Embed Size (px)
Citation preview

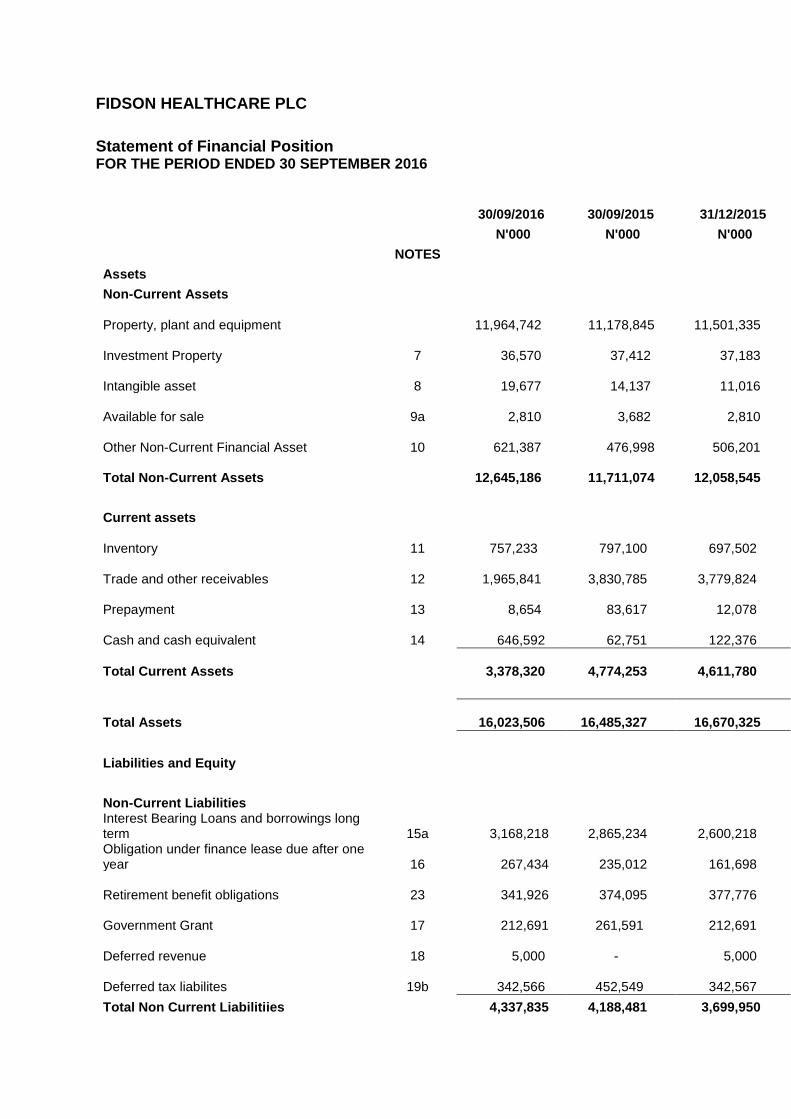
FIDSON HEALTHCARE PLC
Financial Statements FOR THE PERIOD ENDED 30 SEPTEMBER 2016

FIDSON HEALTHCARE PLC
Financial Statements FOR THE PERIOD ENDED 30 SEPTEMBER 2016
CONTENT S PAGE
Statement of comprehensive income 2
Statement of Financial Position 3-4
Statement of Change in equity 5
Statement of cash flows 6-7
Notes to the financial statement 8-18

FIDSON HEALTHCARE PLC
Statement of Profit or Loss and Other Comprehensive Income FOR THE PERIOD ENDED 30 SEPTEMBER 2016
30/09/2016 30/09/2015 31/12/2015
NOTES N'000 N'000 N'000
REVENUE 1 4,527,004 6,160,874 8,210,760
COST OF SALES 2 2,141,075 2,895,611 3,858,896
GROSS PROFIT
2,385,929 3,265,263 4,351,864
OTHER OPERATING INCOME
10,104
23,033
132,939
OTHER OPERATING EXPENSES 3 (51,290)
(56,680)
(23,635)
ADMINISTRATIVE EXPENSES 4 (1,330,705)
(1,566,905)
(2,037,327)
SELLING & DISTRIBUTION EXPENSES 5 (432,382)
(562,916)
(868,844)
FINANCE COSTS 6 (460,958)
(405,497)
(716,958)
PROFIT BEFORE TAX
120,698
696,298
838,039
INCOME TAX EXPENSE
(38,623)
(222,815)
(93,661)
PROFIT FOR THE PERIOD
82,075
473,483
744,378
OTHER COMPREHENSIVE INCOME NET OF INCOME TAX - - 39,169
TOTAL COMPREHENSIVE INCOME FOR THE PERIOD
82,075
473,483
783,547
EARNINGS PER SHARE (KOBO) BASIC & DILUTED 5
32 50
FIDSON HEALTHCARE PLC
Statement of Financial Position FOR THE PERIOD ENDED 30 SEPTEMBER 2016
30/09/2016 30/09/2015 31/12/2015
N'000 N'000 N'000
NOTES
Assets Non-Current Assets
Property, plant and equipment
11,964,742
11,178,845
11,501,335
Investment Property 7 36,570
37,412
37,183
Intangible asset 8 19,677
14,137
11,016
Available for sale 9a 2,810
3,682
2,810
Other Non-Current Financial Asset 10 621,387
476,998
506,201
Total Non-Current Assets
12,645,186
11,711,074
12,058,545
Current assets
Inventory 11 757,233
797,100
697,502
Trade and other receivables 12 1,965,841
3,830,785
3,779,824
Prepayment 13 8,654
83,617
12,078
Cash and cash equivalent 14 646,592
62,751
122,376
Total Current Assets
3,378,320
4,774,253
4,611,780
Total Assets
16,023,506
16,485,327
16,670,325
Liabilities and Equity
Non-Current Liabilities Interest Bearing Loans and borrowings long
term 15a 3,168,218
2,865,234
2,600,218
Obligation under finance lease due after one year 16
267,434
235,012
161,698
Retirement benefit obligations 23 341,926
374,095
377,776
Government Grant 17 212,691
261,591
212,691
Deferred revenue 18 5,000 - 5,000
Deferred tax liabilites 19b 342,566
452,549
342,567
Total Non Current Liabilitiies
4,337,835 4,188,481 3,699,950
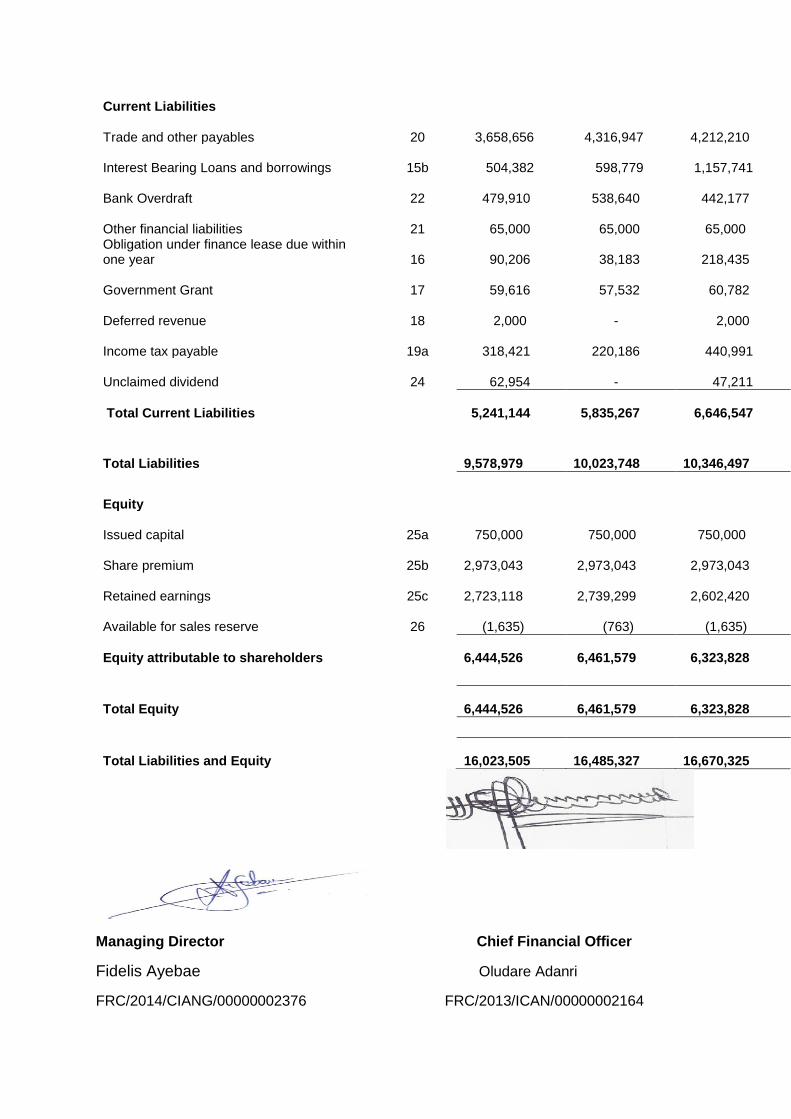
Current Liabilities
Trade and other payables 20 3,658,656
4,316,947
4,212,210
Interest Bearing Loans and borrowings 15b 504,382
598,779
1,157,741
Bank Overdraft 22 479,910
538,640
442,177
Other financial liabilities 21 65,000
65,000
65,000
Obligation under finance lease due within one year 16
90,206
38,183
218,435
Government Grant 17 59,616
57,532
60,782
Deferred revenue 18 2,000
- 2,000
Income tax payable 19a 318,421
220,186
440,991
Unclaimed dividend 24 62,954 -
47,211
Total Current Liabilities
5,241,144
5,835,267
6,646,547
Total Liabilities
9,578,979
10,023,748
10,346,497
Equity
Issued capital 25a 750,000
750,000
750,000
Share premium 25b 2,973,043
2,973,043
2,973,043
Retained earnings 25c 2,723,118
2,739,299
2,602,420
Available for sales reserve 26 (1,635)
(763)
(1,635)
Equity attributable to shareholders
6,444,526
6,461,579
6,323,828
Total Equity
6,444,526
6,461,579
6,323,828
Total Liabilities and Equity
16,023,505
16,485,327
16,670,325
Managing Director Chief Financial Officer
Fidelis Ayebae Oludare Adanri
FRC/2014/CIANG/00000002376 FRC/2013/ICAN/00000002164

FIDSON HEALTHCARE PLC
Statement of Change in Equity FOR THE PERIOD ENDED 30 SEPTEMBER 2016
Share Capital
Share Premium
Available for Sale Fin. Assets
Retained Earnings
Total Equity
Balance as at Beginning of the Prior Year
750,000
2,973,043
(763)
2,043,001
5,765,281
Profit for the year -
744,378
744,378
Other comprehensive Income for the year
(872)
40,041
39,169
Total Comprehensive Income
(872)
784,419
783,547
Payment of Dividends
(225,000)
(225,000)
Balance as at End of the Prior Year 750,000
2,973,043
(1,635)
2,602,420
6,323,828
Profit for the year
120,698
120,698
Other comprehensive income for the year
Total Comprehensive Income
-
120,698
120,698
Dividend
Balance as at End of the Current Year
750,000
2,973,043
(1,635)
2,723,118
6,444,526

FIDSON HEALTHCARE PLC
Statement of Cash Flows FOR THE PERIOD ENDED 30 SEPTEMBER 2016
30/09/16 30/09/15
31/12/15
N'000
N'000
Operating activities:
Profit before tax from continuing operations
120,698
696,298
838,039
Non cash adjustment to reconcile profit before tax to net cash flows
Depreciation and impairment of Property Plant and Equipment
166,852
225,015
258,927
(Impairment reversal )/ Loss
-
(32,704)
Gain/Loss on disposal of Asset
- -
11,421
Inventory Write-off
30,391
35,580
12,214
Provision for doubtful debt
- 141,883
- -
Depreciation and impairment of Investment Property
688 688
918
Grant Income
- -
(45,651)
Ammortisation and impairment of Intangible Assets
11,394
18,108
22,383
Gain on disposal of available for for sale assets
-
Finance Income
(10,104)
(23,033)
(25,787)
Finance Costs
460,958
405,497
716,958
Employee benefit expense
35,850 -
57,322
Changes in operating assets and liabilities:
(Increase) / Decrease in trade and other receivables
1,465,899
(643,314)
(559,649)
Decrease /(Increase) in prepayments
3,424
33,630
105,169
Decrease /(Increase) in Inventories
(59,731)
348,440
435,824
Increase/ (Decrease) in government grant
- -
-
Increase / (Decrease) in Trade and other payables
(523,554)
519,622
432,590
Movement in deferred revenue
-
2,000
1,702,765
1,758,414
2,229,974
Income tax paid
(122,570) -
-

Benefits paid
-
(14,145)
Movement in deferred revenue
-
5,000
Net cash flow from Operating activities
1,580,195
1,758,414
2,220,829
Cash flows from investing activities
Purchase of Property, Plant & Equipment
(510,195)
(590,815)
(773,912)
Addition to Intangible Assets
(20,053)
(9,805)
(10,960)
Proceeds from disposal of available for sale financial assets
- 21,057
Interest income received
10,104
23,033
-
Addition to loans and receivables
(142,510)
(411,268)
Addition to held to maturity
(234,953)
Proceeds on loans and receivables
-
423,500
Proceeds from sale of property, plant and equipment
104,685
2,812
2,987
Investment in other financial assets
27,324 -
(628,370)
Liquidation of investment in Other financial asset
21,965
398,826
Net cash (utilised)/ provided by investing activities
(530,645)
(766,706)
(999,197)
Cash flows from financing activities
Payments of finance lease liabilities
(128,229)
(153,648)
(148,709)
Interest paid on loans & Borrowings
(460,958)
(405,497)
(716,958)
Dividend paid
(45,000)
(225,000)
Refund of Dividend
15,743 -
47,211
Proceed from loans & borrowings
705,736
108,000
-
Loan Repayment
(685,359)
(741,966)
(268,491)
Proceed from bond issued
- -
-
Cost of issue of bond
-
-
Net cash (utilised)/ provided by financing activities
(553,067)
(1,238,111)
(1,311,947)
Net (decrease)/ increase in cash & cash equivalents
496,483
(246,403)
(90,315)
Cash & cash equivalent at 1 Jan
(319,801)
(229,486)
(229,486)
Cash & cash equivalent at 30th September
176,682
(475,889)
(319,801)

FIDSON HEALTHCARE PLC
Notes to the Financial Statements FOR THE PERIOD ENDED 30 SEPTEMBER 2016
30/09/2016 30/09/2015 31/12/2015
N'000 N'000 N'000
Revenue
1 Over The Counter(OTC) 2,755,380 4,104,954 5,283,404
Ethical 1,638,669 2,055,920 2,774,703
Consumer 78,611 - 152,653
4,472,660 6,160,874 8,210,760
2 Cost of Sales
Over The Counter(OTC) 1,287,293 1,975,048 2,446,316
Ethical 695,555 920,562 1,299,073
Consumer 58,227 - 113,507
2,041,075 2,895,611 3,858,896
3 Other Operating Expenses
Corporate Social Responsibility 17,149 9,605
Inventory Write off 30,391 35,580
Gift and Donation 3,750 11,495
51,290 56,680
4 Administrative Expenses
Salaries 363,049 393,877
Depreciation & Amortisation 166,852 225,015
Audit Fee 8,625 7,875
Travelling 302,142 349,796
30/09/16 30/09/15
31/12/15

Bad Debt 38,450 141,883
Diesel & Fuel 85,109 50,442
Consultancy 4,763 73,039
Repairs & Maintenance 184,903 152,569
Others 197,761 172,409
1,351,654 1,566,905
129,896
5 Selling & Distribution Expenses
Promotion and advertisement 189,791 107,411
Institutional promotion 23,278 16,861
Sales expense 77,786 290,424
Logistic Expenses 141,527 148,220
432,382 562,916
6 Finance Costs
Interest on Bank Loan 460,958 405,497
SEPTEMBER, 2016
SEPTEMBER, 2015 DECEMBER, 2015
N'000 N'000 N'000
7 Investment Property
Ecomed
Cost at beginning 48,301 48,301 48,301
Additions - -
Cost at end of year 48,301 48,301 48,301
Accumulated depreciation at beginning (11,119) (10,201)
(10,200)
Charge for the period (612) (688)
-918
Carring amount 36,570 37,412 37,183
8 Intangible assets
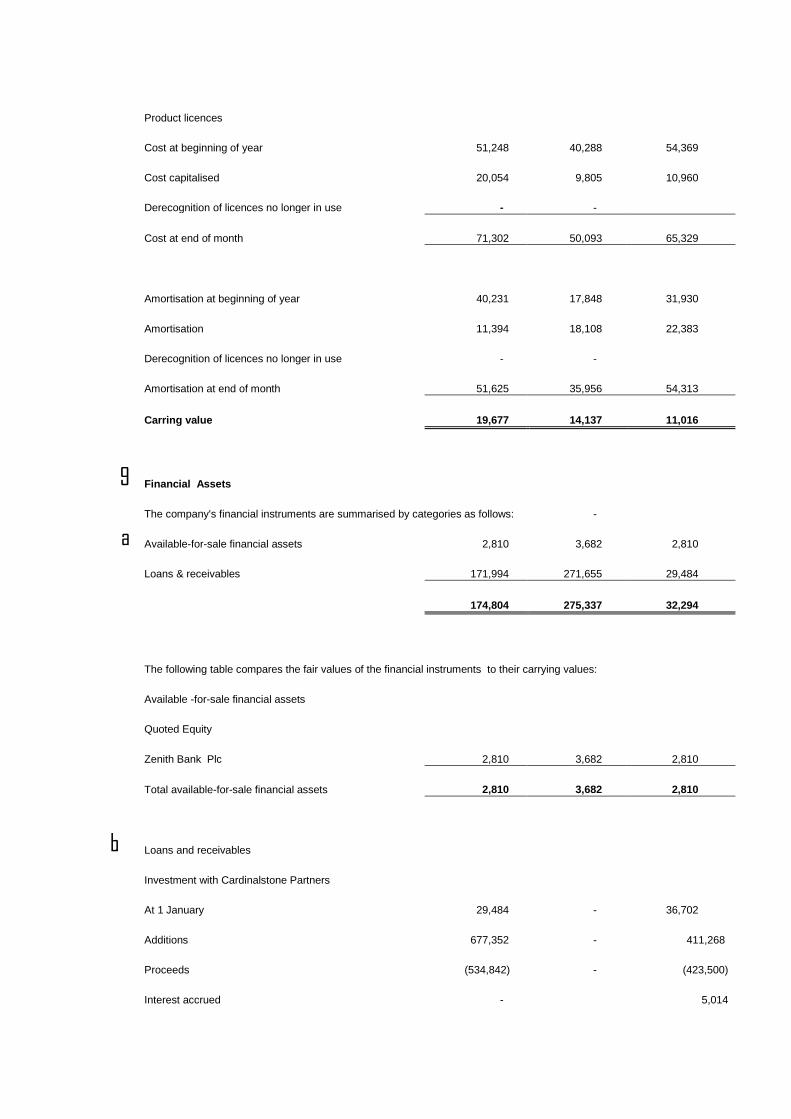
Product licences
Cost at beginning of year 51,248 40,288 54,369
Cost capitalised 20,054 9,805 10,960
Derecognition of licences no longer in use - -
Cost at end of month 71,302 50,093 65,329
Amortisation at beginning of year 40,231 17,848 31,930
Amortisation 11,394 18,108 22,383
Derecognition of licences no longer in use - -
Amortisation at end of month 51,625 35,956 54,313
Carring value 19,677 14,137 11,016
9 Financial Assets
The company's financial instruments are summarised by categories as follows: -
a Available-for-sale financial assets 2,810 3,682 2,810
Loans & receivables 171,994 271,655 29,484
174,804 275,337 32,294
The following table compares the fair values of the financial instruments to their carrying values:
Available -for-sale financial assets
Quoted Equity
Zenith Bank Plc 2,810 3,682 2,810
Total available-for-sale financial assets 2,810 3,682 2,810
b Loans and receivables
Investment with Cardinalstone Partners
At 1 January 29,484 - 36,702
Additions 677,352 - 411,268
Proceeds (534,842) - (423,500)
Interest accrued -
5,014

171,994 - 29,484
CardinalStone Partners Limited is the portfolio management and custodial service provider for the company towards meeting its payment on the bond. The company on a weekly.
basis remits money to CardinalStone Partners Limited. CardinalStone Partners Limited is however to disburse funds on monthly basis into the transition account maintained by
the Bond Trustee (ALM Trustees)
10 Other Non-Current Financial Asset ( ALM Trustees)
At 1 January 476,717 - 226,400
Additions 598,337 205,343 628,370
Proceeds (625,661)
(398,826)
Accrued Interest -
20,773
449,393 205,343 476,717
-
ALM Trustee are the Bond Trustees for the issuance of N2bn bond by Fidson(issuer). Under the bond agreement, the issuer is required to fund a reserve account with an amount
equal to the interest payable on the next payment date. Thereafter, upon the expiration of the moratorium period the issuer shall fund the reserve account on the first business
day of each month with an amount equal to 1/6th of the principal payable on the next payment date. The fund is investible by the Bond Trustee and the issuer is restricted from
assessing the fund including the accrued interest throughout the 5 year life of the Bond.
11 Inventories
Finished goods 63,623 252,140 404,464
Goods in transit 269,413 35,187 6,764
Raw & Packaging Materials 420,461 334,522 284,837
Work in progress 3,736 175,251 1,437
757,233 797,100 697,502
12 Trade and other receivables
a Receivables from related parties
Trade receivables (b) 1,674,314 3,545,577 3,595,173
Other receivables (c ) 291,527 285,208 184,651
1,965,841 3,830,785 3,779,824

Individually Impaired
At 1 January 2016 433,786 466,489
Charge for the Period (8,521) 115,174
Write off - -
At 31 August 2016 425,265 581,663
-
c Other receivables
Witholding tax receivables 174,419 160,080 164,042
Value added tax 260 260 260
Sundry debtors and Staff loans 116,848 124,868 20,349
291,527 285,208 184,651
13 Prepayment
Advance to suppliers 8,654 83,617 -
Other prepayments
12,078
8,654 83,617 12,078
This represents advances made to suppliers for the purchase of factory equipment. Other prepayments include prepaid advert, prepaid insurance and prepaid rent.
14 Cash and cash equivalents
Cash at hand 17,616 654 27
Bank 618,747 60,296 172,713
Short-term deposits(including demand and time deposits) 10,229 1,801 31,414
Total cash and cash equivalents 646,592 62,751 204,154
15 Interest Bearing Loans and borrowings
a Interest Bearing Loans and borrowings (Non-Current Portion)
Access Bank (CBN Intervention Loan) 175,003 212,736 175,003
Guaranty Trust Bank - - -
First City Monument Bank - - -
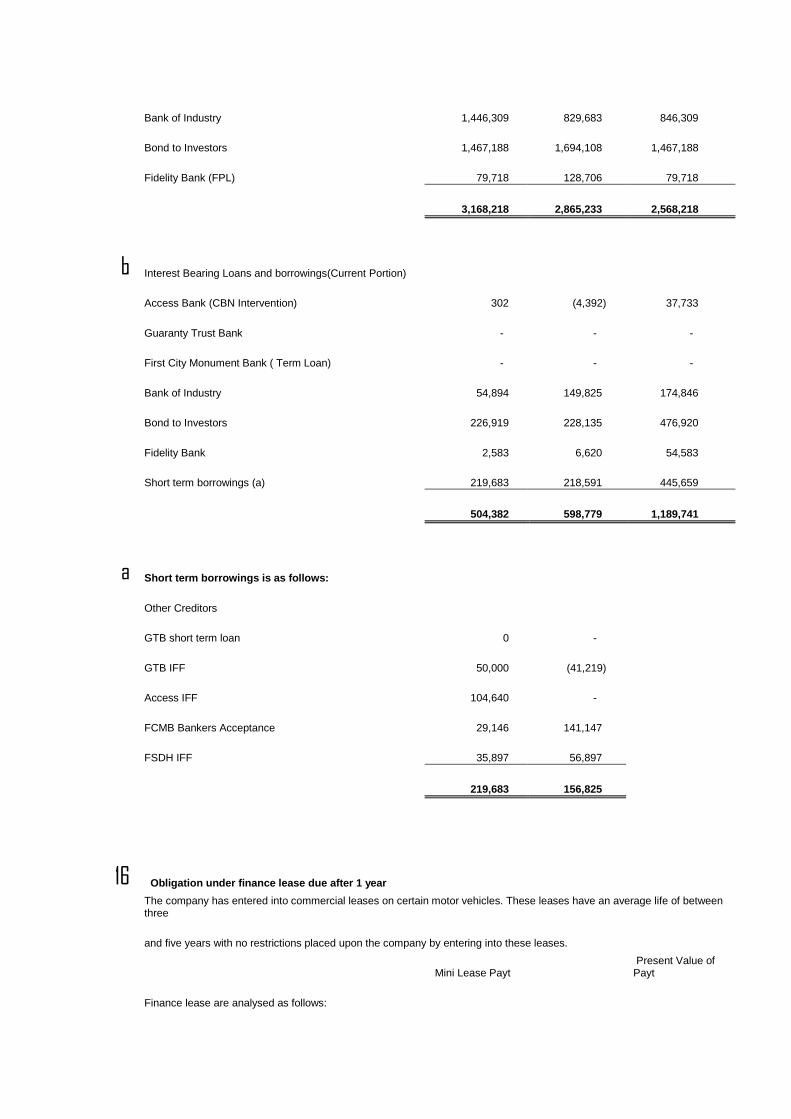
Bank of Industry 1,446,309 829,683 846,309
Bond to Investors 1,467,188 1,694,108 1,467,188
Fidelity Bank (FPL) 79,718 128,706 79,718
3,168,218 2,865,233 2,568,218
b Interest Bearing Loans and borrowings(Current Portion)
Access Bank (CBN Intervention) 302 (4,392) 37,733
Guaranty Trust Bank - - -
First City Monument Bank ( Term Loan) - - -
Bank of Industry 54,894 149,825 174,846
Bond to Investors 226,919 228,135 476,920
Fidelity Bank 2,583 6,620 54,583
Short term borrowings (a) 219,683 218,591 445,659
504,382 598,779 1,189,741
a Short term borrowings is as follows:
Other Creditors
GTB short term loan 0 -
GTB IFF 50,000 (41,219)
Access IFF 104,640 -
FCMB Bankers Acceptance 29,146 141,147
FSDH IFF 35,897 56,897
219,683 156,825
16 Obligation under finance lease due after 1 year
The company has entered into commercial leases on certain motor vehicles. These leases have an average life of between three
and five years with no restrictions placed upon the company by entering into these leases.
Mini Lease Payt
Present Value of Payt
Finance lease are analysed as follows:

Current Obligations 90,206
218,435
Non Current Obligations 267,434
161,698
357,640
380,133
-
17 Government Grant
At 1 January 273,473 319,124 319,124
Transfer from Fidson Products
-
Released to the income Statement (1,166) - (45,651)
At 31st August 272,307 319,124 273,473
Current 59,616 57,532 60,782
Non-current 212,691 261,592 212,691
272,307 319,124 273,473
This represents the grant elements of CBN intervention and BOI loans, after the loans were re-measured using efective interest rate.
The government grants have been recognised in the statement of financial position and it is being amortised through profit or loss
on a systematic basis over the tenure of the loan.
18 Deferred revenue
At 1 January -
-
Deferred rent recognised 7,000
7,000
7,000
7,000
Current 2,000
2,000
Non-current 5,000
5,000
7,000
7,000
This represents deferred rental income from an insginificant portion of the company's building held to earn rentals.
19 Taxation
a Current tax payable
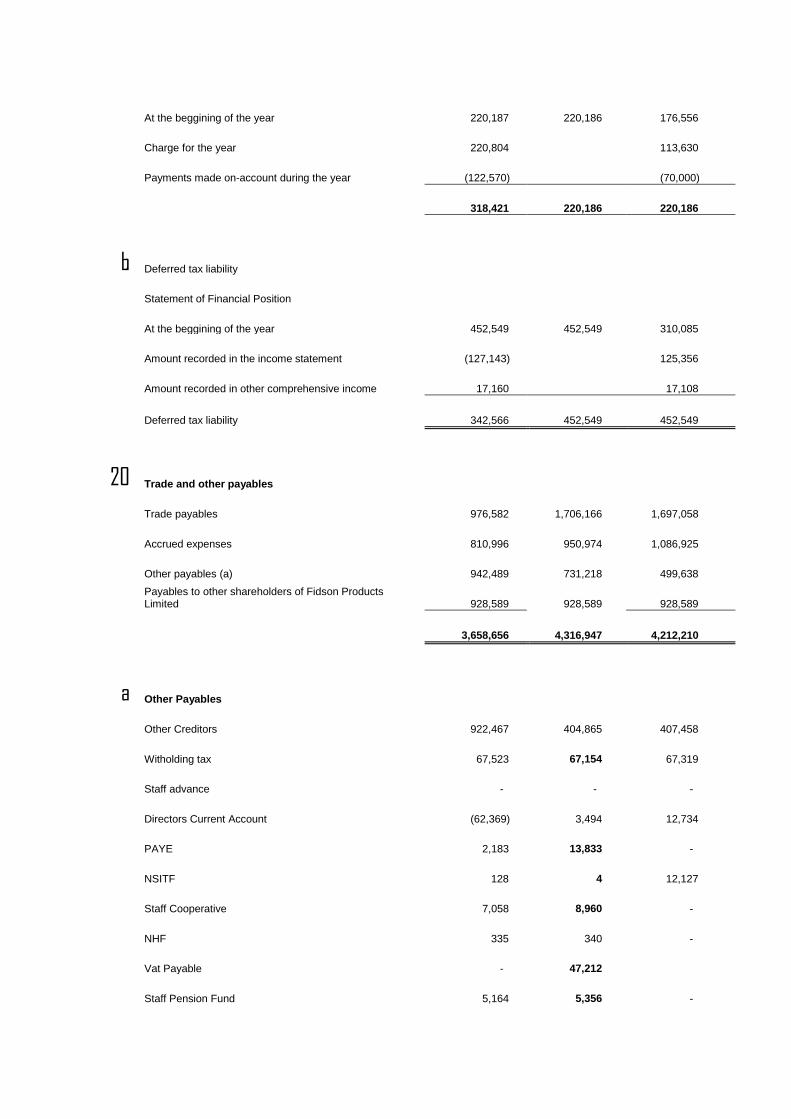
At the beggining of the year 220,187 220,186 176,556
Charge for the year 220,804
113,630
Payments made on-account during the year (122,570)
(70,000)
318,421 220,186 220,186
b Deferred tax liability
Statement of Financial Position
At the beggining of the year 452,549 452,549 310,085
Amount recorded in the income statement (127,143)
125,356
Amount recorded in other comprehensive income 17,160
17,108
Deferred tax liability 342,566 452,549 452,549
20 Trade and other payables
Trade payables 976,582 1,706,166 1,697,058
Accrued expenses 810,996 950,974 1,086,925
Other payables (a) 942,489 731,218 499,638
Payables to other shareholders of Fidson Products Limited 928,589 928,589 928,589
3,658,656 4,316,947 4,212,210
a Other Payables
Other Creditors 922,467 404,865 407,458
Witholding tax 67,523 67,154 67,319
Staff advance - - -
Directors Current Account (62,369) 3,494 12,734
PAYE 2,183 13,833 -
NSITF 128 4 12,127
Staff Cooperative 7,058 8,960 -
NHF 335 340 -
Vat Payable - 47,212
Staff Pension Fund 5,164 5,356 -

Dividend payable - 180,000 -
942,489 731,218 499,638
21 Other current financial liabilities
Commercial paper 65,000 65,000 65,000
The fair value of the commercial paper is as stated.
22 Cash and cash equivalents in Statements of cash flows
Cash and cash equivalents (note 13) 646,592 62,751 204,154
Bank Overdraft (a) (479,910) (538,640) -433,640
166,682 (475,889) -229,486
a Bank Overdraft Accounts
Access Bank (125,258) (101,984) (103,622)
Access Bank 2 (101,984) - (254,864)
FCMB 2 (270,787) (270,787) (75,255)
GTB (166,227) (166,227) (1,755)
Mainstreet - - -
Diamond - -
UBA - -
Sterling - -
IBTC-CHARTERED -
(664,256) (538,998) (435,496)
23 Retirement benefit obligations
The company has a discontinued its defined benefit gratuity effective 31st December 2013.
The scheme was non-contributory and was classified as other employment benefits in line with IAS 19
Benefit asset / (liability)
Defined benefit obligation 341,926 374,095 391,801
Benefit liability 341,926 374,095 391,801
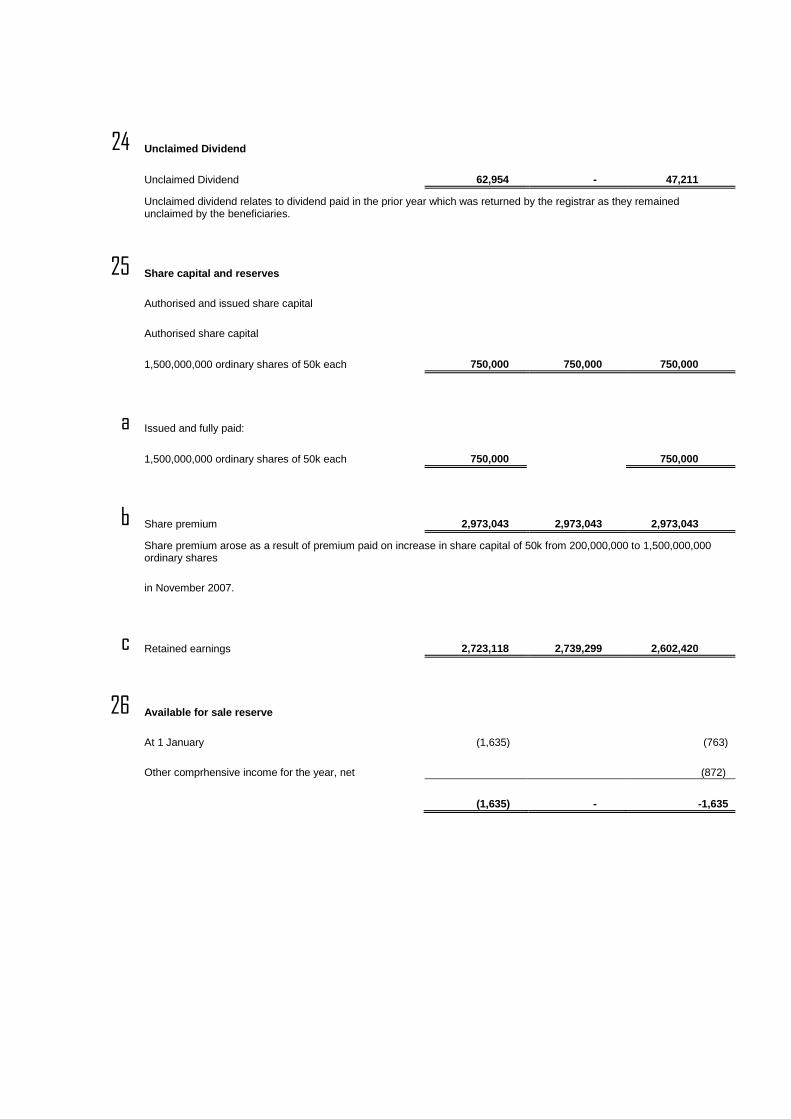
24 Unclaimed Dividend
Unclaimed Dividend 62,954 - 47,211
Unclaimed dividend relates to dividend paid in the prior year which was returned by the registrar as they remained unclaimed by the beneficiaries.
25 Share capital and reserves
Authorised and issued share capital
Authorised share capital
1,500,000,000 ordinary shares of 50k each 750,000 750,000 750,000
a Issued and fully paid:
1,500,000,000 ordinary shares of 50k each 750,000
750,000
b Share premium 2,973,043 2,973,043 2,973,043
Share premium arose as a result of premium paid on increase in share capital of 50k from 200,000,000 to 1,500,000,000 ordinary shares
in November 2007.
c Retained earnings 2,723,118 2,739,299 2,602,420
26 Available for sale reserve
At 1 January (1,635)
(763)
Other comprhensive income for the year, net
(872)
(1,635) - -1,635
N'000 N'000
N'000
120,698
696,298
838,039
166,852
225,015
258,927
-
(32,704)

- -
11,421
30,391
35,580
12,214
- 141,883
-
688 688
918
- -
(45,651)
11,394
18,108
22,383
-
(23,033)
(25,787)
(246,403)
(90,315)
(229,486)
(229,486)
(475,889)
(319,801)