Embed Size (px)
Citation preview

-)f OCKi—95297
DE87 000575
OCT 1 ; 1986
PLASMA DIAGNOSTIC TECHNIQUES IN-THERmL-BARRIER TANDEM-MIRROR FUSION EXPERIMENTS
E. H. S i lve r , J. F. Clauser, M. R. Car ter , B. H. Fa i lo r , J . H. Foote, R. S. Hornady,
R. A. James, C. J . Lasnier, and D. E. Perkins
This paper was prepared for submittal to the Course and Workshop on Basic and Advanced Fusion
Plasmas Diagnostic Techniques, September 3-13, 1986, Varenna, I t a l y .
August 29, 1986
Jh,
This i* • preprint of • paper intended far pub tic at to* in R journal or proceeding. '• change* may be made before poWieatiofl, (his preprint « made available wilh Ihr understanding that it will not be cited or reproduced *iihoiK the permission of the author.
DISTRIBUTION OF JliiS (lOCUMEM «•• i lNUWTtt

DISC I U M r H
I h i \ document was prepared as an account of w<irk sponsored h» an agcnei of the t niied Slates <;<mmmenl. Nr i lher ihr I ni trd Slates ( j n t r n m n i i nor Ihr I ni»ersil* of ( alifornia nnr an> of their employer-*, makrs an* war rant ) , e»-prcss or implied, or assumes any l r t » l l inhil i ls or responsihilin fur (he »c-i u r a i > . ciimpti'lrni'ss. nr usefulness of any informal inn. apparatus, pun lu t t . of procrss discicisod, »r represents that its »\t would mil infringe p r i t a l d ) owned rights. Reference herein In ant specific commercial products. process. «r sen ice b> trade damp, trademark, manufacturer, or oiherwise, dues nut nccrssaril* constitotc or imply its endorsement, recommendation, or f j ju ir tnj ; b> the I niled Stairs (internment or I he I r i iers i ts nf < alifornia. I ht- <ir«s and opinions of auihnrs expressed herein do nnl necessarily state or reflect "hose of the I Ailed Slates (inset ntnent thereof, and shall nni he used f i r ad> t r i s i ng ar product en-
1 irscment purposes.

Plasma Diagnostic Techniques in Thermal-Barrier Tandem-Mirror Fusion Experiments*
E.H. Silver, J.F. Clauser, M.R. Carter, B.H. Failor, J.H.Foote, R.S. Hornady, R.A. James, C.J. Lasnier, and D-E. Perkins
Lawrence Livermore National Laboratory University of California, Livermore, California
United States of America
Abstract
We review two classes of plasma diagnostic techniques used in thermal-barrier tandem-mirror fusion experiments. The emphasis of the first class is to study mirror-trapped electrons at the thermal-barrier location. The focus of the second class is to measure the spatial and temporal behavior of the plasma space potential at various axial locations. The design and operation of the instruments in these two categories are discussed and data that are representative of their performance is presented.
^m msiBwufffiM OP TO uottmm K a m m ! a - ^ Y ^
* This work was performed under the auspices of the U.S. Department of Energy by Lawrence Livermore National Laboratory under contract W-7405-Eng-48.
]

Plasma Diagnostic Techniques in Thermal-Barrier Tandem-Mirror Fusion Experiments
E.H. Silver, J.F. Clauser, M.R. Carter, B.H- Failor, J.H.Foote, R.S. Hornady, R.A. James, C.J. Lasnier, and D.E. Perkins
Lawrence Livermore National Laboratory University of California, Livermore, California
United States of America
1. Introduction
Current research efforts in open confinement fusion experiments emphasize the development of tandem-mirror machines operating with thermal barriers. The thermal*barrier tandem-mirror (TBTM) concept was proposed by Baldwin and Logan }\j and is the theoretical framework and motivation for the TMX-U experimental program at the Lawrence Livermore National Laboratory /2 /3 / , This paper has two objectives. The first is to describe the diagnostics used to study the mirror-trapped electrons in a TBTM. These electrons are expected to influence the formation of a thermal barrier. The second is to discuss the diagnostics employed to measure the plasma potential profiles designed to aid axial confinement of centra] cell ions.
To better understand the TBTM concept and set the stage for a discussion of experimental techniques used to diagnose TBTM performance , we review briefly, several mirror-physics fundamentals and refer the reader to the literature for details. The magnetic moment, p, of a charged particle in a helical trajectory about a magnetic field line is conserved if the field, sampled by the particle, varies negligibly during one gyrorotation period. In a magnetic well or simple mirror, electrons and ions experience an average retarding force proportional to -\L | VB | that repels them from regions of increasing magnetic field, B. The velocity parallel to the field eventually vanishes at each axial turning point. This occurs when the total energy of the particle, E, equals the product /i ] B |. Gyrating electrons or ions are, therefore, confined in the magnetic well as long as their energy is less than the product of their magnetic moment and the maximum magnetic field present /4 / . This condition establishes a minimum pitch angle that these particles can have and remain magnetically confined. Those with smaller pitch angles lie within what is called the "loss-cone." The minimum pitch-angle with negligible electrostatic potential present, measured with respect to the magnetic axis, is given by, 0j,c = sin~l[y/'i/R] , where H, the mirror-ratio, is the ratio between the maximum and minimum magnetic fields in the mirror cell. The ultimate confinement time of these particles is dictated by the average elapsed time before they pitch-angle scatter across the loss-cone boundary. In a fully ionized plasma, scattering is dominated by Coulomb collisions, and the Coulomb cross section varies inversely with the square of the relative energy of the colliding particles / 5 / . Therefore, confinement of a plasma improves as the kinetic temperature increases. Electrons, because of their lower mass, will pitch-angle scatter more rapidly than will ions. The resulting loss of electrons from the mirror-confined region will cause a positive potential to form. The potential will increase, containing electrons and expelling ions, until the
2

Second harmonic heating Fundamental heating
ei.»ctron and ion loss rates are equal so that quasineutrality holds. The resulting equilibrium plasma potential ia expressed by the Pastukov relationship / 6 / .
In a tandern-mirror, two single mirror cells (called end cells or plugs) bracket a relatively tong solenoidal section termed the central cell. The positive potentials that develop in the end cells help confine ions to the central cell because the end-cell density is made greater than the central cell density. This has been verified on the Tandem Mirror Experiment at LLNL and on other experiments /? ' /8/9/.
In a. TBTM an ion confining potential is generated with a lower plasma density in the plug than in the solenoid. A reduced plug density is attractive for reactor-scale machines because it minimizes the power and magnetic field required by end cells but provides high central-cell density that is needed for fusion power output. Figure 1 shows the desired relationship along the machine axis ;.?tween the potential, electron and ion density, and magnetic field. Electron-cyclotron-resonant heating (ECRH) is applied at two axial locations in each end plug to facilitate electrostatic potential formation. In the TMX-U experiment, gyrotrons (200 kW at 28 GHz) create mirror-trapped electrons by second-harmonic ECRH. These electrons, in turn, create an axial potential depression to isolate plug electrons thermally from the central-cell electrons.
The thermal isolation makes it possible to selectively heat electrons in the potential peak with fundamental ECRH. The increased /i | VB | force experienced by these electrons causes them to move away from the heating location, thereby enhancing the potential peak that confines the central-cell ions. Neutral beams of deuterium injected at an oblique angle to the magnetic axis at the mid plane of the plug (still outside the loss-cone) create a sloshing ion distribution. As long as ion pitch-angle scattering and ion-to-electron energy exchange, or drag, are slow processes on the time scale of the slashing ion charge exchange time, the sloshing ions will create axial density peaks near their turning points.
irror trapped
Thermal barrier
Fig. 1. Axial profilea of the magnetic field, the electron and ion density, and the electrostatic potential for one half of TMX-U. The fraction of mirror-trapped electrons, q, at the thermal-barrier is defined as the ratio between the total density, nr, and the mirror-trapped density, n m ( . $t is the central cell potential, ^ the ion confining potential, 4>b the thermal barrier potential well depth, and 0 P the potential peak height.
3

An injection angle of 47° was chosen for TMX-Uso that the ions would ha*- their outer density peak at the location near where the fundamental heating is applied and the ion-confining potential is expected to form- The sloshing ions help charge neutralize the mirror-trapped electrons a t the midplane , while warm, potentially confined electrons and the few energetic central-cell electrons t ha t pass to the end wall, theoretically maintain quasineutrality at the potential peak position.
The theoretical depth of the barrier potential, 4>b, can be expressed as
*» = T « m [ n „ / n r ( l - f f ) l , ( l )
where n e C &nd Tec are the central-cell electron density and tempera ture , respectively, and n j is the total electron density at the barrier. The mirror-trapped fraction, 9, is the ratio between the mirror-trapped electron density at the barrier, nrrAl and the total density, fir, there. In the limit of strong E C R H heat ing /10 /11 / and for mirror-ratios appropria te t o TMX-U, the predicted ion-coniining potent ial between the outer peak and the centra'.-cell is approximated
by, A - 2 r , "p i a / 3 i " .« i 1 / 5
A ,,>
To achieve a deep potent ial well a t the barrier and a high potent ia l a t the outer ion turning point, it is advantageous for the value of q to be near unity. Experimental determination of the mirror-trapped fraction and the axial potential profile is, therefore, crucial to understanding T B T M performance.
In §2. of this paper , we will focus on the diagnostics used t c s tudy the properties of the mirror-trapped electron plasma. * To learn about mirror-trapped electrons, we employ broadband, high resolution x-ray detectors which are used to measure x-ray bremsstrahlung emission from the plasma and allow us t o infer the electron momentum, distr ibution function. A high energy x-ray pinhole camera provides data on the spatial profile of the x-ray emission. These instruments are described in §2.1 and §2.2- Basic plasma propert ies obtained from routine measurements are also presented in §2.2. Based upon these observations, a plasma model for the electron momentum distr ibution is proposed. In §2.3, t he results of x-ray bremsstrahlung calculations based upon this model are outlined. In §2.4, we outline bow one combines the results from these diagnostics with those by diamagnetic loops and microwave interferometers to
* The diagnostics discussed in this report represent a subset of the various instruments used to study a TBTM plasma. Other important diagnostics deserve- mention. These have been discussed else-where in the literature. For example, mirror machines employ in any diagnostics common to all fusion experiments, namely, Thomson scattering Bystems, Langmuir probes, bolometers, neutron detectors, and optical and EU V spectrometers. Several others take advantage of the unique open-field line feature of mirror-machines. Faraway cups / 12 / measure the axial ion-loss current as a function of position. The plasma potential control plates, located at the ends of the machine, measure the net-electron current lost axially / 1 3 / . The data from the latter t*vr> have been compared to the total ionitation in the plasma, measured by a high speed video camera that senses the amount of Ha emission. This has allowed the balance between the particle tosses and the particle sources to be evaluated. The small net imbalance that is commonly found implies that particle loss currents can be a good measure of the particle confinement / 1 4 / I 5 / .
4

obtain the density and fraction of mirror-trapped electrons at the barrier location. The results for a representative set of plasma experiments is presented in §2.5. In §2.6, electron-cyclotron emission measurements are described. Superheterodyne radiometers detect emission propagating perpendicular to the axial magnetic field. The temporal evolution of the hot electron temperature can be determined from these signals. Corroboration by x-ray results is shown.
In §3. we discuss some techniques for measuring electrostatic potentials. In §3.1 we discuss the use of end-loss ion spectrometers to detect ions that escape from the plasma region along open ended magnetic field lines. The spectrometers provide information about ion energies inside the plasma and about space potentials existing in the plasma. A heavy-ion beam probet
used to determine the central-cell potential, is treated in §3.2. In §3.3 we describe charge exchange spectroscopy using a time-of-flight technique. It provides information about the potential difference between the thermal-barrier and the confining potential peak.
2. The Mirror-Trapped Electron Diagnostics
Essential to any measurement of the mirror-trapped electron density is a knowledge of the electron momentum distribution. Measurements of the x-ray bremsstrahlung spectra produced by the mirror-trapped electrons can be used to provide this information. Unfortunately, one cannot determine unambiguously the mirror-trapped electron density from the x-ray measurements alone. However, we will show how a knowledge of the electron distribution inferred from the x-ray spectrum can be combined with measurements of plasma diamagnetism, microwave line-density, and plasma dimensions to allow us to self-consistently calculate the mirror-confined density and fraction.
2.1 X-Hay Pulse Height Analysis
X-ray spectra between 3 and 1200 keV are measured with high-purity germanium (HPGe) and thallium-doped sodium iodide (Nal(Tl)J detectors. As depicted in Fig. 2, these instruments
Image intensified Csl pinhole camera
Borated polyethylene
Lead
Vacuum vessel^
Liquid-nitrogen dewa
Borated polyethylene
Lead
Lead colli mat ion
3"*3 ' -NaHTI )
Mu-metal
Lead
Borated polyethylene
HPGe
Remotely controlled filters
Lead collimation
'— Remotely controlled apertures
Fig. 2. View along the axis of TMX-U showing the location of the thermal-barrier x-ray diagnostic?. 5

are coaligned to view a common plasma volume heated by second-harmonic electron-cyclotron waves. The HPGe detector has sufficient energy resolution (300 eV) to distinguish line radiation produced by titanium, iron, tantalum, and tungsten impurities in the plasma, allowing us to mask their influence on the continuum. The HPGe and Nal detectors are configured so that the ranges of energies recorded by the multi-channel pulse height analyzers (PHAs) extend between 2 and 100 keV for the HPGe and 60-1200 keV for the Nal detectors. The spectral overlap has served as an important d;agnostic check on the general performance and calibration of the two instruments. Since the two detectors observe the same plasma volume, the spectral intensities and shapes should be identical.
The detailed use of solid-state detectors to measure x-rays from magnetic-fusion plasmas has been well documented /16/17/18/19/20/ end will not be reproduced here. However, we highlight several enhancements to standard techniques. To achieve high throughput in the HPGe detector, while minimizing pulse-pileup distortion of the spectrum and without degrading the energy resolution, a recently developed spectroscopy amplifier has been incorporated into c?ur data acquisition system. The amplifier features a triangular pulse-shaping network and pulse-pair resolving time that are tailored for optimum performance at high count rates with an 8 bit analog-digital converter (ADC) /21/22/.
Maximum input count rates of 100-150 kHz can be accomodated while spectral distortion due to pulse pileup is less than 5%. The output rate is limited to 40-50 kHz by the ss 6 /is total ADC pulse conversion time. At these input rates the ADC is "dead" about 1/2 of the time. Similarly, the Na] detector can accommodate maximum input rates of 200-250 kHz by incorporating an active voltage-regulated divider network into the photomultiplier tube base /23/24/25/. At these input rates, the ADC is dead about 70% of the time. More details about the the TMX-U spectrometers may be found in Ref./26/.
The data presented in Figs. 3 and $ are representative of measurements obtained with these Selectors. Figure 3(a,b) shows the temporal history of the energy-integrated x-ray count rate for a typical TMX-U shot. The plasma diamagnetism is also plotted. The shot duration can be divided into two parts. During the first 60 ms of the shot, gas fueling, second-harmonic electron-cyclotron microwave heating, neutral beams, and magnets operate simultaneously to produce a thermal-barrier plasma. The average x-ray spectrum for this period is shown in Fig. 4(a) where the solid line is the best statistical 6t to the data (see §2.4). This spectrum indicates a distinct high-energy exponential tail, characteristic of high-energy mirror-trapped electrons with average energies between 200 and 400 keV. In addition, a steeper low-energy spectral component indicates that a warm population with an average energy of about 20 to 50 keV is present.
Once the microwave heating terminates, the warm electrons rapidly disappear. The average spectrum for the period 200 to 640 ms ia depicted in l'"ig. 4(b). The loss of warm electrons is evident from the difference between the two spectra below 100 keV. This loss is the cause of the sudden drop in plasma diamagnetism that occurs at 55 ms as is shown in Pig. 3(b). An "afterglow" plasma apparently remains after about 100 ms. It consists of extremely long-lived hot electrons, associated ions, and some percentage of cold electrons. In this state the x-ray intensity is observed to slowly decay for the remaining 850-900 ms interval that the magnetic field is still present. Although the plasma diamagnetism is not measured beyond 130 mc, the
6

plot in Fig. 4(b) suggests that the diamagnetic signal, which is dominated by the long-lived hot electrons, decays exponentially during the afterglow time period.
0 100 200 300 400 500
5 55 ms Second-harmonic ECRH 5 65 Fundamental ECRH 25 65 Neutral tea ma
0 90 Gas fuoling
Loss of warm electrons
- Extrapolated-
0 tOO 200 300 400 500 600 Time (ms)
r 1 1 1 1 ECRH pulse 0-60 ms (at
200 400 600 Energy (keV)
Fig. 3. (a) Temporal behavior of the energy-integrated x-ray count fate. A pulse of x-rays occurs during the 5-65 ms interval that ECRH, neutral beams, and gas fueling act. The "afterglow" x-ray emission persists until the magnets turn off at ss 900 ms. Here the count rate is plotted only to 640 ms. (b). Temporal behavior of the plasma diamagnetiam. The sharp drop between 55 and 60 ms is the signature of the loss of warm-electrons. This is followed by a less steep exponential decay characteristic of the gradual loss of Lot electrons. The dotted line between 130 and 640 ms is an exponential extrapolation of the diamagnetic signal measured between 65 and 130 ms.
Based on the above observations, there is strong experimental and theoretical evidence far us to postulate t ha t the thermal-barrier electrons in TMX-U can be divided into at least three tempera ture categories. The existence of the third component is not immediately apparent from the above x-ray observations. However, theoretical and experimental findings
Fig. 4. Average x-ray spectra for (a) the ECRfl pulse interval of 0-60 ms and (b) the afterglow interval of 200-640 ms.
. . n 5 e ~ E(PJ/TC
fh e - E(p)/Th I
-—-̂ "T i Mirror trapped electrons
0* 10 20 30 40 50 60 70 1 Energy (keV)
Fig. 5. Plot of a proposed electron distribution function. A normalized reiativistic Maxwelli&n is adopted for the functional dependence of the individual cold, warm, and hot electron components. The normalized distribution for the entire electron population is a linear combination of the individual distributions weighted by their respective density fractions.
7

indicate that a cold electron population exists with *n average energy below 1 keV. We assume th*t electrons below I keV are not mirror-confined. This group of electrons, which is measured by end-loss electron energy analyzers, may originate from untrapped electrons t ta t pass into the plug from the central-cell where the electron temperature is typically 30-250 eV /27/. Cold plug electrons may also arise from ionization of residual cold gas in the periphery of the end-cell plasma. Although the bremsstrahlung emission from these electrons is not detectable by our x-ray instrumentation, their density, n c , contributes to the microwave interferometer signals.
Figure 5 is a plot of a proposed electron distribution function. It depict i contributions from the cold, warm, and hot electron populations. For simplicity, but without loss of generality, we adopt a relativistic Maxwellian energy distribution a% the fu-.ctional dependence of the electron density for each of these. We denote by n c , n w , and BI, the respective deusities of cold , warm, and hot electrons. In terms of these parameters, the mirror-trapped fraction, q, is def;n»d as
q .--• (n», + nxViJT s n„t/nT , (3)
where the total density, UT, is
n r = n c + n„ + -l;, . (4)
The next issue to address is the angular phase space distribution of the electrons. The mirror-ratio for TMX-U is four, yielding a magnetic confinement region of - ' i c = 30 to !50°. However, there is no a priori reason to assume thi*. the phase space is uniformly populated. Indeed, the plasma length obtained from electron-cyclotron emission /28/ and plasma diamag-netism measurements clong the magnetic axi.D- indicate that the region of pitch-angle space occupied by 67% of the mirror-confined electrons is somewhat smaller than the full magnetic-confinement range. The observed l/e length of 60 cm yields an equivalent mirror ratio of 1.2 and a corresponding pitch-angle range, 0pi = 65° to 0 P 2 = 115°.
2.2 High Energy X-ray Finholc Camera
The size and shape of the plasma are inferred from x-ray imag:s made with a recently duveloped pinhole camera. It was designed to detect higher x-ray energies and possess higher gain than systems currently employed on other controlled-fusion experiments. Kt soft x-ray energies (< 6 keV} microchannel-plates, surface-barrier detectors, and semicopductor chips have all been used /29/30/31/32/. r'ilm can also be used to either detect the soft x-rays directly, or in conjunction with a fiourefcent screen jZZj. In contrast, the microwave heating in a TBTM produces bulk plasmas with higher electron temperatures and requires efficient detection of x-rays with energies between 8 and 300 keV. The relatively low plasma density(< 2 x 10 1 2cm *3) by tokamak standards, combined with a detection solid angle limited by specific machine geometry on TMX-U required that the system possess significant gain.
8

The instrument installed on TMX-U consists of a scdium-doped cesium k>dide(Csi(.Na)) x-ray converter, a dmde image intensifier fibei-optically coupled to a micro-channel-plate image inten-tSer, and a recording medium, consisting of either high speed film, a CCD array, or a silicon intensified target (SIT) vidicon /34/35/. The electronics are situated behind a lead aperture and the entire assembly is surrounded by a sufficient amount of x-ray and neutron shielding as depicted in Fig. 6.
^ClIINllCrviMl O.odk^
Inttn.if!*, Film ot CCD « r t y - l
Fig. 6. (a) X-ray imaging system using a film or CCD video camera for readout. The overall gain is « 4. x 10 3. (b) System uiing a SIT vidicon readout. The overall gain is » 1 x 1 0 \ (c) Schematic of camera system surrounded by x-ray and neutron shield assembly.
(b)
10"
r 300 400
Energy (keV)
Fig. 7. (a) Truncated pinJjoJe design(not driwn to scale). R is the radial extent of source object and L the pinhole-oh'ect distance, (b) Effective pinhole area > plotted versus x-ray energy for 0.5 mm and 14 mm radius pinholes of lead and uranium.
9

The Csl(Na) x-ray cc .iverter has a large photoelectric cross section and a high scintillation efficiency. It converts 11.5% of the incident x-ray energy to optical photons at 400-450 nm. Computer studies and laboratory measurements /36/ were conducted with 0.5 and 3 mm thick crystals. The spectral sensitivity of the instrument is limited at low energies by the transmission of a 0.008 in. aluminum viewing window on the TMX-U vacuum vessel and at the high energies by the scintillator absorption. The low energy cutoff at the 1/e intensity point is 11 keV and the corresponding high-energy cutoffs are 96 and 183 kev for the 0.5 and 3 rnm crystals, respectively. The importance of multiple Compton scattering on x-ray energy deposition was assessed via Monte Carlo calculations. For 200 keV photons, the increase in spot size via this process is only 3.5 and 1% for the two crystals, respectively.
The resolution of the camera is limited by the pinhole diameter and the crystal thickness. The pinhole material loses its opacity at high x-ray eneigies, with a resulting degradation of image clarity tiiere. The conical shape common to soft x-ray pinhole imaging applications was thus truncated to form a pinhole \>iih "finite" length, shown, in Fig. 7(a) , so that the ares, uf the pinhole remains roughly constant as a function x-ray energy. The desired field of view is determined by the cone angle, a = R/Lt where R is the radial extent of the source and L is the pinhoie-source distance. The pinhole radius, r, is chosen tso that the transmission of x-rays is as uniform as possible over the energy Tange of interest. Wi* have computed analytically and simulated via ray tracing, the effective area of the pinhole as a function of energy for lead and uranium. The results are shown in Fig.7(b) for 1.4 and .5 mm radius pinholes. We employ lead pinholes since they display good performance up to 200 keV, whereupon the scintillator response falls off.
The index of refraction mismatch at the scintillator to glass fiber-optic interface determines the angle at which total internal reflection occurs in the crystal. The absorption depth of an x-ray therefore influences the diameter of the image. An x-ray with a short mean-free1 path will typically produce a larger spot than one with a larger mean-free path. We plot in Fig. 8 the ratio of spot size to crystal thickness, 6^,0 3 :, vs energy for the two crystal thicknesses. These are the solid curves. The dashed line in Fig. 8 is the spot size plotted versus the ratio of bm. -to the photon mean free path, AT Ojp. Xmjp corresponds to the inverse of the energy dependent absorption coefficient. Interestingly, this is a universal curve from whic1 to predict the image size produced by an x-ray of any energy for any Csl crystal thicknc.vs.
The spatial resolution is ultimately determined by the convolution of the effective pinhole diameter and scintillator spot size. We evaluated this using a ray tracing code for an exponential source spectrum. The results show that the spot size for th« 0.5 mm thick crystal varies negligibly with temperature and is essentially pinhole limited for energies below 400 keV. The results for the 3 mm thick crystal, however, show significant variations with temperature. The solid curves :. "ig. 9 represent intensity profiles for a pinhole with a 2.8 mm diameter. Below 400 keV, the resolution is independent of plasma temperature and is crystal limited, while above 400 keV, the image sharpens and becomes pinhole limited.
10

1
2.0
1.8
1.6 . ' • *
1 1.2
1.0
, 0.8
0.6
0.4
0.2
0
1 Q - ' 1 0 ' 1 0 3 1 0 5
-
~ ^ C\ Csl(Na) / A / 0.5 mm-y X ~ - 3.0 mm^ / \ / / /
-\ AW
-
- » -10 1 10 2
Energy fkeV) 1 0 3 4 6 8 10
Spot size (mm}
Fig. 8. Ratio of spot size to crystal thickness, I'm** plotted versus x-ray energy for 0.5 m and 3 mm Csl crystals. The discontinuity in each curve corresponds to the K absorption edge in Iodine. The ratio of spot size to crystal thickness, &„,,,» plotted versus the ratio of v m a i to photon mean free path, A m / P , is shown by the dashed line.
Fig. 9. Comparison of intensity profiles obtained via Monte Carlo simulations when using a 2.8 mm diameter pinhole and 3 mm thick Csl scintillator for electron temperatures of 5, 100, and 400 keV. The pinhole diameters are in parentheses. Also shown is the profile for a 1 mm diameter pinhole and 3 mm thick Csl.
10 15 20 25 Radius (cm)
(a) (b)
Fig. 10 (a) Pseudo-3D contour of the typical x-ray emission from the thermal barrier location of TMX-U. The tall cut-off peak is thick target bremsstrahlung emitted v/hen energetic electrons strike the diamagnetic loop, (b) Gaussian radial profile of the chordal-averaged x-ray emission taken from a cut through the contour in (a). A value of 14 cm is indicated as the radius at the 1/e intensity point.
21
Note that the resolution below 400 keV for a 1mm diameter pinhole, depicted by the dashed line, is the same as for the 2,8 mm one This is because the opacity of the 1 mm diameter pinhole diminishes at 400 keV and the effective area therefore increases. When throughput is important, the 2.6 mm pinhole and 3 mm thick Cs] can be used with negligible spatial resolution loss. The 3 mm Csl also provides high quantum efficiency for the 400 keV photons. We employ the 0.5 mm Csl crystal because its resolution is pinhole limited over the energy range of interest. Given the specific geometry of the camera installation on TMX-U, a 1 mm diameter pinhole provides 2 cm spatial resolution at the plasma source.
The required gain of the image intensification stage depends, in part, on the readout mechanism. In our first generation instrument, shown in Fig. 6(a), a Nikon FE2 film camera or a Sony AVC-D] miniature CCD video camera was lens coupled to the output of an inverting microchannel plate image intensifier. Since the efficiency of lens coupling is less than 1%, an additional 40 mm diameter diode intensifier was inserted between the crystal and the microchannel plate intensifier to increase the gam by a factor of 50. The overall gain of this system was es 4x 10³ and was sufficient to obtain plasma images at 16 ms intervals. Fig. 10(a) depicts a pseudo-3D contour of the typical x-ray volume emission from the thermal-barrier location of TMX-U. The tall, cut-off peak is due to thick target bremsstrahlung that is emitted when energetic electrons strike a spot on the diamagnetic loop. A radial cut through the contour yields a profile of the chordal averaged x-ray emission at the thermal barrie-. It is usually well approximated by a Gaussian profile, shown in Pig. 10(b). The characteristic radius at the 1/e intensity point for this data is 14 ± 0.2 cm.
In order to acquire images in 1-5 ms frames, we have replaced the lens coupled cameras with a SIT vidicon readout which has an intrinsic gain of = 200. This factor of 2 x 10* improvement in sensitivity over the lens coupling scheme, enabled us to simplify the intensifier stage to a single 50 mm inverting microchannel plate image intensifier. The overall gain is w 1 x 10 e. The SIT vidicon operating parameters are under computer control allowing us to acquire images at nonstandard frame rates /35/ . Fig. 11 shows four frames taken at 4 ms intervals during recent TMX-U operation. They show that the plasma changes in size and shape on this time scale.
We use these results to model the plasma geometry. The intensity profile is a function of the radial dependences of the electron momentum distribution and the ion species mix.
66 ins
Fig. 11. Four images of recent TMX-U plasmas recorded at 4 ms intervals with the SIT vidicon camera system- The plasma increases in size by 50% in 10 ms. The feature in the lower tight corner that begins to form at 62 ms is due to the thick target bremsstrahlung emitted when energetic electrons hit the diamagnetic Soop.
12
Our x-ray spectra are obtained, hcwever, along the central plasma chord only. Lacking additional information, we assume that the electron distribution is independent of radius, although it is conceivable that this assumption may be significantly in error. Based on EUV measurements /37/ we assume that the impurity ion species concentration is also independent of radius. Given these assumptions, the quadratic dependence of intensity on density yields a Gaussian profile fcv the density with a radius that is a factor of y/2 larger than that of the intensity profile.
2.3 Bremsstrahlung Calculations
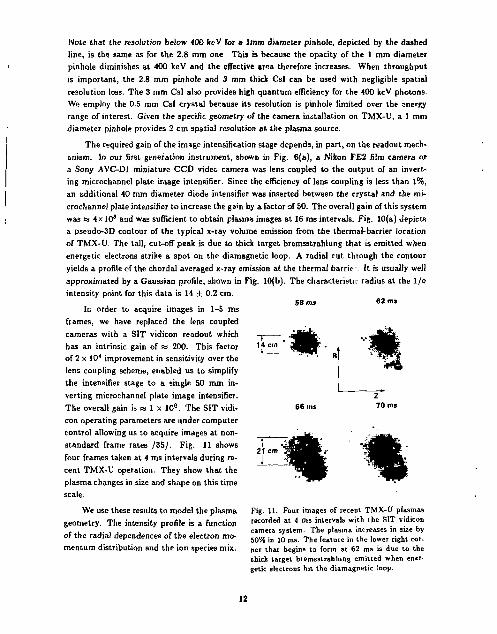
X-ray bremsstrahlung is generated from electron-ion and electron-electron interactions as well as from radiative recombination. In TMX-U, however, radiative recombination is negli-gible/38/. To date, calculations of the spectrum for mirror-confined plasmas have included only contributions to bremsstrahlung emission from electron-ion collisions, because this process dominates. The x-ray intensity resulting from electron-ion interactions is proportional to the square of the mirror-trapped electron density and to the relative abundances of associated plasma ions times the square of their charge Z.
In the context of the above plasma mod^l the bremsstrahlung differential brightness from electron-ion interactions measured along a chord of the plasma can be expressed as
^ ^ • = n„nTZxL^v{T„k) + nkhTZILxc,r(Th,k) , (5)
where we have written the brightness in terms of the peak electron densities times the integrated path length through the radial intensity profile. The symbol, *ep(X,fc), represents the bremsstrahlung emissivity at photon energy, k, and detection angle with respect to the magnetic field, &d- It is calculated by integrating the bremsstrahlung cross section over the distribution of electron momenta. Lx is the chord length obtained from the radial x-ray intensity profile. The quantity, Zx, accounts for high Z plasma impurities and is given by, Zx = — Yl>n*Z?N • Here, we have assumed that the majority of mirror-trapped electrons scatter off the bare nuclear charge, ZXN /39/.
Electron-electron bremsstrahlung is rarely included in bremsstrahlung calculations because at low temperatures its contribution is negligible. However, recent calculations for lower-hybrid-wave heating experiments in tokamaks have included its effects. Such computations for a tokamak plasma are simplified by the fact that the high-energy electrons that produce the high-energy tail of the x-ray spectrum constitute only Z% of the total electron density /38/. Since the bulk electron population has a temperature of < 1 keV, 97% of the target electrons available for scattering high-energy electrons are effectively at rest . The kinematics for such collisions are then analogous to those of electron-ion collisions, where an electron scatters in the electric field of a stationary heavy ion. Calculating the resulting differential cross-section and x-ray spectrum is straightforward since it involves the motion of only one electron.
The situation is far more complex for a TBTM plasma . In such a machine, it is desirable for the mirror-trapped fraction to be near unity. Thus, the bulk plasma electrons are sufficiently energetic to preclude use of the simplified kinematical picture described above. The particle dynamics of both electrons involved in the collision must be treated. As a result, the relative
13

contribution of electron-electron bremsstrahlung to the x-ray continuum observed in a. TBTM is larger than that expected in tokamak plasmas heated by lower-hybrid waves .
The brightness measured along a plasma chord at energy, k, and detector angle, tf^ due to this process can be expressed in terms of our plasma model as
dP{U$d) = *l!>**«(T~>T«,k) + hlLx<ee[n,Th,k)
+ 2h,hwLxcee{Tc>Tv,k) + 2hehhLx€te{TClTh,k) (6> + 2nwnhLxtet{TunTh,k) .
The symbol, t « , is the bremsstrahlung emissivity at photon energy, A:, and detection angle Sd for a distribution of electrons with temperature, T% interacting with an electron distribution with temperature, 7V
We have developed a computer code to generate t<p and c e e . The electron-ion emissivity, c e p
is calculated using the relativistic Born approximation formula for the differential cross section derived by Gluckstern and Hull/40/. It includes a multiplicative factor derived by Elwert/4l/ that improves the accuracy of the results when the photon energy is comparable to the incident electron energy/42/. The electron-electron emissivity, t t t is derived using a differential cro ;s section formulated by Haug/43/. This a!so includes an Elwert-Coulomb correction factor. The reader is referred to Ref./26/ by Silver and Clauser for more details.
A comparison of the electron-electron and electron- ion contributions is shown in Fig. 12, where the total bremsstrahlung emissivity for these interactions is plotted vs temperature for a single temperature relativistic Maxwellian distribution. The plasma is taken as hydrogenic. At temperatures below 50 keV, the electron-ion emisson dominates the electron-electron emission by at least an order of magnitude. At approximately 260 keV, the power emitted in the two processes is equal. In the extreme relativistic limit the total electron-electron power is twice that of *he electron-ion power.
Figure 13 shows the calculated spectra for single temperature hydrogenic plasmas at 32, 145, and 342 keV. The spectral contribution from electron-ion (ep) and electron-electron (ee) bremsstrahlung are plotted as solid and dashed curves, respectively. Their sum (ee+ep) is also shown. They illustrate how the apparent slope and intensity of the emission will indicate a temperature and density that are too high if we fail to account for the electron-electron emission process.
Rather than extracting the distribution directly from the spectra, we assume a simple model for the distribution function from which x-ray spectra can be generated for a variety of the model's input parameters . The most probable parameter values are taken as those that predict a spectrum with the best statistical fit to the observed spectrum. This indirect method has been carried out previously for mirror-con fined plasmas by several investigators /44/45/46/. It also has been employed in studies of tokamak plasmas heated with lower-hybrid waves (current drive) /38/47/48/49/50/ and in the analysis of hard x-ray bremsstrahlung from solar flares /51 / .
14

1 io-"
J,o-»
f l O -
2 1 0 " 1 6
I 10-".
1 1 1
sX S^^
- "3^<r _
^<-'„ X
1 1 i 10 1 0 2 1 0 3
Temperature (keV)
10
10
10
r 10
r 10 "E v 10
_ 10
: 10
10
10
10
10
10
10
10
{a} I I T. » 32 keV Z =1
^ e e — ^
^^ -oe + ep
i i i
20 40 60 80 100 120
<bl T,= 145keV ^ Z =1 •^S^r-
^ ^ e e + ep e e — ^ " ^~-*"*^:—-
e p ^
100 200 300 400 500
Ic) i
T. Z
342 keV 1
_\_ee *=== =^L ̂ ~ i~L — e e + ep
-/
" ' l
200 400 600 800 1000 1200 Energy (keV)
Fig. 13. Calculated spectra for single temperature, hydrogenic (Z=l) plasmas at (a) 32 keV, (b) 145 keV, and (c) 342 keV. The spectral contributions from the e!ectton-ion (ep) and electron-electron (ee) bremsstrahlung are plotted as dashed and solid curves, respectively. The total emission (ee+ep) is also plotted as the top curve.
Fig. 12. Total brenustrahlung loss rate of electron-ion (ep) and electron-electron (ee) scattering interactions is plotted vs temperature for a single temperature, relativistic, Maxwellian distribution. These calculations were performed for a hydrogenic, TBTM plasma where the electron pitch angle range is 65-115° and the detection angle with respect to the magnetic field is 90°.
(>)'
^
T w = 17 keV T„ - 318 keV
• * * * f ^ & L 1 x\. •
10'
. 1 0 "
r i o 9
£ 1 0 0 200 400 600 800 1000
| 1 0 " at
I 10" •C a
S i o 9
E « IB
1 0 s
1 0 '
<b|
:Vc - i i ^ ^ - ^ ̂ ; ^ Total ep
~ —- ~" Xterm ee No Xterm
0 200 400 600 800 1000 Energy [keV)
Fig. 14.(a) Typical spectrum observed in TMX-U. The solid curve is the beat fit obtained from the three component plasma model with Te w 0. The warm and hot electron temperatures are 17 and 313 keV, respectively, and the ratio of the warm to hot densities is 3.9. (b) Spectrum from (a) with the individual bremsstrahlung contributions to it. The total continuum is depicted by the top curve and the electron-ion (ep) by the solid curve. The electron-electron (ee) constituents are divided into two parts. Referring to Eq.(6), the bottom curve denoted by "No Xterm" is the sum of the diagonal electron-electron components with coefficients, n£ and n^,. The curve labeled "Xterm* represents the emission due to the sum of the cross-terms with coefficients h^nt,, n w Rc, and hhhc.
15

A two temperature spectrum, typical of that observed in TMX-U, based upon our three component plasma model with Tc as 0, is shown in Fig. 14. Figure 14(a) depicts the measurements together with a solid curve that represents the best fit from the three component model. The warm and hot electron temperatures are 17 and 318 keV, respectively, and the ratio between the warm and hot densities is 3.9. Figure 14(b) illustrates the total continuum emission and individual contributions to it. The total is depicted by the dashed curve. The electron-ion emission is represented by the solid curve. The curve with large dashes at the bottom of the figure, designated "No Xterm" indicates the sum of electron-electron components for hot electrons scattering off hot electrons and warm electrons scattering off warm electrons. The curve with the smallest dashes denoted by "Xterm" characterizes the emission due to the sum of the other terms in Eq.(6) , i.e., those cross-terms due to contributions from nvnK, hvnc, and hhfic- Note that for this representative plasma, tbe total electron-electron bremsstrahlung is approximately 40% of the electron-ion bremsstrahlung.
2.4 Determining The Fraction of Mirror-Trapped Electrons Of the instrumentation listed above, any one diagnostic alone provides to some extent
equivocal information. However, the results of these diagnostics can be combined via a complete set of equations, which in turn can be solved to extract the desired densities and temperatures. For example, the total x-ray emission measured along a plasma chord can be written as
^S = hlL^t^T^k) + tet[T*,Tw,k) + 2(1 - l)eet{T^Tc,k)}
+ nj[i, |^€,p(rA,fc) + e« ( r h l T f c , * ) + 2 ( - - l )€ e e ( r k ) T e ( i f c ) ] 9 q (7)
+ 2(- ~ \)cee{Tw,Te> fc) + 2(- - l)eee{Th,Tc,k)j .
The data can be fit to Eq.(7), thereby fixing the parameters n^nftjTu,, and Th for a given value of Zx and q. To do so, we use the method of Maximum Likelihood for Poisson statistics. Since Zx and q serve as relative scale factors between the electron-ion terms and the electron-electron terms, and these terms have similar shapes, the goodness of fit is insensitive to our choice of Zx and q. In other words, any variation in Zx or q will manifest itself as an alteration of n w ,6*1,7^ , and Th that roughly maintains the statistical quality of the St. As a result, it is exceedingly difficult to determine Zx and q by fitting the x-ray emission data to Eq.(7) alo<ae. A measurement is therefore needed that is either sensitive to Z3t q, or the mirror-trapped density.
A second constituent to the solution comes from microwave interferomctry. When the radial profile information and electron distribution function are used to correct the measured line-density we obtain the total electron density, n r . In plasmas with relativists electrons, the plasma becomes increasingly transparent as the electron masr increases for microwave frequencies above the plasma frequency. Consequently, interferometry will underestimate the electron density /52/. The average of 1/7 over the distribution function the fraction of electron density
16

actually measured by the microwave interferometer. If we define the fraction for an electron-density component with temperature, T, as < 1/7 >T , we can then write the expression for the peak electron density obtained via interferomtery, n^, as the sum of the cold, warm , and hot densities weighted by the appropriate fractions:
hlt=nc + hw < I /7 >r„ + « * < 1/7 >Tk • (8)
The peak density, n M , is determined from the integrated line density measured by the interferometer by dividing it by an appropriate path length calculated from our plasma model. In Eq.(7), the coefficient < 1/7 >TC has been set equal to 1. Substituting for hc in Eq.(7) from F<q.(3) to obtain the total density in terms of measured quantities leads to an expression for the mirror-trapped fraction, g,
The final component for our set of equations, must involve a measurement that is sensitive to Zx, qt or the mirror-trapped density. The plasma diamagnetism suffices, as it is proportional to the perpendicular plasma pressure.The diamagnetism has contributions from all components including ions. However, those from ions and cold electrons are negligible . The pressure per mirror-trapped electron, P ^ ' , can be determined from the normalized electron distribution as inferred from the x-ray spectra. For a unit distribution of mirror-trapped electrons only, we thus have
tiB = P ? 1 = I f£-f[p I Tw,Th)p2dp fsinHdB I'd<f> . (10) I j 7m J J
0 fln 0
Since we are considering only the subset of electrons that are mirror-trapped, we have taken the distribution function to be a two temperature relativistic Maxwellian, normalized for the sum of the warm and hot components rnly /26/.
The pressure, P™' depends only on the ratio of the warm to hot density and not on the absolute values of the densities. Given this ratio and Tw and 7\ from the x-ray analysis, we have a measure of the mirror-trapped density by dividing the measured total diamagnetism, M, at the thermal-barrier by P™(; thus,
» ! « - • = $ • ( " >
Here, M has been corrected for the electron radial profile and the value of the magnetic field at the barrier location.
All of the constituent equations are now at hand. Eqs.(7), (9), (10), and (11) can be solved self-consistently to yield hV),hhlTw^Th.tZx, and q. In practice, the solution of these non-linear equations is an iterative one that follows the flow diagram of Fig. 15. First, we take an initial guess for q and Zx. Following a fit of Eq.(7) to the x-ray spectral data, the quantity P™1 is computed using Eq.(10). The mirror-trapped electron density, n ^ t ) is then calculated frcm Eq.(ll) using the measured diamagnetism, M, at the thermal-barrier. A subsequent guess for
17

the mirror-trapped fraction, qneV), is then evaluated by substituting n ^ t for n w + n* in Eq.(9). From the x-ray absolute intensity, we get a second measure of the mirror-trapped electron density, which we call, n ^ t .
A self-consistent solution requires the two values, n^j and n ^ t , to be equal. Iteration continues until they are. This entails scaling the value of Zx/q by the square of the ratio n^t/n^t multiplied by qnev> to obtain a new value , ZnfVj, for Zx. Using Zntw
and qnew the x-ray spectrum-fitting procedure is then repeated until n^t and n^ t are equal to within 1%. This criterion is usually achieved after thres to five iterations.
| Start: Z , and q |
• Non-linear fi* + radial profile-*- r>w, fth, T „ , T h
• Computa P^' * r o m *tplT w . T hr
pml
*t,%, 1 - » , < - '^ ?ig. 15. Flow chart denoting the steps for itera-tively solving the aet of non-linear equations for the parameters, n„ , n.,, Tu,, Th: *?*, and q.
|ft«. V T w Th- 1- * - I F I M I
2.5 TMX-U Experimental Results
To study the dependence of x-ray spectral shape, mirror-trapped density, and mi*ror-trapped fraction on the systematic variation of the central-cell density we apply the experimental method developed above to plasmas heated solely by ECRH. Fig. 14(a) is a representative spectrum from these experiments with central cell density of 5 x 10 , I cm~ 3 . The plasma parameters obtained from these data are summarized in Pig. 16 by the solid circles. The temperature of the hot-electron component decreases from 31fl to 119 keV as the central-ceH density grows from 5 x 1 0 n e m ~ 3 to 1.75 x 10¹²<:m~3. The warm-eiectron temperature is constant at 20-25 keV except for the highest values of central-cell density, where it reaches 58 keV The warm-to-hot density ratio appears to decrease monotonically from a value of 4 at ntc = 5 x I 0 n c m ~ 3 to a value of 2 at nee = 1.75 x 1 0 n c m " 3 . The mirror-trapped density and fraction together with the effective nuclear charge are plotted for this experiment vs the centra] cell density in Fig. 17. Both the mirror-trapped density and its fraction monotonically decrease over the measured range of central-cell electron densities. The maximum value for q, obtained at a central-cell density of 5 x 1 0 l l c m - 3 , is 0.7 ± 0.15. We note for later reference that the effective nuclear charge, Zx , increases from 1.5 to 3 over this range of n e c .
X-ray spectra from a recent experiment with TMX-U configured for full thermal-barrier operation have been measured at 10-ms intervals. Our analysis provides a temporal history of
18

> 350 * £ 300 250 200 1S0 100 SO 0 6 5
J= 4 ^ 3
2 1
- M V - i — i — r - •h
- • -- •
i i • , •
,T._ 1 1 1
0 4 8 12 16 2 0 x 1 0 "
Central cell electron density n e c ( c m - 3 )
Fig. 16. Plasma parameters obtained from x-ray spectra] measurements of plasmas heated solely by ECRH. In (a), T„ and X» and in (b), fi„/n» are plotted vs central-cell density.
500 400 300 200 100 0
(•) j x . T w
o = T„ (•) j (•) j
. -< b> *
5 0t+
'0 4 8 12 16 2 0 x 1 0 " Central cell electron density n , c (cm" 3)
1 0 0 3 4 0 5 8 0 — S c a l e c h a n g e -
Time (ms)
Fig. 17, Mirror-trapped density, mirror-trapped fraction, and effective charge derived from the same apectraJ data analyzed to obtain the results in Fig. 16.
Fig. 18. Temporal history of (a) T« and Th, (b) ft„ and nht-$e) Zx, and (d) q for the TMX-U experiment configured for full thermal-barrier operation. Note the time scale change after 100 ms.
19

the distribution function and mirror-trapped fraction. The results substantiate the qualitative description of the plasma evolution that we inferred from a casual perusal of the data above. According to Fig. 18(a), the warm temperature (shown by x) remains constant at approximately 25 keV for the 50-ms second-harmonic ECRH-pulse duration. The hot temperature (open circle), on the other hand, climbs rapidly to 100 keV in the first 10-15 ms and demonstrates a slower rise during the final 35 ms of the ECRH pulse. It reaches a plateau value of approximately 200 keV that appears to increase slightly, even in the afterglow plasma. (Low plasma x-ray brightness during the first 10-ms period limited x-ray measurements during this interval.)
Figure 18(b) shows the temporal behavior of the warm and hot electron densities for this experiment. The density of warm-electrons reaches 70% of its peak value during the first 10 ms of the ECRH pulse, while the hot-electron density builds slowly until the ECRH-pulse terminates. The warm-to-hot electron density ratio decreases from about 10 at 20 ms to approximately 3 at 50 ms. When the second-harmonic ECRH is turned off, the warm-electrons abruptly disappear while the long lived hot electrons remain.
The warm-electron density, n v , actually goes negative during the 100 ms period following termination of the ECRH pulse, A negative density for one component (with total density positive) can be understood in the context of fitting two exponentials to a spectrum produced by a distribution that is deficient in low-energy elections. Evidently, a low-energy hole forms in the distribution at this time. Not only do the low-energy electrons from the warm-electron distribution leave the plasma, but many low-energy electrons that contribute to the distribution of the hot Maxwellian component also scatter into the loss cone of the mirror. This hole in the distribution is manifest by the flattening of the afterglow x-ray spectrum below 100 keV as seen in Fig. 4(b)
The mirror-trapped fraction, q , hovers at 15-20% during the ECRH pulse as depicted in Fig. 18(d). It drops by a factor of 2 when the second-harmonic ECRH pulse terminates because of the loss of v/arm-electrons, and finally rises to at least 55% in the afterglow because of a loss of cold electrons. The effective charge, Zx, increases from a value of 2 to about 8 during the ECRH pulse, then rises dramatically in the afterglow to approximately 100. The values during the ECRH pulse for full thermal-barrier operation are markedly higher than those measured for a plasma heated solely by ECRH . A value of 100 during the afterglow plasma is not surprising if the afterglow plasma is composed of ionized metals only - For example, a plasma composed of four times ionized pure titanium yields a value of 121 for Zx.
2.6 Electron-Cyclotron Emission
Perpendicular electron-cyclotron emission (PECE) is detected from hot electrons that are mirror-confined at the thermal-barrier location of both end-cells. Optically thin emission at two widely separated frequencies is used to calcuh/"1 the temporal evolution of the hot electron temperature, 7 \ , and density, rih.. To accomplish this task, a relativistic code /28/ has been developed to calculate the temperature dependence of the perpendicular emission coefficient, J i ^ i O ^ o r the frequencies of interest. Using this method, we have obtained excellent qualitative agreement between PECE and x-ray measurements of 7V
20

In one end plug, a high gain horn antenna and overmoded waveguide are used to collect and t ransport the emission to receivers located outs ide the experimental area. By reducing to fundamental waveguides, polarization selection is made at the receiver input . Measurements are performed at 35 ,60 , and 98 GHz which are 2 .5 ,4 .3 , and 6.7 t imes the fundamental cyclotron frequency, respectively. Double-balanced, superheterodyne receivers with bandwidths of 0.3, 1.0, and 2.0 GHz , are used respectively / 5 3 / .
The opposite plug contains a quasi-optical viewing system capable of being calibrated absolutely / 5 4 / . I t consists of a V-band horn an tenna and an ellipsoidal focusing mirror to produce a tightly collimated detection pat tern (3 d B diameter of ''w 5cm). Facing it is a Macor microwave beam-dump t o prevent wall-re fleeted radiation from entering the collecting optics. The receivers are variously tunad to 65, 98, 130, and 195 GHz. They are si tuated in the experimental area t o shorten the waveguide runs, and thereby reduce t he uncertainty in their calibration.
The spectrum from a low density plasma such as t ha t found in TMX-U, consists of a series of harmonics of the cyclotron frequency, f c e, each of which is relativisticatly shifted and broadened. Radiation is emit ted in both the extraordinary and ordinary modes. For average electron energies above 50 keV considerable harmonic overlap occurs and the spectrum becomes somewhat featureless. For values of (i>/pC€) > 3 the emission is optically th in .
If source emission fills the receiving antenna pa t te rn , the power captured a t a frequency, t>, within a bandwidth, dv> is P{u] = d ^ / s ( l - e ~ r ) where IB is the blackbody intensity per unit frequency, and r = J a ( i / ) n / i ( r ) d r is the optical depth . Here, c* is the absorption coefficient per uni t density and n^.(r) is the radial hot-electron density as a function of radius. For an optically thin plasma, we have r « 1 and thus, P(u) = duI^T. Using KirchofTs law in the single particle limit, one finds, IB = j±{!',t)/a{i/tt). The perpendicular emission is then given by / 5 5 /
P{v, t) = duX*iT
±
h {ut t) J n h (r)dr , (12)
where we have set T ~ TV
The temperature dependence of j ^ A at the detected frequencies is shown in Fig. 19. These calculations are the results of numerically integrating the Schott-Trubnikov / 5 6 / formula for the single particle emissivity over a Maxwellian distribution of electron momentum that has a step function at the loss-cone boundary in momentum space (see section 2.1). The contributions from each contributing harmonic are included.
The ratio between the P E C E signals measured at any two frequencies is proportional to the ratio of the respective perpendicular emission coefficients. The ratio Fig. 19. PECE code calculation of the perpendic
ular emission coefficient, ) ±*' [v) plotted versus Th for 35, 60, and 94 GHz.
21

is, therefore, temperature dependent b u t independent of density. Since the P E C E intensity is
proportional to the plasma tempera ture , the emission from ths *iot plasma component (200-400
keV) dominates the warm component (20-50 keV).
~T 1 1 1 1 T
(a) T—r"
West 60 GHz
Ql 1 A ! I l _ l — ' ' 120
—i—i—i—i— ' .— i—i—i—i—i—r (c) West 35 GHz
ECRH
t(ms)
I
(b) —i—i—i—i—r~
West 98 GHz
J__l L_] L.
500
120
—\—I—l—t—iiti—i i i (d) West T h
i ' i ' i ' • \ • • • »
12C t{ms)
Fig. 20. Sample PECE signals showing temporal history of the (a) 60 GHz, (b) 98 GHz, and (c) 35 GHz emission. The dashed curve in (c) indicates hr.w the 35 GHs signal might be expected to behave if it wei; not attenuated by a warm electron plasma. In (d), the temporal profile cf Th is plotted. This was derived from Eq. (13) and the data in {a) and (b). The solid dots are derived from x-ray measurements.
T h e ratio can therefore be us.?d to mewv-.e the hot electron temperature , 7 \ , as a function
cf t ime t. The 35 GHz signal shown in Fig. 20(c), cannot be used for this purpose because it is
a t tenuated during the ECRH pulse. This ••••bservation lends further credence to the existence of
hot and warm population components found by the x-ray analysis. The optical depth at 35 GHz
is significantly greater than t ha t at 94 GHz. This behavior of the 35 GHz signal is consistent
with absorption of the hot-electron component emission by a warm electron component. In the
early afterglow, the warm plasma population disappears, and the 35 GHz signal increases to a
level consistent with that expected from jus t the hot component.
For TMX-U plasmas, we measure the experimental ratio between the 98 and 60 GH2
22

sign ah 1 P(9S,1) _ ff(M,Q
and compare the value with the code predictions for jJh{98tt)/j^h(G0,t). Fig. 20(d) shows the resulting temporal history of TV X-ray measurements are shown as solid dots. Since the waveguiJe attenuations are not precisely known, the constant, C, is adjusted so that at 100 ms, Th is equal to the temperature obtained from the high energy x-ray spectrum.
The temporal evolution of the hot electron density, n>(t)> can be inferred from the measured power, either P(98,l) or P(G0,t), and the values of jT?{v,t) calculated from the temperature results. The radial profile measurements obtained from the pinhole camera are also needed. As with the x-ray measurements, this procedure requires a calibration from the dia-roagn*tism measurement. This must occur at a tinr* in the shot when the warm component has di?appeared but before the hole in the distribution has formed. The time-resolved x-ray measurements cf the distribution function provide this information.
3. Electrostatic Potent ial Measurement.s
3,1 End- loss Ion Spectrometer
The open ended feature of a TBTM means that ions and electrons escape from the plasma carrying significant information about the confined plasma. A gridded, electrostatic particle-energy analyzer /57/ has been routinely used to diagnose the plug potential, 0 P , and under special circumstances it has been us-.d to study the central cell poten-ial and the depth of the thermal-barrier. This has been supplanted by a more sophisticated instrument called the end-loss ion spectrometer (EL1S) /58/ . It can measure simultaneously ion energies for two different masses and obtain information about the peak potential, sheruial-barrier potential, and central-cell ion temperature. Data on confinement and ion-end-loss plugging, hydrogen/deuterium concentrations, magnetic field location of the potential peak and energetic electron losses are also possible. Here we will describe the instrument and focus on its ability to infer the electrostatic potential.
The ELIS, shown schematically in Fig. 21 uses parallel electric and magnet'c fields tc respectively separate the masses and resolve the energy spectrum of each mass. It is modeled after the charge exchange neutral analyzer on the Tokamak Fusion Test Reactor(TFTR) /59/ with the omissior, of the charge exchange cell preceding their analyzer. Fig. 22 shows the spatial separation. The greater the ion energy, the further the inD is displaced to the right of the entrance aperture when it strikes the detector array. The entrance hole is displaced toward the plan 5 of one pole tip to allow as much room as possible for the electric field to disperse the different masses as they accelerate toward the other magnetic pole tip.
An array of 128 flat collector plates intercepts the ions whose trajectories have been bent through a 180° arc. Fig 23 shows the array with 2 rows of 60 detectors each - a row for the deuterons and a row for the protons. These 120 detectors ar< surrounded by 8 border detectors to guard against ions missing the regular detectors. The spatial width of the 120 detectors is varied so that each covers the same energy range. The detector array is made of copper-coated G10 epoxy fiberglass (normally used for printed-circuit boards) with lines of copper
23

etched away to make the individual detector plates. The numbers across t he top represent the locations on the detector array where deuterons and protons of t he indicated energies will contact the detector plane. The sensitive energy range of the ELIS can be varied by adjusting its magnetic field.
Fig. 21. Major components of the ELIS, shown schematic ally and approximately to scale.
D * , H + ^
Fig. 22. Spatial separation of ions by mass and energy in EjJB region of ELIS. Symbols E and B represent the electric and magnetic fields respectively, and W represents the ion energy. Shown are trajectories for two different D+ and two different H+ energies.
D + (keV) 0.25 0.5 H + (keV) 0.5 1
Fig. 23. The ELIS detector array of 128 flat collector plates that intercept the ions whose trajectories have been bent through a 180 ° arc.
When calibration and testing are needed, a calibration ion source can be moved in front of the ent rance aperture . A straight-through detector can he used to measure t he to ta l ion flux entering the instrument when the electric and magnetic fields are off. A normalization detector s i tuated a t the side of the entrance aper tu re can monitor the total ion flux from the p lasma to the ELIS.
T h e ELIS measures the ion energy spectra which are related t o the plasma potentials and ion energies inside the plasma / 6 0 / , An example of a spectrum for D~* is plotted on linear and semi log scales in Fig. 24(a) and 24(b), respectively . Assuming t ha t no ions are lost by plasma outboard of this peak, one can see tha t an extrapolation of t he da t a on the low
24

energy side of the spectrum to the base- line (x-intercept) then provides an est imate of the min imum ion energy required to overcome the peak potential barrier, (f>?. This is indicated in Fig. 1(d) which is the predicted axial potsntial profile for the end-plug of a T B T M . The slope of the high energy side of the spectrum in the spmi-log plot furnishes an es t imate of the average t empera ture for escaping ions. Assuming their dominant source to be the central cell. it is then an es t imate of the centra) cell ion tempera ture .
X - intercept = 2*1 eV 1/t = 95«V
n.y -wnaj
- \ : \
1 0 o l 1 0 200 400 600 800 0 200 400 600 800
tftp D* energy IBV)
Fig. 24. Sample EL1S spectrum of D+ ions plotted on (a.) linear and (b) semi-log scales. Extrapolating the low energy side of the spectrum in (a) to the baseline (x-integer) yields an estimate of the peak potential, tj>p, indicated in Pig. Id. The slope on semi-log axes of the high energy spectrum is an estimate of the temperature ol escaping ions.
Fig. 25 depicts the temporal history of the D+ energy spectrum, measured every 200 fis, for a typical TMX-U plasma shot. The deuter ium losses extend from 5 ms to 25 ms at which t ime axial confinement is achieved and the end-losses d rop to zero. End-losses recur at 65 ms when E C R H and neutral beams are shut off. During the shot, the energy spect rum (assumed mainly to be due to central-cell losses) varies considerably in shape and in its position on the energy axis.
The ELIS is also used as a sensor of the potential in the region of the opposite end cell where a thermal barrier is predicted to exist. By injecting an auxiliary neutral beam at 18° (inside the loss-cone), the energetic beam a toms will be ionized by the plasma a t a known kinetic energy and be lost in one transi t ou t the opposite end. This is shown in Fig. 26(a) . The kinetic energy of these ions, detected by the ELIS, equals the original beam
Fig. 25. Temporal history of the D"1" end-loss energy spectrum of the total ion current measured every 200 ps. Good axial confinement is ichieved between 25 and 65 ms and end Josses drop to zero.
25

energy plus the potential energy associated with the plasma region in which they were created. The auxiliary neutral beam is operated on hydrogen gas so that the resulting ions are protons and, with our double row of detectors, are easily distinguishable from the deuterons emitted by the standard deuterium plasma.
Fig. 26(b) shows a possible axial plasma-potential profile of the predicted thermal-barrier type. Indicated is the approximate axial region over which ions can be produced by ionization of the neutral beam so that they will be subsequently detected by the ELIS. This axial region, indicated by the arrows at the right, is where the neutral beam intersects the bundle of magnetic-field lines observed by the ELIS. The energy spread of such ions should correspond approximately to the range of potentials in the thermal-barrier region over which they were born.
AA. c h^L
J^A = A w ELIS PPD 21
Ax'nldnttnc*, Z
Fig- 26. Axial profile of (a) magnetic-field intensity showing injection angle and position or neutral beam injection inside loss cone, (b) possible TBTM axial potential profile. The arrows indicate axial region where the neutral beam intercepts the magnetic field lines observed by ELIS. The higher the potential at which an ion is born, the more energetic it will be when it reaches the ELIS. This is denoted by the varying length of the arrows, (c) Axial regions in TMX-U where the plasma potential is measured simultaneously by ELIS and the heavy-ion beam probe-potential diagnostic.
A neutral beam normally has full-, half-, and third-energy components in it. The ELIS observes all three energy components. These are labeled Wt, Wj/2 , and W 4 / 3 , respectively, in Fig. 27 where a temporal profile of end-loss ion spectra for each component is plotted. The original neutral beam energy and plasma potential are easily obtained from these data. The ion energies detected by the ELIS for each component represent the sum of the original beam energy and the plasma potential. The original beam energies are measured directly from the beam's acceleration voltage and the potential can be obtained by subtraction. Alternatively the original beam energies and plasma potential can be obtained by solving the simultaneous equations, using any two of the three component signals.
26

Consistent results are obtained for the various methods. A beam energy of ft: IS keV and a potential of 2 ItV was measured from the data in Fig. 27. The temporal trace at low energies has a centroid energy of =s 2 keV and represents the end-loss spectrum from the central-cell ions escaping through and out the end of the plug opposite from where the auxiliary beam is injected. Note that these are examples showing the ELIS capabilities, and do not necessarily represent thermal-barrier operation. Careful axial potential measurements are currently in progress.
3.2 Thallium-Ion Beam Probe Potential Diagnostic
The space potential in the central-cell of TMX-U is measured directly with a the Plasma Potential Diagnostic (PPD) /61/62/33/. Energetic, singly charged thallium ions are injected across the plasma cross-section. A fraction of these become doubly ionized along the beam path when they collide with plasma electrons. No significant momentum change occurs, but the Larrnor radius of the thallium ions is halved. The magnetic field confining the plasma separates the doubly charged ions (T7 4 2 ) from the primary beam and other Xi"*2 ions created at other points along the primary path. If a 7 7 4 2 ion has sufficient momentum to escape from the confining field, its final kinetic energy will be increased by the value of the plasma space potential at the ionization site- If the space potential at a location, (x,y), in the plasma cross section is 4>[x,y), the energy of the primary beam will be reduced by e<p(x, y) by passage to (x,y). Ions incrementally ionized at (x,y) will gain an energy 2e#(x, y) upon leaving the plasma. Their net energy gain is therefore t<p{z,y) which is measured by comparing the T i + 2 energy with that of the Tl+ primary beam.
For doubly charged ions to escape from the plasma, their gyroradius must ce comparable to the diameter of the solenoidal magnetic field. This constraint, determines the energy required by the primary beam. The product of the radius, R, in cm, and magnetic field, B, in gauss, is RB = 4.56 x l03y/AEZ/{Z + 1) where A and E are the mass in AMU and energy in keV respectively. Z is the charge of ion as it leaves the ion gun. For practical reasons, it is advantageous to maximize the mass, A, because it lowers the beam energy required.
The heaviest ion that has an appropriate atomic structure is thallium with a mass of 204. The configuration of the outer shell of neutral thallium is 6s26p. The outer p electron is loosely bound requiring only 6.106 eV to be ionized. Singly charged ions are thus easily created in
- End km from cwttraj ettl
0 3 6 9 12 15 18
H* wMrsy (k«V>
Fig. 27. Time re3olved ELIS energy spectrum of the thire energy components of the auxiliary neutral beam.
27

the source. The ionization potential of the 6 s 2 electron is 20.42 eV and is sufficiently high to achieve good penetrat ion into the plasma before a second ionization occurs. In TMX-U, a primary beam energy of 54-60 keV is required t o assure transmission of a doubly charged ion created at the center of the plasma where the field strength is 3 kG.
The thallium source is made from a thall ium zeolyte material. (A zeolite material is an ion exchange compound t ha t binds the ion in an ionic solution in ionized form). The binding
.energy of the tons in the soui-ce is low enough tha t they can be therm!onicat)y emitted. The ' ions are extracted from the zeolite, accelerated to the desired beam energy , and then directed by two sets of electrostatic deflection plates to the desired trajectory.
The trajectories are simulated on a computer using a description of the magnetic field and the locations of t he ion source and analyzing detector. T h e simulation produces a m a p t h a t uniquely defines the location in the plasma where a douMy charged ion can be created for a given injection energy and source angle, and subsequently detected. By sweeping the beam in a direction perpendicular to the field, while simultaneously adjusting the beam acceleration voltage, sca.:s of the plasma diameter are made during a single plasma shot . Alternatively, the injection may be held fixed io measure the plasma potential as function of time at a single location for the duration of the plasma shot. The instrument and experimental configuration are shown in Fig. 28.
Fig. 28. Thallium-ion beam potential diagnostic (PPD) in TMX-U central cell.
Ion optla t*nk M*nbly
The detector for the T / + 2 beam ib a parallel plate electrostatic analyzer. In addition, two other detectors are used for calibration purposes. One is a "straight-through" detector used when the magnetic field is off. It is composed of a cross-wire grid that defines the initial line of sight. It can also measure the uniformity of the beam profile. The third detector is position sensitive and is used to monitor the primary beam. Hs purpose is to map the spatial profile of the magnetic field to verify the trajectory simulations.
The spatial resolution of the device is determined by the primary beam diameter and the size of the entrance aper ture of the analyzer. Typically, about 1cm 3 of plasma is sampled. The resolution of the analyzer limits the precision of space potential measurements to SO volts for a thallium beam at 50 keV. The bandwidth of the system can be as high as 200 kHz, but in typical operation it is 20 kH2.
28
Prlmirr dMctor numbly -

Fig. 29 is an example of the plasma potential data obtained by the PPD for the first 55 ms jf a TMX-U shot used for testing the operation of the instrumentation. For comparison, the data from the two ELIS instruments is also plotted. In this shot the data indicate that the potential profile exhibits little axial variation and that the three diagnostics observe the same temporal plasma behavior. 10 15 20 25 30 35 40 45 50 55
Time (ms)
Fig. 2d. Sample time resolved potential data obtained by PPD. The data ftom two ELIS instruments are plotted.
3.3 Time of Flight Analyzer
Time of flight analysis is being used to measure the velocity spectra of charge exchange neutral particles emitted from the midplane of the TMX-U endplug. The time of flight analyzer (TOF) views the midplane at an angle of 22.5° with respect to the magnetic axis. With this orientation, the analyzer is sensitive to particles with pitch-angles in the magnetic loss cone of the plug. In principle it can be used to measure the potential diiference between the barrier and potential peak. The velocity spectra also provide information about the ion temperature.
The regions of maximum magnetic field and electrostatic potential in mirror machines represent turning point limits for the confined particles. Unconfined particles leave the machine in a single pass. A study of the energy phase-space-representation of ions for different regions is useful in understanding how the TOF may be used to determine the electrostatic potential at various axial points.
The phase space boundary equations are easily derived. From the conservation of energy, we have for a confined particle at location, z,
mz)+T±(z) + e4>{z) -constant , (14)
where T||(s) and T±{z) are its parallel and perpendicular components of kinetic energy, respectively, and ${z) is the electrostatic potential there. Conservation of magnetic moment implies that,
(15) ^ = ~td\ = conslant
If a turning point is taken to be at z = z t , then we have T^(zt) = 0, and
Tj-{Z) = BM[-]B(z)IW + e W z ) ' 0 1 " ) ) ] • ( , 6 )
For example, a particle at z = zk (the midplane of the plug) will be confined by a potential peak at location p shown in Fig. 30(a), if its perpendicular and parallel kinetic energies, T±(zt), and T||(*&), respectively, lie to the left of the phase space boundary defined by
^ W = B ( # f e ) l r ' W + « ( * W - ^ ) ) l (17)
29

This line, labeled L t p is plotted in Fig. 30(b) for the assumed potential profile of Fig. 1(d). The boundary corresponding to the confinement limit set by the outboard magnetic field peak, m, is similarly depicted in Fig. 30(b) and labeled Lsm-
Fig. 30. Axial magnetic field profile and potential, [a) Predicted axial profile of a TBTM. Letters b, p, and m identify the potential well (thermal barrier), the potential peak, and the outboard magnetic field peak, respectively, (b) A
i plot of phase-space for the thermal barrier location, z = zb. Lfcp is the confinement limit set by the potential peak, 4[zF), for a particle at z ~ Zb-tbm is the limit set by the magnetic field peak, m. The heavy line represents the phase-space location of particles with pitch-angles of 22.5° (those viewed by the TOF diagnostic).
Particles with pitch angles of 22.5° will lie in phase space along the heavy solid line in Fig. 30(b) and be viewed by the T O F diagnostic. The equation for the line is
7\i.00 = T| | (2)tan 2 (22.5°) . (18)
Let us denote by 7" m „, the total kinetic energy at the intersection of this line with boundary, L k p . Note that any ion detected by the TOF with total kinetic energy greater than T m a I is not confined by the potential, *(z p). Moreover, it is not magnetically confined unless (^(zm) is sufficiently large such that L t m intersects Lj p at a point where the total kinetic energy is less than T„,«*. Assuming that the potential at <j>(zn) is sufficiently low that this does not occur, then the TOF energy spectrum will exhibit a break or "knee" at Tmax corresponding to the Ltp
confinement limit. By measuring this high energy cutoff, a value for the potential difference between the barrier and predicted potential peak locations should be achievable (given the caveat conrining #(*„>)). Combining Eq.(18) with Eq.(17) above, we obtain $b + «>,, the potential difference between the barrier and potential peak, in terms of Tmax as
[1 - B ( ' ^ ; B i ' " i ' a n a ( 2 2 . 5 ° ) l , [««, ) - « * ) ' , = t(fc + *.) = i ' t e B . ( 2 2 . 5 - j T m " • m
For values appropriate to TMX-U, 8(zb) and B(zp) are 5 and 10 kG, respectively, and Eq.(19) implies that e(tj>b + "M = 0.717^,,!.
The TMX-U TOF analyzer design is based upon work by Voss and Cohen /64/. The charge-exchange neutral particles emerging from the plasma are chopped by a rotating, toothed
30

wheel. The chopper was fashioned from a modified turbomolecular pump with speeds variable between 3000 and 43000 rpm. It has 14 tapered slots. As the chopped beam pulse leaves the wheel, it disperses due to the different velocities of the particles. The particles travel down a flight tube that is 700 cm long and strike a detector consisting of a Cu-Be secondary emitter coupled to an electron multiplier. The system is sensitive to neutral particles with energies greater than 20 eV.
The velocity distribution function, /(f) , for the charge-exchange neutral particles is determined from the detector current as a function of time, /j(<) for each pulse. From this, the energy distribution can be inferred if the particle mass is known. If n0 is the total neutral particle density in the plasma, the rate of particles leaving the plasma in a velocity interval, v to i>-f dv, is proportional to n0f[v)v3dv. The current of particles in the same velocity interval impinging on the chopper wheel is then, I(v) oc f(v)v3dv. Suppose a slit in the chopper wheel opens at ( = 0 and closes at a time At later. Further, assume that the times to open and to close are short with respect to the total open duration. Transmitted particles then travel down the flight tube for a distance, Lt to the detector. Their different velocities are manifest by their varying arrival times at the detector if the open duration, At is short compared to their flight time. For the time interval, t to t 4- At, only those particles with velocities between vj = L/t and v2 = L/(t - At) will be detected. If S(v) w 10~ 1 5 v 2 is the velocity dependent secondary emission coefficient of the Cu-Be target, then the detector current is given by
Id{t) a / 2 5{v)I{v)dv a / * n0f{v)v*dv . (20)
For t >> At the approximation, dv « t>2 - uj « Atv2/L holds, and the integral becomes
U(*) ocn0f[v)v7At/L (21)
The distribution, f(v) can thus be obtained from the measurements of U[t)-
A sample charge-exchange spectrum is, shown in Fig. 31. A distinct "knee" is observed at 200 eV. This break can be interpreted using Eq (19) as an indication that the potential difference, tf>t, -r & is 0.14 kV.
Fig. 31. A sample charge exchange spectrum. The "knee" or break in the spectrum may be interpreted as the <j>b + fa = 0.14 kV potential difference between the barrier and peak.
.C u
0.5 1.0 Deuterium «n*rgy (k«V)
31

4. Summary We have reviewed two classes of diagnostic techniques used in a Thermal-Barrier Tandem-
Mirror machine. The first class is for studying the mirror-trapped electrons. This class includes: (a) high resolution x-ray detectors for measuring bremsstrahlung emission spectra and inferring the electron distibution function; (b) a high energy x-ray pinhole camera for measuring the radial extent of the mirror-trapped electron plasma; (c) ft methodology for analyzing the x-ray results and combining them with measurements of plasma diamagnetism and interferometric line densities to yield mirror-trapped electron densities, temperatures, and proportions; and (d) perpendicular electron cyclotron emission detectors, which when calibrated against the ether diagnostics, allow the hot electron temperature to be Monitored with high time resolution.
The second class of diagnostics is for measuring the plasma space potential at various axial locations within the machine. These include the following: (a) a singly ionized thallium beam that penetrates the plasma. The potential energy gain associated with a second ionization is detected; (b) an E (| B ion spectrometer that can temporally resolve the energy spectrum of those ions that escape from the plasma along open ended magnetic field lines. These measurements are obtained simultaneously for two different masses. Electrostatic potential is determined in two ways. The first involves an extrapolation of the low energy spectrum to the energy where the intensity is zero. This provides an estimate of the minimum ion energy required to overcome the final potential barrier to escaping ions. The second method involves detecting the energy gain associated with the first ionization of a neutral beam injected inside the loss-cone; and (c) a charge exchange product analyzer that is sensitive to particles with pitch-angles within the Ions-cone. Energy spectra are measured using a time-of-flight technique. Potential is inferred by identifying the loss-cone boundary energy from the spectral shape.
5. Acknowledgements The authors would like to thank the entire TMX-U staff for useful discussions. We are es
pecially grateful to F. Faria and M. Mays for their tireless support in preparing this manuscript.
32

References
/ l / BALDWIN, D.E. and LOGAN, B.G., Phys. Rev. Leu. 43 (1979) 1318.
,'2/ COENSGEN, F.H., SIMONEN, T.C., CHARGIN, A.K., and LOGAN, B.G., Lawrence Livermore National Laboratory, Livermore, CA, LLL-PROP-172 (1980).
/ 3 / GRUBB, D.P., ALLEN, S.L., CASPER, T.A., CLAUSER, J.F., COENSCEN, F.H., et al., Phys. Rev. Lett. 53 (1984) 783.
/ 4 / KESNER, J., GERVER, M.J., LANE, B.G., MCVEY, B.D., AAMODT, RE. , CATTO, P.J., D'IPPOLITO, D.A., MYRA, J.R., Introduction To Tandem Minor Physics, Department of Energy, Washington, D.C., DOE/ET/51013-109 (1983).
/ 5 / SPITZER, L. 1962 Physics of Fully Ionized Gases (Interscience: New York).
/ 6 / PASTUKHOV, V.P., Nucl. Fusion 14 3 (1974).
/ 7 / CORRELL, D.L., ALLEN, S.L., CASPER, T.A., CLAUSER, J.F., COAKLEY, P., COENSGEN, F.H., et al., Nucl. Fusion 22, 223 (1982).
/ 8 / YATSU, K., MIYOSHI, S., TAMAI, H., SHIDA, K., ISHII, K., and 1TAKURA, A., Phys. Rev. Lett. 43, 627 (1979).
/ 9 / BRUEN, R., GOLOVATO, S.N., YUJIRI, L., MCVEY, B., MOLV1K, A., SMATLAK, D., POST, R.S., SMITH, D.K., HERSHKOWITZ, N., r-hys. Rev. Lett. 47, ISIS (1981).
/10/ COHEN, R.H., BERNSTEIN, I.B., DORN1NG, J J . , and ROWLANDS, G., Nucl. Fusion 20, 1421 (1980).
/ l l / COHEN, R.H., Phys. Fluids 26, 1997 (1983); MATS'JDA, Y. and ROGNLIEN, T.D., Phys. Fluids 26, 1778 (1983).
/12/ SIMONEN, T.C., in Summary of TMX-U Results: 1984, Vol. 1, Lawrence Livermore National Laboratory, Livermore, CA, L'CID-20274 (1984).
/13/ HOOPER, E.B. JR., BALDWIN, D.E., FOWLER, T.K., KANE, R.J., and TURNER, VI.C, Phys. Fluids 27, 2264 (1984).
/U/ ALLEN, S.L., CORRELL, D.L., HILL, D.N., and KAISER, T.B., UCRL-94588, submitted . to Phys. Rev. Lett., July 1986.
/15/ ALLEN, S.L., CORRELL, D.L., HILL, D.N., WOOD, R.D., BROWN, M.O., Pioc. of 6th Topical Conf. on High Temperature Plasma Diagnostics, Am. Phys. Soc, Hilton Head Island, SC (1986) UCRL-93877.
/16/ SILVER, E., BITTER, M., BRAU, K., EAMES, D., GREENBERGER, A., HILL. K.W., MEADE, D.M., RONEY, W., SAUTHOFF, N.R., VON GOELER, S., Rev. of Sci. Instrum. 53 8 (1982) 1198.
/17/ HILL, K.W., BITTER, M., EAMES, D., VON GOELER, S., SAUTHOFF, N.R., SILVER, E., in Low Energy X - Ray Diagnostics, AIP Conf. Proceedings No. 75, Eds. Attwood, D.T., Henke, B.L., American Institute of Physics, New York, NY, (1981) 8.
/18/ VON GOELER, S„ HILL, K.W., BITTER, M., CLIFFORD, C , FREDD, E., et al., in Diagnostics For Fusion Reactor Conditions, Eds. Stott, P.E., Akulina, D.K., Leotta, G.G., Sindoni, E., Wharton, C , I (1982) 69.
33

/19/ GOULDING, F.S., LANDIS, D.A., IEEE Transactions on Nucl. Sci., NS - 29 3 (1982) 1125.
/20/ LANDIS, D.A., CORK, C.P., MADDEN, N.W., GOULDING, F.S., IEEE Transactions on Nucl. Sci., NS - 29 1 (1982) 1.
/21 / GOULDING, F.S., LANDIS, DA., MADDEN, N.W., Lawrence Berkeley Laboratory, Berkeley, CA, LBL-14464 (1982).
/22/ GOULDING, F.S., Nucl. Instrum. Methods 100 (1972) 493.
/23/ HIEBERT, R.D., THIESSEN, H.A., Obst, A.W., Nucl. Instrum. Methods 142 (1977) 467.
/24/ KERNS, C.R., IEEE Transactions on Nucl. Sci. NS - 24 1 (1977) 363.
/25/ LANDIS, D., MADDEN, N., GOULDING, F., Department of Instrument Science and Engineering, Lawrence Berkeley Laboratory, Berkeley CA (manuscript in progress).
/26/ SILVER, E.H. and CLAUSER, J.R., UCRL-95027, submitted to Nucl. Fusion, July 28, 1986.
/27/ GOODMAN, R.K., GRUBB, D.P., MONTGOMERY, D.S., Bull. Am. Phys. Soc, (1984) 1391.
/28/ JAMES, R.A., ELLIS, R.F., LASNIER, C.J., CASPER, T.A., CELATA, CM., Rev. Sci. Instium. 56 5 (1985) 934.
/29/ YAMAGUCHI, N., AOKI, S., KIWAMOTO, Y., OSHIBA, M., SAITO, T., and . MIYOSHI, S., Japanese Journal of Applied Physics 24, 1065 (1985).
/30/ VON GOELER, S., Diagnostics for Fusion Experiments, Eds. Sindoni, E., and Wharton, C , 1979, Pergamon Press, Oxford and New York.
/31/ PETRASSO, R., GERASSIMENKO, M„ SEGUIN, F.H., TING, J., KROGSTAD, R., GAUTHIER, P., HAMILTON, W., RAMSEY, AT., BURSTE1N, P., and GRANETZ, R., Rev. Sci. Instrumen. 5J. 585 (1980).
/32/ GRANETZ, R. and CAMANCHO, J., Nucl. Fusion 25, 727 (1985).
/33/ DANDL, R.A., EASON, H.O., EDMONDS, P.H., and ENGLAND, A.C., Nucl. Fusion U , 411 (1971).
/34/ FAILOR, B.H., Ph.D. Thesis, University of California at Davis, UCRL-S3717 (University Microfilms, Ann Arbor, MI, 1986) pp. 53-83.
/35/ KALATA, K., SPIE 331, Instrumentation in Astronomy IV (1982).
/36/ FAILOR, B.H., SILVER, E.H., and CLAUSER, J.F., manscript in progress.
/37/ YU, T.L., ALLEN, S.L., MOOS, H.W., J. Vac. Sci. Technol. 43 3 (1985) 1077.
/38/ STEVENS, J., VON GOELER, S., BERNABEI, S., BITTER, M., CHU, T.K., et a!., Nucl. Fusion 25 (1985) 1529.
/39/ VON GOELER, S., STODIEK, W., EUBANK, H., FISHMAN, N., GREGEN-SHCHIKOV, S., HINNOV, E., Nuc). Fusion 16 (1975) 304.
/40/ GLUCKSTERN, R.L., HULL, JR., M.H., Phys. Rev. 90 6 (1953) 1030.
34

/ 4 1 / ELWERT, V.G., Ann. Phys. 5 34 (1939) 12.
/ « / LEE, CM., K1SSE;, L., PRATT, R.H., Phys. Rev. A. 13 5 (1976) 1714.
/43/ HAUG, E., Z. Naturforsch. 30a (1975) 1099.
/44/ ENGLAND, A.C., HASTE, G.R., Phys. Rev. A 7 2 (1973) 383
/45/ DANDL, R.A., ENGLAND, A.C., ARD., W.B., EASON, H.O., BECKER, M.C., HAAS, G.M., Nucl. Fusion 4 (1964) 344.
/46/ BERNHARDI, K., WIESEMANN, K., Plasma Physics 24 8 (1982) 867.
/47/ VON GOELER, S., STEVENS, J., STOD1EK, W., BERNABEI, S., BITTER, M., et al., in Diagno9tics For Fusion Reactor Conditions, Eds. Stott, P.E., Akulina, D.K., Leotta, G.G., Sindoni, E., Wharton, C. 1 (1982) 87.
/48/ VON GOELER, S., STEVENS, J., KARNEY, C , BERNABEI, S., BITTER, M., et al., in Proc. of Fifth APS Topical Conference on Radio Frequency Plasma Heating, Madison, WI, (1983) 96.
/49/ TEXTER, S., KNOWLTON, S., PORKOLAB, M., TAKASE, Y., Plasma Fusion Center, M.I.T., Cambridge, MA., PFC/JA-B6-11 (1986) submitted to Nucl. Fusion.
/50/ HUTCHINSON, I.H., in Proc. of 6tn Topical Conference on High Temperature Plasma Diagnostics (1986) to be published in Rev. Sci. Instrum.
/ 5 1 / DERMER, C. and RAMATY, R., Astrophys. J. 301, (1986) 962.
/52/ BATCHELOR, D.B., GOLDFINGER, R.C., WEITZNER, H., Oak Ridge National Laboratory, Oak Ridge, TN, ORNL/TM-9075 (1984).
/53/ JAMES, R.A., LASN1ER, C.J., and ELLIS, R.F., UCRL-93882, Proc. of 6th Topical Conf. on High Temp. Plasma Diag., Am. Phys. Soc, Hilton Head Island, SC, March 9-13, 1986.
/54/ LASNIER, C.J., JAMES, R. A., and ELLIS, R. F., UCRL-93883, Proc. of 6th Topical Conf. on High Temp. Plasma Diag., Am Phys. Soc, Hilton Head island, SC, March 9-13, 1986.
/55/ BEKEFI, G., Radiation Processes in Plasmas (Wiley, New York, 1966).
/56/ TRUBNIKOV, B.A., Ph.D. Thesis, Moscow Inst, of Engineering and Physics, U.S.S.R. (1958); U.S.A.E.C. Tech. Info. Service, AEC-TR-4073 (1960).
/57/ MOLVIK, A.W., Rev. Sci. Instrum. 52, 704 (1981).
/58/ FOOTE, J.H., COUTTS, G.W., PEDROTTI, LP., SCHLANDER, L., and WOOD, B.E., Rev. Sci. Instrum. 56 (5), May 1985, p. 1117.
/59/ MEDLEY, S., Princeton Plasma Physics Laboratory Report No. PPPL-1770, 1981.
/60/ FOOTE, J.H., WOOD, BE., BROWN, M.D., and CURNOW, G.M., Proc. of 6th Topical Conf. on High Temperature Plasma Diagnostics, Am. Phys. Soc, Hilton Head Island, SC (1986) UCRL-93789.
/ 6 1 / HORNADY, R.S., in Summary of TMX-U Results (1984) Vol. 2, Lawrence Livermore National Laboratory, Livermore, CA, UCID-20274 (1984) Ed. by T. C. Simonen.
35

/62/ HO.iNADY, R.S., STEELE, D., and NELSON, D.H., Bull. Am. Phys. Soc. 30, U34.
/63/ JOBES, F.O. and HICKOK, R.L., Nucl. Fusion IS (1970) p. !»°
/64/ VOSS, D.E. and COHEN, S.A., Rev. of Sci. Instr. S3, 11 (1982) p. 1696.


![[I. H. Hutchinson] Principles of Plasma Diagnostic(BookFi.org)](https://img.dokumen.tips/doc/110x75/55cf9b0f550346d033a4928c/i-h-hutchinson-principles-of-plasma-diagnosticbookfiorg.jpg)