Embed Size (px)
Citation preview
Alexander Fridman,
Drexel University
Hydrogen Production from Hydrocarbons, H2O and H2S, Stimulated by Non-Thermal Atmospheric Pressure Plasma
• Plasma-Chemical Hydrogen Production from Water• Plasma-Chemical Hydrogen Production from H2S• Plasma-Assisted Partial Oxidation of Methane• Hydrogen Production in Tornado/Gliding Arc • Experiments vs Modeling
PLASMA-ASSISTED COMBUSTION SYNTHESIS
OF HYDROGEN
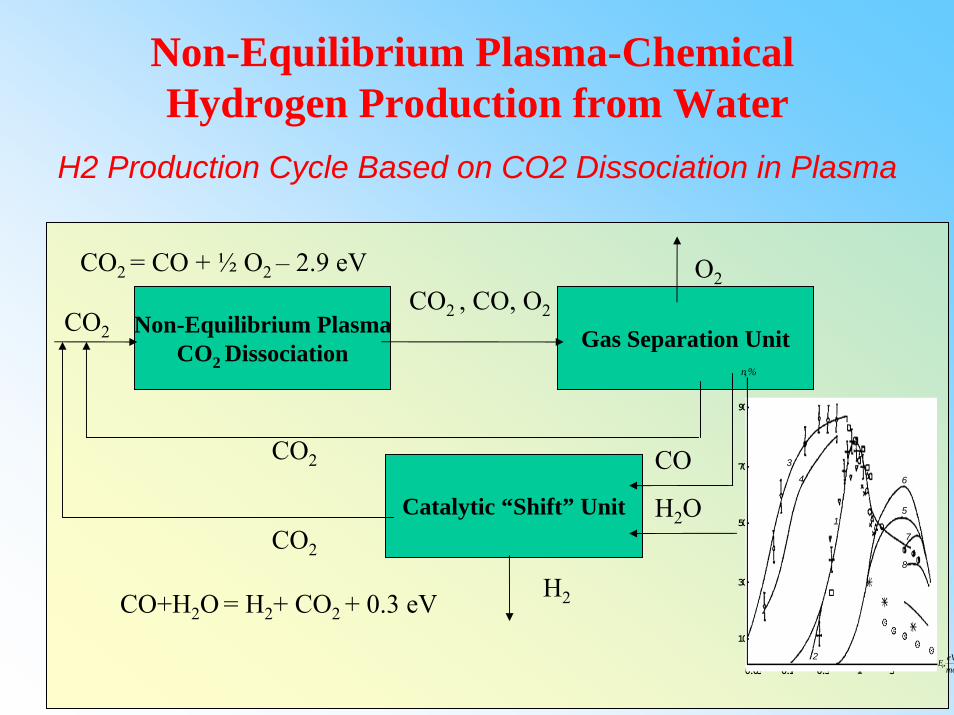
CO2 = CO + ½ O2 – 2.9 eV
CO+H2O = H2+ CO2 + 0.3 eV
Non-Equilibrium PlasmaCO2 Dissociation Gas Separation Unit
Catalytic “Shift” Unit
CO2 , CO, O2
O2
CO
CO2
CO2
CO2
H2O
H2
H2 Production Cycle Based on CO2 Dissociation in Plasma
0.03 0.1 0.3 1 3
10
30
50
70
90
moeVEv,
n, %
6
5
7
8
3
4
1
2
Non-Equilibrium Plasma-Chemical Hydrogen Production from Water

H2S Dissociation
in Gliding Arc Tornado
H2S
Sulfur
Heat
Sulfur
H2
1
2
3
4
5
7
6
H2
H2H2S
1
Process Characteristics:•Gas Temperature 200-400C•Electron Temperature 15,000K•H2S Conversion Degree: 95% •Products: Hydrogen, Sulfur•Energy Cost: 0.8 kWh/m3 H2

Plasma Catalytic H2 Production from Natural GasPlasma PO optimal parameters:
CH4+0.5O2 = CO + 2 H2optimal equivalence ratio = 3.3,
[O2]/ [CH4]=0.6
Preheating temperature = Internal, 750KConversion = 92%Electric energy cost :
experimental = 0.06 kWh/m3
modeling EQ = 0.11 kWh/m3
modeling NE = 0.07 kWh/m3
Output Syn-Gas energy = 3.00 kWh/m3
power for 100,000 barrel/day of Liquid Fuel:experimental = 4.5 MWmodeling EQ = 8.2 MWmodeling NE= 5.2 MW
Oscilloscope & data acquisition
Temperature controller
GLIDING ARC REACTOR
Quartzheater
mixing chamber
Flowcontrollers
gas chromatography
gas sampling
resistor box
powersupply
PLASMA-ASSISTED COMBUSTION SYNTHESIS OF HYDROGEN

Plasma Catalysis Vs. Thermo-Catalytic Partial Oxidation
Thermo-Catalytic Conversion:•High Temperature Requirements (>1100K)•Large Specific Size of Reactor•Special Materials Requirements and Reactor Design•Sulfur from Natural Gas Causes Catalyst Poisoning •Low Conversion at Moderate Equivalence Ratios (3.0-3.5)
Catalysis TemperatureCH4 + 1/2 (O2 + 3.76 N2) CO + 2 H2 + 1.88 N2 + 36 kJ/mol
Plasma-Catalysis:•Low Temperature Operation (~750K)•Large Specific Productivity•Lower Temperature Requirements•No Sensitivity to sulfur or other impurities•Possibility to Operate at High Equivalence (3.5-4.5)
PLASMA-ASSISTED COMBUSTION SYNTHESIS OF HYDROGEN

Gliding Arc as Transitional Non-Equilibrium Plasma:
THERMAL PLASMA
NON-THERMAL PLASMA
MAJOR CHALLENGES :
• Power Density & Productivity.
• Selectivity.•Very High Plasma power and density.
•High Gas temperature.
•No selective chemical process can be achieved.
•Low gas temperature and very high electron temperature.
•Low Power Density
•Chemical Selectivity can be achieved.“Gliding Arc in Tornado”

“““GLIDING ARC in Flat Geometry”GLIDING ARC in Flat Geometry”GLIDING ARC in Flat Geometry”
Initial Breakdown
Extinction
Elongation
Fast Equilibrium to Non-Equilibrium Transition

“““THE GLIDING ARC IN TORNADO”THE GLIDING ARC IN TORNADO”THE GLIDING ARC IN TORNADO”
Schematic Diagram for GAT reactor.
•Gliding Arc in Tornado works in a Reverse Vortex Flow setup.
•A circular and spiral electrode is placed in the plane of the flow act as diverging High Voltage DC Electrodes.
•The flow conditions and the characteristics of the power supply determine the shape of the spiral electrode.
Gliding Arc in Tornado Flow
Anode
High Voltage
DC
Discharge Zone
Spiral Electrode
Tangential Gas inlet
Cylindrical Volume
Ground
Axial Inlet
Ring Electrode

Gliding Arc “Tornado”

“It Can Melt a Metal Rod But You Can Touch It”
Gliding Arc “Tornado”

THE EXPERIMENTAL SETUP
FIRED AT EQUIVALENCE
RATIO 4.
Plasma Catalytic Methane Partial Oxidation
Syn-gas Burner
Plasma-Catalytic Reactor

0.3
0.4
0.5
0.6
0.7
0.8
0.9
1
2.8 3.2 3.6 4 4.4 4.8Equivalence Ratio
Con
vers
ion
Deg
ree
Simulation Vs Experiments The conversion degree: α = ([H2] + [CO]) / 3[CH4]
Modeling results With plasma
Experimental results with plasma
Modeling results without plasmaExperimental results without plasma
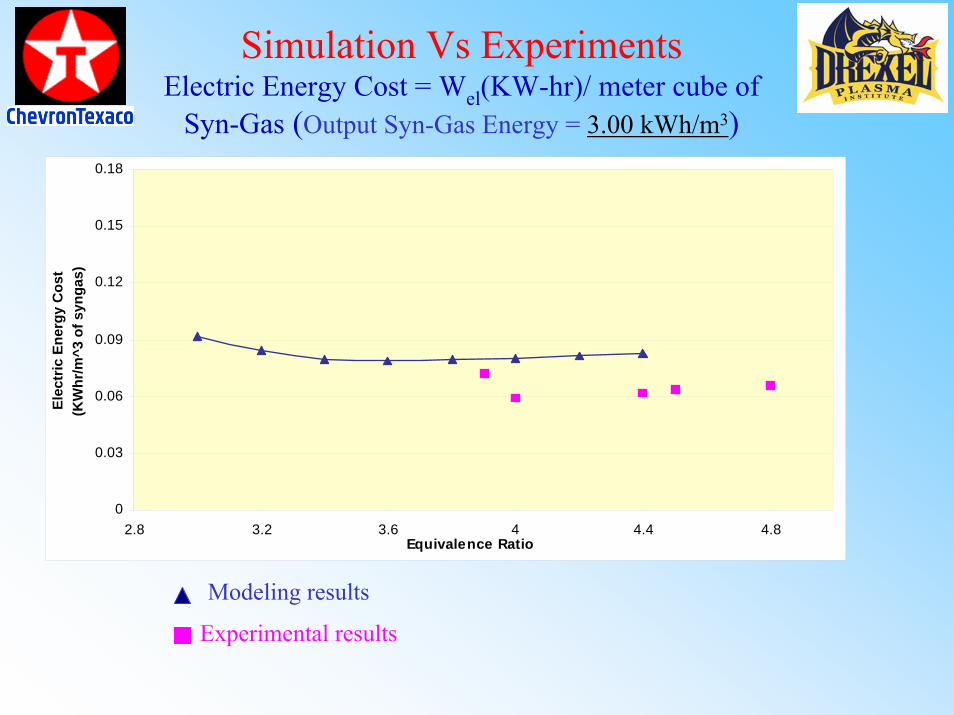
0
0.03
0.06
0.09
0.12
0.15
0.18
2.8 3.2 3.6 4 4.4 4.8Equivalence Ratio
Elec
tric
Ene
rgy
Cos
t
(KW
hr/m
^3 o
f syn
gas)
Modeling results
Experimental results
Simulation Vs Experiments Electric Energy Cost = Wel(KW-hr)/ meter cube of
Syn-Gas (Output Syn-Gas Energy = 3.00 kWh/m3)

Simulation Vs Experiments Methane Energy Cost = [CH4] (KW-hr) per
meter-cube of Syn-Gas
Modeling results with Plasma
Experimental results with plasma
3
4
5
6
7
8
9
10
2.8 3.2 3.6 4 4.4 4.8Equivalence Ratio
Met
hane
Ene
rgy
cost
K
W-h
r/m^3
of w
yn g
as
Modeling results without plasmaExperimental results without plasma

3
4
5
6
7
8
9
10
2.8 3.2 3.6 4 4.4 4.8Equivalence Ratio
Ener
gy C
ost
(K
Whr
/m^3
of s
ynga
s)
Simulation Vs Experiments Total Energy Cost = (Electric Energy Cost +
Methane Energy Cost) per meter Cube of Syn-Gas
Modeling results With plasma
Experimental results with plasma
Modeling results without plasmaExperimental results without plasma

0
0.2
0.4
0.6
0.8
1
2.8 3.2 3.6 4 4.4 4.8Equivalence Ratio
Effic
ienc
y
Theoretical maximum ef f ic iency can be 0.84.
Modeling results With plasma
Experimental results with plasma
Modeling results without plasmaExperimental results without plasma
Simulation Vs ExperimentsEfficiency = KW-hr of Syn-Gas Produced / Total
Energy Input in KW-hr

•Only 2.0% of Total Energy Consumption Required for Plasma Power
•Electric Energy Cost 0.06 kWh/m3 of syn-gas (energy from syn-gas = 3.0 KW-hr/m3).
•92% conversion at Equivalence ratio of 3.3.
•Internal Heat Recuperation (Preheating) at 750 K.
•No soot Deposition.
•Large Specific Production rates due to low residence times.
•Effective for Higher Hydrocarbon conversion to Syn-Gas.
•Not Sensitive to Sulfur and Other Impurities.
Highlights of Plasma-Catalytic Partial Oxidation:


![Plasma TelwinEnterprise Plasma 160 HF[1]](https://img.dokumen.tips/doc/110x75/55cf9702550346d0338f3edd/plasma-telwinenterprise-plasma-160-hf1.jpg)