Embed Size (px)
Citation preview

Molecular Ecology Resources (2009) 9 (Suppl. 1), 151–163 doi: 10.1111/j.1755-0998.2009.02640.x
© 2009 Blackwell Publishing Ltd
Blackwell Publishing LtdBARCODING PLANTS
Plant DNA barcodes and species resolution in sedges (Carex, Cyperaceae)
JULIAN R. STARR,*† ROBERT F. C . NACZI‡ and BRIANNA N. CHOUINARD*†*Canadian Museum of Nature, PO Box 3443, Station D, Ottawa, ON, Canada K1P 6P4, †Department of Biology, Gendron Hall, Room 160, 30 Marie Curie, University of Ottawa, Ottawa, ON, Canada K1N 6N5, ‡The New York Botanical Garden, 2900 Southern Blvd., Bronx, NY 10458-5126, USA
Abstract
We investigate the species discriminatory power of a subset of the proposed plant barcodingloci (matK, rbcL, rpoC1, rpoB, trnH-psbA) in Carex, a cosmopolitan genus that represents oneof the three largest plant genera on earth (c. 2000 species). To assess the ability of barcodingloci to resolve Carex species, we focused our sampling on three of the taxonomically best-known groups in the genus, sections Deweyanae (6/8 species sampled), Griseae (18/21 speciessampled), and Phyllostachyae (10/10 species sampled). Each group represents one of threemajor phylogenetic lineages previously identified in Carex and its tribe Cariceae, thus permittingus to evaluate the potential of DNA barcodes to broadly identify species across the tribe andto differentiate closely related sister species. Unlike some previous studies that have suggestedthat plant barcoding could achieve species identification rates around 90%, our results sug-gest that no single locus or multilocus barcode examined will resolve much greater than 60%of Carex species. In fact, no multilocus combination can significantly increase the resolutionand statistical support (i.e., ³ 70% bootstrap) for species than matK alone, even combinationsinvolving the second most variable region, trnH-psbA. Results suggest that a matK barcodecould help with species discovery as 47% of Carex taxa recently named or resolved withincryptic complexes in the past 25 years also formed unique species clusters in UPGMA trees.Comparisons between the nrDNA internal transcribed spacer region (ITS) and matK insect. Phyllostachyae suggest that matK not only discriminates more species (50–60% vs.25%), but it provides more resolved phylogenies than ITS. Given the low levels of speciesresolution in rpoC1 and rpoB (0–13%), and difficulties with polymerase chain reaction amplifica-tion and DNA sequencing in rbcL and trnH-psbA (alignment included), we strongly advocate thatmatK should be part of a universal plant barcoding system. Although identification rates inthis study are low, they can be significantly improved by a regional approach to barcoding.
Keywords: Carex, Cariceae, DNA barcoding, phylogeny, plants, regional barcoding, species discovery
Received 17 November 2008; revision received 17 January 2009; accepted 30 January 2009
Introduction
Carex L. (Cariceae Pax; Cyperaceae Juss.) is an enormousgenus (c. 2000 species) equalled in species diversity only byEuphorbia L. and Piper L. (Frodin 2004). It is also of globalimportance as one of the few truly cosmopolitan plant genera(Good 1974) with centres of diversity in the temperateregions of Asia, Europe and the Americas. Throughout itsrange, Carex is found in a multitude of habitats ranging from
deserts to rain forests, and in some regions, such the Arctic,it is one of the dominant components in terms of speciesdiversity and biomass (Scott 1995; Aiken et al. 2007). More-over, its species often demonstrate a high degree of habitatspecificity, making them some of the best indicator plantsfor characterizing habitat types (e.g. Magee & Rorer 1981;Klinka et al. 1989; Anderson et al. 1996; Ringius et al. 1997;Vellend et al. 2000; Karlsen & Elvebakk 2003; Gignac et al.2004; Dabros & Waterway 2008). Although Carex lacks cropspecies, it is of indirect economic importance for its weeds.Approximately 18% of the estimated 449 Cyperaceae speciesexplicitly cited as weedy (Bryson & Carter 2008) are found
Correspondence: Julian R. Starr, Fax: 613-364-4027; E-mail:[email protected]

152 B A R C O D I N G P L A N T S
© 2009 Blackwell Publishing Ltd
within Carex, some of which have spread at an astonishingrate (Reznicek & Catling 1987).
Clearly, the biological diversity, ecological significanceand economic impact of Carex is global in nature, and yet itsspecies are often ignored by scientists and the general publicalike. This is largely due to the genus’ complex taxonomy andreduced morphology, which can make species identificationdifficult, particularly in temperate areas where local Carexfloras can approach or exceed 100 taxa (e.g. City of Ottawa,Ontario, Canada, Brunton 2005; Tompkins Co., New York,USA, Weldy & Werier 2008). In Carex species, reliable mor-phological identification is complicated by the fact thatclosely related taxa often differ by only a single qualitativecharacter or by the accumulation of many small quantitativedifferences (Naczi 1992; Standley et al. 2002). In addition,identification typically requires reproductively maturematerial that may be available for only a short period of the year(e.g. Naczi & Bryson 2002) as well as a good understandingof the genus’ morphology and terminology in order tonavigate through lengthy taxonomic keys (e.g. the key toCanadian Carex is 39 pages in Scoggan 1978). This difficultywith identification has many unfortunate consequences:some studies purposely ignore sedge diversity (e.g. Dornbush2004); invasive species go unnoticed or are mistaken asnatives (e.g. Catling & Kostiuk 2003; Janeway 2005); florasare often incomplete or erroneous (e.g. Zika & Kuykendall2001); and taxonomic confusion related to misidentifica-tion is common (e.g. Wheeler 2007; Molina et al. 2008).Unfortunately, this problem is only getting worse as numer-ous, often cryptic species continue to be discovered. Overthe past 20 years in North America alone, more than twonew Carex species per year have been discovered on averagewith the majority of them in one of the best studied florasin the world, eastern North America (Hartman & Nelson1998; Ertter 2000; Ford et al. 2008). Any methodology thatcan facilitate the correct identification of Carex species andaid in new discoveries, particularly as threats from habitatloss, invasive species and climate change increase globally,would constitute a significant contribution to science andsociety. Owing to its great diversity, difficult morphologyand high potential for still undiscovered species, Carex is aprime candidate to develop DNA barcodes.
The promise of DNA barcoding is that it will provide aquick, simple and economic tool for identifying and discov-ering biological diversity. Ideally, a DNA barcode wouldrequire only small amounts of possibly poor quality tissue tobe easily amplified and sequenced using universal primers.In addition, its sequences would provide a high level ofconfidence that the name provided by the barcode data-base could be treated as an actual ‘species identification’,and if sufficiently different from any other member in thedatabase, it would indicate that a new species had beendiscovered (Savolainen et al. 2005; Kress & Erickson2008).
In this study, we evaluate a subset (matK, rbcL, rpoC1, rpoB,trnH-psbA) of the seven proposed plant barcodes (Pennisi2007) for their technical practicality (i.e. ease of amplifica-tion and sequencing) and potential to identify and discoverCarex and Cariceae species. We focused our efforts on threeof the taxonomically best-known groups in the genus andtribe, Carex sections Deweyanae (Tuckerm. ex Mack.) Mack.,Griseae (L. H. Bailey) Kük., and Phyllostachyae Tuckerm.ex Kük. Species in these sections are clearly circumscribedby multiple lines of morphological (e.g. Saarela & Ford2001; Crins et al. 2002; Naczi & Bryson 2002; Naczi 2002),anatomical (Starr & Ford 2001), cytological (Naczi 1999), andmolecular evidence in the case of sect. Phyllostachyae (Fordet al. 1998a, 1998b, 1998c; Starr et al. 1999; Ford & Naczi 2001).Each section also represents one of three major lineagesidentified in tribal phylogenies (Yen & Olmstead 2000;Roalson et al. 2001; Starr et al. 2004, 2008; Waterway & Starr2007; Starr & Ford 2009), permitting us to evaluate thepotential of barcodes to broadly identify species across tribeCariceae and to differentiate sister species, the most difficultchallenge for any barcoding system. In addition, thesegroups contain species discovered (e.g. Naczi 1993; Ford &Naczi 2001; Saarela & Ford 2001; Naczi et al. 2002) and/orspecies complexes resolved (e.g. Naczi et al. 1998; Ford et al.1998a) within the last 25 years, which allowed us to evaluatehow successful barcodes might be for discovering newspecies and for helping to resolve difficult taxonomicproblems within the tribe. Since the barcoding regionsexamined have not previously been used in Carex orCariceae phylogenetics, we also assessed their potential forclarifying relationships within these groups.
Methods and materials
Taxonomic sampling
To determine which of a subset of the proposed barcoding lociare necessary to resolve Carex species, we sampled one to fourindividuals per taxon for sections Deweyanae (six taxa analysedfrom a total of nine in the section), Griseae (18 taxa analysedfrom a total of 21 in the section), and Phyllostachyae (10 taxaanalysed from a total of 10 in the section) (Appendix S1, Sup-porting information). Most taxa (31 of 34) were representedby multiple individuals and the majority of these (20 of 31)consisted of three or more samples. Although morpholog-ical and molecular evidence suggest that Carex laeviculmis isnot a part of sect. Deweyanae, it was treated as such for thepurposes of this study (see Naczi 2002; Ford et al. 2006;Naczi 2009).
DNA isolation and amplification
All regions were polymerase chain reaction (PCR) amplifiedfrom total genomic DNA isolated from herbarium specimens

B A R C O D I N G P L A N T S 153
© 2009 Blackwell Publishing Ltd
using a modified silica-column-based method (Alexanderet al. 2007) where the guanidine hydrochloride in the bindingbuffer was increased from 2 m to 7 m and the end percentageof ETOH was 16.7%. Primer sequences for the codingregions matK (matK-2.1f, matK-5 r), rpoB (rpoB-2f, rpoB-4 r),and rpoC1 (rpoC1–1f, rpoC1–4 r) were obtained from thephase 2 protocols available on the Royal Botanic Gardens’(Kew) barcoding website (www.kew.org/barcoding/protocols.html). A portion of the chloroplast gene rbcL wasinitially amplified using primers Z1 (Arnold et al. 1991) andZ-1240R (Herre et al. 1996). After problems with sequencingwere encountered with these primers, the rbcL primer setused by Kress & Erickson (2007) (rbcL-a_f, Tsukaya et al. 1997;rbcL-a_r) was also tried. The noncoding trnH-psbA regionwas amplified as in Kress et al. (2005) using primers psbA3′f(Sang et al. 1997) and trnHf (Tate & Simpson 2003). Primerswere not re-designed when problems with PCR or sequen-cing were encountered since the purpose of this study wasto evaluate both the ability of a barcode to resolve speciesas well as how easily it can be amplified and sequenced.Each PCR amplification contained the following reactantsdissolved in an end volume of 15 μL: 1× PCR buffer (Sigma,P2317), 0.2 mm of each dNTP, 0.25 μm of each primer, 2.5 mmMgCl2, 1.33 mg BSA, 10–50 ng of template DNA, and 2.5 Uof JumpStart Taq DNA Polymerase (Sigma, D4184). PCRproducts were amplified on a Bio-Rad DNA engine (PTC-200) gradient cycler via 30 cycles of DNA denaturation at95 °C for 45 s, primer annealing at 45 °C for 45 s, and DNAstrand extension at 72 °C for 90 s, with a pre-treatment at95 °C for 60 s before cycling. The PCR was terminated by afinal extension step of 72 °C for 3 min. Minor adjustmentsto the above PCR protocols were sometimes necessary de-pending on DNA quality and the primer pair used for ampli-fication. A sample of each reaction was run on 2.0% agarosegels stained with ethidium bromide and successful productswere sent to the Canadian Centre for DNA Barcoding atthe University of Guelph where they were sequenced inboth directions using PCR primers according to theCentre’s protocols (www.dnabarcoding.ca/pa/ge/research/protocols/sequencing).
Analysis
Bidirectional sequences for each locus were assembled andedited in Sequencher 4.7 (Genecodes). Manual alignment wasused for coding loci due to a lack of size differences amongtaxa; however, alignment for the noncoding trnH-psbA regionrequired the use of Clustal_X (default settings; Thompsonet al. 1997). To assess the ability of each locus and multilocuscombination to resolve species, upgma (unweighted pairgroup method with arithmetic mean) dendrograms basedon Kimura 2-parameter distances (K2P, recommended byCBOL, www.barcoding.si.edu) were constructed in paup*4.10b (default settings; Swofford 2003). Only upgma
analyses were performed as they have consistently resolvedthe greatest number of species in studies that have usedmultiple tree building methods (e.g. Lahaye et al. 2008a, b).A positive identification by a barcoding locus or combinationof loci was counted only when all individuals sampled fora species (i.e. ≥ 2; includes subspecific taxa) formed a singlecluster in trees. Following Fazekas et al. (2008), the numberof species resolved with a bootstrap (BS) value of ≥ 70%(heuristic searches, 10 000 random additions with theMULTREES option off; DeBry & Olmstead 2000) was countedand reported as a percentage of the total number of speciesresolvable to assess support for successful resolution of aspecies cluster. As numerous difficulties with the amplifi-cation and sequencing of the trnH-psbA region were encoun-tered for taxa within sections Deweyanae and Phyllostachyae,the utility of this region for barcoding purposes was onlyassessed within sect. Griseae. The barcoding potential of therbcL gene was not evaluated as both primer sets assayed didnot provide a sufficient number of readable sequences.
The potential for barcoding loci to help discover new specieswas assessed by counting the number of species resolvedby the best barcoding locus or multilocus combination fornew taxa named in the past 25 years. This represents ninetaxa in sect. Griseae (Carex acidicola, C. brysonii, C. calcifugens,C. godfreyi, C. ouachitana, C. paeninsulae, C. pigra, C. planispicata,C. thornei; Kral et al. 1987; Naczi 1993, 1997, 1999; Naczi et al.2002), three in sect. Phyllostachyae (C. cordillerana, C. juniper-orum, C. timida; Catling et al. 1993; Ford & Naczi 2001; Saarela& Ford 2001), and two in sect. Deweyanae (C. bromoides ssp.montana, C. infirminervia; Naczi 1990; Naczi et al. 2002). Notethat all of these taxa, except C. brysonii and C. bromoides ssp.montana, were represented by two or more individuals. Inaddition, the ability of the best barcoding locus or multilocuscombination for helping to resolve former taxonomic prob-lems was assessed by the level of resolution achieved in theCarex willdenowii complex (sect. Phyllostachyae), a crypticgroup of three species (C. basiantha, C. superata, C. willdenowii)that are separable on the basis of morphological, anatomical,micromorphological and molecular data (Ford et al. 1998a;Naczi et al. 1998; Starr et al. 1999; Starr & Ford 2001).
The utility of coding regions for phylogenetic purposeswas also explored in paup* by comparing basic characterstatistics among loci and the range of sequence divergenceacross taxa (K2P). The same was not carried out for the non-coding trnH-psbA region as it could not be widely ampli-fied, sequenced, or aligned for the sections examined. Theutility of matK for reconstructing lower-level relationshipsin Carex was assessed by comparing levels of clade supportand tree resolution in phylogenies constructed using matKvs. the internal transcribed spacer (ITS) region of nuclearribosomal DNA (nrDNA) in sect. Phyllostachyae (Starr et al.1999). Strict consensus trees were assembled from heuristicparsimony searches using a random addition sequence oftaxa (10 000 repetitions) with the MULTREES option on.
154 B A R C O D I N G P L A N T S
© 2009 Blackwell Publishing Ltd
upgma trees were also constructed to see whether morespecies clusters would be resolved for each data set by thismethod.
Results
PCR amplification and DNA sequencing
Of the 93 individuals included in this study, strong or weakPCR amplification was achievable for all loci, although asmall percentage of individuals (2%) could not be amplifiedfor either the trnH-psbA, rbcL (both primer sets) or matKregions (Table 1). Double banding was observed in amplific-ations for the trnH-psbA (17%) and rbcL (5%) regions (Table 1).Success rates for bidirectional sequences were highest forrpoB (100%) and matK (95%), followed by trnH-psbA (72%)and rpoC1 (52%). Single direction sequence reads wereobtained for 30% of rpoC1 and 9% of trnH-psbA samples.Sequences were unreadable for approximately 9% of trnH-psbA and 2% of matK sequences. All efforts to sequence rbcLin both directions failed, with 82% of sequences being entirelyunreadable. Readable sequence could not be obtained from
the alternative primer set rbcL-a_f and rbcL-a_r. AlthoughrpoC1 could not be reliably sequenced in both directions,clear sequence was obtained for all taxa sampled in at leastone direction. In this case, the reverse primer (rpoC1–4 r)appears to double prime during sequencing.
Alignment and barcoding
Sequences for coding regions could be aligned easily by eyeas no insertion/deletion (indel) events were detected. How-ever, the trnH-psbA intergenic spacer showed considerablesize variation across the taxa examined (600 to 852 bp).Efforts to align this locus using Clustal_X could not be easilyachieved across all taxa. The rps19 gene previously detectedby Wang et al. (2008) in the Cyperaceae genus Scirpus L. andacross most monocots, is also present in the spacer regionbetween the trnH and psbA genes of Carex. Alignments ofCarex trnH-psbA sequences with the rps19 gene of Scirpusternatanus Reinw. ex Miq. (AB331264) revealed the absenceof five codons in all Carex near the 5′ end of the gene (codons20 to 24) as well as the lack of 27 codons including the stopsignal on the 3’ end of rps19 in species of sect. Griseae only.
The utility of the coding sequences examined for barcod-ing, alone and in multigene combinations, is presented inTable 2. Results indicate that matK resolves a much higherpercentage of species (57%) than either rpoC1 or rpoB (9%each), and it provides more statistical support for taxa ≥ 70%BS (33%) than either of these loci (3% each). Multigene com-binations only marginally resolve a greater percentage oftaxa and provide greater support over matK alone (Table 2),with the exception of rpoB + rpoC1 which provides consid-erably poorer resolution (17%) and support (10%) for the taxaexamined. A upgma dendrogram using matK data is pre-sented in Fig. 1.
In comparisons of the noncoding trnH-psbA region vs. allcoding sequences and locus combinations in sect. Griseae,matK provided greater levels of species resolution (53% vs.44%) and species statistical support (27% vs. 19%) than trnH-psbA alone (Table 3). The genes rpoB and rpoC1 provided
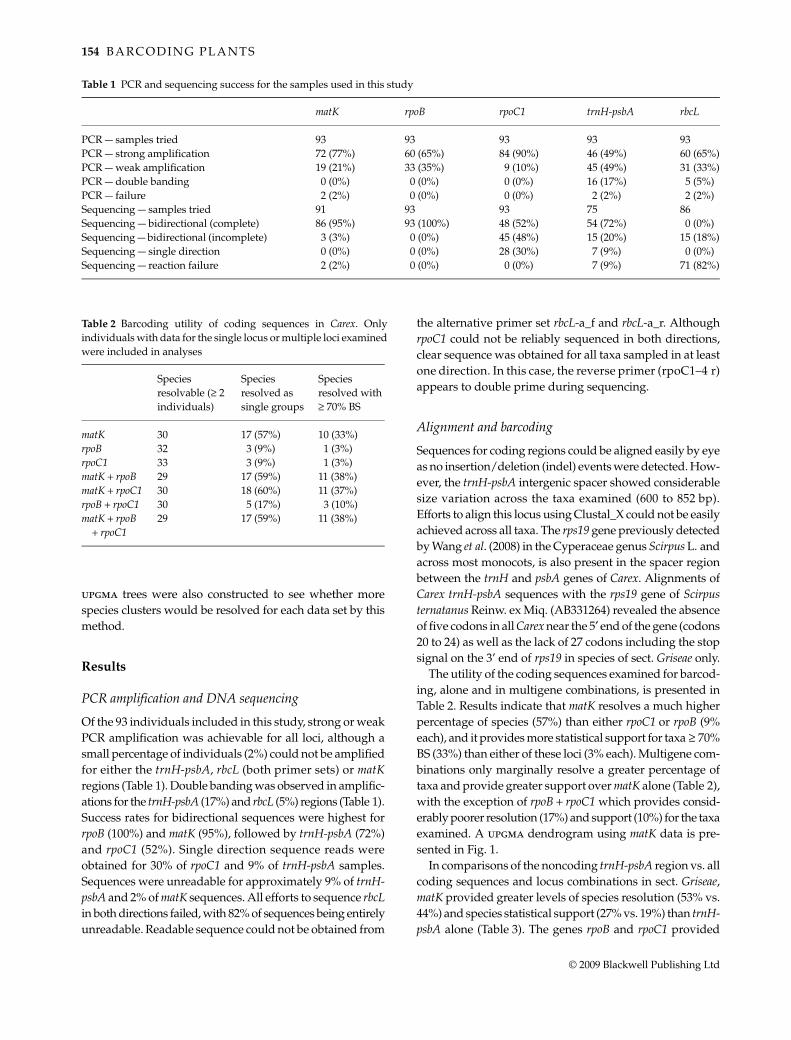
Table 1 PCR and sequencing success for the samples used in this study
matK rpoB rpoC1 trnH-psbA rbcL
PCR — samples tried 93 93 93 93 93PCR — strong amplification 72 (77%) 60 (65%) 84 (90%) 46 (49%) 60 (65%)PCR — weak amplification 19 (21%) 33 (35%) 9 (10%) 45 (49%) 31 (33%)PCR — double banding 0 (0%) 0 (0%) 0 (0%) 16 (17%) 5 (5%)PCR — failure 2 (2%) 0 (0%) 0 (0%) 2 (2%) 2 (2%)Sequencing — samples tried 91 93 93 75 86Sequencing — bidirectional (complete) 86 (95%) 93 (100%) 48 (52%) 54 (72%) 0 (0%)Sequencing — bidirectional (incomplete) 3 (3%) 0 (0%) 45 (48%) 15 (20%) 15 (18%)Sequencing — single direction 0 (0%) 0 (0%) 28 (30%) 7 (9%) 0 (0%)Sequencing — reaction failure 2 (2%) 0 (0%) 0 (0%) 7 (9%) 71 (82%)
Table 2 Barcoding utility of coding sequences in Carex. Onlyindividuals with data for the single locus or multiple loci examinedwere included in analyses
Species resolvable (≥ 2 individuals)
Species resolved as single groups
Species resolved with ≥ 70% BS
matK 30 17 (57%) 10 (33%)rpoB 32 3 (9%) 1 (3%)rpoC1 33 3 (9%) 1 (3%)matK + rpoB 29 17 (59%) 11 (38%)matK + rpoC1 30 18 (60%) 11 (37%)rpoB + rpoC1 30 5 (17%) 3 (10%)matK + rpoB
+ rpoC129 17 (59%) 11 (38%)

B A R C O D I N G P L A N T S 155
© 2009 Blackwell Publishing Ltd
Fig. 1 upgma dendrogram of Carex taxa using 815 bp of the 3′ end of matK. Specific epithets are followed by DNA numbers and standardabbreviations for the state or province in which a sample was collected (see Appendix S1). Branches in grey represent species for which allindividuals sampled (≥ 2) formed a single species cluster. Single species clusters receiving ≥ 70% BS support are distinguished by asterisksabove branches. Arrow heads represent single species clusters (≥ 2) named within the past 25 years, including the three species recentlyresolved within the Carex willdenowii complex in sect. Phyllostachyae. Individuals from taxa named in the last 25 years that did not groupinto single species clusters are indicated by black dots to the right of state and province abbreviations. Since the newly discovered C. brysoniiand C. bromoides ssp. montana were represented by only a single sample each, they are not distinguished by arrow heads or dots in the figure.

156 B A R C O D I N G P L A N T S
© 2009 Blackwell Publishing Ltd
very low resolution (0% vs. 13%) and support (0% vs. 7%)for species groups (Table 3). Only trnH-psbA + matK + rpoC1and trnH-psbA + matK + rpoB + rpoC1 resolved more speciesand provided better statistical support for taxa than matKalone (Table 3), although these increases were small (53%vs. 57% species resolution, 27 % vs. 36% of species with ≥70% BS).
Utility of barcodes for resolving recently named taxa
For recently described taxa (last 25 years), matK resolved two(C. godfreyi, C. ouachitana) of the eight species in sect. Griseaefor which multiple individuals were available (Fig. 1). Theninth species, Carex brysonii, was represented by a single indi-vidual isolated on a long branch (Fig. 1). For sect. Deweyanae,individuals of C. infirminervia were clearly separated fromall other species. Carex bromoides ssp. montana, which wasrepresented by a single sample, clearly separated from thethree individuals sequenced for C. bromoides ssp. bromoides.In sect. Phyllostachyae, only one (C. cordillerana) of the threespecies recently named came out as a single cluster (Fig. 1).All members of the C. willdenowii complex (C. basiantha, C.superata, C. willdenowii) were resolved as unique clusters(Fig. 1). A pectinate clustering pattern was seen amongindividuals of C. juniperorum and C. timida (Fig. 1).
Phylogenetic utility of barcoding regions
MatK has 3.3 and 2.9 times more informative charactersthan rpoB and rpoC1 respectively, and it is approximately3.4 and 2.9 times more variable than rpoB and rpoC1 for thetaxa examined (Table 4). For comparisons between phylo-genies constructed for sect. Phyllostachyae using the ITS and
matK regions, matK resolved more taxa and provided morestatistical support for clades than ITS regardless of the treeconstruction method used (Fig. 2; Table 5).
Discussion
Barcoding loci: PCR and sequencing success
Beyond simple sequence variability, crucial characteristicsfor barcoding loci include primer universality and easy
Table 3 Barcoding utility of the noncoding trnH-psbA region versus coding sequences in Carex section Griseae. Only individuals with datafor the single locus or multiple loci examined were included in analyses
Individuals (n)
Aligned length
Variable characters
Informative characters
Species resolvable (≥ 2 individuals)
Species resolved as unique clusters
Species resolved with ≥ 70% BS
trnH-psbA 49 600 32 21 16 7 (44%) 3 (19%)matK 42 815 32 27 15 8 (53%) 4 (27%)rpoB 42 508 3 2 15 0 (0%) 0 (0%)rpoC1 42 584 10 7 15 2 (13%) 1 (7%)trnH-psbA + matK 41 1415 62 39 14 7 (50%) 4 (29%)trnH-psbA + rpoB 41 1108 33 18 16 5 (31%) 3 (19%)trnH-psbA + rpoC1 41 1184 39 22 14 5 (36%) 3 (21%)matK + rpoB 42 1323 35 29 15 7 (47%) 4 (27%)matK + rpoC1 42 1399 42 34 15 7 (47%) 4 (27%)rpoB + rpoC1 42 1092 13 9 15 2 (13%) 1 (7%)trnH-psbA + matK + rpoB 41 1923 65 41 14 7 (50%) 4 (29%)trnH-psbA + rpoB + rpoC1 41 1692 42 24 14 5 (36%) 3 (21%)trnH-psbA + matK + rpoC1 41 1999 71 45 14 8 (57%) 5 (36%)trnH-psbA + matK + rpoB + rpoC1 41 2507 74 47 14 8 (57%) 5 (36%)
Table 4 Phylogenetic utility of barcoding genes
matK rpoB rpoC1
Individuals (n) 86 91 92Aligned length 815 508 584Sequence divergence 0.0–4.2% 0.0–3.0% 0.0–2.7%Variable characters 82 25 30Informative characters 72 22 25
Table 5 Phylogenetic and barcoding utility of matK versus ITS at lowertaxonomic levels using Carex section Phyllostachyae as an example
matK ITS
Individuals (n) 27 22Aligned length (bp) 815 464Variable characters 23 30Informative characters 17 25Species resolvable (≥ 2 individuals) 10 8Species resolved as single groups
(parsimony — upgma)5–6 (50–60%)
2–2 (25–25%)
Species resolved with ≥ 70% BS support 3 (30%)
1 (13%)

B A R C O D I N G P L A N T S 157
© 2009 Blackwell Publishing Ltd
amplification and sequencing (Chase et al. 2007; Fazekas et al.2008). In this study, all regions amplified except for a smallpercentage of individuals for the trnH-psbA, rbcL and matKregions. Excluding matK, these regions were also the mostdifficult to cleanly amplify and sequence. Although the rbcLregion typically amplified well, it was prone to doublebanding, and only a handful of poorly readable sequenceswere obtained despite the use of two different primer sets.Normally the rbcL region is easy to amplify and sequenceacross a wide range of land plants, but like many otherbarcoding loci assayed (Fazekas et al. 2008), it still requiresthe use of multiple primer sets to achieve complete taxono-mic coverage. If rbcL is chosen as a universal plant barcode,as some authors propose (Newmaster et al. 2006; Kress &Erickson 2007), primers other than those used here will benecessary to obtain data for Carex.
The trnH-psbA region was undoubtedly the most difficultto cleanly amplify and sequence. Highly variable in size anddifficult to align across Carex clades, the trnH-psbA region
produced numerous double bands, was difficult to sequencein both directions and yielded a considerable number ofsequences that were unreadable. Part of the difficulty asso-ciated with its sequencing and alignment can be explainedby the presence of numerous homopolymer regions, a factthat also accounts for most of the spacer size differencesobserved amongst taxa as these and other repeat units variedin number. However, size variation in the trnH-psbA regionwas also due to differences in the length of rps19, a gene orpseudogene that has previously been seen in the Cyperaceaegenus Scirpus as in many other monocots (Wang et al. 2008).Alignments of Scirpus rps19 with trnH-psbA sequences fromall three Carex sections suggest not only the absence of fivecodons in Carex near the 5′ end of the gene, but also the lackof 27 possible codons including the stop codon at the 3′ endof rps19 in section Griseae, but not in sections Deweyanae andPhyllostachyae. Even though this region was among the mostvariable assayed, difficulties with amplification, sequencingand alignment suggest that the trnH-psbA region does not
Fig. 2 Trees resulting from the parsimony analysis of nrDNA ITS (strict consensus) and cpDNA matK sequences in Carex sectionPhyllostachyae. Branches in grey represent monophyletic species. Bootstrap values are given above branches.

158 B A R C O D I N G P L A N T S
© 2009 Blackwell Publishing Ltd
provide a practical barcode for Carex or other land plants(Chase et al. 2007; Sass et al. 2007).
By comparison, the matK region was not only easy toamplify, sequence bidirectionally and align (no indels), butit was also more variable than the trnH-psbA region. Highervariability for the matK region has also been seen in othermonocot genera (see Chase et al. 2007), a fact that likelyaccounts for the difficulties encountered with its amplifica-tion and sequencing (Fazekas et al. 2008). Only rpoB was moreeasily amplified and sequenced for all individuals, but dueto low variability and poor species resolving power, we con-sider it largely impractical for barcoding purposes in Carex.The rpoC1 region amplified well, but it was difficult tosequence due to double priming by the reverse primerrpoC1–4 r. This primer could be redesigned, but the regionas a whole was among the least variable and poorest speciesdiscriminators of all those examined indicating that it is notan effective barcode. Similar results have also been seen inother studies (Sass et al. 2007; Lahaye et al. 2008a; Newmasteret al. 2008; Fazekas et al. 2008) suggesting that rpoC1 maynot be an effective barcode for land plants in general.
Barcoding loci: species resolution
As a single region barcode, matK resolves by far the greatestnumber of species and provides the highest statistical supportfor taxa of any marker (Fig. 1; Tables 2 and 3). In fact, nomultigene combination greatly improves species resolutionor statistical support over the use of matK alone (Tables 2 and3), a result also seen in Lahaye et al. (2008a, b). This is eventrue when the noncoding region trnH-psbA is added to theanalysis as only marginal gains in taxon resolution (53% vs.57%) and support (27% vs. 36%) could be achieved over matKwhen trnH-psbA was part of a possible three (trnH-psbA+ matK + rpoC1) or four locus barcode (trnH-psbA + matK +rpoB + rpoC1). Given the low variability of both rpoB andrpoC1 (a trait common for these loci; Chase et al. 2007; Fazekaset al. 2008; Newmaster et al. 2008), and the numerous diffi-culties with amplification and sequencing in rbcL and trnH-psbA (alignment included), only matK appears to be a viablebarcode for Carex. Even though we were not able to sequencerbcL in this study despite using two different primer sets, itis unlikely that rbcL would significantly increase speciesresolution as it is typically three times less variable thanmatK (Hilu et al. 2003). In other words, it would most likelyprovide the same level of variation as detected in rpoB orrpoC1, but it would require more sequencing effort sincecomparisons are based on complete or nearly complete genesequences (~1300 bp long; Chase et al. 2005; Newmaster et al.2006). No matter which single or multilocus comparisonsare made, it is clear that matK is providing most of the reso-lving power and statistical support observed in this study.
Although the performance of any one barcoding locus istaxon dependent, most studies have shown that matK and
trnH-psbA are the most variable chloroplast markers and theyconsistently provide the best species resolution of proposedloci (e.g. Fazekas et al. 2008; Lahaye et al. 2008a; Newmasteret al. 2008). Fazekas et al. (2008) suggest that species resolu-tion is not so dependent on the locus chosen as on numberof loci used. However, if a reasonable number of loci (two tofour) are used as a universal plant barcode, and the technicaland analytical difficulties posed by noncoding regions suchas trnH-psbA are to be avoided, the exclusion of matK froma multilocus barcode will greatly diminish its species discrim-inatory power in Carex, a genus whose species represent 0.5%to 0.9% of seed plant diversity (Govaerts 2001; Scotland &Wortley 2003). Based on our results, an rpoB + rpoC1 or trnH-psbA + rpoB + rpoC1 barcode would probably not resolvemuch more than 13% to 36% of Carex species, figures that areunlikely to increase with the addition of rbcL. Consequently,as with Lahaye et al. (2008a, b), we advocate that matK bechosen as part of a universal plant barcode from amongstthe seven loci recently proposed (Pennisi 2007) despite thecurrent technical problems associated with its amplificationacross land plants (Sass et al. 2007; Fazekas et al. 2008). A sin-gle universal primer set for matK may not exist, just as thereis no single set of primers for rbcL or the animal barcodecox1; nevertheless, the practicality of a matK barcode will bediminished if it cannot be amplified and sequenced withconsiderably fewer then the ten primer pairs used by Fazekaset al. (2008).
Even if matK is included in a universal barcode, our resultssuggest that only 60% of Carex species would be resolvedby the loci examined, and this would fall to only 38% if thecriterion for successful species resolution used by Fazekaset al. (2008) is applied (i.e. ≥ 70% BS; Fig. 1; Tables 2 and 3).Unfortunately, these are probably high-end estimates, as thesections examined here are relatively small and taxonomicallywell known. For example, the greatest species resolutionwas achieved in sections Deweyanae and Phyllostachyae(60% to 100%), groups consisting of eight and 10 speciesrespectively, with species-level boundaries in sect. Phyl-lostachyae having already been tested by multiple lines ofmorphological and molecular data (evolutionary signifi-cant units sensu Meyer & Paulay 2005). By comparison,sect. Griseae is considerably larger (18 of 21 taxa sampled)and its species have not been tested with genetic tools. Inits case, only 57% of taxa clustered into single groups, evenwhen four regions were combined. Bearing in mind thatour species sampling represents the greatest for any plantgenus thus far and that our sampling represents both broadlineages and numerous close species pairs within sections(the most difficult challenge for barcoding; Hollingsworth2008; Newmaster et al. 2008), we consider it unlikely thatthe assayed barcodes will achieve a species resolution ratesignificantly greater than 60% in Carex and Cariceae givenour current taxonomic understanding of these groups.Although future taxonomic changes may increase this figure,

B A R C O D I N G P L A N T S 159
© 2009 Blackwell Publishing Ltd
we expect initial species resolution rates to be worse dueto several large and taxonomically difficult groups withinthe tribe. For example, the inclusion of members of Carexsection Ovales Kunth in our analyses (85 species; Mastro-giuseppe et al. 2002 FNA), a large sedge clade that is partof a deeper lineage that appears to have undergone rapidspeciation [i.e. Carex subg. Vignea (P. Beauv. ex Lestib. f.)Perterm.; Ford et al. 2006], would have reduced the assign-ment success of the barcodes examined (B.N. Chouinardet al., unpublished data).
Regional barcoding: a solution to poor species resolution?
Several previous studies have suggested that barcoding inplants could attain taxon assignment levels approximating90% or greater (e.g. Kress & Erickson 2007; Lahaye et al.2008a, b; Newmaster et al. 2008), although these studieshave typically included phylogenetically distant taxa whereinfrageneric sampling was limited and/or regional in nature(Lahaye et al. 2008a, b; Newmaster et al. 2008). In contrast,Fazekas et al. (2008) sampled two to seven species for 32genera across land plants and concluded that only 69–71% of taxa could be resolved with statistical confidenceusing a barcoding system based on a moderate numberof plastid markers. However, Fazekas et al. (2008) consideredthese figures as an upper-end estimate of the maximumresolution possible since they considered their samplingof close relatives as sparse. Our results are even less encour-aging (i.e. a maximum of 60% of species resolved, 38%with statistical confidence) and are probably a reflectionof our greater infrageneric and especially infrasectionalsampling (see Fazekas et al. 2008). This sampling strategymeant that more sister species were present in our analysisthan in previous plant barcoding studies.
Figures suggesting that around 60% of Carex species wouldbe resolvable using a barcoding system based on the lociexamined are discouraging, although successful taxon assig-nment rates could be increased if a sample’s regional originwas known. For example, a multilocus approach to identify-ing the Carex and Kobresia Willd. (Cariceae, Cyperaceae)of the Canadian Arctic Archipelago (J. LeClerc-Blain et al.,in press) demonstrates that a two-locus barcode involvingmatK can achieve a 100% success rate. Moreover, prelimi-nary data from the development of a matK database forall North American Carex, north of Mexico (c. 559 taxa),suggests that matK can correctly assign sequences tospecies > 60% to > 90% of the time, depending on whichregion of Canada is analysed (i.e. Eastern, Central, Westernand Northern regions) (B.N. Chouinard et al., unpublisheddata). In the case of the taxa examined here, which are allwoodland groups and whose highest common diversityoccurs in Alabama (19 of the 34 taxa examined), a matK barcod-ing survey of Madison and Winston Counties where theirsyntopy is highest (R.F.C. Naczi, unpublished data),
would achieve successful identification in 88% (seven ofeight) and 86% (six of seven) of cases. Although assign-ment success is often highest where diversity is lowest(e.g. the Arctic; Taberlet et al. 2007; LeClerc-Blain et al., inpress) and vice versa (B.N. Chouinard et al., unpublisheddata), such a system could increase the level of certainty inspecies assignments to a point where it may be deemedpractical in applications involving nonspecialists (i.e.nonsystematists). Even if a regional approach could increasespecies assignment rates to an acceptable level, it wouldstill adversely affect the utility of a barcoding systemto nonspecialists since a specimen whose originswere entirely unknown could not be identified withconfidence. This does not mean that an imperfect bar-code would not be useful to nonspecialists as it couldstill significantly narrow the number of possible taxa,but for applications where a precise identification wasrequired, further taxonomic expertise would remainindispensable.
Discovering plant species and evolution by DNA barcodes
Although correct taxon assignment was poor overall, matKdid show promise as a means to help with the discovery ofbiodiversity. Unlike previous studies that have suggestedthat plant barcodes may have already discovered unreco-gnized diversity (Pennisi 2007; Lahaye et al. 2008a), ourapproach was to examine whether newly named taxa (< 25years) could be resolved using barcodes, including taxa froma recently resolved cryptic group, the Carex willdenowiicomplex. Of the 15 species this represents with two or moreindividuals sampled in our analysis, 47% were resolved inmatK dendrograms. Moreover, if we assume that futuresamples of Carex brysonii will cluster with the single indivi-dual sequenced here, as suggested by its long branch inupgma trees, matK was able to resolve 50% of these taxa. Inthe case of Carex timida and C. juniperorum, failure to resolvethese newly discovered species could possibly be due toparaphyly, hybridization or incomplete lineage sorting.Interestingly, the branching of individuals of C. timida andC. juniperorum in our upgma tree largely reflects the popula-tional relationships detected in the isozyme analyses ofFord & Naczi (2001), a pattern they attributed to paraphylywhich may be common in plants (Rieseberg & Brouillet1994). Admittedly, a new species barcode discovery rate of47% to 50% of potential taxa is not incredibly high and thecase of C. timida and C. juniperorum may be isolated, butthey do suggest that once a complete matK database isavailable for the North American carices, as is currentlyunderway (Chouinard et al. 2008), such a resource couldbe used to help test species hypotheses, serendipitouslydiscover taxa, or even point to evolutionary phenomenathat need further investigation when conducting taxonomicstudies.

160 B A R C O D I N G P L A N T S
© 2009 Blackwell Publishing Ltd
Phylogenetic utility of coding regions — comparisons with ITS
As previous studies have found, matK is by far the mostvariable (0.0–4.2%) coding region investigated providingapproximately three times as many variable and informativecharacters than either rpoB or rpoC1. Although the low levelsof sequence variation in the latter two genes (0.0–3.0%, rpoB;0.0–2.7%, rpoC1) are not as low as has been seen in somegroups (e.g. Myristicaceae; Newmaster et al. 2008), theresolution they provide is poor, suggesting they are not onlypoor barcoding regions for Carex, but that large scale phylo-geny projects would best place their efforts in sequencingother potential chloroplast regions.
Given that the sections we investigated each representone of the three major clades previously detected in tribalphylogenetic analyses (Starr & Ford 2009), it is not surpris-ing that all of the genes investigated grouped sections intoseparate clades. In order to investigate the utility of matK atlower taxonomic levels, we compared parsimony analysesof species in Carex sect. Phyllostachyae with a sectional phylo-geny constructed using ITS sequences from a previousstudy (Starr et al. 1999). This region is the most widely usedmarker for lower-level phylogenies in plants (Alvarez &Wendel 2003; Starr et al. 2003) and it is generally the mostvariable region that can be easily amplified and sequencedfor nearly any living group. Because of its high variabilitylevels and ease of amplification, the ITS region has beenproposed as a barcode for plants (Kress et al. 2005) and it isrecommended as a barcode for fungi (Seifert 2008). How-ever, despite the desirable trait of being highly variable,several characteristics of the region make it a problematicbarcode such as the presence of many paralogues, and insome cases, multiple functional copies (Chase et al. 2007;King & Roalson 2008). Surprisingly, at least for section Phyllo-stachyae, matK is not only a better phylogenetic marker thanITS, it is also a better barcode. MatK may produce fewervariable (40 vs. 55) and informative (17 vs. 25) charactersthan ITS, but it provides better resolution and support forclades as well as resolving two and a half to three times morespecies than ITS, and three times as many with ≥ 70% BSsupport. This result probably reflects the fact that the ITSregion is not simply more variable than matK, its variablesites themselves are possibly evolving at a rate so rapidthat it creates homoplasy even at the infrasectional level.The low consistency indices seen in tribal ITS phylogeniessupport such a conclusion as does the common finding ofincongruence in comparisons of nrDNA and nrDNA vs.cpDNA partitions (Starr & Ford 2009) in Cariceae analysesamong other reasons (King & Roalson 2008). Our results thussuggest that matK could make a significant contribution toresolving phylogeny at multiple taxonomic levels fromgeneric relationships within Cariceae to infrasectionalrelationships within Carex.
Acknowledgements
The authors thank Bruce Ford (University of Manitoba) for hisongoing assistance in research on Carex and Cariceae systematics,and Roger Bull, Jessica LeClerc-Blain, and Jeffery Saarela from theCanadian Museum of Nature for help with this and ongoing bar-coding projects. We would also like to thank Janet Topan (CanadianCentre for DNA Barcoding, University of Guelph) for help withDNA sequencing. We are grateful to the curators of the followingherbaria for the use of their specimens: DOV, WIN. This researchwas supported by a Natural Sciences and Engineering ResearchCouncil of Canada Discovery Grant to JRS.
Conflict of interest statement
The authors have no conflict of interest to declare and note thatthe funders of this research had no role in study design, datacollection and analysis, decision to publish, or preparation ofthe manuscript.
References
Aiken SG, Dallwitz MJ, Consaul LL et al. (2007) Flora of the CanadianArctic Archipelago: Descriptions, Illustrations, Identification, andInformation Retrieval. NRC Research Press, Ottawa [CD-ROM].
Alexander PJ, Rajanikanth G, Bacon CD, Bailey CD (2007) Recoveryof plant DNA using a reciprocating saw and silica-based columns.Molecular Ecology Notes, 7, 5–9.
Alvarez I, Wendel JF (2003) Ribosomal ITS sequences and plantphylogenetic inference. Molecular Phylogenetics and Evolution, 29,417–434.
Anderson DS, Davis RB, Rooney SC, Campbell CS (1996) The ecologyof sedges (Cyperaceae) in Maine peatlands. Bulletin of the TorreyBotanical Club, 123, 100–110.
Arnold ML, Buckner CM, Robinson JJ (1991) Pollen-mediatedintrogression and hybrid speciation in Louisiana irises. Proceedingsof the National Academy of Sciences, USA, 88, 1398–1402.
Brunton DF (2005) Vascular Plants of the City of Ottawa, with Identi-fication of Significant Species, Appendix A of Muncaster EnvironmentalPlanning and Brunton Consulting Services. 2005. Urban NaturalAreas Environmental Evaluation Study, Final Report. Planningand Growth Management Department, City of Ottawa, Ottawa,Canada.
Bryson CT, Carter R (2008) The significance of Cyperaceae asweeds. In: Sedges: Uses, Diversity, and Systematics of the Cyperaceae(eds Naczi RFC, Ford BA), pp. 15–101. Monographs in SystematicBotany from the Missouri Botanical Garden, St. Louis, Missouri.
Catling PM, Kostiuk B (2003) Carex acutiformis — dominance of acryptic invasive sedge at Ottawa. Lingua Botanica, 4, 12–15.
Catling PM, Reznicek AA, Crins WJ (1993) Carex juniperorum(Cyperaceae), a new species from northeastern North America,with a key to Carex sect. Phyllostachys. Systematic Botany, 18, 496–501.
Chase MW, Cowan RS, Hollingsworth PM et al. (2007) A proposalfor a standardised protocol to barcode all land plants. Taxon, 56,295–299.
Chase MW, Salamin N, Wilkinson M et al. (2005) Land plants andDNA barcodes: short-term and long-term goals. Philosophicaltransactions of the Royal Society of London. Series B, BiologicalSciences, 360, 1889–1895.
Chouinard BN, Starr JR, Naczi RFC (2008) Barcodes and rela-tionships of the North American sedges, north of Mexico (Carex,

B A R C O D I N G P L A N T S 161
© 2009 Blackwell Publishing Ltd
Cariceae, Cyperaceae). Abstract ID. 811, Botany 2008, Vancouver,British Columbia, Canada http://2008.botanyconference.org/engine/search/index.php?func=detail&aid=811.
Crins WJ, Naczi RFC, Reznicek AA, Ford BA (2002) Carex sect.Phyllostachyae. In: Flora of North America, Volume 23, Magnolio-phyta: Commelinidae (in Part): Cyperaceae (eds Ball PW, Gandhi K,Kiger RW et al.), pp. 558–563. Oxford University Press, Oxford,UK.
Dabros A, Waterway MJ (2008) Segregation of sedge species(Cyperaceae) along environmental gradients in fens of the Schef-ferville region, northern Quebec. In: Sedges: Uses, Diversity, andSystematics of the Cyperaceae (eds Naczi RFC, Ford BA), pp. 145–161. Monographs in Systematic Botany from the MissouriBotanical Garden, St. Louis, Missouri.
DeBry RW, Olmstead RG (2000) A simulation study of reducedtree-search effort in bootstrap resampling analysis. SystematicBiology, 49, 171–179.
Dornbush ME (2004) Plant community change following fifty-years of management at Kalsow Prairie Preserve, Iowa, U.S.A.American Midland Naturalist, 151, 241–250.
Ertter B (2000) Floristic surprises in North America north of Mexico.Annals of the Missouri Botanical Garden, 87, 81–209.
Fazekas AJ, Burgess KS, Kesanakurti PR et al. (2008) Multiplemultilocus DNA barcodes from the plastid genome discriminateplant species equally well. PLoS ONE 3, e2802. doi: 10.1371/journal.pone.0002802.
Ford BA, McQueen DAR, Naczi RFC, Reznicek AA (1998a) Allozymevariation and genetic relationships among species in the Carexwilldenowii complex (Cyperaceae). American Journal of Botany,85, 546–552.
Ford BA, McQueen DAR, Starr JR, Naczi RFC (1998b) The impactof species-specific traits and phylogenetic relatedness on allozymediversity in Carex section Phyllostachys (Cyperaceae). PlantSystematics and Evolution, 212, 13–29.
Ford BA, Starr JR, McQueen DAR, Naczi RFC (1998c) Relation-ships among species in Carex section Phyllostachys (Cyperaceae)based on allozyme divergence. Plant Systematics and Evolution,212, 31–51.
Ford BA, Naczi RFC (2001) Genetic diversity in the Carex jamesiicomplex (Cyperaceae: sect. Phyllostachyae) with insights into theevolution and origin of the newly described species Carex timida.Sida, 19, 885–897.
Ford BA, Iranpour M, Naczi RFC, Starr JR, Jerome CA (2006)Phylogeny of Carex subg. Vignea (Cyperaceae) based on non-coding nrDNA sequence data. Systematic Botany, 31, 70–82.
Ford BA, Naczi RFC, Starr JR (2008) Carex section Phyllostachyae:the value of a multidisciplinary approach in conducting systematicsstudies in sedges. In: Sedges: Uses, Diversity, and Systematics ofthe Cyperaceae (eds Naczi RFC, Ford BA). Monographs in Sys-tematic Botany from the Missouri Botanical Garden, St. Louis,Missouri.
Frodin DG (2004) History and concepts of big plant genera. Taxon,53, 753–776.
Gignac LD, Gauthier R, Rochefort L, Bubier J (2004) Distributionand habitat niches of 37 peatland Cyperaceae species across abroad geographic range in Canada. Canadian Journal of Botany,82, 1292–1313.
Good R (1974) The Geography of the Flowering Plants. Longman,London.
Govaerts R (2001) How many species of seed plants are there?Taxon, 50, 1085–1090.
Hartman RL, Nelson BE (1998) Taxonomic novelties from NorthAmerica north of Mexico: a 20-year vascular plant diversitybaseline. Monographs in Systematic Botany from the MissouriBotanical Garden, 67, 1–59.
Herre EA, Machado CA, Bermingham E et al. (1996) Molecularphylogenies of figs and their pollinator wasps. Journal of Bio-geography, 23, 521–530.
Hilu KW, Borsch T, Müller K et al. (2003) Angiosperm phylogenybased on matK sequence information. American Journal of Botany,90, 1758–1776.
Hollingsworth PM (2008) Progress and outstanding questions.Heredity, 101, 1–2.
Janeway LP (2005) Noteworthy collections: Carex pendula.Madrono, 52, 125.
Karlsen SR, Elvebakk A (2003) A method using indicator plants tomap local climatic variation in the Kangerlussuaq/Scoresby Sundarea, East Greenland. Journal of Biogeography, 30, 1469–1491.
King MG, Roalson EH (2008) Exploring evolutionary dynamics ofnrDNA in Carex subgenus Vignea (Cyperaceae). Systematic Botany,33, 514–524.
Klinka K, Krajina VJ, Ceska A, Scagel AM (1989) Indicator Plants ofCoastal British Columbia. UBC Press, Vancouver, Canada.
Kral R, Manhart J, Bryson CT (1987) A new Carex sect. Oligocarpae(Cyperaceae) from western Arkansas and eastern Oklahoma.Annals of the Missouri Botanical Garden, 74, 440–442.
Kress WJ, Erickson DL (2007) A two-locus global DNA barcodefor land plants: the coding rbcL gene complements the non-coding trnH-psbA spacer region. PLoS ONE, 2, e508. doi: 10.1371/journal.pone.0000508.
Kress WJ, Erickson DL (2008) DNA barcodes: genes, genomics, andbioinformatics. Proceedings of the National Academy of Sciences,USA, 105, 2761–2762.
Kress WJ, Wurdack KJ, Zimmer EA, Weigt LA, Janzen DH (2005)Use of DNA barcodes to identify flowering plants. Proceedings ofthe National Academy of Sciences, USA, 102, 8369–8374.
Lahaye R, van der Bank M, Bogarin D et al. (2008a) DNA barcodingthe floras of biodiversity hotspots. Proceedings of the NationalAcademy of Sciences, USA, 105, 2923–2928.
Lahaye R, Savolainen V, Duthoit S, Maurin O, van der Bank M(2008b) A test of psbK-psbI and atpF-atpH as potential plant DNAbarcodes using the flora of the Kruger National Park (SouthAfrica) as a model system. Nature Precedings Available fromURL: http://hdl.handle.net/10101/npre.2008.1896.1
LeClerc-Blain J, Starr JR, Bull RD, Saarela JM (2009) A regionalapproach to plant DNA barcoding provides high species resolu-tion of sedges (Carex and Kobresia, Cyperaceae) in the CanadianArctic Archipelago. Molecular Ecology Resources, in press.
Magee DW, Rorer A (1981) Freshwater Wetlands: A Guide to CommonIndicator Plants of the Northeast. University of MassachusettsPress, Amherst, Massachusetts.
Mastrogiuseppe J, Rothrock PE, Dibble AC, Reznicek AA (2002)Carex sect. Ovales. In: Flora of North America, Vol. 23, Magnoliophyta:Commelinidae (in Part): Cyperaceae (eds Ball PW, Gandhi K, KigerRW et al.), pp. 332–378. Oxford University Press, Oxford, UK.
Meyer C, Paulay G (2005) DNA barcoding: error rates based oncomprehensive sampling. Plos Biology, 12, 2229–2238.
Molina A, Acedo C, Llamas F (2008) Taxonomy and new taxa of theCarex divulsa aggregate in Eurasia (section Phaestoglochin, Cyper-aceae). Botanical Journal of the Linnean Society, 156, 385–409.
Naczi RFC (1990) The taxonomy of Carex bromoides (Cyperaceae).Contributions from the University Michigan Herbarium, 17, 215–222.

162 B A R C O D I N G P L A N T S
© 2009 Blackwell Publishing Ltd
Naczi RFC (1992) Systematics of carex section griseae (Cyperaceae)Ph.D. Dissertation. University of Michigan, Ann Arbor.
Naczi RFC (1993) Carex brysonii and Carex godfreyi, new species ofCarex section Griseae (Cyperaceae) from the southeastern UnitedStates. Contributions from the University of Michigan Herbarium,19, 195–205.
Naczi RFC (1997) Carex pigra, a new species of Carex section Griseae(Cyperaceae) from the southeastern United States of America.Novon, 7, 67–71.
Naczi RFC (1999) Carex planispicata, a widespread and frequentnew species of Carex section Griseae (Cyperaceae) from the east-ern United States of America. Journal of the Kentucky Academy ofScience, 60, 37–44.
Naczi RFC (2002) Carex sect. Deweyanae. In: Flora of North America,volume 23, Magnoliophyta: Commelinidae (in Part): Cyperaceae (edsBall PW, Gandhi K, Kiger RW et al.), pp. 321–325. OxfordUniversity Press, Oxford, UK.
Naczi RFC (2009) Insights on using morphologic data for phylo-genetic analysis in sedges (Cyperaceae). The Botanical Review, 75,67–95.
Naczi RFC, Bryson CT (2002) Carex sect. Griseae. In: Flora of NorthAmerica, Vol. 23, Magnoliophyta: Commelinidae (in Part): Cyperaceae(eds Ball PW, Gandhi K, Kiger RW et al.), pp. 448–461. OxfordUniversity Press, Oxford, UK.
Naczi RFC, Reznicek AA, Ford BA (1998) Morphological, geo-graphical, and ecological differentiation in the Carex willdenowiicomplex (Cyperaceae). American Journal of Botany, 85, 434–447.
Naczi RFC, Bryson CT, Cochrane TS (2002) Seven new species andone new combination in Carex (Cyperaceae) from North America.Novon, 12, 508–532.
Newmaster SG, Fazekas AJ, Ragupathy S (2006) DNA barcodingin land plants: evaluation of rbcL in a multigene tiered approach.Canadian Journal of Botany, 84, 335–341.
Newmaster SG, Fazekas AJ, Steeves AD, Janovec J (2008) Testingcandidate plant barcode regions in the Myristicaceae. MolecularEcology Resources, 8, 480–490.
Pennisi E (2007) Wanted: a barcode for plants. Science, 318, 190–191.Reznicek AA, Catling PM (1987) Carex praegracilis (Cyperaceae) in
eastern North America: a remarkable case of rapid invasion.Rhodora, 89, 205–216.
Rieseberg LH, Brouillet L (1994) Are many plant species para-phyletic? Taxon, 43, 21–32.
Ringius GS, Sims RA, Meades SJ (1997) Indicator Plant Species inCanadian Forests. Canadian Forest Service, Ottawa, Canada.
Roalson EH, Columbus JT, Friar EA (2001) Phylogenetic relationshipsin Cariceae (Cyperaceae) based on ITS (nrDNA) and trnT-L-F(cpDNA) region sequences: assessment of subgeneric and sectionalrelationships in Carex with emphasis on section Acrocystis.Systematic Botany, 26, 318–341.
Saarela JM, Ford BA (2001) Taxonomy of the Carex backii complex(section Phyllostachyae, Cyperaceae). Systematic Botany, 26, 704–721.
Sang T, Crawford DJ, Stuessy TF (1997) Chloroplast DNA phylogeny,reticulate evolution, and biogeography of Paeonia (Paeoniaceae).American Journal of Botany, 84, 1120–1136.
Sass C, Little DP, Stevenson DW, Specht CD (2007) DNA barcodingin the Cycadales: testing the potential of proposed barcodingmarkers for species identification of cycads. PLoS ONE, 11, e1154.doi: 10.1371/journal.pone.0001154.
Savolainen V, Cowan RS, Vogler AP, Roderick GK, Lane R (2005)Towards writing the encyclopaedia of life: an introduction toDNA barcoding. Philosophical Transactions of the Royal Society B:Biological Sciences, 360, 1805–1811.
Scoggan HJ (1978) The Flora of Canada Part 2 Pteridophyta, Gymno-spermae, Monocotyledonae. National Museum of Natural SciencesPublications in Botany, no. 7, Ottawa, Canada.
Scotland RW, Wortley AH (2003) How many species of seed plantsare there? Taxon, 52, 101–104.
Scott GAJ (1995) Canada's Vegetation: a World Perspective. McGill-Queen’s University Press, Montréal, Canada.
Seifert KA (2008) Recent developments and progress on fungaldna barcoding. In: Towards a Barcoded Planet, Canadian Barcode ofLife Network 2008 Scientific Symposium, p. 24 Royal OntarioMuseum, Toronto, Canada.
Standley LA, Cayouette J, Bruederle L (2002) Carex sect. Phacocystis.In: Flora of North America, Vol. 23, Magnoliophyta: Commelinidae(in Part): Cyperaceae (eds Ball PW, Gandhi K, Kiger RW et al.),pp. 379–401. Oxford University Press, Oxford, UK.
Starr JR, Bayer RJ, Ford BA (1999) The phylogenetic position ofCarex section Phyllostachys and its implications for phylogenyand subgeneric circumscription in Carex (Cyperaceae). AmericanJournal of Botany, 86, 563–577.
Starr JR, Ford BA (2001) The taxonomic and phylogenetic utilityof vegetative anatomy and fruit epidermal silica bodies in Carexsection Phyllostachys (Cyperaceae). Canadian Journal of Botany,79, 362–379.
Starr JR, Ford BA (2009) Phylogeny and evolution in Cariceae(Cyperaceae): current knowledge and future directions. TheBotanical Review, 75, 110–137.
Starr JR, Harris SA, Simpson DA (2003) Potential of the 5′ and 3′ends of the intergenic spacer (IGS) of rDNA in the Cyperaceae:new sequences for lower-level phylogenies in sedges with anexample from Uncinia Pers. International Journal of Plant Sciences,164, 213–227.
Starr JR, Harris SA, Simpson DA (2004) Phylogeny of the un-ispicate taxa in Cyperaceae tribe Cariceae I: generic relationshipsand evolutionary scenarios. Systematic Botany, 29, 528–544.
Starr JR, Harris SA, Simpson DA (2008) Phylogeny of the un-ispicate taxa in Cyperaceae tribe Cariceae II: the limits of Uncinia.In: Sedges: Uses, Diversity, and Systematics of the Cyperaceae (edsNaczi RFC, Ford BA). Monographs in Systematic Botany from theMissouri Botanical Garden, 108, 243–267.
Swofford DL (2003) PAUP*: Phylogenetic Analysis Using Parsimony(*and Other Methods). Version 4. Sinauer & Associates, Sunder-land, Massachusetts.
Taberlet P, Coissac E, Pompanon F et al. (2007) Power and limita-tions of the chloroplast trnL (UAA) intron for plant DNAbarcoding. Nucleic Acids Research, 35, doi: 10.1093/nar/gkl938.PMCID: PMC1807943.
Tate JA, Simpson BB (2003) Paraphyly of Tarasa (Malvaceae) anddiverse origins of the polyploid species. Systematic Botany, 28,723–737.
Thompson JD, Gibson TJ, Plewniak F, Jeanmougin F, Higgins DG(1997) The Clustal_X Windows interface: flexible strategies formultiple sequence alignment aided by quality analysis tools.Nucleic Acids Research, 24, 4876–4882.
Tsukaya H, Yokoyama J, Ikeda H, Kuroiwa H, Kuroiwa T,Iwatsuki K (1997) Morphological, Physiological and MolecularGenetic Characterization of Arabidopsis himalaica, with referenceto A. thaliana. Journal of Plant Research, 110, 15–23.
Vellend M, Lechowicz MJ, Waterway MJ (2000) Environmentaldistribution of four Carex species (Cyperaceae) in an old-growthforest. American Journal of Botany, 87, 1507–1516.
Wang RJ, Cheng CL, Chang CC, Wu CL, Su TM, Chaw SM (2008)Dynamics and evolution of the inverted repeat-large single

B A R C O D I N G P L A N T S 163
© 2009 Blackwell Publishing Ltd
copy junctions in the chloroplast genomes of monocots. BMCEvolutionary Biology, 8, 36.
Waterway MJ, Starr JR (2007) Phylogenetic relationships in thetribe Cariceae (Cyperaceae) based on nested analyses of threemolecular data sets. Aliso, 23, 165–192.
Weldy T, Werier D (2008) New York Flora Atlas. New York FloraAssociation, Albany, New York. Available from URL: http://www.newyork.plantatlas.usf.edu.
Wheeler GA (2007) Carex sagei (Cyperaceae), the correct name forC. barrosii. Darwiniana, 45, 231–235.
Yen AC, Olmstead RG (2000) Molecular systematics of Cyperaceaetribe Cariceae based on two chloroplast DNA regions: ndhFand trnL intron-intergenic spacer. Systematic Botany, 25, 479–494.
Zika P, Kuykendall K (2001) Some sedges (Carex) never found inOregon. Kalmiopsis, 7, 24–30.
Supporting information
Additional supporting information may be found in the onlineversion of this article:
Appendix S1 Voucher data for all individuals used in this study.DNA and GenBank numbers are given in the following order inparentheses after collection data and herbarium acronyms: DNAnumber, matK, trnH-psbA, rpoB, rpoC1. All taxa are arranged alpha-betically by section.
Please note: Wiley-Blackwell are not responsible for the content orfunctionality of any supporting materials supplied by the authors.Any queries (other than missing material) should be directed tothe corresponding author for the article.