Embed Size (px)
Citation preview

DNA barcodes, cryptic diversity and phylogeography of a WMediterranean assemblage of thermosbaenacean crustaceansFERNANDO C�ANOVAS, JOS�E A. JURADO-RIVERA, ELENA CERRO-G�ALVEZ, CARLOS JUAN, DAMI�A JAUME &JOAN PONS
Submitted: 20 July 2015Accepted: 20 January 2016doi:10.1111/zsc.12173
C�anovas, F., Jurado-Rivera, J.A., Cerro-G�alvez, E., Juan, C., Jaume, D., Pons, J. (2016).DNA barcodes, cryptic diversity and phylogeography of a W Mediterranean assemblage ofthermosbaenacean crustaceans. —Zoologica Scripta, 00, 000–000.We assess the occurrence of crypticism and analyse the phylogeography of a thermosbae-nacean crustacean, the monodellid Tethysbaena scabra, endemic to the Balearic Islands (WMediterranean). This species occurs only in mixohaline waters of coastal wells and cavesadjacent to the seashore. We have used the mitochondrial DNA barcode region to assess itsgenetic population structure throughout the anchialine environment of the islands. Maxi-mum likelihood phylogenetic analyses showed that the Balearic Tethysbaena and those fromthe NW Italian Peninsula form a monophyletic assemblage subdivided into several lineages.Cytochrome c oxidase subunit 1 (cox1) p-distances among the more divergent Mallorcan lin-eages are remarkably high and on par with those established between the formally describedspecies T. scabra from Menorca and T. argentarii from Italy. This result and the applicationof the generalised mixed Yule coalescence model (GMYC) suggest that at least some of theMallorcan lineages represent cryptic species. A clear-cut phylogeographic pattern is dis-played by this anchialine assemblage: six of its seven lineages appear in allopatry, with theexception of a Mallorcan lineage limited to a single cave nested within the geographic rangeof another lineage. All lineages show a distribution reduced to a single cave or to short por-tions of coast not exceeding 60 km in length. Our coalescence estimations suggest an earlyTortonian (10.7 Ma) origin for the Balearic + Italy Tethysbaena clade, an age that is largelyprior to the onset of the eustatic oscillations associated with the Quaternary glaciations.Only the diversification that took place within some of the Mallorcan lineages could be coe-val with the broad glacio-eustatic oscillations of the Quaternary.Corresponding author: Joan Pons, IMEDEA (CSIC-UIB), Instituto Mediterr�aneo de EstudiosAvanzados, C/Miquel Marqu�es 21, 07190 Esporles, Illes Balears, Spain. E-mail: [email protected] C�anovas, Centro de Ciencias do Mar (CCMAR), Universidade do Algarve, Campus deGambelas 8005-139 Faro, Portugal. E-mail: [email protected]�e A. Jurado-Rivera, Departament de Biologia, Universitat de les Illes Balears, Edifici GuillemColom, Campus Universitari, Ctra. Valldemossa, km 7’5, 07122 Palma de Mallorca, Illes Balears,Spain. E-mail: [email protected] Cerro-G�alvez, IMEDEA (CSIC-UIB), Instituto Mediterr�aneo de Estudios Avanzados,C/Miquel Marqu�es 21, 07190 Esporles, Illes Balears, Spain. E-mail: [email protected] Juan, Departament de Biologia, Universitat de les Illes Balears, Edifici Guillem Colom,Campus Universitari, Ctra. Valldemossa, km 7’5, 07122 Palma de Mallorca, Illes Balears, Spainand IMEDEA (CSIC-UIB), Instituto Mediterr�aneo de Estudios Avanzados, C/Miquel Marqu�es 21,07190 Esporles, Illes Balears, Spain. E-mail: [email protected]�a Jaume and Joan Pons, IMEDEA (CSIC-UIB), Instituto Mediterr�aneo de Estudios Avanza-dos, C/Miquel Marqu�es 21, 07190 Esporles, Illes Balears, Spain. E-mails: [email protected], [email protected]
ª 2016 Royal Swedish Academy of Sciences 1
Zoologica Scripta
IntroductionThe anchialine environment refers to the masses of mixo-haline water of aquifers affected by seawater intrusion(Stock et al. 1986; Bishop et al. 2015). This medium con-forms a narrow band in coastal areas that extends inland tothe limit of seawater penetration (Stock et al. 1986; Bishopet al. 2015). Its subterranean waters harbour a dispropor-tionate number of phylogenetic and biogeographic relictswhose distribution, often limited to a single island or nar-row portion of coast, renders them extremely vulnerable tonatural or anthropogenic impacts (Iliffe & Kornicker2009).Climatic fluctuations during the Quaternary have played
a major role in determining the current distribution andgenetic structure of animal populations (Hewitt 2004). Incoastal areas, sea-level oscillations associated with majorepisodes of glaciation–deglaciation have led to the recur-rent exposure and retreat of emerged land. Such cycleshave largely determined the distribution and phylogeogra-phy of coastal organisms through promoting the fragmen-tation and ulterior secondary contact of their populations,their local extinction, or sieving their genetic diversitythrough the establishment of population bottlenecks(Molins et al. 2009).The anchialine environment represents an ideal study
system where to assess the effect of past sea-level oscilla-tions on the phylogeographic structure of species tightlyassociated with coastal areas. This peculiar habitat experi-enced dramatic changes in its extent and connectivity inthe past due to the recurrent changes in sea level associatedwith Quaternary glacial cycles, or even to more ancientevents.The few studies performed until now on the phylogeog-
raphy of anchialine taxa have dealt with diadromous species(i.e. that pass part of their life cycle in the sea, usually asdispersive larvae) and have shown that this aspect of thenatural history of the organisms largely determines the spa-tial genetic structure of their populations (Kano & Kase2004; Santos 2006; Craft et al. 2008; Russ et al. 2010).Only the study by Bauz�a-Ribot et al. (2011) has focused onan unequivocally non-diadromous anchialine taxon – theamphipod crustacean Metacrangonyx longipes Chevreux,1909 – and revealed that this species shows a high level ofpopulation genetic structure along the apparently continu-ous anchialine habitat of a Mediterranean island.Among the members of the anchialine fauna outstand
the Thermosbaenacea, an odd order of peracaridan crus-taceans characterised by the development of a dorsal broodpouch in gravid females that contrasts with the ventral‘marsupium’ exhibited by females of other peracaridorders (Fig. 1A). The group is strictly aquatic subterranean
(stygobiont) and appears rarely in samples, with the few(35) species known thus far showing a very localised distri-bution in tropical to warm-temperate latitudes, mostly inanchialine habitats (Wagner 1994, 2012; Jaume 2008; Shi-momura & Fujita 2009). As the rest of peracaridans, theyhave no free-swimming larval stages, brooding femalesreleasing miniaturised adults instead. In addition, none ofthe species known has been reported to be diadromous.The dispersal abilities of thermosbaenaceans seem conse-quently to be extremely limited.Here, we use DNA barcodes [667 bp of the Cytochrome
oxidase I (cox1) mitochondrial DNA gene; Hebert et al.2003a,b] to assess for the first time the phylogeography ofa thermosbaenacean crustacean, the monodellid Tethysbaenascabra (Pretus, 1991), endemic to the Balearic Islands ofMallorca, Menorca and their peripheral islets Cabrera andDragonera (W Mediterranean; Fig. 1B; Pretus 1991; Jaume1993; Wagner 1994). This species has a broad distributionthroughout the anchialine medium of the islands (Wagner1994), appearing only in mixohaline waters of coastal wellsand caves adjacent to the seashore and never in fresh inlandgroundwaters. These islands and islets have remained iso-lated from the continent and from the rest of the BalearicArchipelago since the beginning of the Pliocene, but withthe advent of the Pleistocene, glacio-eustatic oscillationshave impelled their recurrent connection and separation,modifying the size and shape of emerged land (Cuerda1975; Pomar 1979). We use the mitochondrial DNA bar-code region of this species as a population genetic markerto assess its levels of variation throughout the anchialineenvironment of the islands, in search of past sea-level sig-nals that could have determined its genetic populationstructure.
Materials and methodsSampling
Specimens of Tethysbaena scabra were collected from 12different localities scattered over the coasts of Mallorca,Menorca and adjacent islets. In addition, specimens fromeight populations covering the entire geographic range ofthe genus were used as outgroups. The genus currentlyincludes 25 formally described species (Wagner 1994,2012), and its distribution covers from the coasts of theIndian Ocean (Arabian Peninsula; own obs.) to theEdwards Aquifer in Texas (USA). We sampled the follow-ing taxa: T. argentarii (Stella, 1951) from its singleknown locality at Monte Argentario (Tuscany, Italy),T. atlantomaroccana (Boutin & Cals, 1985) from its typelocality at the flood plain of river Tensift in Marrakech(Morocco), and six not yet formally described speciesfrom, respectively, a well placed near Tasla (Morocco; two
2 ª 2016 Royal Swedish Academy of Sciences
Crypticism and phylogeography in Tethysbaena � F. C�anovas et al.

sympatric species), one at Lamkedmyia (Morocco), one atSalalah and another one at Mirbat (both on the Dhofarcoast of Oman, Indian Ocean), and an anchialine cave onthe SW coast of the Dominican Republic (Hispaniola,Caribbean). Localities and number of specimens studiedper site in T. scabra and T. argentarii are listed in Table 1.Specimens were fixed in 96% ethanol and stored at 4 °C.Genomic DNA was isolated following Wizard� SV 96Genomic DNA Purification System (Promega) or DNeasyTissue Kit (Qiagen, Hilden, Germany) manufacturers’protocols. Cox1 50 end sequences were amplified andsequenced as described in Bauz�a-Ribot et al. (2011) usingprimer pairs LCO-HCO (Folmer et al. 1994; Geller et al.
2013). Sequences for the large subunit of nuclear riboso-mal DNA (28S rDNA) were obtained for a subset of 84individuals using the primers 1274-GACCCGTCTTGAAACACGGA (Markmann & Tautz 2005) and D6br-CACACGAAACCCTTCTCCAC (Omilian & Taylor2001). Chromatograms were edited with CodonCodeAligner v. 5.0.1 (CodonCode Corp., Denham, MA, USA),and DNA sequences aligned with MAFFT v. 7.215(Katoh & Toh 2008) using default parameters. Afteralignment, cox1 and 28S rDNA sequences were 667 bpand 727 bp in length, respectively. The number of parsi-mony informative sites was 215 for cox1, and 54 for 28SrDNA sequences.
Fig. 1 —A. Tethysbaena sp., broodingfemale from Coves del Drac (Manacor,Mallorca). Notice the dorsal brood pouch.—B. Topographic map indicatingsampling sites at the Balearic and Tuscancoasts (see Table 1 for detailedinformation). Symbols denote molecularentities recorded at each locality (seeFigs 2–3). —C. Median-joining networkdepicting phylogenetic relationshipsamong Balearic Tethysbaena cox1 mtDNAhaplotypes. Circle size proportional tohaplotype frequency, with median vectors(i.e. missing intermediates or ancestralhaplotypes) indicated by question marks.Branch lengths proportional to number ofpositions exhibiting nucleotide mutations.
ª 2016 Royal Swedish Academy of Sciences 3
F. C�anovas et al. � Crypticism and phylogeography in Tethysbaena

Phylogenetic analyses
Phylogenetic trees were estimated in BEAST v. 1.8.1(Drummond et al. 2012) using a substitution model for thefirst and second codon sites, and another one for the thirdpositions (see Results). The best substitution model foreach partition was selected with pMrAIC v. 1.1 (Nylander2004). Analyses implementing different coalescence models(see below) were run for 100 million generations samplingevery 1000 generations. Convergence of all parameters wasassessed using Tracer v. 1.6 (Rambaut et al. 2015), whereasconsensus tree topologies and posterior node support wereestimated with TreeAnnotator (Drummond et al. 2012).Maximum Likelihood (ML) analyses were implemented inRAxML v. 7.2.8 (Stamatakis 2006) using a GTR+CATmodel with nodal support estimated by 1000 fast bootstrapreplicates. Parsimony searches were performed in PAUP v.4.0b10 with 1000 random addition replicates saving 50trees per replicate and heuristic searches with tree-bisec-tion-reconnection branch-swapping (Swofford 2002). Weperformed 10 000 bootstrap replicated to assess cladesupport.
Species delimitation
We used a generalised mixed Yule coalescent method(GMYC) to determine genetic clusters representing inde-pendently evolving entities (Pons et al. 2006; Monaghanet al. 2009; Fujisawa & Barraclough 2013). The GMYCalgorithm compares an ultrametric tree in which allbranches are assumed to follow a coalescent diversificationmodel vs. another one based on a mixed Yule coalescentmodel. The threshold in branching rate at which the tran-sition between these two alternative diversification patternsoccurs is computed based on ML. Tree nodes placed belowthis threshold are considered to correspond to species
diversification events, while those above that threshold rep-resent clusters following coalescent processes (Barracloughet al. 2003; Fontaneto et al. 2007). The independent enti-ties determined by the GMYC model might representcryptic species. The support of the GMYC-delimited enti-ties is estimated through the comparison of several coales-cent and speciation models. The support value of a node isdefined as the sum of Akaike weights of candidate delimita-tion models where the node is included (Fujisawa & Barra-clough 2013). The Poisson Tree Processes model (PTP)was alternatively used for species delimitation (Zhang et al.2013). This method models branching events in terms ofnumber of substitutions and does not require the use ofultrametric trees. bPTP also estimates Bayesian support(BS) values for delimited entities on the input tree. A highBS value on a particular node indicates all its descendantnodes, and branches are likely to pertain to a single species.The cox1 sequence data set used in GMYC and PTP analy-ses was collapsed to a set of different haplotypes using thePerl script uniqHaplo.pl (Takebayashi 2015).
Population analyses
Number of haplotypes per site, haplotype and nucleotidediversity, and pairwise FST distances and their significancebased on 10 000 permutations were determined usingDnaSP v. 5 (Librado & Rozas 2009), Arlequin v. 3.0.1(Excoffier et al. 2005) and MEGA v. 5.2 (Tamura et al.2011). DnaSP analyses excluded all nucleotide positionswith missing data, while in MEGA only those positionswith missing data in a particular pairwise comparison wereexcluded. Median-joining network was estimated in Net-work v. 4.6.1.2 (Bandelt et al. 2015). This method buildsup minimum spanning trees within a single network, subse-quently adding median vectors (consensus sequences) to
Table 1 Localities, number of specimens analysed (n) and haplotypes recorded per locality for T. scabra and T. argentarii. Haplotype (H)and nucleotide (p) diversity are shown with their respective standard deviations in brackets
Code Site name Locality n Haplotype (n) H p (9 E�02)
MO Cova de sa Font Dragonera 22 h13 (22) – –
PI Well at es Pil�lar�ı Palma; Mallorca 21 h12 (21) – –
PO Well at sa Porrassa Magaluf; Mallorca 8 h12 (8) – –
BU Cova des Burr�ı Cabrera 3 h7 (3) – –
DO Cova des Dolc� Ses Salines; Mallorca 8 h8 (6) h5 (2) 0.429 (0.169) 3.838 (1.511)PV Cova des Pas de Vallgornera Llucmajor; Mallorca 4 h7 (3) h8 (1) 0.500 (0.255) 0.746 (0.396)VA Cova de Cala Varques C Manacor; Mallorca 2 h9 (2) – –
AB Cova de s’Abisament Sant Llorenc�; Mallorca 8 h9 (7) h10 (1) 0.250 (0.180) 0.373 (0.269)RP Cova des Dracs des Rafal des Porcs Ses Salines; Mallorca 6 h9 (5) h11 (1) 0.333 (0.215) 0.498 (0.321)DR Coves del Drac Manacor; Mallorca 11 h9 (11) – –
SM Cova de son Sant Mart�ı Alc�udia; Mallorca 5 h4 (4) h3 (1) 0.400 (0.056) 0.597 (0.354)FI Cova de ses Figueres Sant Llu�ıs; Menorca 10 h6 (10) – –
ST Grotta degli Stretti Monte Argentario; Tuscany 22 h1 (21) h2 (1) 0.091 (0.081) 0.136 (0.121)
4 ª 2016 Royal Swedish Academy of Sciences
Crypticism and phylogeography in Tethysbaena � F. C�anovas et al.

reduce tree length. Such vectors can be interpreted asextant unsampled sequences or as extinct ancestralsequences (Bandelt et al. 1999). To assess the occurrence ofisolation by distance, a Mantel test was performed ongenetic and geographic population distances usingZT (Bonnet & Van de Peer 2002). SAMOVA v.1.0 (Dupanloup et al. 2002) was used to identify the geo-graphic groupings that maximised genetic variance betweengroups of populations. The method calculates F statistics(genetic variance among populations, among populationswithin groups and among groups; FST, FSC, FCT, respec-tively) using AMOVA (Excoffier et al. 1992) and identifiesthe optimum number of population groups for a set ofsampled sites taking into account their geographic location.We used 100 simulated annealing processes for each valueof K.
Estimation of divergence time
Cox1 divergences in Malacostraca vary broadly, with esti-mated substitution rates ranging from 1.4 to 2.6% permillion years in pairwise comparisons (e.g. Knowlton &Weigt 1998; Finston et al. 2007; Kornobis et al. 2010). Inour case, we decided to use as a proxy the mean substitu-tion rate estimated for another anchialine crustacean, thestygobiont amphipod Metacrangonyx longipes, a Balearicendemic that displays a geographic distribution similar toTethysbaena, with some populations even co-occurring inthe same caves (Bauz�a-Ribot et al. 2011, 2012). TheM. longipes cox1 rate (1.32% per lineage and million years,confidence interval 0.89–1.95%) is close to the standardmitochondrial arthropod 2.3% pairwise divergence (1.15%per lineage). This substitution rate was implemented inthe Tethysbaena data set as an uncorrelated log-normalprior (mean �4.33, standard deviation 0.2) in a relaxedclock in which different coalescence models were explored(e.g. constant population, exponential, expansion or logisticpopulation growth). These models were compared usingBayes factors based on marginal likelihoods estimated bypath sampling method. Analyses were performed inBEAST starting from a random tree and using the previ-ously described partition scheme by codon position. Theremaining parameters (nucleotide frequencies and substitu-tion model across partitions) and the rate-heterogeneitymodels were unlinked and estimated from the data set.Search was set to 100 million generations, sampling every1000. Marginal likelihoods were estimated from a chain of100 path steps of 1 million generations using a pathscheme with a beta Quantile of 0.33 (Baele et al. 2012).Node age confidence intervals were estimated inTreeAnnotator after a burnin of the first 10 million gen-erations (Drummond et al. 2012).
ResultsPhylogenetic analyses and genetic distances
The DNA barcode consisting of a fragment of 667 bp ofcox1 was sequenced from 108 specimens of T. scabra(Table 1). Tethysbaena argentarii (Italy), T. atlantomaroccana(Morocco) and six not yet formally described species fromMorocco (3 spp.), Oman (2 spp.) and the DominicanRepublic (1 sp.) were used as potential outgroups.Sequences were deposited in European Nucleotide Archive(http://www.ebi.ac.uk/ena) under accession numbersLN899288-LN899424. ML, Bayesian and parsimony phy-logenetic analyses showed similar tree topologies (Fig. 2and Fig. S1). Tethysbaena of the Balearic Archipelago andthe Italian Peninsula conform a single highly supportedmonophyletic assemblage (with uncorrected genetic p-dis-tances <10%), appearing genetically very distant (>17%)from the remaining congeneric species from other geo-graphical areas (Fig. 2). Phylogenetic relationships withinthis Balearic + Italy clade were supported unambiguouslyonly between three (or four; see below) of the Balearic lin-eages, while the positions of Tethysbaena scabra fromMenorca (FI), T. argentarii from Italy, and the populationsfrom a cave in Alc�udia (SM) and one of the two lineagesfound at cova des Dolc� (DO-L1), both on Mallorca, rela-tive to each other, and with respect to the rest of Mallor-can, lineages were not resolved using this DNA sequencedata set (Fig. 2). The nuclear 28S rDNA sequences (acces-sion numbers LT159977-LT159999) showed low geneticvariation (maximum uncorrected p-distance of 5%) result-ing in a poorly resolved phylogenetic tree in which onlythree clades are supported, namely the sequences of T. ar-gentarii from Italy, Alc�udia (SM) and from the remainingsamples (Fig. S2).A species delimitation using cox1 sequences and GMYC
method on the monophyletic Balearic + Italian assemblagerevealed the occurrence of a transition in the branchingrate from species to the population level 1.1 Myr ago, pre-dicting the presence of eight major lineages (Fig. 3). Anultrametric tree for species delimitation was obtained inBEAST applying a coalescence model and a constant popu-lation size prior, two independent substitution models for1st + 2nd (HKY + G) and third (GTR) codon sites, arelaxed clock with a log-normal prior (mean 1.32%), andexcluding 86 identical haplotypes (Fig. 3). The GMYCmodel was preferred over the null model of coalescentbranching rates (log L = 88.74, compared to null modellog L = 81.31; 2D L = 14.86, v2 test, d.f. = 3, P < 0.001).Similar results were attained applying the Poisson TreeProcesses model (PTP) except this analysis collapsed twoof the previously deduced cox1-based lineages into a singleone (as e in Fig. 3), rendering a total of seven lineages
ª 2016 Royal Swedish Academy of Sciences 5
F. C�anovas et al. � Crypticism and phylogeography in Tethysbaena

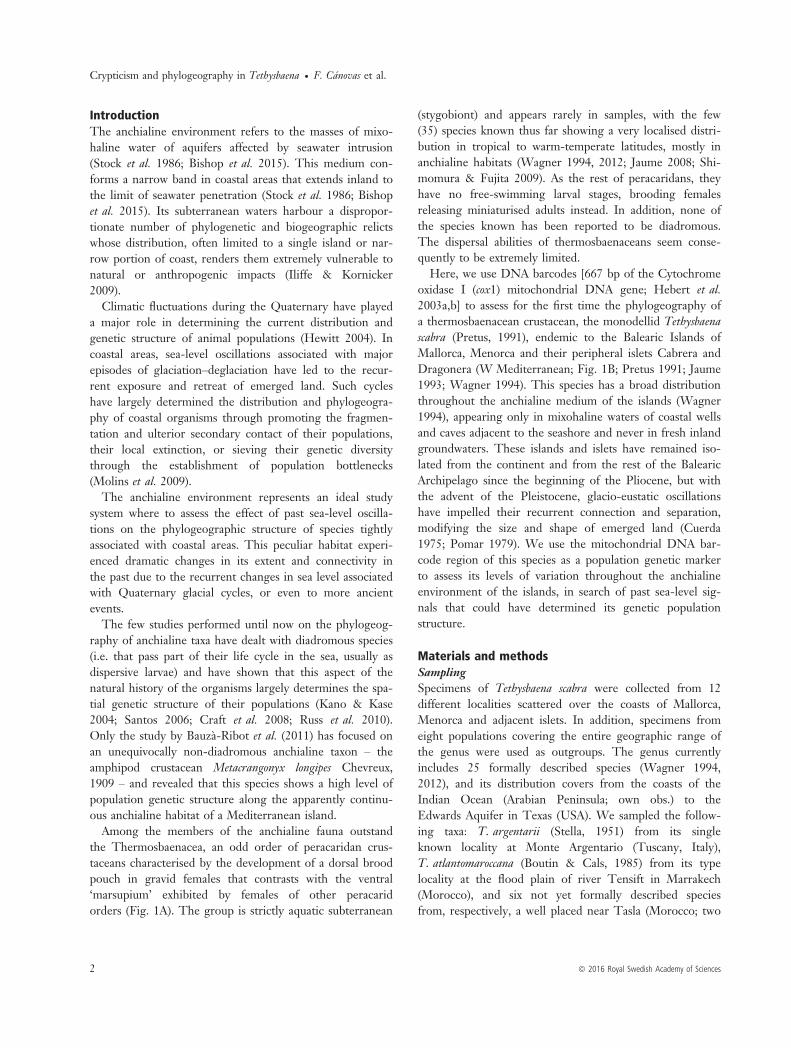
Fig. 2 Maximum likelihood tree based on cox1 sequences of 108 specimens of Tethysbaena scabra from Mallorca, Menorca, Dragonera andCabrera plus eight Tethysbaena species from Italy, Morocco, Oman and the Dominican Republic. Tree rooted by mid-point rooting.Numbers placed on nodes indicate ML bootstrap support (first, ≥70), Bayesian posterior probability (second, ≥0.95) and bootstrap supportbased on Parsimony criterion (third number, ≥70). Numbers within brackets correspond to number of sequences within each cluster.Locality codes as in Table 1. Note locality DO harbours two divergent lineages (DO-L1 and DO-L2).
6 ª 2016 Royal Swedish Academy of Sciences
Crypticism and phylogeography in Tethysbaena � F. C�anovas et al.

instead of eight (Fig. 3; see also Fig. 2). One of the lin-eages (lineage a) corresponds to the formally described spe-cies Tethysbaena argentarii, which is confined to a singlelocality on the Italian coast (cave locality ST; Table 1).The remaining lineages are limited to the Balearic Islands:one corresponds to the formally described T. scabra fromMenorca (lineage b, cave FI, the type locality of the spe-cies; Table 1), while the rest occur on Mallorca and twoislets placed nearby. Two of them show also a very loca-lised distribution, each in a single cave, one placed on thenorth coast of the island (lineage c; cave SM; Table 1), theother one on the south coast (lineage d; cave DO;Table 1). The lineage d displayed a cox1 sequence highlydivergent (lineage DO-L1) from the rest of specimens sam-pled in the same cave (p-distance = 9.5%; DO-L2), sug-gesting the occurrence of two sympatric taxa at thislocality. The second sympatric lineage e present in thiscave displays a wider geographic distribution covering thesouth and east coasts of Mallorca plus Cabrera islet (locali-ties DO, DR, RP, AB, VA, BU and PV; Table 1). Finally,two additional related cox1 lineages (f and g) are apparentlyconfined to the SW of Mallorca (caves PO and PI;Table 1) and to Dragonera islet (cave MO; Table 1),respectively (Fig. 3). The geographic distribution of allthese molecular entities is shown in Fig. 1. We did notperform GMYC and PTP analyses based on 28S rDNAsequences due to the low phylogenetic signal displayed bythis marker.Cox1 p-distances among the more divergent Mallorcan
lineages average 7.6–9.6% and are on par with their diver-gence with respect to the formally described speciesT. scabra from Menorca (7.9–8.7%) or T. argentarii from
Italy (8.3–9.3%). The genetic distance between the lattertwo species averages 10.2% (Table S1). These divergencevalues suggest that at least some of the Mallorcan lineagesrepresent cryptic species, in accord with the results of thespecies delimitation analyses.
Population genetic structure and genetic diversity
Thirteen different cox1 haplotypes were identified usingDnaSP in the populations from the Balearics and Italy(Table 1). Their median-joining network (Fig. 1C) showeda population structure similar to that retrieved in the phy-logenetic analysis (Fig. 3). Four haplotypes are sharedamong several Mallorcan populations. Thus, haplotype h9appears with a high frequency at VA, AB, RP and DRcaves (south/south-east Mallorcan coast), whereas haplo-type h7 is present at BU and PV; h8 at DO and PV; andh12 at PI and PO. Haplotype diversity per locality is lowor even zero; five caves and two wells displayed each a sin-gle haplotype, while the rest of caves harboured a maxi-mum of two haplotypes only. Nucleotide diversity rangedbetween 0.0014 and 0.0075 except at cave DO, where aremarkably higher value of 0.038 was reached due to theoccurrence of two very divergent haplotypes (h8 and h5,each belonging to a different lineage; see above). Manteltest revealed a low significant correlation between geneticand geographic distance in the Balearic localities(r = 0.603, P = 0.01). In addition, cox1 pairwise populationFST values were very low or non-significant when compar-ing localities placed nearby or those sharing haplotypes(FST = 0–0.3), whereas moderate to high in the rest ofcases, indicating absence of gene flow (FST = 0.5–1).SAMOVA showed that the optimum number of population
Fig. 3 Molecular entities delimited in aphylogenetic tree based on cox1 sequencesby GMYC and PTP algorithms in WMediterranean Tethysbaena (T. scabra andT. argentarii). Numbers placed abovenodes indicate GMYC (left) and bPTP(right) support values, and numbers belownodes posterior credibility (≥0.95)estimated by Bayesian inference. Asterisksindicate no support. Locality codes as inTable 1 and symbols as in Fig. 1. Singlelower case letter codes indicate delimitedGMYC and PTP entities (i.e. putativespecies). Note identical haplotypes wereremoved from data set before performinganalyses.
ª 2016 Royal Swedish Academy of Sciences 7
F. C�anovas et al. � Crypticism and phylogeography in Tethysbaena

groups necessary to maximise FCT values in the Balearicsamples was K = 6 (FCT = 0.886) (K = 7 if T. argentariifrom Italy is included in the analysis), with a populationaggregation pattern equivalent to that resulting from theGMYC and PTP analyses except for the two divergentcox1 haplotypes present in cave DO; these two haplotypesappear in the same group in the SAMOVA as this analysisgroups haplotypes geographically.
Estimation of coalescence times
Coalescence of the 130 cox1 mitochondrial DNAsequences of T. scabra and its closest relative T. argentariiwas estimated by Bayesian analysis implementing a relaxedmolecular clock, as Bayes factors rejected the assumptionof a strict clock (see Table 2). A logistic population growthmodel was preferred over constant population or exponen-tial/expansion population growth models based on Bayesfactor values estimated by marginal likelihood using thepath sampling method (Table 2). The estimated age forthe crown node (time to the most recent common ances-tor) of the Balearic + Italy Tethysbaena clade varied depend-ing on the population model used between 10.7 Myr (95%higher posterior density, HPD 18.4–4.3 Myr) using thepreferred population model to a maximum of 18.1 Myr.Moreover, the estimated node ages for the diversificationbetween and within lineages were relatively similar irre-spective of the population model assumed (Table 2). Coa-lescence of the three lineages present on the south, eastand west coast of Mallorca plus Cabrera and Dragoneraislets (lineages e, f and g) was estimated at 3.6 Myr agounder the logistic model (HPD 6.4–1.4 Myr; see Table 2).Ulterior splits presumably took place more recently, ca.2 Myr ago between lineages f and g (Palma Bay and Dra-gonera; HPD 3.4–0.7 Myr), and ca. 1.2 Myr ago withinlineage e (between the southern Mallorcan coast + Cabreraand the eastern Mallorcan coast; HPD 2.1–0.4 Myr).
DiscussionCryptic diversity in Tethysbaena
Some crustacean groups – especially stygobionts – includea remarkable number of cryptic species (Witt & Hebert2000; Wellborn et al. 2005; Lef�ebure et al. 2006a,b; Wittet al. 2006; Finston et al. 2007; Seidel et al. 2009; Westramet al. 2011). For example, Bauz�a-Ribot et al. (2011) revealeda surprisingly high population genetic structure in theBalearic stygobiont amphipod Metacrangonyx longipes, com-patible with the genetic divergence expectable among allo-patric cryptic sister lineages (‘type 1 crypticism’; Tronteljet al. 2009). Seemingly, the monophyletic assemblage ofTethysbaena thermosbaenaceans studied herein – whichincludes several highly divergent lineages– could embrace amosaic of cryptic species. Thus, whereas T. argentarii isendemic to a single locality on the Italian coast, six orseven lineages (depending on the analysis performed) occuron the Balearic Islands. Only one of them has been for-mally described thus far, as T. scabra, and is apparently lim-ited to a single cave on Menorca. The rest appear only onMallorca, and two islets placed nearby. As previously sta-ted, cox1 genetic distances between all these lineages arerelatively high and are in agreement with the results of thespecies delimitation analyses and SAMOVA presentedabove. It is remarkable that two Mallorcan lineages (d ande) occur in the same cave (Cova des Dolc�, locality codeDO; Table 1). They could represent a case of morphologi-cal convergence between non-sister lineages after evolutionunder similar ecological constraints, or due to a lack ofmorphological differentiation (‘type 2 crypticism’; Tronteljet al. 2009). This is not the only case of sympatry reportedherein because two of the outgroup lineages included inour analyses were collected in the same well in the Moroc-can Anti-Atlas.The 28S rDNA data set, although containing scarce phy-
logenetic information and with a presumably much larger
Table 2 Marginal Likelihood values estimated by path sampling (ps), and crown node ages (in million years) for the Tethysbaena lineages ofFig. 3. Ages were estimated using several coalescence models in BEAST v. 1.8.1 on the 130 cox1 sequences. A constant population (ct.pop.) size model was assessed under both strict and relaxed uncorrelated log-normal clocks, but the former was rejected by Bayes factors.Hence, analyses assumed a relaxed clock with an uncorrelated log-normal prior. Confidence intervals correspond to logistic growth values
Model ps Root a b c e f g e1 e2 f + g e + f+g
ct. pop. strict clock �2393.585 15.458 0.448 0.454 0.62 1.248 0.735 0.41 0.715 Paraphyly 2.679 4.449ct. pop. log normal �2388.591 13.287 0.636 0.521 0.685 1.501 0.931 0.578 0.803 0.6 2.424 4.417Exponential growth �2382.286 14.581 0.451 0.416 0.596 1.276 0.726 0.42 0.667 0.461 2.352 4.364Expansion growth �2389.935 12.654 0.757 0.644 0.788 1.626 1.061 0.706 Paraphyly 0.72 2.501 4.471Skyride uniform �2364.180 18.056 0.281 0.245 0.639 1.279 0.470 0.265 0.646 0.243 3.354 6.058Skyline piecewise ct. �2374.389 17.996 0.281 0.297 0.643 1.353 0.559 0.301 0.684 0.316 2.290 5.428Logistic growth �2316.038 10.663 0.646 0.385 0.523 1.197 0.713 0.43 0.621 0.446 1.964 3.625Confidence intervalLower na 4.266 0.099 0.042 0.056 0.404 0.202 0.097 0.16 0.112 0.672 1.384Upper na 18.393 0.92 0.826 1.127 2.126 1.301 0.821 1.127 0.816 3.42 6.438
8 ª 2016 Royal Swedish Academy of Sciences
Crypticism and phylogeography in Tethysbaena � F. C�anovas et al.

coalescence time, supports three of the major lineagesdetected using mtDNA. More variable nuclear markerswould be necessary however to perform a formal speciesdelimitation scrutiny as the GMYC method is known toperform poorly in case of gene trees with many zero lengthterminal branches (O’Meara 2010). Despite their clear util-ity in the resolution and discovery of species, coalescent-based species delimitation methods have some limitations(Fujita et al. 2012). Ideally, multilocus data should be usedto avoid discordances between the genealogy from a partic-ular locus and the history of speciation. In addition, meth-ods that use a fixed tree can overestimate the number ofspecies (Fujita et al. 2012). Notwithstanding, the GMYCmodel has been shown to be useful in cases where diver-gences are deep, taxon sampling is incomplete or obtainingmultilocus data is unattainable (Reid & Carstens 2012).
Phylogeography of anchialine species
The phylogeographic structure of anchialine species seemsto be largely determined by natural history traits such as theexistence and duration of dispersive larval stages at sea (San-tos 2006; Craft et al. 2008). Accordingly, a complete lack ofpopulation differentiation should be expected in taxa withlong-lasting marine planktonic larvae (or shallow populationstructures, depending on the presence and extent of barriersto subterranean dispersal). Conversely, a strong populationalstructure and/or species differentiation would be the case intaxa with reduced dispersal capabilities (Santos 2006; Craftet al. 2008). The latter should show phylogeographic pat-terns similar to those exhibited by most groundwater crus-taceans, where the reduced dispersal aptitudes and thehistorical fragmentation of populations have led to distribu-tions often limited to a single island or groundwater system(Trontelj et al. 2009). Indeed, this is the conditionapproached in the Hawaiian anchialine shrimp Halocaridinarubra Holthuis, 1963 (Santos 2006; Craft et al. 2008). Theremarkable level of populational genetic structure shown bythis shrimp throughout the Archipelago seems to be theresult of allopatric fragmentation and isolation by distance,coupled with the occurrence of episodes of short-rangecoastal dispersal. Halocaridina has life history traits such aslarge eggs, lecithotrophic larvae and abbreviated larval devel-opment that make long-distance dispersal very unlikely (San-tos 2006; Craft et al. 2008).However, and as stated above, other anchialine taxa show
no trace of genetic differentiation. This is the case of thePhilippine anchialine neritilid gastropod Neritilia cavernicolaKano & Kase, 2004; where the combination of amphidr-omy and drifting of planktonic larvae would explain thelack of differentiation between populations placed 200 kmapart (Kano & Kase 2004). The same holds for the anchia-line alpheid shrimp Metabetaeus lohena Banner & Banner,
1960, that appears genetically undifferentiated throughoutthe islands of the Hawaiian Archipelago (Russ et al. 2010).In accord with Santos (2006) and Craft et al. (2008), we
show that the non-diadromous, strictly anchialine Tethys-baena thermosbaenaceans from the Balearics and Italy dis-play a clear-cut phylogeographic pattern. Six of the sevencox1 lineages recognised within this monophyletic assem-blage appear in allopatry, the only exception being lineaged, which shows an extremely localised distribution limitedto a single cave placed within the geographic range of lin-eage e. All lineages show a distribution reduced to a singlecave (a–d, g) or to short strips of coast (e, f) not exceeding60 km in length. Therefore, the anchialine belt developedaround the islands is not as continuous as might beexpected and allows the maintenance of discrete popula-tions of strictly anchialine species that might have beenthought initially that showed no differentiation.
Sea-level oscillations and historical biogeographic patterns in
anchialine thermosbaenaceans
The islands and islets of the Balearic Archipelago harbour-ing Tethysbaena (Mallorca, Menorca, Cabrera and Drago-nera) are located on a common submarine promontoryand have remained isolated from the continent and fromthe rest of Balearic Islands (Ibiza and Formentera) sincethe beginning of the Pliocene, when the Mediterraneanwas re-flooded after the Messinian salinity crisis (5.33 Myrago; Krijgsman et al. 1999). With the advent of the Pleis-tocene 2.59 Myr ago, broad glacio-eustatic oscillationshave modified repeatedly the size and shape of theemerged lands, leading to their recurrent connection andseparation. Thus, Mallorca and Menorca were split offand had most of their lowlands submersed about780 000 years ago, when sea level reached ca. +90 mabove its present stand in the Balearic area (Cuerda 1975).Conversely, they conformed a single composite island asrecently as at the Last Glacial Maximum (21 000 yearsago), when sea level dropped to ca. �134 m (Cuerda1975; Lambeck et al. 2014).Our coalescence estimations based on cox1 sequences
(Table 2) suggest that presumably at the Early Tortonian(10.7 Myr ago; with the caveat of the broad HPD associ-ated with this dating: 18.4–4.3 Myr) an ancestralBalearic + Italy Tethysbaena monophyletic assemblage splitinto five different lineages (d, c, b, [e + f + g], and a; seeFig. 3). In any case, this time span largely precedes theonset of the broad glacio-eustatic oscillations of the Qua-ternary and indicates that the formation of the major lin-eages within this species assemblage responded to othercauses. Descendants of these five lineages currently persiston Italy (a), Menorca (b), the north coast of Mallorca (c),the south coast of Mallorca (d), and the south and
ª 2016 Royal Swedish Academy of Sciences 9
F. C�anovas et al. � Crypticism and phylogeography in Tethysbaena

south-east coasts of Mallorca plus Dragonera and Cabreraislets ([e + f + g]).Only the diversification that took place within the latter
lineage [e + f + g] could be coeval with the glacio-eustaticoscillations of the Quaternary. Indeed, the estimated dat-ings for the splits affecting this lineage fall, or partiallyoverlap, into the Pleistocene. Thus, the coalescence ofMallorcan lineages e and [f + g] has been estimated at3.6 Myr ago (HPD 6.4–1.4 Myr). Other splits would havesubsequently followed, as those between lineages f and g
about 2.0 Myr ago (HPD 3.4–0.7 Myr), or within lineage e
1.2 Myr ago (HPD 2.1–0.4 Myr). The broad confidenceintervals associated with these datings–which partially over-lap– impede to associate the corresponding splits to anyparticular transgressive–regressive sea-level cycle. In anyevent, the topography of Fig. 1B shows that Lower Pleis-tocene transgressive phases such as those recorded at+55 m a.s.l. (530 000 years ago) or at +90 m a.s.l.(780 000 years ago) on the south coast of Mallorca (seeCuerda 1975: 49; 81) could be in the origin of lineages f
and g or have caused the split within lineage e, in a waysimilar to that described by Notenboom (1991; i.e. vicari-ance triggered by marine regressions) to explain the diver-sification of other stygobiont crustaceans of direct marinederivation. This mechanism has been suggested elsewhereto explain the divergence of Metacrangonyx lineages in thesame area (Bauz�a-Ribot et al. 2011, 2012). The impact onpopulation genetic structure of more recent eustatic oscilla-tions (for instance, the maximum lowstand at the Last Gla-cial Maximum) cannot be easily detected with the geneticmarker at hand, and a much faster evolving sequenceshould be used for this purpose.
AcknowledgementsThis work was supported by Spanish MINECO GrantCGL2012-33597, partially financed with EU FEDERfunds. We greatly appreciate the support received duringfieldwork from Francesc Gr�acia (Mallorca), Josep A.Alcover, Mar Bauz�a-Ribot and Jos�e A. Ottenwalder(Dominican Republic), Ali Baitsaid and Ronald Vonk(Oman), and Claude Boutin, Nicole Coineau, MohammedMessouli, Mohammed Yacoubi and Mohamed Boulanouar(Morocco). Fieldwork in Oman could not have been possi-ble without the support, and facilities provided by Mr. Dr.Zaher Khaled al Suleimani and Dr. Abdullah Bawain of theMinistry of Regional Municipalities and Water Resources.Elena Cerro-G�alvez benefited from a IMEDEA 2014‘Javier Bened�ı’ starting research fellowship. Pau Balaguerand Guillermo Vizoso are acknowledged for their supportwith GIS issues. We finally thank two anonymous review-ers for their valuable comments and suggestions on an ear-lier version of the manuscript.
ReferencesBaele, G., Lemey, P., Bedford, T., Rambaut, A., Suchard, M. A. &Alekseyenko, A. V. (2012). Improving the accuracy of demo-graphic and molecular clock model comparison while accommo-dating phylogenetic uncertainty. Molecular Biology Evolution, 29,2157–2167.
Bandelt, H. J., Forster, P. & R€ohl, A. (1999) Median-joining net-works for inferring intraspecific phylogenies. Molecular Biologyand Evolution, 16, 37–48.
Bandelt, H. J., Foster, P. & R€ohl, A. (2015) Network v. 4.6.1.3.Available via http://www.fluxus-engineering.com/sharenet.htm.
Barraclough, T. G., Birky, C. W. & Burt, A. (2003). Diversifica-tion in sexual and asexual organisms. Evolution, 57, 2166–2172.
Bauz�a-Ribot, M. M., Jaume, D., Forn�os, J. J., Juan, C. & Pons, J.(2011). Islands beneath islands: phylogeography of a groundwa-ter amphipod crustacean in the Balearic archipelago. BMC Evo-lutionary Biology, 11, 221.
Bauz�a-Ribot, M. M., Juan, C., Nardi, F., Orom�ı, P., Pons, J. &Jaume, D. (2012). Mitogenomic phylogenetic analysis supportscontinental-scale vicariance in subterranean thalassoid crus-taceans. Current Biology, 22, 2069–2074.
Bishop, R. E., Humphreys, W. F., Cukrov, N., Zic, V., Boxshall,G. A., Cukrov, M., Iliffe, T. M., Kr�sini�c, F., Moore, W. S.,Pohlman, J. W. & Sket, B. (2015). Anchialine” redefined as asubterranean estuary in a crevicular or cavernous geological set-ting. Journal of Crustacean Biology, 35, 511–514.
Bonnet, E. & Van de Peer, Y. (2002). Zt: a software tool for sim-ple and partial Mantel tests. Journal of Statistical Software, 7,1–12.
Craft, J. D., Russ, A. D., Yamamoto, M. N., Iwai., T. Y., Jr, Hau,S., Kahiapo, J., Chong, C. T., Ziegler-Chong, S., Muir, C.,Fujita, Y., Polhemus, D. A., Kinzie, R. A., III & Santos, S. R.(2008). Islands under islands: The phylogeography and evolutionof Halocaridina rubra Holthuis, 1963 (Crustacean: Decapoda:Atyidae) in the Hawaiian archipelago. Limnology & Oceanography,53, 675–689.
Cuerda, J. (1975). Los Tiempos Cuaternarios en Baleares. Palma deMallorca: Diputaci�on Provincial de Baleares.
Drummond, A. J., Suchard, M. A., Xie, D. & Rambaut, A. (2012).Bayesian phylogenetics with BEAUti and the BEAST 1.7. Molec-ular Biology Evolution 29, 1969–1973.
Dupanloup, I., Schneider, S. & Excoffier, L. (2002). A simulatedannealing approach to define the genetic structure of popula-tions. Molecular Ecology, 11, 2571–2581.
Excoffier, L., Smouse, P. E. & Quattro, J. M. (1992). Analysis ofmolecular variance inferred from metric distances among DNAhaplotypes: application to human mitochondrial DNA restrictiondata. Genetics, 131, 479–491.
Excoffier, L., Laval, G. & Schneider, S. (2005). Arlequin (version3.0): an integrated software package for population genetics dataanalysis. Evolutionary Bioinformatics Online, 1, 47–50.
Finston, T. L., Johnson, M. S., Humphreys, W. F., Eberhard, S.M. & Halse, S. A. (2007). Cryptic speciation in two widespreadsubterranean amphipod genera reflects historical drainage pat-terns in an ancient landscape. Molecular Ecology, 16, 355–365.
Folmer, O., Black, M., Hoeh, W., Lutz, R. & Vrijenhoek, R.(1994). NA primers for amplification of mitochondrial cyto-chrome c oxidase subunit I from diverse metazoan invertebrates.Molecular Marine Biology and Biotechnology, 3, 294–299.
10 ª 2016 Royal Swedish Academy of Sciences
Crypticism and phylogeography in Tethysbaena � F. C�anovas et al.

Fontaneto, D., Herniou, E. A., Boschetti, C., Caprioli, M., Mel-one, G., Ricci, C. & Barraclough, T. G. (2007). Independentlyevolving species in asexual bdelloid rotifers. PLoS Biology, 5,e87.
Fujisawa, T. & Barraclough, T. G. (2013). Delimiting speciesusing single-locus data and the Generalized Mixed Yule Coales-cent (GMYC) approach: a revised method and evaluation onsimulated datasets. Systematic Biology, 62, 707–724.
Fujita, M. K., Leach�e, A. D., Burbrink, F. T., McGuire, J. A. &Moritz, C. (2012). Coalescent-based species delimitation in anintegrative taxonomy. Trends in Ecology & Evolution, 27, 480–488.
Geller, J., Meyer, C., Parker, M. & Hawk, H. (2013). Redesign ofPCR primers for mitochondrial cytochrome c oxidase subunit Ifor marine invertebrates and application in all-taxa biotic sur-veys. Molecular Ecology Resources, 13, 851–861.
Hebert, P. D. N., Cywinska, A., Ball, S. L. & De Waard, J. R.(2003a). Biological identifications through DNA barcodes. Pro-ceedings of the Royal Society B: Biological Sciences, 270, 313–321.
Hebert, P. D. N., Ratnasingham, S. & De Waard, J. R. (2003b).Barcoding animal life: cytochrome c oxidase subunit 1 diver-gences among closely related species. Proceedings of the Royal Soci-ety B: Biological Sciences, 270(Suppl. 1), S96–S99.
Hewitt, G. M. (2004). Genetic consequences of climatic oscilla-tions in the Quaternary. Philosophical Transactions of the RoyalSociety B: Biological Sciences, 359, 183–195.
Iliffe, T. M. & Kornicker, L. S. (2009). Worldwide diving discov-eries of living fossil animals from the depths of anchialine andmarine caves. Smithsonian Contributions to the Marine Sciences, 38,269–280.
Jaume, D. (1993). Fauna carcinol�ogica de les aig€ues continentals.Hist�oria Natural de l’Arxip�elag de Cabrera. In: J. A. Alcover, E.Ballesteros & J. J. Forn�os (Eds.) (pp. 309–322). Palma de Mal-lorca: Ed. Moll/CSIC.
Jaume, D. (2008). Global diversity of spelaeogriphaceans & ther-mosbaenaceans (Crustacea; Spelaeogriphacea & Thermosbae-nacea) in freshwater. Hydrobiologia, 595, 219–224.
Kano, Y. & Kase, T. (2004). Genetic exchange between anchialinecave populations by means of larval dispersal: the case of a newgastropod species Neritilia cavernicola. Zoologica Scripta, 33,423–437.
Katoh, K. & Toh, H. (2008). Recent developments in the MAFFTmultiple sequence alignment program. Briefings in Bioinformatics,9, 286–298.
Knowlton, N. & Weigt, L. A. (1998). New dates and new rates fordivergence across the Isthmus of Panama. Proceedings of the RoyalSociety B: Biological Sciences, 265, 2257–2263.
Kornobis, E., P�alsson, S., Kristj�ansson, B. K. & Svavarsson, J.(2010). Molecular evidence of the survival of subterraneanamphipods (Arthropoda) during Ice Age underneath glaciers inIceland. Molecular Ecology, 19, 2516–2530.
Krijgsman, W., Hilgen, F. J., Raffi, I., Sierro, F. J. & Wilson, D.S. (1999). Chronology, causes and progression of the Messiniansalinity crisis. Nature, 400, 652–655.
Lambeck, K., Rouby, H., Purcell, A., Sun, Y. & Sambridge, M.(2014). Sea level and global ice volumes from the Last GlacialMaximum to the Holocene. Proceedings of the National Academy ofSciences, 111, 15296–15303.
Lef�ebure, T., Douady, C. J., Gouy, M. & Gibert, J. (2006a). Rela-tionship between morphological taxonomy and molecular diver-gence within Crustacea: proposal of a molecular threshold tohelp species delimitation. Molecular Phylogenetics and Evolution,40, 435–447.
Lef�ebure, T., Douady, C. J., Gouy, M., Trontelj, P., Briolay, J. &Gibert, J. (2006b). Phylogeography of a subterranean amphipodreveals cryptic diversity and dynamic evolution in extreme envi-ronments. Molecular Ecology, 15, 1797–1806.
Librado, P. & Rozas, J. (2009). DnaSP v5: a software for compre-hensive analysis of DNA polymorphism data. Bioinformatics, 25,1451–1452.
Markmann, M. & Tautz, D. (2005). Reverse taxonomy: anapproach towards determining the diversity of meiobenthicorganisms based on ribosomal RNA signature sequences. Philo-sophical Transactions of the Royal Society B: Biological Sciences, 360,1917–1924.
Molins, A., Mayol, M. & Rossell�o, J. A. (2009). Phylogeographicalstructure in the coastal species Senecio rodriguezii (Asteraceae), anarrowly distributed endemic Mediterranean plant. Journal ofBiogeography, 36, 1372–1383.
Monaghan, M. T., Wild, R., Elliot, M., Fujisawa, T., Balke, M.,Inward, D. J., Lees, D. C., Ranaivosolo, R., Eggleton, P., Barra-clough, T. G. & Vogler, A. P. (2009). Accelerated species inven-tory on Madagascar using coalescent-based models of speciesdelineation. Systematic Biology, 58, 298–311.
Notenboom, J. (1991). Marine regressions and the evolution ofgroundwater dwelling amphipods (Crustacea). Journal of Biogeog-raphy, 18, 437–454.
Nylander, J. A. A. (2004). pMrAIC.pl version 1.1. (computer programand manual). Distributed by Author, Evolutionary Biology Cen-tre, Uppsala University.
O’Meara, B. C. (2010). New heuristic methods for joint speciesdelimitation and species tree inference. Systematic Biology, 59,59–73.
Omilian, A. R. & Taylor, D. J. (2001). Rate acceleration and long-branch attraction in a conserved gene of cryptic daphniid (Crus-tacea) species. Molecular Biology and Evolution, 18, 2201–2212.
Pomar, L. (1979). La evoluci�on tectonosedimentaria de lasBaleares: an�alisis critico. Acta Geol�ogica Hisp�anica, 14, 293–310.
Pons, J., Barraclough, T. G., G�omez-Zurita, J., Cardoso, A.,Duran, D. P., Hazell, S., Kamoun, S., Sumlin, W. D. & Vogler,A. P. (2006). Sequence-based species delimitation for the DNAtaxonomy of undescribed insects. Systematic Biology, 55, 595–609.
Pretus, J. L. (1991) Estudio Taxon�omico, Biogeogr�afico y Ecol�ogico delos Crust�aceos epigeos e hipogeos de las Baleares (Branchiopoda, Cope-poda, Mystacocarida y Malacostraca). Ph. D. Thesis, Universitat deBarcelona.
Rambaut, A., Suchard, M. A., Xie, D. & Drummond, A. J. (2015)Tracer v1.6. Available via http://beast.bio.ed.ac.uk/Tracer.
Reid, N. M. & Carstens, B. C. (2012). Phylogenetic estimationerror can decrease the accuracy of species delimitation: a Baye-sian implementation of the general mixed Yule-coalescentmodel. BMC Evolutionary Biology, 12, 196.
Russ, A. D., Santos, S. R. & Muir, C. (2010). Genetic populationstructure of an anchialine shrimp, Metabetaeus lohena (Crustacea:Alpheidae), in the Hawaiian Islands. Revista de Biolog�ıa Tropical,58, 159–170.
ª 2016 Royal Swedish Academy of Sciences 11
F. C�anovas et al. � Crypticism and phylogeography in Tethysbaena

Santos, S. R. (2006). Patterns of genetic connectivity amonganchialine habitats: a case study of the endemic Hawaiian shrimpHalocaridina rubra on the island of Hawaii. Molecular Ecology, 15,2699–2718.
Seidel, R. A., Brian, K., Lang, B. K. & Berg, D. J. (2009). Phylo-geographic analysis reveals multiple cryptic species of amphipods(Crustacea: Amphipoda) in Chihuahuan Desert springs. BiologicalConservation, 142, 2303–2313.
Shimomura, M. & Fujita, Y. (2009). First record of the thermos-baenacean genus Halosbaena from Asia: H. daitoensis sp. nov.(Peracarida: Thermosbaenacea: Halosbaenidae) from an anchia-line cave of Minamidaito-jima Is., in Okinawa, southern Japan.Zootaxa, 1990, 55–64.
Stamatakis, A. (2006). AxML-VI-HPC: maximum likelihood-basedphylogenetic analyses with thousands of taxa and mixed models.Bioinformatics, 22, 2688–2690.
Stock, J. H., Iliffe, T. M. & Williams, D. (1986). The concept“anchialine” reconsidered. Stygologia, 2, 90–92.
Swofford, D. (2002). PAUP*: Phylogenetic Analysis using Parsimony*(and other methods), 4.0b10. Sunderland, MA: Sinauer Associates.
Takebayashi, N. (2015). uniqHaplo.pl. Available via http://raven.iab.alaska.edu/~ntakebay/teaching/programming/perl-scripts/perl-scripts.html.
Tamura, K., Peterson, D., Peterson, N., Stecher, G., Nei, M. &Kumar, S. (2011). MEGA5: molecular evolutionary geneticsanalysis using maximum likelihood, evolutionary distance, andmaximum parsimony methods. Molecular Biology and Evolution,28, 2731–2739.
Trontelj, P., Douady, C. J., Fi�ser, C., Gibert, J., Gori�cki, �S.,Lef�ebure, T., Sket, B. & Zak�sek, V. (2009). A molecular test forcryptic diversity in ground water: how large are the ranges ofmacro-stygobionts?. Freshwater Biology, 54, 727–744.
Wagner, H. P. (1994). A monographic review of the Thermosbae-nacea (Crustacea: Peracarida). Zoologische Verhandelingen, 291,1–338.
Wagner, H. P. (2012). Tethysbaena ophelicola n. sp. (Thermosbae-nacea), a new prime consumer in the Ophel biome of the Ayya-lon Cave, Israel. Crustaceana, 85, 1571–1587.
Wellborn, G. A., Cothran, R. & Bartholf, S. (2005). Life historyand allozyme diversification in regional ecomorphs of the Hya-lella azteca (Crustacea: Amphipoda) species complex. BiologicalJournal of the Linnean Society, 84, 161–175.
Westram, A. J., Jokela, J., Baumgartner, C. & Keller, I. (2011).Spatial distribution of cryptic species diversity in Europeanfreshwater amphipods (Gammarus fossarum) as revealed bypyrosequencing. PLoS One, 6, e23879.
Witt, J. D. S. & Hebert, P. D. N. (2000). Cryptic species diversityand evolution in the amphipod genus Hyalella within central gla-ciated North America: a molecular phylogenetic approach. Cana-dian Journal of Fisheries and Aquatic Sciences, 57, 687–698.
Witt, J. D. S., Threloff, D. L. & Hebert, P. D. N. (2006). DNAbarcoding reveals extraordinary cryptic diversity in an amphipodgenus: implications for desert spring conservation. MolecularEcology, 15, 3073–3082.
Zhang, J., Kapli, P., Pavlidis, P. & Stamatakis, A. (2013). A generalspecies delimitation method with applications to phylogeneticplacements. Bioinformatics, 29, 2869–2876.
Supporting InformationAdditional Supporting Information may be found in theonline version of this article:Fig. S1. Strict consensus cladogram build from 49 600
parsimony trees of 698 steps (left panel) and Bayesian treetopology (right panel) based on cox1 sequences of 108 spec-imens of Tethysbaena scabra from Mallorca, Menorca, Dra-gonera and Cabrera plus eight Tethysbaena species fromItaly, Morocco, Oman and the Dominican Republic.Fig. S2. Strict consensus cladogram build from 357 par-
simony trees (107 steps) based on 28S rDNA sequences of84 specimens of Tethysbaena scabra from Balearic Islandsand T. argentarii from Italy.Table S1. Pairwise distances between collecting sites.
12 ª 2016 Royal Swedish Academy of Sciences
Crypticism and phylogeography in Tethysbaena � F. C�anovas et al.