Embed Size (px)
Citation preview

Methods and Procedures | 1
PIRLS 2011 Characteristics of National Samples
AustraliaFourth GradeCoverage and Exclusions
�� Coverage�is�100�percent.
�� School-level�exclusions�consisted�of�non-mainstream�schools��(e.g.�special�education�schools),�very�small�schools�(MOS�<�5),��remote�schools,�and�schools�that�burned�down�in�Victorian�bushfires.
�� Within-school�exclusions�consisted�of�intellectually�and�physically�disabled�students,�and�English�as�a�second�language�(ESL)�students.
Sample Design�� Explicit�stratification�by�states/territories.
�� Implicit�stratification�by�geographic�location�(metropolitan,�provincial,�and�remote),�SEIFA�performance�index�(10),�and�school�type�(Catholic,�government,�and�independent).
�� Sampled�two�classrooms�per�school�and�all�of�the�indigenous�students�found�in�sampled�schools.
�� Schools�were�oversampled�to�allow�for�better�estimates�at�the��state/territory�level.
�� Student�non-response�adjustment�cells�for�the�indigenous�students�were�built�at�the�explicit�stratum�level�(with�no�modification�to�the�variance�calculation�method).
�� All�sampled�students�for�PIRLS�also�were�asked�to�take�TIMSS�at�Grade 4.

| Methods and Procedures2 | PIRLS2011ChARACteRIStICS of NAtIoNAL SAmPLeS
Exhibit 1: Allocation of School Sample in Australia, Fourth Grade
Explicit StrataTotal
Sampled Schools
Ineligible Schools
Participating SchoolsRefusal Schools
Excluded SchoolsOriginal
Schools1st
Replacements2nd
Replacements
Australian Capital Territory 30 1 29 0 0 0 0
New South Wales 45 0 40 4 0 1 0
Northern Territory 15 0 14 0 0 1 0
Queensland 45 0 44 0 0 1 0
South Australia 40 1 39 0 0 0 0
Tasmania 30 2 28 0 0 0 0
Victoria 45 2 41 1 0 1 0
Western Australia 40 0 40 0 0 0 0
Total 290 6 275 5 0 4 0
AustriaFourth GradeCoverage and Exclusions
�� Coverage�is�100�percent.
�� School-level�exclusions�consisted�of�special�education�schools�and�very�small�schools�(MOS�<�4).
�� Within-school�exclusions�consisted�of�intellectually-disabled�students,�functionally-disabled�students,�non-native�language�speakers,�and�students�with�special�needs�in�special�education�classrooms�in�regular�schools.
Sample Design�� Explicit�stratification�by�region�(Bundesland).
�� Implicit�stratification�by�district�(121).
�� Sampled�two�classrooms�per�school.
�� All�sampled�students�for�PIRLS�also�were�asked�to�take�TIMSS�at�Grade 4.

Methods and Procedures | PIRLS2011ChARACteRIStICS of NAtIoNAL SAmPLeS | 3
Exhibit 2: Allocation of School Sample in Austria, Fourth Grade
Explicit StrataTotal
Sampled Schools
Ineligible Schools
Participating SchoolsRefusal Schools
Excluded SchoolsOriginal
Schools1st
Replacements2nd
Replacements
Burgenland 5 0 5 0 0 0 0
Kärnten 11 0 11 0 0 0 0
Niederösterreich 31 0 31 0 0 0 0
Oberösterreich 29 0 29 0 0 0 0
Salzburg 11 0 11 0 0 0 0
Steiermark 22 0 21 0 0 0 1
Tirol 14 0 14 0 0 0 0
Vorarlberg 8 0 8 0 0 0 0
Wien 29 0 28 0 0 0 1
Total 160 0 158 0 0 0 2
AzerbaijanFourth GradeCoverage and Exclusions
�� Coverage�is�100�percent.
�� School-level�exclusions�consisted�of�schools�where�students�are�taught�in�languages�other�than�Azeri�or�Russian,�very�small�schools�(MOS�<�5),�and�special�education�schools.
�� Also�excluded�were�students�taught�in�Armenian�community�schools�in�Nagorno-Karabakh�conflict�zone�(due�to�lack�of�access,�students�taught�in�Azeri�community�schools�were�in�the�sample�frame�under�“refugee�schools”)�and�students�in�international�schools�(TISA�and�BAKU)�for�which�no�statistics�were�available.�As�a�result,�exclusion�rates�are�biased�downward.
�� Within-school�exclusions�consisted�of�students�with�special�educational�needs�and�students�taught�in�languages�other�than�Azeri�or�Russian.
Sample Design�� Explicit�stratification�by�national�examination�score.
�� Implicit�stratification�by�geographic�sub�index�(Baku,�Baku�suburb,�refugee�school,�regional�center�school,�and�village�school),�and�performance�level�on�national�examination�(11).�If�the�national�

| Methods and Procedures4 | PIRLS2011ChARACteRIStICS of NAtIoNAL SAmPLeS
examination�score�of�the�school�was�unknown�(missing),�the�implicit�stratification�took�into�account�the�school�type�(gymnasium�and�lyceum,�basic�and�elementary,�and�secondary�school).
�� Sampled�two�classrooms�per�school.
�� All�sampled�students�for�PIRLS�also�were�asked�to�take�TIMSS�at�Grade 4.
Exhibit 3: Allocation of School Sample in Azerbaijan, Fourth Grade
Explicit StrataTotal
Sampled Schools
Ineligible Schools
Participating SchoolsRefusal Schools
Excluded SchoolsOriginal
Schools1st
Replacements2nd
Replacements
Low Performance 40 0 26 12 2 0 0
Medium Performance 30 0 22 6 2 0 0
High Performance 78 0 74 4 0 0 0
Unknown Performance 22 1 20 1 0 0 0
Total 170 1 142 23 4 0 0
Belgium(french)Fourth GradeCoverage and Exclusions
�� Coverage�is�100�percent.�
�� School-level�exclusions�consisted�of�schools�for�disabled�children�and�hospitalized�children,�and�very�small�schools�(MOS�<�5).
�� Within-school�exclusions�consisted�of�children�with�less�than�one�year�of�instruction�in�French.
Sample Design�� Explicit�stratification�by�school�type.
�� Implicit�stratification�by�region�(Brabant�Wallon,�Bruxelles�Capitale,�Hainaut,�Liege,�Luxembourg,�and�Namur).
�� Sampled�two�classrooms�per�school�in�larger�schools�(MOS�>�35).

Methods and Procedures | PIRLS2011ChARACteRIStICS of NAtIoNAL SAmPLeS | 5
Exhibit 4: Allocation of School Sample in Belgium (French), Fourth Grade
Explicit StrataTotal
Sampled Schools
Ineligible Schools
Participating SchoolsRefusal Schools
Excluded SchoolsOriginal
Schools1st
Replacements2nd
Replacements
Local Board Public Network Schools 73 0 64 4 0 5 0
Private Dependent Schools 64 0 41 8 0 15 0
Public Schools 13 0 10 0 0 3 0
Total 150 0 115 12 0 23 0
BotswanaSixth Grade (PIRLS)Coverage and Exclusions
�� Coverage�is�100�percent.
�� School-level�exclusions�consisted�of�special�education�schools.
�� No�within-school�exclusions.
�� The�same�sample�of�schools�was�used�for�both�prePIRLS�and�PIRLS.
Sample Design�� Explicit�stratification�by�inspectoral�region.
�� Implicit�stratification�by�performance�level�(high,�medium,�low,�and�unknown).
�� The�school�measure�of�size�(MOS)�was�given�by�the�number�of�Grade�4�students�found�in�schools�(Grade�4�and�Grade�6�students�all�attend�the�same�schools).
�� School�sample�overlap�between�prePIRLS�(Grade�4),�TIMSS�(Grade 6),�PIRLS�(Grade�6),�and�TIMSS�(Grade�9):�1)�Samples�were�drawn�all�at�once;�2)�All�sampled�schools�were�asked�to�participate�in�all�studies;�and�3)�All�sampled�students�for�PIRLS�at�Grade�6�also�were�asked�to�take TIMSS.

| Methods and Procedures6 | PIRLS2011ChARACteRIStICS of NAtIoNAL SAmPLeS
Exhibit 5: Allocation of School Sample in Botswana, Sixth Grade
Explicit StrataTotal
Sampled Schools
Ineligible Schools
Participating SchoolsRefusal Schools
Excluded SchoolsOriginal
Schools1st
Replacements2nd
Replacements
Central North 25 1 24 0 0 0 0
Central South 28 0 28 0 0 0 0
North 14 0 14 0 0 0 0
South 24 0 24 0 0 0 0
South Central 43 0 43 0 0 0 0
West 16 0 16 0 0 0 0
Total 150 1 149 0 0 0 0
BulgariaFourth GradeCoverage and Exclusions
�� Coverage�is�100�percent.
�� School-level�exclusions�consisted�of�special�education�schools�and�very�small�schools�(MOS�<�5).
�� No�within-school�exclusions.
Sample Design�� Explicit�stratification�by�school�type.
�� Implicit�stratification�by�location�(capital,�large�city,�and�“other”)�and�region�(28).
�� Sampled�two�classrooms�per�school.
Exhibit 6: Allocation of School Sample in Bulgaria, Fourth Grade
Explicit StrataTotal
Sampled Schools
Ineligible Schools
Participating SchoolsRefusal Schools
Excluded SchoolsOriginal
Schools1st
Replacements2nd
Replacements
Basic 83 2 77 4 0 0 0
Elementary 13 0 13 0 0 0 0
General 54 1 52 1 0 0 0
Total 150 3 142 5 0 0 0

Methods and Procedures | PIRLS2011ChARACteRIStICS of NAtIoNAL SAmPLeS | 7
CanadaFourth GradeCoverage and Exclusions
�� Coverage�is�100�percent.
�� School-level�exclusions�consisted�of�very�small�schools�(MOS�<�7�in�Alberta,�MOS�<�10�in�Québec,�and�MOS�<�6�for�the�rest�of�the�country),�non-Ministry�schools�(in�Québec),�special�needs�schools,�private�schools,�band-operated�schools�(First�Nations�and�Native�schools),�distance�learning�schools,�not�funded�schools,�schools�from�Yukon�and�other�territories,�and�schools�from�New�Brunswick�where�students�are�taught�in�English.
�� Within-school�exclusions�consisted�of�students�with�special�needs�and�students�who�do�not�speak�English�or�French.
Sample�Design�� Explicit�stratification�by�province,�English/French�school�type,�school�board�within�Nova�Scotia,�“Grade�4”�/�“Grade�4�&�Grade�8”�school�type,�and�school�size�within�Alberta.
�� Implicit�stratification�by�independent/public�school,�program�(English,�French,�and�immersion),�region�(6�in�Ontario,�and�5�elsewhere),�school�type�in�Ontario�(Catholic,�private,�Protestant�separate,�and�public),�immersion�status�(yes/no),�and�Native�status�(yes/no).
�� Census�of�all�schools�in�some�explicit�strata.�
�� Sampled�two�classrooms�in�large�schools�and�in�the�census�strata.
�� All�variance�estimates�from�the�census�strata�were�derived�using�schools�as�variance�strata.
�� Oversampling�in�the�provinces�of�British�Columbia,�Alberta,�Ontario,�Québec,�New�Brunswick,�Newfoundland,�and�Nova�Scotia.
�� Controlled�for�school�sample�overlap:�more�details�available�in�the�Alberta,�Ontario,�and�Québec�sections�at�the�end�of�this�document

| Methods and Procedures8 | PIRLS2011ChARACteRIStICS of NAtIoNAL SAmPLeS
Exhibit 7: Allocation of School Sample in Canada, Fourth Grade
Explicit StrataTotal
Sampled Schools
Ineligible Schools
Participating SchoolsRefusal Schools
Excluded SchoolsOriginal
Schools1st
Replacements2nd
Replacements
British Columbia – English 131 0 128 1 0 2 0
British Columbia – French 19 0 19 0 0 0 0
Manitoba 6 0 6 0 0 0 0
New Brunswick – French 73 0 73 0 0 0 0
Newfoundland 153 1 151 0 0 1 0
Saskatchewan 6 0 6 0 0 0 0
Nova Scotia – English51 33 0 33 0 0 0 0
Nova Scotia – English52 16 0 16 0 0 0 0
Nova Scotia – English53 26 0 26 0 0 0 0
Nova Scotia – English54 50 0 50 0 0 0 0
Nova Scotia – English55 27 0 27 0 0 0 0
Nova Scotia – English58 17 0 17 0 0 0 0
Nova Scotia – English59 18 0 18 0 0 0 0
Nova Scotia – French 57 17 1 16 0 0 0 0
Grade 4 only – Ontario – English 39 0 38 0 0 0 1
Grade 4 only – Ontario – French 53 3 49 0 0 1 0
Grade 4 & Grade 8 – Ontario – English 81 4 74 1 0 1 1
Grade 4 & Grade 8 – Ontario – French 27 0 27 0 0 0 0
Grade 4 only – Québec – French 114 0 108 1 0 5 0
Grade 4 only – Québec – English 70 2 65 0 0 2 1
Grade 4 & Grade 8 – Québec – French 6 0 6 0 0 0 0
Grade 4 & Grade 8 – Québec – English 10 0 10 0 0 0 0
Grade 4 only – Alberta – Big 71 1 69 0 0 1 0
Grade 4 only – Alberta – Small 36 1 34 0 0 1 0
Grade 4 & Grade 8 – Alberta – Big 22 1 21 0 0 0 0
Grade 4 & Grade 8 – Alberta – Small 21 0 19 2 0 0 0
Total 1142 14 1106 5 0 14 3

Methods and Procedures | PIRLS2011ChARACteRIStICS of NAtIoNAL SAmPLeS | 9
ChinesetaipeiFourth GradeCoverage and Exclusions
�� Coverage�is�100�percent.
�� School-level�exclusions�consisted�of�special�needs�schools�and�schools�severely�damaged�in�typhoon�Mokrak.
�� No�within-school�exclusions.
Sample Design�� Explicit�stratification�by�region.
�� No�implicit�stratification.
�� Sampled�two�classrooms�in�large�schools�(more�than�18�classrooms�in�school).
�� School�sample�overlap�between�TIMSS�(Grade�4)�and�PIRLS:�1)�Samples�were�drawn�all�at�once;�2)�All�sampled�schools�for�PIRLS�were�asked�to�participate�in�TIMSS;�and�3)�All�sampled�students�for�PIRLS�also�were�asked�to�take�TIMSS.
Exhibit 8: Allocation of School Sample in Chinese Taipei, Fourth Grade
Explicit StrataTotal
Sampled Schools
Ineligible Schools
Participating SchoolsRefusal Schools
Excluded SchoolsOriginal
Schools1st
Replacements2nd
Replacements
North 66 0 66 0 0 0 0
Middle 40 0 40 0 0 0 0
South 39 0 39 0 0 0 0
East 3 0 3 0 0 0 0
Isolated Islands 2 0 2 0 0 0 0
Total 150 0 150 0 0 0 0
ColombiaFourth Grade (PIRLS)Coverage and Exclusions
�� Coverage�is�100�percent.
�� School-level�exclusions�consisted�of�very�small�schools�(MOS�<�3).
�� Within-school�exclusions�consisted�of�students�with�a�mental�disability,�and�students�who�attend�evening�or�weekend�classes.

| Methods and Procedures10 | PIRLS2011ChARACteRIStICS of NAtIoNAL SAmPLeS
Sample Design�� Explicit�stratification�by�school�MOS�(known�and�unknown),��urban/rural�status,�and�private/public�status.
�� Implicit�stratification�by�states�or�performance�level�(42).
�� Sampled�one�classroom�per�school.
�� In�the�first�four�explicit�strata,�triplets�of�schools�were�sampled�(SRS)�instead�of�schools�being�sampled�individually.�Within�each�triplet,�a�school�was�sampled�among�the�eligible�schools.�Weights�were�derived�accordingly�(note�that�the�notion�of�replacements�did�not�apply�for�these�strata).
�� School�sample�overlap�between�prePIRLS�and�PIRLS:�1)�Samples�were�drawn�all�at�once;�2)�All�sampled�schools�for�prePIRLS�were�asked�to�participate�in�PIRLS;�and�3)�All�sampled�students�for�prePIRLS�also�were�asked�to�take�PIRLS.
Exhibit 9: Allocation of School Sample in Colombia, Fourth Grade
Explicit StrataTotal
Sampled Schools
Ineligible Schools
Participating SchoolsRefusal Schools
Excluded SchoolsOriginal
Schools1st
Replacements2nd
Replacements
Schools with no MOS – Urban – Public 2 0 2 0 0 0 0
Schools with no MOS – Rural – Private 2 0 2 0 0 0 0
Schools with no MOS – Rural – Public 2 0 1 0 0 1 0
Schools with MOS – Urban – Private 28 1 24 3 0 0 0
Schools with MOS – Urban – Public 78 2 67 7 2 0 0
Schools with MOS – Rural – Private 2 0 1 0 1 0 0
Schools with MOS – Rural – Public 43 2 34 3 3 1 0
Total 157 5 131 13 6 2 0

Methods and Procedures | PIRLS2011ChARACteRIStICS of NAtIoNAL SAmPLeS | 11
CroatiaFourth GradeCoverage and Exclusions
�� Coverage�is�100�percent.
�� School-level�exclusions�consisted�of�very�small�schools�(MOS�<�6),�hospital�schools,�schools�for�minority�groups�(language�and�writing,�and�models�A�and�B),�schools�in�which�the�majority�of�the�classes�are�composed�of�solely�Roma�children,�and�private�elementary�schools.
�� Within-school�exclusions�consisted�of�students�with�special�needs�and�special�program�teaching.
Sample Design�� Explicit�stratification�by�school�type.
�� Implicit�stratification�by�region�(Središnja,�Istocna,�Sjeverna,�Zapadna,�Južna,�and�Zagreb)�or�area�(21).
�� Sampled�two�classrooms�in�large�schools�in�the�“One�Building�School”�stratum�(MOS�>�90)�and�sampled�two�classrooms�in�each�sampled�school�in�the�“Multiple�Building�School”�and�“Minority�School”�strata.
�� Satellite�schools�of�mother�schools�were�treated�as�classrooms�of�the�mother�school�for�purposes�of�sampling.
�� School�sample�overlap�between�TIMSS�(Grade�4)�and�PIRLS:�1)�Samples�were�drawn�all�at�once;�2)�All�sampled�schools�for�PIRLS�also�participated�in�TIMSS;�and�3)�All�sampled�students�for�PIRLS�also�were�asked�to�take�TIMSS.
Exhibit 10: Allocation of School Sample in Croatia, Fourth Gradee
Explicit StrataTotal
Sampled Schools
Ineligible Schools
Participating SchoolsRefusal Schools
Excluded SchoolsOriginal
Schools1st
Replacements2nd
Replacements
One Building School 59 0 57 2 0 0 0
Multiple Building School 91 0 91 0 0 0 0
Minority School 2 0 2 0 0 0 0
Total 152 0 150 2 0 0 0
| Methods and Procedures12 | PIRLS2011ChARACteRIStICS of NAtIoNAL SAmPLeS
CzechRepublicFourth GradeCoverage and Exclusions�
�� Coverage�is�100�percent.�
�� School-level�exclusions�consisted�of�special�education�schools,�Polish�language�schools,�and�very�small�schools�(MOS�<�3�in�Grade�4).
�� Within-school�exclusions�consisted�of�students�with�special�educational�needs.
Sample Design�� Explicit�stratification�by�extended�education�status.
�� Implicit�stratification�by�region�(14).
�� Sampled�two�classrooms�in�the�“extended�education�of�languages”�stratum.�All�variance�estimates�from�this�stratum�were�derived�using�schools�as�variance�strata.
�� Oversampling�in�the�“extended�education�of�languages”�stratum.
�� School�sample�overlap�between�TIMSS�(Grade�4)�and�PIRLS:�1)�Samples�were�drawn�all�at�once;�2)�All�sampled�schools�for�PIRLS�also�were�sampled�for�TIMSS;�and�3)�All�sampled�students�for�PIRLS�also�were�asked�to�take�TIMSS.
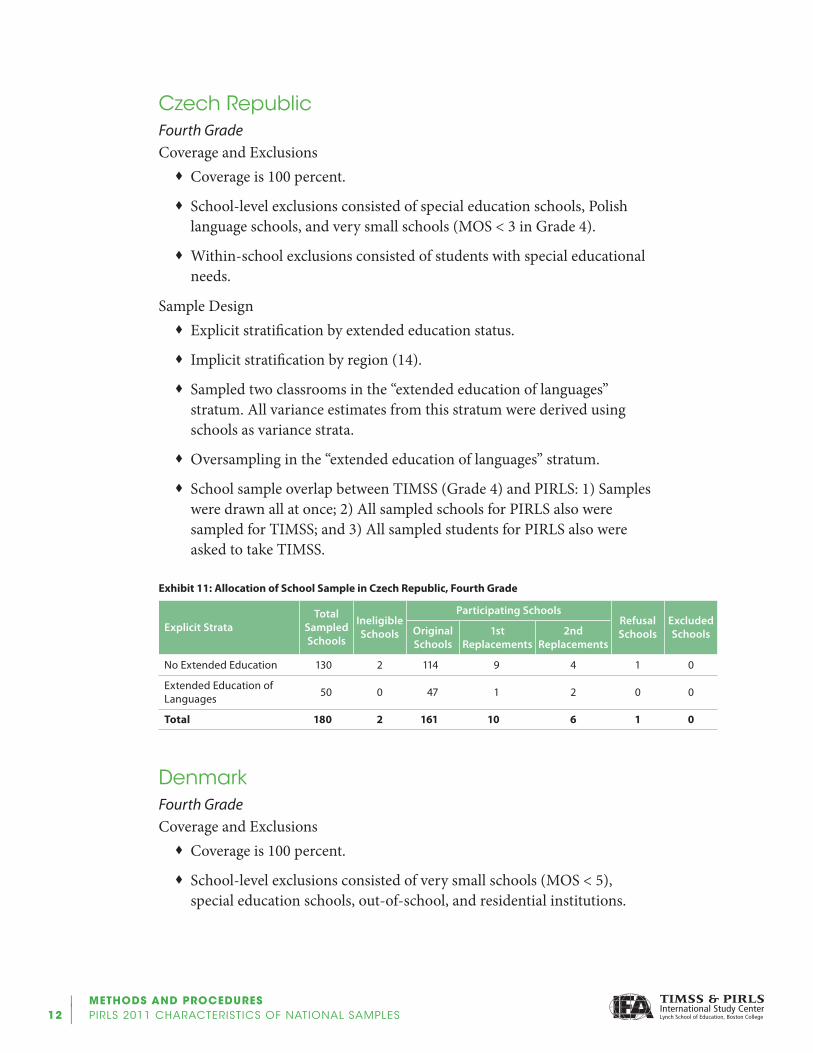
Exhibit 11: Allocation of School Sample in Czech Republic, Fourth Grade
Explicit StrataTotal
Sampled Schools
Ineligible Schools
Participating SchoolsRefusal Schools
Excluded SchoolsOriginal
Schools1st
Replacements2nd
Replacements
No Extended Education 130 2 114 9 4 1 0
Extended Education of Languages 50 0 47 1 2 0 0
Total 180 2 161 10 6 1 0
DenmarkFourth GradeCoverage and Exclusions
�� Coverage�is�100�percent.
�� School-level�exclusions�consisted�of�very�small�schools�(MOS�<�5),�special�education�schools,�out-of-school,�and�residential�institutions.

Methods and Procedures | PIRLS2011ChARACteRIStICS of NAtIoNAL SAmPLeS | 13
�� Within-school�exclusions�consisted�of�students�with�special�educational�needs.
Sample Design�� Explicit�stratification�by�public/private�status.�
�� No�implicit�stratification.
�� Sampled�one�classroom�per�school�in�most�schools.�
�� School�sample�overlap�between�TIMSS�(Grade�4)�and�PIRLS:�1)�Samples�were�drawn�all�at�once;�and�2)�No�school�sample�overlap�between�PIRLS�and�TIMSS.
Exhibit 12: Allocation of School Sample in Denmark, Fourth Grade
Explicit StrataTotal
Sampled Schools
Ineligible Schools
Participating SchoolsRefusal Schools
Excluded SchoolsOriginal
Schools1st
Replacements2nd
Replacements
Private 30 0 22 6 0 2 0
Public 210 4 185 18 1 2 0
Total 240 4 207 24 1 4 0
englandFourth Grade (Year 5)Coverage and Exclusions
�� Coverage�is�100�percent.
�� School-level�exclusions�consisted�of�special�schools�and�very�small�schools�(MOS�<�8).
�� Within-school�exclusions�consisted�of�students�with�significant�special�educational�needs.
Sample Design�� Explicit�stratification�by�“Year�5”�/�“Year�5�&�Year�9”�schools.
�� Implicit�stratification�by�attainment�level�(low,�low�to�medium,�medium,�medium�to�high,�high,�and�unknown),�and�school�type�(primary,�junior,�middle,�independent,�and�unknown).
�� Sampled�two�classrooms�in�large�schools�(MOS�>�85).
�� Response�adjustment�cells�were�built�using�attainment�status.

| Methods and Procedures14 | PIRLS2011ChARACteRIStICS of NAtIoNAL SAmPLeS
�� School�sample�overlap�between�TIMSS�(Year�5),�PIRLS,�and�TIMSS�(Year�9):�1)�Samples�were�drawn�all�at�once;�and�2)�No�school�sample�overlap�between�these�three�studies.
Exhibit 13: Allocation of School Sample in England, Fourth Grade
Explicit StrataTotal
Sampled Schools
Ineligible Schools
Participating SchoolsRefusal Schools
Excluded SchoolsOriginal
Schools1st
Replacements2nd
Replacements
Year 5 only 146 2 106 9 10 19 0
Year 5 & Year 9 4 0 3 0 1 0 0
Total 150 2 109 9 11 19 0
finlandFourth GradeCoverage and Exclusions
�� Coverage�is�100�percent.
�� School-level�exclusions�consisted�of�special�education�schools�and�language�schools�(instructional�language�not�Finnish�or�Swedish).
�� Within-school�exclusions�consisted�of�students�with�dyslexia�or�other�severe�linguistic�disorders,�intellectually�disabled�students,�functionally�disabled�students,�and�students�with�limited�proficiency�in�the�assessment�language.
Sample Design�� Explicit�stratification�by�major�region�and�urban�&�semi-urban/rural�status.
�� No�implicit�stratification.
�� Sampled�two�classrooms�per�school.�
�� School�sample�overlap�between�TIMSS�(Grade�4)�and�PIRLS:�1)�Samples�were�drawn�all�at�once;�2)�All�sampled�schools�for�PIRLS�also�were�sampled�for�TIMSS;�and�3)�All�sampled�students�for�PIRLS�also�were�asked�to�take�TIMSS.

Methods and Procedures | PIRLS2011ChARACteRIStICS of NAtIoNAL SAmPLeS | 15
Exhibit 14: Allocation of School Sample in Finland, Fourth Grade
Explicit StrataTotal
Sampled Schools
Ineligible Schools
Participating SchoolsRefusal Schools
Excluded SchoolsOriginal
Schools1st
Replacements2nd
Replacements
Southern Finland – Urban & Semi-urban 61 0 59 2 0 0 0
Southern Finland – Rural 8 0 8 0 0 0 0
Western Finland – Urban & Semi-urban 27 0 26 1 0 0 0
Western Finland – Rural 7 0 7 0 0 0 0
Eastern Finland – Urban & Semi-urban 11 0 11 0 0 0 0
Eastern Finland – Rural 7 1 5 0 0 1 0
Northern Finland – Urban & Semi-urban 15 1 13 1 0 0 0
Northern Finland – Rural 5 0 5 0 0 0 0
Swedish Speaking – Urban & Semi-urban 6 1 5 0 0 0 0
Swedish Speaking – Rural 3 1 2 0 0 0 0
Total 150 4 141 4 0 1 0
franceFourth GradeCoverage and Exclusions
�� Coverage�is�100�percent.
�� School-level�exclusions�consisted�of�overseas�territories�(TOM),�La�Réunion�(Southern�hemisphere),�Guyane�(isolated),�very�small�schools�(MOS�<�3),�private�schools�without�contracts,�specialized�schools,�and�French�schools�in�foreign�countries.
�� No�within-school�exclusions.
Sample Design�� Explicit�stratification�by�school�size.
�� Implicit�stratification�by�school�type�(public–priority�education�zone,�public–other,�and�private).
�� Sampled�two�classrooms�per�school.

| Methods and Procedures16 | PIRLS2011ChARACteRIStICS of NAtIoNAL SAmPLeS
Exhibit 15: Allocation of School Sample in France, Fourth Grade
Explicit StrataTotal
Sampled Schools
Ineligible Schools
Participating SchoolsRefusal Schools
Excluded SchoolsOriginal
Schools1st
Replacements2nd
Replacements
Large Schools 120 0 119 1 0 0 0
Small Schools 55 0 51 3 0 1 0
Total 175 0 170 4 0 1 0
GeorgiaFourth GradeCoverage and Exclusions
�� Coverage�is�91�percent.�Coverage�in�Georgia�was�restricted�to�students�whose�language�of�instruction�is�Georgian�(91%�of�the�international�target�population).
�� School-level�exclusions�consisted�of�special�needs�schools�and�very�small�schools�(MOS�<�4).�Schools�from�South�Ossetia�also�were�excluded�along�with�schools�from�Abkhazia�(no�physical�access,�and�no�official�statistics).�However,�Abkhazia�refugee�schools�functioning�in�other�territories�of�Georgia�were�part�of�the�sample�frame.�As�a�result,�exclusion�rates�are�biased�downward.
�� Within-school�exclusions�consisted�of�specialized�schools�for�disabled�students.
Sample Design�� Explicit�stratification�by�region�and��“Grade�4”�/�“Grade�4�&�Grade�8”�school�type.
�� Implicit�stratification�by�state/private�status,�and�highland/town/village�status.
�� Sampled�two�classrooms�in�large�schools�(MOS�>�50).
�� School�sample�overlap�between�TIMSS�(Grade�4),�PIRLS,�and�TIMSS�(Grade�8):�1)�Samples�were�drawn�all�at�once;�2)�All�sampled�schools�in�the�“Grade�4�&�Grade�8”�stratum�were�asked�to�participate�in�all�studies;�and�3)�All�sampled�students�for�PIRLS�also�were�asked�to�take�TIMSS�at�Grade�4.

Methods and Procedures | PIRLS2011ChARACteRIStICS of NAtIoNAL SAmPLeS | 17
Exhibit 16: Allocation of School Sample in Georgia, Fourth Grade
Explicit StrataTotal
Sampled Schools
Ineligible Schools
Participating SchoolsRefusal Schools
Excluded SchoolsOriginal
Schools1st
Replacements2nd
Replacements
Grade 4 only 2 0 2 0 0 0 0
Grade 4 & Grade 8 – qvemo qarTli 14 1 13 0 0 0 0
Grade 4 & Grade 8 – aWara 20 0 19 1 0 0 0
Grade 4 & Grade 8 – afxazeTi – ltolvilebi 2 0 2 0 0 0 0
Grade 4 & Grade 8 – guria 6 0 6 0 0 0 0
Grade 4 & Grade 8 – imereTi 28 0 25 0 0 3 0
Grade 4 & Grade 8 – kaxeTi 14 0 13 0 0 1 0
Grade 4 & Grade 8 – mcxeTa-mTianeTi 5 0 5 0 0 0 0
Grade 4 & Grade 8 – raWa-leGxumi da qvemo svaneTi 2 0 2 0 0 0 0
Grade 4 & Grade 8 – samcxe-javaxeTi 5 0 5 0 0 0 0
Grade 4 & Grade 8 – Sida qarTli 14 0 14 0 0 0 0
Grade 4 & Grade 8 – Tbilisi 50 2 48 0 0 0 0
Grade 4 & Grade 8 – samegrelo-zemo svaneTi 18 0 18 0 0 0 0
Total 180 3 172 1 0 4 0
GermanyFourth GradeCoverage and Exclusions
�� Coverage�is�100�percent.
�� School-level�exclusions�consisted�of�schools�for�children�with�special�needs�(mentally�disabled,�physically�disabled,�visual�impairment,�hearing�impairment,�autism,�and�long-term�sickness).
�� Within-school�exclusions�consisted�of�children�with�special�needs�in�regular�schools.
Sample Design�� Explicit�stratification�by�federal�state.
�� Implicit�stratification�by�regional�subdivision�(30),�and�school�type�(Grundschule,�Freie�Waldorfschule,�and�Förderschule).

| Methods and Procedures18 | PIRLS2011ChARACteRIStICS of NAtIoNAL SAmPLeS
�� Sampled�one�classroom�per�school.
�� School�sample�overlap�between�PIRLS�and�TIMSS�(Grade�4):�1)�Samples�were�drawn�all�at�once;�and�2)�All�sampled�students�for�PIRLS�also�were�asked�to�take�TIMSS.
Exhibit 17: Allocation of School Sample in Germany, Fourth Grade
Explicit StrataTotal
Sampled Schools
Ineligible Schools
Participating SchoolsRefusal Schools
Excluded SchoolsOriginal
Schools1st
Replacements2nd
Replacements
Baden-Württemberg 29 0 26 2 0 1 0
Bayern 32 0 32 0 0 0 0
Berlin 7 0 6 0 0 0 1
Brandenburg 5 0 5 0 0 0 0
Bremen 2 0 2 0 0 0 0
Hamburg 4 0 4 0 0 0 0
Hessen 15 0 15 0 0 0 0
Mecklenburg-Vorpommern 3 0 3 0 0 0 0
Niedersachsen 21 0 19 2 0 0 0
Nordrhein-Westfalen 47 0 44 2 0 1 0
Rheinland-Pfalz 10 0 10 0 0 0 0
Saarland 2 0 2 0 0 0 0
Sachsen 8 0 8 0 0 0 0
Sachsen-Anhalt 4 0 4 0 0 0 0
Schleswig-Holstein 7 0 6 1 0 0 0
Thüringen 4 0 4 0 0 0 0
Total 200 0 190 7 0 2 1
hondurasSixth GradeCoverage and Exclusions
�� Coverage�is�100�percent.
�� School-level�exclusions�consisted�of�very�small�schools�(MOS�<�5),�and�schools�with�different�curriculum/schedule.
�� No�within-school�exclusions.
Sample Design�� Explicit�stratification�by�“Grade�6”�/�“Grade�6�&�Grade�9”�schools,�public/private�status,�and�urban/rural�status.

Methods and Procedures | PIRLS2011ChARACteRIStICS of NAtIoNAL SAmPLeS | 19
�� Implicit�stratification�by�school�type�(municipal,�official,�urban,�rural,�and�semi-public),�geographic�area�(18),�and�urban/private�status.
�� Sampled�two�classrooms�per�school�in�large�schools�(MOS�>�125).
�� The�school�measure�of�size�(MOS)�was�given�by�the�number�of�Grade�4�students�found�in�schools�(Grade�4�and�Grade�6�students�all�attended�the�same�schools).�
�� School�sample�overlap�between�TIMSS�(Grade�6),�PIRLS,�and�TIMSS�(Grade�9):�1)�Samples�were�drawn�all�at�once;�2)�All�sampled�schools�in�the�“Grade�6�&�Grade�9”�stratum�were�asked�to�participate�in�TIMSS�at�Grade�9�(a�subset�of�these�schools�was�also�asked�to�participate�in�both�PIRLS�and�TIMSS�at�Grade�6);�and�3)�All�sampled�students�for�PIRLS�also�were�asked�to�take�TIMSS�at�Grade�6.
Exhibit 18: Allocation of School Sample between Studies in Honduras
Explicit StrataTotal
Sampled Schools
Allocation of Schools
To PIRLSGrade 6
To TIMSSGrade 6
To TIMSSGrade 9
Grade 6 only 120 120 120 0
Grade 6 & Grade 9 50 32 32 50
Grade 9 only 110 0 0 110
Total 280 152 152 160
Exhibit 19: Allocation of School Sample in Honduras, Sixth Grade
Explicit StrataTotal
Sampled Schools
Ineligible Schools
Participating SchoolsRefusal Schools
Excluded SchoolsOriginal
Schools1st
Replacements2nd
Replacements
Grade 6 only – Public Urban 42 1 34 4 2 0 1
Grade 6 only – Public Rural 71 3 65 3 0 0 0
Grade 6 only – Private 7 0 5 2 0 0 0
Grade 6 & Grade 9 – Public Urban 10 0 9 1 0 0 0
Grade 6 & Grade 9 – Public Rural 17 0 16 1 0 0 0
Grade 6 & Grade 9 – Private 5 0 4 0 1 0 0
Total 152 4 133 11 3 0 1

| Methods and Procedures20 | PIRLS2011ChARACteRIStICS of NAtIoNAL SAmPLeS
hongKongFourth GradeCoverage and Exclusions
�� Coverage�is�100�percent.
�� School-level�exclusions�consisted�of�non-native�language�speaker�schools,�schools�with�different�curriculum,�international�schools,�special�schools,�and�schools�expected�to�be�closing�before�data�collection.�
�� Within-school�exclusions�consisted�of�non-native�language�speakers�under�inclusive�education�scheme.
Sample Design�� Explicit�stratification�by�school�type�and�session�(am/pm/day).
�� Implicit�stratification�by�school�gender�(boys,�co-educational,�or�girls).
�� Sampled�one�classroom�per�school.
�� School�sample�overlap�between�TIMSS�(Grade�4)�and�PIRLS:�1)�Samples�were�drawn�all�at�once;�2)�All�sampled�schools�for�PIRLS�also�were�sampled�for�TIMSS;�and�3)�All�sampled�students�for�PIRLS�also�were�asked�to�take�TIMSS.
Exhibit 20: Allocation of School Sample in Hong Kong, Fourth Grade
Explicit StrataTotal
Sampled Schools
Ineligible Schools
Participating SchoolsRefusal Schools
Excluded SchoolsOriginal
Schools1st
Replacements2nd
Replacements
Aided – Whole day 117 0 105 2 0 10 0
Aided – AM 4 0 3 0 0 1 0
Aided – PM 3 0 3 0 0 0 0
Direct Subsidy 6 0 5 0 0 1 0
Government 11 0 7 0 0 4 0
Private 9 0 7 0 0 2 0
Total 150 0 130 2 0 18 0

Methods and Procedures | PIRLS2011ChARACteRIStICS of NAtIoNAL SAmPLeS | 21
hungaryFourth GradeCoverage and Exclusions
�� Coverage�is�100�percent.
�� School-level�exclusions�consisted�of�special�schools�for�students�with�special�educational�needs,�very�small�schools�(MOS�<�5�in�both�Grade�4�and�Grade�8),�and�students�taught�in�a�foreign�language.
�� Within-school�exclusions�consisted�of�students�with�special�educational�needs.
Sample Design�� Explicit�stratification�by�type�of�community�and�“Grade�4”�/�“Grade�4�&�Grade�8”�school�type.
�� Implicit�stratification�by�geographic�region�(Del-Alfold,�Del-Dunantul,�Kozep-Dunantul,�Kozep-Magyarorszag,�Nyugat-Dunantul,�Eszak-Alfold,�and�Eszak-Magyarorszag).
�� Sampled�two�classrooms�per�school.
�� School�sample�overlapped�between�TIMSS�(Grade�4),�PIRLS,�and�TIMSS�(Grade�8):�1)�Samples�were�drawn�all�at�once;�2)�All�sampled�schools�in�the�“Grade�4�&�Grade�8”�stratum�were�asked�to�participate�in�all�studies;�and�3)�All�sampled�students�for�PIRLS�also�were�asked�to�take�TIMSS�at�Grade�4.
Exhibit 21: Allocation of School Sample between Studies in Hungary
Explicit StrataTotal
Sampled Schools
Allocation of Schools
To PIRLSGrade 4
To TIMSSGrade 4
To TIMSSGrade 8
Grade 4 only 22 22 22 0
Grade 4 & Grade 8 128 128 128 128
Grade 8 only 22 0 0 22
Total 172 150 150 150
| Methods and Procedures22 | PIRLS2011ChARACteRIStICS of NAtIoNAL SAmPLeS
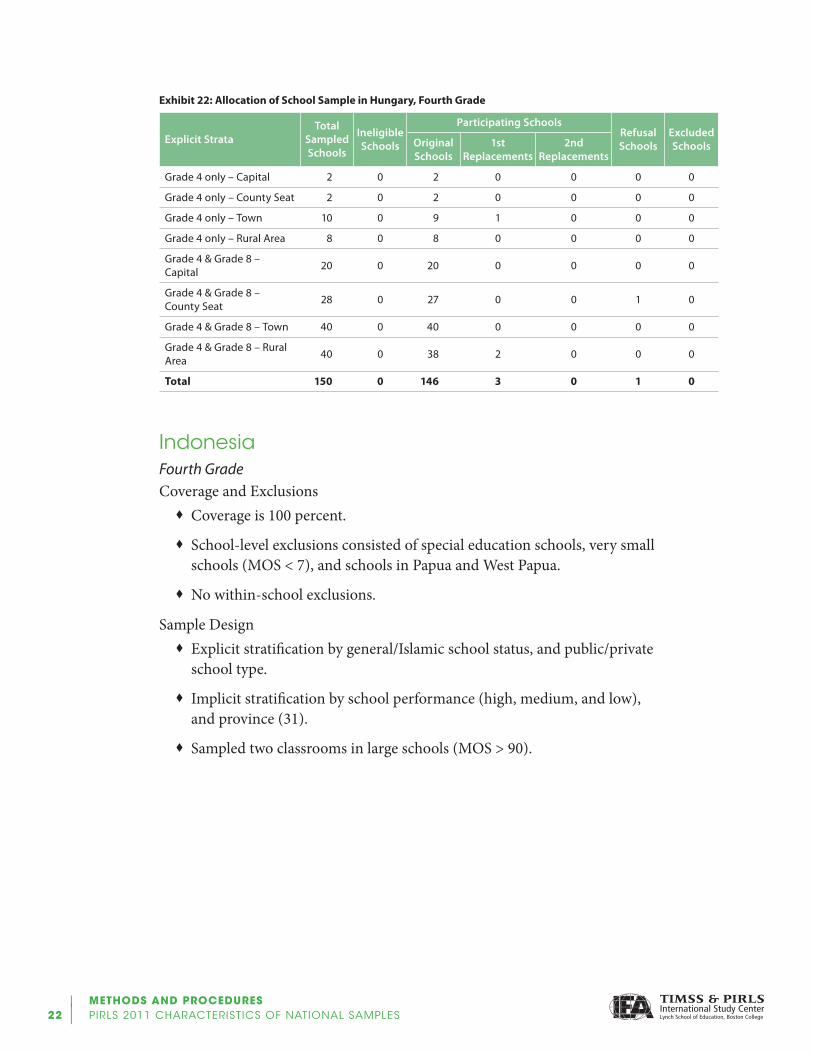
Exhibit 22: Allocation of School Sample in Hungary, Fourth Grade
Explicit StrataTotal
Sampled Schools
Ineligible Schools
Participating SchoolsRefusal Schools
Excluded SchoolsOriginal
Schools1st
Replacements2nd
Replacements
Grade 4 only – Capital 2 0 2 0 0 0 0
Grade 4 only – County Seat 2 0 2 0 0 0 0
Grade 4 only – Town 10 0 9 1 0 0 0
Grade 4 only – Rural Area 8 0 8 0 0 0 0
Grade 4 & Grade 8 – Capital 20 0 20 0 0 0 0
Grade 4 & Grade 8 – County Seat 28 0 27 0 0 1 0
Grade 4 & Grade 8 – Town 40 0 40 0 0 0 0
Grade 4 & Grade 8 – Rural Area 40 0 38 2 0 0 0
Total 150 0 146 3 0 1 0
IndonesiaFourth GradeCoverage and Exclusions
�� Coverage�is�100�percent.
�� School-level�exclusions�consisted�of�special�education�schools,�very�small�schools�(MOS�<�7),�and�schools�in�Papua�and�West�Papua.
�� No�within-school�exclusions.
Sample Design�� Explicit�stratification�by�general/Islamic�school�status,�and�public/private�school�type.
�� Implicit�stratification�by�school�performance�(high,�medium,�and�low),�and�province�(31).
�� Sampled�two�classrooms�in�large�schools�(MOS�>�90).

Methods and Procedures | PIRLS2011ChARACteRIStICS of NAtIoNAL SAmPLeS | 23
Exhibit 23: Allocation of School Sample in Indonesia, Fourth Grade
Explicit StrataTotal
Sampled Schools
Ineligible Schools
Participating SchoolsRefusal Schools
Excluded SchoolsOriginal
Schools1st
Replacements2nd
Replacements
Public – General 126 0 126 0 0 0 0
Public – Islamic 2 0 2 0 0 0 0
Private – General 14 0 14 0 0 0 0
Private – Islamic 16 0 16 0 0 0 0
Total 158 0 158 0 0 0 0
Iran,IslamicRepublicofFourth GradeCoverage and Exclusions
�� Coverage�is�100�percent.
�� School-level�exclusions�consisted�of�very�small�schools�(MOS�<�4)�and�schools�geographically�difficult�to�access.
�� No�within-school�exclusions.
Sample Design�� No�explicit�stratification.
�� Implicit�stratification�by�province�(31),�public/private�status,�and�school�gender�(boys,�co-educational,�or�girls).
�� Sampled�one�classroom�per�school.
�� School�sample�overlap�between�TIMSS�(Grade�4)�and�PIRLS:�1)�Samples�were�drawn�all�at�once;�2)�All�sampled�schools�for�PIRLS�also�were�sampled�for�TIMSS;�and�3)�All�sampled�students�for�PIRLS�also�were�asked�to�take�TIMSS.
Exhibit 24: Allocation of School Sample in Iran, Fourth Grade
Explicit StrataTotal
Sampled Schools
Ineligible Schools
Participating SchoolsRefusal Schools
Excluded SchoolsOriginal
Schools1st
Replacements2nd
Replacements
Iran 250 6 244 0 0 0 0
Total 250 6 244 0 0 0 0

| Methods and Procedures24 | PIRLS2011ChARACteRIStICS of NAtIoNAL SAmPLeS
IrelandFourth GradeCoverage and Exclusions
�� Coverage�is�100�percent.
�� School-level�exclusions�consisted�of�non-aided�first�level�educational�institutions�(private�schools),�and�students�in�special�schools�(students�with�special�educational�needs).
�� Within-school�exclusions�consisted�of�students�with�special�educational�needs.
Sample Design�� Explicit�stratification�by�school�size.
�� Implicit�stratification�by�school-level�socio-economic�status�(DEIS1,�DEIS2,�rural,�and�“other”),�language�status�(Irish,�Gaeltacht,�and�English),�and�school�gender�(boys,�co-educational,�or�girls).
�� Sampled�two�classrooms�per�school.
�� The�school�sample�for�PIRLS�was�selected�by�controlling�for�the�overlap�between�three�studies�using�the�Chowdhury�approach�(samples�drawn�sequentially).�The�PIRLS�sample�of�schools�was�selected�by�minimizing�the�overlap�with�the�samples�from�the�previous�PIRLS�field�test�and�the�samples�were�drawn�for�a�national�study.�Note�that�these�two�previous�samples�were�drawn�independently�from�each�other.�
�� All�sampled�students�from�schools�selected�for�PIRLS�were�asked�to�participate�in�TIMSS�at�Grade�4.
Exhibit 25: Allocation of School Sample in Ireland, Fourth Grade
Explicit StrataTotal
Sampled Schools
Ineligible Schools
Participating SchoolsRefusal Schools
Excluded SchoolsOriginal
Schools1st
Replacements2nd
Replacements
Very Small Enrolment 2 1 1 0 0 0 0
Small Enrolment 45 0 45 0 0 0 0
Medium Enrolment 41 0 40 1 0 0 0
Large Enrolment 64 0 62 2 0 0 0
Total 152 1 148 3 0 0 0

Methods and Procedures | PIRLS2011ChARACteRIStICS of NAtIoNAL SAmPLeS | 25
IsraelFourth GradeCoverage and Exclusions
�� Coverage�is�100�percent.
�� School-level�exclusions�consisted�of�Ultra�Orthodox�schools,�special�education�schools,�very�small�schools�(MOS�<�5),�and�schools�where�instruction�is�in�English�or�French.
�� Within-school�exclusions�consisted�of�classes�for�students�with�special�educational�needs�in�regular�schools�and�students�with�special�educational�needs�learning�in�regular�classes.
Sample Design�� Explicit�stratification�by�“Grade�4”�/�“Grade�4�&�Grade�8”�school�status,�and�school�orientation.
�� Implicit�stratification�by�socio-economic�status�(SES)�(high,�medium,�and�low),�school�gender�(boys,�co-educational,�or�girls),�and�geographic�region�(North�and�South).
�� Sampled�two�classrooms�in�large�schools�(MOS�>�130).
�� There�was�one�census�stratum�(“Grade�4�&�Grade�8�–�Arabic�Druze”).�All�variance�estimates�for�this�stratum�were�derived�using�schools�as�variance�strata.
�� School�sample�overlap�between�PIRLS�and�TIMSS�(Grade�8):�1)�Samples�were�drawn�all�at�once;�and�2)�Only�two�of�the�sampled�schools�in�the�“Grade�4�and�Grade�8”�stratum�also�were�asked�to�participate�in�TIMSS�at�Grade�8�and�PIRLS.
Exhibit 26: Allocation of School Sample between Studies in Israel
Explicit StrataTotal
Sampled Schools
Allocation of Schools
To PIRLSGrade 4
To TIMSSGrade 8
Grade 4 only 129 129 0
Grade 4 & Grade 8 45 24 23
Grade 8 only 129 0 129
Total 303 153 152

| Methods and Procedures26 | PIRLS2011ChARACteRIStICS of NAtIoNAL SAmPLeS
Exhibit 27: Allocation of School Sample in Israel, Fourth Grade
Explicit StrataTotal
Sampled Schools
Ineligible Schools
Participating SchoolsRefusal Schools
Excluded SchoolsOriginal
Schools1st
Replacements2nd
Replacements
Grade 4 only – Hebrew Secular 64 0 64 0 0 0 0
Grade 4 only – Hebrew Religious 27 0 27 0 0 0 0
Grade 4 only – Arabic Arab 26 0 25 0 0 1 0
Grade 4 only – Arabic Druze 4 0 4 0 0 0 0
Grade 4 only – Arabic Bedouin 8 0 8 0 0 0 0
Grade 4 & Grade 8 – Hebrew Secular 6 0 6 0 0 0 0
Grade 4 & Grade 8 – Hebrew Religious 8 0 6 0 2 0 0
Grade 4 & Grade 8 – Arabic Arab 5 0 5 0 0 0 0
Grade 4 & Grade 8 – Arabic Druze 2 0 2 0 0 0 0
Grade 4 & Grade 8 – Arabic Bedouin 3 0 3 0 0 0 0
Total 153 0 150 0 2 1 0
ItalyFourth GradeCoverage and Exclusions
�� Coverage�is�100�percent.
�� School-level�exclusions�consisted�of�students�taught�in�Slovenian�and�very�small�schools�(MOS�<�5).
�� Within-school�exclusions�consisted�of�intellectually�and�functionally�disabled�students,�and�non-native�language�speakers.
Sample Design�� Explicit�stratification�by�geographic�area,�and�“Grade�4”�/�“Grade�4�&�Grade�8”�school�type.
�� Implicit�stratification�by�public/private�status,�and�by�region�or�province�(104).
�� Sampled�two�classrooms�in�large�schools�(MOS�>�150).

Methods and Procedures | PIRLS2011ChARACteRIStICS of NAtIoNAL SAmPLeS | 27
�� Oversampling�as�follows:�40�schools�selected�per�region�to�allow�comparison�between�the�five�main�regions�(Northeast,�Nothwest,�Central,�South,�and�Southern�Islands)�plus�additional�sampling�for�sub-regions�(Trento�&�Bolzano,�and�Valle�D’Aosta).
�� School�sample�overlap�between�TIMSS�(Grade�4),�PIRLS,�and�TIMSS�(Grade�8):�1)�Samples�were�drawn�all�at�once;�2)�All�sampled�schools�in�the�“Grade�4�&�Grade�8”�stratum�were�asked�to�participate�in�all�studies;�and�3)�All�sampled�students�for�PIRLS�also�were�asked�to�take�TIMSS�at�Grade�4.
Exhibit 28: Allocation of School Sample between Studies in Italy
Explicit StrataTotal
Sampled Schools
Allocation of Schools
To PIRLSGrade 4
To TIMSSGrade 4
To TIMSSGrade 8
Grade 4 only 106 106 106 0
Grade 4 & Grade 8 99 99 99 99
Grade 8 only 105 0 0 105
Total 310 205 205 204
Exhibit 29: Allocation of School Sample in Italy, Fourth Grade
Explicit StrataTotal
Sampled Schools
Ineligible Schools
Participating SchoolsRefusal Schools
Excluded SchoolsOriginal
Schools1st
Replacements2nd
Replacements
Grade 4 only – Central 21 0 20 0 1 0 0
Grade 4 only – Northeast, without Trento & Bolzano 14 0 8 3 2 1 0
Grade 4 only – Northwest, without Valle D’Aosta 19 0 17 2 0 0 0
Grade 4 only – South 28 0 24 3 0 1 0
Grade 4 only – Southern Islands 20 0 14 6 0 0 0
Grade 4 only – Valle D’Aosta (Northwest) 2 0 0 1 1 0 0
Grade 4 only – Trento & Bolzano (Northeast) 2 0 1 1 0 0 0
Grade 4 & Grade 8 – Central 19 0 15 4 0 0 0
Grade 4 & Grade 8 – Northeast, without Trento & Bolzano
21 0 18 2 1 0 0

| Methods and Procedures28 | PIRLS2011ChARACteRIStICS of NAtIoNAL SAmPLeS
Explicit StrataTotal
Sampled Schools
Ineligible Schools
Participating SchoolsRefusal Schools
Excluded SchoolsOriginal
Schools1st
Replacements2nd
Replacements
Grade 4 & Grade 8 – Northwest, without Valle D’Aosta
21 0 16 3 1 1 0
Grade 4 & Grade 8 – South 12 0 11 0 1 0 0
Grade 4 & Grade 8 – Southern Islands 20 0 18 2 0 0 0
Grade 4 & Grade 8 – Valle D’Aosta (Northwest) 2 0 1 1 0 0 0
Grade 4 & Grade 8 – Trento & Bolzano (Northeast) 4 0 3 0 1 0 0
Total 205 0 166 28 8 3 0
KuwaitSixth GradeCoverage and Exclusions
�� Coverage�is�78�percent.�Coverage�in�Kuwait�was�restricted�to�students�in�public�schools�(78%�of�the�international�target�population).
�� School-level�exclusions�consisted�of�special�needs�schools�(based�on�sampling�forms�provided�for�Grade�4).
�� No�within-school�exclusions�(based�on�sampling�forms�provided�for�Grade�4).
Sample Design�� Explicit�stratification�by�region.
�� Implicit�stratification�by�school�gender�(boys�or�girls).
�� Sampled�two�classrooms�per�school�in�large�schools�(MOS�>�143)�of�“Hawalli”�and�“Farwaniya”�explicit�strata.
�� Schools�were�paired�for�variance�calculation�purposes�in�the�“Farwaniya”�stratum�because�all�schools�were�sampled.�The�same�was�done�for�the�certainty�schools�of�the�“Ahmadi”�stratum.
Exhibit 29: Allocation of School Sample in Italy, Fourth Grade (Continued)

Methods and Procedures | PIRLS2011ChARACteRIStICS of NAtIoNAL SAmPLeS | 29
Exhibit 30: Allocation of School Sample in Kuwait, Sixth Grade
Explicit StrataTotal
Sampled Schools
Ineligible Schools
Participating SchoolsRefusal Schools
Excluded SchoolsOriginal
Schools1st
Replacements2nd
Replacements
Asema 20 0 19 0 0 1 0
Hawalli 22 0 19 0 0 3 0
Farwaniya 31 0 26 0 0 5 0
Ahmadi 35 0 32 0 0 3 0
Jahra 27 0 24 0 0 3 0
Mubarak 15 0 13 0 0 2 0
Total 150 0 133 0 0 17 0
LithuaniaFourth GradeCoverage and Exclusions
�� Coverage�is�93�percent.�Coverage�in�Lithuania�was�restricted�to�students�whose�language�of�instruction�is�Lithuanian�(93%�of�the�international�target�population).
�� School-level�exclusions�consisted�of�very�small�schools�and�special�schools.
�� Within-school�exclusions�consisted�of�intellectually�disabled�students�and�students�whose�language�of�instruction�was�not�Lithuanian.
Sample Design�� Explicit�stratification�by�“Grade�4”�/�“Grade�4�&�Grade�8”�school�status�and�school�location.
�� Implicit�stratification�by�school�type�(primary,�primary�&�Kindergarten,�basic,�secondary,�and�gymnasium).
�� Sampled�two�classrooms�in�large�schools�(MOS�>�50).
�� A�national�booklet�was�used�(resulting�in�one�less�international�booklet).�A�larger�sample�size�was�required�to�compensate�for�the�loss.��
�� School�sample�overlap�between�TIMSS�(Grade�4),�PIRLS,�and�TIMSS�(Grade�8):�1)�Samples�were�drawn�all�at�once;�2)�All�sampled�schools�in�the�“Grade�4�&�Grade�8”�stratum�were�asked�to�participate�in�all�studies;�and�3)�All�sampled�students�for�PIRLS�also�were�asked�to�take�TIMSS�at�Grade�4.

| Methods and Procedures30 | PIRLS2011ChARACteRIStICS of NAtIoNAL SAmPLeS
Exhibit 31: Allocation of School Sample between Studies in Lithuania
Explicit StrataTotal
Sampled Schools
Allocation of Schools
To PIRLSGrade 4
To TIMSSGrade 4
To TIMSSGrade 8
Grade 4 only 39 39 39 0
Grade 4 & Grade 8 121 121 121 121
Grade 8 only 29 0 0 29
Total 189 160 160 150
Exhibit 32: Allocation of School Sample in Lithuania, Fourth Grade
Explicit StrataTotal
Sampled Schools
Ineligible Schools
Participating SchoolsRefusal Schools
Excluded SchoolsOriginal
Schools1st
Replacements2nd
Replacements
Grade 4 only – Vilnius 6 0 6 0 0 0 0
Grade 4 only – Other Major Cities 9 1 8 0 0 0 0
Grade 4 only – Cities 20 2 16 1 0 0 1
Grade 4 only – Small Cities & Villages 4 1 3 0 0 0 0
Grade 4 & Grade 8 – Vilnius 18 0 16 2 0 0 0
Grade 4 & Grade 8 – Other Major Cities 25 0 23 2 0 0 0
Grade 4 & Grade 8 – Cities 39 0 36 2 1 0 0
Grade 4 & Grade 8 – Small Cities & Villages 39 1 37 1 0 0 0
Total 160 5 145 8 1 0 1
maltaFourth Grade (English)Coverage and Exclusions
�� Coverage�is�100�percent.
�� No�school-level�exclusions.
�� No�within-school�exclusions.
Sample Design�� No�explicit�stratification.
�� Implicit�stratification�by�Malta/Gozo�location,�and�school�type�(church,�independent,�and�state).

Methods and Procedures | PIRLS2011ChARACteRIStICS of NAtIoNAL SAmPLeS | 31
�� Census�of�all�students.�All�variance�estimates�were�derived�using�classrooms�as�variance�strata.
Exhibit 33: Allocation of School Sample in Malta (English), Fourth Grade
Explicit StrataTotal
Sampled Schools
Ineligible Schools
Participating SchoolsRefusal Schools
Excluded SchoolsOriginal
Schools1st
Replacements2nd
Replacements
Malta 99 3 96 0 0 0 0
Total 99 3 96 0 0 0 0
moroccoFourth GradeCoverage and Exclusions
�� Coverage�is�100�percent.
�� School-level�exclusions�consisted�of�very�small�schools�(MOS�<�6).
�� No�within-school�exclusions.
Sample Design�� Explicit�stratification�by�public/private�status�and�superior�region.
�� Implicit�stratification�by�urban/rural�status,�and�school�type�(10).�
�� The�16�original�regions�were�grouped�into�ten�superior�regions:��Region�1—Guelmim,�Es-smara,�Laayoune-Boujdour,�Sakia�AlHamra,�Oued Ed,�dhab,�and�Lagouira;�Region�2—Sous,�Massa,�and�Draa;�Region�3—Grand�Casablanca;�Region�4—Marrakech,�Tensift,�and�Al�Haouz;�Region�5—Rabat,�Salé,�Zemmour,�and�Zaer ;�Region�6—Fès�and�Boulmane;�Region�7—Meknès�and�Tafilalet;�Region�8—Gharb,�Chrarda,�Beni�Hssen,�Tanger,�and�Tetouan;�Region�9—Chaouia,�Ourdigha,�Doukala,�Abda,�Tadla,�and�Azilal;�Region�10—l’Oriental,�Taza,�Taounate,�and�Al�Hoceima.
�� Sampled�one�classroom�per�school.
�� Oversampling�to�allow�for�reliable�estimates�at�the�regional�level.
�� Overlap�was�maximized�between�Grade�4�and�Grade�6�school�samples.
�� All�sampled�students�for�PIRLS�at�Grade�4�also�were�asked�to�take�TIMSS�at�Grade�4.

| Methods and Procedures32 | PIRLS2011ChARACteRIStICS of NAtIoNAL SAmPLeS
Exhibit 34: Allocation of School Sample in Morocco, Fourth Grade
Explicit StrataTotal
Sampled Schools
Ineligible Schools
Participating SchoolsRefusal Schools
Excluded SchoolsOriginal
Schools1st
Replacements2nd
Replacements
Private 39 0 38 0 0 1 0
Public – Region 1 25 0 25 0 0 0 0
Public – Region 2 25 0 25 0 0 0 0
Public – Region 3 25 1 24 0 0 0 0
Public –Region 4 25 1 24 0 0 0 0
Public – Region 5 25 0 25 0 0 0 0
Public – Region 6 25 0 25 0 0 0 0
Public – Region 7 25 0 25 0 0 0 0
Public – Region 8 25 0 24 0 0 1 0
Public – Region 9 25 0 25 0 0 0 0
Public – Region 10 25 0 24 0 0 1 0
Total 289 2 284 0 0 3 0
Sixth GradeCoverage and Exclusions
�� Coverage�is�100�percent.
�� School-level�exclusions�consisted�of�very�small�schools�(MOS�<�6).
�� No�within-school�exclusions.
Sample Design�� Explicit�stratification�by�public/private�status�and�superior�region.
�� Implicit�stratification�by�urban/rural�status�and�school�type�(10).
�� The�16�original�regions�were�grouped�into�ten�superior�regions:�Region�1—Guelmim,�Es-smara,�Laayoune-Boujdour,�Sakia�AlHamra,�Oued�Ed,�dhab,�and�Lagouira;�Region�2—Sous,�Massa,�and�Draa;�Region�3—Grand�Casablanca;�Region�4—Marrakech,�Tensift,�and�Al�Haouz;�Region�5—Rabat,�Salé,�Zemmour,�and�Zaer ;�Region�6—Fès�and�Boulmane;�Region�7—Meknès�and�Tafilalet;�Region�8—Gharb,�Chrarda,�Beni�Hssen,�Tanger,�and�Tetouan;�Region�9—Chaouia,�Ourdigha,�Doukala,�Abda,�Tadla,�and�Azilal;�Region�10—l’Oriental,�Taza,�Taounate,�and�Al�Hoceima.
�� Sampled�one�classroom�per�school.

Methods and Procedures | PIRLS2011ChARACteRIStICS of NAtIoNAL SAmPLeS | 33
�� The�school�measure�of�size�(MOS)�was�given�by�the�number�of�Grade�4�students�found�in�schools�(Grade�4�and�Grade�6�students�all�attending�the�same�schools).
�� Oversampling�to�allow�for�reliable�estimates�at�the�regional�level.
�� All�sampled�schools�for�PIRLS�at�Grade�4�also�were�asked�to�participate�in�PIRLS�at�Grade�6.
Exhibit 35: Allocation of School Sample in Morocco, Sixth Grade
Explicit StrataTotal
Sampled Schools
Ineligible Schools
Participating SchoolsRefusal Schools
Excluded SchoolsOriginal
Schools1st
Replacements2nd
Replacements
Private 39 1 38 0 0 0 0
Public – Region 1 25 0 25 0 0 0 0
Public – Region 2 25 0 25 0 0 0 0
Public – Region 3 25 2 23 0 0 0 0
Public – Region 4 25 2 23 0 0 0 0
Public – Region 5 25 0 25 0 0 0 0
Public – Region 6 25 0 24 0 0 1 0
Public – Region 7 25 0 24 0 0 1 0
Public – Region 8 25 2 22 0 0 1 0
Public – Region 9 25 1 24 0 0 0 0
Public – Region 10 25 0 25 0 0 0 0
Total 289 8 278 0 0 3 0
theNetherlandsFourth GradeCoverage and Exclusions
�� Coverage�is�100�percent.
�� School-level�exclusions�consisted�of�schools�for�special�education,�and�very�small�schools�(MOS�<�7).
�� Within-school�exclusions�consisted�of�non-native�language�speakers�(less�than�one�year�of�instruction�in�Dutch).
Sample Design�� Explicit�stratification�by�socio-economic�level�(SES).�The�SES�levels�differ�between�the�PIRLS�and�TIMSS�studies.�Because�sample�overlap�was�controlled,�distinct�SES�levels�were�maintained.

| Methods and Procedures34 | PIRLS2011ChARACteRIStICS of NAtIoNAL SAmPLeS
�� Implicit�stratification�by�urbanization�(very�high,�high,�moderate,�low,�and�very�low),�and�school�size�(large�and�small).
�� Sampled�all�classrooms�in�selected�schools.
�� Given�that�school�nonresponse�was�mainly�found�in�large�schools,�the�nonresponse�adjustment�was�conducted�using�the�expected�counts�of�students�not�participating�rather�than�using�the�counts�of�schools�not�participating.�Variance�calculation�is�slightly�biased�as�a�result.
�� Schools�were�selected�with�equal�probabilities.
�� School�sample�overlap�between�TIMSS�(Grade�4)�and�PIRLS:�1)�Samples�were�drawn�all�at�once;�and�2)�No�sample�overlap�between�these�studies.
Exhibit 36: Allocation of School Sample in the Netherlands, Fourth Grade
Explicit StrataTotal
Sampled Schools
Ineligible Schools
Participating SchoolsRefusal Schools
Excluded SchoolsOriginal
Schools1st
Replacements2nd
Replacements
High Mean SES 47 0 35 7 3 2 0
High to Medium Mean SES 38 0 25 8 2 3 0
Medium Mean SES 27 0 14 9 0 4 0
Medium to Low Mean SES 27 0 17 4 4 2 0
Low Mean SES 12 0 6 3 1 2 0
Total 151 0 97 31 10 13 0
NewZealandFourth Grade (Year 5)Coverage and Exclusions
�� Coverage�is�100�percent.
�� School-level�exclusions�consisted�of�the�Westmount�School�(Closed�Brethren),�the�Correspondence�School,�special�education�schools,�Maori-medium�Level�2�immersion�schools,�and�very�small�schools�(MOS�<�4;�includes�some�very�small�Maori-medium�Level�1�immersion�schools).
�� Within-school�exclusions�consisted�of�special�needs�students:�class�level�and�within�class,�students�who�have�insufficient�years�of�instruction�in�the�assessment�language,�and�students�who�only�receive�51–80�percent�of�their�instruction�in�Level�2�Maori�language�immersion�units�in�either�

Methods and Procedures | PIRLS2011ChARACteRIStICS of NAtIoNAL SAmPLeS | 35
English-medium�schools�or�in�Maori-medium�Level�1�immersion�schools,�and�students�in�Level�1�Pacifica�language�immersion�units��(e.g.�Samoan).
Sample Design�� Explicit�stratification�by�language�of�instruction,�“Grade�4”�/�“Grade�4�&�Grade�8”�school�type,�and�school�size.
�� Implicit�stratification�by�socioeconomic�status�indicator�(very�high,�high,�moderate,�low,�and�very�low),�school�gender�(boys,�co-educational,�or�girls),�and�major�urban/�“other”�school�status.
�� Sampled�two�classrooms�in�large�schools�(the�rule�varies�from�one�stratum�to�the�next)�and�in�dual�language�schools.�In�the�latter,�one�classroom�from�each�language�group�was�sampled.
�� Response�adjustment�for�students�assessed�in�Maori�was�based�on�student-weighted�counts�amongst�all�participating�classrooms�assessed�in�Maori.
�� School�sample�overlap�between�TIMSS�(Grade�4),�PIRLS,�and�TIMSS�(Grade�8):�1)�Samples�were�drawn�all�at�once;�and�2)�No�school�sample�overlap�between�these�studies.
Exhibit 37: Allocation of School Sample between Studies in New Zealand
Explicit StrataTotal
Sampled Schools
Allocation of Schools
To PIRLSGrade 4
To TIMSSGrade 4
To TIMSSGrade 8
Grade 4 only 368 187 181 0
Grade 4 & Grade 8 34 14 8 12
Grade 8 only 150 0 0 150
Total 552 201 189 162
Exhibit 38: Allocation of School Sample in New Zealand, Fourth Grade
Explicit StrataTotal
Sampled Schools
Ineligible Schools
Participating SchoolsRefusal Schools
Excluded SchoolsOriginal
Schools1st
Replacements2nd
Replacements
Grade 4 only – Maori Level 1 Immersion 6 0 2 1 0 3 0
Grade 4 only – English-Medium with Level 1 Immersion
8 0 8 0 0 0 0
Grade 4 only – English-Medium only 173 2 161 8 1 1 0

| Methods and Procedures36 | PIRLS2011ChARACteRIStICS of NAtIoNAL SAmPLeS
Explicit StrataTotal
Sampled Schools
Ineligible Schools
Participating SchoolsRefusal Schools
Excluded SchoolsOriginal
Schools1st
Replacements2nd
Replacements
Grade 4 & Grade 8 – Maori Level 1 Immersion 6 0 2 1 0 3 0
Grade 4 & Grade 8 –English-Medium with Level 1 immersion
2 0 2 0 0 0 0
Grade 4 & Grade 8 – English-Medium only – Small School
2 0 2 0 0 0 0
Grade 4 & Grade 8 – English-Medium only – Small Year 5, Large Year 9
2 0 1 1 0 0 0
Grade 4 & Grade 8 – English-Medium only – Large School
2 0 2 0 0 0 0
Total 201 2 180 11 1 7 0
NorthernIrelandFourth GradeCoverage and Exclusions
�� Coverage�is�100�percent.�
�� School-level�exclusions�consisted�of�very�small�schools�and�special�schools.
�� Within-school�exclusions�consisted�of�students�with�significant�special�educational�needs.
Sample Design�� Explicit�stratification�by�region.
�� Implicit�stratification�by�deprivation�level�(high,�moderate�to�high,�moderate,�low�to�moderate,�and�low).�
�� School�sample�overlap�between�TIMSS�(Grade�4)�and�PIRLS:�1)�Samples�were�drawn�all�at�once;�and�2)�All�sampled�students�for�PIRLS�also�were�asked�to�take�TIMSS�at�Grade�4.
Exhibit 38: Allocation of School Sample in New Zealand, Fourth Grade (Continued)

Methods and Procedures | PIRLS2011ChARACteRIStICS of NAtIoNAL SAmPLeS | 37
Exhibit 39: Allocation of School Sample in Northern Ireland, Fourth Grade
Explicit StrataTotal
Sampled Schools
Ineligible Schools
Participating SchoolsRefusal Schools
Excluded SchoolsOriginal
Schools1st
Replacements2nd
Replacements
Belfast 23 0 14 1 2 6 0
Western 29 0 17 5 2 5 0
Northeast 37 0 22 9 3 3 0
Southeast 34 0 22 5 0 7 0
Southern 37 0 25 7 2 3 0
Total 160 0 100 27 9 24 0
NorwayFourth GradeCoverage and Exclusions
�� Coverage�is�100�percent.
�� School-level�exclusions�consisted�of�international�schools,�schools�where�students�are�taught�in�Sami�language,�and�very�small�schools�(MOS�<�3).
�� No�within-school�exclusions.
Sample Design�� Explicit�stratification�by�“Bokmål”�/�“Nynorsk�or�other”�status,�and�“Grade�4”�/�“Grade�4�&�Grade�8”�school�type.
�� Implicit�stratification�by�community�size�(small,�medium,�large,�and�very large).
�� Sampled�two�classrooms�per�school.
�� School�sample�overlap�between�TIMSS�(Grade�4),�PIRLS,�and�TIMSS�(Grade�8):�1)�Samples�were�drawn�all�at�once;�2)�No�school�sample�overlap�between�TIMSS�at�Grade�8�and�PIRLS�at�Grade�4;�and�3)�All�sampled�students�for�PIRLS�also�were�asked�to�take�TIMSS�at�Grade�4.
Exhibit 40: Allocation of School Sample between Studies in Norway
Explicit StrataTotal
Sampled Schools
Allocation of Schools
To PIRLSGrade 4
To TIMSSGrade 4
To TIMSSGrade 8
Grade 4 only 121 121 121 0
Grade 4 & Grade 8 68 29 29 39
Grade 8 only 111 0 0 111
Total 300 150 150 150

| Methods and Procedures38 | PIRLS2011ChARACteRIStICS of NAtIoNAL SAmPLeS
Exhibit 41: Allocation of School Sample in Norway, Fourth Grade
Explicit StrataTotal
Sampled Schools
Ineligible Schools
Participating SchoolsRefusal Schools
Excluded SchoolsOriginal
Schools1st
Replacements2nd
Replacements
Grade 4 only – Bokmål 103 2 63 16 7 15 0
Grade 4 only – Nynorsk or other 18 2 8 2 2 4 0
Grade 4 & Grade 8 – Bokmål 23 0 10 4 3 6 0
Grade 4 & Grade 8 – Nynorsk or other 6 0 4 1 0 0 1
Total 150 4 85 23 12 25 1
Fifth GradeCoverage and Exclusions
�� Coverage�is�100�percent.
�� School-level�exclusions�consisted�of�very�small�schools�(MOS�<�3�in�Grade�4),�schools�where�students�are�taught�in�Sami�language,�and�international�schools.
�� No�within-school�exclusions.
Sample Design�� Explicit�stratification�by�“Bokmål”�/�“Nynorsk�or�other”�status,�and�“Grade�4”�/�“Grade�4�&�Grade�8”�school�type.
�� Implicit�stratification�by�community�size�(small,�medium,�large,�and�very large).
�� Sampled�two�classrooms�per�school.
�� Sampled�every�second�Grade�4�school.
Exhibit 42: Allocation of School Sample in Norway, Fifth Grade
Explicit StrataTotal
Sampled Schools
Ineligible Schools
Participating SchoolsRefusal Schools
Excluded SchoolsOriginal
Schools1st
Replacements2nd
Replacements
Grade 4 only – Bokmål 51 0 24 9 4 14 0
Grade 4 only – Nynorsk or other 9 0 3 2 1 3 0
Grade 4 & Grade 8 – Bokmål 12 0 6 1 0 5 0
Grade 4 & Grade 8 – Nynorsk or other 3 0 2 1 0 0 0
Total 75 0 35 13 5 22 0

Methods and Procedures | PIRLS2011ChARACteRIStICS of NAtIoNAL SAmPLeS | 39
omanFourth GradeCoverage and Exclusions
�� Coverage�is�100�percent.
�� School-level�exclusions�consisted�of�special�education�schools�and�very�small�schools�(MOS�<�10).
�� No�within-school�exclusions.
Sample Design�� Explicit�stratification�by�“Grade�4”�/�“Grade�4�&�Grade�8”�school�status,�region,�and�school�type.
�� Implicit�stratification�by�urban/rural�status�and�school�gender�(boys,�co-educational,�or�girls).
�� There�were�census�strata�along�with�certainty�schools�outside�these�strata.�Two�classrooms�per�school�were�sampled�in�these�schools.�All�variance�estimates�were�computed�using�schools�as�variance�strata.�
�� Census�of�all�students�in�the�first�two�explicit�strata.�All�variance�estimates�were�computed�using�classrooms�as�variance�strata.
�� Oversampling�to�allow�for�better�estimates�at�the�regional�level.�
�� School�sample�overlap�between�TIMSS�(Grade�4),�PIRLS,�and�TIMSS�(Grade�8):�1)�Samples�were�drawn�all�at�once;�2)�Overlap�was�maximized�between�all�studies�for�schools�selected�from�the�“Grade�4�&�Grade�8”�stratum;�and�3)�All�sampled�students�for�PIRLS�also�were�asked�to�take�TIMSS�at�Grade�4.
Exhibit 43: Allocation of School Sample between Studies in Oman
Explicit StrataTotal
Sampled Schools
Allocation of Schools
To PIRLSGrade 4
To TIMSSGrade 4
To TIMSSGrade 8
Grade 4 only 182 182 182 0
Grade 4 & Grade 8 164 156 156 122
Grade 8 only 217 0 0 217
Total 563 338 338 339

| Methods and Procedures40 | PIRLS2011ChARACteRIStICS of NAtIoNAL SAmPLeS
Exhibit 44: Allocation of School Sample in Oman, Fourth Grade
Explicit StrataTotal
Sampled Schools
Ineligible Schools
Participating SchoolsRefusal Schools
Excluded SchoolsOriginal
Schools1st
Replacements2nd
Replacements
Grade 4 only – Integrated Curriculum 4 0 4 0 0 0 0
Grade 4 only – International 5 0 5 0 0 0 0
Grade 4 only – Private 10 0 10 0 0 0 0
Grade 4 only – Public – Ad Dakhliyah 20 0 20 0 0 0 0
Grade 4 only – Public – Adh Dhahirah 14 0 14 0 0 0 0
Grade 4 only – Public – Al Batinah North 24 1 23 0 0 0 0
Grade 4 only – Public – Al Batinah South 20 0 20 0 0 0 0
Grade 4 only – Public – Al Buraimi governorates 8 0 8 0 0 0 0
Grade 4 only – Public – Al Wusta 1 0 1 0 0 0 0
Grade 4 only – Public – Ash Sharqiyah North 12 0 12 0 0 0 0
Grade 4 only – Public – Ash Sharqiyah South 18 0 18 0 0 0 0
Grade 4 only – Public – Dhofar governorates 20 0 20 0 0 0 0
Grade 4 only – Public – Musandam governorates 4 0 4 0 0 0 0
Grade 4 only – Public – Muscat governorates 22 0 22 0 0 0 0
Grade 4 & Grade 8 – International 23 0 19 0 0 4 0
Grade 4 & Grade 8 – Private 20 0 18 0 0 2 0
Grade 4 & Grade 8 – Public – Ad Dakhliyah 10 1 9 0 0 0 0
Grade 4 & Grade 8 – Public – Adh Dhahirah 16 0 16 0 0 0 0
Grade 4 & Grade 8 – Public – Al Batinah North 6 0 6 0 0 0 0
Grade 4 & Grade 8 – Public – Al Batinah South 10 0 10 0 0 0 0
Grade 4 & Grade 8 – Public – Al Buraimi governorates 5 0 5 0 0 0 0

Methods and Procedures | PIRLS2011ChARACteRIStICS of NAtIoNAL SAmPLeS | 41
Explicit StrataTotal
Sampled Schools
Ineligible Schools
Participating SchoolsRefusal Schools
Excluded SchoolsOriginal
Schools1st
Replacements2nd
Replacements
Grade 4 & Grade 8 – Public – Al Wusta 15 0 15 0 0 0 0
Grade 4 & Grade 8 – Public – Ash Sharqiyah North 18 3 15 0 0 0 0
Grade 4 & Grade 8 – Public – Ash Sharqiyah South 12 0 12 0 0 0 0
Grade 4 & Grade 8 – Public – Dhofar governorates 10 0 10 0 0 0 0
Grade 4 & Grade 8 – Public – Musandam governorates 3 0 3 0 0 0 0
Grade 4 & Grade 8 – Public – Muscat governorates 8 0 8 0 0 0 0
Total 338 5 327 0 0 6 0
PolandFourth Grade (Standard 3)Coverage and Exclusions
�� Coverage�is�100�percent.
�� School-level�exclusions�consisted�of�very�small�schools�(MOS�<�5)�and�special�schools.
�� Within-school�exclusions�consisted�of�special�needs�students�in�regular�classrooms.
Sample Design�� Explicit�stratification�by�urbanization.
�� Implicit�stratification�by�districts�(voivodship)�(16).
�� Sampled�two�classrooms�per�school.�
�� School�sample�overlap�between�TIMSS�(Grade�4)�and�PIRLS:�1)�Samples�were�drawn�all�at�once;�2)�All�sampled�students�for�PIRLS�also�were�asked�to�take�TIMSS�at�Grade�4.
Exhibit 44: Allocation of School Sample in Oman, Fourth Grade (Continued)

| Methods and Procedures42 | PIRLS2011ChARACteRIStICS of NAtIoNAL SAmPLeS
Exhibit 45: Allocation of School Sample in Poland, Fourth Grade
Explicit StrataTotal
Sampled Schools
Ineligible Schools
Participating SchoolsRefusal Schools
Excluded SchoolsOriginal
Schools1st
Replacements2nd
Replacements
Village 61 0 61 0 0 0 0
Town (up to 20 thousand inhabitants) 24 0 24 0 0 0 0
City (20 to 100 thousand inhabitants) 29 0 29 0 0 0 0
City (above 100 thousand inhabitants) 36 0 36 0 0 0 0
Total 150 0 150 0 0 0 0
PortugalFourth GradeCoverage and Exclusions
�� Coverage�is�100�percent.
�� School-level�exclusions�consisted�of�extremely�small�schools�(MOS�<�5).
�� Within-school�exclusions�consisted�of�students�with�special�educational�needs,�and�non-native�language�speakers.
Sample Design�� Explicit�stratification�by�public/private�status.
�� Implicit�stratification�by�region�(12).
�� Sampled�two�classrooms�per�school.
�� School�sample�overlap�between�TIMSS�(Grade�4)�and�PIRLS:�1)�Samples�were�drawn�all�at�once;�and�2)�All�sampled�students�for�PIRLS�also�were�asked�to�take�TIMSS�at�Grade�4.
Exhibit 46: Allocation of School Sample in Portugal, Fourth Grade
Explicit StrataTotal
Sampled Schools
Ineligible Schools
Participating SchoolsRefusal Schools
Excluded SchoolsOriginal
Schools1st
Replacements2nd
Replacements
Private 16 0 13 2 0 1 0
Public 134 0 120 11 2 1 0
Total 150 0 133 13 2 2 0

Methods and Procedures | PIRLS2011ChARACteRIStICS of NAtIoNAL SAmPLeS | 43
QatarFourth GradeCoverage and Exclusions
�� Coverage�is�100�percent.
�� School-level�exclusions�consisted�of�schools�that�provide�instruction�in�languages�other�than�English�and�Arabic.
�� No�within-school�exclusions.
�� Private�(from�the�“Grade�4�&�Grade�8”�explicit�stratum�in�the�co-educational�schools)�and�community�schools�were�not�part�of�previous�cycles.
Sample Design�� Explicit�stratification�by�“Grade�4”�/�“Grade�4�&�Grade�8”�school�types.
�� Implicit�stratification�by�school�gender�(boys,�co-educational,�or�girls)�and�school�type�(community,�independent,�and�private).
�� Sampled�two�classrooms�per�school�in�large�schools�(MOS�>�150).
�� Census�of�all�schools.�Variance�estimates�were�computed�using�schools�as�variance�strata�for�schools�where�at�least�two�classrooms�or�all�classrooms�were�sampled.
�� School�sample�overlap�between�TIMSS�(Grade�4),�PIRLS,�and�TIMSS�(Grade�8):�1)�Samples�were�drawn�all�at�once;�2)�All�sampled�schools�in�the�“Grade�4�&�Grade�8”�stratum�were�asked�to�participate�in�all�studies;�3)�All�sampled�students�for�PIRLS�also�were�asked�to�take�TIMSS�at�Grade�4.
Exhibit 47: Allocation of School Sample between Studies in Qatar
Explicit StrataTotal
Sampled Schools
Allocation of Schools
To PIRLSGrade 4
To TIMSSGrade 4
To TIMSSGrade 8
Grade 4 only 113 113 113 0
Grade 4 & Grade 8 62 62 62 62
Grade 8 only 51 0 0 51
Total 226 175 175 113

| Methods and Procedures44 | PIRLS2011ChARACteRIStICS of NAtIoNAL SAmPLeS
Exhibit 48: Allocation of School Sample in Qatar, Fourth Grade
Explicit StrataTotal
Sampled Schools
Ineligible Schools
Participating SchoolsRefusal Schools
Excluded SchoolsOriginal
Schools1st
Replacements2nd
Replacements
Grade 4 only 113 5 107 0 0 1 0
Grade 4 & Grade 8 62 2 59 0 0 0 1
Total 175 7 166 0 0 1 1
RomaniaFourth GradeCoverage�and�Exclusions
�� Coverage�is�100�percent.�
�� School-level�exclusions�consisted�of�very�small�schools.�
�� No�within-school�exclusions.
Sample Design�� Explicit�stratification�by�“Grade�4”�/�“Grade�4�&�Grade�8”�school�type�and�school�performance�level.
�� Implicit�stratification�by�urban/rural�status,�school�performance�level�(high,�medium,�low,�and�unknown),�and�geographic�location�(Central,�Northeast,�South,�Southeast,�Northwest,�and�West).
�� Sampled�two�classrooms�in�large�schools�(MOS�>�40).
�� School�sample�overlap�between�TIMSS�(Grade�4),�PIRLS,�and�TIMSS�(Grade�8):�1)�Samples�were�drawn�all�at�once;�2)�All�sampled�schools�in�the�“Grade�4�&�Grade�8”�stratum�were�asked�to�participate�in�all�studies;�and�3)�All�sampled�students�for�PIRLS�also�were�asked�to�take�TIMSS�at�Grade�4.
Exhibit 49: Allocation of School Sample between Studies in Romania
Explicit StrataTotal
Sampled Schools
Allocation of Schools
To PIRLSGrade 4
To TIMSSGrade 4
To TIMSSGrade 8
Grade 4 only 14 14 14 0
Grade 4 & Grade 8 136 136 136 136
Grade 8 only 14 0 0 14
Total 164 150 150 150

Methods and Procedures | PIRLS2011ChARACteRIStICS of NAtIoNAL SAmPLeS | 45
Exhibit 50: Allocation of School Sample in Romania, Fourth Grade
Explicit StrataTotal
Sampled Schools
Ineligible Schools
Participating SchoolsRefusal Schools
Excluded SchoolsOriginal
Schools1st
Replacements2nd
Replacements
Grade 4 only 14 0 14 0 0 0 0
Grade 4 & Grade 8 – Unknown Performance 19 0 18 0 0 0 1
Grade 4 & Grade 8 – Low Performance 30 0 29 0 0 0 1
Grade 4 & Grade 8 – Medium Performance 30 0 30 0 0 0 0
Grade 4 & Grade 8 – High Performance 31 0 31 0 0 0 0
Grade 4 & Grade 8 – Very High Performance 26 0 25 1 0 0 0
Total 150 0 147 1 0 0 2
theRussianfederationFourth GradeCoverage�and�Exclusions
�� Coverage�is�100�percent.
�� School-level�exclusions�consisted�of�very�small�schools�and�special�needs�schools.
�� Within-school�exclusions�consisted�of�disabled�students.
Sample Design�� Explicit�stratification�by�very�large�regions.�There�were�15�certainty�regions�(with�a�“*”�in�the�table�below)�and�one�large�stratum�from�which�27�regions�were�selected�(as�shown�in�the�table�below).
�� Implicit�stratification�by�urbanization�within�selected�regions�(rural,�settlement,�city–fewer�than�50,000�inhabitants,�city–50,000�to�100,000�inhabitants,�city–100,000�to�450,000�inhabitants,�city–450,000�to�680,000�inhabitants,�city–more�than�680,000�inhabitants).
�� Extra�sampling�stage�(regions)�required�before�sampling�schools�within�selected�regions.�Roughly�half�of�the�regions�were�certainty�regions�(selected�with�a�probability�of�one).�Within�these�certainty�regions,�schools�were�paired�for�variance�calculation�purposes.�Otherwise,�selected�regions�were�paired�for�variance�calculation�purposes.

| Methods and Procedures46 | PIRLS2011ChARACteRIStICS of NAtIoNAL SAmPLeS
�� Sampled�one�classroom�per�school�(in�general).
�� School�sample�overlap�between�TIMSS�(Grade�4)�and�PIRLS:�1)�Samples�were�drawn�all�at�once;�and�2)�All�sampled�students�for�PIRLS�also�were�asked�to�take�TIMSS�at�Grade�4.
Exhibit 51: Allocation of School Sample in the Russian Federation, Fourth Grade
Explicit StrataTotal
Sampled Schools
Ineligible Schools
Participating SchoolsRefusal Schools
Excluded SchoolsOriginal
Schools1st
Replacements2nd
Replacements
Alania 4 0 4 0 0 0 0
Altay kr 4 0 4 0 0 0 0
Belgorod obl 4 0 4 0 0 0 0
Kamchatka kr 4 0 4 0 0 0 0
Kostroma obl 4 0 4 0 0 0 0
Kursk obl 4 0 4 0 0 0 0
Murmansk obl 4 0 4 0 0 0 0
N Novgorod obl* 4 0 4 0 0 0 0
Rostov obl* 6 0 6 0 0 0 0
Chuvashia 4 0 4 0 0 0 0
Primorsk kr 4 0 4 0 0 0 0
Astrakhan obl 4 0 4 0 0 0 0
Ivanovo obl 4 0 4 0 0 0 0
Perm kr 4 0 4 0 0 0 0
Samara obl* 4 0 4 0 0 0 0
Tver obl 4 0 4 0 0 0 0
Ulianovsk obl 4 0 4 0 0 0 0
Sankt-Petersburg* 6 0 6 0 0 0 0
Iamal-Nenets ok 4 0 4 0 0 0 0
Krasnoyarsk kr* 4 0 4 0 0 0 0
Stavropol kr 4 0 4 0 0 0 0
Kemerovo obl* 4 0 4 0 0 0 0
Novosibirsk obl 4 0 4 0 0 0 0
Saratov obl 4 0 4 0 0 0 0
Hanty-Mansii ok 4 0 4 0 0 0 0
Dagestan* 6 0 6 0 0 0 0
Sakha 4 0 4 0 0 0 0
Tatarstan* 6 0 6 0 0 0 0
Arhangelsk obl 4 0 4 0 0 0 0
Irkutsk obl* 4 0 4 0 0 0 0

Methods and Procedures | PIRLS2011ChARACteRIStICS of NAtIoNAL SAmPLeS | 47
Explicit StrataTotal
Sampled Schools
Ineligible Schools
Participating SchoolsRefusal Schools
Excluded SchoolsOriginal
Schools1st
Replacements2nd
Replacements
Moscow obl* 10 0 10 0 0 0 0
Sverdlovsk obl* 6 0 6 0 0 0 0
Tomsk obl 4 0 4 0 0 0 0
Chelyabinsk obl* 6 0 6 0 0 0 0
Volgograd obl 4 0 4 0 0 0 0
Lipetsk obl 4 0 4 0 0 0 0
Bashkortostan* 8 0 8 0 0 0 0
Voronezh obl 4 0 4 0 0 0 0
Zabaykalski kr 4 0 4 0 0 0 0
Krasnodar kr* 8 0 8 0 0 0 0
Moscow* 12 0 12 0 0 0 0
Orenburg obl 4 0 4 0 0 0 0
Total 202 0 202 0 0 0 0
* Certainty Regions
SaudiArabiaFourth GradeCoverage and Exclusions
�� Coverage�is�100�percent.
�� School-level�exclusions�consisted�of�very�small�schools�(MOS�<�6).
�� No�within-school�exclusions.
Sample Design�� Explicit�stratification�by�school�type�and�school�gender.
�� Implicit�stratification�by�school�location�(Center,�East,�South,�West,�and�North),�public/private�status,�and�school�gender�(boys�or�girls).�
�� Sampled�two�classrooms�in�large�schools�(MOS�>�150).
�� Oversampling�of�“religious�schools”�to�allow�for�better�estimates�at�that�level.�
�� School�sample�overlap�between�TIMSS�(Grade�4)�and�PIRLS:�1)�Samples�were�drawn�all�at�once;�and�2)�All�sampled�students�for�PIRLS�also�were�asked�to�take�TIMSS�at�Grade�4.
Exhibit 51: Allocation of School Sample in the Russian Federation, Fourth Grade (Continued)

| Methods and Procedures48 | PIRLS2011ChARACteRIStICS of NAtIoNAL SAmPLeS
Exhibit 52: Allocation of School Sample in Saudi Arabia, Fourth Grade
Explicit StrataTotal
Sampled Schools
Ineligible Schools
Participating SchoolsRefusal Schools
Excluded SchoolsOriginal
Schools1st
Replacements2nd
Replacements
Non-religious schools – Girls 68 1 64 2 1 0 0
Non-religious schools – Boys 73 2 66 5 0 0 0
Religious schools – Girls 15 1 14 0 0 0 0
Religious schools – Boys 15 0 15 0 0 0 0
International schools 4 0 4 0 0 0 0
Total 175 4 163 7 1 0 0
SingaporeFourth GradeCoverage and Exclusions
�� Coverage�is�100�percent.
�� School-level�exclusions�consisted�of�special�education�schools�and�private�schools.
�� Within-school�exclusions�consisted�of�students�with�special�educational�needs.
Sample Design�� Explicit�stratification�by�“Grade�4”�/�“Grade�4�&�Grade�8”�schools.
�� No�implicit�stratification.
�� Census�of�all�schools.�Within�schools,�two�half�classrooms�were�sampled�with�probability�proportional�to�the�size�of�the�classroom.�Within�selected�classrooms,�19�students�were�randomly�sampled.
�� All�variance�estimates�were�calculated�using�schools�as�variance�strata.
�� School�sample�overlap�between�TIMSS�(Grade�4),�PIRLS,�and�TIMSS�(Grade�8):�1)�Samples�were�drawn�all�at�once;�2)�All�sampled�schools�in�the�“Grade�4�&�Grade�8”�stratum�were�asked�to�participate�in�all�studies;�and�3)�All�sampled�students�for�PIRLS�also�were�asked�to�take�TIMSS�at�Grade�4.
Methods and Procedures | PIRLS2011ChARACteRIStICS of NAtIoNAL SAmPLeS | 49
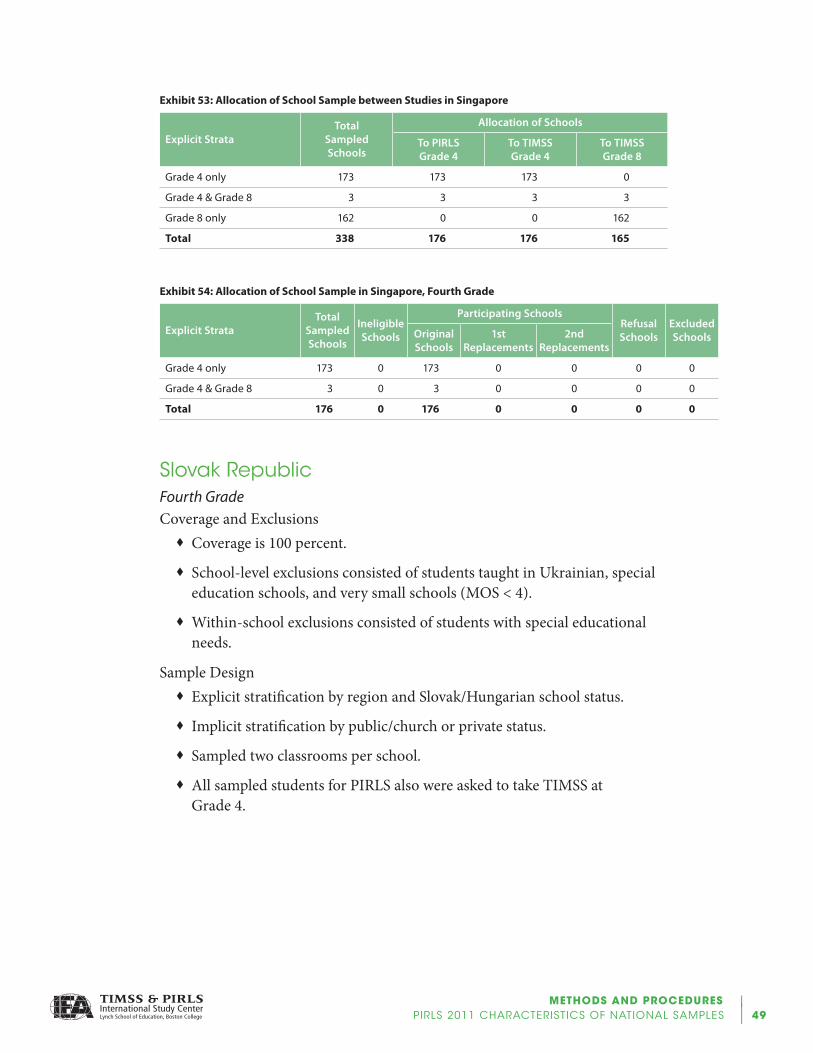
Exhibit 53: Allocation of School Sample between Studies in Singapore
Explicit StrataTotal
Sampled Schools
Allocation of Schools
To PIRLSGrade 4
To TIMSSGrade 4
To TIMSSGrade 8
Grade 4 only 173 173 173 0
Grade 4 & Grade 8 3 3 3 3
Grade 8 only 162 0 0 162
Total 338 176 176 165
Exhibit 54: Allocation of School Sample in Singapore, Fourth Grade
Explicit StrataTotal
Sampled Schools
Ineligible Schools
Participating SchoolsRefusal Schools
Excluded SchoolsOriginal
Schools1st
Replacements2nd
Replacements
Grade 4 only 173 0 173 0 0 0 0
Grade 4 & Grade 8 3 0 3 0 0 0 0
Total 176 0 176 0 0 0 0
SlovakRepublicFourth GradeCoverage and Exclusions
�� Coverage�is�100�percent.
�� School-level�exclusions�consisted�of�students�taught�in�Ukrainian,�special�education�schools,�and�very�small�schools�(MOS�<�4).
�� Within-school�exclusions�consisted�of�students�with�special�educational�needs.
Sample Design�� Explicit�stratification�by�region�and�Slovak/Hungarian�school�status.
�� Implicit�stratification�by�public/church�or�private�status.
�� Sampled�two�classrooms�per�school.
�� All�sampled�students�for�PIRLS�also�were�asked�to�take�TIMSS�at�Grade 4.

| Methods and Procedures50 | PIRLS2011ChARACteRIStICS of NAtIoNAL SAmPLeS
Exhibit 55: Allocation of School Sample in the Slovak Republic, Fourth Grade
Explicit StrataTotal
Sampled Schools
Ineligible Schools
Participating SchoolsRefusal Schools
Excluded SchoolsOriginal
Schools1st
Replacements2nd
Replacements
Bratislavský – Slovak 16 0 16 0 0 0 0
Bratislavský – Hungarian 2 0 2 0 0 0 0
Trnavský – Slovak 14 1 12 1 0 0 0
Trnavský – Hungarian 8 0 6 2 0 0 0
Trenciansky – Slovak 18 0 16 1 1 0 0
Nitriansky – Slovak 18 0 18 0 0 0 0
Nitriansky – Hungarian 10 0 10 0 0 0 0
Žilinský – Slovak 26 1 24 1 0 0 0
Banskobystrický – Slovak 19 0 19 0 0 0 0
Banskobystrický – Hungarian 6 0 6 0 0 0 0
Prešovský – Slovak 32 0 30 1 0 1 0
Košický – Slovak 27 0 24 3 0 0 0
Košický – Hungarian 4 0 4 0 0 0 0
Total 200 2 187 9 1 1 0
SloveniaFourth GradeCoverage and Exclusions
�� Coverage�is�100�percent.
�� School-level�exclusions�consisted�of�very�small�schools�(MOS�<�5),�schools�for�students�with�special�needs�(58�schools),�Waldorf�schools,�and�schools�for�the�Italian�minority�(4�schools).
�� Within-school�exclusions�consisted�of�students�with�special�needs�enrolled�in�normal�school�classes�but�following�a�limited�curriculum.
Sample Design�� Explicit�stratification�by�region,�geographic�area,�and�“Grade 4”/ “Grade 4�&�Grade�8”�school�type.
�� Implicit�stratification�by�language�achievement�index,��mathematics�achievement�index,�and�region.
�� Sampled�two�classrooms�in�large�schools�(MOS�>�55).

Methods and Procedures | PIRLS2011ChARACteRIStICS of NAtIoNAL SAmPLeS | 51
�� There�were�two�census�strata�and�some�certainty�schools�outside�these�two�strata.�Variance�estimates�were�calculated�using�schools�as�variance�strata�for�these�certainty�schools.
�� Oversampling�to�allow�for�better�estimates�at�the�regional�level.
�� School�sample�overlap�between�TIMSS�(Grade�4),�PIRLS,�and�TIMSS�(Grade�8):�1)�Samples�were�drawn�all�at�once;�2)�Most�sampled�schools�in�the�“Grade�4�&�Grade�8”�stratum�were�asked�to�participate�in�all�studies;�and�3)�All�sampled�students�for�PIRLS�also�were�asked�to�take�TIMSS�at�Grade�4.
Exhibit 56: Allocation of School Sample between Studies in Slovenia
Explicit StrataTotal
Sampled Schools
Allocation of Schools
To PIRLSGrade 4
To TIMSSGrade 4
To TIMSSGrade 8
Grade 4 only 20 20 20 0
Grade 4 & Grade 8 189 182 182 189
Grade 8 only 2 0 0 2
Total 211 202 202 191
Exhibit 57: Allocation of School Sample in Slovenia, Fourth Grade
Explicit StrataTotal
Sampled Schools
Ineligible Schools
Participating SchoolsRefusal Schools
Excluded SchoolsOriginal
Schools1st
Replacements2nd
Replacements
Grade 4 only – Central 5 1 4 0 0 0 0
Grade 4 only – North-Eastern 3 0 3 0 0 0 0
Grade 4 only – South-Eastern 5 0 5 0 0 0 0
Grade 4 only – Western 7 0 6 0 0 1 0
Grade 4 & Grade 8 – Pomurska 16 0 14 2 0 0 0
Grade 4 & Grade 8 – Podravska 24 0 24 0 0 0 0
Grade 4 & Grade 8 – Koro ka 17 0 16 0 0 1 0
Grade 4 & Grade 8 – Savinjska 16 0 16 0 0 0 0
Grade 4 & Grade 8 – Zasavska 9 0 9 0 0 0 0
Grade 4 & Grade 8 – Spodnjeposavska 16 0 16 0 0 0 0

| Methods and Procedures52 | PIRLS2011ChARACteRIStICS of NAtIoNAL SAmPLeS
Explicit StrataTotal
Sampled Schools
Ineligible Schools
Participating SchoolsRefusal Schools
Excluded SchoolsOriginal
Schools1st
Replacements2nd
Replacements
Grade 4 & Grade 8 – Jugovzhodna Slovenija 10 0 9 0 0 1 0
Grade 4 & Grade 8 – Osrednjeslovenska 35 0 34 0 0 1 0
Grade 4 & Grade 8 – Gorenjska 13 0 13 0 0 0 0
Grade 4 & Grade 8 –Notranjsko-kra ka 3 0 3 0 0 0 0
Grade 4 & Grade 8 – Gorika 7 0 7 0 0 0 0
Grade 4 & Grade 8 –Obalno-kra ka 16 0 14 0 0 2 0
Total 202 1 193 2 0 6 0
SpainFourth GradeCoverage and Exclusions
�� Coverage�is�100�percent.
�� School-level�exclusions�consisted�of�very�small�schools�(MOS�<�4),�international�schools,�and�special�education�schools.
�� Within-school�exclusions�consisted�of�disabled�students�and�non-native�language�speakers�(less�than�1�year�of�instruction�in�language�of�assessment).
Sample Design�� Explicit�stratification�by�autonomous�community.
�� Implicit�stratification�by�public/private�status.��
�� Sampled�two�classrooms�per�school�in�larger�schools�(MOS�>�55).
�� Oversampling�in�Andalucía�and�in�the�Canary�Islands.
�� School�sample�overlap�between�PIRLS�and�TIMSS�at�Grade�4:�1)�Samples�were�drawn�all�at�once;�2)�A�subset�of�the�sampled�schools�in�Andalucía�and�in�the�Canary�Islands�participated�in�TIMSS;�and�3)�In�all�strata,�all�sampled�students�for�TIMSS�also�were�asked�to�take�PIRLS.
Exhibit 57: Allocation of School Sample in Slovenia, Fourth Grade (Continued)

Methods and Procedures | PIRLS2011ChARACteRIStICS of NAtIoNAL SAmPLeS | 53
Exhibit 58: Allocation of School Sample between Studies in Spain
Explicit StrataTotal
Sampled Schools
Allocation of Schools
To PIRLSGrade 4
To TIMSSGrade 4
Andalusia 150 150 30
Canary Islands 49 49 7
Other 115 115 115
Total 314 314 152
Exhibit 59: Allocation of School Sample in Spain, Fourth Grade
Explicit StrataTotal
Sampled Schools
Ineligible Schools
Participating SchoolsRefusal Schools
Excluded SchoolsOriginal
Schools1st
Replacements2nd
Replacements
Andalusia 150 0 149 0 0 1 0
Aragon 4 0 3 0 0 1 0
Asturias 2 0 2 0 0 0 0
Balearic Islands 4 0 4 0 0 0 0
Basque Country 6 0 5 1 0 0 0
Canary Islands 49 0 49 0 0 0 0
Cantabria 2 0 2 0 0 0 0
Castile and Leon 7 0 7 0 0 0 0
Castile-La Mancha 8 0 8 0 0 0 0
Catalonia 23 0 23 0 0 0 0
Ceuta and Melilla 2 0 2 0 0 0 0
Extremadura 4 0 4 0 0 0 0
Galicia 7 0 4 3 0 0 0
La Rioja 2 0 2 0 0 0 0
Madrid 20 0 20 0 0 0 0
Murcia 6 0 6 0 0 0 0
Navarra 2 0 2 0 0 0 0
Valencia 16 0 16 0 0 0 0
Total 314 0 308 4 0 2 0

| Methods and Procedures54 | PIRLS2011ChARACteRIStICS of NAtIoNAL SAmPLeS
SwedenFourth GradeCoverage and Exclusions
�� Coverage�is�100�percent.
�� School-level�exclusions�consisted�of�very�small�schools�(MOS�<�5),�international�schools,�and�special�schools�for�disabled�students.
�� Within-school�exclusions�consisted�of�students�with�special�needs.
Sample Design�� Explicit�stratification�by�immigrant�status,�and�new�school�status�since�school�listing.
�� Implicit�stratification�by�“Grade�4”�/�“Grade�4�&�Grade�8”�school�type�and�school�grade�point�average�(7).
�� Oversampling�to�allow�for�better�estimates�at�the�immigrant�status�level.�More�classrooms�were�sampled�in�“higher�percentage�of�immigrants”�strata.
�� School�sample�overlap�between�PIRLS�and�TIMSS�at�Grade�4:��1)�Samples�were�drawn�all�at�once;�and�2)�All�sampled�students�for�TIMSS�also�were�asked�to�take�PIRLS.
Exhibit 60: Allocation of School Sample in Sweden, Fourth Grade
Explicit StrataTotal
Sampled Schools
Ineligible Schools
Participating SchoolsRefusal Schools
Excluded SchoolsOriginal
Schools1st
Replacements2nd
Replacements
No Immigrants 56 2 52 2 0 0 0
Low Percentage of Immigrants 62 3 57 1 0 1 0
Medium Percentage of Immigrants 21 2 19 0 0 0 0
High Percentage of Immigrants 20 1 18 0 1 0 0
New Schools 2 0 2 0 0 0 0
Total 161 8 148 3 1 1 0

Methods and Procedures | PIRLS2011ChARACteRIStICS of NAtIoNAL SAmPLeS | 55
trinidadandtobagoFourth GradeCoverage and Exclusions
�� Coverage�is�100�percent.
�� School-level�exclusions�consisted�of�very�small�schools�(MOS�<�7).
�� No�within-school�exclusions.
Sample Design�� Explicit�stratification�by�educational�district.
�� Implicit�stratification�by�school�index�(very�high,�high,�medium,�and�low),�and�school�type�(denominational,�government,�and�private).
�� Sampled�two�classrooms�in�large�schools�(MOS�>�80).
Exhibit 61: Allocation of School Sample in Trinidad and Tobago, Fourth Grade
Explicit StrataTotal
Sampled Schools
Ineligible Schools
Participating SchoolsRefusal Schools
Excluded SchoolsOriginal
Schools1st
Replacements2nd
Replacements
Caroni 22 0 22 0 0 0 0
North Eastern 9 0 9 0 0 0 0
Port of Spain & Environs 28 0 28 0 0 0 0
St. George East 37 0 37 0 0 0 0
St. Patrick 16 0 15 0 0 1 0
South Eastern 11 0 11 0 0 0 0
Victoria 20 0 20 0 0 0 0
Tobago 7 0 7 0 0 0 0
Total 150 0 149 0 0 1 0
UnitedArabemiratesFourth GradeCoverage and Exclusions
�� Coverage�is�100�percent.
�� School-level�exclusions�consisted�of�schools�with�students�taught�in�languages�other�than�Arabic�and�English,�schools�that�are�geographically�inaccessible,�very�small�schools�(MOS�<�10),�and�special�education�schools�(see�the�Dubai�section).

| Methods and Procedures56 | PIRLS2011ChARACteRIStICS of NAtIoNAL SAmPLeS
�� Within-school�exclusions�consisted�of�students�with�functional�disabilities.
Sample Design�� Explicit�stratification�by�educational�zones�and�“Grade�4”�/�“Grade�4�&�Grade�8”�school�type.
�� Implicit�stratification�by�school�type�(public,�private,�and�“other”),�curricula,�school�gender�(boys,�co-educational,�or�girls),�and�assessment�language�(English,�Arabic,�or�both).
�� Census�of�all�schools�in�Dubai,�in�the�West�region�of�Abu�Dhabi,�and�in�the�educational�zone�of�Umm-Al�Quwain�(with�two�sampled�classrooms�per�school).�Classes�within�these�schools�were�used�to�build�jackknife�replicates�for�variance�calculation.�Also,�there�were�certainty�schools�outside�of�these�regions,�and�variance�calculation�was�done�following�the�same�approach�for�these�schools.
�� The�United�Arab�Emirates�was�divided�into�three�large�districts:�Abu�Dhabi�(Abu�Dhabi,�Al�Ain,�and�West�region),�Dubai,�and�the�rest�of�the�Emirates.�All�three�districts�were�oversampled�to�allow�for�better�estimates�at�the�district�level.
�� School�sample�overlap�between�TIMSS�(Grade�4),�PIRLS,�and�TIMSS�(Grade�8):�1)�Samples�were�drawn�all�at�once;�2)�All�sampled�schools�in�the�“Grade�4�&�Grade�8”�stratum�were�asked�to�participate�in�all�studies;�and�3)�All�sampled�students�for�PIRLS�also�were�asked�to�take�TIMSS�at�Grade�4.
Exhibit 62: Allocation of School Sample between Studies in the United Arab Emirates, Fourth Grade
Explicit StrataTotal
Sampled Schools
Allocation of Schools
To PIRLSGrade 4
To TIMSSGrade 4
To TIMSSGrade 8
Grade 4 only 187 187 187 0
Grade 4 & Grade 8 291 291 291 291
Grade 8 only 186 0 0 186
Total 664 478 478 477
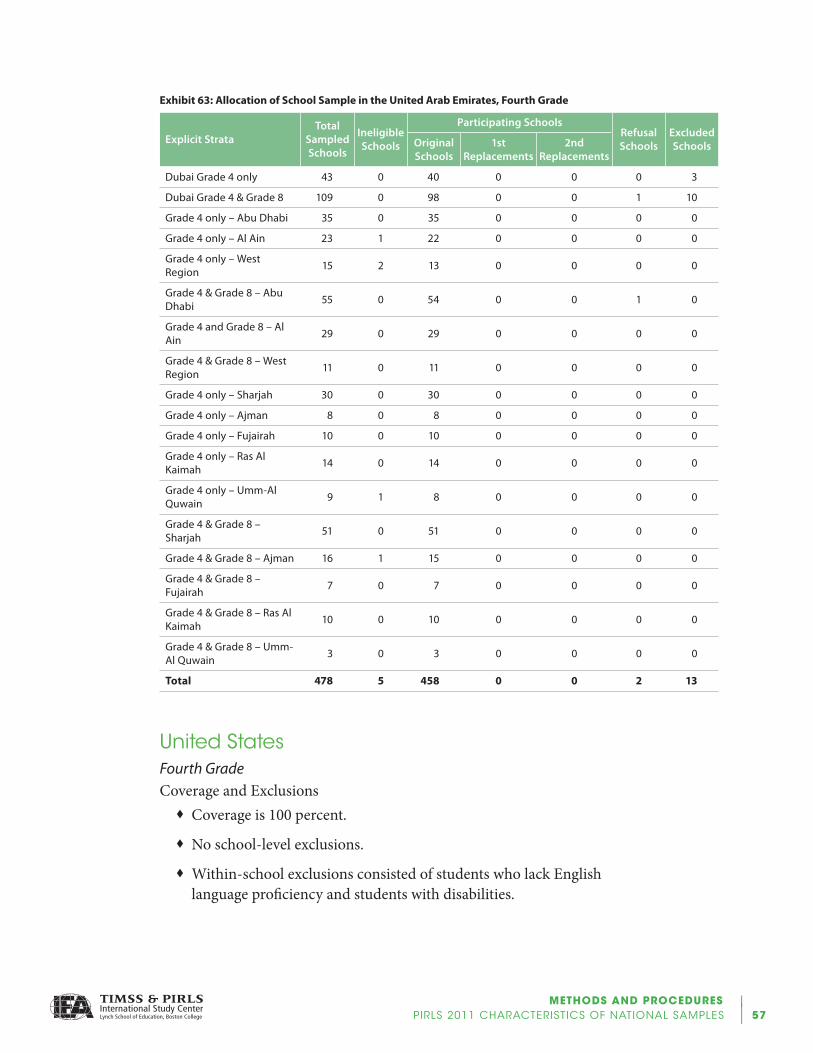
Methods and Procedures | PIRLS2011ChARACteRIStICS of NAtIoNAL SAmPLeS | 57
Exhibit 63: Allocation of School Sample in the United Arab Emirates, Fourth Grade
Explicit StrataTotal
Sampled Schools
Ineligible Schools
Participating SchoolsRefusal Schools
Excluded SchoolsOriginal
Schools1st
Replacements2nd
Replacements
Dubai Grade 4 only 43 0 40 0 0 0 3
Dubai Grade 4 & Grade 8 109 0 98 0 0 1 10
Grade 4 only – Abu Dhabi 35 0 35 0 0 0 0
Grade 4 only – Al Ain 23 1 22 0 0 0 0
Grade 4 only – West Region 15 2 13 0 0 0 0
Grade 4 & Grade 8 – Abu Dhabi 55 0 54 0 0 1 0
Grade 4 and Grade 8 – Al Ain 29 0 29 0 0 0 0
Grade 4 & Grade 8 – West Region 11 0 11 0 0 0 0
Grade 4 only – Sharjah 30 0 30 0 0 0 0
Grade 4 only – Ajman 8 0 8 0 0 0 0
Grade 4 only – Fujairah 10 0 10 0 0 0 0
Grade 4 only – Ras Al Kaimah 14 0 14 0 0 0 0
Grade 4 only – Umm-Al Quwain 9 1 8 0 0 0 0
Grade 4 & Grade 8 – Sharjah 51 0 51 0 0 0 0
Grade 4 & Grade 8 – Ajman 16 1 15 0 0 0 0
Grade 4 & Grade 8 – Fujairah 7 0 7 0 0 0 0
Grade 4 & Grade 8 – Ras Al Kaimah 10 0 10 0 0 0 0
Grade 4 & Grade 8 – Umm-Al Quwain 3 0 3 0 0 0 0
Total 478 5 458 0 0 2 13
UnitedStatesFourth GradeCoverage and Exclusions
�� Coverage�is�100�percent.
�� No�school-level�exclusions.
�� Within-school�exclusions�consisted�of�students�who�lack�English�language�proficiency�and�students�with�disabilities.

| Methods and Procedures58 | PIRLS2011ChARACteRIStICS of NAtIoNAL SAmPLeS
Sample Design�� Explicit�stratification�by�high/low�poverty�index,�public/private�status,�and�census�region.
�� Implicit�stratification�by�location�(city,�rural,�suburban,�or�town)�and�ethnic�status.
�� The�same�schools�were�sampled�for�both�PIRLS�and�TIMSS�studies.�Within�the�sampled�schools,�different�classrooms�(students)�were�sampled�for�each�study.�In�general,�two�classrooms�were�sampled�per�study�per�school.
�� Sampled�schools�with�only�one�classroom�were�randomly�assigned�to�PIRLS�or�TIMSS.�These�schools�were�treated�as�nonresponse.
�� Response�adjustment�cells�are�given�by�the�explicit�strata�for�all�schools�except�private�schools.�For�private�schools,�all�four�private�strata�were�merged�to�define�a�single�adjustment�cell.
�� Oversampling�to�compensate�for�losses�linked�to�splitting�the�sample�allocation�between�PIRLS�and�TIMSS�(in�previous�cycle,�sample�of�300�schools�with�two�classrooms�per�school).
Exhibit 64: Allocation of School Sample in the United States, Fourth Grade
Explicit StrataTotal
Sampled Schools
Ineligible Schools
Participating SchoolsRefusal Schools
Excluded SchoolsOriginal
Schools1st
Replacements2nd
Replacements
High poverty – Public – CENSREG = 1 20 1 13 1 0 5 0
High poverty – Public – CENSREG = 2 25 2 12 3 0 8 0
High poverty – Public – CENSREG = 3 84 1 71 2 1 9 0
High poverty – Public – CENSREG = 4 49 0 39 5 0 5 0
Private – CENSREG = 1 10 2 4 0 0 4 0
Private – CENSREG = 2 11 2 6 0 0 3 0
Private – CENSREG = 3 14 0 6 0 0 7 1
Private – CENSREG = 4 9 1 3 0 0 5 0
Low poverty – Public – CENSREG = 1 44 0 35 3 0 6 0
Low poverty – Public – CENSREG = 2 62 1 53 3 0 5 0

Methods and Procedures | PIRLS2011ChARACteRIStICS of NAtIoNAL SAmPLeS | 59
Explicit StrataTotal
Sampled Schools
Ineligible Schools
Participating SchoolsRefusal Schools
Excluded SchoolsOriginal
Schools1st
Replacements2nd
Replacements
Low poverty – Public – CENSREG = 3 72 1 65 0 0 6 0
Low poverty – Public – CENSREG = 4 50 1 42 3 0 4 0
Total 450 12 349 20 1 67 1
Exhibit 64: Allocation of School Sample in the United States, Fourth Grade (Continued)

| Methods and Procedures60 | PIRLS2011ChARACteRIStICS of NAtIoNAL SAmPLeS
PIRLS 2011 Characteristics of Benchmarking Participants
Alberta,CanadaFourth GradeCoverage and Exclusions
�� Coverage�is�100�percent.
�� School-level�exclusions�consisted�of�very�small�schools�(MOS�<�7).
�� Within-school�exclusions�consisted�of�students�with�special�needs.
Sample Design�� Explicit�stratification�by�“Grade�4”�/�“Grade�4�&�Grade�8”�school�type�and�school�size.
�� Implicit�stratification�by�funding�(private,�public,�and�“other”)�and�immersion�school�status�(yes�or�no).
�� There�were�only�three�certainty-selected�schools,�so�there�were�too�few�to�use�special�estimation�variance�procedures.
�� Sampled�two�classrooms�in�large�schools�(MOS�>�32).
�� School�sample�overlap�between�TIMSS�(Grade�4),�PIRLS,�and�TIMSS�(Grade�8):�1)�Samples�were�drawn�all�at�once;�2)�No�sampled�schools�involved�in�both�Grade�4�and�Grade�8�populations;�and�3)�Sampled�schools�from�the�large�strata�were�involved�in�both�PIRLS�and�TIMSS�at�Grade�4.�However,�students�within�the�schools�either�took�PIRLS�or�TIMSS.�No�students�took�both�PIRLS�and�TIMSS.
Exhibit 65: Allocation of School Sample between Studies in Alberta
Explicit StrataTotal
Sampled Schools
Allocation of Schools
To PIRLSGrade 4
To TIMSSGrade 4
To TIMSSGrade 8
Grade 4 only – Big 71 71 71 0
Grade 4 only – Small 72 36 36 0
Grade 4 & Grade 8 – Big 45 22 22 23
Grade 4 & Grade 8 – Small 72 21 21 30
Grade 8 only 97 0 0 97
Total 260 150 150 150

Methods and Procedures | PIRLS2011ChARACteRIStICS of NAtIoNAL SAmPLeS | 61
Exhibit 66: Allocation of School Sample in Alberta, Fourth Grade
Explicit StrataTotal
Sampled Schools
Ineligible Schools
Participating SchoolsRefusal Schools
Excluded SchoolsOriginal
Schools1st
Replacements2nd
Replacements
Grade 4 only – Big 71 1 69 0 0 1 0
Grade 4 only – Small 36 1 34 0 0 1 0
Grade 4 & Grade 8 – Big 22 1 21 0 0 0 0
Grade 4 & Grade 8 – Small 21 0 19 2 0 0 0
Total 150 3 143 2 0 2 0
ontario,CanadaFourth GradeCoverage and Exclusions
�� Coverage�is�100�percent.
�� School-level�exclusions�consisted�of�very�small�schools�(MOS�<�6),�First�Nations�schools,�and�special�education�schools.
�� Within-school�exclusions�consisted�of�students�with�special�educational�needs�and�students�who�do�not�speak�English�or�French.
Sample Design�� Explicit�stratification�by�“Grade�4”�/�“Grade�4�&�Grade�8”�school�type�and�English/French�status.
�� Implicit�stratification�by�geographic�region�(Barrie,�London,�Ottawa,�Sudbury,�Thunder�Bay,�and�Toronto)�and�type�of�school�(Catholic,�private,�Protestant�separate,�and�public).
�� Sampled�two�classrooms�in�large�schools�(MOS�>�49).
�� There�were�some�certainty-selected�schools�but�there�were�too�few�to�use�special�estimation�variance�procedures.
�� Oversampling�in�the�“French”�strata.�
�� School�sample�overlap�between�TIMSS�(Grade�4),�PIRLS,�and�TIMSS�(Grade�8):�1)�Samples�were�drawn�all�at�once;�2)�No�sampled�schools�involved�in�both�TIMSS�at�Grade�4�and�PIRLS;�3)�All�sampled�schools�from�the�“Grade�4�&�Grade�8”�strata�are�involved�in�either�PIRLS�or�TIMSS�at�Grade�4;�and�4)�A�subset�of�these�“Grade�4�&�Grade�8”�schools�also�were�involved�in�TIMSS�at�Grade�8.

| Methods and Procedures62 | PIRLS2011ChARACteRIStICS of NAtIoNAL SAmPLeS
Exhibit 67: Allocation of School Sample between Studies in Ontario
Explicit StrataTotal
Sampled Schools
Allocation of Schools
To PIRLSGrade 4
To TIMSSGrade 4
To TIMSSGrade 8
Grade 4 only English 85 39 46 0
Grade 4 only French 59 53 6 0
Grade 4 & Grade 8 – English 175 81 94 106
Grade 4 & Grade 8 – French 31 27 4 2
Grade 8 only 42 0 0 42
Total 392 200 150 150
Exhibit 68: Allocation of School Sample in Ontario, Fourth Grade
Explicit StrataTotal
Sampled Schools
Ineligible Schools
Participating SchoolsRefusal Schools
Excluded SchoolsOriginal
Schools1st
Replacements2nd
Replacements
Grade 4 only English 39 0 38 0 0 0 1
Grade 4 only French 53 3 49 0 0 1 0
Grade 4 & Grade 8 – English 81 4 74 1 0 1 1
Grade 4 & Grade 8 – French 27 0 27 0 0 0 0
Total 200 7 188 1 0 2 2
Québec,CanadaFourth GradeCoverage and Exclusions
�� Coverage�is�100�percent.
�� School-level�exclusions�consisted�of�special�needs�schools,�very�small�schools�(MOS�<�10),�Native�schools,�and�non-Ministry�Schools.
�� Within-school�exclusions�consisted�of�children�with�disabilities.
Sample Design�� Explicit�stratification�by�“Grade�4”�/�“Grade�4�&�Grade�8”�school�type�and�English/French�status.
�� Implicit�stratification�by�public/private�status,�and�Native�status�(yes�or�no).
�� Sampled�one�classroom�per�school.

Methods and Procedures | PIRLS2011ChARACteRIStICS of NAtIoNAL SAmPLeS | 63
�� There�were�some�certainty-selected�schools,�but�there�were�too�few�to�use�special�estimation�variance�procedures.
�� Oversampling�of�the�“English”�strata.
�� School�sample�overlap�between�TIMSS�(Grade�4),�PIRLS,�and�TIMSS�(Grade�8):�1)�Samples�were�drawn�all�at�once;�2)�All�sampled�schools�in�the�“Grade�4�&�Grade�8”�stratum�were�asked�to�participate�in�all�studies;�and�3)�All�sampled�students�for�PIRLS�also�were�asked�to�take�TIMSS�at�Grade�4.
Exhibit 69: Allocation of School Sample between Studies in Québec
Explicit StrataTotal
Sampled Schools
Allocation of Schools
To PIRLSGrade 4
To TIMSSGrade 4
To TIMSSGrade 8
Grade 4 only 184 184 184 0
Grade 4 & Grade 8 16 16 16 16
Grade 8 only 184 0 0 184
Total 384 200 200 200
Exhibit 70: Allocation of School Sample in Québec, Fourth Grade
Explicit StrataTotal
Sampled Schools
Ineligible Schools
Participating SchoolsRefusal Schools
Excluded SchoolsOriginal
Schools1st
Replacements2nd
Replacements
Grade 4 only – French 114 0 108 1 0 5 0
Grade 4 only – English 70 2 65 0 0 2 1
Grade 4 & Grade 8 – French 6 0 6 0 0 0 0
Grade 4 & Grade 8 – English 10 0 10 0 0 0 0
Total 200 2 189 1 0 7 1
maltese—maltaFourth Grade (Maltese —Year 5)Coverage and Exclusions
�� Coverage�is�100�percent.
�� No�school-level�exclusions.
�� No�within-school�exclusions.

| Methods and Procedures64 | PIRLS2011ChARACteRIStICS of NAtIoNAL SAmPLeS
Sample Design�� No�explicit�stratification.
�� Implicit�stratification�by�Malta/Gozo�location,�and�school�type�(church,�independent,�and�state).
�� Census�of�all�students.�All�variance�estimates�were�derived�using�classrooms�as�variance�strata.
Exhibit 71: Allocation of School Sample in Malta (Maltese), Fourth Grade
Explicit StrataTotal
Sampled Schools
Ineligible Schools
Participating SchoolsRefusal Schools
Excluded SchoolsOriginal
Schools1st
Replacements2nd
Replacements
Malta 99 3 95 0 0 0 1
Total 99 3 95 0 0 0 1
eng/Afr(5)—RSA(RepublicofSouthAfrica)Fifth Grade Coverage and Exclusions
�� Coverage�is�38�percent.�Coverage�in�South�Africa�(PIRLS)�was�restricted�to�schools�where�language�of�instruction�is�either�Afrikaans�or�English�(38%�of�the�international�target�population).
�� School-level�exclusions�consisted�of�very�small�schools.
�� No�within-school�exclusions.
Sample Design�� Explicit�stratification�by�“Grade�4”�/�“Grade�4�&�Grade�8”�school�type�and�language�of�instruction.
�� Implicit�stratification�by�school�type�(one�language,�two�languages,�and�multi-language),�and�province�(9).
�� Sampled�two�classrooms�(one�from�each�language)�where�both�languages�were�found�in�the�school.
�� School�sample�overlap�between�PIRLS�(Grade�5)�and�prePIRLS�(see�the�prePIRLS�section,�below).
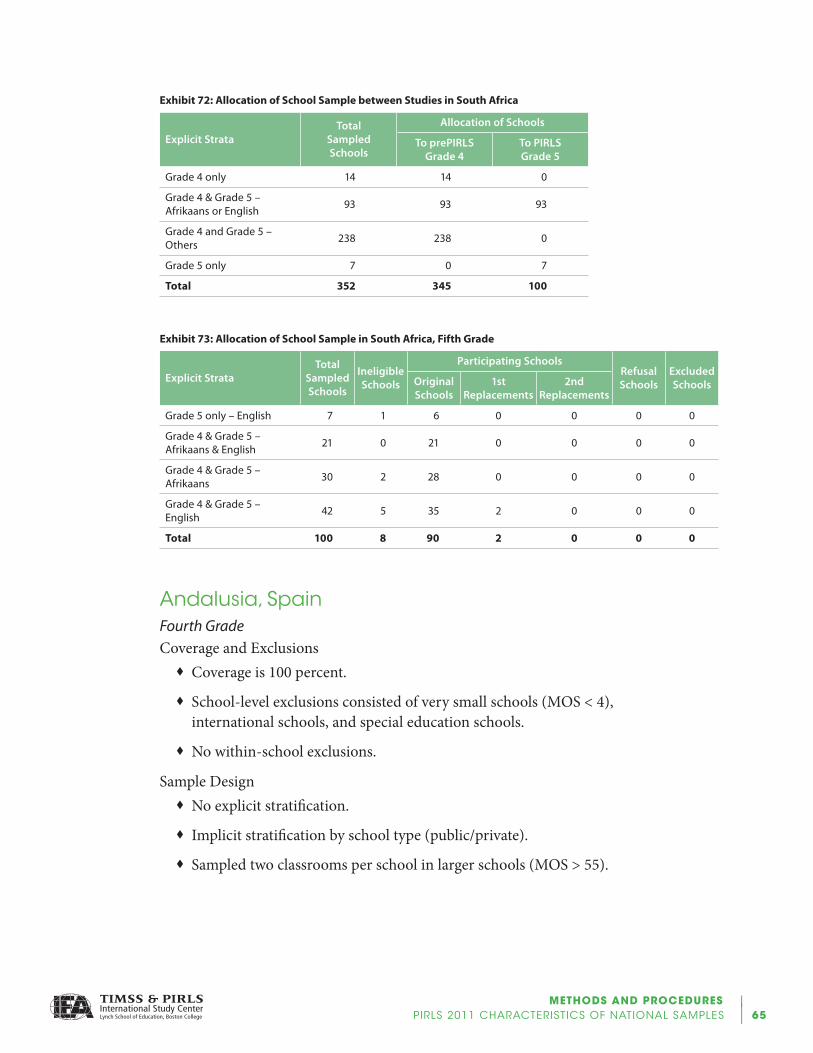
Methods and Procedures | PIRLS2011ChARACteRIStICS of NAtIoNAL SAmPLeS | 65
Exhibit 72: Allocation of School Sample between Studies in South Africa
Explicit StrataTotal
Sampled Schools
Allocation of Schools
To prePIRLSGrade 4
To PIRLSGrade 5
Grade 4 only 14 14 0
Grade 4 & Grade 5 – Afrikaans or English 93 93 93
Grade 4 and Grade 5 – Others 238 238 0
Grade 5 only 7 0 7
Total 352 345 100
Exhibit 73: Allocation of School Sample in South Africa, Fifth Grade
Explicit StrataTotal
Sampled Schools
Ineligible Schools
Participating SchoolsRefusal Schools
Excluded SchoolsOriginal
Schools1st
Replacements2nd
Replacements
Grade 5 only – English 7 1 6 0 0 0 0
Grade 4 & Grade 5 – Afrikaans & English 21 0 21 0 0 0 0
Grade 4 & Grade 5 – Afrikaans 30 2 28 0 0 0 0
Grade 4 & Grade 5 – English 42 5 35 2 0 0 0
Total 100 8 90 2 0 0 0
Andalusia,SpainFourth GradeCoverage and Exclusions
�� Coverage�is�100�percent.
�� School-level�exclusions�consisted�of�very�small�schools�(MOS�<�4),�international�schools,�and�special�education�schools.
�� No�within-school�exclusions.
Sample Design�� No�explicit�stratification.
�� Implicit�stratification�by�school�type�(public/private).
�� Sampled�two�classrooms�per�school�in�larger�schools�(MOS�>�55).

| Methods and Procedures66 | PIRLS2011ChARACteRIStICS of NAtIoNAL SAmPLeS
�� 150�schools�were�sampled�for�PIRLS�(these�included�30�schools�already�sampled�for�TIMSS�in�the�national�sample�for�Spain).�All�sampled�schools�for�Andalusia�were�used�to�produce�the�national�estimates�for�Spain.
Exhibit 74: Allocation of School Sample in Andalusia, Fourth Grade
Explicit StrataTotal
Sampled Schools
Ineligible Schools
Participating SchoolsRefusal Schools
Excluded SchoolsOriginal
Schools1st
Replacements2nd
Replacements
Andalusia 150 0 149 0 0 1 0
Total 150 0 149 0 0 1 0
AbuDhabi,UAeFourth GradeCoverage and Exclusions
�� Coverage�is�100�percent.
�� School-level�exclusions�consisted�of�very�small�schools�and�schools�with�students�taught�in�languages�other�than�Arabic�and�English.
�� No�within-school�exclusions.
�� Two�school�census�strata�(West�region).�Variance�calculation�was�adjusted�accordingly.
Sample Design�� Explicit�stratification�by�“Grade�4”�/�“Grade�4�&�Grade�8”�schools�and�educational�zones.
�� Implicit�stratification�by�private/public�status,�curricula�(24),�school�gender�(boys,�co-educational,�or�girls),�and�test�language�(English,�Arabic,�or�both).
�� Sampled�two�classrooms�per�school�in�the�West�region.
�� All�schools�from�the�West�region�were�sampled.�Classes�within�schools�were�used�to�build�jackknife�replicates�for�variance�calculation.�There�were�certainty�schools�(schools�selected�with�certainty)�outside�of�that�region,�and�variance�calculation�was�conducted�following�the�same�approach�for�these�schools.��

Methods and Procedures | PIRLS2011ChARACteRIStICS of NAtIoNAL SAmPLeS | 67
�� School�sample�overlap�between�TIMSS�(Grade�4),�PIRLS,�and�TIMSS�(Grade�8):�1)�Samples�were�drawn�all�at�once;�2)�All�sampled�schools�in�the�“Grade�4�&�Grade�8”�stratum�were�asked�to�participate�in�all�studies;�and�3)�All�sampled�students�for�PIRLS�also�were�asked�to�take�TIMSS�at�Grade�4.
Exhibit 75: Allocation of School Sample between Studies in Abu Dhabi
Explicit StrataTotal
Sampled Schools
Allocation of Schools
To PIRLSGrade 4
To TIMSSGrade 4
To TIMSSGrade 8
Grade 4 only 73 73 73 0
Grade 4 & Grade 8 95 95 95 95
Grade 8 only 75 0 0 75
Total 243 168 168 170
Exhibit 76: Allocation of School Sample in Abu Dhabi, Fourth Grade
Explicit StrataTotal
Sampled Schools
Ineligible Schools
Participating SchoolsRefusal Schools
Excluded SchoolsOriginal
Schools1st
Replacements2nd
Replacements
Grade 4 only – Abu Dhabi 35 0 35 0 0 0 0
Grade 4 only – Al Ain 23 1 22 0 0 0 0
Grade 4 only – West region 15 2 13 0 0 0 0
Grade 4 & Grade 8 – Abu Dhabi 55 0 54 0 0 1 0
Grade 4 & Grade 8 – Al Ain 29 0 29 0 0 0 0
Grade 4 & Grade 8 – West region 11 0 11 0 0 0 0
Total 168 3 164 0 0 1 0
Dubai,UAeFourth GradeCoverage and Exclusions
�� Coverage�is�100�percent.
�� School-level�exclusions�consisted�of�schools�with�students�taught�in�languages�other�than�Arabic�and�English,�special�education�schools,�and�very�small�schools�(MOS�<�10).�Statistics�on�special�education�schools�

| Methods and Procedures68 | PIRLS2011ChARACteRIStICS of NAtIoNAL SAmPLeS
were�not�available�and�were�estimated�using�the�sample.�They�are�found�under�the�within-school�exclusion�rates.
�� Within-school�exclusions�consisted�of�students�with�special�educational�needs.
Sample Design�� Explicit�stratification�by�“Grade�4”�/�“Grade�4�&�Grade�8”�schools.
�� Implicit�stratification�by�curricula�(14)�and�assessment�language�(English,�Arabic,�or�both).
�� Sampled�two�classrooms�per�school.�
�� All�schools�were�sampled.�Classes�within�schools�were�used�to�build�jackknife�replicates�for�variance�calculation.
�� School�sample�overlap�between�TIMSS�(Grade�4),�PIRLS,�and�TIMSS�(Grade�8):�1)�Samples�were�drawn�all�at�once;�2)�All�sampled�schools�in�the�“Grade�4�&�Grade�8”�stratum�were�asked�to�participate�in�all�studies;�and�3)�All�sampled�students�for�PIRLS�also�were�asked�to�take�TIMSS�at�Grade�4.�
Exhibit 77: Allocation of School Sample between Studies in Dubai
Explicit StrataTotal
Sampled Schools
Allocation of Schools
To PIRLSGrade 4
To TIMSSGrade 4
To TIMSSGrade 8
Grade 4 only 43 43 43 0
Grade 4 & Grade 8 109 109 109 109
Grade 8 only 34 0 0 34
Total 186 152 152 143
Exhibit 78: Allocation of School Sample in Dubai, Fourth Grade
Explicit StrataTotal
Sampled Schools
Ineligible Schools
Participating SchoolsRefusal Schools
Excluded SchoolsOriginal
Schools1st
Replacements2nd
Replacements
Dubai Grade 4 only 43 0 40 0 0 0 3
Dubai Grade 4 & Grade 8 109 0 98 0 0 1 10
Total 152 0 138 0 0 1 13

Methods and Procedures | PIRLS2011ChARACteRIStICS of NAtIoNAL SAmPLeS | 69
florida,UnitedStatesFourth GradeCoverage and Exclusions
�� Coverage�is�89�percent.�Coverage�in�this�state�was�restricted�to�students�in�public�schools�(89%�of�the�international�target�population).
�� No�school-level�exclusions.
�� Within-school�exclusions�consisted�of�students�who�lack�English�language�proficiency�and�students�with�disabilities.
Sample Design�� Explicit�stratification�by�high/low�poverty�index.
�� Implicit�stratification�by�location�(city,�rural,�suburban,�or�town)�and�ethnic�status.�
�� The�same�schools�were�sampled�for�both�TIMSS�and�PIRLS�studies.�Within�the�sampled�schools,�different�classrooms�(students)�were�sampled�for�each�study.�In�general,�two�classrooms�were�sampled�per�study�per�school.
�� The�TIMSS�National�US�sampled�schools�were�added�to�this�sample�with�new�school�IDs.�The�“supplemental”�school�sample�was�selected�by�controlling�for�overlap�with�the�TIMSS�National�US�and�NAEP�(Alpha–public�schools)�samples�using�the�Chowdhury�approach�(samples�drawn�sequentially).�This�strategy�maximized�the�overlap�with�the�TIMSS�national�sample�and�minimized�the�overlap�with�the�NAEP�(Alpha–public�schools)�sample.�In�summary,�priority�was�given�to�schools�selected�for�the�TIMSS�national�sample�(including�schools�also�selected�for�the�NAEP�Alpha�sample);�then�priority�was�given�to�schools�not�selected�for�either�the�TIMSS�national�or�NAEP�Alpha�samples;�and�finally�priority�was�given�to�schools�selected�for�the�NAEP�Alpha�sample�and�not�selected�for�the�TIMSS�national�sample.
Exhibit 79: Allocation of School Sample in Florida, Fourth Grade
Explicit StrataTotal
Sampled Schools
Ineligible Schools
Participating SchoolsRefusal Schools
Excluded SchoolsOriginal
Schools1st
Replacements2nd
Replacements
High Poverty 42 0 39 0 0 2 1
Low Poverty 39 0 38 0 0 1 0
Total 81 0 77 0 0 3 1