Embed Size (px)
Citation preview

8
2. As a means of energy conservation, incentives to users of energy-saving modes (e.g., bus or carpool) are preferred by respondents to economic disincentives to people who do not use such modes.
3. Respondents agree that carpooling and bus travel save money and energy, but the majority of them view these modes as impractical for themselves.
4. Travel time and convenience to the traveler are favored over saving monev and energy in the choice of a mode of transportation.
5. The majority of respondents thinks it is important to make major improvements to public transportation in southeastern Michigan, but when they were questioned about financing mechanisms, fares paid by passengers and federal government subsidy were the only two financing options favored by a majority of the sample. Thus, the respondents recognize a need for public transportation but feel that someone else should pay for it.
CONCLUSIONS
A small-sample, supplemental 0-D survey was conducted successfully by using a personal home interview to collect attitudinal and demographic data and a travel diary to collect a 24-h travel record for all household members 5 years old and older. The sample size and distribution were based on the trip-rate variances estimated from 1965 data, with some modifications; a sample of about 2500 households was generated that achieved the desired accuracy of ±5 percent error with 90 percent confidence.
The trip rates exhibited from this survey show a 17 percent increase over the rates measured in 1965, which seems to be consistent with other recent surveys measuring trip rates. Within this 17 percent overall increase, a decrease was found in home-based work trips and increases in all other trips, particularly non-home-based trips. It is not clear, however, to what extent these measured increases are the result of real increases in tripmaking or are the result of a different survey mechanism (the travel diary), which could be ex-
Transportation Research Record 886
pected to provide a more accurate picture of tripmaking.
The results of the attitude survey are, for the most part, unsurprising but serve to confirm a number of prevailing professional expectations and assessments, particularly in relation to transportation energy and the use of carpools and tr~nsit. Two points that deserve particular emphasis are, first, that 68 percent of the sample know very little or nothing about transit in the southeast Michigan reg ion (this percentage does not change when the data area is expanded to the entire region), whereas less than 6 percent consider that they are very familiar with regional transit services and that federal subsidies are seen as the preferred mechanism to fund transportation improvements. This second finding is particularly relevant given current changes in policy occurring at the federal level with respect to transportation funding. It is also noteworthy that lack of knowledge of regional transit services seems to have little impact on the perception that transit improvements are needed; these are favored by almost 90 percent of respondents.
ACKNOWLEDGMENT
The opinions, findings, and conclusions expressed in this paper are ours and not necessarily those of the u .s. Department of Transportation, Federal Highway Administration, Urban Mass Transportation Administration, or the State of Michigan.
REFERENCES
1. Consistency of Origin-Destination (0-D) Characteristics through Time. !TE Journal , Oct. 1979, pp. 32-39.
2. Preparation for the 1980 March 1979, pp. 41-47.
Census. !TE Journal,
3. M.E. Smith. Design of view Travel Surveys. search Record 701, 1979,
Small-Sample Home-InterTRB, Transportation Repp. 29-35.
Pilot Testing of Alternative Administrative Procedures and Survey Instruments IRA M. SHESKIN AND PETER R. STOPHER
Traditionally, pilot surveys have involved pretests of the survey instrument and administrative procedures to be employed in the main survey. Such pilot surveys usually have attempted to pretest a single version of the survey instrument and the administrative procedures and to seek appropriate refinements. By using examples from the Dade County On-Board Transit Survey and a Midwest regional travel survey, it is argued that an important and underused part of a pilot study is comparisons between various alternative administrative procedures or survey-instrument components, in which each alternative is foreseen to have both advantages and disadvantages. The pilot study is likely to provide considerable information on the relative merits of the alternatives tested and will lead to improved design of the final instrument or procedure. Such testing may lead frequently to decisions that can have extensive impacts on response rate, response quality, or survey cost.
Survey research is in many ways as much an art as it is a science. While it is possible to transfer general procedures from one spatial and temporal setting to another, each survey effort is to a large extent unique. Thus, every survey should be preceded by a pilot study (_!, p. 205). Often, pilot studies have consisted only of a pretest of the questionnaire, perhaps even administered to a sample not representative of the population to be sampled in the main survey. In a university setting, this usually translates to the testing of the questionnaire on a captive classroom audience; in other settings often only an in-house test is performed. Four reasons may be seen for the employment of cursory pilot studies in most cases. First, it is

Transportation Research Record 886
possible that some researchers have not recognized the importance of a full-scale pilot study. Second, budgetary constraints often have obviated any largescale pilot-study effort, frequently because the importance of budgeting for it was not recognized. Third, time considerations may make it infeasible to carry out a pilot study. Fourth, if the survey effort falls under the rules and requirements of the U. S. Office of Management and Budget (OMB), a pilot test on more than 10 people requires OMB approval. This approval is likely to involve sufficient lead time and delays to make a pilot test infeasible for all but extremely large censuses and surveys, which is surely in contradiction to the intent that lies behind the OMB role in survey approvals.
The purpose of this paper is to discuss the need to pretest alternative survey forms and the probable benefits that accrue. The major contention is that if two or more proposed procedures or proposed methods for asking a question are foreseen to have both advantages and disadvantages, both procedures should be tested in a pilot study. The need to test alternative procedures is highlighted by Dillman (±_).
DADE COUNTY ON-BOARD TRANSIT SURVEY AND MIDWEST REGIONAL TRAVEL SURVEY
The discussion in this paper employs examples from pilot studies designed by us for two transportation surveys: the Dade County On-Board Transit Survey and a Midwest regional travel survey. A brief description of the purposes of each survey and the survey mechanisms follows.
The Dade County On-Board Transit Survey was designed to collect data from a random sample of bus passengers (ll· The principal purposes of the survey were to provide the following:
1. A major test of a proposed monitoring and surveillance activity for the Metro Transit Agency (MTA) as called for by the Transportation Development Program (TDP) (4);
2. A partial supplement to the travel data collected by the 1980 census on trips to work and part of a data base for using the census data to update trip-rate estimates for nonwork trips;
3. Needed data on bus ridership in the central business district (CBD) (the current data base is seriously deficient in this part of the matrix);
4. Improved data to MTA for use in adjusting its revenue-based, patronage-estimating formula, particularly as needed after recent changes in transfer policies;
5. Data on the use of media by bus passengers, particularly as it relates to providing riders and potential riders with information on the bus system and the services available;
6. Part of the data needs for a recalibration of the Dade County modal-split model; and
7. Data on the perceptions of riders about the MTA system and specific elements of it and a basis for comparing bus-rider judgments (attitudes) with those of the general population of Dade County; the latter were collected in a separate survey in 1980 by MTA (§).
As is common in most u.s. urban areas, bus riders constitute less than 10 percent of the population of Dade County. Hence, any survey aimed specifically at bus riders would be highly inefficient if the sample were drawn from households, employees, or any other non-travel-specific grouping of the population. Thus, the survey mechanism was designed as an intercept survey of bus passengers. A dual survey mechanism was employed that included a brief form to
9
be completed on the bus and a longer, take-home, mail-back survey (_§).
The Midwest regional travel survey was designed to collect data from a stratified random sample of the population in seven counties. The principal purposes of the survey were to provide the following data:
1. The means of update trip-gener.ation rates and modal-split models,
2. Attitudes of the population toward transportation and energy (1_) ,
3. Attitudes toward possible changes in the transit system, and
4. Preferred methods of obtaining information on carpooling.
The trip-generation and modal-split models to be updated use certain demographic character is tics and income as input variables, so these characteristics must be measured to permit updating to be accomplished. Also, the survey coincided with a period of high unemployment in the southeast Michigan region (mainly connected with a low cycle in the automotive industry). Because of the potential effects of this on tripmaking, detailed information was required on employment status.
The selected survey mechanism was the home-interview survey. Two instruments were used. The first was an attitudinal demographic survey asked of a randomly selected adult household member. The second was a travel log distributed to each household member more than five years old and designed to obtain trip information for a 24-h weekday period.
TESTING ALTERNATIVE SURVEY FORMS
Dade Coun t y o n-Boa rd Transi t su r vey
Frequently, in the design of a survey instrument, two or more ways appear to be potentially useful to ask a given question or set of questions; or there may be several possible ways to request answers, e.g., by using 5-point, 6-point, or 7-point scales on judgmental questions. Similarly, many survey instruments may contain questions that are particularly crucial to the purposes of the survey but that are difficult to ask. For such situations, two or more alternative formats often will be developed for such questions, but choice among them may not be obvious. In either case, the most definitive test of the alternative formats is to use each one as part of the pilot study. To do this, a carefully structured scientific test of each alternative must be developed. An example is described in this section based on a set of problem questions in the Dade County On-Board Transit Survey.
In that survey, questions concerning respondents' perceptions of the times and costs of bus transportation versus alternative modes needed to be asked for purposes of recalibrating the Dade County modalspli t model, but all suggested formats for asking these questions were viewed as difficult. Compounding this problem is the fact that bus riders are not a random sample of the population but rather are more likely to be members of specific sociodemographic groups in which problems of compre hension or concentration are likely to be more pronounced. This section describes in more detail the forms (including the alternative formats) used on the pilot study of the Dade County survey and the results obtained.
The survey instrument was designed as a two-part entity. An on-board form (form a) was printed on card stock (to make it easier to fill out while riding a bus) and was designed to be short enough to

10
Figure 1. Instruction sheet.
METRO-DADE -· TRANSIT SURVEY DEAR BUS AIDER,
ME TAO-DADE WK.L SOON l!IE MAKINO MAJOR CH ... NOES IN THE BUS
• r t 11:u t'OUI •fllt.U' Ill Nu.~ ao ""* C• llf w""'°' k14'1& 1roc fotft l\IJ 'nt(u W&:I, M•lit 'l'OU M I Ull
00 PLEASE Fill OUT FOAM a NOW ANO H.l.HD IT IN
H f O:iti 10~ Ctet Ol'P" nc I I
[ti] PLEASE FILL OUT FORM b LATEll (WHlN 'IOU HAVE
TIME) ANO PUJ 11 IN THE ENVELOPE WE HAVE OIVEN
YOU "NO MAIL If BACK (NO POSTAOI! 18 NECESSARY)
a WHEN FOlllll '•'AHO FOAM 'b' Mil.VE llUN ,.LU:D OUT
ANO RETURNED, WE Will MAIL YOU A PASS FOR special thank you! FREE AIDES ON METFIOBUS
000348 rhl this .
form [6] L.::..I IS
00 this .
form ~ IS
fill out on a bus. Although a reply-paid panel was printed on this card so that mail return was possible, the form was designed to be placed in a •eceptacle at the eKit door of the bus or handed back to the survey person. The second part was a longer, take-home form (form b) designed to be completed at home and mailed in in the reply-paid envelope provided. The whole package was stapled and included an instruction page and a letter from the county transportation coordinator (Figure 1) • The instruction page eKplained briefly the purpose of the survey and instructed respondents that form a was to be completed on the bus but that form b was to be done at home and returned by mail. In addition, a free bus-pass incentive was offered to gain cooperation. The back of this page contained helpful county telephone numbers. The letter from the transportation coordinator stated the reasons for the survey and the importance of each person's contribution, reviewed the instructions for filling out the forms, and provided a telephone number for help, comments, or verification that this was a bona fide survey. The entire survey instrument was combined so that, when one looked at the instruction page, a 1-in tab from each of form a and form b showed below the top page. This simplified the problem for the respondent of finding each form. The
Transportation Research Record 886
major reason for the two-part form was to permit the evaluation of nonresponse bias (6).
In the pilot study, 2158 foi=iiis were distributed: 632 (29 percent) of the on-board forms and 380 (18 percent) of the take-home forms were returned, although due to time constraints only 301 of the ~ake-home forms were computerized.
Two versions of the on-board form and three versions of the take-home form were devised. Because a possible "shadow effect" of one questionnaire on another eKisted, each on-board form (called the on-board short and the on-board long for reasons eKplained below) was combined in equal numbers with each take-home form (called .he take-home short, take-home long, and take-home table). This produced the following siK versions of the questionnaire:
l. On-board short/take-home short, 2. On-board short/take-home table, 3. On-board short/take-home long, 4. on-board long/take-home short, 5. On-board long/take-home table, and 6. On-board long/take-home long.
These versions were distributed in a systematic miK to consecutive bus riders as they boarded to assure that, as far as possible, the full range of siK survey instruments was distributed at each bus stop.
Alternative On-Board Forms
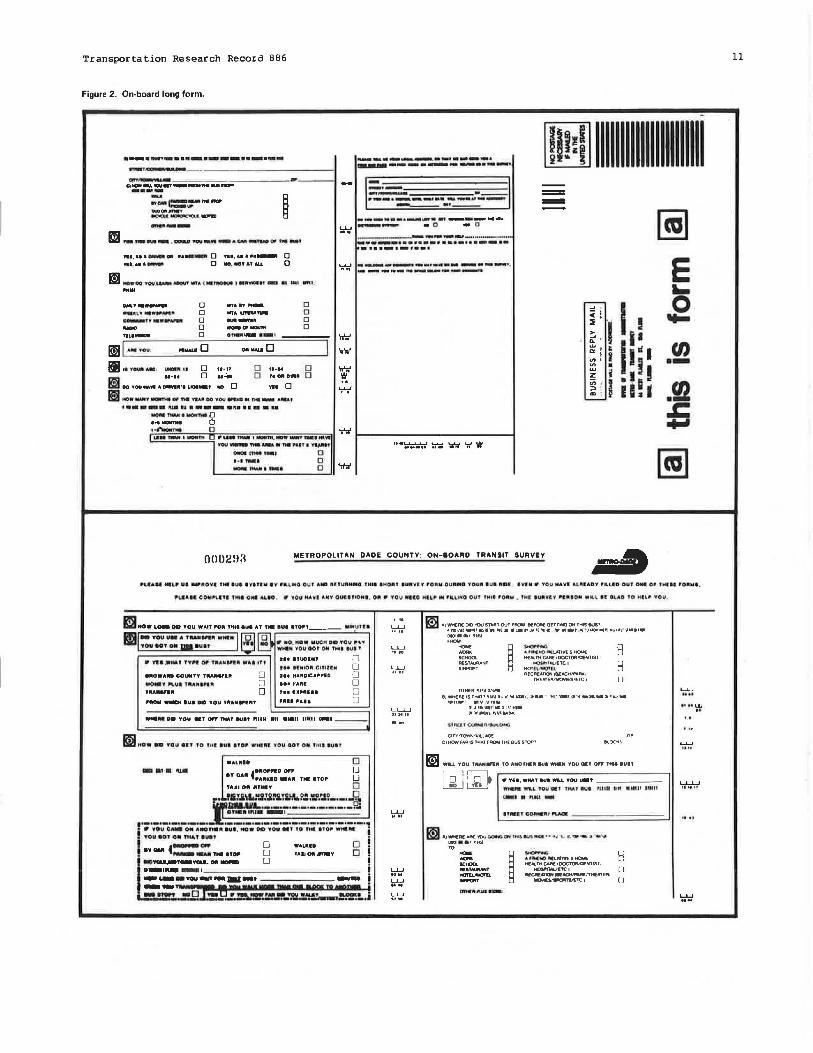
The major purpose of the on-board form was to elicit some response from persons who would not be bothered to take a form home, spend 45 min completing it, and remember to mail it (see Figure 2). Also, reading and writing on a moving bus is very difficult and many persons in Dade County, particularly the elderly, ride the bus for only a few blocks at a time. All these considerations seemed to dictate the use of an on-board form that was as brief as possible.
A competing force, however, was the importance of collecting origin-destination information by trip purpose from as many passengers as possible. Because the response rate would be higher on the on-board form than on the take-home form, the possibility of asking for origin-destination information on the on-board form presented itself. Obtaining such information is not simple becau~e it means asking people for the addresses of their origin and destination as open-ended questions. This can have a number of negative impacts on the survey. First, the length of the document increases significantly (questions 4 and 6 in Figure 2). Second, these questions require writing words while one is on a moving bus rather than simply checking a boK or writing one or two numbers on a line. Third, such questions very well may frustrate respondents who do not know the address of their origin or destination and they may simply stop filling out the form. Fourth, any self-administered survey is biased against the illiterate, but a semiliterate person may be able to handle a form on which he or she can read slowly and check boKes. such a person would eKperience difficulty with the origin-destination questions.
Thus, it was decided to create two versions of the on-board form: the on-board short and the on-board long. The only difference between the two forms is that the on-board long contains the origin-destination questions. Figure 2 shows the on-board long form. Note that questions 4 and 6 (including the part of question 6 continued on the back of the form) occupy an entire column of the form and increase its length by about 33 percent.
Transportation Research Record 886
Figure 2. On-board long form.
·-· ....... -···-·---··-·-- ~ ...... -.._-. ....... __ .. ~ .. ~----~-.-..... _... m~ 11111111111111111111111
.....,.~~-------------~1 .,..,,......... ____________ _.._~-~ Q ....... .,.,.,... ........ _ .... -···--9"'0.-~=- ....... _°'..,...
91(l11Q.1.~~ ---m 'IDlll ~-- , OIXUll"'OIY•Vll~ACM-'fU9rll fte-t
n1,Hi1'..,...CNI ,...,.._. 0 n.1.u""'- 0 Yll,H•-- 0 llD,llOYAfAU 0
II ._.co 't'01.1...,...MOVT"'."' .. ...,"" •••...a•• - •• 1.1111 ..... .... OM." .. WWAl'PI .... 11.1.. ... ......... .
~, ..... ........,."' 0 0 0 0 0 -
mlA.MTC\I. ....... o
.. , ........ MTA unM'fu. ..,._. _ ........ OnMllll.me-1
....... o Bl ,. TOUllll ••1 ........ u 0 11-11 D .......
H-U 0 ...... D ••OllOWllll .m DO TOU MAWI A DIW'llt'9 UCl-t IC) 0 ft'9 0
m ,,_, ....... -,. ~C# M ~DOTOU..__811 '"'-- ....... ,
····-- ,.... .. ·--- •11• •••••• ~'1'WllWOll'1H90 ... ...ntl 0 , . ......,_ a
0 a 0 0
0 0
Ll.lln.111~ 9'U•W-.. •-"'lllO• ..... lllllltotlW. .OW....._,._.,.., • .._Nefl....,....t
CIWJI ('Mil .... , 0
w
......... ...
......... .. ~ 'r'"-l
w
. ....... 0 ... '*Ill .... , a w
:"'...:=.. '"-·1 .... -·-----··· ____ ... , ... ~ ._. .. ___ ............. ,.,... ...... -----· ................. - 0 .. 0 ·-------- .,._ ... _.._ ·-····-·---·---·· ······ ···-···--- ·• •• ·- •-r••lll ... ~~--·-....... ----·-.,. __ ,.. _________ ._..
= =
0002na METROPOLITAN DADE COUNTY: ON-BOARD TRANSIT SURVEY
~ E i.
-
, 1. i 0 ..... -, <, .... ::E > ~· en w'
i I• i' o: I
~· ·-w z i .1 a I u; •
-~ :> ' Usl "' ; ..__
.c ..,
~
,. , ........ ~, UI ..... 110'11 r• I'll eYtfUI ey 1(111~•0 0\IT AMO HIU'IN .. O UUI IMOllT IUf!IYl.T ,O,_w 01.lfUNO -Y OUllll IU• •IDI IVDI., 'l'OU HA'f'I ALlltlAOV '"LID OUT OMI 0' 141• 10.t!Mt,
PUIAH ClOtll'l •. 11. Utlt OMI &LIO. " 'tO~ .U.'11 Aln OLKIUOll.t, 011 • 101,t ll'llUO H(L.11' .. , .. UNG O\U Oul f'OlllW . IHI tUflJlrl'I' •111110111 • .11..l H 0.LillD ra ...... YOU,
m MOW L099 Dm YOU WAIT ro1t T ... I aua AT TMI •UI HOI'? ___ ..... ,0'1l_I
II .. '°" ... , ............. I @J rat ¥011 MT·CMI n1111 au•' 0 ~ :.:~· ~:: O:~:,.o::_~o.uv;~or
IJ .._ ...... , '""Of' IHJllnJlli WAI tfr H• ITUOENT 0 H• UH.Ofll CllltlN 0
eltOWARD COUNTY TllAN ... Ut 0 0 0
HI HANOICAl'll'fO 0 ID• l'AfllE 0 7H llll'ltlll D
'"°" WtCH IUI DID YOU TltANIPlltT r1tHl'AU D
W•M Dll YOU GIT OW TMAT Mitt PUIM 1111 •&1111 llMll ~I ---
!JI Mow OID •Ou••• 'o rn111.11 arol' WKlflt wou oor 01111tt4la1u1r
WAUCID 0 -···ft.I• .. ••• t::::::·.'7. ,.. .... B TUIOlt .. TlllY D
1 .. Tli1i.\S.:'3~.i!'a.1i.'&9!.':£~~-·-·-~ ilo HllLUA...-·-·-·-·-·-·-·-·-·-·• I Ohll•n•u• -· ., ............... _,,_.., __ , ____ , •. _.,_._, __ ,_,_·-·-·-·-··
i • YOU a ... °" •• ,,.. •u• . ..O• DtD YOU., •o,... ITOI' WMlllll i
l "ou ff't O• nuit •u•• i
. ewMA 4=.':n.HOP § ~A-:C:.mmv B ! _....._.. _ _.._oo_ D ! o_,..__, ! - .... -YOU~ .. Jml-t _..I _ .... ,..-y•··--·--m..,. i -ft9t -o .,.. ~:a.m::-...,.._v:a,.:.~·~~:..i
m AJ WHERE DID 'IOU STA.AT OUT FROM BEFORE OETTNJ. ON THIS BUS' ~ .. llll~•lll•em•r11111•1• •um l1:JIr'1111 ill •GI'• •t 111 •~...,.•11 '""'")' \IUllD•• CJUJOla• P\ll!il
'""" """' WDA• SCHOO<
OTHER '1111111.'Ulll
-" 'fli!lf..MO llELATN'E 5 HOME HEALTHCARE 1DOCTORUNTIST•
~}.&UETCI HOTl \iVO'I( ' RECREATICJrol 1&EACHIPl'.R111
fHEllTERrM0\1'1ES1ETC J
R H II
BJWl'iEREISTHAf1P\Llll!ll,U'.'lllr.lml _,,._.. . lll'._lf//lllllMOl& ... Jl".l.J-111111•• IOlll 111"1'1•
'1111-111111 ' •'..l:\'lflU llflllllOl1P\A/IMClll
CITV'T~'Ylll.i(}E
C1HOWU.RIS THAT FROM Tl--!E BUS '>lOf''
m WU YOU nlANlf"Elt TO AN0-0.:lll llUI .,_N YOU GIT Off TICI •uU
• YEI, WHAT 9U8 WLL YOfJ Ull? ----- - llrHIM Wl..L ,01.1 Qll.'t ,Mt llUe '1 H lt Niii •YIU 111111
~··,.~-
E!I A)lllfllHERIEllAE'l'OlJ~~ IM&...,,,Af)tl#' • OI L<t.• •• a111•••".llll
....... TO ....
~ -.... 1111''-tOlll:Ud"rvt:Sl-tC*E IOCXl< NE M.Tto• CAM IDOC'TOAlm' NTIS r • N:l9Al.91AHT ......,ourn; I ..,,..,..,,., lllECMRO.~ITHEATEAI ._.... .....,..,.....,.,...,, onc1111~•ic..i
l-i [)
[I
.... W
11

12
Table 1. Patterns of missing data for on-board form.
Question
I. Waiting time 2. Transfer? 2. Type fare/transfer 3. Access mode
Avg, 1-3
4a. Origin purpose 4c. Distance to bus stop 6a. Destination purpose 6c. Egress mode
Avg, 4,6
7. Captivity 8. Learn about bus 9. Sex
iO. Age 11. Driver's license 12. Resid ence
Avg, 7-12 Avg, 1-3, 7-12 Avg, 1-12
Mailing list? Comments not present
Missing Answers
On-Board Long Form'
No. Percent
47 13.9 35 10.4 37 10 .9 36 10.7
39 11.5
37 10.9 167 49.4 47 13.4
114 33 .7
91 27.0
45 13.3 45 13.3 32 9.5 35 i0.4 55 16.3 74 21.9
48 14.l 44 13.1 58 17. I
63 18.6 234 69 .2
On-Board Short Formb
No ,
26 16 29 16
22
NA NA NA NA
NA
35 41 29 2o 32 49
35 30 NA
42 159
Percent
8.8 5.4 9.9 5.4
7.4
11.9 13.9
9.9 ~.g
10.9 16 .7
12 .0 10.2
14.3 54.1
Notes: NA = not available. These questions were not asked o n the on·board short form.
aNo. distributed , 1079; no ~ of responses, 338; response rate, 31.3 percent. bNo. distributed, I 079; no. of responses, 294 ; response rate, 27 .2 percent.
Note also the difficulty of these questionsi the respondent must be able to find the antecedents of the demonstrative pronouns in questions 4b, 4c, and au.
It is important to note that the alternative of asking the origin-destination questions on the take-home form was used in all cases. Irrespective of the presence of thcoc qucationa on the on board form, the origin anrl destination of the trip were needed on the take-home form as an aid to recall the subject trip and a context-setting device for judgmental questions and questions on alternative modes.
'!'able 1 shows the results ot the pilot study of the two versions. The number of on-board forms distributed was 215B, 1079 of each version. A 31.3 percent response rate (33B returns) was achieved for the on-board long; a 27 .2 percent re s ponse ra te ( 294 returns ) was achieved for the o n-boa r d short. Because a fairly large sample (numerically) was obtained, it is possible to make statistical comparisons on some aspects of the responses. Although this is useful to distinguish between chance and systematic occurrences, it is not essential to the use of a well-des igned pilot test, where reliance should be placed on qualitative assessments. These two response rates are significantly different at the .5 percent level but no t at the 1 percent level (Z = 2. 09) , so the null hypothesis--that the addition of these two questions, although lengthening the form, would not discourage response--cannot be rejected at the 5 percent level .
In addition to the possible implications of the presence of the origin and destination questions on response rate, it is also possible, for reasons stated above, that there may be some effects on the quality of information received on the form. Many aspects of quality are difficult to assess. 'l'hus, the surrogate variable used for judging quality is the percentage of missing answers to each question. It is recognized that this variable does not measure the quality or the accuracy of the information provided. Thus, Table 1 shows the percentage of
Transportation Research Record BB6
respondents omitting answers to each question on each alternative form. In some cases, questions do not appear on Table 1 because the data were not punched in a manner that facilitated distinguishing between missing data and instances where no answer should appear because of a contingency question.
The table shows that although more on-board long forms were returned, the percentage of mi s sing information was clearly greater on the long form. A t-test for examining for a significant difference between the average percentage of missing information for the 10 questions in common between the two forms (questions 1-3 and 7-12) shows (t 1.79, alpha ~ 0.05) that the average percentage of missing information on the on-board long is significantly greater than on the on-board short. The percentage of missing information is greater both for the questions (1-3) that appear p rior t o the difficult origin-destination questions (4,6) and for the questions (7-12) that appear subsequently. In adrlition, the lengthening effect of these questions appears to have significantly reducerl the percentage of respondents writing in comments (Z = 7.22, alpha
0.05). One of three explanations is possible. First, because the origin-destination questions lengthened the form by 33 percent, respondents ran out of time and had to get off the bus. Second, respondents tired of filling out the form because it was longer. Third, after struggling to write words while they were on a moving bus for the address questions, respondents were reluctant to try to write words again in the Conunents section.
P.nother problem with the on-board long form was that the origin-destination questions (4 and 6) were not completed well. On the on-board form, 69 percent of the responses included a usable address for the origin of the bus trip (question 4a). On the take-home form, BB percent provided a usable origin address. This percentage might have been even higher, but no doubt some respondents completing the take-home form probably figured they had already answere~ the question on the on-board torm anrl decided to skip it on the take-home form. Evidently, respondents who took the time to complete and mail back the rather complicated take-home form were not deterred by the address questions. Thus, even given the lower response rate on the take-home form, a satisfactory number of origin-destination addresses would be received on the final survey if these questions were omitted from the on-board form.
Two interesting s idelights may be noted. The first is the large percentage of missing information on questions 4c and 6c. This pointed to a design flaw in which too little space was left between 4b and 4c and between 6b and 6c, so that respondents read right over these questions. The second is that the contingency aspects of questions 2 and 3 proved too difficult for most respondents. These two questions were simplified and combined on the form for the main survey.
In addition to the tests and comparisons described, the survey designers spent a consirlerable amount of time reviewing individual questionnaires. They reviewed the consistency of answers among questions and the trips on which forms were given out and tried to obtain a subjective impress ion of the way in which forms had been completed. These reviews were also used in rlecisions to change or modify layouts, question-and-answer wordings, and formats.
In sum, the decision was made to produce a revised version of the on-board short form for the main survey. Although a significantly higher response rate (at the 5 percent but not at the 1 percent level) was achieved for the on-board long, the form yielded a significantly higher rate of

Transportation Research Record 886
missing information and significantly lower rate of comments. Also, tests of the take-home form seemed to yield sufficient origin-destination information for analysis purposes. That the lengthening of the form by 33 percent did not affect the response rate adversely is similar to the results shown below for the testing of alternative take-home forms. Although this result, to some extent, is at odds with conventional wisdom that states that longer forms should achieve lower response rates, it could be that both the long and the short versions of the on-board form were sufficiently short to lie within the tolerance range of the same population groups (~).
Alternative Take-Home Forms
One of the major purposes of the take-home form was to collect data to recalibrate the Dade County modal-split model. (See Figures 3-6.) Optimally, disaggregate behavioral modal-split models require individual perceptions of time and cost parameters for a selected mode and one or more alternative modes (~, Chap. 15). Because at least 13 modes can be identified in Dade County, it would obviously be beyond the patience of the vast majority of respondents to provide data on all alternative modes. Thus, an initial decision was made to query perceived time and cost parameters for the bus ride on which the respondents received the form and for three alternative modes. If a respondent provided data on at least one alternative, the response was usable for the modeling. The importance of this information as well as the obvious difficulties of asking questions about alternative modes prompted considerable attention to the modal-split questions.
Thus, three versions of the take-home form were designed. Figures 3-6 show the take-home long form. The take-home short form contains a subset of the questions on the long form (excluding the four sets of 18 mode-specific perceptual questions). The take-home table form asks in a matrix format the mode-specific time and cost questions that are asked as separate questions on the long and short forms. Each of the three versions may be separated into four sections:
Section I was devised as a warm-up section beginning with a set of perceptual questions designed to create interest (questions lA-lM). Also included is a series of questions for devising marketing strategies (questions 2-5).
Section IV asks for information on education, income, automobile ownership, family structure (relationship, age, sex, driver's license), residential status, employment, and race. Such information is needed both for the Dade County modeling sequence and for federal reporting requirements.
Section II (questions 1-9) asks for detailed information on the bus trip the respondent was making when the form was distributed. This includes information on the land use and the address at the origin and destination, access and egress modes to the bus, and time and cost of the trip. In addition, on the long form, 18 perceptual questions are asked (question 10) about the bus ride on which the respondent received the form.
Section III asks the respondent to select three alternative modes and answer a series of questions, imagining that they had used the-- ~lternative modes instead of the bus for the trip on which they received the form. The manner in which these questions are asked varies by the version of the form. For the long form, the respondent is asked to look at a list of 13 modes and cross out the means of travel used on the day he or she received the form. Three alternative modes are then selected by the
13
respondent to become Travel Means A, Travel Means B, and Travel Means C. The respondent must then be capable of translating his or her choices for A, B, and C to a separate page for each, where detailed questions about times, costs, and frequencies and perceptual questions are asked. (Note that, to conserve space, only the page for Travel Means A is shown in Figure 5. The pages for Travel Means B and C contain the same questions.)
The short form is designed in exactly the same manner as the long form except that the three sets of 18 perceptual questions about the alternative modes are omitted.
The table form (Figure 7) requests the same information as the short form, except that respondents are asked to fill in times, costs, and frequencies for the bus ride and three alternative modes in the cells of a matrix where the 13 modes form the rows and the modal characteristics form the columns.
All three of these formats display potential problems because either following the rather difficult procedure of translating the abstract notion of Travel Means A from one page to another or filling in the cells of a matrix is a difficult task for the bus-riding public, who may not be accustomed to filling out forms. Another difficulty is introduced because it is necessary to request people not accustomed to doing so to think hypothetically about a situation (modal choice) that they may not have thought about a great deal. This applies particularly to transit captives, who, because they lack an automobile, probably have never thought about the time and cost parameters of other modes.
Before the execution of the pilot study, the belief was that each form displayed some significant benefits. If respondents would persevere with the long form, the most information would be obtained. On the other hand, the long form was 10 pages long in comparison with B pages for the short form and 6 pages for the table form. If respondents could be shown to complete the matrix satisfactorily, a much shorter and simpler-looking form could be used. If the table proved unsatisfactory and the long form proved long enough to discourage response, the short form might represent the best alternative.
One other advantage of the table form was that it was possible to shade some of the cells in the matrix to indicate that no response should be placed there. On the long and short forms, all the time and cost questions had to be asked for Travel Means A, B, and C. Thus, if the respondent selected, say, walk for Travel Means A, he or she would be asked how much time was spent traveling in vehicles and finding parking. This would certainly serve to confuse some respondents. On the table form, the cells for these questions could be shaded out.
The overall response rate for the take-home form was 16.7 percent: 380 forms were returned of the 2158 distributed. Only 301 forms are included in the analysis because the others arrived too late for processing. Table 2 indicates that 97 of the 719 long forms (13.5 percent) were returned, 84 (11. 7 percent) of the short forms, and 120 (16.7 percent) of the table forms. The proportion of table forms returned is significantly greater (alpha 0.05) than both the proportion of long forms ( Z = 1. 69) and short forms (Z = 2.72). This is the expected result given that the table form was two pages shorter than the short form and four pages shorter than the long form. On the other hand, there exist no significant differences between the response rates of the long and short forms (Z = 1.03), although it is noteworthy that a greater response rate was achieved for the long form. In sum, if we

14 Transportation Research Record 886
Figure 3. Take·home long form: Section I.
•TROPOurAll DADE COUNTY: TRANSIT SURVEY
~ 'lft aa..D UU tO •llOW ....-~ ..,.,,, Yo..I' l'UUl9e lleOUf MU. I •tllll09U8 J •lllCI: ......
JMI ..... AM.A. P\.IA81 ~ .-OUT n-. •RVG: 'tOU MAW'I HAD ON •TA I .. fR<mU8 I ..... I -..I TOU
..... ..._.,... C11iM1t.-., nm 11eno.
K:ll .. ,_. ... TID •LOW ........ Of' tTA,..•llTI nMt ~T • U.:0 TO DIK,_
A ........ •H~I A90UT MU ( 11111 flt09ut 19UI M•..Cl n WOtU Lml:l YOU
TO llU. UI HOW 8f'"*9..., YOU A_.. Ofll DtMmml MfN IEACH a. fMf "Ol.lOW.C
"AYl .. MH
t91"9111 ... •• ._ •1•l•m~•H
I l.•f UC C.OLOlll Of UC
.. , - -· _, _. ., .•. , , .. , -· _, WtA C .. UtOllUI tl""t ----- 1
.,,. •• , ISth 1• •••I •• U-1 ....... ~ I emu .- t• - · ©ii - - ~· 1• .. , ,. - I C:.11 111 •flt- lltJl•H Ill
-· -· .w•1 ... t ,_, -· 811111 811111 .-1 ii-'
fH911llftQ A90UJ M!!J"OltUS lft
(I) CM.11111',..a\ . •aw wun· •" ri.11-1:0 '''"" , .... l .flllW'ltl-----------·
NO'llf 1lil '""A .......... Oii' , ......... ,. aaout •VI Jl!"¥1CI • ~ Wt, WOlA.O
U(t TOIJ fO#llliWI• .. • -Alll Wit.T
GU -I ... ,
111111 '""' -· 11•1
CIJ ~:~:,·~: ~:~::.::~. t [CJ :-'=~·~=;::~~-~----1 mJ ;~~:,c:.~Ul~~~~~~~~--- 1 ID [[]
1tOU' C.AM lllUjiil wo•t: 1111. 1ya
IM.l.1111 .. •c4"---------- I
'fOU' C1UI Ul\lA\l 'I GOU:llll OH aUl(S 10 flluN OH ttW( - -- --- I
-m DO "IOU MAO A ............. ,.,,.." "l°"".\M.tt
r;J Q lorlOC>,Pl.IA•OOTOOWlnoo4
, ................ ,0
.... Ml .. *• ll 11114 .... "AlD
06.\lltlO , •• ·-~·
... tot90Mt000 .... u ..... cow-...n ... .,.,.,,. .• ltUDll.lrf'f .......... ..
D LI D D u LI IJ LI
WOfll\0 AllfO .... ltOllAt. rJ uv1NG Ofll •uru"'• •eno. O ePOllU 0 '•••C.&-.t. ·~ou o """ II.MD llik!M' 0 COlltCI 0 OU,'1' U' P"-O•UM ec.r9Cka.t 0 lOC4l•WI 0 POOO TOOA"I 0 HnO-ll 0 •meCM• elCnoM [J t...:....... () n. ... tUY lWlltl41A,_ 0 ...a.IL aw.AT ........... •H LI
onetruu••-1
l_J I 11'4
''' ,.,.
' ' " t)HU
~~t .. J
1 1 LI 1.#Mff
lr'n'r.'
•I i •!H I Ii Ill w.t.n.a fOlt " IUI .......
MAT1'9:R la A 9IO P'R09LIM----1 ' . • I 1,,1 ..
IHI eus ROUfll QfNIRAll y ..... TO 00 WHt:•I I WANT TO GO - - I ' • • • .,,.,,.
[Il C•llWI OM UC IU• II A
' IUUOUI Pft09LIM------- 1 . • I •,,1u•
CD aua •OUIC .... ,. A"-1 MAllO 10
• I rtau"t: OUT----------~ ' . ...... m llllW .. A"11 lt01UU Mi01.111
' . • • rHt au1 ""•''" •"- rAM - - -- t .,,.,.
[Il Hill IUI •YUIY 11 Of: I llMO lffllfR ---- - ------- 1 ' • • I ., ....
Ill 1"( AOIMC'T I HAf ft'\i Mlt .... au• llY9tlMI IHOUlO Dtr .. nl y 1ti
11,.
1101 It( A\.l0Wt0 tO 'llll!ll
fHlll ...... "'~- 11Slf" -- --- ' ' ' . • • ~ WI ttAY( \11110 •UOtfll' ' QI.ti IOfAI HU1f "'°'41 If:' USCO IQ
CIYf.•u.t 1\VUU ltOllM"illOtf 0 f 0 9LI~ ~ .,,, , u •..ec.o J Of' fHl[SE O«A5 00 YOU fUl AAF , •• wost MPOA IAHf1
nlll t•ll 11 -·· 11131 IUI Miii Ill•,_. fl-11151
I BUS SYSTEMl IHfOAMAJIOH CfNflA5 IN ..aHJ.-OAHOOD5
1 c: YlltAlltO'tO ff,_l_CPt10riit' lf!lrOl!IW,A uo• J laPANotO 1 1\.1,.0llA\ 11\,IPHOk:( l(AVJCI(.
• HHE• OUlftN.\flOM SIDffS OH •HE OUJSIOI. Of fH£ IUHS
5 MOA( WAPI, SCHIEOUlES, AND H£WSlETTIEAI OH BUllS
I W01lf I.JI l".S'IW M''O•UMl lON ~ Ml'l'UPA,.UIS
1 MOAf BUS IYSTlW INf'OAWotHIOH AOVlAflSINO OH fV
• "'IUI 1ng(_lll ":t ouior ma.t t(U.S YOU ::: .. u,'..-:~~~-:=~·.c;
I .\ P'OSllEO AOUJE W.\P Al All BU! STOPS
tO A POSTED 5CHf.DUI.£ .\J All BUS STOPS
1 1 • ltOt • \;llf~ "'" ~tOMri!AllON PHOlllt 41 WAJOlll eus St0,.3
12 PEAMAHll!:Hf INFOAMAJION DISPLAY!. Al SHOPP ... 0 ct:HTEAS
IJ Olll'iYU~l'I "''° Wll. L or~"'°"'"' wo•r ..-a111wAtlOlrf
~ DO YOU lllffH TO THIE "ADM> .. ~AN..Y ........ ,
g g I "NO ......... GO TO OllEU"* I I
... r1 WCMIO IUD
O w•1 710 -·-Q WINZ 140 .. ,.n •11• n w100 110 -PUCI INQM
Q WMllM .... -·-. () WNW" ... I Ifft
0 WOCN 14110 MUI Ulll
IJ WOAM OIO lllC,_11,
()WQH 19'0 llC-
ll Wl9D 100 ,.Hlln M
11 W""C .... U.11 H• fl wvca ·- -..... , .. LI WWOll IHU 19'0 1WtiU1 tMlft
I t 0 WA&A
I u WAllY
I IJ WClllO
: I] WCMIQ ,u ft0"
I u WttYI
111 '#Hiil
Ill Wl'tf
II WMJI
111 wou
1.1 ·-I 11 WYO .. I
B:3 00 'fOU WAtC.M tlt.tYtllON M'~---'f' •1&11 .. r
... IOI I ... "' ... , 14 I
IOI I
"' IDP I ...
... 1·• 1-mEHt .. ., . I OI
.-11 ... •• n11 • W Ill
• ...... -, .. IOtl M lmftl Wllllllt
E ... 0 'I-
"' ·-"' ·-.c ..,
~ ..:c '<:" :':)
::i ~ 0
-
•,. 1;t
~' L,.-';:;J ~
l.J•I I I I I I
·~"." .....
,.:g:"'!"~_g::"°=:-.'::"="":·:":":•:•:oo=='O:O:Ul=l='-='=1-------.I ';;";/ • ,ftl, WMtCM ll4leotrll DO l'OU W4tCM MOULtr-.n
11 CHA-l I,. . . ..... , I) C .. A.._l t Vtl r w•VJ
IJ ~l r ..C·WCllr
11 C...,.._\. 10 A8C •WP\.Cll
If CloM~ Ull.J _,,. . wc;11
rJ CMA-l n•-W\.rw
L._~o~""'=:":'"~'m:_:•:"':'__:===============================.JI~
m -IW.U, NOW ........ 00-1 A ..,_.TM 00 YOV ._.- MIU1 I WfJM> ... » ._.. • ... .,OUMlll•......_,
to 09' MO• O&'f'I I J e -tlOAYI u I . .. DATI I J Lall 1llMI I DAY IJ '"" ••• 11'1' ,..,, ~ u IT w.-IAlOl IJ
Ontl•fPH• •-I ';!-;/

Transportation Research Record 886
Figure 4. Take-home long form: Section II.
~· .. W04A,9 ._. TO •llO• tom MIMU ..-OUt t• IUt 1i1101 YO~ •1• WA.it .......
YOUMI ,,_ "911 .. YPO.
JUA,• .,_ AilO\l'f T)Mf 91.11 - ....... YOU~ CO-. "90W MC .... tO.
mn ... IOCM
.om 0tia1...,.•..u11 ne ..- •• rMO• ... .a...-o TOf.I Git '"'-..,. '""" '°· P'l.IA• M'I ue TCM.tt Mmlwt• AOMll
E!3 L ....... • Ou,,._ .. out llllOM .... YOU M.AOI ,.... IUI..,. Oii •NCH \'OU
.,, t"Mll ...-WY·~ t 1•u •• • '"""
•-- n- LI W'mm LJ A 1-.m>iMl.AflW~I MO.. lJ tcHOOl. Li "'M. nt CA• l OOCtot IUl:JIUtelt •UAUIWlllf LI MOIJl'ITAlllfC I (I HOflLAlllOTU [J MQa&1A)Jt -4~ .. ~lt,,.ArUlll
..._, LI llOV.1,POUltllC , I J o,,.,• lfilal •11JWI
"' ..,.. .. """" ml.II 1111 • ' " .-..St• •wm mu• c•u • 11t MftM • ruo - •• 119'1 wt II 1111 ••
• II 111 HI• 1• II tit 111111 M II .. UI '1111 --
., ... ,~ ....... DlllGI ______________ _
C"YITOIRllVLLMll ----------~!If 1 ... a__
c. MOW• 'f'OV•t ro ntt ..,.,...,., '""'' AC101111t
c11a1•1•"1• WALllOID
IYCA" 4=D-~"9:1TO, TA•I OR .. 1'9Y
EYCLa . llOTORCYCLl . OR MONO
1 1 11 11 I I l'I
o• .. l"t&ll 11Htll11------------
li!\lf1111Hf#lfl\MV ••"""""''"""" .. .... '"Dft~·~· ~ ...... .,, .... , .... fWOA.IXIAl' j.~ li ""-t ~ ,_.. Ntf UllUt.rl.-..OUf ' rao••• 11).W ................ ~
\ ••011'9 I •Dltf'l'I . lf!MllHM!lr"lllW ...... s .. v
~'~~IOI H (lfllfft4'1ll•"l99•
(g2J••lif111Ulff I- IW'l'flflll!W'l,.l'fWUINi'
~lllli111 .. lllll-t•1 .. 1111,,..,,.,lllAVflHill!IVfl•ll'>'
l!l2J11•M1a111- .• , ... , ........ 111111•Nilllll...._ ....
IS!a··· ...... , ....... ,., ,, ......... . ~ .. lln'l•"Mll..,.Ni••~'' 111111111wur."cw111111 ..-.co!ll 'l'll"IU'
_,..llfS~J«Mj I
N~l:l.f111111«1f'l-111
li!SI '1111 l._M>Na1UI fHIJ ll1'NW illlt9N f(Jl.tla)f ... ......-~·~ M ~ ltSltV•\Qff ~";ifVIAAI. " ....... t,IHIU'f'llllaOM INl\ll\Of<tiC'J- 1HIU ...
......... U-.Mll,llU Ull't!'\IAll • .NI ..,.I IHI U'IM41 ... 111WOU*-1 c.J"msKftf Wl l!tll AlC"I •••<lllflll·M'ill't 11111 o•lf •-••,,nr111•-. - & 1. •• •••••••~• M-•••
!'tl'lllC\1 11111 Mlll"l~lHl•Urr n~I , .... !1.-.. , ............. . _, .. ,
I f111111i•011•mtrt ··"'-........ ,. , ._ .. ,,
.-Jflfl llJ/lfTf oo.llCWllt OISMlflff 'lht'lllnl• lllWI •Otll• ~O.tn bl"t.l(Wf tlf9:..,llo•
.. ,.~
l...J..J r··
L..W..U .. ., ..
........ ,, ..
- - YOU_rD ... l"DUTOOll naY .. -'
TO ..... [] - u - u ..• ..,,.....~ ...... u I0400l (J tC"4. 'rw ~I OOCTQfllCmftlll
MITAUflANT 0 MO ... TALITC, 0 HOYl.LIM01'1l. LI -- ~IMA11•, -· 0 MO•llW<MllHIUC, D
On9:11 lftUll ... ,
.,..,. '""""HI •m. II MmA ...... n•o ~· ••• -- • PllU ._
s11W.n~•1•U11.0M1 ------------
c11w1row.1vu. .. m: ------- -,. ___ _
c HOW DI) "fOU CIET TO ntAT ~·· 'ROif ,,. I.All eue '""' TOO UWD?
i:mm • •• "'&11 WALlllD
UCAlll (=~lllTMITOf' TAKIOR .. 1 .. Y
91CYCll IC>TON:l'O.E. ml MOl"ID
11 11 11 I I r1
0001,.uu • ·- • -----------
At ~1 ... QI) "fOU ....... A1 fl¥.1 ~Ht ftll• lU • I• t• • wtlt u ...... ti
AM I J OR P' M 11
riJl ra l.!§J ~
- •II W.CllWOl.l..0 TOU~ IOKO'I""°
1..- eUI ,UU111Vli1' "UU tllll • ~ 1•
• l:'it#lff~rt~J'l'f fOUSf" /fl lnA\11:1 OCJlllWNTfM'N
• MAll.lSWC liV<VIHWllllPEOf'li I OOMJIM~
I OIONfll AllUW .. TOAIAOOO wntll ~I t lf\AVtlt' D
1 llASIMCnwlmlANI "iFAIS
• flolMI C. Ull """"'UM"f ,. ~ CYH I-. M U-~ t4•,.u.t llU•Ntlf "M
' HA!oA 1"-'vtl IUI' Ill"' r'ti.u.:4 ' A l flftRIJN l ...... IU hO
1(1 l"iNllll•flY ICl"illlllllflll!U vF1..-:iFMIM.tJllll!Wf.i
U 11i1•£UIO'°""'l.'l'FW ll!IA IRAlflCllCCllJfNI
,. DIJl,..., .... CJUllWlllll llJ '6o!At 11W1Yrns
,., llStllPfld'Vf c~nwnH on•111c:ir:MT!\(lll l1¥N1
lllfUIW~t
t• a ... •• .. "'""''~ ...... IN'fOlf
AM(") OA P'M f)
"""" llOllU Ao!~ff OISMmlF
'ill'llCWOIY 11nnFt o;.a1e1.u1u 'illCiHH' OISN .... ltl "ill•Mill
'u' .. •
1 . 1. . t ....
11 • f I
"''''' '
L.U UM
'., °'M
........ ,.,.
LI..J •••4
'-'-' ....
15

16
Figure 5. Take-home long form: Section 111.
SECTION RI
(I •1: •C11Yll .. IJ 'Hfl•ll ...... 14••••1 ""'&$( R(A() 1Ht: LIS1 ANO CROSS OUT THf I RA.V f l ........ ~ ... nu USfO c... · ~d °"''IOU 001 THIS f()N,I
I A.vicJ .. l"'M(btiu'to 1 lOCAI. BUS IVfO f •""fSS BUS ) CAA lOCAl BUS ANOf•PRf <;~ eu ... ' £ lPRt SS 8US
\ CAR ANO AIUUI AH •i OC .. l • A ll~
ft Af UUl-'A1IOCAt1flUS
~ <:AA a,<;,~A1Atl IHf Wt.Y• I C: ll.M ASPlliS$fl«<. i fA1Atl IHI lllMYo 9 CAR POOi. 1SHAAf 0 f.ll[)f 1
10 WA.I.Ill IAlL JHf WlY1 11 BIC'l'Clf I) MOTCIAl;vn• t ll.llritl 11'111 1 1 14,ll()MJll ... IY
f ~.u 1~ !U- t • __ , . ..... .,.., 0 1 1 I l"\I Ai\ • ..... ... , ...... ,-.._. , .. -. ,~--141MLYWfLI olVf"'" 'f\lUHAVI
>ti l4 !l'or fl. ••" wo 10 4 •111• 1• • w1 .. 11 1. , , .., HA.Vl> 1lf ••llf '""' 1 '1- Qtl~
IAAVI I MfA ... ~ A
• 4 ' ' " ••
11• •1- I; ... &111 ''111• 1 tt• • -lr • t .. fl I , .. ,
~l a.s.J 00 TO IH( I JFIST ";r t f1lo OVf S l•Jl'f <;, ANOFltl IN l"I ""'Mf ( )I I M•V1 L MfAft.S A
P\ fa.\I ANSWlA THE OUfS1()frr,ISA8QUT THAY IR.tlo'fl l,lfANS •WilGINlt«o IH.U 'IOU US( fl IT IH C:. t•AO(ll !Hl ~ AIDf 'f()lJ TOlD US A8()VT IN SECT~ •
1--A ...
• ~--="'-"'°"'-O"Ul>Sl'll..O.........a•'IOU..-oni.lll•M9A•!f<J111 ...... l -.....ro MC)PWOlll-ltl[PIC..rN*ACM)
-.,qac..iam U LI-J
1 NQlllll....,.t ... 1 ... wau.-o~,.....,...,,...,.¥Dtn9, .._ • ...,,.'Gtc."l~UICT\'YAOODOOUl•-.iMvt:M-~1!0W
.._.. ...... ~-~·--I lft.L-~"9-.---\91Gf't~O .,_.,.f't".,_. __ ... .,....,.no..,.----......-.n.,.oc:u.o• ~'°---- "*" ,.,..,..,.. "fJm "'9a#lb./f9MM.__. _ SLW_,...10U __ Oll __ WNn ...
..... ~., ... -·-··-·--···········-· - ,_ --- --..._ __ .. ._, _ -...R\•.....,. - ..,_. I •tlODllClf'(llltll;llC)CC&,D ......
...
L...L.1.-1.-1 .... L...LL..I ...
- w
TMILlfl .. M9A
• •terr 1JIPll9VI mum m ·--, ....... ~#N~I
"°'""-• OC:.11«71 ~Ml tOl'CAOM ........ ~ , ...... ~ .... . WllllCllMl-ll (N,TA..,..f , ........ ~ .. ...,,... I *'I A flllmll!I. ,_ nte OMNICI al.Of,.... JOCMI"
... ..,. ..... ,JO~ll,..... ..... _ t t utl .......... .......cr
, ....... ~ ...... -... ~~-·· --n aou.-~wte1--,. ....... ~mnt --a....-..-
---·,--""....., ,, .... _
Transportation Research Record 886
---A ... ,_. ..__ ~ ~·
......... ., - aam,y a.Dfft.Y ~ ITRCl9.Y
LI..J ..
w ......., ... w
.......... .. w w
'rN .......... --w w w
·~~-- ..... ··~-Cit..---- w · --... ., ... --·--·- '
·-· w .. ..•

Transportation Research Record 886
Figure 6. Take·home long form: Section IV.
........ , AU 0#,.. TllAWllL . .... u1no HLOW .... -. ..... TO
'IOU ..._, PUA• ..,_ l9CKIT rHI IUI - Oii - \'OU •T "9 .... Y.oml. PLIA• ... Rm LIH Ofl TU.VB .......... t...- 1119GUT "9Ctl 0.1
fOU •01.LD ..... 10 ..... ro• f MU - · c ....... .,.. •• _ LOCAL ... Al91X ... MIUI
CA", LOCAL .... Ale I IJl!Ma IU9 ....... _ CA.Ill~~ LOCAL)li!A
C.&11111 , Al OMlf'lllll lAU tte WAT I
CA .. ,AI PA---lt CAU. nll WAYJ
CARPOOi. I-_, WALi I.AU ,_ W" 'fl
-•cu W.O tOMTGl.I 01' llllQflm
TAllOll .1 ... Y
....:;H °' T• 1'111&"'~ llllll.Alll M na utt MOVI: ft t)Jlf 0.. t'OU WCUl.D L .. I. Jiit Klot' f'Ollti hc,u ... , 11. • .. 11111 au !!..,! 1• • 1• •t IU&al tlO • j•
• * Im 1• 11111 •••I • WI 'IW llft 1111 II
.... ow• l•• ... ,,~ __________ _ MCH a. °" n9 , ....... L .... WOUlD YOU ~I, .. • cOlm •" roll niAT -· Tl•~ I Ull lmC~ Rlf .. : -----------
AND W.OH Olll WCMA.D YOU LMI TH9'11D NH'°" TMAT ltM.f
TI9 0.. I t.al THI TttlllllG Mlf 1• 1----------
ITA.L ~- AIOUT n11 IUI - OM wtmOM YOU GOT THll FORM: ....-.O• TMl NO lum'I ..... ~ .. TMI ._. .. llUIU OW fMAl DAT', lrKU
.._. .. • .... 'IOU TO....,_ ~1 tM._ _... I "90u.t • • ,.._ U"
........... , on•• TllA ....... II ntAT LllT ..... ...,.. --- 1
TMIOU9ll 11• 1MAT YOU- YOU ._,.TMAVI ~llltuD 01 rHI ..,,.,
m ....... ai&. llllA ... ,__MIOU'l 1'111 ~YOU UW • - 90U.O ur.11 f'O_ ... l.ac......._ • ._.,_tO'fOt.l l•A'liUt
··----··-·-·----- ..
I
,..._""- ..... .-.. .... ._.lO'ftlU.-AmCOlllYa.talT .. 11,_ .... _ _,,_ ..... -..,_ .. .,T,,.Y••A-~
"-'AmMMef--------~- llalne OP'fMI .... ---"""'"'. In.I'_..,.~ _,....,II a ..... ~mol-Ol 'WMllMQU9ICl.D,
!!I!:!- - - --m 0 rii - " 11111-.i I IJ "° 1
0 , a -Ill I a -m 0 , a -I a "°
II 0 , a -I a ..
Ill 0 ,
0 -I 0 "° IJ 0
, IJ -I IJ -m 0
, IJ -• a -• 0 , a -• a ..
• 0 , a -• a -• 0 , a .. • a -• D , a -• a -• D , a -• (J -• D ' a -• -0 -• D ' a - u • a - u
w...J .. ~ w...J ....
I I l....L.J UI lt ft,. ... .. •,•.·.·~
w....L.L.L.LJ ... r .. ,,. ~ .... MW•
............... ____ .. ~ ._, ......... l....LL..L..L.J ······-............... ....... ~ ...........u... ' ....... . ~ ...... u..i.......u... .......
SECTIOll IY
WI 'ftOtA.D La.I TO IUIOW A PIW DUA&.I A•OUT Tim NQPU WllD - lllTA
YOUR AMIWUtl AM CC>Mft.ITIL Y C~TIAL AND WILL MOT• U9D FOR
\.9' TO e T'Uflll or IQfDOt,. 0 7-4 YLUll °' ICHOOI. 0 10-11 TLUtl Oii ICMOOL 0 ~COL.Um LI 1-YURDI:- 0 IAC.aOll' e Cit-I 0 ~-...own llUDl Li OllAOW'lt .. _._,., 0
on ... 1.,tu .... ~ 1.1 1 .... li!\I How IMNY lllCMllTMI Oii TI9 YEAR DO YOU _..., .. nl! ..... AICU
~ ••••"•••••• •mA tin•• ..,•in •i"m ••• •• ... nu ........ ttwl 0-. llllONfH 0 t-IMONTMI 0 ... ~. a
1 VCNll. nWll I tillG*ITHI 0 NOW I.Gm *YI 'fOU I.nm .. n.e ..,..,, mu••• P11ua
LI.II nt&N I YIAR 0 1-1 ...... 0 4-e YIARI 0
~~~~~·-~ ~
lml----0Yll)llOW1 [§] E""·;;;cr;.f• I~
IDl.,,. Yll, ti YOUR .Im: FW.-~ 0 l?!!l' NRT•Nm 0
IOJM . r\IJ. .._,._. .. , _.
~ 00 YOU COllllJIR YO\lllt-.r TO • --LAT91.....:AN --· 0 0 0
0 0 0 0 0
o,,. ....... ·-·---.... m HOW •N,Y IHllWATE llOTOll ...cl81 (CARI, TMCRl, llOTCllS'ICl.a.•rc ...
AW~I IO'WCM.111111~ -~---AMAi -.,... ••o D n IJ
-...... ....... - lJ 0 I.I
m PUAm lB.&. U1 TO......,,_._ 'E'" ..,..,_ lAal.-tllla.._
,......,..,..,...rte...-,11c '°"' nc,.....
"··-·- •11- - ,. ___ ,. ,............. 0 IM ... .. ... .-Ntll'WIM L1 ...... . . ,.- ... ,,... [J IM .... - -OWIAflll•T'IAR [)
'" .... . , ..... ,...,.. a m.eo . .uA•~Ul •• T'GU~···· .... ........ -. .. ~, ...... -··e -~-_..a.,A ... ~,_.,91'1111WTI
.__. ITO.IGll .......
N•-·-----·- •H ··-··-.. .,... u ............. " .. .,.. 0 .......... _ .. .,.. u
1•.--1•_._,.. D ....... -~ ......... u
u-.. ....................... ........ ,.. .,..,,...,,_ ................................... .
• YOW ... YY ~t• • ..._...,. ... ,,_ .... OOl9fY, M -.._.._..,_....,.._._ •• ,._TO-.-~··
- ...._. .. ._...,,_...,TO _..._ ....._ N-.N.MI ._~.-.. • ._ ... _. ~· --- _, ____ .._ _ _..,, ... -. .. .... , ... _,. . ........... ,----.. ..... - ... ,._,.t .... ,_. __ .. .., .. ____ _,
&.-ull'l.l" - lllU
L...LJ .... LLJ ...
',, ....
17

18
Figura 7. Matrix page . •.. ._ .. .., .... __ .......... ,_ ·-------... ---··-... -.... a ....... ,. a ........ a ..__tMf a --.. --a " .... "'°' a )e---· ~"'1
l!I .. ~._ ... '° __ ,.,,,,_ OlfM ..... ., 1,,l»L»t..a.'alaJ
1,, ...... ~~-J ----· LJ 11 l I J ........ ., .. .,_..,, ,_._ ..._ ._ UI,_• ..._..., OOL- fl/I ,_ · .. · .. · ,...._ , .... ~.'.1w.•.t .. •J
M ·--~- ,,_ ,._. -- - ,...,_NA.,_I, L..1....L . l 1...1. J ., .........
,.._ _ _.. ___ \'OUM ..... -.... .. MOUT M9 <.LLLLI...J ........... N.&.•f'9._1 ..... "9, ... ,.,.., .. - w \ "-' .. '. ll.M.'9:MIY&•-o..-tM-.-•-Y-.i'lllllrYOU. Mm...,,......,,., •-•wou•w..,. __ OI.,.., 1
i 1i 1i"ii',t;r' L~LJ
- - Trt ........ t019-ll'YMOltO.. OP,_,,_ 111 Mfl•Ull
•••-•••-·1 MWtMC! ~trnt
.......... ,_ ......... ,,.. ........... l ..... w - ·-·-·-------.. ---- l.1....J . LJ . J....J ., ........ .--------.-. .... ..._".--. u.J..J..L..L.J
...... ___ ..... .,. lJ.· .. ·.·u· w '<J;J
consider only the response rates, the table form appears best.
The quality of the information on each f o rm, however, as measured by the percentage of missing answers for each question, leads to a different conclusion (Table 2). On the table form, an average of 39 percent of the data h missing compared with 31. 9 percent for the short form and 30 percent for the long form. Although no significant differences exist (alpha = 0. 05) between the average percentage missing on the short and long forms ( t = O. 481) or table and short forms (t • 1.4~2), there is a significantly higher average percent missing on the table form than on the long form (t = 1.92). Thus, it would appear that, while the brevity of the table form induced a significantly greater percentage of persons to fill out the form, respondents obviously experienced difficulties with some of the questions.
Examining the percentage of missing information on various portions of the questionnaire reveals some insights into various aspects of questionnaire design and suggests some needed changes in the take-home form.
The attitude and marketing questions (Table 2) on pages 1 and 2 of the questionnaire were filled out relatively well on all three formsi 7.8 percent of respondents omitted answers to the attitude questions and 10.3 percent, to the marketing questions. In both cases, the long form has the least missing information, the short form the most, and the table an intermediate rate, although the differences in the rates are not great. An interesting sidelight is the unusually large number of respondents ( 27. 9 percent) who did not answer question lK about their perception of the fairness of newspaper stories on transit. Evidently many persons felt unqualified to answer, perhaps because they had not read any newspaper stories on the bus system.
Beginning with the bus trip parameters (Table 2) and continuing through the Means C times and costs, the superiority of the long form and the overwhelm-
Transportation Research Record 886
/
( ) (, .. ..or ~"'~ CO•t (.,.."°" .,..'umo) "'A\l'ILMIM8 ta•UJ ~ •P•u••..,..'":
00@@® ffiH 0@@® --·--.) fttlGm .. T'GU 9DltMI ........ ~
·· ----.. -""""" CM .. ....__ D LI 0 (J lOC..M,. -·-- r1 I I fl u - - - -· CM.t..CICM. ..... ...,, I ) I J I J I I ·~ .. -.. -.... -..... r 1 1 11 11 CM',_ ........ -- - . . -·. ·- - -•GC.ll•- lJ I.I 1 1 u - - - -- -- - -· -.....-... a.otN.1-.. 11 11 Ll l 1
~__,
CM, •t~ (J u l_J 11 CAii .••~
···~· EEOJITJ [I
l I l l 11 I~..,_. .... I r I ·1 LI r J
~AUM-.T
ITJ][J [J LJ CJ r 1 ...... r I I l r I I.I
•••Olllln•v u LJ LI 11 tlOf'OllC'IQ.IO. LJ t I I I ["J - '---
\.
..... 't'OU 9'0ULD •wt~• 'OWi Lml 06 llrm T*l, nM9 YOU
'UA• 90 CM fO nil •II Ol.&l notl,
ing problems of the table form become clear. For each group of questions, the average percentage of missing information on the table form is betwee n 43 percent and 55 percent higher than on the long form. Also, in each case, the percentage of missing information on the short form is strikingly higher th;m on 1".hP long form. 'T'wo explanations for the lack of response to the questions in the matrix on the table form are possible. First, it is probable that many respondents were simply incapable of following instructions for the matrix and filling it in. Set!ond, the instructions tor the matrix occupy almost an entire column of the form and the matrix itself takes up one column (Figure 7) . The table form contained 12 columns of questions. Respondents might have felt that it was not worth try ing to figure out the matrix when it was only one question on the form, and anyway they had done their duty by answering the other questions.
There is an obvious explanation for the somewhat better results from the long form than the short form in spite of its greater length: The presence of the perceptual questions sparked respondents' interest in the form.
Again, in addition to the numerical and statistical analysis, individual forms were scrutinized carefully to look for a variety of possible indicators for change and for instrument selection. A conunon problem with subjective scaling questions is either receiving the same scale position selected for every statement or receiving the same ratings on each mode for a given statement. Various other more subtle patterns may also indicate that a respondent opteil not to make individual and, at least partly, independent judgments on each statement. These were looked for together with illogical or improbable responses to other quantitative and qualitative questions. This scrutiny, which took place while the numerical and statistical results were being developed, pointed initially to the superiority of the long form, which was subsequently confirmed by

Transportation Research Record 886 19
Table 2. Patterns of missing data for take·home form. Missing Answers
Table8 Short Formb Long Formc
Question No . Percent No. Percent No . Percent
Attitude I A. Satisfied with service 7 5.8 4 4.8 5 5.2 IB. Drivers polite 3 2.5 2 2.2 3 3.1 IC. Wait is problem 3 2.5 6 7.1 6 6.2 ID. Schedules difficult 7 5.8 6 7.7 6 6.2 IE. Relax in bus 5 4.2 3 3.6 5 5.2 IF. Bus on time 6 5.0 2 2.4 2 2 I IG. Weather is problem 3 2.5 7 8.3 3 3.1 IH. Routes go where want 3 2.5 2 2.4 6 6.2 II. Crime is problem 10 8.3 9 10.7 12 12.4 IJ. Maps difficult 9 7.5 NA NA 8 8.2 IK. News unfair 27 22.5 43 51.2 14 14.4 IL. Bus getting better 11 9.2 5 6.0 7 7.2 1 M. Bus company runs trains 19 15.8 11 13.1 9 9.3
Avg, attitude 8.7 7.2 8.3 9.9 6.6 6.8
Marketing 2. First idea 7 5.8 10 11.9 9 9.3 2. Second idea 10 8.3 11 13.1 10 10.3 2. Third idea 12 10.0 15 17.9 13 13.4 3. Read newspaper 15 12.5 9 10.7 8 8.2 4. Listen radio 18 15.0 10 11.9 7 7.2 5. Watch television 14 11.7 4 4.8 3 3.1
Avg, marketing 12.7 10.6 9.8 11.7 8.3 8.6
6. Frequency use bus 9 7.5 3.6 3.1
Bus trip parameters I A. Origin land use 2 1.7 4 4.8 4 4.1 IC. Access mode 4 3.3 3 3.6 2 2.1 2A. Destination land use 2 1.7 2 2.4 I 1.0 2C. Egress mode 15 12.5 19 22.6 5 5.2 2E. Rather arrive other time 21 17.5 15 17.9 14 14.4 3. Frequency make trip 49 40.8 8 9.5 8 8.2
Avg, bus trip parameters 15.5 12.9 8.5 10.1 5.7 5.8
Bus trip times and costs 4. Time walking 61 50.8 15 17.9 9 9.3 5. Time waiting 55 45.8 10 11.9 8 8.2 6. Time in vehicles 60 50.0 29 34.5 26 27.0 7. Time looking for parking 99 82.5 51 60.7 46 47.4 8. Pay for parking 100 83.3 51 60.7 48 49.5 9. Cost of ride 88 73.3 35 41.7 35 36.l
Avg, bus trip times and costs 77.2 64.3 31.8 37.9 28.7 29.6
Alternative modesd Cross out mode used 38 31.7 17 20.2 13 13.4 Named Means A 65 54.2 26 31.0 24 24.7 Named Means B 76 63.3 43 51.2 35 36.l Named Means C 86 71.7 48 57.l 41 42.3
Avg, alternative modes 66.3 55.2 33.5 39.9 28.3 29.l
Means A times and costs I. Time walking 88 73.3 32 38.l 22 29.l 2. Time waiting 90 75.0 NA NA 31 32.0 3. Time in vehicles 78 65.0 NA NA 30 30.9 4. Time looking for parking 100 83.3 50 59.5 40 41.2 5. Pay for parking 105 87.5 55 65.5 42 43.3 6. Cost of trip 101 84.2 44 52.4 41 42.3
Avg, Means A times and costs 93.7 78.l 45 .3 53.9 34.3 35.4
Means B times and costs 1. Time walking 90 75.0 46 54.8 36 37.1 2. Time waiting 101 84.2 54 64.3 41 42.3 3. Time in vehicles 83 69.2 54 64 .3 45 46.4 4. Time looking for parking 98 81.7 54 64.3 46 47.4 5. Pay for parking 106 88.3 58 69.0 49 50.5 6. Cost of trip 104 86.7 56 66.7 49 50.5
Avg, Means B times and costs 97.0 80.8 53.7 63.9 44.3 45.7
Means C times and costs 1. Time walking 95 79.2 55 65.5 46 47.4 2. Time waiting 105 87.5 57 67.9 49 50.2 3. Time in vehicles 95 79.2 56 66.7 51 52.6 4. Time looking for parking 110 91.7 61 72.6 32 33.0 5. Pay for parking 113 94.2 61 72.6 54 55.7 6. Cost of trip 109 90.8 58 69.0 50 51.5
Avg, Means C times and costs 104.5 87.1 58.0 69 .0 47.0 48.4
Mode preference and captivity B. First preferred mode 24 20.0 21 25.0 53 54.6 B. Second preferred mode 30 25.0 27 32.1 57 58.8 B. Third preferred mode 42 35.0 31 36 .9 59 60.8 c. Other modes might use 38 31.7 29 34.5 55 56.7 c. Bus only way 66 55.0 43 51.2 75 77.7
Avg, mode preference and 40.0 33.3 30.2 36.0 59.8 61.6 captivity

20
Table 2. Continued.
Question
Scoioeconomic I. Education 2. Months in Miami 3. Length of residence 4. Ethnic group 5. Age of respondent 5. Sex of respondent 5. Driver's license 6. Number of automobiles 7. Personal income 8. Household income
Avg, socioeconomic
Made comments
Overall avg
Missing Answers
Table•
No . Percent
20 16.7 54 45.0 19 15.8 16 13.3 12 10.0 10 8.3 18 15.0 6 5.0
35 29.2 51 42.5
24.l 20.8
86 71.7
46.8 39.0
Transportation Research Record 886
Short Formb Long Formc
No . Percent No. Percent
II 13.1 41 42.3 42 50.0 65 67.0 14 16.7 49 50.5 10 11.9 45 46.4 20 24.0 46 47.4 18 21.4 46 47.4 20 23.8 45 46.4 16 19.0 48 49 .5 35 41.7 51 52.6 41 48.8 61 62.9
22.7 27.0 49.7 51.2
72 85.7 85 87.6
26.8 31.9 29.l 30.0
Notes: NA== not available. For exact wording and context of each question, see questionnaire, Figures 3·6 .
? No. distributed. 719: no. of resoonses. 120: resoonse rate. 16.7 oercent. 0 No. distributed, 719; no. of resPonses, B4; resp~nse rate, 11.7 pen:.ent. ~No. distributed, 719; no. of responses, 97; response rate, 13.S percent.
For the table form, the respondent idcntfficd these variables by filling out the rows of the matdx.
the quantitative analysis. In addition, it suggested some useful rewordings of both questions and answers and some format changes.
All these factors then pointed toward a decision to use the long form for the main survey. Two factors, however, indicated the need to make a significant modification by eliminating Travel Means C from the survey form. First, it may be noted that for all three forms (Table 2), as one looks from the questions about times and costs for the bus trip through these same questions for Travel Means A, B, and C, the percentage of missing information increases. On the long form, for instance, the percentages increase from 29.6 to 35.4 to 45.7 to 48.4. Additional evidence of this "dropping out" of rcopondcnt3 who evidently tired of un3wcring the same set of questions over and over again is shown in Table 3. The percentage of missing information on the perceptual questions increases from 16. 4 to 29. 0 to 38. 8 to 48. 4 as one proceeds from This Bus Trip Lo Travel Mean8 C.
The second reason for removing Travel Means C from the final version of the questionnaire was the shadow effect of the length of the modal-split questions on the completeness of the questions that followed the modal-split section. Note that for the questions about mode preference and captivity and the socioeconomic questions, the percentage of missing information on the long form is substantially greater than that for the short or table form. Evidently, when respondents tired of the modal-split questions, they did not look to see what came next but were probably sufficiently deterred by the length of the questionnaire that they simply placed it in the envelope for mailing. In fact, this effect was so severe that the missing information on the long form is of the order of twice the percentage on the short and table forms. Some slight effect is seen also in the lower percentage of respondents who wrote comments on the long form. An interesting, but not unexpected, sidelight is the large percentage of persons not responding to the income questions.
A third reason for eliminating Travel Means C was the feeling that doing so might encourage higher response rates to Travel Means A and B. That is, the respondent who, for example, worked his or her way through the questions about the bus trip and Travel Means A might have had a negative reaction to filling out the questions twice more. By reducing
the repetition from four times to three, it was hoped to persuade more respondents to persevere and complete the form.
In sum, then, although the table form resulted in a significantly higher response rate, the long form was completed best by the respondents. The length of the long form, however, did result in some negative effects: a drop-off rate in answering the modal-split questions and a lower likelihood of completion of the questions following the modalsplit questions. For these reasons, the final decision was to use the long form modified by the elimination of Travel Means c.
Thus, some very positive and, in the long run, cost-saving measures were learned from the rather extQnsiive pilot study of the on-board and take-home forms. More important, a small in-house pretest on secretarial staff of the the table form had failed to uncover the full extent of the problem revealed in the pilot study. Had a decision been made to pretest just the table torm on the pilot study, the problem would have been discovered and another pilot study would have been necessary to test the long and the short forms. Even worse, had a decision been made on the basis of an in-house pretest to use the table form, the expensive main survey might have failed to generate data of sufficient quality to support the modeling effort.
Midwest Reg ional Travel Survey
Additional advantages of pilot study of the survey experiences on the Midwest
performing an extensive instruments are shown by survey. Two alternative
forms and two alternative survey mechanisms were tested. The two issues to be decided involved the procedure for querying occupation and which of the two surveys (the home-interview attitude survey or the travel logs) should precede the other.
Conventional wisdom in survey research (1,9,10) indicates that asking respondents for occupational information should be done as an open-ended question with a sufficient degree of probing until the interviewer is satisfied that he or she has obtained enough information to permit a coder to categorize the respondent correctly. Three problems exist with this procedure. First, it relies on the ability of the interviewers to probe successfully. Second, the person coding the answers does not have access to the respondent (except with the trouble of a phone

Transportation Research Record 886 21
Table 3. Patterns of missing data for mode-specific perceptual questions (take-home long form).
Missing Answersb
This Bus Trip Travel Means A Travel Means B Travel Means C
Question" No. Percent No. Percent No. Percent No. Percent
I. Too hot or cold 12 13.4 27 27.8 36 37.l 44 45.4 2. Wait 5+ min 10 10.3 26 26.8 35 36.1 45 46.4 3. Get there on time 12 12.4 28 28.9 35 36.l 44 45 .2 4. Expensive to CBD 16 16.5 29 29.9 37 38.1 46 47.4 5. Travel with strangers 16 16.5 30 30.9 36 37.l 48 49.5 6. Not allowed to read/write 18 18.6 27 27.8 36 37.1 47 48 .5 7. Uncomfortable seats 15 15.5 26 26 .8 38 39.2 46 47.4 8. Walk under 10 min 16 16.5 25 25.8 41 42.3 46 47.4 9. Time varies 18 18.6 30 30.9 39 40.2 49 50.5
10. Breaks down 15 15.5 28 28.9 37 38.I 50 51.5 11. Travel in privacy 18 18.6 28 28.9 39 40.2 47 48.5 12. Noisy, bumpy ride 18 18.6 27 27.8 38 39.2 47 48.5 13. Traffic accident 18 18.6 31 32.0 38 39.2 50 51.5 14. Transfers needed 17 17.5 27 27 .8 37 38.1 46 47.4 15. Expensive 15 15.5 28 28.9 37 38.l 47 48.5 16. Security 14 14.4 28 28.9 35 36.1 46 47.4 17. Smoking allowed 23 23.7 32 33.0 47 48.5 52 53.6 18. Availability 14 14.4 29 29.9 36 37 .1 45 46.4
Overall avg 15 .9 16.4 28 . l 29.0 37 .6 38 .8 46 .9 48.4
a For the exact wording and context of each question, see questionnaire, Figures 3-6. b Based on the 97 returned take-home long questfonnaires.
Figure 8. Response cards for job and occupation.
JOB CATEGORIES
A. MANUFACTURING OF TRANSPORTATION EQUIPMENl B. OTHER MANUFACTURING C. AGRICULTURE, FORESTRY AND FISHERY D. MINING E. BUSINESS SERVICES AND REPAIR SERVICES F. PROFESSIONAL AND RELATED SERVICES G. WHOLESALE OR RETAIL TRADE H. FINANCE, REAL ESTATE OR INSURANCE I. TRANSPORTATION, COMMUNICATIONS, UTILITIES J. CONSTRUCTION K. ENTERTAINMENT OR RECREATION SERVICES L. GOVERNMENT M. OTHER (Please Describe)
OCCUPATION TYPES
A. PROFESSIONAL OR TECHNICAL B. FARMER OR FARM MANAGER C. FARM LABORER OR FARM FOREMAN D. OTHER LABORER E. MANAGER, OFRCIAL, OWNER OF A BUSINESS F. CLERICAL AND SIMILAR WORKERS G. SALES H. CRAFTSMAN OR FOREMAN AND SIMILAR WORKERS I. EQUIPMENT OPERATOR OR MOTOR VEHICLE OPERATOR J. PRIVATE HOUSEHOLD WORKER (MAID, BllTUR, ETC.) K. OTHER SERVICE WORKER L. Ml~RY 1111. OTHER (Please Describe)
call). Third, asking a respondent for both job type (agriculture, business, government, etc.) and work type (professional, manager, clerical, sales, etc.) as open-ended questions can lead to confusion as to the meaning of the questions.
Thus, a second procedure also was pretested in the pilot study. Response cards (Figure 8) were handed to the respondent with answers to each of the occupation questions. The respondent was then asked to classify himself or herself with some degree of assistance from the interviewer. Interviewers were instructed to make liberal use of the "Other" category when necessary. Note that the categories employed are those used by the U.S. Census Bureau, with some minor wording modifications. One advantage of this procedure is that the respondent is providing his or her perception of his or her occupation. Another advantage is that, because census categories are used, the main survey can be checked against the census for response bias.
At a debriefing session of the interviewers for the pilot study, the interviewers were unanimous in the opinion that the response cards should be used. Both the interviewers and interviewees were reported to have an easier time getting to what the interviewers described as more realistic answers when they employed the cards. Thus, the second procedure was adopted for the main survey.
As mentioned above, the Midwest survey consistea of an attitude survey of one randomly selected respondent and travel logs for each household member older than five years. Two possibilities existed for performing the survey:
Procedure 1: Distribute the travel logs, make an appointment to pick up the travel logs, and then do the attitude survey when picking up the travel logs (travel log first, interview after) i or
Procedure 2: Do the attitude survey, distribute the travel logs, and make an appointment to pick up the travel logs (interview first, travel logs after).
Procedure 1 had the following advantages. Because the attitude survey was of very limited utility unless the travel logs were completed and a high percentage of refusals to complete the travel logs was expected, time would not be spent on the attitude survey unless the travel logs were complete. It also would permit the interviewer to probe more easily for completion and correct interpretation of the travel logs. Procedure 2, on the other hand, would permit some rapport between the interviewer and the interviewee to develop during the course of

22
the interview. It might then be expected to be easier to convince the household to take and complete the travel logs.
Both procedures were pretested in the pilot study in which 138 households were contacted. There were 41 nonresponses, including 17 outright refusals, l termination, and 23 "no answers." Of the remaining 97 households, half were given travel logs first (Procedure 1) 1 half, interviews first (Procedure 2). As shown below, Procedure 2 was clearly supe-rior.
Res~nse Percent Procedure 1
Refusal of travel log 53 Refusal of interview 5 Completion rate 42
Procedure 2 Refusal of interview 27 Refusal of trav<>l lng 4
Completion rate 69
When presented with the travel logs first, 53 percent of respondents refused to take them compared with a 4 percent refusal rate when the interview was done first. Evidently it is necessary to build up rapport prior to asking respondents to participate in something that, on the surface, appears to be a difficult task. Note also that, in both procedures, once respondents had complied with whatever form was presented first, very low refusal rates (4 and 5 percent) were experienced for the other form.
CONCLUSION
The benefits of testing alternative survey forms when logical arguments concerning the advantages and disadvantages of each form can be offered have been discussed. Two pilot studies designed by us--an on-board survey in Dade County and a regional travel curvcy in the Midwcot--have been used ns examples.
This paper has concentrated on one specific aspect of designing surveys and undertaking pilot studies to illuminate and inform the design process. This aspect, frequently ignored in past transportation surveys, is to test alternative designs or questions, survey instruments, or administration procedures of the survey. In the case studies illustrated, a combination of qualitative judgments and scrutiny of returned survey forms and numerical comparisons and tests was used to seek distinctions in effectiveness of the alternatives tested. In the case of the Dade on-board survey, a sufficient sample size was obtained to permit a number of statistical tests of difference between designs. This was useful to support the qualitative judgments but is not essential to the success of the strategy.
In general, pilot studies are constrained to very small samples. Considerable care and attention must be paid to the sampling for useful results to be obtained from such samples 1 they must be selected carefully and randomly from the same population from which the final sample will be drawn, alternative instruments or procedures must be distributed completely randomly, and all aspects of the survey must be conducted as closely as possible to the expected design of the final survey. Provided that this is done, the small sample will still provide very useful information, even if it is too small to allow statistical comparisons such as those used in the Dade County case study. A good rule of thumb seems to be to aim for a minimum of 50 responses for each alternative tested. If little or no difference,
Transportation Research Record 886
qualitatively and quantitatively, is found between such subsamples, the selection among the tested alternatives is probably not of major significance to the survey results. If large differences are found (even if they cannot be tested statistically), a good basis is provided tu select one alternative over another.
In the illustrated case studies, it is apparent that without a pilot study, decisions on the alternative designs and procedures would be likely to have led to significantly lower response rates, less complete responses, or higher cost surveys than was the case after the pilot study results were used. However, the prohibitive effect of current OMB regulations on conducting such pilot studies for. surveys covered by these regulations must be noted and should be a matter of major concern to those committed to improving the quality and usefulness of transportation data collection.
ACKNOWLEDGMENT
We would like to thank the staffs of the Dade County Office of Transportation Administration (OTA) and the Kaiser Transit Group (KTG) for their assistance during various phases of this research. Special thanks are due Gary Spivack and Michael Brown of OTA and Howard Eisenstadt of KTG. We also wish to acknowledge the assistance of the Southeastern Michigan Transportation Authority (SEMTA). The views expressed in the paper are ours and do not necessarily reflect the views of OTA, KTG, or SEMTA.
REFERENCES
1. E.R. Babbie. Survey Wadsworth Publishing Co., 1973.
Research Methods. Inc., Belmont, CA,
2. D.A. Dillman. Mail and Telephone Surveys: The Total Design Method. New York, Wiley, 1978.
3. I.M. Sheskin, G.S. Spivack, and P.R. Stopher. Dade County's On-Board Bus Survey. Transit Journal, Spring 1981, pp. 15-28.
4. Transit Development Program. Office of Transportation Administration, Dade County, Miami, FL, Feb. 1980.
5 . Preliminary Draft of Countywine Attitude Survey. Dade County Metro Transit Agency, Miami, FL, 1980.
6. I.M. Sheskin and P.R. Stopher. The Dual Survey Mechanism as a Device for Gauging Nonresponse Bias. Presented at Annual Meeting of Southeastern Division of Association of American Geographers, Blacksburg, VA, Nov. 1980.
7. I.M. Sheskin and P.R. Stopher. Transportation and Energy--Some Urban Perceptions. Proc., Transportation Research Forum, Vol. 22, No. 1, 1981, pp. 332-342.
8. P.R. Stopher and A.H. Meyburg. Survey Sampling and Multivariate Analysis for Social Scientists and Engineers. Lexington Books, Lexington, MA, 1979.
9. C.H. Backstrom and G.D. Hursh. Survey Research. Northwestern Univ. Press, Evanston, IL, 1963.
10. C.J. Dixon and B. Leach. Questionnaires and Interviews in Geographic Research. Study Group in Quantitative Methods, Institute of British Geographers, Univ. of East Anglia, Norwich, Concepts and Techniques in Modern Geography No. 18, 1979.