Embed Size (px)
Citation preview

Transit IDEA Program
Independent Transportation Network: Alternative Transportation for the Elderly Final Report for Transit IDEA Project 9 Prepared by: Katherine Freund, MA Southern Maine Area Agency on Aging and James McKnight, Ph.D National Public Services Research Institute March 1997

Innovations Deserving Exploratory Analysis (IDEA) Programs Managed by the Transportation Research Board This Transit IDEA project was funded by the Transit IDEA Program, which fosters development and testing of innovative concepts and methods for advancing transit practice. The Transit IDEA Program is funded by the Federal Transit Administration (FTA) as part of the Transit Cooperative Research Program (TCRP), a cooperative effort of the FTA, the Transportation Research Board (TRB) and the Transit Development Corporation, a nonprofit educational and research organization of the American Public Transportation Association (APTA). The Transit IDEA Program is one of four IDEA programs managed by TRB. The other IDEA programs are listed below. • NCHRP Highway IDEA Program, which focuses on advances in the design, construction, safety,
and maintenance of highway systems, is part of the National Cooperative Highway Research Program.
• High-Speed Rail IDEA Program, which focuses on innovative methods and technology in support of the Federal Railroad Administration’s (FRA) next-generation high-speed rail technology development program.
• Safety IDEA Program, which focuses on innovative approaches for improving railroad safety and intercity bus and truck safety. The Safety IDEA program is funded by the Federal Motor Carrier Safety Administration and the FRA.
Management of the four IDEA programs is coordinated to promote the development and testing of innovative concepts, methods, and technologies. For information on the IDEA programs, look on the Internet at www.trb.org/idea or contact the IDEA programs office by telephone at (202) 334-3310 or by fax at (202) 334-3471. IDEA Programs Transportation Research Board 500 Fifth Street, NW Washington, DC 20001
The project that is the subject of this contractor-authored report was a part of the Innovations Deserving Exploratory Analysis (IDEA) Programs, which are managed by the Transportation Research Board (TRB) with the approval of the Governing Board of the National Research Council. The members of the oversight committee that monitored the project and reviewed the report were chosen for their special competencies and with regard for appropriate balance. The views expressed in this report are those of the contractor who conducted the investigation documented in this report and do not necessarily reflect those of the Transportation Research Board, the National Research Council, or the sponsors of the IDEA Programs. This document has not been edited by TRB. The Transportation Research Board of the National Academies, the National Research Council, and the organizations that sponsor the IDEA Programs do not endorse products or manufacturers. Trade or manufacturers' names appear herein solely because they are considered essential to the object of the investigation.

Independent Transportation Network: Alternative Transportation for the Elderly
IDEA Program Final Report
Transit IDEA Project 9
Prepared for Transit IDEA Program
Transportation Research Board National Research Council
Prepared by Katherine Freund, MA
Southern Maine Area Agency on Aging and
A. James McKnight, Ph.D National Public Services Research Institute
March 1997

ACKNOWLEDGEMENTS
Now I understand why people have acknowledgments. Not only is this research project built upon the work of others, it would not even be possible with out their help and insight. First, and most, I want to thank Dr. A. James McKnight of National Public Services Research Institute, whose research design, project evaluation, and generosity made this project possible. I also wish to thank Dr. Richard Fortinsky and Dr. Sandra Rosenbloom for their early and consistent support. The Southern Maine Area Agency on Aging and its Executive Director, Laurence Gross, gave the project a home, the Maine Department of Transportation identified the IDEA Program at the Transportation Research Board as an appropriate organization for a “new idea,” and the UNUM Foundation provided economic support for the “Driving Miss Daisy” Project. Special thanks to Dr. John Eberhard at the National Highway Traffic Safety Administration, Jon Burkhardt of Ecosometrics, Audrey Straight at the Public Policy Institute of the American Association of Retired Persons, and Stewart McKeown at the Federal Transit Administration. I thank Katie Brown and Mike Wells at the Independent Transportation Network for the endless hard work of lifting ideas off the page into the reality of the world, and my children, Alison and Ryan Walsh, who forgive me for the time I spend away from them. Finally, I wish to thank all of the staff from the Transit IDEA Program for their consistent patience, understanding, and support. The opinions and conclusions expressed herein are solely those of the authors and should not be construed as representing the opinions or policies of the Transportation Research Board, the National Academy of Sciences, or the United States Government.

TABLE OF CONTENTS
EXECUTIVE SUMMARY . . . . . . . . . . . . . . . . . . . . . . . . . . . . . . . . . . . . . . 1
Concept . . . . . . . . . . . . . . . . . . . . . . . . . . . . . . . . . . . . . . . . . . . .1
Research Design and Results . . . . . . . . . . . . . . . . . . . . . . . . . . . . . . . . . 1
IDEA PRODUCT . . . . . . . . . . . . . . . . . . . . . . . . . . . . . . . . . . . . . . . . . . . 3
CONCEPT AND INNOVATION . . . . . . . . . . . . . . . . . . . . . . . . . . . . . . . . . . . 3
INVESTIGATION . . . . . . . . . . . . . . . . . . . . . . . . . . . . . . . . . . . . . . . . . . .4
Method . . . . . . . . . . . . . . . . . . . . . . . . . . . . . . . . . . . . . . . . . . . . 4
Needs Assessment . . . . . . . . . . . . . . . . . . . . . . . . . . . . . . . . . . 4
Design of the Pilot ITN . . . . . . . . . . . . . . . . . . . . . . . . . . . . . . . 5
Implementation . . . . . . . . . . . . . . . . . . . . . . . . . . . . . . . . . . . 5
Results . . . . . . . . . . . . . . . . . . . . . . . . . . . . . . . . . . . . . . . . . . . . 7
Needs Assessment . . . . . . . . . . . . . . . . . . . . . . . . . . . . . . . . . . 7
Interviews with Transit Providers . . . . . . . . . . . . . . . . . . . . . .7
Focus Groups . . . . . . . . . . . . . . . . . . . . . . . . . . . . . . . 8
Telephone Survey . . . . . . . . . . . . . . . . . . . . . . . . . . . . . 9
Current Driving Status . . . . . . . . . . . . . . . . . . . . . . 10
Alternatives to Driving . . . . . . . . . . . . . . . . . . . . . 11
Expectations . . . . . . . . . . . . . . . . . . . . . . . . . . . 11
Transportation Service . . . . . . . . . . . . . . . . . . . . . . . . . . . . . . . 12
Reports of Transportation Characteristics . . . . . . . . . . . . . . . . . 12
Times of Transportation Use . . . . . . . . . . . . . . . . . . . 12
Purpose of Transportation . . . . . . . . . . . . . . . . . . . . .13
Difficulties in Meeting Transportation Needs . . . . . . . . . . . 14
Modes of Transportation . . . . . . . . . . . . . . . . . . . . . 14

User Characteristics . . . . . . . . . . . . . . . . . . . . . . . .15
Satisfaction with ITN . . . . . . . . . . . . . . . . . . . . . . . 15
Interest in ITN Programs . . . . . . . . . . . . . . . . . . . . . 15
ITN Trip Characteristics . . . . . . . . . . . . . . . . . . . . . .15
Trip Purpose . . . . . . . . . . . . . . . . . . . . . . . . . . . .16
Number and Distances of Trips . . . . . . . . . . . . . . . . . . .17
Participation Characteristics . . . . . . . . . . . . . . . . . . . . . . . . 17
Membership . . . . . . . . . . . . . . . . . . . . . . . . . . . . 17
Gift Certificates . . . . . . . . . . . . . . . . . . . . . . . . . . 17
Advance Payment . . . . . . . . . . . . . . . . . . . . . . . . . 17
CONCLUSIONS . . . . . . . . . . . . . . . . . . . . . . . . . . . . . . . . . . . . . . . . . . . . 17
Plans for Implementation . . . . . . . . . . . . . . . . . . . . . . . . . . . . . . . . . . . 18
REFERENCES . . . . . . . . . . . . . . . . . . . . . . . . . . . . . . . . . . . . . . . . . . . . 19

EXECUTIVE SUMMARY CONCEPT Most older Americans depend upon the private automobile for transportation. This dependence poses serious safety and mobility consequences for diminished capacity older drivers, who rely on the automobile for access to the basic necessities of life. The Independent Transportation Network (ITN) is an attempt to develop a safe, affordable, and desirable transportation alternative for millions of people who, sooner or later, will not be able to drive safely, but who will want to remain in their homes, leading an independent lifestyle. The basic idea behind the ITN is that people who have grown up and grown old with the automobile will be most inclined to choose a transportation alternative which closely approximates the system they must forgo. The ITN replaces such traditional underlying transit assumptions as the use of vans or buses and the reliance on public funding with new assumptions that reflect consumer preference. Thus, the ITN is built on the assumptions that people ride in cars because they like them, and people are willing to pay for their own transportation. Moreover, there is dignity and independence in doing so. Based upon these assumptions, the ITN uses cars to pick people up and take them where they need to go. Seniors pay for the rides by the mile, with discounts for advance scheduling and ridesharing. The ITN is organized as a membership based non-profit corporation, providing feelings of safety and belonging, the importance of which cannot be underestimated for seniors, who may feel frail and vulnerable. Customers may pay cash for ITN service, on a pay-per-ride basis, or they may set up an account, against which they may draw for transportation service, and into which they may pay in any of several ways, including but not limited to membership dues and benefits, cash value of no longer used vehicles, monthly payments based on previous automobile expenses, monthly payments from adult children or financial advisors, profits from affinity credit cards, third party payers (such as merchants), frequent rider credits, and transportation credits for volunteer services. This innovative payment plan and non-profit structure distinguishes the ITN from standard taxi service. The Independent Transportation Network is mass transit that looks, feels, and acts like the private automobile, but it is mass transit in ownership and efficiency. Because people will share rides, traffic congestion will decrease, and air quality will improve. When diminished capacity older drivers have a satisfactory alternative to the private automobile, public safety and senior mobility will improve.
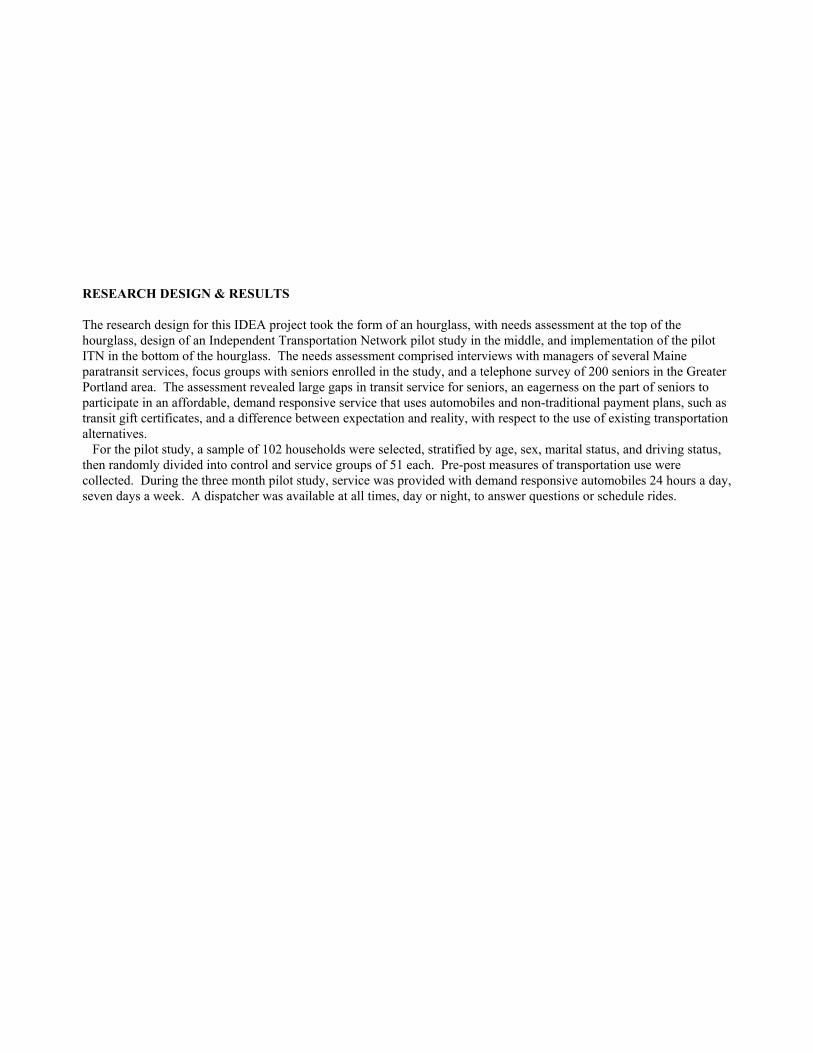
RESEARCH DESIGN & RESULTS The research design for this IDEA project took the form of an hourglass, with needs assessment at the top of the hourglass, design of an Independent Transportation Network pilot study in the middle, and implementation of the pilot ITN in the bottom of the hourglass. The needs assessment comprised interviews with managers of several Maine paratransit services, focus groups with seniors enrolled in the study, and a telephone survey of 200 seniors in the Greater Portland area. The assessment revealed large gaps in transit service for seniors, an eagerness on the part of seniors to participate in an affordable, demand responsive service that uses automobiles and non-traditional payment plans, such as transit gift certificates, and a difference between expectation and reality, with respect to the use of existing transportation alternatives. For the pilot study, a sample of 102 households were selected, stratified by age, sex, marital status, and driving status, then randomly divided into control and service groups of 51 each. Pre-post measures of transportation use were collected. During the three month pilot study, service was provided with demand responsive automobiles 24 hours a day, seven days a week. A dispatcher was available at all times, day or night, to answer questions or schedule rides.

While no significant pre-post differences in ease of travel appeared within either the service or control groups, or between the two groups, or between users and non-users of ITN, the 25 seniors in the service group who used the ITN during the three month pilot test period gave the service a highly satisfactory rating. (Of the 26 remaining in the service group, 10 more used the service in the subsequent three months.) On a scale of one to five, service ratings averaged 4.9 for safety, courtesy, friendliness, cleanliness, comfort, and ease of getting in and out of the vehicle. Users scored the service 4.8 for promptness and 4.6 for knowledge of area roads. Over duration of the study period, the number of trips (n=441) increased significantly from the first half of the study period to the second, despite cold and snowy weather in the second half. Aspects of participation in the ITN, beyond being transported in vehicles, involved membership, the gift certificate program and advance payment. Forty-two of the 102 households became dues paying members of the ITN, 21 from each group, control and service. This 41 percent membership response indicates both that seniors are willing to join a membership organization dedicated to meeting their transportation needs, and that such an organization contributes to a sense of transportation security. Sixty-nine percent of service group participants redeemed Christmas gift certificates mailed to them to test their willingness to pay for transportation with a gift certificate. This high return rate indicates the gift certificate program is a likely source of revenue for the ITN. Of the 25 service group users, eight elected to set up advance payment accounts, or had accounts set up for them. Willingness to pay in advance has implications for smart cards and other systems for debiting prepaid accounts. Finally, seniors in both the service and control group indicated a willingness to participate in several innovative payment plans and cost saving devices, including Frequent User credit card miles (77 percent), ridesharing (74 percent), and third party payment through merchant participation (71 percent). From the perspective of service quality and customer satisfaction, this IDEA product demonstrates that it is possible to successfully provide a demand responsive transportation service for seniors that models the comfort and convenience of the private automobile. The significance of this finding lies in its potential to meet the mobility requirements of America’s aging population, increasingly stranded in suburban and rural areas by diminished capacity to drive an automobile and inadequate public transit. IDEA PRODUCT An alternative transportation service for non-driving seniors, the Independent Transportation Network (ITN) has been pilot tested in Portland, Maine, a metropolitan area of 125,000 people. This pilot ITN investigated two true aspects of feasibility: How well the service can be provided, and how well the service is accepted. Using demand responsive automobiles available 24 hours a day, seven days a week, researchers provided a transportation service designed to approximate the comfort and convenience of the private automobile. A dispatcher was available at all times, day or night, to answer questions or schedule rides. There were no restrictions placed on use, based upon trip purpose, or on users, based upon income. Seniors paid for rides by the mile, but discounts for advance scheduling and ridesharing promoted economy for customers and efficiency for the transit provider. Seniors who used the service gave it a 4.9

rating on a scale of 1 to 5 in the areas of safety, courtesy, friendliness, cleanliness, comfort and ease of getting in and out of the vehicles. The impact of this IDEA product for transit practice lies in its potential to: 1) develop a viable transportation alternative for seniors in suburban and rural locations through the use of low cost, readily available vehicles (automobiles); 2) provide a transit product so satisfying to consumers that they will be willing to pay for it; and 3) improve public safety by providing a desirable alternative to the private automobile for the rapidly growing, aging population. CONCEPT AND INNOVATION Most older Americans depend upon the private automobile for transportation. This dependence poses serious safety and mobility problems for diminished capacity older drivers, who rely on the automobile for access to the basic necessities of life. The Independent Transportation Network is an alternative transportation system designed to meet the needs of the elderly, especially diminished capacity older drivers. The need for alternative transportation for the elderly is a product of five factors: elderly population growth,1 suburban population growth,2 inadequate public transportation,3 safety,4 and the need for independence and choice.5 The ITN is an attempt to find a safe, affordable, and desirable transportation alternative for millions of people who, sooner or later, will not be able to drive safely, but who will want to remain in their homes, leading an independent lifestyle. The basic idea behind the ITN is that people who have grown up and grown old with the automobile will be most inclined to choose a transportation alternative which closely approximates the system they must forego. The Independent Transportation Network begins by examining some of the tacit assumptions underlying current alternative transportation practice. These assumptions include:
1. When seniors who have traveled in automobiles all their lives can no longer safely drive, they will be satisfied
with transportation in vans or buses.
2. Seniors who have paid for their own transportation all their lives need rides in publicly subsidized transit when they stop driving.
3. Seniors who still drive have sufficient mobility. 4. Seniors who maintain their safety by limiting their driving to daylight hours, familiar roads, fair weather, and non-rush hour travel, always feel safe on those occasions when they do drive.
The ITN replaces these old assumptions with new assumptions. These include:
1. Seniors who have traveled in automobiles all of their lives prefer to travel in automobiles.
2. Seniors who have paid for their own transportation all of their lives prefer to pay for their own transportation.
There is dignity and independence in doing so.
3. Seniors who limit their driving to maintain their safety may have limited mobility even if they still possess and use a driver's license.
4. Seniors who limit their driving because certain times, conditions, and driving situations feel unsafe may feel
unsafe when or where they do drive. Based upon these new assumptions, the ITN is an alternative transportation service that uses cars to pick up seniors and take them where they want to go. Seniors pay for the rides by the mile, with discounts for advance scheduling and ridesharing. The ITN is organized as a non-profit, membership based corporation, providing feelings of safety and

belonging, the importance of which cannot be overestimated for seniors, who may feel frail and vulnerable. Customers may pay cash for ITN service, on a pay-per-ride basis, or they may set up an account, against which they may draw for transportation service, and into which they may pay in any of several ways, including but not limited to:
· membership dues · cash value of no longer used vehicles · monthly payments based on the money they had been spending for car payments, insurance, gasoline,
maintenance, parking, registration, excise tax · gift certificates from adult children or friends · transportation credits from a Frequent Rider credit card program · payments from a third party payer, such as a local merchant or health care provider · transportation credits for volunteer service
This innovative payment plan and non-profit organizational structure distinguishes the ITN from standard taxi service. The ITN is mass transit that looks, feels and acts like the private automobile. Like the automobile, the ITN is convenient, comfortable, and privately funded. Unlike the automobile, an investment in the ITN does not depreciate, it appreciates. People who travel on the ITN can pay for their transportation through a redistribution of existing assets, such as no longer used vehicles. Diminished capacity older drivers can travel on the ITN when they can no longer drive safely, but are still interested in living independently. Moreover, the ITN may help seniors with limited driving ability voluntarily make the transition from the driver's seat to the passenger seat by offering them an opportunity to try a mode that suits their lifestyle. The Independent Transportation Network is mass transit in ownership and efficiency, but it feels personal and private in use. Because people share rides, traffic congestion decreases and air quality improves. When diminished capacity older drivers have a satisfactory alternative to the private automobile, public safety and senior mobility improve. An economically self-sustaining ITN could be replicated in other cities and other states, thereby creating a nationally interconnected, non-profit, transportation alternative for non-driving seniors. INVESTIGATION METHOD The specific aim of this research project was to help elderly citizens fulfill their transportation requirements with independence and safety. This broad goal can be defined in terms of several specific objectives:
· Meeting Basic Life Needs--To provide access to such basic necessities as food clothing, medicine and medical care.
· Social Contact--To improve the quality of seniors' lives by providing the means to visit family and friends and to participate in such social resources as church, adult education, cultural events, and civic organizations.
· Safety--To help diminished capacity older drivers regulate their driving by providing an alternative to the private automobile.
· Independence--To foster independence by improving seniors' ability to remain productive members of society. · Security--To provide a sense of security through membership in an organization that will provide transportation
whenever it is needed. · Aging in place--To permit seniors to remain in their homes when they can no longer operate an automobile.
The study was designed in the form of an hourglass, with needs assessment at the top of the glass, design of an Independent Transportation Network pilot study in the middle, and implementation of the pilot ITN at the bottom of the hourglass.

Needs Assessment Seniors' transportation needs were assessed through interviews with paratransit providers, a telephone survey of the over 65 population in the greater Portland area, and focus group discussions with seniors participating in the pilot study. Interviews were conducted with six paratransit providers across the state--People's Regional Opportunity Program (PROP) and the Regional Transportation Program (RTP) in Portland, Western Maine Transportation and Community Concepts in western Maine, York County Community Action Program in Southern Maine, and Washington Hancock Community Action Program in the eastern part of the state. All six interviews followed a 31 question format. Three focus groups were conducted in August at the Southern Maine Area Agency on Aging (SMAAA). Sessions lasted one to two hours, with six to eight participants. All discussions were tape recorded and later transcribed. Focus group participants were drawn from the sample of 100 households in the TRB study, and divided into groups according to driving status--seniors who have never driven, former drivers, and current drivers. Researchers attempted to achieve diversity by age, sex, and geographic distribution in all groups. Focus group scripts were drafted, circulated, and revised. The purpose of the revised script was to learn how seniors feel about existing transportation alternatives and to whom they turn when they have concerns about transportation. More specifically, focus group participants were asked what attracted them to the Independent Transportation Network, and whether they liked or disliked several payment and cost saving options proposed by the ITN, including gift certificates from adult children, smart cards, debit accounts, ridesharing, Frequent Rider Miles, fare discounts for advance notice, and transportation credits for no longer used vehicles. The telephone survey of the over 65 population was conducted at the Area Agency on Aging over several evenings and days using staff and trained volunteers. A sample was selected from the SMAAA mailing list, grouped alphabetically by town. Characteristics of people on the list were compared with similar characteristics for the over 65 population in the US Census for Portland and vicinity. Overall, the SMAAA seniors have a higher income than similar seniors in the over 65 population, though inflation may account for this, since census data are from 1989. SMAAA seniors are slightly more likely to own an automobile, and they are more likely to report a disability. The survey instrument was drafted, circulated for review, pilot tested and revised before being used to interview a sample of 200 seniors in October and November. Design of the Pilot ITN The criteria for selection of households for the pilot study were:
· Be age 65 or older · Live within a 25 mile radius of Portland · Express a willingness to use the service · Complete an application form (pre-service measures) and sign an informed consent
The methodology for assigning the sample of 102 households into two equally matched groups was to first separate the ten households that were couples. The remaining population was divided into categories by driving status--non-drivers, former drivers, and current drivers--then stratified by age and sex and randomly divided. The process was then repeated for the ten households of couples. The final sample had 51 households in each category, as shown in Table 1.
Implementation Two 1995 mid-size automobiles were leased for the study. No special license plates were required, since it was a research project. However, "for hire" license plates were required for regular ITN service initiated after the research

phase was complete. A Bureau of Motor Vehicles check for at-fault accidents and moving violations, a criminal history check, three personal references, and a personal interview were required of all drivers and dispatchers. A road test was added to the screening procedure after several weeks. Communication between drivers and dispatchers was accomplished with hand held, two-way radios leased for the study, and a cellular telephone. The cellular phone was particularly effective, since it allowed staff to forward calls from the office to the cell phone, effectively providing round the clock dispatch capability for a nominal cost. Any senior who calls to schedule a ride during non-office hours speaks to a person, rather than an answering machine. In this fashion, seniors can always have a ride when they need it. All drivers wore photo identification cards, and large placards with the ITN logo were placed on the dashboard of all vehicles. One or two drivers were on duty at all times. Rides were provided in ITN vehicles whenever possible, but volunteer drivers from another study were also used to carry passengers when both project vehicles were busy.
TABLE 1 Pilot Study Sample
Service
Control
Gender
M
12.00
11.00
F
44.00
45.00
Age
Mean
79.48
78.96
65-69
3.00
4.00
70 -74
7.00
13.00
75 -79
17.00
10.00
80 -84
15.00
13.00
85 -89
12.00
15.00
90 -up
2.00
1.00
Driving Status
Never driven
13.00
15.00
Former Driver
32.00
30.00
Current Driver
11.00
11.00
Total
56.00
56.00
Fares were collected according to the schedule in Table 2. Fares were structured high enough to prevent frivolous use of the service, and low enough to be affordable to seniors with limited means. As shown in Table 2 there was a small incentive for scheduling rides in advance, as well as an incentive for sharing rides with others. Drivers waited up to 15 minutes for seniors who needed to stop for errands. A $5.00 premium was charged for rides between 10:00PM and

8:00AM. Researchers encouraged customers to set up accounts, both because it is much easier for the drivers than collecting cash, and because it establishes the practice of using an account, an important part of the innovative payment plans proposed for the ITN. With an account specially designated for transportation, seniors and their children can deposit funds from various sources and withdraw them in an accountable fashion. Accounts provide a source of ownership and investment in the transportation system. Like the purchase of an automobile, accounts establish designated resources for transportation. The psychological importance of this practice cannot be overstated.
TABLE 2 Cost Per Mile, Per Person to Ride the ITN During the Research Phase
Ride Alone
Share a Ride with 1 other
Share a Ride with 2 others
Share a Ride with 3 others
Ask for Immediate Service
55 cents
40 cents
35 cents
30 cents
Give 24 Advance Notice
45 cents
30 cents
25 cents
20 cents
There was a $1 charge per vehicles, per ride, in addition to the charges listed above. Prices and service were subject to change
The three month pilot study was conducted between November 15, 1995 and February 14, 1996. The week before Christmas, all seniors in the service group were mailed Merry Christmas gift certificates to test their willingness to use a transportation gift certificate. At the conclusion of the three month pilot study, all seniors were mailed a survey of their transportation needs similar to the pre-service measures collected from them when they first applied to the ITN for transportation, except questions about willingness to share rides and willingness to participate in various payment plans were added to the post service questionnaire. Surveys not returned by mail within a few weeks were recovered through followup phone calls. All participants except one who died during the course of the study returned their post service measures. Since ITN service continued after the pilot study, all participants also received a letter asking if they would like to become a dues paying member of the Independent Transportation Network, which was by then incorporated as a non-profit, membership based corporation. The letter explained that all seniors were eligible to receive rides, whether or not they chose to become dues paying members. However, certain benefits of membership would accrue to members, such as a free ride for the member's birthday, free miles for referring another senior to the service, and eligibility for innovative payment plans, such as Frequent Rider Miles. RESULTS The description of results is presented in two sections. The first section reports the results of the needs assessment, while the second section reports the results of the ITN transportation service.

Needs Assessment The assessment of needs includes the interviews with transit providers, the focus groups, and the telephone survey. Interviews With Transit Providers Providers use buses with paid drivers and automobiles with volunteer drivers to serve primarily a low income, Medicaid eligible population. Miles of service provided with volunteer drivers in private automobiles ranged from a low of 28 percent to a high of 97 percent. Providers indicated they are unable to meet requests for rides to work, shopping and laundry. They are also unable to meet ride requests for medical needs for seniors on Medicare but not Medicaid, and for seniors visiting spouses in nursing homes. Middle class seniors, seniors with money, and the working poor are not well served by paratransit, according to the providers interviewed. Ridesharing is permitted but there is no consistent policy on fares or shared costs. There is no on-demand service; rides are scheduled 24 or 48 hours in advance. Providers felt that vans and buses served customers needs well. One provider explained that she spends a lot of time convincing passengers to ride the bus. Another expressed annoyance with customers who prefer a volunteer driver in an automobile, since the service is paid for with public resources. Providers believe the most popular features of their service are personal attention and door-to-door service. When asked what their clients would improve about their service, providers replied "less notice for a ride" and on-demand service. Focus Groups Although similarities across all three groups greatly exceeded differences, there were some notable differences. All groups expressed difficulty securing adequate transportation, frequently citing health problems as the initial and often continuing cause of trouble. When asked "What do you think about your own ability to get around," many seniors complained about bus service (though some were happy with it,) the high cost of taxicabs, difficulty walking, and their desire not to impose on family and friends for transportation favors. One participant, who gave up driving because of the expense, and who now walks or takes buses or taxicabs, said "I have two working daughters. I just don't like to ask them to do anything. I know they would if I asked them, but I really don't like the feeling that I'm dependent on my children." This discussant chose her current residence so she can be near public transportation. Still, she has difficulty walking to the bus stop, finds taxicabs too expensive, and does not go out at night because she has no safe, affordable transportation. Focus group participants who still drive expressed a different kind of frustration. In addition to the mobility problems typical of non-drivers and former drivers, seniors who still drive expressed frustration with their driving limitations, caused by illness, inexperience, anxiety, or cost. It is interesting to note that the difference between former drivers and drivers, in some cases, is really a matter of self image. That is, former drivers who chose not to drive and drivers who choose not to drive are really people at close stages along an invisible transitional continuum. For example, a man who called himself a former driver said, "I can drive, all right, but I don't like to. I don't feel as secure as I did when I was a young fellow, because I'm not using it everyday, and I don't own one [automobile], now. Confidence is gone a bit...when you don't use a car that much, and it's so expensive." Compare this to a newly widowed senior who calls herself a driver, but is so afraid to drive, she leaves her car parked in the garage all the time. She says, "With a retired husband a few years back, I hadn't done much driving. I had in the past, but when he was there, he was going to drive, and now I'm on the fence. Should I start driving a little again? I'm reluctant, to be honest. I live right here in Portland, and it's terribly hard to get around." Even drivers who felt happy with the freedom and independence their driving afforded them complained about their limited mobility outside the areas where they feel safe to drive. For example, a 90 year old senior who drove herself to the focus group discussion in downtown Portland, but who had been too ill to drive the previous year, said, "It's frustrating when you can't go out of the city long distances, as I've been used to driving, taking people to have a change of scenery, and to eat at different places. All of my friends have been dependent upon me, but this year they have found that they have to find other resources if they wanted to get out."

Another woman, who learned to drive later in life, described it as "the first little taste of independence I've had." She loves to drive, but worries about car repairs, and doesn't want to put too much worry or energy into [driving] because of what might happen with my eyes." Like many other seniors, her vision is deteriorating. She added, " I'm sort of in a dilemma, because I'm still well enough to want to go, go, go. And so, I take on a lot of volunteer things to keep active, and transportation with those has become a problem." When asked to think back to what it was about the Independent Transportation Network that attracted them, seniors answered that they have difficulty using the bus and the ITN is less expensive than taxis. They liked the fact that it is available on demand because they could use it for emergencies (times when they cannot plan ahead for transportation) and because they can use the ITN to go shopping or to visit friends in nursing homes. One man laid his copy of the newspaper article about the ITN on the table and said, "It drew attention to people like us." When asked what he meant by "people like us," he explained, "I guess it goes back to people who are on the handicapped side. Independent, retired. We all have our pride, and our minds are all right. It's hard to shuffle around." One woman said she thought the phrase from the ITN brochure, "for those who prefer not to drive," was particularly thoughtful "because you didn't have to talk about all your infirmities...or lack of experience or all those little details that make it necessary for you to require it" [ITN service.] Researchers used the last part of each of the focus groups to learn what seniors think about the various innovative payment plans. The gift certificate program was universally and enthusiastically endorsed by all three groups. One woman, who had just explained that she would not accept cash to pay for taxicabs from her daughter, responded to a question about gift certificates by saying, "That's great. They're always wondering what they can get you. They may as well get you something you need." The interviewer probed, "You just said your daughter offered you cash for transportation and you declined, but now you're saying that if it were a gift certificate, that would be OK?" Senior #1: "I don't want her to do it because she feels, she says, 'You don't have a lot of money.' I can afford it. I'll take care of it. I said 'No, I'll manage myself.' As I say, I'm independent." Senior #2: "It sounds better, I think, than to have someone offering you money." Senior #3: "It's a gift, rather than a handout." Senior #2: "You still have your independence." Senior #4: "We get Christmas presents we never open." Senior #2: "Or if you do open it, it's something you never use, or didn't want." PI: "So, if someone gave you a gift of transportation, that would be a gift you would want?" Senior #1: "Yes, you could plan that way, like I've always wanted to go to such and such a place." Senior #3: "From the point of view of the other party, it would be something that they would consider very worthwhile, that they were doing something nice in the way of a gift." From this discussion alone, it is clear that the gift certificate program warrants further development. Ridesharing also received a favorable response in all three groups, often for social reasons. Almost everyone received an ITN ride to the focus group discussions, so ridesharing was fresh in their minds. On the ride home, some seniors quickly exchanged phone numbers, so they could stay in touch with each other. Convenience, however, was always a concern. People did not want to be inconvenienced by waiting for others, nor did they want to inconvenience others by taking too long with their shopping or errands. Thus, ridesharing is a good cost saving possibility, but it must meet consumer needs to work effectively. Seniors also talked about convenience when they were asked about their willingness to plan rides in advance to save money. Most agreed that they wouldn't mind planning ahead, if they could do so without inconveniencing themselves too much. Everyone seemed excited about the possibility of transportation service available on demand, and agreed they

would be willing to pay a premium for such convenience. Cost was a factor for some; others clearly stated they were willing to pay to have a car waiting for them while they shopped. Smart cards received mixed reviews. It was difficult to explain them to seniors, so the principal investigator called them debit cards. Many seniors said they preferred to pay cash, though some responded favorably to the idea of an account for transportation, because it would help them budget or keep track of transportation expenses. Seniors in the driving group thought debit cards were a great idea, especially when they learned they might have the option of turning in their cars for transportation credits in a bank account. Trading in cars to pay for rides was well received. Many seniors said they "just gave their cars away, anyway." One member of the driver focus group said she had already had three strokes and could not drive for six months after each one. She wanted to know how soon she could trade in her car. Telephone Survey Two hundred seniors participated in the phone survey from the greater Portland area. The average age of the sample was 77.8 years old (range was 66 - 95). Almost seventy-five percent of those sampled were female, 37.5 percent were married, 48.8 percent were widowed, and 13.7 percent were either divorced, separated or never married; 52.8 percent lived alone, 36.6 percent lived with their spouse, and 10.5 percent lived with a child or someone else. The respondents were asked to estimate their 1994 household income. Of those who responded, 57.1 percent reported that their income was $20,000 or less. Respondents were asked if they had any physical disabilities. Almost twenty percent said they had physical disabilities that made it difficult to drive, 36.9 percent reported difficulty walking, and 9.4 percent had difficulties caring for themselves. Current driving status Respondents were asked about their current driving status, including questions about their license and driving activities. Results appear in Table 3. TABLE 3 Driving Status and Activities
Status
Percent
Ever had license
88.2%
Current license
78.0%
Own automobile
76.1%
Currently drive
70.0%
Changes in driving over last 5 years
44.2% (drivers only)
Avoid driving at night
60.3% (drivers only)
Avoid driving in winter
36.2% (drivers only)
Avoid busy times
45.5% (drivers only)
Avoid turnpikes and interstate roads
25.9% (drivers only)
Avoid driving downtown
35.7% (drivers only)

Avoid driving near schools or small children
6.3% (drivers only)
Avoid unfamiliar locations
36.3% (drivers only)
Drive themselves to places they need to go
70.4%
In answer to other questions, 9.6 percent reported that they had changed residence in the last five years to better meet their transportation needs, 16 percent reported setting aside money specifically to meet changing transportation needs, 17.9 percent reported having concerns about their current transportation situations, and 28.8 percent reported being worried about another senior's driving. For those who drive, 75.4 percent find it enjoyable all or almost all the time. Although 64 percent give rides to others, most (69.8 percent) of these respondents reported that this occurs only a few times a month or less. Alternatives to Driving Respondents were asked to describe other ways they get to where they need to go. A list of possible alternatives was provided, and they were asked to respond 'yes' or 'no' to each alternative. Table 4 presents the results. TABLE 4 Percent of Sample Making Use
of Various Driving Alternatives
Form of Travel
Percent Using
Ride with someone else
76.1%
Ride a bus
18.2%
Use a taxi
23.3%
Use a public van
10.2%
Walk
50.0%
Riding with others is clearly the predominant form of transportation, with buses and taxis being used by a relatively small minority Expectations Respondents were asked about their expectations regarding transportation needs. Over half (54.4 percent) believed that their needs will be different ten years in the future, compared to 19 percent, who believed that there would be no change after ten years. Respondents were also asked about possible use of alternatives if their current means of transportation should that become unavailable. Again, a list of alternatives was presented and they were asked to respond yes or no to each one. The results are presented in Table 5.

TABLE 5 Percent Considering Various Driving Alternatives
Rides from family
71.1%
Rides from friends
75.9%
Public transportation
58.4%
Walk
41.6%
Taxi
53.6%
While rides from family and friends are the most favored alternatives to driving when such becomes impossible, public transportation and taxis are considered acceptable. The telephone survey results indicate discrepancies between expectations for some seniors and reality for others. For example, 53.6 percent of those surveyed thought they would use taxicabs if their current means of transportation became unavailable, but only 23.3 percent actually use taxis. Likewise, 58.4 percent thought they would use public transportation if their current transportation mode had to change, but only 18.2 percent actually ride a bus. Slightly more seniors walk (50 percent) than thought they would (41.6 percent), but seniors accurately predicted dependence on others for rides in automobiles, since 76.1 percent currently ride with others and 75.9 percent thought they would ride with friends if they had to change their current transportation. Seniors also seem more aware of other seniors’ driving difficulty than they are of their own, since 28.8 percent worry about the driving of other seniors, but only 17.9 percent worry about their own, even though 54.4 percent believe their transportation needs will be different in ten years. Another discrepancy emerged in the area of financial planning for transportation. Despite the belief that their transportation needs would change in ten years, only 16 percent of seniors surveyed reported setting aside money for their transportation needs. This means many seniors are effectively planning a pattern of dependence, though such dependence was described in the focus groups as very unsatisfactory. An unanticipated result of the telephone survey was the high percentage of driving seniors (75.4 percent) who enjoy driving all or almost all of the time. This is especially surprising since 44.2 percent reported changes in their driving over the last five years (see Table 3). These changes include avoiding driving at night (60.3 percent), in the winter (36.2 percent), at busy times (45.5 percent), on turnpikes and interstate highways (25.9 percent), downtown (35.7 percent), and in unfamiliar locations (36.3 percent). This may mean that seniors are adjusting well to those problems of which they are aware. Since drivers in this age group (mean age is 77.8 years) have a high crash rate6 compared to the population as a whole, this may also indicate that they believe themselves to be safer than they are. Transportation Service This section describes results regarding transportation use for all seniors participating in the study as obtained from the pre-post measures administered to the Service and Control groups, and the characteristics of trips taken on the ITN by those in the Service group, as obtained from trip logs, and other measures of participation in the ITN program, including membership enrollment and use of gift certificates. Of the subjects assigned to the Service group, 25 did not elect to make use of the service during the three-month study period. (This number dropped to 10 after an additional 3 months.) Where differences between the reports of users and non-users appeared during the three-month study period, they are described.

Reports of Transportation Characteristics This section of the results addresses reports of transportation characteristics for all subjects, including when motor vehicle transportation is used, purpose of trips, mode of transportation used, difficulties in obtaining transportation, characteristics of ITN users, their satisfaction with the service and interest in ITN programs. Times of Transportation Use The periods of time when motor vehicle transportation is used by all subjects is shown in Table 6. The entries represent the percent of subjects indicating their use of motor vehicles for transportation during the periods indicated. For simplicity the data for all subjects are combined. However, some differences appeared across groups. Within the Service group, weekday use by those using the system increased from 55 percent to 78 percent while declining from 80 percent to 58 percent within the non-user group, a significant interaction (F=5.91, p=.02). The Control group showed no change. All groups showed a significant increase in Saturday use (F=4.76, p=.03), the increases ranging from 5 percent for the Control and non-user groups to 25 percent for the user groups, although the interaction was not significant (p>.2).
TABLE 6 Percent of All Subjects Using Motor Vehicle Transportation at Various Times
Period
Percent
Daytime
77%
Evening
4%
Weekday
65%
Saturday
19%
Sunday
24%
Purpose of Transportation The number of times per week that subjects used motor vehicle transportation for trips to various destinations is shown in Table 7. TABLE 7 Mean Times per Week that Motor Vehicles
Were Used for Various Purposes
Purpose
Mean times

Visit friends/family
.39
Groceries
.80
Doctor
.54
Personal
.63
Church
.18
Work
.18
Eating out
.33
Many subjects left blank answers for certain purposes, leaving uncertain whether they failed to use motor vehicles for that purpose or simply ignored the item. Therefore, the number may be more meaningful in a relative than an absolute sense. All groups showed pre-post increases in numbers of trips to the doctor via motor vehicles. The overall differences were significant (F=10.19, p=.002) While the largest increases appeared to be among the Controls and non-users, the interaction was not significant (p>.10). The same pattern appeared for personal visits and eating out, the overall increases being significant (respectively, F=11.76, p=.001, and F=9.28, p=.03) but the interactions being non-significant. Modes of Transportation The degree to which subjects used various modes of transportation from one place to another are shown in Table 8. The values range from 5 Very Often to 1 Never.
TABLE 8 Degree to Which Subjects used Various Modes of Transportation
Mode
Degree of Use
Drive one’s self
1.61
Ride with others
3.49
Bus
2.04
Taxi
2.30
Van
1.60
Walk
2.13
Riding with someone else was the most common means of transportation, while driving oneself or using van transportation were the least Those subjects in the service group making use of the ITN tended to use the bus more often than non-users ( (F=4.53, p=.04). Otherwise, there were no significant differences between groups, pre-post differences, or interactions between groups and pre-post changes. Difficulties in Meeting Transportation Needs

All subjects in the study sample were called upon to report difficulties in meeting transportation needs, again on a scale of 1 Never to 5 Very Often. The results appear in Table 9.
No significant pre-post differences appeared within either the Service or Control groups, nor were there any differences between the two groups. Neither were there any differences between users and non-users of ITN, either prior or following introduction of the services, nor were any pre-post differences found within either of the subgroups. For these reasons, the results of all groups were combined.
For the most part, experiences ranged between “rarely” (2) and “occasionally” (3). The only deviant trip purpose involved transportation for work purposes, in which difficulty ranged from “never” to “rarely.” Since this question was answered only by those who made trips for work purposes, the results may mean that those who still work don’t experience difficulty in doing so. Indeed, this group had less difficulty meeting all their transportation needs than did those who were not working.
The failure to find greater ease of travel for the ITN users does not mean that the service was not of benefit to them; their rating of the service, and the fact that their use of it increases means that it facilitated their travel. The lack of differences between users and non-users may be an indication of the extent to which the ITN prevented difficulty among users. While one still would have expected to find pre-post changes among the users, the rating was rather subjective and not highly sensitive to small changes. Had it been possible to collect daily logs of trips, and difficulties in arranging them, such records would have been more sensitive to change than general recollections of difficulty, and it is possible that improvement would have been revealed. Nevertheless, the results suggest that subscribers used ITN less to overcome difficulty getting places than to depend less upon others in doing so.
TABLE 9 Difficulty Meeting Trip Needs
Trip purpose
Mean rating
Shopping
2.45
Personal needs
2.64
Visiting family/friends
2.50
Medical Visits
2.43
Eating out
2.27
Cultural events
2.37
Church
2.28
Work (paid/volunteer)
1.63
User Characteristics With respect to a number of background characteristics in the Service group who made use of the ITN were compared with those not using it. No significant differences emerged with respect to age, annual mileage, possession of a drivers license, vehicle ownership or whether they currently drove. Satisfaction with ITN

While all subjects in the service group were surveyed for their satisfaction with ITN, only the answers supplied by users of the service were analyzed. On a scale of 1 to 5, ratings averaged over 4.9 for safety, courtesy, friendliness, cleanliness, comfort and ease of getting in and out. The remainder exceeded 4.5 with 4.8 for promptness and 4.6 for knowledge of area roads.
Users were also asked to rate the various types of vehicles employed in ITN transportation. The only type of vehicle that all respondents reported riding in was the four-door sedan, which was had a mean rating of 4.8 on a scale of 1 (low) to 5 (high). The eight users who reported riding in station wagons and two door sedans rated them 4.4 and 4.3 respectively. (Some seniors were occasionally driven by volunteers from another research project.)
Interest in ITN programs All subjects were asked about their interest in ways to reduce their cost for ITN service. The arrangements, and percent of subjects indicating interest, are shown in Table 10. About three-fourths supported merchant participation and credit card as ways of funding travel, as well as ITN arranged ridesharing. Self arranged ride sharing and use of gift certificates were less acceptable, both depending on the cooperation of others. Trading the car for ITN miles was not a popular choice, though this did not consider how many of the respondents actually owned cars, and was contrary to the opinions expressed in the focus groups completed earlier in the study.
ITN Trip Characteristics This section reports upon the characteristics of ITN trips, as obtained from the trip logs compiled on individual trips, including purposes of trips, numbers and distances of trips. Trip Purpose The purposes for which clients of the ITN used the service are summarized in Table 11.
TABLE 10 Percent of Subjects Showing Interest in Possible ITN Programs
Possible Program
Percent
Ride sharing, ITN arranged
74%
Ride sharing, self arranged
56%
Gift certificates by others for rides
51%
Bonus miles for car trade
16%
Merchant participation in funding
71%
Frequent user credit card miles
77%
Table 11 Purposes of Trips by ITN Clients Trip Purpose
Trips
Per Cent
Medical
124
28.4%

Visit Ill Friends
36
8.2%
Personal
90
20.6%
Work/Volunteer
13
3.0%
Groceries
41
9.4%
Shopping
59
13.5%
Visit Social Friends
29
6.6%
Dining out
8
1.8%
Dental
11
2.5%
Church
10
2.3%
Recreation
1
.2%
Educational
15
3.4%

No significant shifts appeared in use of the ITN over the three month time period under study and the results for the two periods are consolidated. However, by comparing trip purposes for those who used the ITN with trip purposes of all travel collected in pre-post measures from all seniors in the study (Table 7), some notable differences appear. Seniors indicated in pre-post measures that rides for grocery shopping were the most frequent cause of travel, being taken .8 times per week, while medical visits were taken less often, .54 times per week. But, of those using the ITN, only 9.4 percent of rides were to buy groceries, while medical visits were taken three times as often. Since everyone must eat, this indicates that trips to the supermarket are supplied by others, perhaps family and friends, an arrangement facilitated by the fact that they may be scheduled at any time. On the other hand, rides to the doctor may not be as easily met by other means of transportation since there is little flexibility for scheduling appointments, and many family members who might be prevailed upon to provide rides may be busy at work during doctors’ office hours. Numbers and Distances of Trips Over duration of the study period, those in the ITN group made use of the service for 441 trips. The number of trips increased by 7 percent from the first half of the study period to the second, a significant change (p<.01). Both the numbers of users and their frequency of use increased. In interpreting the results, the lack of comparability between periods should be taken into account, the second half of the period being characterized by cold and snow, which presumably discouraged travel. It seems likely that under more stable weather conditions that the increase in use would have been greater.
The average trip involved a distance of 2.98 miles of travel transporting clients, and 4.95 miles of total travel to and from clients. No significant differences in either form of travel were reported from one time period to another.
Participation Characteristics Aspects of participation in ITN beyond being transported in ITN vehicles, included membership in ITN, the purchase of gift certificates and advanced payment. Membership Immediately following the three month pilot period, seniors from the Control and Service groups were offered an opportunity to become members of the Independent Transportation Network. Forty-two of the 102 households became dues paying members, 21 from each group, Control and Service. This 41 percent membership response indicates both that seniors are willing to join a membership organization dedicated to meeting their transportation needs, and that such an organization contributes to a sense of transportation security. Some of the seniors who paid for membership in the ITN never chose to ride on the system; others rode only occasionally. Some seniors who use the service regularly have still not chosen to pay a membership fee, although they have indicated they would if they were required to do so. Gift Certificates Thirty-five of the 51 participants in the Service group redeemed their Christmas gift certificates. Since there was no expiration date on the certificates, some were used as late as April. This 69 percent return rate is another indication that the gift certificate program is a likely source of revenue for the ITN. Advance Payment

To avoid the necessity of making payments each time service was provided, participants were offered the opportunity to set up an account through advance payments. Of the 25 users of the service, eight elected to set up advance payment accounts, or had accounts set up for them. The willingness to pay in advance carries implications for use of smart cards and other systems for debiting prepaid accounts. CONCLUSIONS From the perspective of service quality and customer satisfaction, this IDEA product demonstrates that it is possible to successfully provide a demand responsive transportation service for seniors that models the comfort and convenience of the private automobile. The significance of this finding lies in its potential to meet the mobility requirements of America's aging population, increasingly stranded in suburban and rural areas by diminished capacity to drive an automobile and inadequate public transit. The research shows that seniors are willing to:
· Join a membership organization dedicated to meeting their transportation needs · Use and pay for a transportation service that helps meet their needs · Share rides with other seniors · Schedule rides in advance to save money · Pay for rides in advance through a transportation account · Participate in several innovative payment plans, including a Frequent Rider Program, an affinity
credit card program for their adult children, and a third party payer program (merchant participation)
The telephone survey also shows that seniors do not accurately anticipate or plan for their own transportation needs and find themselves dependent upon the favors of family and friends, a situation described in the focus groups as unsatisfactory. PLANS FOR IMPLEMENTATION It is important to understand these research results in the context of other, on-going ITN research projects, since the fact that seniors like demand responsive transportation in automobiles and they are willing to pay for it in non-traditional ways is only useful if the service is economically viable. Such viability can be achieved through increased revenue or decreased costs. The various payment plans explored in this study show the way to increase revenue in future practice. Many transit services traditionally choose to decrease costs by seeking efficiency through the use of high occupancy vehicles. The ITN has chosen to use automobiles, so cost savings is achieved through the use of volunteer drivers and volunteer vehicles in exchange for credit in the system. These ideas have been studied in a research project funded by the American Association of Retired Persons (AARP), The Role of Volunteerism in the Independent Transportation Network. A related research project, funded by AARP, the National Highway Traffic Safety Administration(NHTSA), and the Federal Transit Administration(FTA), Alternative Transportation for the Elderly: A Positive Option for Families and Policy Makers, is studies the extent to which seniors can rely on family and friends for transportation and the impact of an alternative transportation service, such as the ITN, on seniors' decisions to relinquish the driving role. The economic viability of the ITN is currently being tested through a deployment grant from the FTA. The ITN is fully incorporated as a non-profit corporation and is applying to become a charitable corporation. Several automobile dealerships in the Portland area have agreed to participate in a car trade program, and Key Bank of Maine has agreed to set up interest bearing ITN Transportation accounts for customers. Electronic funds transfer from these accounts can be accomplished from the ITN office. In this project, both paid drivers in program cars and volunteer drivers in personal cars are providing service to over 300 seniors in the greater Portland area. The ITN currently has 143 dues paying members in seven states, and requests for information about the ITN have come from 37 states and Canada. This broad level of interest has been generated by national press coverage of the ITN, including articles in the New York Times, Good Housekeeping magazine, Traffic Safety (National Safety Council), GEICO

Direct (GEICO Insurance), the Orange County Register, Parade magazine, and numerous articles and editorials in the Portland newspaper, the Portland Press Herald. National television inquiries have come from Eye to Eye, NBC Now, World News Tonight, and Good Morning America. Such national media attention indicates both the level of transportation need, the amazing size of the market, and the potential popularity of a consumer oriented transportation service for seniors. Future research and development is needed in four areas: 1) transportation counseling for diminished capacity older drivers to help them plan for their transportation needs and make the transition form the driver's seat to the passenger seat; 2) revenue generating power of rideshare and innovative payment plans for seniors using the ITN; 3) application of ITS technology to the ITN, especially smart cards; and 4) rural transit in low density areas through the development of small satellite ITN's piggybacked on central ITN dispatch and administration. REFERENCES 1. Licensing the Older Driver: A Summary of State Practices and Procedures. Report DOT HS 807443,
NHTSA, U.S. Department of Transportation, April 1989, p.1. 2. S. Rosenbloom. Developing a Comprehensive Service Strategy to Meet a Range of Suburban Travel
Needs. Report DOT-T-91-06. U.S. Department of Transportation, 1990, p. 4. 3. S. Rosenbloom. Developing a Comprehensive Service Strategy to Meet a Range of Suburban Travel
Needs. Report DOT-T-91-06. U.S. Department of Transportation, 1990, p. 6. 4. A. James McKnight. “Driver and Pedestrian Training,” Transportation in an Aging Society:
Improving Mobility and Safety for Older Persons. Transportation Research Board, National Research Council, Special Report 218, Vol 2, p. 101.
5. F. Carp. “Significance of Mobility for the Well-Being of the Elderly,” Transportation in an Aging Society: Improving Mobility and Safety for Older Persons. Transportation Research Board, National Research Council, Special Report 218, Vol 2, p. 8.
6. E.C. Cerrelli. Crash Data and Rates for Age-Sex Groups of Drivers, 1990. Research Note, NHTSA, U.S. Department of Transportation, May 1992.