Embed Size (px)
Citation preview
CENTER FOR GEOTECHNICAL MODELING REPORT NO. UCD/CGM-03/01
PILE FOUNDATIONS IN LIQUEFIED AND LATERALLY SPREADING GROUND DURING EARTHQUAKES: CENTRIFUGE EXPERIMENTS & ANALYSES
BY R. W. BOULANGER B. L. KUTTER S. J. BRANDENBERG P. SINGH D. CHANG
Research supported by the California Department of Transportation under contract 59A0162. The contents of this report reflect the views of the authors who are responsible for the facts and the accuracy of the data presented herein. The contents do not necessarily reflect the official views or policies of the State of California or the Federal Highway Administration. This report does not constitute a standard, specification, or regulation.
DEPARTMENT OF CIVIL & ENVIRONMENTAL ENGINEERING COLLEGE OF ENGINEERING UNIVERSITY OF CALIFORNIA AT DAVIS SEPTEMBER 2003

STATE OF CALIFORNIA DEPARTMENT OF TRANSPORTATION TECHNICAL REPORT DOCUMENTATION PAGE TR0003 (REV. 10/98) 1. REPORT NUMBER
2. GOVERNMENT ASSOCIATION NUMBER
3. RECIPIENT’S CATALOG NUMBER
UCD/CGM-03/01 5. REPORT DATE
September 2003
4. TITLE AND SUBTITLE
Pile foundations in liquefied and laterally spreading ground during earthquakes: Centrifuge experiments and analyses 6. PERFORMING ORGANIZATION CODE
7. AUTHOR(S)
Ross W. Boulanger, Bruce L. Kutter, Scott J. Brandenberg, Priyanshu Singh, and Dongdong Chang
8. PERFORMING ORGANIZATION REPORT NO.
10. WORK UNIT NUMBER
9. PERFORMING ORGANIZATION NAME AND ADDRESS
University of California Department of Civil & Environmental Engineering Davis, California 95616
11. CONTRACT OR GRANT NUMBER
59A0162 13. TYPE OF REPORT AND PERIOD COVERED
Final report
12. SPONSORING AGENCY AND ADDRESS
California Department of Transportation Sacramento, CA 95819
14. SPONSORING AGENCY CODE
15. SUPPLEMENTAL NOTES
16. ABSTRACT
This research project addressed key needs for advancing the design of pile foundations in soil profiles that are susceptible to liquefaction and lateral spreading during earthquakes.
A series of large-scale dynamic centrifuge model tests were performed to study the behavior of single piles and pile groups in a soil profile comprised of a nonliquefied crust spreading laterally over a loose saturated sand layer. Detailed instrumentation and new interpretation and data processing procedures enabled fundamental measurements of soil-pile interaction behavior in the centrifuge tests. The measurements include the first available time histories of loads from nonliquefied surface soils and underlying liquefied soils during lateral spreading under realistic earthquake shaking motions. The identified behaviors that are important to design practice include: (1) peak lateral down-slope loads from the surface crust may be in-phase or out-of-phase with lateral loads from the deeper liquefied layers; (2) the peak lateral loads imposed on the pile caps by the laterally spreading ground included significant interface friction loads from along the sides and base of the pile cap; and (3) the lateral load versus relative displacement response of pile caps embedded in laterally spreading ground was much softer than predicted by relations derived for static loading conditions.
Monotonic pushover analyses based on limit pressures or on nonlinear p-y analyses with monotonic kinematic loading were evaluated against the centrifuge data. Guidelines for estimating the lateral spreading loads from both nonliquefied and liquefied layers were subsequently provided. Pushover design analyses using these guidelines and common relations for other input parameters produced predictions of peak pile bending moments and pile cap displacements that ranged from reasonable to conservative.
Nonlinear dynamic time-history analyses were also performed using dynamic p-y, t-z, and q-z materials that were developed and implemented in connection with this project. Example problems and initial comparisons to centrifuge test data of pile-supported structures in liquefying sand profiles demonstrate that these modeling methods can reasonably approximate the essential features of soil and structural response.
Downdrag loads on vertical piles in liquefied soil profiles were evaluated using an adapted version of the neutral plane concept, and a simple design guideline was subsequently recommended.
17. KEY WORDS
Piles, liquefaction, lateral spreading, earthquakes, centrifuge modeling, dynamic response.
18. DISTRIBUTION STATEMENT No restrictions. This document is available to the public through the National Technical Information Service, Springfield, VA 22161
19. SECURITY CLASSIFICATION (of this report)
Unclassified
20. NUMBER OF PAGES
205 pp.
21. PRICE
n.a. Reproduction of completed page authorized
1
PILE FOUNDATIONS IN LIQUEFIED AND LATERALLY SPREADING GROUND DURING EARTHQUAKES:
CENTRIFUGE EXPERIMENTS & ANALYSES
by
Ross W. Boulanger Bruce L. Kutter
Scott J. Brandenberg Priyanshu Singh Dongdong Chang
Report No. UCD/CGM-03/01
Center for Geotechnical Modeling Department of Civil & Environmental Engineering
University of California Davis, California
2003

i
EXECUTIVE SUMMARY This research project addressed key needs for advancing, both in the short term and long
term, our abilities to reliably design pile foundations in soil profiles that are susceptible to liquefaction and lateral spreading. This project was motivated by the large costs associated with the construction of new pile foundations and the remediation of existing foundations in areas where liquefaction and lateral spreading are a concern. The major components and accomplishments of this research project were as follows.
A series of large-scale dynamic centrifuge model tests were performed to study the behavior of single piles and pile groups in a soil profile comprised of a nonliquefied crust spreading laterally over a loose saturated sand layer. These experiments provided the first available data on soil-pile interaction during lateral spreading under realistic time histories of very intense, earthquake shaking. The experimental data were archived and are publicly available for use by other future researchers through five detailed centrifuge data reports published through the Center for Geotechnical Modeling (CGM).
Detailed instrumentation and new interpretation and data processing procedures enabled fundamental measurements of soil-pile interaction behavior in the centrifuge tests. The measurements include the first available time histories of loads from nonliquefied surface soils and underlying liquefied soils during lateral spreading under realistic earthquake shaking motions. These loads have large cyclic components and may act in an up- or down-slope direction during intense shaking, and furthermore the peak down-slope loads at the surface (crust) may be in-phase or out-of-phase with loads from the deeper liquefied layers. Despite the complexity, monotonic pushover calculations based on limit pressures or on nonlinear p-y analyses with monotonic kinematic loading were found to provide a useful procedure for design of piles in lateral spreading ground provided that an adequate range of variability and various combinations of parameters are considered.
Predicting the peak lateral loads imposed on the pile caps by the laterally spreading ground required including interface friction along the sides and base of the pile cap. The lateral load versus relative displacement response of pile caps embedded in laterally spreading ground was shown to be much softer than predicted by relations derived for static loading conditions. Guidelines for estimating the lateral spreading loads from both nonliquefied and liquefied layers are provided. Pushover design analyses using these guidelines and common relations for other input parameters produced predictions of peak pile bending moments and pile cap displacements that ranged from reasonable to conservative.
Nonlinear dynamic time-history analyses were performed using the PEER Center’s public domain, general purpose, finite element platform OpenSees, after dynamic p-y, t-z, and q-z materials were developed and implemented in connection with this project. Example problems and initial comparisons to centrifuge test data of pile-supported structures in liquefying sand profiles demonstrate that these modeling methods can reasonably approximate the essential features of soil and structural response. These FEM tools provide new abilities for (1) further research using dynamic analyses to refine guidelines for simplified pushover design methods and (2) use on specific projects where the insight of a dynamic analysis may affect design decisions.
Downdrag loads on vertical piles in liquefied soil profiles were evaluated using an adapted version of the neutral plane concept. The analysis results are summarized in a simple design guideline, wherein the down-drag from the liquefied layer itself can be reasonably neglected.

ii
ACKNOWLEDGEMENTS Caltrans supported this research project under contract 59A0162. The shaker on the large
centrifuge was designed and constructed with support from the NSF, Obayashi Corporation, Caltrans, and the University of California. The Pacific Earthquake Engineering Research (PEER) Center, through the Earthquake Engineering Research Centers Program of the National Science Foundation, supported development of the nonlinear FEM models and associated analyses under contract 2312001. However, the contents of this report do not necessarily represent a policy of these agencies or endorsement by the State or Federal government.
The authors would like to acknowledge the important contributions of Abbas Abghari, Angel
Perez, and Dan Wilson during various phases of this research. In addition, Chad Justice, Tom Coker, and Tom Kohnke at the Center for Geotechnical Modeling provided assistance with all testing, and Karthik Subramanian and Hideo Nakajima assisted with the first two centrifuge tests.
iii
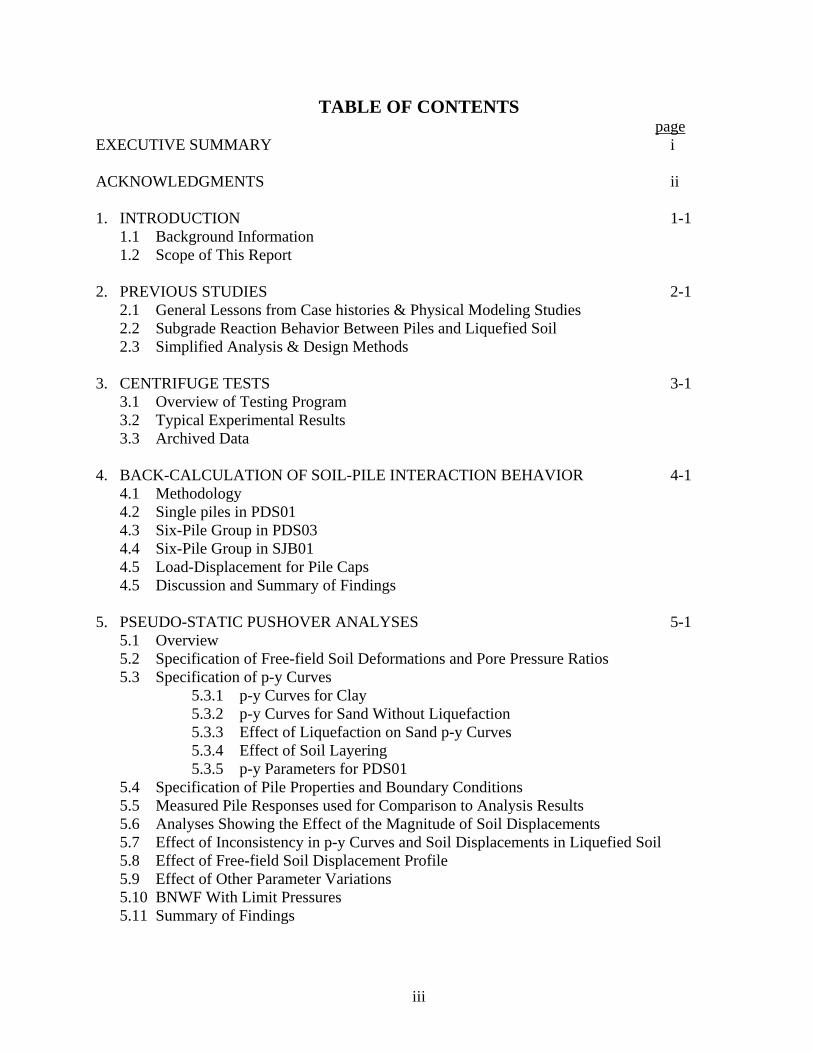
TABLE OF CONTENTS page
EXECUTIVE SUMMARY i ACKNOWLEDGMENTS ii 1. INTRODUCTION 1-1 1.1 Background Information 1.2 Scope of This Report 2. PREVIOUS STUDIES 2-1 2.1 General Lessons from Case histories & Physical Modeling Studies 2.2 Subgrade Reaction Behavior Between Piles and Liquefied Soil 2.3 Simplified Analysis & Design Methods 3. CENTRIFUGE TESTS 3-1 3.1 Overview of Testing Program 3.2 Typical Experimental Results 3.3 Archived Data 4. BACK-CALCULATION OF SOIL-PILE INTERACTION BEHAVIOR 4-1
4.1 Methodology 4.2 Single piles in PDS01 4.3 Six-Pile Group in PDS03 4.4 Six-Pile Group in SJB01 4.5 Load-Displacement for Pile Caps 4.5 Discussion and Summary of Findings
5. PSEUDO-STATIC PUSHOVER ANALYSES 5-1 5.1 Overview 5.2 Specification of Free-field Soil Deformations and Pore Pressure Ratios 5.3 Specification of p-y Curves
5.3.1 p-y Curves for Clay 5.3.2 p-y Curves for Sand Without Liquefaction 5.3.3 Effect of Liquefaction on Sand p-y Curves 5.3.4 Effect of Soil Layering 5.3.5 p-y Parameters for PDS01
5.4 Specification of Pile Properties and Boundary Conditions 5.5 Measured Pile Responses used for Comparison to Analysis Results 5.6 Analyses Showing the Effect of the Magnitude of Soil Displacements 5.7 Effect of Inconsistency in p-y Curves and Soil Displacements in Liquefied Soil 5.8 Effect of Free-field Soil Displacement Profile 5.9 Effect of Other Parameter Variations
5.10 BNWF With Limit Pressures 5.11 Summary of Findings

iv
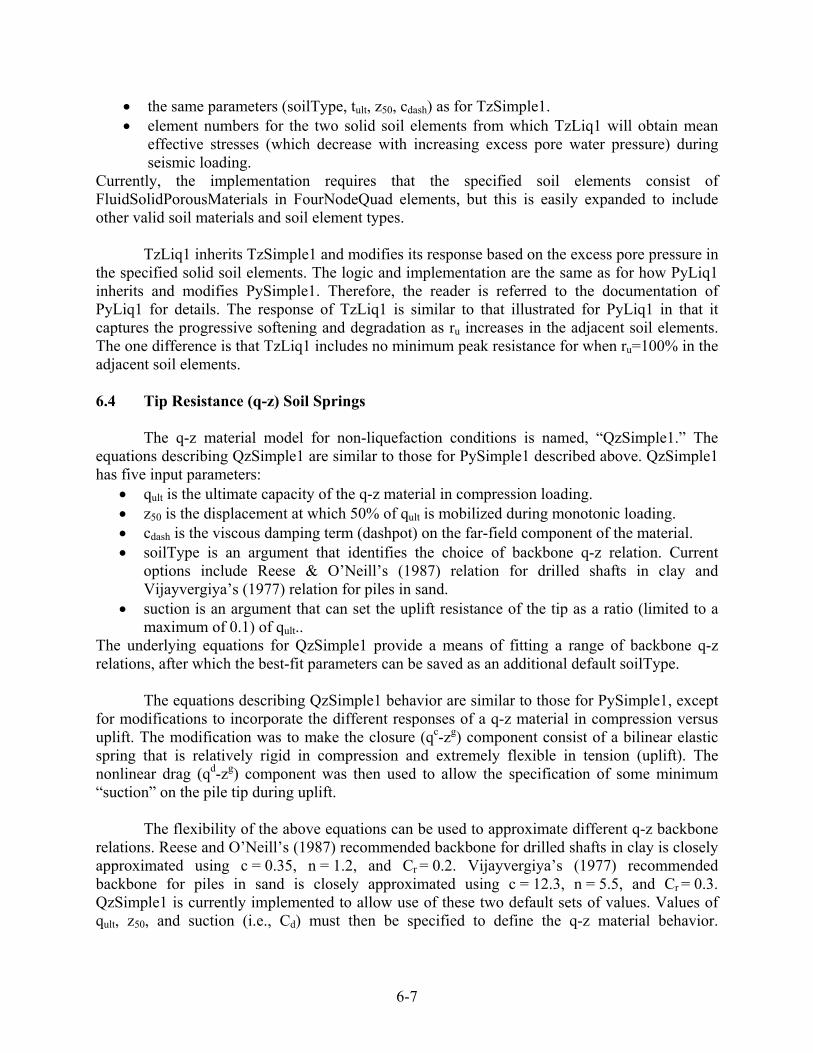
6. NONLINEAR TIME HISTORY ANALYSES 6-1 6.1 Overview 6.2 Lateral (p-y) Soil Springs 6.2.1 p-y Material Model for Non-Liquefaction 6.2.2 p-y Material Model with Liquefaction
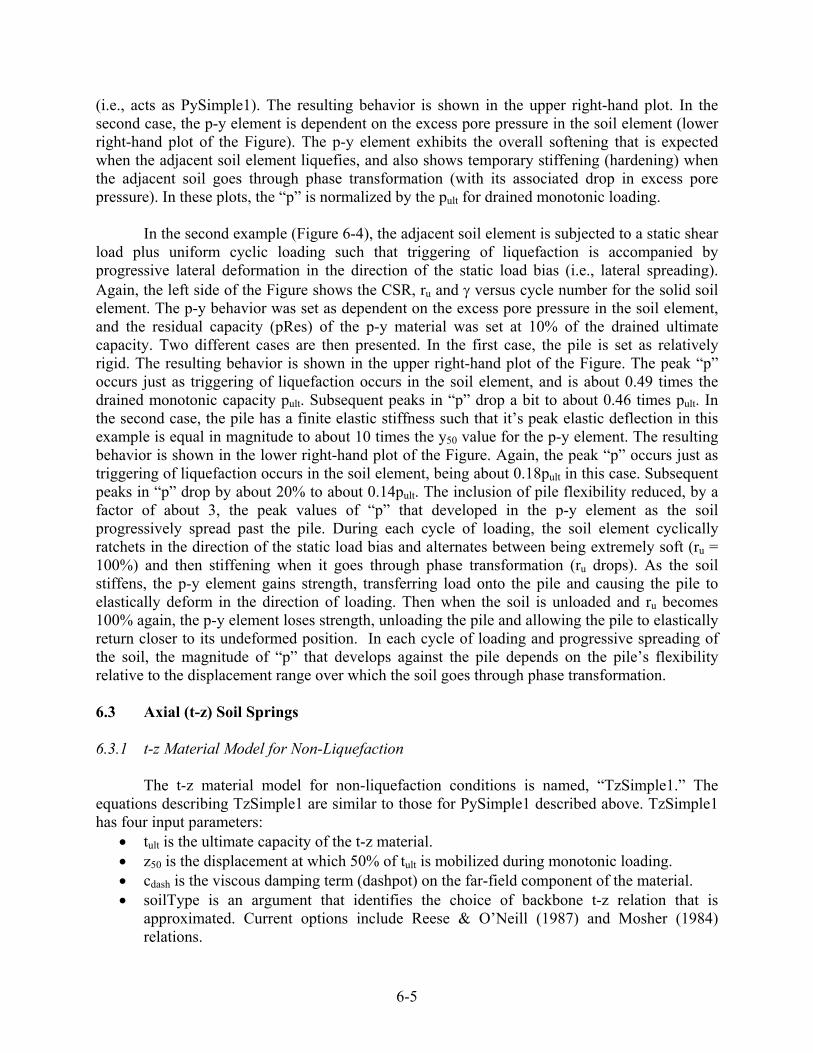
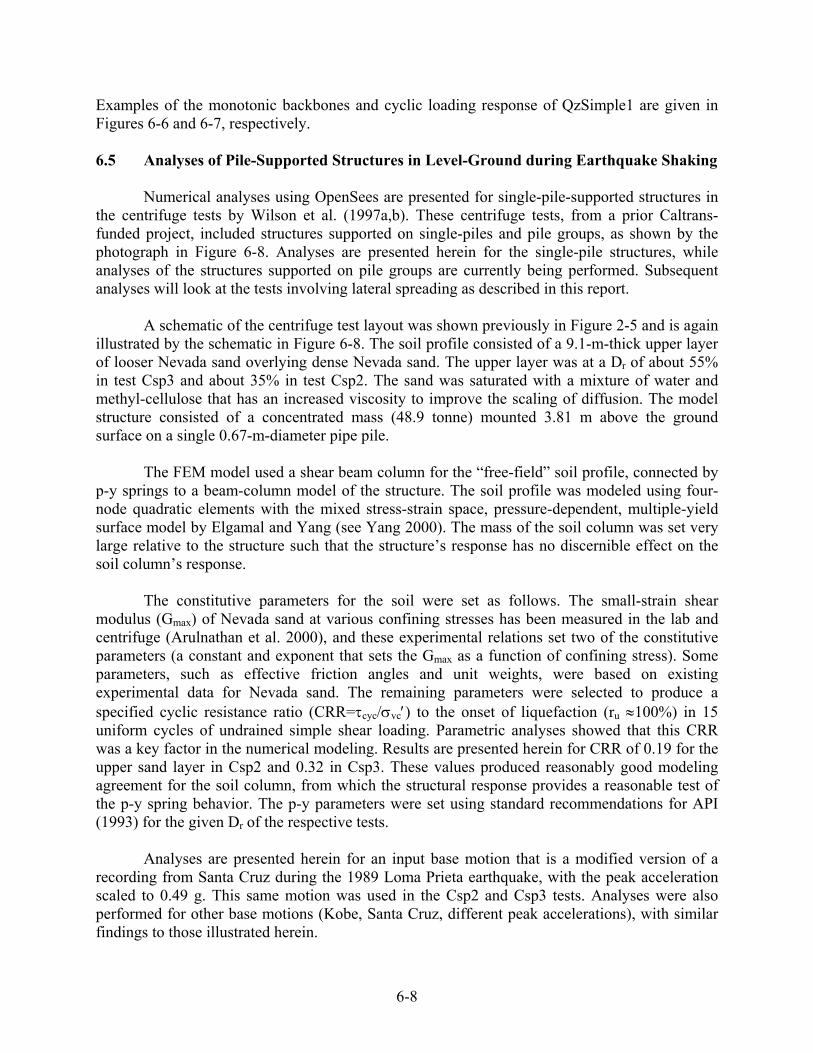
6.3 Axial (t-z) Soil Springs 6.3.1 t-z Material Model for Non-Liquefaction 6.3.2 t-z Material Model for Liquefaction 6.4 Tip Resistance (q-z) Soil Springs 6.5 Analyses of Pile-Supported Structures in Level-Ground during Earthquake Shaking 6.6 Summary and Future Directions 7. NEUTRAL PLANE SOLUTION FOR LIQUEFACTION-INDUCED DOWN-DRAG ON VERTICAL PILES 7-1 7.1 Introduction 7.2 Neutral Plane Solution for Liquefaction 7.3 Discussion
7.4 Conclusion 8. SUMMARY AND RECOMMENDATIONS 8-1 8.1 Archived Experimental Database 8.2 Back-Calculated Soil-Pile Interaction in Liquefied & Laterally Spreading Ground 8.3 Accounting for Liquefaction Effects in Pseudo-Static Pushover Analyses 8.4 Nonlinear Time History Analyses 8.5 Neutral Plane Solution for Liquefaction-Induced Down-drag on Vertical Piles REFERENCES R-1
1-1
1. INTRODUCTION 1.1 Background Information
Extensive damage to pile-supported bridges and other structures in areas of liquefaction and lateral spreading has been observed in many earthquakes around the world. Many important lessons and insights have been learned from case histories, physical model tests, and numerical studies in recent years, but numerous questions still remain regarding the basic mechanisms of soil-pile interaction in liquefied soil and their effects on superstructure performance. Understanding these mechanisms and evaluating the capabilities of emerging analysis methods against physical data (case histories and model studies) are essential steps toward developing safe, economical design methods.
Different mechanisms of damage to pile foundations are illustrated in Figure 1-1 for cases with and without lateral spreading. Both inertial and kinematic loading must be considered, with the appropriate load combination varying as liquefaction develops during shaking. Kinematic loading will vary with the magnitude of ground deformations and the strength/stiffness of the soil during a given loading cycle. Peak ground deformations can occur either during or toward the end of shaking, depending on the magnitude of transient ground movements (lurching) during the lateral spreading process. Considerable judgment is involved in estimating the appropriate combination of kinematic and inertial loads, and the governing case may be different for the substructure and superstructure.
Monotonic “pushover” design procedures for pile foundations in laterally spreading ground
are intended to envelope the cyclic loading response that may occur during earthquake shaking. Pushover design procedures include two alternative versions of the pseudo-static beam on nonlinear Winkler foundation (BNWF) method, as depicted in Figure 1-2. The first BNWF alternative requires the free-field soil movements (ysoil) as an input, with the resulting lateral soil reactions (p) being dependent on the relative displacement (y) between the free-field soil (ysoil) and the pile (ypile). The second BNWF alternative applies limit pressures over the depth of the laterally-spreading soil (with the p-y springs removed in this interval), and then uses p-y springs to model the response in the underlying competent soil. In this second alternative, the applied lateral pressures are independent of the free-field soil displacements since the soil movements are assumed to be large enough to cause the lateral pressures to reach their limiting values. For bridge abutments, a simple iterative coupling of the lateral spreading and pile response analyses has sometimes been used by designers at Caltrans and elsewhere (e.g., Martin et al. 2002) to take advantage of the fact that the pile foundation will act to reduce the lateral spreading deformations of the abutment, which reduces the loads on the pile foundation itself. Applying any of these approaches to liquefaction problems is complicated by our lack of knowledge of how liquefaction affects the “p-y” behavior of the liquefied soil or overlying crust and the uncertainty in modeling the free-field response of liquefied deposits. The predictive capabilities and inherent limitations of these simplified analysis method are not yet fully understood, and the resulting uncertainty affects the cost of building new foundations and remediating hazards at existing foundations.
1-2
Direct observations of “p-y” (subgrade reaction) behavior in liquefying soil were first provided by Wilson et al. (1998, 2000) by applying back-calculation procedures to the results of dynamic centrifuge model tests of pile-supported structures in level ground models of loose to medium-dense sands. Tokimatsu et al. (2001) applied similar procedures to the results of large-scale 1g shake table tests for piles embedded in a level ground soil profile. Ashford and Rollins (personal communications) back-calculated p-y behavior for full-scale piles at Treasure Island that were laterally loaded after the site, also level, was liquefied by blasting. Other physical modeling studies have provided valuable information on the lateral loads imposed on pile foundations by laterally spreading ground without necessarily presenting the results in terms of p or y time histories (e.g., Dobry and Abdoun 2001). The wide range of subgrade reaction behaviors that have been observed in these different studies reflect the complexity of the phenomena and illustrate the importance of several key factors, as discussed later in this report. In addition, the effect of lateral spreading on the subgrade reaction behavior in nonliquefied crusts and liquefied layers has not been evaluated in previous studies.
Dynamic FEM analyses have the potential to better represent certain aspects of pile
foundation behavior during earthquake loading and liquefaction-induced deformations. FEM analyses can explicitly couple abutment deformation and pile foundation behavior, including the effects of progressive liquefaction on seismic response, ground deformations, and foundation stiffness. However, confidence in the use of nonlinear FEM analyses to develop design guidelines requires the calibration or evaluation of the numerical method against physical data from either case histories or physical model tests.
1.2 Scope of This Report The study described herein focused on addressing several key issues related to the performance of pile foundations (single piles and groups) embedded in laterally spreading ground during earthquake shaking. This study was proposed as a three-year project, but was instead initiated as a two-year project. A one-year follow-up project is currently in progress. This final report covers the findings of the two-year project, while the cumulative findings of these two projects will be summarized in the final report for the in-progress project. This report is structured in sections as follows.
• Review of previous studies, including: (1) general lessons from case histories and physical
modeling studies, (2) fundamental aspects of subgrade reaction behavior between piles and liquefied soil, and (3) simplified analysis and design methods.
• Description of the dynamic centrifuge model tests that were performed to provide physical data on the behavior of pile foundations in laterally spreading ground. The soil profiles consisted of a surface layer of nonliquefiable clay overlaying a layer of loose sand, which in turn was overlying a layer of dense sand. Single piles and pile groups were tested. The experimental data were archived and are publicly available for use by other future researchers through five centrifuge data reports published through the Center for Geotechnical Modeling (CGM) at UC Davis. These data reports are an important component of this final report.

1-3
• Back-calculation of soil-pile interaction behavior from the centrifuge experiments. The back-
calculated soil-pile interaction behavior provides the desired understanding of the factors that most affect the load transfer between laterally spreading ground and pile foundations.
• Evaluation of pseudo-static pushover design methods against the centrifuge test data, including parametric studies to evaluate sensitivity of results to the major variables. The results of these analyses provide guidance on the accuracy/limitations of pushover design methods.
• Initial evaluation of nonlinear time-history finite element analyses for modeling dynamic soil profile and soil-pile-structure interaction in liquefying ground. Dynamic p-y, t-z, and q-z springs were developed and implemented in the FE platform OpenSees for these analyses. Initial comparisons were made against the centrifuge test data from Wilson (1998) to facilitate the simultaneously progress of these analyses while the centrifuge testing program of this study was being performed.
• An evaluation of down-drag loads on vertical piles using an adapted version of the neutral plane concept. This analysis method was developed to address issues related to down-drag loads, including the expected contribution to down-drag from the post-liquefaction consolidation of a liquefied layer. While no centrifuge tests were performed to directly address this issue, the neutral plane analyses provide insight into the mechanisms of down-drag for these conditions.
• Summary of findings and recommendations.

1-4
Loss of pile capacity
Failure due to shear
Loss of pile capacity & lateral spreading
Failure due to overturning moment
Settlement of adjacent ground
Failure due to lateral spreading
Failure due to transient ground deformation
Failure due to lateral spreading
Figure 1-1: Schematics of pile damage mechanisms in liquefied ground
(modified from Tokimatsu et al. 1996).
crust
liquef.soil
firmsoil
free-fieldsoil column
Imposed soildisplacements
Imposed pressuresfrom spreading soil
spreading layers
Ground surface displacement
Max
. Ben
ding
Mom
ent
[or
othe
r res
pons
e m
easu
re] Imposed pressures from
spreading ground
Imposed free-field soil displacements
Assumes non-yielding piles.
Figure 1-2: Schematic comparison of two methods for imposing kinematic loads from laterally spreading ground.

2-1
2. PREVIOUS STUDIES 2.1 General Lessons From Case Histories & Physical Modeling Studies An overview of lessons from case histories and physical model tests of pile foundations in liquefied and laterally spreading ground during earthquake shaking is presented herein. In addition, a total of 19 case histories and 19 model tests from the literature are summarized in Tables 2-1 and 2-2, respectively. These tables provide a concise summary of the conditions involved (e.g., pile type, soil type, shaking), from which the reader can identify papers of particular interest for closer review.
Subgrade reaction (p-y) behavior between piles and liquefied soil is discussed in greater detail in Section 2.2, including the observations derived by back-calculation methods. Lastly, a review of simplified design methodologies is given in Section 2.3.
Damage to piles during earthquakes (e.g., Figure 2-1, 2-2, 2-3) has been greatest in areas of liquefaction and particularly lateral spreading (e.g. Karube et al. 1996, Hamada et al. 1996, Matsui et al. 1996, 1997, Tokimatsu et al. 1996, 1997, Tokimatsu and Asaka 1998, Sasaki et al. 1997, Oh-Oka et al., 1997, 1998). In contrast, reports of damage are relatively rare for pile foundations designed according to modern standards and embedded in competent soils that experience negligible permanent deformations during earthquakes.
Several different mechanisms of pile foundation damage, as excessive deformations or structural damage, have been observed in liquefied ground, as illustrated in Figure 1-1 (after Tokimatsu et al. 1996). The occurrence of liquefaction often causes large transient and permanent ground deformations (laterally or vertically) that impose kinematic loads on the pile foundation. The liquefaction also causes a reduction in pile capacity to resist vertical or lateral loads (i.e., loss of shaft friction, tip bearing capacity, or lateral subgrade reaction) that can lead to excessive deformations under the inertial and static loads from the superstructure.
The importance of kinematic loading has been most strongly demonstrated in areas of lateral spreading with relatively strong nonliquefied surface layers. For example, a common case in Kobe was for piles to extend from a nonliquefiable crustal layer, down through a liquefied layer and into more competent bearing layers. The lateral spreading of the crustal layer subsequently caused damage to many piles at both the top and bottoms of the liquefied layers, as identified through various inspection methods (e.g., Tokimatsu 1996, Tokimatsu and Osaka 1998, Oh-Oka et al. 1997; discussed later). Several cases showed that damage usually was found at the top and bottom of liquefied layer (e.g. Matsui et al. 1997, Fuji et al. 1998, Tokimatsu et al. 1997, Tokimatsu and Osaka 1998, Oh-Oka et al. 1997, 1998, Ramos et al. 1999).

2-2
Table 2-1. Summary of Case Histories No. (1)
Site & location (2)
Pile foundation (3)
Earthquake event (4)
Peak accel.a (5)
Damage (6)
Reference (7)
1 10-story Hotel east of State Highway 101, SF, U.S.A.
Prestressed concrete piles, 0.36-m (14-in) square.
1989 Loma Prieta, ML =7.0
0.29g - 0.33 g
Piles performed well. No significant damage except one corner pile, on which cracks on the pile head show possibility of a plastic hinge.
Adib et al. (1995).
2 Higashinada Gas Turbine Thermal Power Station, Kobe, Japan.
Prestressed concrete piles, 0.4-m diameter.
1995 Kobe, ML = 6.9
Not provided a
Cracks (horizontal and longitudinal) occurred to all piles: some damaged only at the pile heads while others also damaged at depth.
Akiyama et al. (1997).
3 Landing Road bridge, New Zealand
Group of 8 raked piles per bridge pier. 0.4-m square reinforced concrete piles.
1987 Edgecumbe, ML = 6.3
<0.33 g None at piers C & D. Minor cracking at pile heads at one pier.
Berrill et al. (1997, 2001), Yasuda & Berrill (2000).
4 Buildings on Port Island, Japan
Building C: 0.50-m diameter high strength PS Building D: 0.45-m diameter PS
1995 Kobe, ML = 6.9
0.36 g Building C: No damage Building D: Severe damage near pile head, and at liquefiable/non-liquefiable interface
Fujii et al. (1998).
5 Building near the Higashi Kobe bridge station in reclaimed island, Japan.
Prestressed concrete pile, corner piles 0.35-m in diameter, other piles 0.45-m in diameter.
1995 Kobe, ML = 6.9
Not provided a
Piles bent at 9-m below ground surface. Failures at about 1-m below the reclaimed fill, many cracks between 3-6m below ground surface, no damage below the failures depth. No clear damage to building.
Fujii et al. (1998).
6 Building along Osaka Bay area, Kobe, Japan.
No much description of piles, mainly concern structures.
1995 Kobe, ML = 6.9
No damage to building on friction piles. Hamada et al. (1996).
7 Railway structures between Osaka and Kobe, Japan.
Cast-in-place piles. 1995 Kobe, ML = 6.9
Varies along routes.
Some piles almost cracked although no serious damage to superstructure. A railway bridge on 5 cast-in-place piles completely collapsed for a length of 3.5-m. Cracks frequently occur at the pile head for bridges on one-pier.
Karube et al. (1996).
8 Building in Niigata, Japan
Reinforced concrete piles, 0.3-m diameter.
1964 Niigata, ML = 7.5
Not provided a
Cracking on piles throughout liquefied layer, and into underlying dense layer. Some shear discontinuities about 3.5-m below water table.
Matsui et al. (1993).

2-3
No. (1)
Site & location (2)
Pile foundation (3)
Earthquake event (4)
Peak accel.a (5)
Damage (6)
Reference (7)
9 Elevated highways and bridges in Kobe, Ashiya, Nishinomiya area, Japan.
Various: Cast-in-place reinforced concrete piles of more than 1-m diameter; precast concrete piles; steel pipe piles of 0.7-m diameter and >1-m diameter.
1995 Kobe, ML = 6.9
Varies along routes.
Cast-in-place reinforced concrete piles: cracks near pile heads, some cracks at where reinforcement details changed, and some cracks near interface of liquefied and nonliquefied soil. Steel pipe piles: large diameter (>1 m) not damaged even in lateral spreading, smaller diameter (70 cm) indented at the bottom of the liquefied sand. Precast concrete piles: cracking at pile heads and at depth. The degree of pile damage did not necessary correspond to that of the super- and sub-structures, but instead corresponded to the subsurface conditions and occurrence of lateral spreading.
Matsui et al. (1996).
10 Hanshin Expressway, Japan
1.0-m diameter RC at piltz-type bridge.
1995 Kobe, ML = 6.9
Not provided a
Heavy damage including collapse of elevated highways and inclining of bridge piers.
Matsui et al. (1997).
11 Piers at Sumiyoshihama-cho, Higashinada-ku, and Kobe, Japan.
Vertical steel pipe piles, 0.56-m diameter. Battered steel pipe piles, 0.61-m and 0.71-m diameter.
1995 Kobe, ML = 6.9
0.33g Piles yielded near the sea bottom. Pier collapse was largely due to the deformation of the adjacent sea wall.
Nishizawa et al. (1998).
12 Building on Port Island, Kobe, Japan.
Pretensioned high-strength concrete piles, 0.45-m diameter, embedded 0.1-m into pile caps.
1995 Kobe, ML = 6.9
Not provided a
Cracking on the pile caps, but no damage to the pile heads, no lateral gap between pile caps and pile heads. Little damage to superstructure.
Oh-Oka et al. (1997).
13 Wharf on Port Island, Japan
Pipe pile with closed ends, 0.5-m and 0.6-m diameters.
1995 Kobe, ML = 6.9
Not provided a
Hairline cracks on the bottom surfaces of the pile caps. No lateral gaps at the pile cap connections. No notable damage to piles.
Oh-Oka et al. (1998).
14 Higashinada sewage treatment plant at a reclaimed area, Kobe, Japan.
Prestressed concrete piles: diameters 0.35, 0.4, 0.5,0.6-m. Cast-in-place RC piles: diameters 1, 1.2, 1.5-m.
1995 Kobe, ML = 6.9
Not provided a
Cracks 2 or 3-m below the pile head and at the bottom of liquefiable layers, with upper cracks larger than the lower ones. Some piles severed in areas of largest ground deformation.
Sasaki et al. (1997).

2-4
No. (1)
Site & location (2)
Pile foundation (3)
Earthquake event (4)
Peak accel.a (5)
Damage (6)
Reference (7)
15 Buildings and other structures on Port and Rokko islands, Japan.
Various: Individual piers on group of 8 (4 by 2) raked piles. Prestressed RC piles, 0.406 m square. Piles battered at 1:6 (H:V). Pile heads at ∼1.5 m below ground surface.
1995 Kobe, ML = 6.9
0.3-0.8 g. Damage most common at pile heads. For concrete piles well embedded in the pile caps, shear or flexural cracks near the pile heads. For steel pipe piles fixed tightly in caps, failure occurred either at the connection or in the pile cap. For piles connected loosely in caps, the pile heads rotated or even detached from the caps. Many buildings on piles tilted and settled without damage to the superstructures.
Tokimatsu et al. (1996).
16 Building on reclaimed land in Higashinada-ku, Kobe, Japan.
Prestressed concrete piles, 0.4-m in diameter, embedded 0.1-m into pile caps.
1995 Kobe, ML = 6.9
Not provided a
Large horizontal /diagonal cracks on seaside piles at three depths: near the pile head, in the middle of the liquefied layer, and at the bottom of the liquefied layer. For piles on the mountainside of the building, cracks only near the pile heads and at the bottom of the liquefied layer.
Tokimatsu et al. (1997).
17 Building on reclaimed land in Higashinada-ku, Kobe, Japan.
Prestressed concrete piles, 0.5-m in diameter, embedded 0.05-m into pile caps.
1995 Kobe, ML = 6.9
Not provided a
On the seaside: pile heads detached from caps, concrete spalled from the pile heads, piles completely cut off at a depth of 3.4-4.2 m, longitudinal reinforcement failure, extensive horizontal and/or diagonal cracks. On the mountainside: large horizontal cracks 0.2-m below the pile caps with many cracks at larger depths. Large horizontal cracks on all piles at depths of 8.5 m to 10.5 m. Cracks concentrated slightly below the interface between the fill and the natural deposit.
Tokimatsu et al. (1997).
2-5
No. (1)
Site & location (2)
Pile foundation (3)
Earthquake event (4)
Peak accel.a (5)
Damage (6)
Reference (7)
18 Buildings on reclaimed land areas including Port and Rokko islands, Fukaehama, and Mikagehama, Japan.
Various: Prestressed concrete piles, prestressed high-strength concrete piles, steel pipe piles, and steel pipe reinforced concrete piles. Diameters of 0.35 to 0.6 m, typically. Cast-in-place reinforced concrete piles, >1 m diameter.
1995 Kobe, ML = 6.9
Not provided a
Pile failures concentrated at the interface between liquefied and non-liquefied layer and near the pile heads. In the liquefied level ground, severe damage to most reinforced concrete piles while less damage to steel or steel-shelled piles. In the waterfront with liquefaction-induced lateral spreading, damage to all types of piles and to pile caps and foundation beams.
Tokimatsu and Asaka (1998).
19 NHK and NFCH buildings, Niigata, Japan
Reinforced concrete, 0.35-m diameter.
1964 Niigata, ML = 7.5
Not provided a
Severe concrete rupture at interfaces between liquefied and nonliquefied soils.
Meyersohn et al. (1992)
a As reported in the reference(s).

2-6
Table 2-2. Summary of Physical Modeling Studies (prototype units for centrifuge tests) No. (1)
Structure type (2)
Soil profile (3)
Base shaking (4)
Modeling technique (6)
Reference (7)
1 Single pipe pile, 0.475-m diameter.
2o slope. 2-m of nonliquefiable cemented sand, over 6-m of liquefiable sand (Dr=40%), over 2-m of the same nonliquefiable cemented sand. Water table at ground surface.
Sinusoidal f=2Hz, 40 cycles, amax of 0.28 g.
Centrifuge, 3-m radius, 50g.
Abdoun et al. (1996)
2(a) 0.7-m diameter, 4-pile group connected with a rigid pile cap.
Level ground. 11.3-m of liquefiable Toyoura sand, Dr=75% over 9.4-m nonliquefiable dense Toyoura sand, Dr=90%. Water table at ground surface.
El Centro 1940, amax = 0.177g. Centrifuge, 3-m radius, 45g.
Adachi et al. (1998).
2(b) The same with 2(a). The same with 2(a). Lateral loading using the displacement time history of the pile cap from test A.
The same with 2(a). Adachi et al. (1998).
3 0.342-m diameter, 4-pile group loaded against 0.6-m diameter CISS pile 0.342-m diameter 9-pile group loaded against 0.9-m diameter CISS pile.
Treasure Island. 6-m of uniformly graded loose sand, over 4-m of soft fat clay, over 3.5-m of loose silty sand, over soft fat clay. Water table at 1.5-m depth.
Blast induced liquefaction. Blast-induced liquefaction.
Ashford et al. (2000).
4 0.381-m diameter steel pipe pile
Level ground. 6.7-m of liquefiable sand (uniform Nevada No.120 sand, Dr≈62%). Water table at ground surface.
Sinusoidal shaking, amax from 0.06g to 0.4g.
Centrifuge, 40g. Dobry et al. (1995).
5 1-m diameter single pile. Level ground. 9-m of liquefiable sand, Dr=60% outside of the cut-off wall and Dr=90% inside the cut-off wall. Water table at ground surface.
Sinusoidal waves, 1.2Hz, 20 cycles: amax of 0.102g, 0.204g, 0.306g, 0.357g.
Centrifuge, 50g. Koseki et al. (1998).
6 Single pile behind rigid quay wall.
Level ground surface. 7.5-m of Toyoura sand (Dr=60% before shaking) behind quay wall. Varying water tables.
Sinusoidal waves, 50 Hz, 60 cycles, amax = 0.15g. Hyogoken-Nambu 1995 Port Island, amax = 0.16g.
Centrifuge, 2.65-m radius, 50g.
Horikoshi et al. (1997, 1998).
7 2 by 2 pile group. Level ground surface. 6.75-m of Toyoura sand (Dr=60%) over 0.75-m gravel. Water table at ground surface. Soil among piles was improved (denser).
Tokachi-oki 1968, amax = 0.2g. Centrifuge, 3.31-m radius, 25g.
Ohtsuki et al. (1998).
2-7
No. (1)
Structure type (2)
Soil profile (3)
Base shaking (4)
Modeling technique (6)
Reference (7)
8 Simple structure on 4 by 2 pile group, and a single pipe pile, both behind a sheet pile wall.
Level ground surface. 2.1-m of unsaturated uniform Silica No.8 sand (DR =50%), over 3.9-m liquefiable uniform Silica No.8 sand (DR =50%), over 2.1-m dense Toyoura sand (DR =90%), over 3.9-m dense Silica sand of larger mean grain size (DR =90%, bearing stratum). Water table at 2.1-m below ground surface.
Sinusoidal waves, 2 Hz, 10 cycles, amax = 0.153g.
Centrifuge, 30g. Ogasawara et al. (1998).
9 End-bearing single pile, 0.6-m diameter, restrained by a spring at the pile head.
Level ground surface. 6-m of liquefiable saturated Nevada sand (Dr=40%) over 2-m of nonliquefiable sand (slightly cemented). Water table at ground surface.
Sinusoidal waves, 2 Hz, 40 cycles, amax = 0.3g.
Centrifuge, 50g. Ramos et al. (1999).
10 Superstructure on a group of 6 piles behind a caisson-type quay wall.
Level ground surface. 10.8 m liquefiable uniform silica sand (DR=40%) over 0.3-m coarse sand. Water table a little lower than ground surface.
Sinusoidal waves, 2Hz, 30 cycles, amax=0.357g.
Centrifuge, 30g. Sato et al. (1998).
11 Single pile, 0.6-m diameter, in a sloping ground (case 1), or behind a quay wall in a level ground (case 2 &3).
Case 1: 10% sloping ground surface. 5-m liquefiable Toyoura sand (Dr=51.2%). Water surface at ground surface. Case 2 & 3: Level ground surface. 10-m liquefiable Toyoura sand (Dr =53.5% in case 2 and Dr =55.7% in case 3).
Sinusoidal waves, 4 Hz, 400 cycles for case 1 and 100 cycles for case 2 & 3.
Centrifuge, 3-m radius, 50g.
Satoh et al. (1998).
12 Heavy structure on 4 by 4 pile group fixed on a footing.
Level ground surface. 6-m of reclaimed sand, over 5-m of alluvial sand, over 1-m gravel (bearing layer). Water table at ground surface.
At 50g: Sinusoidal waves, 1 to 7 Hz, amax=0.003g. At 30g: Sinusoidal waves, 3Hz, amax=0.11g; Sinusoidal waves, 2Hz, amax= 0.1g; El Centro earthquake with amax = 0.175g.
Centrifuge, 50g and 30g. Taji et al. (1998).
13 Pier on 3 by 3 pile group in front of gravity type caissons.
6.5-m of level backfill (Toyoura sand, Dr =50%) behind the caissons, with 1:2 sloping rubble mound (quartz sand, Dr =30%) in front of caissons, both over 1-m Toyoura sand layer (Dr =50%), over 3.5-m bearing stratum (dense quartz sand, Dr =80%). Water table 2-m below the backfill surface behind caissons and over ground surface in front of caissons.
Case 1: Modified 1995 Port Island, Kobe, motion. Case 2-5. Sinusoidal waves, 2Hz, 20 cycles.
Centrifuge, 50g. Takahashi et al. (1998).
2-8
No. (1)
Structure type (2)
Soil profile (3)
Base shaking (4)
Modeling technique (6)
Reference (7)
14 Caisson type quay wall. Level ground surface. Water table at the surface of liquefiable layer. Case 1: 0.5-m of nonliquefiable sand over 1-m liquefiable sand (both Dr=22%), over 0.3-m of dense sand base layer. Case 2: 1-m of nonliquefiable sand over 0.5-m of liquefiable sand (both Dr=22%), over 0.3-m of dense sand base layer.
Sinusoidal waves, 5 Hz, 25 cycles, amax=0.15g and 0.5g.
Shaking table. Tamura et al. (1997).
15 Single steel pipe pile, 0.32-m diameter.
Level ground surface. 5.3-m of loose moist sand (Dr =64.6%, water content=9.3%).
Shake 1: “Sweep Test”: sinusoidal waves of amax=0.5g, frequency varying gradually from 20Hz to 1Hz. Shake 2: 1995 Port Island, Kobe, motion with amax= 0.45g.
Shaking table. Tao et al. (1998).
16 4 sloping ground models with varying slope lengths.
5°sloping ground surface, water table at the surface of the middle liquefiable layer. Case 1-3: 0.15-m of unsaturated gravels (D50=7 mm), over 0.35-m of liquefiable layer, over a nonliquefiable Mt. Sengen-yama sand. Case 4: 0.35-m of liquefiable layer over a nonliquefiable Mt. Sengen-yama sand.
Sinusoidal waves, 2 Hz, 40 cycles, with several levels of amax applied stepwise.
Shaking table. Tokida et al. (1992).
17 Several differently arranged model pile groups fixed to a plate at the pile heads.
Level ground surface. An upper liquefiable layer of Toyoura sand over a dense sand layer.
The same as 16.
One hammer blow against container sidewall.
Tokida et al. (1992).
18 Simple structures on pipe piles. Single piles, 2 by 2 group, & 3 by 3 group.
Level ground. 9-m of loose or medium-dense clean sand, over 11-m of dense clean sand. Water table at ground surface.
Modified 1995 Port Island & 1989 Santa Cruz recordings; amax of 0.01-0.60 g.
Centrifuge, 9-m radius. Wilson et al. (1999, 2000), Wilson (1998).
19 Quay Walls Level ground behind wall. 30-cm of clear Toyura sand of varying density. Water table at ground surface.
Sinusoidal with f = 3 Hz and amax of 0.15-0.40 g.
Shake table. Yasuda et al. (1996).

2-9
More complicated damage patterns were also observed, with cracking occurring at intermediate depths and different cracking patterns being observed for piles on different sides of the same building (Tokimatsu et al. 1997, Tokimatsu and Asaka 1998). These more complicated damage patterns were subsequently shown to be predictable with a pushover design method that accounted for the lateral ground deformation being greater on one side of the building (adjacent to a quay wall that deformed outward) and the fact the pile heads are interconnected through the building substructure. Ramos et al. (1999) also showed that the distribution of lateral spreading loads on piles, and hence bending moments, can be affected by the superstructure’s restraint against pile head movement.
Kinematic loading from transient ground lurching, even without large permanent ground deformations, is also believed to be an important consideration. In the Port Island of 1995 Kobe Earthquake, failures of piles near bottom of liquefied fill was caused by kinematic loading from the liquefied layer considering the piles were far away from the nearest quay wall (Fujii et al. 1998). The importance of transient ground deformations was illustrated by centrifuge tests at UC Davis with a pile supported tank structure founded in a profile of dense sand over soft clay over dense sand (Robins et al. 1999). The piles extended well into the lower dense sand layer. Strong shaking caused large transient strains in the soft clay and hence yielding of the piles near the sand/clay interface, even though the permanent lateral ground deformations were small. While these tests did not involve liquefaction, the kinematic loading from transient deformations across a softer soil layer are likely to be similar in both cases.
Inertial loads have also been shown to contribute to damage in the field (Kawamura et al., 1985, Yoshida and Hamada 1990, Matsui 1993, Matsui and Oda 1996, Tokimatsu et al. 1996, 1998, Fuji et al. 1998, Nishizawa et al. 1998) and in model tests (Adachi et al. 1998, Taji et al. 1998). Sometimes the contributions of inertial and kinematic loads are difficult to separate. For example, for a building on Port Island in Kobe, Fuji et al. (1998) concluded that pile failure near the bottom of the liquefied layer was caused by kinematic loads from the liquefied layer, while failure near the pile head was likely influenced by inertial loads from superstructure and kinematic loads from non-liquefied crust.
Pile type has been observed to have some effect on foundation performance, with the observations appearing to be consistent with expectation from general design methods. For reinforced concrete (RC) piles, damage has generally been greatest in older piles that lack the level of reinforcing steel required by modern design standards and piles with weak connections to their footings, whereas prestressed reinforced concrete piles designed according to recent standards have performed relatively better (e.g., Adib et al. 1995, Matsui and Oda 1996, Karube et al. 1996, Tokimatsu et al. 1997, Akiyama et al. 1997). Larger diameter (>1m) cast-in-place reinforced concrete piles have generally performed better, but there were still numerous cases of damage (e.g., Matsui and Oda 1996). Large diameter (>1 m) steel pipe piles were not damaged even in areas of lateral spreading, while smaller diameter (70 cm) ones sometimes were damaged. (Matsui and Oda 1996). Steel pipe piles appeared to perform better due to their good ductility, by there were still cases of dramatic yielding and deformations such as at the wharf
2-10
structure described by Nishizawa et al. (1998). The overall conclusion that can be drawn from these case histories is that it is possible for pile foundations of various types to be designed to perform adequately in liquefied ground, and that at the same time, no pile type is immune from damage if not designed adequately for the effects of liquefaction.
The performance of batter piles in liquefied ground includes cases of severe damage and of reasonably good performance. Damage was observed at the heads of batter piles at the Port of Oakland after the 1989 Loma Prieta earthquake (Figure 2-2), which is consistent with the batter piles being stiffer laterally than the vertical piles, and hence attracting a greater share of the lateral kinematic loads. Nishizawa et al. (1998) described damage to steel pipe piles supporting a wharf adjacent to a quay wall (Figure 2-3), with the damage being attributable primarily to the lateral loads from the lateral spreading of the rock dike. Berrill et al. (1997) analyzed the relatively good performance of batter piles at the Landing Road bridge in the 1989 Edgecumbe earthquake, and concluded that the lateral loads from the liquefied sand layer had to be negligible compared to the lateral loads from the nonliquefiable crust layer, since the crust loads were about equal to the load that would be expected to produce collapse of the structure (Figure 2-4).
Moderately damaged (cracked) large-diameter piles along a major highway in Kobe were shown to retain significant lateral loading capacity (Matsui and Oda 1996, Akiyama and Morimoto 1997).
Pile damage is not necessarily related to super-structure damage (Karube and Kimura 1996, Matsui and Oda 1996), and hence various methods for detecting damage were evaluated extensively after the Kobe earthquake. Direct visual observations, X-ray inspection, borehole camera, bore hole television (BHTV), remote controllable television camera, inclinometer survey, slope indicator, plumb measuring, and nondestructive sonic integrity tests were all used in detecting foundation damage (Tokimatsu et al. 1996, 1997, Tokimatsu and Asaka 1998, Akiyama and Morimoto 1997, Oh-Oka et al. 1997, 1998, Sasaki et al. 1997, Fujii et al. 1998, Tao et al. 1998). The borehole television (BHTV) system (also borehole camera), and direct visual observations are the most reliable methods in damage investigation (Tokimatsu et al. 1996).
2.2. Subgrade Reaction Behavior Between Piles and Liquefied Soil
The first measurements of dynamic p-y behavior for liquefying sand were presented by Wilson et al. (1998, 2000) based on back-analyses of dynamic centrifuge model tests (Figure 2-5). Results showed that the p-y behavior has characteristics that are consistent with the stress-strain response of liquefying sand, as illustrated by the typical p-y loops in Figures 2-6 and 2-7. The p-y resistance of loose sand (e.g., Dr ≈ 40%) was much smaller and softer than for medium-dense sand (e.g., Dr ≈ 55%). The ultimate lateral resistance in loose sand (Dr ≈ 40%) was generally small when the soil liquefied, even when relative displacements (y) were fairly large. In medium-dense sand (Dr ≈ 55%), the p-y behavior progressively softened with time during shaking as pore pressures, strains, and number of load cycles increased. The observed p-y behavior was found to be displacement hardening when relative displacements approached or

2-11
exceeded past values, especially near the surface. This behavior may be attributed to the nearly undrained loading conditions and the tendency for the soil to dilate under these loading conditions (i.e., large enough strains to move the sand through a phase transformation).
The observed dynamic p-y behavior for liquefying sand is consistent with the known stress-
strain response of liquefying sand, as illustrated by the typical laboratory test results for medium dense sands shown in Figure 2-8. For example, the stress-controlled cyclic triaxial tests (Figure 2-8a) show inverted s-shaped stress-strain loops that are very similar qualitatively to the p-y loops shown in Figure 2-7. Under strain-controlled loading in the lab (Figure 2-8b), the stress-strain behavior shows a progressive degradation in stiffness that qualitatively agrees with the observed dependence of p-y loops on pore pressure build-up and prior relative displacement history. Similarly, undrained cyclic lab tests on saturated sands show that looser sands degrade faster or soften more than denser sands, and hence the difference in p-y response for different Dr sands in Figures 2-6 and 2-7 are as expected.
Tokimatsu et al. (2001) back-calculated p-y behavior from large scale shaking table tests as
shown by the layout in Figure 2-9. The back-calculated p-y behavior is shown in Figure 2-10 for three different time intervals during shaking and for sand at three different relative densities. The top row of plots is for loose sand, and they show very low lateral resistance (subgrade reaction) at all time (liquefaction occurred early in shaking). The middle row of plots is for dense sand, and they show substantial lateral resistance remaining even after liquefaction (ru=100%) had developed. The bottom row of plots is for medium-dense sand, and they show progressive softening with increasing pore pressure and a memory of prior relative displacements. Tests with different levels of peak base acceleration (0.12 and 0.24 g) showed that the stronger base shaking resulted in greater softening of the subgrade reaction in the medium dense sand after ru=100% had developed, Tokimatsu et al. also observed that the lateral resistance at 1 m depth after liquefaction appeared to be more closely related to relative velocity than relative displacement. Aside from this last observation regarding the effect of relative velocity, the findings are in good agreement with those of Wilson et al. (2000).
Ashford and Rollins (2002) also studied the p-y behavior in liquefied soil based on the blast-
induced liquefaction testing at Treasure Island. These tests involved full-scale pile foundations that were cyclically loaded from the pile head after the surrounding soil was liquefied by a series of blasts. The soil profile and lateral load test results for a 0.6-m-diameter CISS pile are shown in Figure 2-11. The load-displacement response (Figure 2-11b) shows cyclic degradation (i.e., for the same pile head displacement, the lateral load drops with each successive cycle) and a displacement-hardening response for the later cycles of loading. The back-calculated p-y responses in Figure 2-11c similarly show displacement-hardening behavior and a strong dependence on past loading history. The observed p-y behavior from these field tests is similar to that observed by Wilson et al. (2000) for medium-dense sands in centrifuge tests, as previously shown in Figure 2-7. Pore pressure measurements near the piles at Treasure Island showed that transient drops in pore pressure (i.e., a dilational tendency) occurred when the pile was being loaded, which indicates that the soil was going through phase-transformation under the strains imposed by the pile’s displacement through the liquefied soil. These field tests do not, however, incorporate the effects of the seismic site response on the free-field pore pressures or shear strain levels.
2-12
The subgrade reaction against a pile in liquefying soil is dependent on the excess pore
pressures throughout the soil, both near the pile and away from the pile (i.e., near-field and far-field). An excess pore pressure ratio (ru) of 100% (one definition of “liquefaction”) only occurs in sand when the applied shear stress is zero. During shaking, a peak ru of 100% can develop in the free field, after which the ru value can drop to a lower value as shear stress is applied to the soil either from the ground motion or gravity loading for sloping ground. Thus ru values are often observed to vary cyclically during shaking even after peak ru values of 100% have occurred in the free field (e.g., this will be shown in the centrifuge test results shown in subsequent sections of this report). The pore pressures near the pile are then also affected by the strains produced by relative movements between the soil and pile, as shown by the tests at Treasure Island (Ashford and Rollins 2002) and in centrifuge tests (e.g., Wilson 1998, Haigh 2002). Wilson (1998) compared ru values measured in the near field and far field during shaking, and found that the near-field values were closely related to the far-field values, with the near-field effects having a clear, but not dominant, effect on the pore pressures.
The effects of pile flexibility and pile head restraint on the subgrade reaction of liquefying
soil were illustrated in tests by Haigh (2002) and Ramos et al. (1999). Haigh (2002) performed centrifuge tests with single piles embedded in laterally spreading ground (Figure 2-12). The net horizontal stress against the pile was shown to be greater for a “rigid” pile than for a “flexible” pile (Figure 2-13) despite the total relative movements between the soil and pile being similar at the end of shaking. Ramos et al. (1999) showed that lateral restraint on a pile head (e.g. from a superstructure) significantly affected the maximum bending moments and lateral pressure distribution on piles in centrifuge test.
Iai (2002) performed 2D finite element analysis of a pile cross-section being cyclically
displaced in liquefied soil (Figure 2-14) using a constitutive model that could capture cyclic mobility in the undrained stress-strain behavior. The “p-y” behavior derived from the FEM analyses was shown to exhibit cyclic mobility behavior in the same way that the soil did (Figure 2-15).
Rate effects on p-y behavior in liquefied soil have been observed in several studies (Tokida
et al. 1992, Tokimatsu et al. 2001, Towhata and Mizutani 1999). Similar rate dependence has been observed for the reaction against a moving body in saturated sand (e.g., pile, pipe, or plow), which was subsequently shown to due to partial drainage of pore water around the body (Girard and Taylor 1994, Kutter and Voss 1995, Palmer 1999). For p-y behavior in liquefying soil, it is also important to note that rate effects have not been observed in all cases (Wilson et al. 2000, Tokimatsu et al. 2001).
The maximum load and maximum bending moment induced on piles during lateral spreading
have sometimes been observed to occur prior to liquefaction (ru of 100%) throughout the liquefying layer (Tokida et al., 1992, Adachi et al., 1998). Dobry and Abdoun (2001) and Abdoun and Dobry (1998) found that maximum loads and bending moments occurred after liquefaction throughout the laterally spreading layer, and subsequently decreased with increasing lateral spreading deformations.

2-13
The behavior of pile groups in liquefying soil has been evaluated in a number of model studies. Adachi et al. (1998) showed that the existence of a pile group had little effect on the generation of excess pore water pressure during earthquake shaking. Tokida showed that the number and arrangement of piles in a group affected the subgrade reaction in liquefied soil. Takahashi et al. (1998) showed that piles could prevent the lateral movement of soils in some cases, but piles with larger spacing and lower rigidity could move together with soils with no significant effect on the soil lateral movement.
The combined findings from prior physical modeling studies, including those referred to above, show that the p-y behavior of liquefied sand depends on the same factors that affect the monotonic and cyclic loading behavior of saturated sands, plus additional factors as expected.
• Relative density (Dr). • Prior displacement (strain) history. • Excess pore pressure ratio in the far- and near-field.
o Magnitude of cyclic stresses & number of loading cycles imposed on the free-field soil.
o Magnitude and number of loading cycles between the pile & soil. • Partial drainage and hence loading rate. • Soil characteristics. • Pile installation method.
In addition, the pile flexibility and head restraint affect the lateral loads imposed by liquefied soil as it cyclically spreads laterally past a pile. Recognizing the potential effects of such factors is important for reconciling the differences between the various physical modeling and case history studies, and for synthesizing the information into practical design recommendations. Different modeling approaches offer specific advantages and disadvantages in studying these phenomena, as illustrated by example comparison in Table 2-3, which further illustrates the need to synthesize the findings with due consideration to the limitations on each set of experimental data. Lastly, given the complexity of the behavior, it is also important to recognize that any simplified monotonic p-y relation for liquefied soil is only a crude approximation for a complex time-varying cyclic loading response.
Table 2-3: Ability of Physical Modeling Techniques to Evaluate Key Phenomena Field-scale
with blasting Large-scale
shaking tableLarge
centrifuge Effect of pile installation --a --a
Natural soil conditions
-- --
Dynamic site response & dynamic SSI effects
--
Controlled study of soil density & ground motions.
--
a Possible with future capabilities.

2-14
2.3 Simplified Analysis & Design Methods
Simplified analyses of piles in laterally spreading ground include pseudo-static Beam on Nonlinear Winkler Foundation (BNWF) approaches and limit equilibrium approaches. Limit-equilibrium approaches are based on applying the limiting lateral pressures from the laterally spreading soils, assuming pressure distributions in the resisting soils, and then calculating the internal shear force and bending moment distributions. Pseudo-static BNWF (or p-y) approaches include two alternatives as depicted in Figure 1-2. The first BNWF alternative requires the free-field soil movements (ysoil) as an input, with the resulting lateral soil reactions (p) being dependent on the relative displacement (y) between the free-field soil (ysoil) and the pile (ypile). The second BNWF alternative applies limit pressures over the depth of laterally-spreading soil (with the p-y springs removed in this interval), and then uses p-y springs to model the response in the underlying competent soil. In this alternative, the applied lateral pressures are independent of the free-field soil displacements since the soil movements are assumed to be large enough to cause the lateral pressures to reach their limiting values. These two BNWF alternatives are respectively referred to as “BNWF” and “BNWF with limit pressures” in the remainder of this report.
One approach for approximating the effects of liquefaction on p-y behavior for design purposes is to apply a p-multiplier (mp) to the drained p-y resistance. Dobry et al. (1995) investigated such an approach by performing centrifuge tests involving post-liquefaction cyclic loading of a pile in Dr ≈ 40% sand. The cyclic loading continued while the excess pore pressures dissipated. They analyzed the bending moment response using a BNWF analysis method. They showed that the pile bending moments for their experiments could be reasonably predicted if the original drained nonliquefied p-y curves were multiplied by an apparent p-multiplier that decreased more or less linearly with excess pore pressure ratio and reached a minimum value of about 0.1 when the excess pore pressure ratio was unity (Figure 2-16).
Wilson et al. (1999) and Boulanger et al. (1997) performed pseudo-static BNWF analyses of
the dynamic response of piles in centrifuge tests and concluded that a reasonable p-multiplier for representative peak loading cycles on a single pile in liquefied sand may be about 0.1-0.2 for Dr ≈ 35% and about 0.25-0.35 for Dr ≈ 55%. They further showed that (1) lower p-multipliers would be appropriate for smaller load cycles (smaller than a prior peak loading), which is a condition that might exist later in shaking when lateral ground deformations are reaching their maximum values, and (2) that peak bending moments and peak superstructure displacements may occur before or after liquefaction develops, such that both conditions need to be considered.
The Japan Road Association (JRA 2002) specifications for highway bridges stipulate that
inertial loading and kinematic loading (from lateral spreading) can be analyzed separately, such that both inertial and kinematic loads are not considered to act at the same time. The inertial loading from the superstructure is analyzed for two cases: (1) assuming that liquefaction does not occur, and (2) allowing for the expected occurrence of liquefaction. In both cases, the inertial loads from the superstructure are estimated using the superstructure’s natural period in the absence of liquefaction. The p-y parameters and skin friction resistances (axial loading) for the case of liquefaction occurring are multiplied by the “reduction factor (DE)” given in Table 2-4. This DE parameter is equivalent to the p-multiplier (mp), except that it is also used to scale axial

2-15
skin friction resistances. DE is taken as dependent on the level of shaking (as represented by the factor of safety against liquefaction, FL), the relative density of the soil (as represented by the dynamic shear strength ratios R), and the depth from the ground surface.
Table 2-4: Reduction Factor (DE) for Geotechnical Parameters for Liquefied Soil in Analysis of Inertial Loading Condition (JRA 2002)
Note: Level 1 motions correspond to earthquakes with a high probability of occurrence during a bridge’s service life, and Level 2 motions correspond to earthquakes with a low probability of occurrence during a bridge’s service life.
For kinematic loading from lateral spreading, the JRA (2002) guidelines impose lateral
pressures from the liquefied layer and from any overlying nonliquefied layers (Figure 2-17). The nonliquefied layers are considered as imposing passive earth pressures, subject to reduction factors for being more than 50 m from the waterfront and for sites with low liquefaction indices. The liquefied layers are considered as imposing a lateral pressure equal to 30% of the total overburden stress, also subject to a reduction factor for being more than 50 m from the waterfront. Within 50 m of the waterfront, the lateral pressures from the liquefied layers are approximated as:
bp vσ3.0= (3-1)
where p = pressure from liquefied soil σv = total overburden stress b = pile diameter
The lateral pressures from the nonliquefied and liquefied layers are reduced by a factor of 0.5 for distances of 50 to 100m, and neglected for distances greater than 100 m. This methodology is partly based on analyses of case histories of pile performance in the 1995 Kobe earthquake.

2-16
Another approach is to represent the liquefied sand as undrained material with an appropriate undrained (or residual) shear strength. There are several methods for estimating the residual shear strength (Sr) of liquefied sand, including some that directly estimate Sr from in-situ test data and others that estimate a shear strength ratio (Sr/σvc
from the in-situ test data. Either (׳approach will result in Sr values that vary with the relative density of the sand. The ultimate lateral resistance (pult) against a pile given the residual strength of the liquefied soil is then often calculated using equations developed for other φ = 0 materials. The remaining issue is then how to develop the shape of the p-y curve given the pult value calculated in the above way.
Goh and O’Rourke (1999) derived p-y curves for liquefied soil based on 2-D finite difference
analyses of a circular pile (e.g. a horizontal plane was analyzed) with the soil’s constitutive behavior based on undrained monotonic loading, triaxial extension test data on Nevada sand. The triaxial extension data were summarized as having a peak shear strength ratio of Su/p0.17 = ׳ following by a drop to a minimum shear strength ratio of Su,min/p0.034 ≈ ׳ at plastic deviator strains of 2% or greater. The resulting p-y curves are shown in Figure 2-18. Soil-pile interaction analyses using these p-y springs were able to predict the responses of single piles in liquefied Nevada sand (Dr ≈ 40%) from centrifuge tests by Abdoun (1997). They also showed that this approach produced ultimate lateral pressures against their piles that were comparable to those estimated by the JRA guideline previously described.
The above approaches can produce similar values for pu (or p) under certain conditions and
lead to similar results in a soil-pile interaction analysis. A few comparisons are presented herein to illustrate the similarities and differences. One of the simplest comparisons is obtained by equating the p obtained by the JRA guideline and the pu obtained for plane strain failure of an S/σvc′ material. The bearing factor (Np = pu/Sb) for φu = 0 analyses generally ranges from about 3 near the ground surface (wedge failure) to about 9 at depth (plane strain failure), as will be described in equations 3.3 and 3.4. For the low strength ratio that was used herein, plane strain conditions will dominate even at relatively shallow depths, and thus Np can be taken as simply 9 for practical purposes:
bSb vσ3.09 = (3-2)
If σv′ is one-half σv, which is reasonable for a water table near the ground surface, then these approaches give the same pu if S/σvc′ = 0.067. If the water table is deeper such that σvc′ is almost equal to σv, then the same pu is obtained if S/σvc′ = 0.033.
The term “S” describes the soil’s shear resistance during the dynamic p-y loading, and is not
the same as denoted by the terms Su or Sr. The term Su usually refers to undrained shear strength under monotonic loading, while Sr usually refers to residual shear strength which may be affected by field processes like void redistribution (e.g., Seed 1986). The shear resistance that develops between a liquefied sand and a pile during lateral spreading or shaking is further complicated by the cyclic loading conditions, the potential for local drainage between near-field and far-field regions, the spatial variations in soil strains around the pile, and other factors. For these reasons, the term S is used generally to describe the apparent shear resistance of liquefied sand as it interacts with a pile during shaking or lateral spreading.

2-17
Additional comparisons of pu values obtained using the above relation and drained static p-y relations show that values of mp and S/σvc′ can be chosen to produce the same pu values for a given pile diameter and depth, but the same mp and S/σvc′ ratios will generally not give matching pu values at other depths or for other pile diameters. Further comparisons of the p-multiplier and S/σvc′ approaches are presented later in this report.
Simplified pseudo-static design methods, whether using p-y curves with estimated ground displacements or limit pressures in the laterally-spreading soils, have been found to be capable of simulating reasonably well the failure modes of damaged piles in past earthquakes (e.g., Abdoun et al. 1996, Tokimatsu and Asaka 1998, Berrill et al. 2001) and the responses of piles in physical model tests (e.g., Abdoun et al. 1996, Singh 2002). Sometimes the solution is insensitive to the method used to represent the liquefied soil, such as when the loads imposed by the laterally spreading ground are dominated by a strong nonliquefied crust or surface layer. In other cases, the choice of p-y or p values for representing the liquefied soil are chosen to give agreement with observations, and hence the challenge is to reconcile the range of apparent subgrade reactions into a consistent set of guidelines for design practice.
Dynamic nonlinear time-history analyses using FEM models have also been used successfully to reasonably simulate the failure modes of piles in past earthquakes (e.g., Fuji et al. 1998, Kagawa et al. 1997, Tao et al. 1998). As noted for the simplified methods, these solutions can sometimes be insensitive to the method used to represent the p-y behavior in the liquefied layers and in other cases are used to infer the appropriate representation for the liquefied layer. For bridge abutments, a simple iterative coupling of the lateral spreading and pile response analyses has sometimes been used by designers at Caltrans and elsewhere (e.g., Martin et al. 2002) to take advantage of the fact that the pile foundation will act to reduce the lateral spreading deformations of the abutment, which reduces the loads on the pile foundation itself. The details of these design procedures can vary, but the general concept is as illustrated in Figs. 2-19, 2-20, and 2-21. A slope stability analysis is used to obtain the yield acceleration for the slope, given some specified restraining force from the piles (Figs. 2-19, 2-20). A Newmark sliding block analysis of the slope is then used to develop a relation between the magnitude of the slope displacement (lateral spread displacement) and the restraining force from the piles. A pushover analysis of the pile foundation is used to develop the relation between the reaction forces (loads) on the pile foundation and the magnitude of the lateral spreading displacement. The solution is where these two separate analyses produce compatible (equal) soil displacements and pile foundation reaction forces (Figure 2-21). This solution may be obtained iteratively without actually producing the relations shown in Figure 2-21 or may be simplified through various assumptions (e.g., Martin et al. 2002). These types of analysis are capable of identifying when a pile foundation might be expected to withstand lateral spreading loads, and can offer substantial cost savings over the uncoupled analyses. A related outcome of such analyses is that additional piles may offer a cost effective means of mitigating lateral spreading hazards in some situations. The accuracy and limitations of the above iteratively-coupled analysis is unknown because it has not yet been evaluated against any physical data (case histories or model studies) or detailed FEM analyses.

2-18
Figure 2-1. Damage to steel piles of Pier 4 of Showa Bridge
(PWRI; from Yasuda and Berrill 2001)
Figure 2-2. Damage to batter piles at Port of Oakland during 1989 Loma Prieta earthquake (Courtesy of John Egan, Geomatrix)

2-19
Figure 2-3. Damage to steel pipe piles in 1995 Kobe earthquake (Nishizawa et al. 1998)
Figure 2-4. Typical pier foundation at Landing Road Bridge, 1987 Edgecumbe earthquake
(Yasuda and Berrill 2000)

2-20
Figure 2-5: Schematic cross-section of centrifuge model and single-pile-supported structure used to back-calculate p-y behavior by Wilson et al. (2000).
p (k
N/m
)
-400
0
400
y (mm)-50 0 50
-400
0
400
-400
0
400 (a)
(b)
(c)
23.8-29.1 sec
y (mm)-25 0 25
(a)
(b)
(c)
4.7-5.6 sec
15.9-16.9 sec
26.4-27.6 sec
Fig. 2-6. p-y loops in liquefying loose sand (Dr ≈ 40%) at depths (a) 2-D, (b) 3-D, and (c) 4-D (D = 0.67 m). Dashed lines per API (1993). (Wilson et al. 2000)
Fig. 2-7. p-y loops for liquefying med. sand (Dr ≈ 55%) at depths (a) 2-D, (b) 3-D, and (c) 4-D (D = 0.67 m). Dashed lines per API (1993). (Wilson et al. 2000)
acceleration
displacement
pore pressure
strain gauge
9.1 m loose to medium dense sand
11.4 m dense sand
3.8 m
Singlepile
3 x 3 pilegroup
2 x 2 pilegroup

2-21
(a) Stress-controlled undrained cyclic triaxial test (Boulanger and Truman 1996).
(b) Strain-controlled undrained cyclic torsional shear test (Figueroa et al. 1994)
Figure 2-8. Difference in stress- versus strain-controlled undrained cyclic loading response of
saturated medium-dense sand in conventional laboratory tests.
-3 -2 -1 0 1 2 3Axial Strain (%)
-0.2
0.0
0.2
0.4
Cyc
lic S
tres
s R
atio
, CSR
Sacr. river sandCyclic triaxialσ3c′ = 200 kPaDr = 53%

2-22
Figure 2-9: Layout of large shaking table tests by Tokimatsu et al. (2001).
Figure 2-10: Back-calculated p-y behavior from large scale shaking table tests (Tokimatsu et
al. 2001): (a) Top row for A1-120 is for loose sand, (b) Middle row for B1 is for dense sand, and (c) Bottom row for BL is for medium dense sand.

2-23
(a)
(b)
(c)
Figure 2-11. Lateral load tests on a 0.6-m-diameter CISS pile after blast-induced liquefaction at Treasure Island (Ashford and Rollins 2002): (a) Soil profile, (b) Load-displacement response,
and (c) Back-calculated p-y response.

2-24
Figure 2-12. Centrifuge test of lateral spreading against single piles of different flexibilities
(Haigh 2002)
Figure 2-13. Time histories of net horizontal total stress against “flexible” and “rigid” piles in
laterally spreading soil profile (Haigh 2002)

2-25
Figure 2-14: FE Mesh for Undrained Cyclic Loading of Pile in Saturated Sand (Iai 2002)
Figure 2-15: Predicted p-y Behavior from FEM Analyses of Pile in Liquefied Soil (Iai 2002)

2-26
Figure 2-17: Representation of Lateral Spreading Loads by JRA (2002)
Figure 2-18: Strain-softening normalized p-y curves by Goh and O’Rourke (1999)
0 20 40 60 80 100Pore Pressure Ratio, ru (%)
0
0.2
0.4
0.6
0.8
1
P-M
ultip
lier,
mp
Dobry et al. (1995)mp = 1 - 0.9ru
mp = 1 - 0.95ru
Figure 2-16: Relationship between p-multiplier and pore pressure ratio for post-liquefaction cyclic loading of sand (after Dobry et al. 1995).

2-27
Figure 2-19. Newmark Sliding Block Analysis of Slope on Liquefied Soil (Martin et al. 2002)
Figure 2-20. Example of Bridge & Pile Foundation Forces that Resist Lateral Spreading (Martin et al. 2002)
Figure 2-21. Schematic of the Iterative Coupling of the Lateral Spreading and Pile Response Analyses to Obtain Compatible Reaction Forces (Loads) and Displacements.
Lateral slope displacement
Rea
ctio
n fo
rce
betw
een
slop
e &
pile
foun
datio
n
Slope displ. versus restrainingforce from pile foundation
Pushover responseof pile foundation
Solution with compatible forces& displacements

3-1
3. CENTRIFUGE TESTS
3.1 Overview of Testing Program This section describes the centrifuge tests that were performed at the Center for Geotechnical
Modeling (CGM), UC Davis, to study the behavior of piles during earthquake-induced lateral spreading. A total of five centrifuge tests have been fully documented in CGM data reports. The first of these centrifuge tests (PDS01) involved three individual piles and one two-pile group, whereas the subsequent centrifuge tests involved a six-pile group. An overview of the centrifuge test program is briefly presented, along with a more detailed description of the first centrifuge test to illustrate the types of data available in the data reports.
The centrifuge tests were performed on the 9.1-m radius geotechnical centrifuge at UC Davis
(Figure 3-1). Details of the centrifuge facility are available at the CGM website at http://cgm.engr.ucdavis.edu/. The flexible shear beam container (FSB2) was used for the tests. Tests were performed at centrifugal accelerations varying from 36.2g to 38.1g. Table 3-1 presents the scaling factors relevant to the tests. Results are presented in prototype units unless stated otherwise.
Table 3-1: Scaling Factors
Quantity Prototype Scale / Model Scale Quantity Prototype Scale /
Model Scale
Stress 1 Length N
Acceleration N-1 Area N2
Force N2 Moment of Inertia N4
Moment N3 Time (dynamic) N Young’s
Modulus 1
Five tests – named PDS01, PDS02, PDS03, SJB01, and SJB02 – were performed to study the
behavior of piles in liquefied soil. Each test was subjected to more than one shaking event, with each event separated by sufficient time to allow full dissipation of any excess pore pressures. Shaking events were numbered sequentially for each test; e.g., the first shake in the test PDS01 was numbered PDS01_01, and so on. Table 3-2 lists the shaking events and the peak base accelerations in parentheses for the five tests. All the “Kobe” events are scaled versions of ground motions recorded at a depth of 83m at Port Island in the 1995 Hyogoken Nambu (Kobe) Earthquake. The “Santa Cruz” events are scaled versions of the ground motion recorded during the 1989 Loma Prieta Earthquake at the UCSC/Lick Lab, Ch. 1 – 90o.

3-2
Table 3-2: Shaking Events in the Five-Test Series
Test Name Shaking Event
Number PDS01 PDS02 PDS03 SJB01 SJB02
01 Step Shake (0.002g)
Step Shake (0.002g)
Step Shake (0.002g)
Step Shake (0.001g)
Step Shake (0.002g)
02 Small Kobe (0.20g)
Small Kobe (0.20g)
Small Santa Cruz (0.15g)
Small Santa Cruz (0.15g)
Small Santa Cruz (0.17g)
03 Large Kobe (0.70g)
Large Kobe (Unavailable)
Medium Santa Cruz (0.46g)
Medium Santa Cruz (0.45g)
Medium Santa Cruz (0.52g)
04 Second Large Kobe (0.70g) -- Large Santa
Cruz (1.00g) Large Santa Cruz (0.94g)
Large Santa Cruz (0.89g)
05 -- -- Large Kobe (0.74g)
Large Kobe (0.76g)
Large Kobe (0.67g)
06 -- -- -- Second Large Kobe (0.76g)
Second Large Kobe (0.80g)
Note: The values in parentheses are peak base accelerations. The soil profiles in the models were comprised of a non-liquefiable crust of over-
consolidated clay overlying a layer of loose saturated sand (Dr ranging from 20% to 35%), overlying dense sand (Dr ranging from 78% to 91%) as illustrated in Figure 3-2 for PDS01. The soil layers were built to slope at approximately 3o towards a channel at one end of the model. Models PDS01 and PDS02 had a layer of coarse sand on top of the clay to protect the clay from drying due to the air movement caused by the spinning of the centrifuge. For the other three tests, clear lexan-sheet covers were used to shield the model surface from air currents.
The main parameter variations in the five centrifuge tests are listed in Table 3-3. The first
centrifuge model, PDS01 (Figure 3-2), had single pipe piles with prototype diameters of 0.36m, 0.73m, and 1.45m, and one pile group of two 0.73-m diameter piles with a cap connection for fixed head conditions, located at four separate locations in the model slope. Subsequent models had a group of six 0.73-m diameter pipe piles connected by a large embedded pile cap. The main parameters varied in these tests include the input base motions, shear strength of clay, and thickness of loose sand layer.

3-3
Table 3-3: Main Parameter Variations in the Five Tests
Test Piles Soil
1.0 m Coarse Sand; Over 2.9 m Clay Cu ≈ 20 kPa; Over 4.8 m Loose sand, Dr ≈ 26%;
PDS01 Single piles of dia. 0.36m,
0.73m, & 1.45m. Two-pile group of 0.73-m piles.
Over Dense sand, Dr ≈ 91%.
0.3 m Coarse Sand; Over 4.2 m Clay, Cu ≈ 20 kPa;
Over 4.4 m Loose sand, Dr ≈ 32%;PDS02 Six-pile group of 0.73-m
diameter piles Over Dense sand, Dr ≈ 85%.
Clay, Cu ≈ 20 kPa; Loose sand, Dr ≈ 35%; PDS03 Six-pile group of 0.73-m
diameter piles Dense sand, Dr ≈ 82%.
Different input base motion
Clay, Cu ≈ 40 kPa; Loose sand, Dr ≈ 33%; SJB01 Six-pile group of 0.73-m
diameter piles Dense sand, Dr ≈ 83%.
Increased shear strength of
clay
Clay, Cu ≈ 40 kPa; Loose sand, Dr ≈ 20%; SJB02 Six-pile group of 0.73-m
diameter piles Dense sand, Dr ≈ 78%.
Smaller thickness of loose sand
layer
The dense and loose sand layers were placed by dry pluviation. Clay slurry, consisting of
reconstituted bay mud, was prepared with a mixer, placed on the loose sand surface, and consolidated under a hydraulic consolidation press. The clay layer was placed and consolidated in two lifts. A drainage layer consisting of filter paper and thin horizontal sand seams was placed between the two lifts to accelerate consolidation. The vertical consolidation stress was 100 kPa for both lifts for the tests PDS01, PDS02, and PDS03, and 240 kPa for SJB01 and SJB02. After consolidation, a “river” channel was carved into the downhill end of the slope using a thin metal wire to simulate free-face conditions. Pocket torvane measurements of undrained shear strength from all five tests indicate an average Cu/σ’ = (0.25)OCR0.8. Average values of undrained shear strength expected near the center of the clay layers under test conditions are shown in Table 3-3.
The models were placed under a vacuum of 25 inches mercury to remove the air in the sand,
then flooded with carbon dioxide gas and placed back under vacuum. Water was dripped slowly into the evacuated model until the water level reached the desired height, which required approximately 6 to 13 hours.
For models PDS02, PDS03, SJB01 and SJB02, a sheet-aluminum rectangular cofferdam with
dimensions 25.5 x 15.5 x 6.0 cm (model scale) was pressed into the model in the location where the pile cap would be placed, and the clay inside of the rectangle was excavated. Piles were driven using a drop hammer. Each pile was driven in 5 cm at a time, and the pile cap was progressively slid down over the piles as they were driven. A plumb line and level were used to ensure that piles were driven in vertically. The pile cap was lowered into the excavation, such that it was horizontal and its top was flush with the clay surface on the uphill side. Plaster was placed to fill the gap between the pile cap and sheet-aluminum rectangular cofferdam. The

3-4
effective dimensions of the pile cap, including the sheet aluminum rectangle and plaster, were 25.5 x 15.5 x 6.0 cm in model scale.
Relative densities of sand were based on the maximum and minimum density measurements
according to ASTM D4253-83 and D4254-83. Dr values reported in Table 3-3 are based on the data by Woodward-Clyde (1997). Dr values were also obtained using data by Earth Technology Corporation (Arulmoli et al. 1991), and are presented in the data reports. The Nevada sand had a specific gravity of 2.644 (Woodward-Clyde 1997) to 2.67 (Arulmoli et al. 1991); mean grain size, D50, of 0.17; coefficient of uniformity, cu, of 1.64 and permeability of about 3.1 x 10⁻³ cm/s. The clay had a plastic limit of 35-40 and liquid limit of 88-93.
For the five tests, the shear wave velocities measured in flight were in the range 120 m/s -
170 m/s for the loose sand, 185 m/s - 270 m/s for dense sand, and 30 m/s - 120 m/s for the clay. The p-wave velocities were measured at 1-g prior to spin-up to determine the degree of saturation of the model. The average p-wave velocities in the models were in the range of 460 m/s - 800 m/s. The p-wave velocity is expected to increase during spin-up due to the increase in solubility of air into water at increased pressure. There is some uncertainty in the p-wave and shear-wave data due to the high velocities of these waves relative to the data acquisition speed that was used and reflection effects from the model boundaries.
The model piles, made of Aluminum-6061 tubing, were chosen such that the outer-diameter
and the EI values for the prototype piles would be the similar to those for some of the commonly used steel pipe piles in practice. Results of tension tests for the different tubing sizes are presented in Singh et al. (2000a). Table 3-4 presents the pile properties in model and prototype scales. The 38.1 mm and 19.05 mm diameter piles were both constructed of Al-6061-T6 grade aluminum, but the 38.1 mm pile had a higher yield stress and exhibited some strain-hardening after yield, whereas the 19.05 mm pile exhibited more elastic-perfectly-plastic behavior in the tension tests. The material for the smaller 9.53 mm diameter pile exhibited a much lower yield stress followed by highly nonlinear strain-hardening behavior.
Table 3-4: Pile Properties in Model and Prototype Scale.
Model Scale Prototype Scale
Outer Diameter
Wall Thickness
E σyielda σultimate Outer
Diameter Wall
Thickness E σyield σultimate
(mm) (mm) (GPa) (MPa) (MPa) (m) (m) (GPa) (MPa) (MPa)
38.1 1.65 68.9 297 329 1.45 0.063 68.9 297 329 19.05 0.9 68.9 216 219 0.73 0.034 68.9 216 219
9.53 0.9 68.9b 39 112 0.36 0.034 68.9b 39 112
9.53 0.9 68.9b 38 105 0.36 0.034 68.9b 38 105
Notes: a. Determined at 0.002 axial strain. b. Resolution of test data insufficient to accurately define E. A value of 68.9 GPa was used to
determine the yield stress.

3-5
3.2 Typical Experimental Results
Experimental results from the first test, PDS01, are presented herein to illustrate the types of data obtained in the centrifuge tests. Complete data sets for all tests are given in the data reports described in the following section.
The model layout for PDS01, shown in Figure 3-2, includes the approximate locations of
accelerometers, pore pressure transducers, and displacement transducers. The piles in the pile-group are called GP (Group), but are also individually named GS (Group - South pile) and GN (Group - North pile). The 0.36-m diameter pile is referred to as SP (Small-sized Pile), the 0.73-m diameter pile is called MP (Medium-sized Pile), and the 1.45-m pile is named BP (Big-sized Pile). Each of these piles was instrumented with full-bridge strain gauges to measure bending strains. The data was presented in terms of bending moments for all the piles except the 0.36-m pile (SP). SP yielded during the test, and the data for this pile is presented in terms of bending strains. Other dynamic data included the acceleration, pore pressure, and soil and pile displacement time histories. Model layouts for the other centrifuge tests, PDS02 through SJB03, are presented in Figures 3-3 through 3-6. All centrifuge tests other than PDS01 included a six-pile group of 0.73-m diameter piles.
Vertical columns of Nevada sand, dyed black, were put in the sand to record the permanent
lateral movements in sand, and the movements in the clay were recorded using vertical paper tag markers and spaghetti noodles. For tests PDS03 through SJB02, paper strips were inserted the full depth of the model using a metal guide to better define the relative movement between the clay and sand layers and the variation of strain with depth. For models PDS03 through SJB02, horizontal grid patterns were also made at different depths using dyed Nevada sand to observe the movement pattern of sand across the model container at that depth. These grids also helped in visualizing the impact of the pile-group and model container boundaries on soil movements. Similar horizontal grids of light-colored bentonite were made on the clay layers.
Time histories for all transducers during all shaking events are given in Singh et al. (2000 a),
and so only typical recordings are presented herein. Figure 3-7 shows acceleration time histories for a vertical array of accelerometers located near the center of the model container. Note that the time histories are shown for the three shaking events, PDS01_02 through PDS01_04 (Table 3-2), and that the time axis is not continuous in scale. The accelerations generally increase in amplitude from the base to the top of loose sand in all three shaking events.
Figure 3-8 shows pore pressure time histories for a vertical array of pore water pressure
transducers near the center of the container. The pore water pressures in the figure are total pore pressures. Excess pore pressure ratios, ru = ∆u/σvc′, (where σvc′ is the vertical effective consolidation stress) are commonly used for liquefaction analysis. The peak ru values generally were in the range 0.46 - 0.7 in the dense sand, and were between 0.76 and 1 in the loose sand layer. Peak ru value of about 0.5 was observed in the clay layer. The effective consolidation stress, σvc′, was obtained using the depth of the pore pressure transducers from the top of the soil before the shakes.
3-6
Figure 3-9 shows time histories of pile bending moments and pile head displacement for the MP pile, along with the clay crust displacement and base acceleration for comparison. Similar plots for GP and BP are presented in Figures 3-10 and 3-11. The transient lateral displacements of the clay layer were greater than the residual lateral displacements, and similarly the transient bending moments were greater than the residual bending moments in the piles. The peak bending moments for these piles were not significantly different in the event PDS01_04 than in the event PDS01_03, despite the further increase in lateral spreading displacement of the nonliquefied crust and an increase in the peak pile displacements. This result indicates that the full passive resistance of the crust had already been mobilized against the piles during the event PDS01_03.
Deformation patterns for the soil profile and piles were documented during excavation of the
models after testing. For example, the small diameter pile SP in PDS01 (shown in the model before shaking in Figure 3-12) yielded near the bottom of the loose sand layer, as shown by the deformed shape during excavation (Figure 3-13). In addition, the black sand columns helped quantify the localized deformation that occurred at the interface of the loose sand and overlying clay layer (Figure 3-13). This localization is attributed to the accumulation of water at the interface due to the upward seepage driven by the earthquake-induced excess pore pressures in the underlying sand (i.e., void redistribution). A recent study of void redistribution phenomena, including centrifuge tests and numerical analyses, is given in Kulasingam (2003).
Results of pseudo-static Beam on Non-linear Winkler Foundation (BNWF) type analyses are
compared to the recorded behavior of the piles in the model PDS01 in Section 5. These comparisons will include additional summaries of the recorded experimental data, including bending moment distributions, deformed pile shapes, and soil displacement profiles.
Similar data was obtained for the other centrifuge tests and archived as described below. The
pile groups had a more significant effect on the ground deformations and cracking patterns, as illustrated by the post-testing photograph in Figure 3-14. Excavation of these models showed similar localized deformations at the clay-sand interface as shown in Figure 3-15. 3.3 Archived Data Each centrifuge experiment (Tables 3-2 and 3-3) has been fully documented in centrifuge data reports that are archived and distributed through the Center for Geotechnical Modeling:
PDS01 in UCD/CGMDR-00/05 by Singh et al. (2000 a), PDS02 in UCD/CGMDR-00/06 by Singh et al. (2000 b), PDS03 in UCD/CGMDR-01/01 by Singh et al. (2001), SJB01 in UCD/CGMDR-01/02 by Brandenberg et al. (2001 a), SJB02 in UCD/CGMDR-01/06 by Brandenberg et al. (2001 b).
These data reports provide a permanent record of the experiments that enables their use by independent researchers now and in the future. The documentation includes drawings and specifications for all aspects of the experiment, full descriptions of experimental procedures, all electronic digital time histories, and a photographic history of the experiment. These data reports are publicly available at the project web page at the CGM website:
http://cgm.engr.ucdavis.edu/research/projects/pds/
where files can be downloaded or hard-copies of reports and CD’s can be ordered.
3-7
Figure 3-1: Large centrifuge (9 m radius) at CGM
North
MontereySand
Clay
Loose Sand
Dense Sand
South
1650 [63]
790 [30]
580 [22]
Dimensions: model - mm [ prototype - m ]
MP
GN
BP
SP
1.2°
GS
Figure 3-2: Schematic model layout of the first centrifuge test, PDS01

3-8
790 [30]
1650 [63]
Dimensions: model - mm [ prototype - m ]
580 [22]
North
Dense Sand
South
Loose Sand
Clay
MontereySand
AccelerometerPore PressureTransducer
LinearPotentiometer
Figure 3-3: Schematic model layout of the second centrifuge test, PDS02

3-9
1.2°
Dimensions: model - mm [ prototype - m ]
1650 [63]
790 [30]
580 [22]
North
Dense Sand
South
Loose Sand
Clay
AccelerometerPore PressureTransducer
LinearPotentiometer
Figure 3-4: Schematic model layout of the third centrifuge test, PDS03

3-10
1650 [63]
North
790 [30]
Loose Sand
Dense Sand
South
580 [22]
Clay
Dimensions: model - mm [ prototype - m ]
1.4°
AccelerometerPore PressureTransducer
LinearPotentiometer
Figure 3-5: Schematic model layout of the fourth centrifuge test, SJB01

3-11
790 [30]
1650 [63]
Dimensions: model - mm [ prototype - m ]
580 [22]
North
Dense Sand
South
Loose Sand
Clay
AccelerometerPore PressureTransducer
LinearPotentiometer
Figure 3-6: Schematic model layout of the fifth centrifuge test, SJB02

3-12
-1
0
1
1.4 m
-1
0
1
3.7 m
Shaking Reconsol.
> 30 min.
-1
0
1
4.1 m
-1
0
1
6.5 m
-1
0
1
Acc
eler
atio
n (g
)
8.4 m
-1
0
1
11.0 m
-1
0
1
15.2 m
-1
0
1
20.3 m
Shaking Reconsol.
> 30 min.
-1
0
1
Base
Depth
Shaking Reconsol.
Figure 3-7: Acceleration time histories for a vertical array of accelerometers located near the center of the model container for PDS01.

3-13
8
16
24
0.7 m
20
40
60
2.8 m
255075
Pore
Pre
ssur
e (k
N/m
2 )
4.1 m
40
80
120
6.2 m
40
80
1208.6 m
100
200
300
15.4 m
-1
0
1
Bas
e A
ccel
.
Base
Depth
Shaking Reconsol.Shaking Reconsol.
> 30 min.
Shaking Reconsol.
> 30 min.
σvc' = 12 kN/m2
σvc' = 25 kN/m2
σvc' = 34 kN/m2
σvc' = 53 kN/m2
σvc' = 74 kN/m2
σvc' = 144 kN/m2
Figure 3-8: Pore pressure time histories for a vertical array of pore water pressure transducers near the center of the model container for PDS01.
3-14
-0.8
0
0.8
Bas
eA
ccel
erat
ion
(g)
Shaking Reconsolidation ShakingShaking Reconsolidation> 30 min.> 30 min.
-2000
-1000
0
1000
2000
Mom
ent (
kN-m
)
z = 3.8 mz = 8.6 mz = 15.2 m
-1
-0.5
0
0.5
1
Dis
plac
emen
t (m
)
Free-FieldPile Head
do not remove Figure 3-9: Time histories of pile bending moments and pile head displacement for MP, along with the clay crust displacement and base acceleration for comparison. Depth (z) is measured from ground surface.
-0.8
0
0.8
Bas
eA
ccel
erat
ion
(g)
Shaking Reconsolidation ShakingShaking Reconsolidation> 30 min.> 30 min.
-2000
-1000
0
1000
2000
Mom
ent (
kN-m
)
z = 0 mz = 3.8 mz = 8.6 m
-1
-0.5
0
0.5
1
Dis
plac
emen
t (m
)
Free-FieldPile Head
do not remove Figure 3-10: Time histories of pile bending moments and pile head displacement for GP, along with the clay crust displacement and base acceleration for comparison. Depth (z) is measured from ground surface.

3-15
-0.8
0
0.8
Bas
eA
ccel
erat
ion
(g)
Shaking Reconsolidation ShakingShaking Reconsolidation> 30 min.> 30 min.
-8000
-4000
0
4000
8000
Mom
ent (
kN-m
)
z = 3.8 mz = 8.6 mz = 15.2 m
-1
-0.5
0
0.5
1D
ispl
acem
ent (
m)
Free-FieldPile Head
do not remove
Figure 3-11: Time histories of pile bending moments and pile head displacement for BP, along with the clay crust displacement and base acceleration for comparison. Depth (z) is measured from ground surface.

3-16
Figure 3-12: Photograph of PDS01 before testing showing small and large diameter piles near the channel at the downstream toe (The channel exposes the darker colored clay,
while the above-water ground surface has a thin layer of protective sand on it.)
Clay
Loose Sand
Dense Sand
Figure 3-13: Excavation photos from PDS01 showing the yielded small-diameter pile and
the localized deformation at the interface between the loose sand and clay layers.

3-17
Figure 3-14: Pile group in SJB01 after centrifuge testing with instrumentation and wiring removed, showing the ground’s cracking pattern from spreading toward the channel (at the bottom of photograph).
Figure 3-15: Excavation of SJB02 showing the strong localized deformation at the interface between the loose sand and overlying clay layer (paper markers highlighted for clarity). Note that the clay is dark and the horizontal black seam in the sand is a colored marker separating the loose and dense layers.
Den
sesa
ndLo
ose
sand
Cla
yC
rust

4-1
4. BACK-CALCULATION OF SOIL-PILE INTERACTION BEHAVIOR 4.1 Methodology Back-calculation of the load-transfer or subgrade reaction behavior between the piles and laterally spreading ground provides a clearer expression of the mechanisms of soil-pile interaction than can be obtained from studying the raw recorded data alone. In this study, the back-calculation procedures developed by Wilson et al. (1998, 2000) as part of a prior Caltrans-funded project were used to study the soil-pile interaction observed in the different centrifuge experiments. First, the methods used to process and analyze the data are discussed. Results, both raw and processed data, are then presented for three of the centrifuge tests to illustrate key observations, and then the overall findings are summarized. Soil pile (p-y) interaction
The seismic p-y behavior can be back-calculated using the recorded bending moment
distribution M(z) along a pile using simple beam theory according to the equations:
( )zMdzdp 2
2
= (4-1)
)()(2
2
zzydzd
pile φ= (4-2)
where p is the lateral reaction on the pile, ypile is the lateral displacement of the pile, EI is the flexural rigidity of the model pile, M(z) is the moment at depth z, φ(z) is the curvature of the pile at depth z, and z is the vertical distance along the pile. M(z) = EI*φ(z) for linear elastic pile response. Note that the displacement of the soil (ysoil) must be obtained separately to calculate the relative displacement between the soil and pile (y = ysoil - ypile).
The distribution of lateral resistance (p) was obtained by double differentiating the bending
moment distribution with respect to depth at each time step of an event. Discrete numerical differentiation can be very sensitive to relatively small errors in the moment distribution, and tends to amplify high frequency noise in discretely sampled data. Hence the method of differentiation, and careful signal processing are important considerations. Wilson (1998) evaluated the various methods used to double differentiate bending moment distributions, and subsequently developed a weighted-residual technique that had certain advantages over more traditional approaches. That weighted-residual technique was used in this study. Wilson (1998) also developed signal processing techniques (e.g. filtering, base line corrections) specific to the instrumentation that was used, which provided the basis for signal processing in this study.
Total and relative displacements
Relative displacement time histories (y) were difficult to define from the experiments in this study because of the lateral spreading component of soil displacements and the localization of shear deformations at the interface of the liquefied sand and overlying clay layer. In principal,

4-2
the relative displacement (y) is obtained as the difference between the pile displacement (ypile) and free-field soil displacement (ysoil). The pile displacement can be obtained using the measured displacements of the pile above the ground surface (i.e., from displacement transducers, which give displacement of the pile relative to the top ring of the container), measured displacements of the container rings relative to the container base, and double-integration of the bending moment distribution along the pile length. The free-field soil displacements were more difficult to define accurately over time for three reasons. First, the transducers for measuring the lateral displacement of the soil crust were affected by rotations of the anchor plates in the soil and other complications that introduced errors in the definition of the soil crust displacement time history. Double integration of accelerometers provided good definition of transient displacements during shaking, but cannot define the permanent displacements associated with lateral spreading (which have frequency content below the frequency range of the accelerometers). Finally, the timing of the localized deformation at the interface between the liquefied soil and clay crust is unknown, and this introduces a serious uncertainty in trying to define the lateral displacement (ysoil) time history at various depths in the soil profile. Despite these uncertainties, it is possible to define the final soil displacements based on the excavated soil profile and then evaluate various possible relations for proportioning the localized deformations over the time of shaking. Several such methods were evaluated with the conclusion that it is possible to approximately define the soil displacement profile at various times, such that the total relative displacements could be reasonably represented in snapshots (single instances in time) of the soil and pile displaced shapes. However, defining the cyclic p-y behavior requires accuracy in the incremental amounts of relative displacement, and this aspect of behavior was much more strongly affected by the various assumptions involved. Hence, results are only presented for p, and not y, time histories, along with some snapshots of the displaced shapes.
Displacement of the clay crust also varied with distance from the toe of the slope, with lateral displacements generally decreasing with increasing distance from the toe. This pattern of ground deformation was observed in all centrifuge tests and was expected. However, the ground displacements near the six-pile groups were also clearly affected by the presence of the pile group. These complications make it difficult to define a true “free-field” soil displacement at the position of the pile group, but the general observations are not affected by this uncertainty. For the snapshots of soil and pile displaced shapes, the “free-field” soil displacements at the location of the pile group were therefore interpolated from measurements located upslope and downslope of the pile group. Measured loads on pile cap
For the pile groups, the back-calculation of load transfer mechanisms had to consider the loads imposed on the pile cap from the clay layer and the inertial load of the cap itself. Figure 4-1 shows a free body diagram of the pile cap, and includes the following:
Pp: passive force on the back of the pile cap W: weight of the pile cap KhW: horizontal inertia of the pile cap KvW: vertical inertia of the pile cap F1: horizontal friction between the sides of the pile cap and the clay crust

4-3
F2: vertical friction between the back of the pile cap and the clay crust F3: vertical friction between the sides of the pile cap and the clay crust F4: horizontal friction between the base of the pile cap and the clay crust 2Vs, 2Vc, 2Vn: Shear in the south piles (2Vs), shear in the center piles (2Vc), and shear in
the north piles (2Vn). The shears are multiplied by 2 because the pile group is 2x3. e.g. (2Vs) is the shear in the southeast pile plus the shear in the southwest pile.
2Ms, 2Mc, 2Mn: Moment in the south piles (2Ms), moment in the center piles (2Mc), and moment in the north piles (2Mn). The moments are multiplied by 2 because the pile group is 2x3. e.g. (2Ms) is the moment in the southeast pile plus the moment in the southwest pile.
2Qs, 2Qc, 2Qn: Axial load in the south piles (2Qs), axial load in the center piles (2Qc), and axial load in the north piles (2Qn). The axial loads are multiplied by 2 because the pile group is 2x3. e.g. (2Qs) is the axial load in the southeast pile plus the axial load in the southwest pile.
2Ps, 2Pc, 2Pn: Lateral load on the south piles (2Ps), lateral load on the center piles (2Pc), and lateral load on the north piles (2Pn). The lateral loads are multiplied by 2 because the pile group is 2x3. e.g. (2Ps) is the lateral load on the southeast pile plus the lateral load on the southwest pile.
Jα: rotational inertia of pile cap The total lateral load imposed on the pile cap was measured using Wheatstone full bridge
strain gages located on the piles near the interface between the clay and the loose sand, which is near the bottom of the pile segments shown in Figure 4-1. Hence, the shear gauges provide an estimate of the load imposed on the pile group by the clay crust. The shear gages were located on the south-west, center-east and north-west piles, but not on the south-east, center-west or north-east piles. The shear in the south-west pile was assumed to be the same as the shear in the south-east pile; and the same procedure was used for the center and north piles, and for the moment and axial load recordings. The total lateral load was taken as the sum of the individual components V = 2Vs + 2Vc + 2Vn. This calculation includes the influences of passive loading on the cap (Pp), horizontal friction between the sides of the cap and the soil (F1), horizontal friction between the base of the cap and the soil (F4), pile cap inertia (KhW), and the load imposed on the pile segments between the shear gages and the bottom of the pile cap (2Ps + 2Pc + 2Pn). It is desirable to calculate the load imposed on the pile cap by soil alone, without the influence of cap inertia, to facilitate comparison with common methodologies for calculating soil loads. Thus, the lateral soil load on the pile cap, excluding the contribution from inertia, was calculated using the following equation:
WKVF hp ⋅−= (4-3)
The resulting quantity represents the load imposed on the pile cap from lateral earth pressure
upslope of the cap, friction between the sides of the cap and the clay, friction between the bottom of the cap and the clay, and loads on the pile segments between the bottom of the pile cap and the shear gauges.

4-4
ncxpp PPPFFPF 22241 +++++= (4-4) Ideally, the p-histories in the clay layer could be used to estimate the loads on the pile
segments between the bottom of the pile cap and the shear strain gauges. However, the number of strain gauges was insufficient to obtain accurate second derivatives for the pile groups studied in this report. In a more recent test, SJB03 (Brandenberg et al. 2003), which is not discussed in this report, a heavily instrumented pile was constructed for the purpose of obtaining accurate derivatives and second derivatives. The more accurate p-histories from SJB03 were used to estimate the loads that were imposed on the pile segments for PDS03 and SJB01. At the time of peak moment, the lateral load on the pile segments for SJB03 were used to estimate a bearing factor according to the equation
bcpN
up ⋅
= (4-5)
For SJB03, cu = 44 kPa and b = 1.17 m. The subgrade reaction at the time of peak moment
was found to be p ≈ 400 kN/m. Hence, the bearing factor was found to be Np ≈ 8. This bearing factor can be compared to Np calculated using Matlock’s equation for single piles in clay, given in equation 4-6,
bxJ
cN v
p ⋅++='
3σ
for x < xcr (4-6)
9=pN for x ≥ xcr (4-7)
where: Np = bearing factor σv' = vertical effective stressis vertical effective stress c = undrained shear strength J = empirical constant (Matlock found J = 0.5 for soft clay; J = 0.25 for medium clay) x = depth b = pile diameter Equation 4-6 corresponds to a wedge-type failure mechanism in which the passive failure mass in front of the pile moves upward. Equation 4-7 corresponds to a plane-strain type failure mechanism in which vertical strain does not occur due to the large overburden stress from the overlying soil. The critical depth, xcr, can be found by equating (4-6) and (4-7), and solving for x, and marks the transition depth from the wedge-type failure mechanism to plane-strain. For the pile in SJB03 near the center of the clay layer, σv' = 32 kPa, c = 44 kPa, x = 2 m, b = 1.17 m, and J was assumed to be 0.5. Using equation 4-6, Np = 4.6, which implies that the wedge-type failure mechanism controls the ultimate subgrade reaction load.
The bearing factor observed from the p-histories from test SJB03 (Np ≈ 8) was larger than the bearing factor predicted by Matlock’s equation, which can be attributed to the influence of the pile cap on the failure mechanism in the clay layer. The pile cap was embedded into the clay

4-5
layer such that the base of the cap made contact with the clay during installation, and contact was observed after the tests when the models were dissected. Therefore, it is reasonable to assume that the clay was in contact with the base of the pile cap during shaking as well. As the clay spread laterally around the piles, the pile cap likely provided some vertical restraint that did not permit the wedge-type mechanism to occur. However, the pile cap was not a rigid boundary, and rotation of the pile cap likely permitted some vertical strain in the underlying clay. Hence, the failure mechanism during lateral spreading lies between the plane-strain failure mechanism and the wedge-type mechanism. It is reasonable to assume that the same failure mechanism occurred during the other centrifuge tests with the large embedded pile cap, so Np = 8 was used to estimate the loads on the pile segments for PDS03 and SJB01.
Note that active pressure down-slope of the pile cap has been neglected because the soil
displacement was large enough to leave a gap between the down-slope side of the cap and the soil. The inertia load of the pile cap was calculated from the recorded acceleration of the pile cap for test SJB01, but the cap acceleration was not recorded for test PDS03 so an estimate of the pile cap inertia at the time of peak shear load was made.
In addition to the measurement of shear taken directly from the shear strain gages, the total
shear could be estimated using elastic beam theory in conjunction with the moment gauge recordings. The slope of the moment distribution is equivalent to the shear distribution:
dzzdMzV )()( = (4-8)
Where V(z) is the shear distribution, M(z) is the moment distribution, and z is the depth along the pile. By differentiating the moment distribution at every time step, the time history of shear can be obtained at a number of depths along the piles. For centrifuge tests PDS03 and SJB01 discussed in this report, the number of moment gages on the piles in the clay layer was insufficient to obtain reasonable shear time histories by differentiation of the moment distributions. However, a more recent test, SJB03 (Brandenberg et al., 2003) included a pile that was densely instrumented with moment gages. The purpose of the dense instrumentation was to produce high quality derivatives and second derivatives of the moment distribution. Figure 4-2 shows a comparison between the shear time history obtained directly from readings from the shear gages, and the shear time history obtained by differentiating the moment distribution for SJB03. The close agreement between the two shear time histories validates the accuracy of the shear gages and the accuracy of the numerical differentiation technique.
Earth pressure theories
It is convenient to now explain the theories used to calculate the expected passive loads and friction loads that will be later compared to the loads measured in the centrifuge tests. Coulomb passive earth theory and a modification of Coulomb passive earth theory that includes inertia of the failure wedge were used to calculate the loading exerted on the back of the pile cap. The Coulomb analysis includes friction and normal forces on the failure wedge exerted by the back of the pile cap, the weight of the failure mass, and the shear and normal forces exerted on the

4-6
failure plane. A free body diagram of the forces on the failure mass and the corresponding force vector polygon are shown in Figure 4-3.
To account for the influence of the inertia of the failure mass on the magnitude of the passive
resistance in granular soil, Okabe (1926) and Mononobe and Matsuo (1929) have suggested adding a horizontal force vector into the equations of equilibrium for the Coulomb formulation. The same procedure may be implemented for cohesive backfills as well. A free body diagram of the forces on the failure mass, including the horizontal inertia of the failure mass, is shown in Figure 4-4. The force polygon that expresses the condition of equilibrium is shown as well. The force vector polygon graphical formulation is algebraically equivalent to the following equation:
,)sin(
)cos()90sin(2)sin(
)cos()90sin(
)sin()sin()90sin(
)sin()cos()90sin(
2)tan()(
2
2
βθθβγ
βθθβ
βθθβα
βθθβγθθ
−⋅+
⋅⋅
⋅+−
⋅+⋅⋅+
⎥⎦
⎤⎢⎣
⎡−
⋅+⋅⋅+⋅⋅+
−⋅+
⋅⋅
⋅=
HkCH
CHCHHP
hu
uu
(4-9)
where:
P(θ) = Passive load per unit width associated with failure surface angle, θ θ = angle of failure surface from horizontal γ = unit weight of soil H = pile cap height β = inclination of backfill from horizontal α = friction coefficient for contact between clay and pile cap cu = undrained shear strength of clay kh = horizontal acceleration of the failure mass in g
If kh = 0, the equation is equivalent to the standard Coulomb analysis represented in Figure 4-1. The passive resistance is presented as a function of θ because different failure angles will produce different passive forces. The failure angle associated with the smallest passive force is the critical failure angle that controls the analysis. Therefore, the failure angle, θ, must be varied until the minimum passive resistance, P(θ), is calculated. The minimum passive resistance is presented in units of force/width. Therefore, the passive force exerted on the pile cap is equal to b·P(θ), where b is the width of the pile cap. If the pile cap width is not large relative to the pile cap thickness, then an additional adjustment for 3D effects may be necessary. (Mokwa and Duncan, 2000). 4.2 Single Piles in PDS01
The layout of experiment PDS01, as shown in Figure 4-5, included three different single
piles and one two-pile group. As described previously, the models consisted of a nonliquefiable crust overlying loose Nevada sand overlying dense Nevada sand. The nonliquefiable crust and loose sand layers sloped gently toward an open channel at the downslope end of the models. The sign convention for representing displacements, lateral loads, and bending moments is shown in Figure 4-6. In particular, note that displacement and lateral load (p) are positive in the down-slope direction.

4-7
P-histories from the large-diameter single pile (BP) and the upslope pile (GN) of the pile group are shown in Figures 4-7 and 4-8. Numerical differentiation of discrete data is susceptible to errors under certain conditions, which poses some limitations that must be considered when interpreting the p-histories. Errors in the p-histories can be expected at the boundary locations (i.e. at the p-histories nearest to the pile head and nearest to the pile tip), and at locations where the depth profile of p changes abruptly (i.e. at layer interfaces). Boundary errors should be expected for p-histories numbered 1 and 9 for BP, and 1 and 12 for GN. Layer interface errors should be expected for p-histories numbered 2 and 3 for BP, and 3 and 4 for GN, because a sharp variation in p is expected at the interface between the clay and loose sand due to the displacement discontinuity across the interface. Errors are most likely to influence the magnitude of the p-histories, while the phasing and direction during large loading cycles are less prone to error. Erroneous drift of the p-histories may occur between shakes due to relatively small drift in the moment gages. Time histories from the large diameter pile, BP (1.45-m diameter), during three shaking events are shown in Figures 4-9 to 4-11. Each figure includes time histories for: • Pile bending moment 9.5 m below the ground surface, which is near the interface between
the dense sand and loose sand, where the largest moments were recorded. • Subgrade reaction (p) 2.4 m below the ground surface, which is in the middle of the clay
layer. • Subgrade reaction (p) 6.2 m below the ground surface, which is near the middle of the
liquefying loose sand layer. • Excess pore pressure ratio (ru) 6.2 m below the ground surface, which is also near the middle
of the liquefying loose sand layer. • Lateral displacements of the pile at the ground surface, and of the ground surface relative to
the model container base. • Acceleration of the container base.
The three shaking events were conducted in series allowing ample time for consolidation of the soil layers between shakes. The input base motions were scaled versions of the ground motion recorded at 83-m depth at Port Island in the 1995 Kobe earthquake. Solid triangles identify the time at which the peak bending moment occurred in the pile, while open triangles identify the time at which the peak pile head displacement occurred.
The first (“small Kobe”) earthquake produced only small ground displacements with a peak
transient value of about 0.10 m and a permanent value of about 0.02 m, both consistent with relatively modest ru values (about 25% at 6.2 m depth). Bending moments and p values were all small compared to the values observed in the following stronger shakes. The following observations are made from these time histories. • The peak bending moment for the pile occurred at about t ≈ 7 s. This peak bending moment
coincided with the following: o The ru in the loose sand transiently dipped to a local minimum of about 5%, despite
having been up to about 14% immediately before; o The maximum p occurred in the clay, and acted down-slope (positive p);

4-8
o A local maximum in |p| in the loose sand, which acted upslope (negative p). o The transient movement of the clay crust was at its peak; and o The transient movement of the pile was at its peak.
• The loading imposed on the pile by the clay is generally out of phase with the loading imposed on the pile by the loose sand. The loose sand provides resistance to the pile rather than loading the pile in the same direction as the clay. This observation accords well with the relatively small peak ru value observed during the small Kobe earthquake because relatively small free-field soil strains would be expected in the loose sand layer.
The second (“first large Kobe”) earthquake produced ground displacements with a peak
transient value of about 0.5 m and a permanent value of about 0.25 m, both consistent with ru values of almost 100% in the loose sand. The following observations are made from these time histories. • The peak bending moment for the pile occurred at about t ≈ 12 s. This peak bending moment
coincided with the following: o The ru in the loose sand transiently dipped to a local minimum of about 35%, despite
having been up to about 75% immediately beforehand; o A local maximum p occurred in the clay, and acted down-slope (positive p); o A local maximum p occurred in the loose sand, and acted down-slope (positive p); o The transient movement of the clay crust was approaching a local maximum; and o The transient movement of the pile was near a local maximum.
• The peak p values at 2.4 m depth in the clay layer were about 110 kN/m, which is less than the value of 155 kN/m (about 70%) predicted using the equations for monotonic pult values by Matlock (1970) [with cu = 20 kPa and Np = 5.3 with b=1.45 m].
• The loading imposed on the pile by the clay is generally in phase with the loading imposed on the pile by the loose sand. The loose sand provides kinematic loading to the pile rather than resisting the loads imposed by the clay. This behavior is different than the behavior observed during the small Kobe motion. This observation accords well with the high peak ru value observed during the earthquake because relatively large free-field soil strains would be expected.
The third (“second large Kobe”) earthquake produced results that are similar to the second
earthquake. However, one difference in the behavior observed in the two shakes is that the peak moment and peak pile displacements occurred earlier in the third shake (t ≈ 6 s) compared to the second shake (t ≈ 12 s). Time histories from the upslope pile of the pile group, GN (0.73-m diameter), during three shaking events are shown in Figures 4-12 to 4-14. Each figure includes time histories for: • Pile bending moment at the ground surface, which is slightly below the pile cap connection,
where the largest moments were recorded. • Subgrade reaction (p) 1.9 m below the ground surface, which is in the middle of the clay
layer. • Subgrade reaction (p) 6.2 m below the ground surface, which is near the middle of the
liquefying loose sand layer. • Excess pore pressure ratio (ru) 6.2 m below the ground surface, which is also near the middle
of the liquefying loose sand layer.

4-9
• Lateral displacements of the pile cap and the ground surface relative to the model container base.
• Acceleration of the container base. The first (“small Kobe”) earthquake produced only small ground displacements, with a peak
transient value of about 0.10 m and a permanent value of about 0.02 m, both consistent with relatively modest ru values (about 25% at 6.2 m depth). Bending moments and p values were all small compared to the values observed in the following stronger earthquakes.
The second (“first large Kobe”) earthquake produced ground displacements with a peak
transient value of about 0.5 m and a permanent value of about 0.25 m, both consistent with ru values of almost 100% in the loose sand. The following observations are made from these time histories. • The peak bending moment for the pile occurred at about t ≈ 12 s. This peak bending moment
coincided with the following: o The ru in the loose sand transiently dipped to a local minimum of about 35%, despite
having been up to about 75% immediately beforehand; o A local maximum p occurred in the clay, and acted down-slope (positive p); o The |p| in the loose sand was small, and acted upslope (negative p). o The transient movement of the clay crust was at its peak; and o The transient movement of the pile cap was at its peak.
• The peak p values at 1.9 m depth in the clay layer were about 80 kN/m, which agrees reasonably well with the value of 88 kN/m predicted using the equations for monotonic pult values by Matlock (1970) [with cu = 20 kPa and Np = 6 with b=0.73 m].
• The peak p values at 6.2 m depth (in the loose sand) during strong shaking all coincided with transient drops in the ru in the loose sand (i.e., when pore pressures in the loose sand were decreasing due to the sand’s dilatant tendency under this incremental loading condition). The third (“second large Kobe”) earthquake produced peak transient ground displacements of
about 0.7 m and permanent ground displacements of about 0.62 m, which again were accompanied by peak ru values of almost 100%. The following observations are made from these time histories. • The peak bending moment for the pile occurred at about t ≈ 5.5 s. This peak bending
moment coincided with the following: o The ru in the loose sand transiently dipped below about –25% after a slight initial increase
to about 15%. o A local maximum p occurred in the clay, and acted down-slope (positive p); o The |p| in the loose sand reached its peak, and acted upslope (negative p). o The transient movement of the clay crust was at a local maximum; and o The relative displacement between the clay crust and the pile cap was near its peak for
the event. • The peak displacement of the pile cap occurred about two cycles of ground surface
displacement later than when the peak bending moment occurred. The inter-relations between some of the responses during this third shaking event are
illustrated in Figure 4-15.

4-10
• The p values in the clay crust and the loose liquefied sand are correlated to each other but with generally opposing signs; down-slope loads from the clay crust are almost always associated with upslope resistances from the loose sand layer, and visa versa.
• The ru versus p (in loose sand) plot resembles a q-p′ plot for undrained cyclic stress-controlled loading of saturated sand. The highest ru values in the free field are associated with small |p| values in the loose sand, whereas transient dips in ru (phase transformation) are associated with the peak |p| values in the loose sand. Snapshots of the deformed shape and bending moments for the large-diameter pile BP and
the upslope pile in the two-pile group GN are shown in Figures 4-16 and 4-17, respectively. Included on these plots is the final deformed shape of the soil profile. The lateral displacement of BP was relatively small such that the clay crust and the majority of the loose sand layer spread downslope around the pile; i.e., the relative displacement y was positive throughout these depths. Nonetheless, the time histories clearly show that p (in the clay and sand) was cycling in magnitude and direction during shaking, which simply reflects the fact that the direction of p is also dependent on the direction of the incremental relative displacement, not just the total relative displacement. For GN, the lateral pile displacements were relatively large and thus y is negative throughout most of loose sand layer. Nonetheless, the time histories again show p cycling in response to the cycling incremental relative displacements. 4.3 Six-Pile Group in PDS03
The layout of experiment PDS03, as shown in Figure 4-18, involved a single group of six
piles, connected by a pile cap embedded within the clay layer. As before, the soil profile consisted of a nonliquefiable crust overlying a liquefiable layer of loose Nevada sand overlying nonliquefiable dense Nevada sand. The nonliquefiable crust and liquefiable layers sloped gently toward an open channel at the downslope end of the models.
Time histories are shown for four shaking events in Figures 4-19, 4-20, 4-21, and 4-22. Each figure includes time histories for: • Bending moment on the upslope corner (southeast) pile at 2.7 m below ground surface,
which is near the pile head’s connection to the pile cap, where the largest moments were recorded.
• Lateral load on the pile group from the clay crust. • Lateral loads (p) 6.7 m below the ground surface, which is near the middle of the liquefying
loose sand layer. • Excess pore pressure ratio (ru) 6.5 m below the ground surface, which is also near the middle
of the liquefying loose sand layer. • Lateral displacements of the pile cap and ground surface relative to the model container base. • Acceleration of the container base.
The four shaking events were conducted in series allowing ample time for consolidation of
the soil layers between shakes. The input base motions for the first three events were progressively stronger scaled versions of the ground motion recorded at Santa Cruz in the 1989 Loma Prieta earthquake, while the fourth event was a large Kobe motion. Solid triangles identify

4-11
the time at which the peak bending moment occurred in the pile, while open triangles identify the time at which the peak pile head displacement occurred.
The first (“small Santa Cruz”) earthquake produced only small ground displacements, with a
peak transient value of about 4 cm and a permanent value of about 1 cm, both consistent with relative modest ru values (about 30% at 6.5 m depth). Bending moments and p values were all small compared to the values observed in the following stronger earthquakes.
The second (“medium Santa Cruz”) earthquake produced ground displacements that reached
their maximum value of about 0.3 m near the end of shaking, with peak ru values of only about 75% in the middle of the loose sand (higher ru values developed at the top of the loose sand layer). The pile cap was displaced about 0.1 m at the end of shaking, so the ground surface moved about 0.2 m relative to the pile cap. The peak lateral load from the clay crust was about 1100 kN, which is well below expected loads for passive conditions (as discussed below).
The third (“large Santa Cruz”) earthquake produced ground displacements that reached their
maximum value of about 2.0 m near the end of shaking, with peak ru values of about 100% in the loose sand. The pile cap was displaced almost 0.4 m by the end of shaking, so the ground surface moved about 1.6 m relative to the pile cap. The peak lateral load from the clay crust was now about 2700 kN, which is more than double that observed in the previous earthquake. The pile bending moments were similarly increased.
The following observations are made from the time histories for the large Santa Cruz
earthquake. • The peak bending moment for the pile occurred at the pile cap connection at about t ≈ 18 s.
This peak bending moment coincided with: o The ru in the loose sand transiently dipped to a local minimum less than 40%, despite
having been up to 100% immediately beforehand; o The peak lateral load from the clay crust occurred, and acted down-slope (positive); o A local peak occurred in the |p| for the loose sand, and it acted up-slope (negative p).
• The peak lateral load from the clay crust is enveloped using Coulomb passive earth theory, plus consideration of friction loading on the sides and base of the pile cap (Table 4-1).
• The lateral displacement of the pile cap peaked just after the peak pile bending moment occurred. The slight increase in pile cap displacement between these two times was accompanied by ru values in the loose sand increasing back close to 100% and the p values in the loose sand changing from an upslope to down-slope direction, which would both logically contribute to larger pile displacements. At the same time, there was a reduction in the lateral load from the clay crust that was clearly a compensating factor. The fourth event was a “large Kobe” motion, which produced ground displacements that
reached their maximum value of about 3.5 m near the end of shaking, with peak ru values of about 100% in the loose sand. The pile cap displacement increased to about 0.6 m by the end of shaking, so the ground surface moved about 2.9 m relative to the pile cap. The peak lateral load from the clay crust was now about 3600 kN, which is about 45% larger than observed in the previous large Santa Cruz motion. However, the peak pile bending moment was about 2200 kNm, which is only about 10% larger than observed in the previous large Santa Cruz motion.

4-12
The inter-relations between some of the responses during the large Santa Cruz and large
Kobe earthquakes are illustrated in Figure 4-23 and 4-24. • The lateral load from the clay crust, and the p value in the loose liquefied sand are related
with opposing signs; Down-slope loads from the clay crust are almost always associated with upslope resistances from the loose sand layer, and visa versa.
• The ru versus p (in loose sand) plot is more complicated than previously observed for the single pile example. The largest peak p value did coincide with a transient dip in the free field ru, but there were a couple cycles in which the ru value drops to a transient local minimum while the magnitude of p in the loose sand remains small. The mechanisms controlling this behavior are not entirely understood, but one factor worth noting is that the magnitude and direction of p in the liquefied sand are related to the ru in the liquefied sand, and also to the incremental, cyclic relative displacement between the loose sand relative and the piles. Snapshots of the deformed shape and bending moments for the upslope corner pile and the
soil deformation profile are shown in Figure 4-25. The lateral pile displacements are smaller than the soil displacements in the clay crust and throughout most of the loose sand layer. As previously noted, the time histories clearly show that p cycling in response to the cycling incremental relative displacement, with the direction of p not necessary following the total relative displacement at all times.
The peak lateral load imposed on the pile group from the clay crust was estimated at 3650 kN
from shear gauge measurements, as previously described in the section on methodology. The pile cap acceleration was not measured for PDS03, but analyses of the recordings on other pile groups, as described in a following section, suggest that the pile cap acceleration might be about 0.17 g at the time of peak shear loading on the pile cap. The pile cap inertia at 0.17 g acceleration is 630 kN. This suggests that the lateral load from the clay alone might be about 3020 kN.
Predictions of the peak lateral load imposed on the pile cap using common methodologies
have been performed, and are summarized in Table 4-1. The undrained shear strength of the clay was determined from vane shear measurements and T-bar measurements during the centrifuge test. Both methods were conducted at a slow load rate relative to the load rate that occurred during shaking. Numerous laboratory tests have indicated that the undrained shear strength of clay soil increases with load rate such that a factor of 10 increase in load rate produces a 10% increase in the clay strength. It is reasonable to assume that the load rate during shaking was about 10 times higher than the load rate during the vane shear and T-bar tests. Therefore, the undrained shear strength has been increased from cu = 20 kPa to cu = 22 kPa for the passive force analysis.

4-13
Example Calculation An example calculation for Case 2c has been provided to clarify the procedure for calculating the total lateral load expected for a pile cap in lateral spreading cohesive soil. Equation 4-3 was used with the following input parameters: H = 2.2 m Height of pile cap b = 5.7 m Width of pile cap L = 9.2 m Length of pile cap β = 4.4o Angle of inclination of clay surface cu = 22 kPa Undrained shear strength (corrected for load rate) α = 0.6 Coefficient of adhesion between clay and pile cap γ = 15.5 kN/m3 Unit weight of clay kh = 0.2 g Seismic coefficient Lpiles = 1.0 m Length of pile segments between bottom of pile cap and shear gauges The angle of inclination of the failure surface was varied, and P(θ) was calculated using Equation 4-3, and θ was varied from 10o to 80o. Figure 4-26 shows how P(θ) varies with θ for a number of different input parameter cases, including the case with the example input parameters shown above. The minimum P(θ) was selected, which occurred at a critical failure surface angle, θ = 43o, and the associated passive resistance was Pmin = 188.5 kN/m. The passive load was then calculated by multiplying by the pile cap width:
kNmkNmPbPp 1075)/5.188()7.5(min =⋅=⋅= (4-10) The friction on the side of the pile cap was calculated using the following equation:
sidesu ACF ⋅⋅= α1 (4-11) Where α = 0.6, cu = 22 kPa, and Asides = 38.9 m2. Asides is the area of the pile cap that contacts the clay on both the east and west sides of the pile cap. The resulting friction on the sides of the pile cap is:
kNmkPaF 514)9.38()22()6.0( 21 =⋅⋅= (4-12)
The friction on the base of the pile cap was calculated using the following equation:
baseu ACF ⋅⋅= α4 (4-13) Where α = 0.6, cu = 22 kPa, and Abase = 51.7 m2. Abase is the area of the pile cap that contacts the clay beneath the pile cap and is equal to bL – 6πb2/4 = 54.2 m2 – 2.5 m2. The resulting friction on the base of the pile cap is:
kNmkPaF 682)7.51()22()6.0( 24 =⋅⋅= (4-14)

4-14
The lateral loads on the pile segments between the bottom of the pile cap and the shear gauges can be estimated using the bearing factor observed from test SJB03, Np = 8. There were six piles, and the length of the pile segments between the bottom of the pile cap and the shear gages was 1.0 m.
kNmmkPaFpiles 771)0.1()73.0()22()8()6( =⋅⋅⋅⋅= (4-15) Finally, the total load imposed on the pile group from the nonliquefied crust is the sum of the four components:
kNkNkNkNkNFFFPF pilespp 3042771682514107541 =+++=+++= (4-16) Table 4-1. Predicted lateral loads from the soil on the pile cap for PDS03. The estimated
peak lateral load was about 3020 kN. Case Seismic
Coefficient, kh (g) a
Adhesion Coefficient
Passive Load (kN)
Side Friction
(kN)
Bottom Friction
(kN)
Piles Force (kN)
Total Lateral Load (kN)
α b Pp F1 F4 Fpiles Fp c
1a 0.0 0.0 874 0 0 771 1645 1b 0.0 0.3 941 257 341 771 2310 1c 0.0 0.6 1019 514 682 771 2986 1d 0.0 1.0 1143 856 1136 771 3906 2a 0.2 0.0 918 0 0 771 1689 2b 0.2 0.3 991 257 341 771 2360 2c 0.2 0.6 1075 514 682 771 3042 2d 0.2 1.0 1205 856 1136 771 3968
(a) The acceleration of the passive wedge was assumed to be 0.2g. (b) The range in the adhesion coefficient selected for analysis reflects the scatter in the published data for
adhesion coefficients for piles in cohesive soils. (c) The total lateral load consists of the passive load, and friction between the clay and sides and bottom of the
pile cap. Active pressure downslope of the pile cap has been ignored.
Comparing Recorded Lateral Loads to Theoretical Calculations
Comparing the recorded and theoretical lateral loads summarized in Table 4-1 leads to
several observations. • Friction between the clay and the sides and bottom of the cap must be considered to obtain
reasonably accurate results for these tests. Considering the components of loading imposed on the pile cap (Pp, F1 and F4) for case 2c, which produced the closest match with the measured data, the passive force contributed only 47% of the cap loading. Side friction contributed 23% and base friction contributed 30%. Failure to consider friction forces in these tests would result in a significant under-estimate of the loads imposed on the pile cap.

4-15
• An adhesion coefficient equal to about α = 0.6 would produce the best prediction of the total lateral load exerted on the pile cap for this case. This value of α is near the bottom range of the data in the correlation between α and cu developed for calculating the axial friction capacity of piles in cohesive soils as seen in Figure 4-27 (Terzaghi et al. 1996).
• Including a seismic coefficient of 0.2 g had a small effect on the calculated passive load for these tests. Figure 4-26b illustrates that the calculated passive load is not very sensitive to the selection of the seismic coefficient for these calculations.
Verification of Friction on the Bottom of the Pile Cap
Friction on the bottom of the pile cap occurred during the centrifuge test based on several
physical observations. During pile group installation, the pile cap was lowered onto the clay surface such that good contact was made between the clay and the bottom of the pile cap. This contact could have been lost during spin up due to settlement of the clay, but contact was observed after the simulated earthquakes when the model was dissected. During lateral spreading, the clay soil might wedge itself between the bottom of the pile cap and the loose sand, thereby contacting the bottom of the pile cap even in cases where a gap existed prior to lateral spreading.
Analytical predictions of the measured loads on the pile cap also indicate that there was some
friction between the bottom of the pile cap and the clay. Support for the claim that a friction force was exerted on the bottom of the pile cap can be obtained by assuming that there was no friction, calculating the loads on the cap, and comparing with the peak measured load. Assuming a gap existed beneath the pile cap, the the loading mechanism on the pile segments between the bottom of the cap and the shear gages would be controlled by the wedge-type mechanism, so it’s reasonable to assume Np = 5.7, calculated using equation 4-6 for σv' = 30 kPa, cu = 22 kPa, J = 0.5, x = 2m, and b = 0.73m. Hence, the loading imposed on the pile segments would be
kNmmkPaFpiles 549)0.1()73.0()22()7.5()6( =⋅⋅⋅⋅= (4-17)
Assuming α = 1 for the calculation of passive pressure, and for friction on the sides of the cap, and that kh = 0.2g, which corresponds to case 2d in Table 4-1 that produced the largest passive load and side friction combination, the following values were calculated: Pp = 1205 kN F1 = 856 kN The resulting estimated total load is equal to the sum of the three components:
kNkNkNkNFp 26105498561205 =++= (4-18) which is significantly less than the peak crust load (3020 kN). The measured load can’t be reasonably predicted without the contribution of base friction.

4-16
In practice, the question of whether to include friction along the bottom of the pile cap will depend on whether or not soil settlements might have produced a separation between the soil and cap, and whether such a separation can be relied upon for design.
4.4 Six-Pile Group in SJB01
The layout of experiment SJB01 is shown in Figure 4-28, and was similar to that of PDS03.
SJB01 involved a single group of six piles, connected by a pile cap embedded within the clay layer. The difference between SJB01 and PDS03 was that the undrained shear strength of the clay crust was increased from about 22 kPa to about 44 kPa (after correction for load rate).
Time histories are shown for five shaking events in Figures 4-29 to 4-33. Each figure includes time histories for the same quantities as shown in the preceding plots for PDS03. The first four input base motions were the same as PDS03 (small, medium and large Santa Cruz motions, one large Kobe motion), followed by a repeat of the large Kobe motion.
The three Santa Cruz motions produced progressively increasing levels of ground
displacement along with peak ru values at 6.5 m depth (middle of loose sand) that were about 40% for the small motion and about 100% for the medium and large motions. Referring to the large Santa Cruz event, the lateral ground displacement reached peak transient values of about 0.5 m and permanent values that were about 0.43 m. The pile cap displacements closely followed the ground displacements, with the relative movement between the clay crust and pile cap being less than about 0.1 m throughout shaking. The ground displacements are considerably smaller than observed in PDS03 for the same three earthquakes, with the differences being attributed to the effect of the greater shear strength of the clay crust. The stronger clay in SJB01 results in greater shear resistance between the clay crust and the side walls of the model container, which is an undesirable boundary effect that would reduce lateral spreading displacements, plus a greater resisting force from the pile foundation, which is a realistic effect that pile foundations can have on lateral spreading displacements.
The next shaking event was a “large Kobe” motion, which produced ground displacements
that reached their maximum value of about 1.4 m near the end of shaking, with peak ru values of about 100% in the loose sand. The pile cap displacement had a transient peak of about 0.8 m with a permanent lateral displacement of about 0.6 m, such that the ground surface moved more than 0.6 m relative to the pile cap. The peak lateral load from the clay crust was now about 5025 kN, which is almost 70% larger than observed in the previous large Santa Cruz motion.
The final shaking event, a repeat large Kobe motion, increased the lateral soil displacements
to over 2.0 m and the increased the pile cap displacements by about 0.1 m, but otherwise showed very similar responses to that observed in the prior large Kobe motion.
The responses for these five motions show very similar features of behavior to those
observed for the pile group in PDS03 and the single piles in PDS01. The inter-relations between some of the recorded responses are shown in Figure 4-34 and
4-35 for the Large Santa Cruz motion and first large Kobe Motion.

4-17
• The lateral loads from the clay crust and the p in the loose liquefied sand are related with opposing signs; Down-slope loads from the clay crust are almost always associated with upslope resistances from the loose sand layer.
• The largest pile bending moments were always associated with down-slope loads from the clay crust and upslope resistances from the liquefied sand layer.
• The peak pile cap displacement occurs when the loose sand resists downslope movement of the piles near the middle of the loose sand (negative p).
• The ru versus p (in loose sand) plot is more complicated than previously observed for the single pile example, but is similar to that observed in PDS03..
Snapshots of the deformed shape and bending moments for the upslope corner pile and the
soil deformation profile are shown in Figure 4-36. The relative displacements between the pile and soil are positive throughout the clay crust, but vary in time and depth throughout the loose sand layer. Again, as previously observed, the time histories show p cycling in response to the cycling incremental relative displacements.
The significance of the pile cap inertia force was evaluated by comparing it to the back-
calculated total lateral load that the clay crust imposed on the pile cap, as shown in Figure 4-37 for the first large Kobe event. The peak pile cap inertia was about one-fourth as large as the peak total lateral load from the clay crust, but these peak values did not occur at the same time. Instead, the pile cap inertia was closer to 10-20% of the total load from the clay crust when it peaked. Thus, the results for PDS03, in which the pile cap inertial and lateral load from the clay crust could not be separated, are likely to be similarly dominated by the clay crust loads and not the pile cap inertia.
The peak lateral load imposed on the pile cap from the clay crust has been estimated for
SJB01 in the same manner as in PDS03 using Equation 4-3. The input parameters for SJB01 are:
H = 2.2 m Height of pile cap b = 6.5 m Width of pile cap L = 10.2 m Length of pile cap β = 4.4o Angle of inclination of clay surface cu = 44 kPa Undrained shear strength (corrected for load rate) α = 0.7 Coefficient of adhesion between clay and pile cap γ = 16.2 kN/m3 Unit weight of clay kh = 0.2 g Seismic coefficient Lpiles = 1.0 m Length of pile segments between bottom of pile cap and shear gauges
The pile cap acceleration at the time of the peak lateral load was 0.17g, which corresponds to an inertia load of 630 kN. The undrained shear strength of the clay crust was increased by 10% to account for the influence of loading rate, similar to the analysis of PDS03. The undrained shear strength used in the analysis was cu = 44 kPa. An example calculation has been included in Section 4.2. A summary of results is presented in Table 4-2.

4-18
Table 4-2. Predicted lateral loads from the soil on the pile cap for SJB01. The measured lateral load had a peak value of 5025 kN.
Case Seismic Coefficient,
kh (g) a
Adhesion Coefficient
Passive Load (kN)
Side Friction
(kN)
Bottom Friction
(kN)
Piles Force (kN)
Total Lateral
Load (kN) α b Pp F1 F4 Fpiles Fp
c 1a 0.0 0.0 1898 0 0 1542 3440 1b 0.0 0.3 2068 596 833 1542 5039 1c 0.0 0.6 2260 1192 1667 1542 6660 1d 0.0 1.0 2558 2222 2755 1542 9077 2a 0.2 0.0 1962 0 0 1542 3504 2b 0.2 0.3 2140 596 833 1542 5111 2c 0.2 0.6 2340 1192 1667 1542 6741 2d 0.2 1.0 2647 2222 2755 1542 9166
(a) The acceleration of the passive wedge was assumed to be 0.2g. (b) The range in the adhesion coefficient selected for analysis reflects the scatter in the published data for
adhesion coefficients for piles in cohesive soils. (c) The total lateral load consists of the passive load, and friction between the clay and sides and bottom of
the pile cap. Active pressure downslope of the pile cap has been ignored.
Comparing Recorded Lateral Loads to Theoretical Calculations
Comparing the recorded and theoretical lateral loads summarized in Table 4-2 leads to
several observations that are similar to those made in section 4.2: • Friction between the clay and the sides and bottom of the cap must be considered to obtain
reasonably accurate results for these tests. Considering the components of loading imposed on the pile cap (Pp, F1 and F4) for case 2b, which produced the closest match with the measured data, the passive force contributed only 60% of the cap loading. Side friction contributed 17% and base friction contributed 23%. Failure to consider friction forces in these tests would result in a significant under-estimate of the loads imposed on the pile cap.
• An adhesion coefficient equal to about α = 0.3 would produce the best prediction of the total lateral load exerted on the pile cap for this case. The adhesion coefficient that produces the closest match with the data for SJB01 (cu = 44 kPa) is less than the adhesion coefficient that produces the best match with the data for PDS03 (cu = 22 kPa). Correlations between α and cu that are commonly used to estimate axial pile capacity in clays indicate that α decreases with increasing cu, which is the same trend based on the measured data (Terzaghi et al., 1996). The α value that provide the best prediction of measured data for SJB01 is smaller than the scatter of data shown in the correlation in Figure 4-27.
• Including a seismic coefficient of 0.2 g had a small effect on the calculated passive load for these tests. Figure 4-28b illustrates that the calculated passive load is not very sensitive to the selection of the seismic coefficient for these calculations.

4-19
4.5 Load-Displacement for Pile Caps
Observations from Test Data As a general rule for retaining walls, the magnitude of displacement required to mobilize
passive resistance is generally considered to be about 0.5% to 6% of the pile cap height. Data from pile group load tests in granular soil performed by Rollins and Sparks (2002) indicate close agreement with the general rule for retaining walls. The peak load was mobilized at a pile cap displacement of about 2.5% to 6% of the pile cap height. Duncan and Mokwa performed load tests on bulkheads and pile groups embedded in natural desiccated sandy silt and sandy clay, and in crusher run gravel and sand backfills (Duncan and Mokwa 2001; Mokwa and Duncan 2001). Ultimate loads for their tests were developed at displacement-to-pile cap height ratios of about 1% for the natural soil and 4% for the backfill soils.
The centrifuge test data provide a means of assessing whether the load-displacement
relationship for a pile group in a crust spreading laterally over liquefied sand is similar to the trends observed for pile cap load tests. Figure 4-38 shows normalized load vs. relative displacement from tests PDS03, SJB01 and SJB03. The pile cap dimensions were similar for PDS03 and SJB01, but the cap in SJB03 was larger. The undrained shear strengths were cu = 22kPa for PDS03 and cu = 44 kPa for SJB01 and SJB03. Data were collected during virgin loading peaks for each shake for the three tests, and the virgin loads were normalized by the peak crust loads measured for each of the tests. The relative displacement between the soil and the pile cap was estimated during the virgin loading cycles using data from the displacement transducers on the pile cap and displacement transducers attached to the clay crust between the pile cap and the container walls. The passive loads were mobilized at relative displacements of 40% to over 100% of the pile cap height, which is much larger than commonly observed for pile cap load tests.
The softer load-displacement response of the crust loads on the pile caps in the centrifuge
tests can be attributed to the influence of underlying liquefied soil on the distribution of stresses in the nonliquefied crust. For the case where the underlying sand is not liquefied, some of the stress imposed on the clay by the pile cap can be transmitted into the sand, and stress in the clay crust would dissipate sharply with distance away from the pile cap. For the case where the underlying sand is liquefied, and exhibits greatly reduced strength and stiffness, little of the stress imposed on the clay by the pile cap would be transmitted into the liquefied sand, and stress would be distributed throughout a large mass of clay. The zone of influence would extend a greater distance back from the pile cap, with strains distributed in clay soil that is outside of the traditional Coulomb failure wedge. The distribution of strain throughout a large soil mass results in a much softer load-displacement response for the pile cap in liquefied soil than in nonliquefied soil.
Pile Cap P-y Model
Two trend lines, one corresponding to “no liquefaction” and one corresponding to “liquefaction” are also shown in Figure 12. The equation used for the trend lines is

4-20
u
1133.0
u PHCy16
HCy
PP ≤⎥⎥⎦
⎤
⎢⎢⎣
⎡⎟⎠
⎞⎜⎝
⎛⋅⋅
+⎟⎠
⎞⎜⎝
⎛⋅
⋅=
−−−
(4-20)
where P is the load on the pile cap (units of force), Pu is the ultimate load (units of force), y is the relative displacement between the crust and the pile cap, H is the height of the pile cap, and C is a constant that controls the stiffness of the curve. The relationship can be visualized as consisting of an elastic and a plastic component in parallel. The case for no liquefaction is associated with C = 0.05, for which passive resistance is mobilized at about 6% of the pile cap height. Several additional trend lines that envelope the data have been provided to represent the liquefied p-y curve for the pile cap, and C = 0.5 produces a fit for which the passive resistance is mobilized at about 60% of the pile cap height.
4.6 Discussion and Summary of Findings
The back-calculated load transfer behavior from the centrifuge models described herein
indicate a complex interaction that is important to understand as part of developing simplified design methodologies. Key points that warrant emphasizing are: • The peak loading conditions for pile bending moment and pile head displacement do not
necessarily occur at the same time and can sometimes correspond to significantly different load-transfer conditions within the different soil strata (e.g., different ru, different fractions of peak subgrade reaction).
• The loading condition at the time of the peak pile bending moment for the medium-diameter (0.73 m) piles generally corresponds to the peak lateral load from the clay crust acting down-slope, as expected, while the liquefied layer provides an upslope resistance, contrary to common expectations. The loading condition at the time of the peak pile bending moment for the large-diameter (1.45 m) pile generally corresponds to the lateral load from the clay crust and the lateral load from the liquefied sand acting downslope.
• The loading condition for peak pile displacement under the strongest earthquakes most commonly differed from the loading condition for peak pile bending moment as follows. The lateral load from the clay crust was at, or near, a local maximum in its time history, but not necessarily at its overall peak value. The loose sand layer generally had higher ru levels and smaller lateral subgrade reaction (p), although the p still was most commonly acting in the upslope (resisting) direction for the 0.73-m diameter piles.
• The peak lateral loads from the clay crust could be reasonably estimated using current methods for predicting ultimate capacities under static loading conditions, at least within the accuracy to which the various parameters can be estimated (e.g., clay shear strength, side friction along the pile cap sides, bearing factor against a pile).
• The lateral soil-pile load transfer behavior was strongly affected by the characteristics of the soil profile’s dynamic site response.
• The normalized lateral load versus relative displacement data for the embedded pile caps showed much softer responses during lateral spreading than are commonly expected based on experiences with static monotonic loading tests on pile caps or retaining walls.

4-21
Comparisons of recorded lateral soil loads on the pile caps to those predicted by simple design theories lead to the following observations:
• The friction between the clay and the sides and base of the pile cap was significant for these
tests. Considering the loads on the pile caps (Pp + F1 + F4) for the cases that produced the closest match with the measured data, the base friction contributed 23% to 30%, and side friction contributed 17% to 23%. The passive load contributed only 47% to 60% of the total lateral load exerted on the pile cap by the soil.
• Coulomb passive earth theory in conjunction with calculations of friction between the clay and the sides and base of the pile cap provided reasonable agreement with the total soil loads measured in the tests.
• The adhesion coefficients that produced reasonable agreement with the measured data were α = 0.6 for PDS03 (cu = 22 kPa) and α = 0.3 for SJB01 (cu = 44 kPa), which is near the lower end or slightly below the data shown in the correlation between α and cu in Figure 4-27 that is commonly used to estimate the axial shaft friction capacity of piles in clays.
• Including the influence of the inertia of the clay failure mass, similar to the method developed by Mononobe and Matsuo (1931) and Okabe (1929) for sands, did not have a significant impact on the total lateral loads predicted for our pile group.
Rollins and Sparks (2002) performed some pile group load tests in gravel soils, and found
that the base friction carried about 7% of the total load on the pile cap, while the passive resistance provided about 36% of the load. The piles resisted the remaining 57% of the load applied to the pile cap. There was no side friction for the test because soil was not placed along the sides of the pile cap. There are two possible reasons for the higher contribution from base friction for our tests compared with Rollins and Sparks’ tests. First, the ratio of base friction to passive resistance is expected to be smaller for cohesionless soils than for cohesive soils, assuming typical properties and similar conditions. Second, Rollins and Sparks’ tests involved above-ground loading of the pile cap, in which the pile group was pushed through the soil in the absence of free-field soil movement. In the centrifuge tests, the lateral spreading of the clay around the pile cap and its supporting piles may have caused the clay to become wedged between the pile cap and the liquefied sand. The flow of the clay around the piles was accompanied by gaps forming behind the piles and these large deformations would be expected to have caused the clay to heave upward, thereby maintaining good contact between the clay and pile cap base (as was observed during excavation of the models). This wedging mechanism associated with lateral spreading would increase the role of base friction. Whether to include the influence of base friction when calculating the total soil load on the pile cap depends on whether the soil is expected to settle and leave a gap between the bottom of the pile cap and the soil surface. The wedging of the soil beneath the pile cap during lateral spreading could cause soil to come into contact with the bottom of the pile cap even if a gap had existed prior to the lateral spreading. For design, the friction between the soil and the bottom of the pile cap should be excluded from analysis only if the designer is confident that the gap will remain beneath the pile cap during lateral spreading. The peak lateral loads on the pile caps were, however, mobilized for only short periods of time during individual cycles of shaking, even for the strongest earthquake events. A more

4-22
sustained level of lateral load, during and after strong shaking, was generally about 30-50% smaller than the peak value in these centrifuge tests (Figures 4-16 to 4-19, 4-26 to 4-30). This observation might be related to potential post-peak softening in the passive pressure or interface friction on the pile cap. Other factors may include the cyclic nature of the loading, stress redistribution from cracking in the surrounding soil, and the formation of gaps between the soil and pile cap as the lateral spreading displacements progressively increased.
The normalized lateral load versus relative displacement data for the embedded pile caps
showed much softer responses during lateral spreading than have been observed during static monotonic loading tests on pile caps or retaining walls. The softer load-displacement response of the crust loads on the pile caps is attributed to the influence of underlying liquefied soil on the distribution of stresses in the nonliquefied crust. A simple design relation was proposed for describing the variation of lateral load versus relative displacement for embedded pile caps in laterally spreading soils. Further study is needed to confirm that this relation can be applied to conditions that differ from those covered by the centrifuge tests presented herein.
The lateral load transfer in the liquefying loose sand layer is particularly interesting. The fact
that the loose sand restrains the down-slope movement of the 0.73-m diameter piles at the time of peak moment for all of the shaking events is contrary to the loading assumed in most simplified design methods, where the lateral load is applied in the direction of the permanent displacement of the liquefied sand. However, the direction of p may actually follow the direction of the incremental relative displacement between the pile and soil, and not the direction of total relative displacement. Hence the direction of p alternates during the cyclic down-slope spreading of the slope even if the total relative displacement does not change direction. This aspect of behavior was clearly shown in many of the centrifuge test results.
The site response of the soil profile controls the relative timing of soil displacements (clay crust and liquefied sand) and ru levels in the loose sand such that local maxima of the down-slope displacement of the clay crust are associated with local minima in the ru in the loose sand. Furthermore, the magnitude of the transient down-slope crust displacement appears related to the magnitude of the drop in ru. In effect, every time the clay crust lurches down-slope, the ru in the loose sand decreases and the sand temporarily stiffens (since the effective stress is increasing). The down-slope movement of the clay crust imposes a strong kinematic load on the pile foundations, and the temporarily stiffened loose sand can restrain the piles from moving down-slope at that instance.
The influence of pile flexibility on the relative timing of lateral loads from the clay crust and
underlying liquefied sand is illustrated by comparing the responses of the 0.73-m diameter pile GN and 1.45-m diameter pile BP. For both piles, the peak bending moment occurred when the downslope load from the clay crust was at a local maximum. At the time of peak moment, the 1.45-m diameter BP attracted a downslope load from the liquefied sand while the 0.73-m diameter GN developed upslope resistance from the liquefied sand. The reason for the difference is that BP did not displace as much in the liquefied sand layer as GN, since BP was several times stiffer than GN. The free-field soil displacement was larger than the BP pile displacement at the time of peak moment for BP, whereas the GN pile displacement was larger than the free-field soil displacement at the time of peak moment for GN.

4-23
Lateral load transfer from the liquefied sand to the pile is expected to depend on ru levels both in the free field and near field (close to the piles), with the near-field ru levels likely to be affected by the near-field strains imposed by relative soil-pile movement. Figure 4-39 shows near-field and free-field ru time histories from three different centrifuge tests in which the near-field recordings from pore pressure transducers near the piles (less than two pile diameters away) are plotted with free-field recordings far from the piles. The near-field and free-field ru recordings for each test exhibit the same trends with relatively small differences. The similarity of the recordings indicates that the free-field conditions dominated over near-field effects in these tests, and that the coupling between the crust displacement and drop in the ru in the loose sand is controlled by site response (with some additional effects from interaction with the pile foundations).
The combined findings from these and prior physical modeling studies, as discussed in
Section 2, showed that the p-y behavior of liquefied sand depends on: • Relative density (Dr). • Prior relative displacement history relative to pile diameter (y/b). • Excess pore pressure ratio in the far- and near-field:
o Magnitude of cyclic stresses & number of loading cycles imposed by ground shaking. o Magnitude and number of loading cycles between the pile & soil.
• Partial drainage and hence loading rate. • Pile installation method. • Pile diameter. • Soil characteristics.
In addition, the stiffness of a pile foundation affects the lateral load imposed by liquefied soil as it cyclically spreads past the piles, because the pile foundation stiffness affects both the cyclic relative and total relative displacements between the pile and liquefied soil.
The findings in this section further illustrate that the representation of p-y behavior for liquefied soil in simplified design methods cannot be expected to realistically capture the truly cyclic behavior and inherent coupling with site response characteristics (including the lateral spreading of any overlying crust). Instead, the simplified representation of p-y behavior for liquefied soil may reflect the likely range of responses that might occur simultaneously with the other imposed loading conditions (e.g., inertial load from a superstructure, or lateral load from a nonliquefied crust).

4-24
2Qn2Qs 2Qc
Jα
2Mc
2Vc
khWPPF2
F4
2Pc2Ps
2Ms
2Vs
F1
F3
2Pn
2Mn
2Vn
W
kvW
Figure 4-1: Free body diagram of the pile cap and the six pile segments (two by three group) above the shear strain gages.
10 20 30Time (s)
-1000
0
1000
2000
Load(kN)
Shear GagesDifferentiation of Moment
Figure 4-2: Comparison of shear histories recorded from shear strain gages, and by differentiation of moment with depth.

4-25
(a) (b)
Figure 4-3: (a) Free body diagram of passive failure wedge and (b) force vector polygon graphical expression of force equilibrium for Coulomb analysis.
(a) (b)
Figure 4-4: (a) Free body diagram of passive failure wedge and (b) force vector polygon
graphical expression of force equilibrium for modified Coulomb analysis, including the influence of the inertia of the passive failure wedge.
F WP
R
T
P
F
W
T
R
θ
P
R
T
WF
R
P
T
F
Wk Wh k Wh
θ

4-26
North
MontereySand
Clay
Loose Sand
Dense Sand
South
1650 [63]
790 [30]
580 [22]
Dimensions: model - mm [ prototype - m ]
MP
GN
BP
SP
1.2°
GS
AccelerometerPore PressureTransducer
LinearPotentiometer
Figure 4-5: PDS01 schematic model layout.

4-27
Clay
Loose Sand
DenseSand
Monterey Sand
0
1
2
3
4
5
6
7
8
9
10
11
Depth (m)
P
Moment
Disp.
Figure 4-6: Positive sign conventions for PDS01 plots.

4-28
-2000
200
P (k
N/m
)
-2000
200
P (k
N/m
)
-2000
200
P (k
N/m
)
-2000
200
P (k
N/m
)
0 2000 4000 6000Data Point Number
-2000
200P
(kN
/m)
1 Depth = 2.4m
2 Depth = 3.3m
3 Depth = 4.6m
4 Depth = 6.2m
5 Depth = 7.8m
1
5
2
3
4
15
10
Depth(m)
5
0
Clay
LooseSand
DenseSand
MontereySand
20
P+
-2000
200
P (k
N/m
)
-2000
200
P (k
N/m
)
-2000
200
P (k
N/m
)
0 2000 4000 6000Data Point Number
-2000
200
P (k
N/m
)
6 Depth = 9.5m
7 Depth = 11.7m
8 Depth = 14.0m
9 Depth = 17.0m
6
7
8
9
15
10
Depth(m)
5
0
Clay
LooseSand
DenseSand
MontereySand
20
P+
Figure 4-7: P-histories for pile BP from PDS01.

4-29
-2000
200
P (k
N/m
)
-2000
200
P (k
N/m
)
-2000
200
P (k
N/m
)
-2000
200
P (k
N/m
)
-2000
200
P (k
N/m
)
1 Depth = 0.6m
2 Depth = 1.9m
3 Depth = 3.2m
4 Depth = 4.6m
5 Depth = 6.2m
1
5
2
3
4
20
5
15
10
Depth(m)0
DenseSand
LooseSand
MontereySand
Clay
P+
0 2000 4000 6000Data Point Number
-2000
200
P (k
N/m
) 6 Depth = 7.8m
6
-2000
200
P (k
N/m
)
-2000
200
P (k
N/m
)
-2000
200
P (k
N/m
)
-2000
200
P (k
N/m
)
-2000
200
P (k
N/m
)
7 Depth = 9.0m
8 Depth = 10.0m
9 Depth = 11.0m
10 Depth = 12.1m
11 Depth = 14.0m
7
11
89
10
20
5
15
10
Depth(m)0
DenseSand
LooseSand
MontereySand
Clay
P+
0 2000 4000 6000Data Point Number
-2000
200
P (k
N/m
) 12 Depth = 17.0m
12
Figure 4-8: P-histories for pile GN from PDS01.

4-30
-4000
-2000
0
2000
4000
Moment 9.5 mbelow ground
surface (kN-m)
-120-80-40
04080
P 2.4 m belowground surface
(kN/m)
-40-20
0204060
P 6.2 m belowground surface
(kN/m)
-0.1
0
0.1
0.2
0.3
ru 6.2 m belowground surface
-0.1-0.05
00.050.1
0.15Displacement ofpile cap & crustat pile location
(m)CrustPile
0 10 20 30Time (s)
-0.4
-0.2
0
0.2
0.4
Baseacceleration
(g)
Time of peak moment
Time of peak pile disp.
Figure 4-9: Selected time histories for pile BP from PDS01 small Kobe event.

4-31
-8000
-4000
0
4000
8000
Moment 9.5 mbelow ground
surface (kN-m)
-150-100
-500
50100150
P 2.4 m belowground surface
(kN/m)
-150-100
-500
50100150
P 6.2 m belowground surface
(kN/m)
0
0.5
1
ru 6.2 m belowground surface
-0.4
0
0.4
0.8Displacement ofpile cap & crustat pile location
(m)CrustPile
0 10 20 30Time (s)
-0.8
-0.4
0
0.4
0.8
Baseacceleration
(g)
Time of peak moment
Time of peak pile disp.
Figure 4-10: Selected time histories for pile BP from PDS01 first large Kobe event.

4-32
-8000
-4000
0
4000
8000
Moment 9.5 mbelow ground
surface (kN-m)
-200
-100
0
100
200
P 2.4 m belowground surface
(kN/m)
-200
-100
0
100
200
P 6.2 m belowground surface
(kN/m)
-0.5
0
0.5
1
ru 6.2 m belowground surface
-0.4
0
0.4
0.8
1.2Displacement ofpile cap & crustat pile location
(m)CrustPile
0 10 20 30Time (s)
-0.8
-0.4
0
0.4
0.8
Baseacceleration
(g)
Time of peak moment
Time of peak pile disp.
Figure 4-11: Selected time histories for pile BP from PDS01 second large Kobe event.

4-33
-800
-400
0
400
800
Moment atground surface
(kN-m)
-50
-25
0
25
50
P 1.9 m belowground surface
(kN/m)
-50
-25
0
25
50
P 6.2 m belowground surface
(kN/m)
-0.1
0
0.1
0.2
0.3
ru 6.2 m belowground surface
-0.2
-0.1
0
0.1
0.2
Displacement ofpile cap & crust
(m) CrustPile
0 10 20 30Time (s)
-0.4
-0.2
0
0.2
0.4
Baseacceleration
(g)
Time of peak moment
Time of peak pile disp.
Figure 4-12: Selected time histories for pile GN from PDS01 small Kobe event.

4-34
-2000
-1000
0
1000
2000
Moment atground surface
(kN-m)
-100
-50
0
50
100
P 1.9 m belowground surface
(kN/m)
-100
-50
0
50
100
P 6.2 m belowground surface
(kN/m)
-0.5
0
0.5
1
ru 6.2 m belowground surface
-0.4
0
0.4Displacement ofpile cap & crust
(m) CrustPile
0 10 20 30Time (s)
-0.8
-0.4
0
0.4
0.8
Baseacceleration
(g)
Time of peak moment
Time of peak pile disp.
Figure 4-13: Selected time histories for pile GN from PDS01 first large Kobe event.

4-35
-1000
0
1000
2000
Moment atground surface
(kN-m)
-100
-50
0
50
100
P 1.9 m belowground surface
(kN/m)
-100
-50
0
50
100
P 6.2 m belowground surface
(kN/m)
-0.5
0
0.5
1
ru 6.2 m belowground surface
0
0.4
0.8
Displacement ofpile cap & crust
(m) CrustPile
0 10 20 30Time (s)
-0.8
-0.4
0
0.4
0.8
Baseacceleration
(g)
Time of peak moment
Time of peak pile disp.
Figure 4-14: Selected time histories for pile GN from PDS01 second large Kobe event.

4-36
-80 -40 0 40 80P 6.2 m below ground
surface (kN/m)
-80
-40
0
40
80
P 1.9 m belowground surface
(kN/m)
-80 -40 0 40 80P 6.2 m below ground
surface (kN/m)
-0.5
0
0.5
1
ru 6.2 mbelow ground
surface
-80 -40 0 40 80P 6.2 m below ground
surface (kN/m)
-0.2
0
0.2
0.4
0.6
0.8
Pile capdisplacement
(m)
-80 -40 0 40 80P 6.2 m below ground
surface (kN/m)
-1000
-500
0
500
1000
1500
2000
Moment atground surface
(kN-m) 5.31s5.41s5.51s5.60s5.70s
Figure 4-15: Cross-plots of p in the loose sand, p in the clay layer, pile cap displacement, pile bending moment, and ru for pile GN from PDS01 second large Kobe
event.

4-37
Figure 4-16: Snapshots of displaced shape and bending moment for BP in PDS01, along
with soil deformation profile after the test.
Figure 4-17: Snapshots of displaced shape and bending moment for GN in PDS01, along with soil deformation profile after the test.
0 0.5 1 1.5Displacement (m)
-6000 -4000 -2000 0 2000Moment (kN-m)
Time of Peak Pile Disp.Time of Peak Moment
PileSoil15
10
Depth(m)
5
0
Clay
LooseSand
DenseSand
MontereySand
20
0 0.5 1Displacement (m)
-1000 0 1000 2000Moment (kN-m)
20
5
15
10
Depth(m)0
DenseSand
LooseSand
MontereySand
Clay
PileSoil
Time of Peak Pile Disp.Time of Peak Moment

4-38
1.2°
Dimensions: model - mm [ prototype - m ]
1650 [63]
790 [30]
580 [22]
North
Dense Sand
South
Loose Sand
Clay
AccelerometerPore PressureTransducer
LinearPotentiometer
Figure 4-18: PDS03 schematic model layout.

4-39
-200-100
0100200300
Moment in southeast pile 2.7 mbelow ground
surface (kN-m)
-800-400
0400800
1200
Lateral loadfrom claycrust (kN)
-120-80-40
04080
P on southeast pile 6.7 mbelow ground
surface (kN/m)
-0.10
0.10.20.30.4
ru - 6.5 m belowground surface
two pile diametersfrom south east pile
-0.04
0
0.04Displacement ofpile cap & crust
at pile capcenter (m)
CrustPile Cap
0 10 20 30 40 50Time (s)
-0.2
-0.1
0
0.1
0.2
Baseacceleration
(g)
Time of peak moment
Time of peak cap disp.
Figure 4-19: selected time histories from PDS03 small Santa Cruz event.

4-40
-400
0
400
800Moment in southeast pile 2.7 mbelow ground
surface (kN-m)
-1500-1000-500
0500
10001500
Lateral loadfrom claycrust (kN)
-120-80-40
04080
P on southeast pile 6.7 mbelow ground
surface (kN/m)
-0.5
0
0.5
1 ru - 6.5 m belowground surface
two pile diametersfrom south east pile
-0.10
0.10.20.30.4
Displacement ofpile cap & crust
at pile capcenter (m)
CrustPile Cap
0 10 20 30 40 50Time (s)
-0.5
0
0.5
Baseacceleration
(g)
Time of peak moment
Time of peak cap disp.
Figure 4-20: selected time histories from PDS03 medium Santa Cruz event.

4-41
-1000
0
1000
2000
3000Moment in southeast pile 2.7 mbelow ground
surface (kN-m)
-2000
0
2000
4000
Lateral loadfrom claycrust (kN)
-200
-100
0
100P on south
east pile 5.6 mbelow ground
surface (kN/m)
-0.5
0
0.5
1 ru - 6.5 m belowground surface
two pile diametersfrom south east pile
-0.50
0.51
1.52
Displacement ofpile cap & crust
at pile capcenter (m)
CrustPile Cap
0 10 20 30 40 50Time (s)
-1
-0.5
0
0.5
1
Baseacceleration
(g)
Time of peak moment
Time of peak cap disp.
Figure 4-21: selected time histories from PDS03 large Santa Cruz event.

4-42
-1000
0
1000
2000
3000Moment in south
east pile 2.7 mbelow ground
surface (kN-m)
-2000-1000
01000200030004000
Lateral loadfrom claycrust (kN)
-100
-50
0
50
100P on south
east pile 6.7 mbelow ground
surface (kN/m)
0
0.5
1 ru - 6.5 m belowground surface
two pile diametersfrom south east pile
-101234
Displacement ofpile cap & crust
at pile capcenter (m)
CrustPile Cap
0 10 20 30 40 50Time (s)
-1
-0.5
0
0.5
1
Baseacceleration
(g)
Time of peak moment
Time of peak cap disp.
Figure 4-22: selected time histories from PDS03 large Kobe event.

4-43
-200 -150 -100 -50 0 50 100P on south east pile 6.7 mbelow ground surface (kN/m)
-2000
-1000
0
1000
2000
3000
Lateral loadfrom claycrust plus
cap inertia(kN)
-200 -150 -100 -50 0 50 100P on south east pile 6.7 mbelow ground surface (kN/m)
-0.2
0
0.2
0.4
0.6
0.8
1
1.2
ru - 6.5 mbelow ground
surface twopile diameters
from southeast pile
-200 -150 -100 -50 0 50 100P on south east pile 6.7 mbelow ground surface (kN/m)
-0.2
0
0.2
0.4
0.6
Pile capdisplacement
(m)
-200 -150 -100 -50 0 50 100P on south east pile 6.7 mbelow ground surface (kN/m)
-500
0
500
1000
1500
2000
Moment in southeast pile 2.7 mbelow ground
surface (kN-m) 17.52s17.62s17.71s17.81s17.90s
Figure 4-23: Cross-plots of various responses from PDS03 large Santa Cruz event.
-120 -80 -40 0 40 80P on south east pile 6.7 mbelow ground surface (kN/m)
-2000
-1000
0
1000
2000
3000
4000
Lateral loadfrom claycrust plus
cap inertia(kN)
-120 -80 -40 0 40 80P on south east pile 6.7 mbelow ground surface (kN/m)
-0.2
0
0.2
0.4
0.6
0.8
1
1.2
ru - 6.5 mbelow ground
surface twopile diameters
from southeast pile
-120 -80 -40 0 40 80P on south east pile 6.7 mbelow ground surface (kN/m)
-0.2
0
0.2
0.4
0.6
0.8
1
Pile capdisplacement
(m)
-120 -80 -40 0 40 80P on south east pile 6.7 mbelow ground surface (kN/m)
-500
0
500
1000
1500
2000
2500
Moment in southeast pile 2.7 mbelow ground
surface (kN-m) 10.57s10.66s10.76s10.85s10.95s
Figure 4-24: Cross-plots of various responses from PDS03 large Kobe event.

4-44
0 0.4 0.8 1.2 1.6Displacement (m)
0
5
10
15
Depth(m)
South North
Clay
LooseSand
DenseSand
20-2000 -1000 0 1000
Moment (kN-m)
Time of Peak Pile Disp.Time of Peak Moment
PileSoil
Figure 4-25: Snapshots of displaced shape and bending moment for upslope corner pile
and soil profile in PDS03.

4-45
(a) (b)
Figure 4-26: Passive resistance, P(θ), vs. failure angle, θ, for (a) varying values of α with
kh = 0.0, and (b) varying values of kh with α = 0.7.
20 40 60 80θ degrees
100
200
300
400
500P(
θ) k
N/m
α=0.7α=0.4α=0.0
α=1.0
Line of minimum P(θ)
20 40 60 80θ degrees
Line of minimum P(θ)
kh=0.0gkh=0.1g
kh=0.3gkh=0.2g, (Example Calculation)

4-46
Figure 4-27: Adhesion coefficient, α, vs. undrained shear strength, cu, for calculating vertical friction capacity of piles in cohesive soils from Terzaghi et al. (1996). Data from
Dennis and Olson (1983), Stas and Kulhawy (1984).

4-47
1650 [63]
North
790 [30]
Loose Sand
Dense Sand
South
580 [22]
Clay
Dimensions: model - mm [ prototype - m ]
1.4°
AccelerometerPore PressureTransducer
LinearPotentiometer
Figure 4-28: SJB01 schematic model layout.

4-48
-400-200
0200400600
Moment in southeast pile 2.7 mbelow ground
surface (kN-m)
-800
-400
0
400
800
Lateral loadfrom claycrust (kN)
-80
-40
0
40
80P on south
east pile 6.7 mbelow ground
surface (kN/m)
-0.2
0
0.2
0.4
0.6 ru - 6.5 m below
ground surfacetwo pile diameters
from south east pile
-0.04-0.02
00.020.040.06
Displacement ofpile cap & crust
at pile capcenter (m)
CrustPile Cap
0 10 20 30 40 50Time (s)
-0.2
-0.1
0
0.1
0.2
Baseacceleration
(g)
Time of peak moment
Time of peak cap disp.
Figure 4-29: Selected time histories from SJB01 small Santa Cruz event.

4-49
-5000
500100015002000
Moment in southeast pile 2.7 mbelow ground
surface (kN-m)
-2000
-1000
0
1000
2000
Lateral loadfrom claycrust (kN)
-160-120
-80-40
040
P on southeast pile 6.7 mbelow ground
surface (kN/m)
-0.5
0
0.5
1 ru - 6.5 m belowground surface
two pile diametersfrom south east pile
-0.050
0.050.1
0.150.2
Displacement ofpile cap & crust
at pile capcenter (m)
CrustPile Cap
0 10 20 30 40 50Time (s)
-0.5
0
0.5
Baseacceleration
(g)
Time of peak moment
Time of peak cap disp.
Figure 4-30: Selected time histories from SJB01 medium Santa Cruz event.

4-50
-1000
0
1000
2000
3000Moment in southeast pile 2.7 mbelow ground
surface (kN-m)
-2000
0
2000
4000
Lateral loadfrom claycrust (kN)
-200
-100
0
100P on south
east pile 6.7 mbelow ground
surface (kN/m)
-1
-0.5
0
0.5
1 ru - 6.5 m belowground surface
two pile diametersfrom south east pile
-0.2
0
0.2
0.4
0.6Displacement ofpile cap & crust
at pile capcenter (m)
CrustPile Cap
0 10 20 30 40 50Time (s)
-1
-0.5
0
0.5
1
Baseacceleration
(g)
Time of peak moment
Time of peak cap disp.
Figure 4-31: Selected time histories from SJB01 large Santa Cruz event.

4-51
-2000
0
2000
4000Moment in southeast pile 2.7 mbelow ground
surface (kN-m)
-2000
0
2000
4000
6000
Lateral loadfrom claycrust (kN)
-300
-200
-100
0
100P on south
east pile 6.7 mbelow ground
surface (kN/m)
-0.5
0
0.5
1 ru - 6.5 m belowground surface
two pile diametersfrom south east pile
-0.40
0.40.81.21.6
Displacement ofpile cap & crust
at pile capcenter (m)
CrustPile Cap
0 10 20 30 40 50Time (s)
-1
-0.5
0
0.5
1
Baseacceleration
(g)
Time of peak moment
Time of peak cap disp.
Figure 4-32: Selected time histories from SJB01 first Large Kobe event.

4-52
-2000
0
2000
4000Moment in southeast pile 2.7 mbelow ground
surface (kN-m)
-2000
0
2000
4000
6000
Lateral loadfrom claycrust (kN)
-300
-200
-100
0
100P on south
east pile 6.7 mbelow ground
surface (kN/m)
-0.5
0
0.5
1 ru - 6.5 m belowground surface
two pile diametersfrom south east pile
00.40.81.21.6
22.4
Displacement ofpile cap & crust
at pile capcenter (m)
CrustPile Cap
0 10 20 30 40 50Time (s)
-1
-0.5
0
0.5
1
Baseacceleration
(g)
Time of peak moment
Time of peak cap disp.
Figure 4-33: Selected time histories from SJB01 second Large Kobe event.

4-53
-300 -200 -100 0 100P on south east pile 6.7 mbelow ground surface (kN/m)
-2000
-1000
0
1000
2000
3000
Lateral loadfrom clay
crust (kN)
-300 -200 -100 0 100P on south east pile 6.7 mbelow ground surface (kN/m)
-0.2
0
0.2
0.4
0.6
0.8
1
1.2
ru - 6.5 mbelow ground
surface twopile diameters
from southeast pile
-300 -200 -100 0 100P on south east pile 6.7 mbelow ground surface (kN/m)
-0.2
0
0.2
0.4
0.6
Pile capdisplacement
(m)
-300 -200 -100 0 100P on south east pile 6.7 mbelow ground surface (kN/m)
-1000
0
1000
2000
3000
Moment in southeast pile 2.7 mbelow ground
surface (kN-m) 17.54s17.64s17.73s17.82s17.92s
Figure 4-34: Cross-plots of various responses from SJB01 large Santa Cruz event.
-300 -200 -100 0 100P on south east pile 6.7 mbelow ground surface (kN/m)
-4000
-2000
0
2000
4000
6000
Lateral loadfrom clay
crust (kN)
-300 -200 -100 0 100P on south east pile 6.7 mbelow ground surface (kN/m)
-0.2
0
0.2
0.4
0.6
0.8
1
1.2
ru - 6.5 mbelow ground
surface twopile diameters
from southeast pile
-300 -200 -100 0 100P on south east pile 6.7 mbelow ground surface (kN/m)
-0.2
0
0.2
0.4
0.6
0.8
Pile capdisplacement
(m)
-300 -200 -100 0 100P on south east pile 6.7 mbelow ground surface (kN/m)
-2000
-1000
0
1000
2000
3000
4000
Moment in southeast pile 2.7 mbelow ground
surface (kN-m) 7.62s7.72s7.81s7.91s8.00s
Figure 4-35: Cross-plots of various responses from SJB01 first Large Kobe event.

4-54
0 0.4 0.8 1.2 1.6Displacement (m)
0
5
10
15
Depth(m)
South North
Clay
LooseSand
DenseSand
20-4000 -2000 0 2000
Moment (kN-m)
Time of Peak Pile Disp.Time of Peak Moment
PileSoil
Figure 4-36: Snapshots of displaced shape and bending moment for upslope corner pile and soil profile in SJB01.

4-55
-4000 -2000 0 2000 4000
Pile Cap Inertia (kN)
-4000
-2000
0
2000
4000
Lateral loadfrom claycrust (kN)
a
4 6 8 10 12 14 16 18 20Time (s)
-4000
-2000
0
2000
4000
6000
Lateralload(kN)
Crust load + cap inertiaCap inertiaCrust load
Figure 4-37: Comparison of pile cap inertia and the total lateral load on the pile cap from the clay crust; in SJB01 first large Kobe event.

4-56
0 0.4 0.8 1.2(∆soil - ∆cap) / Hcap
0
0.5
1Lo
ad /
Peak
Loa
d
SJB03 dataSJB01 dataPDS03 dataC = 0.05C = 0.3C = 0.5C = 0.8
Figure 4-38: Normalized load versus normalized relative displacement for the pile caps in SJB01, SJB03, and PDS03 (data points for virgin load cycles during lateral spreading only), with proposed relationship plotted for different values of C.

4-57
0 5 10 15 20 25 30Time (s)
-0.5
0
0.5
1
-0.5
0
0.5
1
-0.5
0
0.5
1
1.5
Free FieldNear Field
(c)
(b)
(a)
Figure 4-39: Comparison of near Field (within 2 pile diameters) and free field ru time histories from three centrifuge tests: (a) the 6th shaking event in CSP2 (Wilson et al. 1997), (b) the 3rd shaking event in PDS01, and (c) the 4th shaking event in SJB01.

6-11
-8 -4 0 4 8y/y50
-1.2
-0.8
-0.4
0
0.4
0.8
1.2
p/p u
lt
Soil type = 1 (clay)Cd = 0.1
-8 -4 0 4 8
y/y50
-1.2
-0.8
-0.4
0
0.4
0.8
1.2
p/p u
lt
Soil type = 1 (clay)Cd = 1.0
-8 -4 0 4 8y/y50
-1.2
-0.8
-0.4
0
0.4
0.8
1.2
p/p u
lt
Soil type = 1 (clay)Cd = 10
-8 -4 0 4 8
y/y50
-1.2
-0.8
-0.4
0
0.4
0.8
1.2
p/p u
lt
Soil type = 2 (sand)Cd = 0.3
Figure 6-2. Four examples of cyclic loading response for PySimple1; three for soilType = 1 with Cd = 0.1, 1.0, and 10, and one for soilType = 2 with Cd = 0.3.
-30 -20 -10 0 10 20 30y/y50
-1.2
-0.8
-0.4
0
0.4
0.8
1.2
p/p u
lt
Soil type = 1 (clay)Cd = 0.1
Figure 6-1. Comparison of Matlock’s (1970) test on soft clay and PySimple1
with the same loading path.

6-12
-0.4
-0.2
0
0.2
0.4
CS
R
0
0.25
0.5
0.75
1
r u
0 4 8 12 16 20time
-0.02
-0.01
0
0.01
0.02
γ
-1
-0.5
0
0.5
1
p/p u
lt
-20 -10 0 10 20y/y50
-1
-0.5
0
0.5
1
p/p u
lt
soil pile
p-y spring
Stage = 0(no ru effect)
Stage = 1(ru effect)
-0.4
-0.2
0
0.20.4
CS
R
00.25
0.5
0.751
r u
0 10 20 30time
00.04
0.08
0.12
0.16
γ
-1
-0.5
0
0.5
1
p/p u
lt
0 40 80 120 160y/y50
-1
-0.5
0
0.5
1
p/p u
lt
soil pile
p-y spring
Rigid pile
Peak elastic deflectionof pile is ≈ 10y50
Figure 6-3. Example of PyLiq1 behavior during liquefaction without lateral spreading
Figure 6-4. Example of PyLiq1 behavior during liquefaction with lateral spreading.
-6 -4 -2 0 2 4 6z / z50
-1.2
-0.8
-0.4
0
0.4
0.8
1.2
t / t u
lt
t-z type = 1: Backbone approximatesReese & O'Neill (1987)
-6 -4 -2 0 2 4 6
z / z50
-1.2
-0.8
-0.4
0
0.4
0.8
1.2
t / t u
lt
t-z type = 2: Backbone approximatesMosher (1984)
Figure 6-5. Examples of cyclic loading response for tzType = 1 and tzType = 2.

6-13
0 1 2 3 4 5 6 7 8 9 10z/z50
0
0.2
0.4
0.6
0.8
1
1.2
q/q u
lt Drilled shafts in clayReese & O'Neill (1987)qzType = 1
Piles in sandVijayvergiya (1977)qzType = 2
Figure 6-6. Comparison of Monotonic Backbones for qzTypes 1 and 2 versus the Relations by Reese & O’Neill (1987) and Vijayvergiya (1977).
0 1 2 3 4 5 6 7 8z/z50
-0.2
0
0.2
0.4
0.6
0.8
1
1.2
q/q u
lt
qzType =1
0 1 2 3 4 5 6 7 8 9 10 11 12 13 14
z/z50
-0.2
0
0.2
0.4
0.6
0.8
1
1.2
q/q u
lt
qzType =2
Figure 6-7. Cyclic loading responses for qzType = 1 (left) and 2 (right), with
suction = 0.05, for identical q/qult loading time histories.

6-14
Figure 6-8. Single-pile-supported structure in centrifuge models Csp2 and Csp3 (Wilson et al. 1997a,b) and the FEM model for OpenSees
Figure 6-9. Upper sand layer at Dr=55%; Calculated and recorded responses of the soil profile and structure during a Santa Cruz earthquake event with peak base acceleration of 0.49g.
Nevadasand:
DR≈35%or
DR≈55%
DR≈80%
W=480 kN
Dia.=0.67 mEI=412 MNm2
11.
7 m
9
.1 m
0 4 8 12 16 20Time (s)
-0.4
0
0.4
Stru
ctur
eac
cel.
(g)
-0.8
0
0.8
Mom
ent
(MN
. m)
-0.4
0
0.4
Sur
face
acce
l. (g
)
0
0.5
1
Exc
ess
r u
-0.4
0
0.4
Bas
eac
cel.
(g)
0.1 1 10Period (s)
0
0.4
0.8
1.2
1.6
Spe
ctra
l acc
el. (
g)
0
0.4
0.8
1.2
1.6
Spe
ctra
l acc
el. (
g)
CalculatedRecordedBase motion
@3.8-m depth
@4.6-m depth
Super-structure
Groundsurface

6-15
Figure 6-10. Upper sand layer at Dr=35%; Calculated and recorded responses of the soil profile and structure during a Santa Cruz earthquake event with peak base acceleration of 0.49g
Figure 6-11. Calculated and recorded peak bending moments for upper sand layer at Dr=35%; Calculated moments for level ground, 3° sloping ground, 3° sloping ground with no superstructure (kinematic effect only), and without liquefaction.
0 4 8 12 16 20Time (s)
-0.4
0
0.4S
truct
ure
acce
l. (g
)
-0.8
0
0.8
Mom
ent
(MN
. m)
-0.4
0
0.4
Sur
face
acce
l. (g
)
0
0.5
1
Exc
ess
r u
-0.4
0
0.4
Bas
eac
cel.
(g)
0.1 1 10Period (s)
0
0.4
0.8
1.2
1.6
Spe
ctra
l acc
el. (
g)
0
0.4
0.8
1.2
1.6
Spe
ctra
l acc
el. (
g)
CalculatedRecordedBase motion
@3.8-m depth
@3.8-m depth
Super-structure
Groundsurface
0 500 1000 1500
Peak Moment (kNm)
-20
-15
-10
-5
0
5
Dep
th b
elow
gro
und
surfa
ce (m
)
0 500 1000 1500
Peak Moment (kNm)
Recorded
Levelground
3o slopeNo super-structure
Withoutliquefaction
Den
se s
and
Lo
ose
sand

7-1
7. NEUTRAL PLANE SOLUTION FOR LIQUEFACTION-INDUCED DOWN-DRAG ON VERTICAL PILES 7.1 Introduction
Down-drag loads on pile foundations can be an important design consideration when
earthquake-induced liquefaction is expected to cause ground settlements. There are currently no direct measurements of down-drag loads on piles in liquefied soil deposits, either from case histories or from physical modeling studies, that we are aware of. Consequently, the potential response of pile foundations to down-drag loads are generally analyzed using methods developed for other situations.
The neutral plane solution (Fellenius 1972) has been used to estimated down-drag loads and
settlements of vertical pile foundations due to consolidation of clays. The down-drag load or skin friction in the consolidating clay will increase over time as the effective stresses increase (pore pressures decrease) during the consolidation process. For most practical problems, the down-drag loads are therefore based on the final effective stresses at the end of primary consolidation (e.g., Wong and Teh 1995). The outcome of the neutral plane solution can be used to derive the rule of thumb that pile settlements will be small if the sum of the superstructure’s dead load and the down-drag load from the settling layers is less than or equal to the sum of the resisting load capacities from the underlying (essentially non-settling) layers.
The neutral plane solution is modified herein to investigate the development of down-drag
loads in liquefied soil deposits, taking into account the variation in excess pore pressures and ground settlements over time as a liquefied layer reconsolidates, the dependence of sand compressibility on excess pore pressure ratio, and the dependence of shaft skin friction on the excess pore pressure ratio. Questions that are explored include (1) whether it is necessary to include down-drag loads from the liquefied layers since the shaft friction will slowly increase towards a fully-drained capacity as the liquefied sand reconsolidates, and (2) how degradation of skin friction with relative slip displacement or gap formation may affect the loads and settlement of piles subjected to down-drag loads. These and other aspects of designing for down-drag loads on piles in liquefied ground are discussed, and then recommendations for practice are summarized. 7.2 Neutral Plane Solution for Liquefaction
The modifications to the neutral plane solution by Fellenius (1972) are first described and
then illustrated through its application to an example problem. The process of reconsolidation for a liquefied layer requires (1) a description of excess pore pressure isochrones over time, and (2) a relation between sand compressibility and excess pore pressure ratio. The dissipation of excess pore pressures over time has been well described by physical model studies and numerical analyses (e.g., see NRC 1985). Observed patterns (isochrones) from such prior studies are directly used herein, as will described with the example problem.

7-2
The relation by Seed et al. (1975) was used to model the variation of sand compressibility with excess pore pressure ratio. This relation reasonably approximates the laboratory test results by Lee and Albaisa (1974), and is as follows.
2yy1
)yexp(mm
2vo
v
++= (7-1)
buR r)D5.1(5y −= (7-2)
)4(3b RD−= (7-3)
where mv is the sand compressibility, mvo is the sand compressibility in the absence of excess
pore pressures, DR is the relative density, and ru is the excess pore pressure ratio (∆u/σvo′). The resulting relation between mv/mvo and ru is shown in Figure 7-1 for DR=30%.
Shaft friction within liquefied sand was modeled as being proportional to the effective stress
in the sand, as:
)1)(tan( uovo rKf −′= δσ (7-4) where σvo′ is the vertical effective consolidation stress, , Ko is the coefficient of lateral earth pressure at rest, and δ is the interface friction angle. The values of Ko and δ undoubtedly change during the course of liquefaction and reconsolidation, but in the absence of data describing their changes, these values were kept as constants in this study. In addition, variations in these parameters over time are likely to have a small effect on skin friction compared to that of the ru.
Large relative displacements can develop between a pile shaft and a nonliquefied “crust” that
settles as the underlying liquefied layer reconsolidates. The shaft friction between the pile and “crust” soils may experience some post-peak degradation at large relative movements, depending on the nature of the soil. This possibility was included in the analyses by expressing the ratio of f/fpeak (for the crust only) as a function of the normalized relative displacement between the soil and pile (Srel/D, D=pile diameter). As shown in Figure 7-2, the ratio of f/fpeak was modeled as degrading to a value R when Srel is 10 percent of the pile diameter.
The example problem, as shown in Figure 7-3, involves a single vertical 0.4-m-square, 17-m-
long pile carrying a dead load of 445 kN. The soil profile consists of 4 m of clay, over 6 m of liquefiable sand, over stiff clays to large depths. The water table is at a depth of 4 m, and all soils weigh 20 kN/m3. For simplicity, the shaft friction f is given as 40 kPa in the upper clay layer and 50 kPa in the lower clay layer. Degradation of shaft friction is not included in this example (i.e., R=1). For the sand, ko was taken as 0.5, δ as 28 degrees, and mvo as 1.0x10⁻⁴ m2/kN. The tip bearing capacity (Qp) was taken as a constant 144 kN, which assumes that sufficient tip movement has occurred for Qp to be fully mobilized. Note that if sufficient tip movement does not occur, then only the mobilized portion of Qp should be used to calculate the location of the

7-3
neutral plane (Fellenius 1972). The sand is assumed to completely liquefy during shaking (i.e., ru=1.0), and then the process of down-drag develops as the sand reconsolidates and the ground surface settles. Lastly, this analysis is only for the increment of settlements that are expected due to liquefaction; It does not include prior settlements under long-term static loads, and assumes that the soils beneath the liquefied layer will not settle significantly when under the temporary redistribution of pile loads during the liquefaction and reconsolidation process.
Isochrones of excess pore pressure at various times during reconsolidation of the liquefied
sand are shown in Figure 7-3. These isochrones follow the patterns that have been repeatedly observed in physical modeling studies and predicted by numerical analyses (e.g., Florin and Ivanov 1961, NRC 1985). Four different times are illustrated in Figure 7-3, with to being immediately after ru=100% has developed, and t3 being when excess pores pressures have fully dissipated.
The remaining plots in Figure 7-3 show the corresponding values of shaft friction (fs), soil
settlement, and shaft loads (Q) at the same four times. Soil settlement is calculated by integrating the vertical strain (εv) in the soil profile as the sand reconsolidates. Vertical strains are calculated by numerically integrating the product of vertical effective stress changes and sand compressibility over time. The shaft loads (Q) are, as for the conventional neutral plane solution of Fellenius (1972), calculated for two conditions: first, the loads are summed downwards from the pile head (Qdown), and second, the loads are summed upwards from the pile tip (Qup). The neutral plane is then identified as the depth at which Qdown equals Qup, which conceptually corresponds to the pile being in equilibrium with relative soil-pile displacements being downwards above the neutral plane and upwards below the neutral plane. In addition, it is assumed that full shaft friction is mobilized everywhere along the pile, with its direction only depending on the direction of relative soil-pile displacements. The neutral plane location at time t3 is labeled on Figure 7-3 to complete the illustration.
Pile settlements are calculated differently than in the traditional neutral plane solution. In the
approach of Fellenius (1972), the pile settlement would equal to the soil settlement at the neutral plane location. The pile head settlement would then be equal to the settlement of the neutral plane, plus the elastic shortening of the pile between the pile head and the neutral plane. In the present analysis for liquefaction conditions, the pile settlement is calculated incrementally over time as illustrated in Figure 7-4. For example, consider the increment of time from t2 to t3. The neutral plane shifts upwards between these two time steps because the shaft frictions are increasing in the reconsolidating sand. The increment of neutral plane settlement (∆Sn.p.) reflects two contributions, one from the overall increase in soil settlements over the time increment, and the second from the upward shift of the neutral plane location. However, the shaft friction direction more correctly depends on the incremental (as opposed to total) soil-pile relative displacement. For this reason, the increment of pile settlement (∆Spile) is calculated by reference to the neutral plane location at time t3 only, where ∆Spile must equal the increment of soil settlement. The resulting value of ∆Spile is also labeled on Figure 7-4, illustrating how this increment of pile settlement is significantly less than (∆Sn.p.). The total pile settlement is then obtained by numerically integrating the increments of settlement over the time for reconsolidation. For the example in Figure 7-4, the final settlement of the ground surface is 181 mm, the final settlement of the neutral plane is 87 mm, and the final pile settlement is 25 mm.

7-4
The sensitivity of the pile settlement to other combinations of axial capacities and shaft
friction degradation is illustrated in Figure 7-5, showing pile settlements versus ground surface settlements. In this Figure, QA refers to the sum of the downward loads (Qd plus peak down-drag from the crust) at point A in Figure 7-4, while QB refers to the sum of the upward resisting capacities (Qp plus shaft capacity from the lower clay layer) at point B in Figure 7-4. For the previous example, QA was 701 kN and QB was 711 kN, for a ratio of QB/QA of 0.99. For Figure 7-5, the pile length was changed such that QB had values of 561 kN, 631 kN, and 701 kN (giving QB/QA of 0.8, 0.9, and 1.0). Each case was analyzed without shaft friction degradation (R=1) and with some nominal shaft friction degradation (R=0.75). Note that QA is independent of R because it refers to the peak down-drag from the crust.
For the case with QB/QA=1.0, the inclusion of shaft friction degradation substantially reduced
the final pile head settlement, from 37 mm for R=1 to 11 mm for R=0.75. This benefit can be explained as follows. First, the initial portion of ground surface settlement is associated with pore pressure dissipation at the bottom of the sand layer, and thus the shaft friction in the liquefied layer increases at the bottom first, which acts to offset any increase in down-drag from the upper portions of the liquefied sand layer. Since QB/QA=1, the neutral plane stays in or near the lower clay layer and so pile settlements are small. Consequently, the ground surface settlement initially results in an almost equal amount of soil-pile relative displacement that causes degradation of the down-drag load from the crust (for R=0.75). This degradation of down-drag load allows the neutral plane to remain within the lower clay layer until near the very end of settlements. In addition, the final pile settlement was essentially negligible if R was further reduced to 0.5.
For the case with QB/QA=0.8, the pile essentially settles with the ground surface until about
110 mm of settlement has occurred, regardless of the R value. At this point, the shaft friction in the sand layer has increased sufficiently (due to pore pressure dissipation) to start resisting further pile settlements. Subsequently, the pile incrementally settles less than the ground surface and thus the effect of shaft friction degradation starts to appear. The benefits are, however, small for practical purposes. The case with QB/QA=0.90 simply shows behavior intermediate to the other cases. As expected, QB/QA ratios much less than 0.8 simply result in the pile settlement matching the ground surface settlement, while QB/QA ratios much greater than 1.0 result in very small pile settlements. 7.3 Discussion
Down-drag loads from a settling nonliquefied crust may also degrade in response to other
factors, including the formation of sand boils (or even just water boil) up along the sides of the piles and the formation of gaps due to the lateral cyclic loading produced by the shaking. Sand boils and water ejecta are often observed alongside piles, likely because the soil-pile interface provides a preferential path for the escaping materials. The benefits of such boiling and gapping are hard to quantify, and are perhaps best considered as a secondary benefit for design purposes. The benefits of shaft friction degradation at large relative displacements are, however, a more likely benefit, and are potentially much greater than the R=0.75 considered in the above examples. The benefit of shaft friction degradation on settlement is, however, only realized when QB/QA>1.0, and hence serve to make a good situation even better.

7-5
The neutral plane solution presented herein suggests that the shaft friction in the liquefied
layer will increase to essentially drained capacities as pore pressures dissipate. This can cause an increase in the maximum shaft load (Q) that occurs at the final neutral plane location and may be important for the structural design of the pile. However, the inclusion of shaft friction degradation within the crust partially offsets the increase in down-drag from the consolidating sand layer. For the example with QB/QA=1.0 (Figure 7-4), the maximum shaft load was 837 kN for R=1.0, 804 kN for R=0.75, and 771 kN for R=0.5, while QA was 701 kN for all three cases. In addition, the neutral plane solution assumes that full shaft friction is mobilized along the entire shaft (i.e., any nonzero slip produces full shaft friction), whereas the inclusion of t-z behavior in the analysis would reduce the shaft friction near the neutral plane and hence reduce the maximum shaft load at the neutral plane.
Uncertainties in the structural dead loads, down-drag loads from any settling crust, and axial
capacities below the liquefied layer are extremely important, and likely outweigh the uncertainties associated with the neutral plane solution’s approximations.
Down-drag loads can be expected to develop largely after shaking as the liquefied soils
reconsolidate, and thus should be applied in conjunction with the expected service loads for the bridge. While down-drag loads are a possible consequence of seismic shaking, they should not be applied in conjunction with the design seismic loads because they will not occur at the same time.
Estimating the tolerable settlements of a bridge structure for different levels of performance
is an important step in evaluating the consequences of down-drag loads and the relative merits of different mitigation strategies. The magnitude of pile foundation settlement that a bridge can tolerate depends on the performance objectives (e.g., functionality versus life safety), the type of bridge structure, the span length, and the variability of settlements between bridge supports (i.e., differential settlements). Detailed guidance is not currently available for specifying tolerable settlements for bridges under these types of loading conditions and performance targets, and therefore the specification of tolerable settlements requires careful consideration by the structural design team. Note that the tolerable settlements to maintain life safety under down-drag loads can be much greater than commonly specified for static settlements of newly constructed bridges. In some cases it may be more cost effective to repair a bridge after it experiences down-drag induced settlements than to retrofit the structure to prevent the settlements. 7.4 Conclusion
The modified neutral plane solution presented herein provided a method to evaluate the
potential increase in down-drag load (or skin friction) within a liquefied soil as excess pore water pressures dissipate (effective stresses increase) during the reconsolidation process. The analysis method accounts for the variation in excess pore pressures and ground settlements over time as a liquefied layer reconsolidates, the dependence of sand compressibility on excess pore pressure ratio, and the dependence of shaft skin friction on the excess pore pressure ratio.

7-6
The results of a parametric study using the modified neutral plane solution lead to the following simple guidelines, which are very similar to what has been used in practice for conventional down-drag problems. Pile settlements will be small provided that the sum of the expected service load and peak down-drag load from any settling crust do not exceed the sum of the resisting capacities from below the liquefied layer; Down-drag from the liquefied layer does not need to be included in this criteria. The maximum shaft load, however, can be significantly increased by down-drag that develops within the liquefied layer as it reconsolidates. The maximum shaft load can be estimated using a neutral plane solution for the end-of-consolidation condition, with allowance for degradation of shaft friction within the settling crust.
Pile settlements may be as large as the ground surface settlements if the sum of the expected service loads and down-drag loads exceed the resisting capacities from below the liquefied layer. The specification of tolerable pile settlements for different performance targets is a key consideration in weighing the relative benefits of different mitigation strategies, and this aspect of the design process warrants additional study.

7-7
Figure 7-1: Relation between sand compressibility and excess pore pressure ratio for down-drag example.
Figure 7-2: Normalized skin friction in the crust versus normalized relative
displacement.
0 0.2 0.4 0.6 0.8 1Excess pore pressure ratio, ru
0
4
8
12
16
20
mv/m
vo
0.1Srel /D
0.0
1.0
f /f pe
ak
R
0.005

7-8
Figure 7-3: Example of neutral plane solution for down-drag due to liquefaction.
Figure 7-4: Neutral plane solution for an increment of liquefaction-induced down-drag.
0 100
∆u (kPa)
16
12
8
4
0
Dep
th (m
)
0 30
fs (kPa)
0 0.15
Settlement (m)
0 600
Q (kN)
Clay
Clay
Loosesand
Qd=454 kN
t0t1
t2t3
t0t1
t2t3
t0t1
t2t3
t0
t2t3
t3t2
n.p.@ t3
0 0.03
∆S (m)
0 0.15
S (m)
0 600
Q (kN)
16
12
8
4
0
Dep
th (m
)
Clay
Clay
Loosesand
Qd=454 kN
(t2 to t3) t2 t3
t2t3
t3t2
∆Spile
∆Spile
∆Sn.p.
A
B
∆Ssoil → Ssoil → →

7-9
Figure 7-5: Pile versus ground surface settlement for different combinations of capacity and post-peak softening of down-drag.
0 40 80 120 160 200Settlement of soil surface (mm)
0
40
80
120
160
200
Set
tlem
ent o
f pile
hea
d (m
m) R = 1.0
R = 0.75
QB=0.8QA
QB=0.9QA
QB=QA

8-1
8. SUMMARY AND RECOMMENDATIONS
The research described in this report addressed key needs for advancing, both in the short term and long term, our abilities to reliably design pile foundations in soil profiles that are susceptible to liquefaction and lateral spreading. This project was motivated by the large costs associated with the construction of new pile foundations and the remediation of existing foundations in areas where liquefaction and lateral spreading are a concern. The major components and accomplishments of this research were as follows.
• Dynamic centrifuge experiments:
o Provided the first set of experimental data on soil-pile interaction during lateral spreading under realistic earthquake shaking motions.
o Provided an archived data set on the web that can be used by other researchers. • Back-calculation of fundamental soil-pile interaction behavior in the centrifuge tests:
o Provided the first measurements of dynamic soil-pile interaction, including time histories of loads from the nonliquefied surface soils and the underlying liquefied soils, during realistic earthquake shaking motions.
o Provided insight that (1) explains the limitations of monotonic pushover design methods, (2) guided the development of the new finite element tools for this project, and (3) can lead to improved judgments by designers.
• Evaluation of monotonic pushover design methods against the centrifuge models: o Showed that lateral spreading loads on the pile caps included significant components
from interface friction along the sides and base. o Showed that the lateral load versus displacement response of pile caps embedded in
laterally spreading ground is substantially softer than commonly expected based on relations derived for static loading. Provided a simple relation for practice.
o Provided guidelines for design, including recommendations for representing the equivalent p-y behavior of liquefied soil.
o Showed that a pushover design method using these guidelines and common relations for other input parameters produced predictions that ranged from reasonable to conservative compared to the observed responses, provided that a reasonable range of parameter variability and various combinations of parameters were considered in the analysis.
• Nonlinear dynamic finite element analyses: o Implemented p-y, t-z, and q-z materials into OpenSees, the PEER Center’s public
domain, general purpose, finite element program. o Presented initial validations of OpenSees finite element models against centrifuge
data for pile-supported structures in profiles with liquefying sand layers. o These FEM tools provide new abilities for (1) further research using dynamic
analyses to refine the guidelines for simplified pushover design methods, and (2) use on specific projects where the insight of a dynamic analysis may affect design decisions.
The remainder of this summary section provides an overview of the major findings and the resulting recommendations for design practice. More specific details on the findings for each of the above major components can be found in a corresponding earlier section of this report.

8-2
8.1 Archived Experimental Database
A series of dynamic centrifuge model tests were performed to study the behavior of pile foundations in a soil profile comprised of a nonliquefied crust spreading laterally over a loose saturated sand layer. Test variables included single piles and pile groups, different pile diameters (0.36, 0.73, and 1.45-m), different earthquake time histories, different shear strengths for the nonliquefied crust, and different thickness of the liquefiable layer. These tests provided the first detailed data available on soil-pile interaction during lateral spreading under realistic earthquake shaking motions.
These physical model experiments have been archived in data reports that are publicly available through the Center for Geotechnical Modeling (CGM) at UC Davis (http://cgm.engr.ucdavis.edu/). The documentation includes drawings and specifications for all aspects of the experiment, full descriptions of experimental procedures, all electronic digital time histories, and a photographic history of the experiment. These archived data can be used to evaluate analysis or design methodologies as may be proposed or developed by other researchers. As such, the archived data are a lasting resource that can reduce the need for experimental work in future research efforts on this subject. 8.2 Back-Calculated Soil-Pile Interaction in Liquefied & Laterally Spreading Ground
Back-calculation procedures were used to extract more fundamental measurements of soil-pile interaction behavior from the detailed transducer measurements for the centrifuge tests. The back-calculated quantities include the first available time histories of loads from nonliquefied surface soils and underlying liquefied soils during lateral spreading under realistic earthquake shaking motions. The major findings summarized below are the role of the dynamic site response on observed load transfer behavior, the factors affecting the p-y behavior of liquefied sand, and the peak loads imposed on pile caps by laterally spreading nonliquefied soil layers.
Role of dynamic site response on observed load transfer behavior The lateral load imposed on a pile by laterally spreading soil depends on both the total and incremental (cyclic) relative displacements between the soil and pile. Thus, the cyclic component of ground displacements during lateral spreading can result in lateral loads that temporarily act upslope despite the net relative displacement being in the downslope direction. This aspect is important for understanding why lateral loads from nonliquefied surface soils and underlying liquefied soils can act in opposite directions during shaking. The lateral load imposed on a pile by liquefied soil depends on the excess pore water pressures in the far- and near-field (i.e., away from the pile and close to the pile). The cyclic mobility behavior of liquefying sand during dynamic shaking (i.e., site response) causes transient variations in excess pore pressures, such that a soil that develops a peak excess pore pressure ratio of 100% (e.g., “liquefaction”) during shaking will also experience temporary drops in excess pore pressure due to dilatancy during each cycle of shaking. Thus a liquefied soil temporarily "de-liquefies" and regains effective stress, strength, and stiffness during each cycle of shaking. Consequently, the p-y stiffness and capacity between a pile and liquefied soil also

8-3
varies during shaking, with the degree of variation depending on the ground motion and site response characteristics. The peak lateral loads imposed on the piles by the nonliquefied surface layer of clay sometimes coincided with lateral loads from the underlying liquefied soils acting in the opposite direction during shaking and sometimes coincided with lateral loads from the underlying liquefied soils acting in the same direction during shaking. The mechanisms that contribute to this behavior are as follows: (1) the peak lateral loads from the clay crust generally occur when the clay crust has reached its peak downslope movement during a given cycle of loading, (2) the clay crust has zero velocity and is accelerating upslope at this instance, (3) the underlying liquefied soil has experienced a temporary drop in excess pore pressure because of dilatancy under the shear stresses associated with the upslope acceleration of the clay crust, (4) the clay crust generally has bigger incremental and total downslope displacements than the underlying liquefied soil at the end of this cycle of shaking, (5) the pile displaces incrementally downslope due to the loading from the clay crust, and (6) the reaction between the pile and the underlying liquefied soil acts upslope if the incremental pile displacement is sufficiently larger than the incremental soil displacement, and acts downslope if the incremental pile displacement is less than the incremental soil displacement. Therefore, the direction and magnitude of the loading imposed on the piles by the liquefied sand depends on the pile foundation’s lateral stiffness and the soil’s temporary gains in stiffness and strength during the transient drop in pore pressure. For stiff (large diameter) piles, the lateral soil pressures from the crust and liquefying soil tended to be in phase. For more flexible piles, the crust (which moved farther than the liquefying soil) could drag the top of the pile down-slope through the liquefying soil, resulting in an up-slope reaction between the liquefiable soil and the pile. Synthesizing the results of similar experiments performed by other investigators requires considering the differences in their dynamic site responses. Consider, for example, the fact that the blast-induced liquefaction tests by Ashford and Rollins (2002) do not include a free-field dynamic site response, the centrifuge tests by Dobry and Abdoun (2001) involve repetitive sinusoidal motions with a relative modest peak accelerations, and the centrifuge tests by Wilson et al. (2000) and those presented herein involved realistic earthquake motions with relatively strong peak accelerations. The expected consequence of these different site response conditions, if all else is kept equal, would be that the p-y behavior in the liquefied layers should appear to be strongest/stiffest in the centrifuge tests by Wilson et al. (2000) and in this study, intermediate for the centrifuge tests by Dobry and Abdoun (2001), and weakest/softest for the tests by Ashford and Rollins (2002). Such a comparison is not strictly possible because of other differences in the testing conditions, but nonetheless the trends in observed p-y responses are qualitatively consistent with the differences in dynamic site response conditions. Factors affecting the p-y behavior of liquefied soil
The combined findings from this study and prior physical modeling studies show that the
dynamic p-y behavior of liquefied sand can be significantly affected by the following factors: • Relative density (Dr). • Prior relative displacement and its ratio to pile diameter (i.e., y and y/D). • Excess pore pressure ratio in the far- and near-field:

8-4
o Magnitude of cyclic stresses & number of loading cycles imposed by ground shaking. o Magnitude and number of loading cycles between the pile & soil.
• Partial drainage (and hence loading rate, pile diameter, and soil permeability). • Pile installation method.
In addition, the peak lateral pressures that liquefied soil imposes on a pile as it spreads (cyclically ratchets) past the pile, and the timing of those peak pressures relative to the peak lateral loads from any overlying nonliquefied soils, can be strongly affected by the pile foundation’s lateral stiffness. The use of monotonic p-y curves or lateral pressures for representing liquefied soils in pushover design methods is an approximation with unavoidably large uncertainties. The use of monotonic p-y curves or "limiting" lateral pressures for design must be recognized as an attempt to envelope the likely range of responses that might occur simultaneously with other peak loading conditions (e.g., inertial load from a superstructure, or lateral load from a nonliquefied surface layer). Consequently, monotonic p-y curves or lateral pressures would ideally depend on the peak loading condition of interest (e.g., peak inertial load or peak kinematic load) and the factors listed above. At this time, however, the available data only allows for distinction of some of these effects, as will be discussed subsequently. Peak loads on pile caps from laterally-spreading nonliquefied surface layers The peak lateral loads imposed on the pile caps by the laterally spreading nonliquefied surface layer of clay (with a thin cover of sand in some tests) can be reasonably estimated using existing design theories, as follows.
• Interface friction along the sides and base of the pile cap must be included. The observed good contact between the pile cap’s base and the underlying clay may be attributable to a wedging mechanism as follows. As the clay spread laterally beneath the pile cap, it had to flow around the piles (as evidenced by gaps behind the piles), which caused enough vertical distortion of the clay to ensure good contact between it and the base of the pile cap.
• Passive pressures on the uphill face of the pile cap must also include the effect of interface friction. For clay soils, this can be accomplished using a Coulomb wedge method. For sands, a log-spiral approach would be preferred (although this study did not test nonliquefied surface layers of sand). Including the inertia of the clay failure wedge in the analysis (similar to the Mononobe-Okabe approach for sand) was found to be of negligible importance for these tests, but might be warranted in other situations.
• For pile caps embedded in clay, the interface friction (fs) along the sides and base can be reasonably estimated using the α method, wherein fs is related to the clay’s undrained shear strength (cu) as fs = α⋅cu. The α values for the pile caps in these centrifuge tests are near the lower end or slightly below the data shown in the correlation between α and cu in Figure 4-27 that is commonly used to estimate the axial shaft friction capacity of piles in clays.
The normalized lateral load versus relative displacement data for the embedded pile caps
showed much softer responses during lateral spreading than are commonly expected based on experiences with static monotonic loading tests on pile caps or retaining walls. The softer load-

8-5
displacement response of the crust loads on the pile caps is attributed to the influence of underlying liquefied soil on the distribution of stresses in the nonliquefied crust. A simple design relation was proposed for describing the variation of lateral load versus relative displacement for embedded pile caps in laterally spreading soils. Further study is needed to confirm that this relation can be applied to conditions that differ from those covered by the centrifuge tests presented herein.
8.3 Accounting for Liquefaction Effects in Monotonic Pushover Analyses General comments Incorporating the effects of liquefaction in monotonic pushover analyses of pile-supported structures involves a number of simplifying approximations regarding the inertial and kinematic components of interaction. The problem is complicated by the effect that liquefaction has on the seismic site response, the soil-pile-foundation interaction, and the structural response. The present study provides guidance on several aspects of this problem, as summarized below. Areas where additional research is particularly needed are also noted.
The rationale for selecting design soil parameters should be different for seismic pushover analyses than for static design problems. For static design, the common design experience is that softer or weaker soil properties are conservative, and thus the tendency is to select values that are toward the lower range of the laboratory and in situ test data. For seismic design, the emphasis should be on providing the best possible estimates of soil properties and then allowing for appropriate uncertainty (stronger or weaker) in the design process. For example, as discussed later, it is generally unconservative to assume weaker soil properties when performing pushover analyses of lateral spreading loads. Inertial loading only Pushover analyses for inertial loading only, at sites susceptible to liquefaction, should consider two cases: (1) inertial loading without any liquefaction, and (2) inertial loading with liquefaction. For example, the centrifuge tests by Wilson et al. (1997, 2000) showed that the strongest inertial loading condition could occur before or after the generation of significant excess pore pressures during earthquake shaking. Pushover analyses with and without the effects of liquefaction may reasonably bracket such observed responses. For pushover analyses of inertial loading, the effects of liquefaction on p-y behavior may be approximated using the p-multipliers listed in Table 8-1. These recommended values account for the demonstrated importance of relative density, as represented by the SPT N value after normalization for overburden stress, hammer energy, and adjustment to an equivalent clean sand value (as used in liquefaction triggering analyses). While the dynamic p-y behavior of liquefying sand is substantially affected by several other important factors, the available information does not provide sufficient basis for incorporating such effects in a convenient format at this time. It is also noted that the analyses in this report explored alternative methods of representing the p-y resistance of liquefied sand (i.e., using an undrained strength ratio, and a degradation of capacity that depended on excess pore pressure ratio). While the above methods may be conceptually

8-6
more attractive, the p-multiplier approach (use of a factor less than one, applied to weaken the API p-y curves for drained sand) has the advantage of being the simplest to implement with a common existing program (LPILE) , and likely offers as much accuracy as any of the methods. In this regard, it is suggested that the derived p-y curves for liquefied soil (Table 8-1) may reasonably be scaled by a factor of two, higher or lower, to account for their uncertainty (e.g., similar uncertainties have even been suggested for non-liquefaction conditions, ATC 1996, Curras et al. 2001).
Table 8-1. Recommended p-multipliers for liquefied soil in monotonic pushover analyses of inertial loading case only.
SPT (N1)60-CS
p-multiplier for the effects of liquefaction, mp [for inertial load analysis only]
< 8 0.1 8 – 16 0.2 16 – 24 0.3
> 24 0.5 a Inertial forces must also consider the case of no liquefaction, in which case mp =1.
The inertial load that should be used in the case with liquefaction is the subject of ongoing research. Centrifuge data and finite element studies clearly show that the dynamic site and structural responses are strongly affected by liquefaction (e.g., Figures 6-9 to 6-11), but the generalization of those observations into guidelines for pushover analyses requires more systematic evaluations over a broader range of conditions. Kinematic loading only Kinematic loads from laterally spreading ground can be included in monotonic pushover analyses by either (1) removing the p-y springs and imposing lateral pressures over the depth of lateral spreading or (2) imposing soil displacements on the “free-field” ends of the p-y springs (see Figure 1-2). The two approaches will give identical answers for elastic piles if the imposed pressures (in the first approach) are equal to the ultimate capacities of the p-y springs and the soil displacements are large enough to push the p-y springs to their ultimate capacities. The choice of approach is therefore a matter of convenience whenever the estimated soil displacements are relatively large (e.g., feet). The second approach, however, has the advantage that it can more rationally analyze more complicated cases, including the ability to predict the location of plastic hinges and ductility demands on yielding piles (e.g., Tokimatsu and Asaka 1998) and cases where the estimated ground displacements are expected to remain relatively modest (e.g., inches) even with allowances for the uncertainty in the standard methods for predicting lateral spreading displacements. Peak lateral loads imposed on pile caps by laterally spreading nonliquefied surface soils can be reasonably predicted using existing design theories, provided that the effects of interface friction are included in estimating the passive pressure on the upslope face and the frictional forces along the sides and base of the pile cap. Additional details on estimating such loads for

8-7
design were previously discussed in connection with the back-calculated loads from the centrifuge tests. Whether to include base friction when calculating the total soil load on the pile cap depends on whether the soil is expected to be in contact with the pile cap base during lateral spreading. It is often assumed that the soil will have settled over time, leaving a gap between the bottom of the pile cap and the soil surface. The possibility of such a gap means that base friction is often neglected in static design. During lateral spreading, however, wedging of the soil beneath the pile cap could cause the soil to squeeze under the pile cap and push up against the bottom of the pile cap even if a gap had existed prior to the lateral spreading. In other situations, lateral spreading may be associated with vertical settlements that are sufficiently large (e.g., close to a steep channel slope) to create or enlarge a gap between the soil and pile cap base. For design against lateral spreading, the friction between the soil and the pile cap base should be excluded from analysis only if the designer is confident that a gap will remain beneath the pile cap throughout the lateral spreading.
The lateral load versus relative displacement relations for embedded pile caps in lateral spreading ground may be softened compared to the relations commonly used for static monotonic loading of pile caps or retaining walls. The softer load-displacement response of the crust loads on pile caps during lateral spreading is justified based on the influence of the underlying liquefied soil on the distribution of stresses in the nonliquefied crust. A simple design relation was proposed for describing the lateral load versus relative displacement response for embedded pile caps in laterally spreading soils. The peak lateral loads on the pile caps were only mobilized for short periods of time during individual cycles of shaking, even for the strongest earthquake events. A more sustained level of lateral load, both during and after shaking, was generally about 30-50% smaller than the peak value in these centrifuge tests. The lower sustained loads may be due to possible post-peak softening or cyclic degradation in the passive pressures and interface friction on the pile cap, stress redistribution from cracking in the surrounding soil, and the formation of gaps between the soil and pile cap as the lateral spreading displacements progressively increased.
Peak lateral loads imposed on piles by laterally spreading nonliquefied soils can reasonably be predicted using existing p-y relations (e.g., Matlock 1970 for clay, API 1993 for sand). Note, however, that the cyclic loading adjustments that exist for the above p-y relations should not be used. Such cyclic loading adjustments were derived for different loading conditions and would under-estimate the peak lateral loads during lateral spreading.
The monotonic p-y curves or lateral pressures used to represent the liquefied layers in a pushover analysis of lateral spreading conditions are highly uncertain, as previously discussed in comparison to back-calculated behavior from centrifuge tests. For example, the pressures from liquefied layers can vary dramatically in their magnitude and phasing relative to loads from any nonliquefied surface layer. Provided that these limitations are recognized, the following guidelines are offered for the two common approaches to pushover analyses (Figure 1-2).
• For pushover analyses that impose lateral limit pressures and remove the p-y springs over the depth of liquefaction-induced lateral spreading: The liquefied soil may be represented

8-8
as imposing a lateral load of p = 0.6⋅σvc′⋅b, which corresponds to the load predicted for a shear strength ratio of S/σvc′ of about 0.07. Note that the presumption of downslope pressures corresponding to S/σvc′ of about 0.07 in the liquefied layer is often conservative, but not necessarily in all cases. The lateral soil pressures from the liquefied soil can be much larger than indicated here, but in these cases the reaction of the liquefying soil tends to be out-of-phase from the crust loads. The values of p = 0.6⋅σvc′⋅b and S/σvc′ of about 0.07 may be considered to be a reasonable approximation of the loads from the liquefied soil that are likely to act in-phase with the down-slope crust loads.
• For pushover analyses that impose soil displacements as kinematic loads on the free-field ends of the p-y springs over the depth of liquefaction-induced lateral spreading: The liquefied soil springs may be scaled from their nonliquefied values to produce an ultimate resistance of pu = 0.6⋅σvc′⋅b. Thus, when the imposed soil displacements are large enough to mobilize the full capacity of the p-y springs, the results will be comparable to the lateral limit pressures discussed above. Again, this value of pu should only be viewed as a reasonable approximation of the loads from the liquefied soil that are likely to act in-phase with the down-slope crust loads.
• The above recommendations for representing lateral loads from liquefied soil during laterally spreading are based primarily on experiences with loose sands where the corresponding (N1)60-CS values would be less than 10 or 15. For denser sands [e.g., (N1)60-CS values of 15 to 30], the actual p-y resistance after liquefaction will be stiffer and stronger than for loose sands, but the lateral spreading displacements and the cyclic increments of lateral spreading displacements will also be smaller. Consequently, the mobilized downslope loads that act in phase with lateral loads from any nonliquefied surface layer (crust) may, or may not, increase with increasing (N1)60-CS values. Since the p-y relations used in monotonic pushover analyses are intended to envelope the mobilized downslope loads at the peak loading condition during lateral spreading, it follows that the appropriate pu values for the liquefied soil springs may, or may not, vary with (N1)60-CS values. Pending further experimental studies, the uncertainty in the above recommendations must be accounted for in design.
Axial load-displacement behavior of piles in a group can contribute substantially to the
predicted substructure and superstructure displacements, and thus should be included unless the effects of axial response can be shown to be insignificant. Sands with a factor of safety greater than unity against triggering of liquefaction can still develop limited shear strains and excess pore pressures, and these can have an important effect on the prediction of pile head displacements. The exception to this observation was the 0.36-m diameter SP pile that developed a plastic hinge, in which case the pile head displacement was insensitive to the strain in the underlying dense sand, as expected. For the piles that did not develop plastic hinges, the BNWF analyses presented herein underestimated the pile head displacements by 17 to 74% (for the MP, GN, and BP piles) when the underlying dense sand was assumed to have experienced zero shear strain. The accuracy of these predicted pile head displacements improved greatly when the dense sand layer was assigned an average shear strain of 0.5% and the dense sand p-y springs were softened for the effects of excess pore pressures (although still well below liquefaction triggering levels). Similar conclusions would also apply

8-9
to pushover analyses that impose lateral limit pressures and remove the p-y springs over the depth of liquefaction-induced lateral spreading. Pushover analyses performed in accord with the above recommendations, and using common design relations for other input parameters, produced predictions of peak bending moments that ranged from reasonable to conservative (within -12% to +62% of recorded values) for the centrifuge tests described herein. For the 0.36-m diameter SP pile that developed a plastic hinge, the analyses correctly predicted the occurrence of plastic hinging but were in significant error in terms of the plastic-hinge location and peak bending curvature. For flexible piles, the location of a plastic hinge is largely determined by the shear strain distribution in the lateral spreading soil, which is difficult to predict in field situations. Kinematic and inertial load combinations The appropriate kinematic and inertial load combinations for pushover analyses involving liquefaction are also a topic of ongoing research. The centrifuge tests showed that the peak kinematic loads from laterally spreading ground often occur during strong shaking, and therefore would overlap with the inertial loads from a superstructure. The appropriate load combinations may be (1) peak kinematic load plus some fraction of peak inertial load, and (2) peak inertial load plus some fraction of peak kinematic load. The appropriate fractions to be used will depend on the relative phasing of the two load contributions, which will be a function of the earthquake motion’s characteristics (e.g., frequency content, duration, intensity), the dynamic site response characteristics (e.g., effective site period, timing of liquefaction), the pile foundation stiffness, and the dynamic superstructure response characteristics (e.g., effective periods). Pending results of ongoing centrifuge tests and more systematic finite element parameter studies, the choice of load combination fractions remains largely a matter of judgment. This issue is being addressed in a continuation of this research project. 8.4 Nonlinear Time History Analyses
Soil spring material models (i.e., p-y, t-z, q-z) for BNWF-type analyses involving non-liquefaction or liquefaction conditions were developed and implemented into OpenSees, the PEER Center’s public domain, finite element platform. Comparisons of calculated and recorded responses for single-pile-supported structures in liquefying sand profiles showed reasonably good ability to capture the principle features of behavior and the observed effects of sand relative density on the soil profile and structural responses. Additional comparisons to other centrifuge test data are ongoing.
If they can be further verified, the finite element tools should provide a potentially valuable
ability to enable sophisticated numerical parametric studies to augment centrifuge model test data that may help refine the guidelines for simplified pushover design methods. In the longer term, the FE tools may become more practical and eventually usable in the design office, especially for refined studies of unusual situations where additional insight is needed or for critical bridges where additional effort is justified.

8-10
8.5 Neutral Plane Solution for Liquefaction-Induced Down-drag on Vertical Piles
A modified neutral plane solution was used to evaluate the potential increase in down-drag load (or skin friction) within a liquefied soil as excess pore water pressures dissipate (effective stresses increase) during the reconsolidation process. The analysis method accounts for the variation in excess pore pressures and ground settlements over time as a liquefied layer reconsolidates, the dependence of sand compressibility on excess pore pressure ratio, and the dependence of shaft skin friction on the excess pore pressure ratio.
The results of a parametric study using the modified neutral plane solution lead to the following simple guidelines, which are very similar to what has been used in practice for conventional down-drag problems. Pile settlements will be small provided that the sum of the dead load and peak down-drag load from any settling crust do not exceed the sum of the resisting capacities from below the liquefied layer; Down-drag from the liquefied layer does not need to be included in this criteria. The maximum shaft load, however, can be significantly increased by down-drag that develops within the liquefied layer as it reconsolidates. The maximum shaft load can be estimated using a neutral plane solution for the end-of-consolidation condition, with allowance for degradation of shaft friction within the settling crust.
Pile settlements can be as large as the ground surface settlements if the sum of the expected service loads and down-drag loads exceed the resisting capacities from below the liquefied layer. The specification of tolerable pile settlements for different performance targets is a key consideration in evaluating mitigation strategies, and this aspect of the design process warrants additional study.

R-1
REFERENCES
API(1993). Recommended Practice for Planning, Design, and Constructing Fixed Offshore Platforms. API RP 2A - WSD, 20th ed., American Petroleum Institute.
Abdoun, T. H. (1997). “Modeling of Seismically induced lateral spreading of multi-layer soil deposit and its effect on pile foundations.” Ph.D. Thesis, Dept. of Civil Engineering, Rensselaer Ploytechnic Institute, Troy, NY.
Abdoun, T. H., and Dobry, R. (1998). “Seismically induced lateral spreading of two-layer sand deposit and its effect on pile foundations.” Proc. Intl. Conf. Centrifuge ’98, (T. Kimura, O. Kusakabe, and J. Takemura, eds.), Tokyo, Japan, Sept. 23-25, Vol. 1, pp. 321-326.
Abdoun, T. H., Dobry, R., O’Rouke, T. D., and Chaudhuri, D. (1996). “Centrifuge modeling of seismically-induced lateral deformation during liquefaction and its effects on a pile foundation.” Sixth Japan – U. S. Workshop on Earthquake Resistant Design of Lifeleine Facilities and Countermeasures Against Soil Liquefaction, Report NCEER-96-0012, SUNY, Buffalo, NY, pp. 525 - 539.
Adachi, N., Miyamoto, Y., and Koyamada, K. (1998). “Shaking table test and lateral loading test for pile foundation in saturated sand.” Proc. Intl. Conf. Centrifuge ’98, (T. Kimura, O. Kusakabe, and J. Takemura, eds.), Tokyo, Japan, Sept. 23-25, Vol. 1, pp. 289-294.
Adib, M., Villet, W. C. B., and Nisar, A. (1995). “Prestressed concrete piles under seismic loading: Case history.” Proc. 3rd Intl. Conf. on Recent Advances in Geotechnical Earthquake Engineering and Soil Dynamics, Univ. Missouri-Rolla, Vol. III, 1209-1213.
Akiyama, T., and Morimoto, H. (1997). “The damage and reinforcement of piles for oil storage tanks in a thermal power station.” Preprint from a US-Japan workshop. Provided by the Kansai Electric Power Co., Inc., Japan.
Arulnathan, R., Boulanger, R. W., Kutter, B. L., and Sluis, B. (2000). "New tool for shear wave velocity measurements in model tests." Geotechnical Testing Journal, GTJODJ, ASTM, 23(4): 444-453.
Ashford, S. A, and Rollins, K. M. (2002). TILT: The Treasure Island Liquefaction Test: Final Report, Report SSRP-2001/17, Department of Structural Engineering, University of California, San Diego.
Ashford, S.A., Rollins, K.M, Baez, J.I. (2000). “Comparison of deep foundation performance in improved and non-improved ground using blast-induced liquefaction.” Soil Dynamics and Liquefaction 2000, Proc. of Sessions of Geo-Denver 2000, Geotechnical Special Publication No. 107, Geo-Institute of the American Society of Civil Engineers, ASCE, Reston, Virginia, pp. 20-35.
Applied Technology Council (1996). “Improved Seismic Design Criteria for California Bridges: Provisional Recommendations ATC-32.” June.
Berrill, J. B., Christensen, S. A., Keenan, R. J., and Okada, W. (1997). “Lateral-spreading loads on a piled bridge foundation.” Seismic Behavior of Ground and Geotechnical Structures, Seco e Pinto (ed.), Balkema, Rotterdam, 173-183.

R-2
Berrill, J.B, Christensen, S.A., Keenan, R.P., Okada, W & Pettinga, J.R. (2001). “Case study of lateral spreading forces on a piled foundation.” Geotechnique, 51, 501-17.
Boulanger, R. W., Curras, C. J., Kutter, B. L., Wilson, D. W., and Abghari, A. (1999). "Seismic soil-pile-structure interaction experiments and analyses." Journal of Geotechnical and Geoenvironmental Engineering, ASCE, 125(9): 750-759.
Boulanger, R.W., Wilson, D.W., Kutter, B.L., and Abghari, A. (1997). "Soil-pile-superstructure interaction in liquefiable sand." Transportation Research Record No. 1569, TRB, NRC, National Academy Press, 55-64.
Brandenberg, S. J., Chang, D., Boulanger, R. W., and Kutter, B. L. (2003). “Behavior of piles in laterally spreading ground during earthquakes – centrifuge data report for SJB03.” In press, Center for Geotechnical Modeling, Department of Civil Engineering, University of California, Davis.
Brandenberg, S. J., Singh, P., Boulanger, R. W., and Kutter, B. L. [2001 (a)]. “Piles under earthquake loading – centrifuge data report for SJB01.” Report No. UCD/CGMDR-01/02, Center for Geotechnical Modeling, Department of Civil Engineering, University of California, Davis.
Brandenberg, S. J., Singh, P., Boulanger, R. W., and Kutter, B. L. [2001 (b)]. “Piles under earthquake loading – centrifuge data report for SJB02.” Report No. UCD/CGMDR-01/06, Center for Geotechnical Modeling, Department of Civil Engineering, University of California, Davis.
Brandenberg, S. J., Singh, P., Boulanger, R. W., and Kutter, B. L. [2001 (c)]. “Behavior of piles in laterally spreading ground during earthquakes.” Proc. Sixth Caltrans Seismic Research Workshop, 2-106.
Curras, C. J., Hutchinson, T. C., Boulanger, R. W., Chai, Y.-H., and Idriss, I. M. (2001). “Lateral loading and seismic response of CIDH pile supported bridge structures.” Foundations and Ground Improvement, T. L. Brandon, ed., Geotechnical Special Pub. 113, ASCE, 260-275.
Dennis, N. D. and Olson, R. E. (1983). “Axial capacity of steel pipe piles in clay,” Proc. ASCE Conf. On Geot. Practice in Offshore Engrg., Austin, Texas, pp. 370-388.
Dobry, R., Taboada, V, and Liu., L. (1995). “Centrifuge modeling of liquefaction effects during earthquakes.” Proc. 1st Intl. Conf. On Earthquake Geotechnical Engineering, K. Ishihara, ed., Tokyo, Japan, Vol. 3, pp. 1291-1324.
Dobry, R., and Abdoun., T. (2001). “Recent studies on seismic centrifuge modeling of liqefaction and its effect on deep foundations.” SOAP-3, Proc. 4th Intl. Conf. On Recent Advances in Geotechnical Earthquake Engrg. And Soil Dynamics, S. Prakash, ed, San Deigo, CA.
Duncan, M.J., and Mokwa, R.L. (2001). “Passive Earth Pressures: Theories and Tests.” J. of Geotechnical and Geoenvironmental Engrg., ASCE, Vol. 127(3), 248-257.
Elgamal, A., and Yang, Z. (2002). Pressure-dependent multiple-yield surface soil models, OpenSees source code, http://opensees.berkeley.edu/.

R-3
Fellenius, B. H. (1972). “Downdrag on long piles in clay due to negative skin friction,” Canadian Geotechnical Journal, 9(4), 323-337.
Florin, V. A., and Ivanov, P. L. (1961). “Liquefaction of saturated sandy soil.” Proceedings, 5th International Conference on Soil Mechanics and Foundation Engineering, Paris, p. 106.
Fujii, S., Cubrinovski, M., Tokimatsu, K. and Hayashi, T. (1998). “Analyses of damaged and undamaged pile foundations in liquefied soils during the 1995 Kobe earthquake.” Geotechnical Earthquake Engineering and Soil Dynamics III, Geotechnical Special Publication No. 75, ASCE, Vol. 2, 1187-1198.
Fujii, S., Isemoto, N., Satou, Y., Kaneko, O., Funahara, H., Arai, T., and Tokimatsu, K. (1998). “Investigation and analysis of a pile foundation damaged by liquefaction during the 1995 Hyogoken-Nambu earthquake.” Special Issue of Soils and Foundations, Japanese Geotechnical Society, 179-192.
Georgiadis, M. (1983). “Development of p-y curves for layered soils.” Proc., Geotechnical Practice in Offshore Engineering, ASCE, pp. 536-545.
Girard, J., and Taylor, R. (1994). ‘‘Blade geometry and soil permeability effects on thin blade plow resistance in dense, saturated, cohesionless soils—Phase II report.’’ Rep. TM-2026-OCN, Naval Facilities Engineering Service Center, Port Hueneme, Calif.
Goh, S. H., and O’Rouke, T. D. (1999). “Limit state model for soil-pile interaction during lateral spread.” Seventh U. S. – Japan Workshop on Earthquake Resistant Design of Lifeleine Facilities and Countermeasures Against Soil Liquefaction, Report NCEER-99-0019, SUNY, Buffalo, NY, pp. 237 - 260.
Haigh, S. K. (2002). “Effects of earthquake-induced liquefaction on pile foundations in sloping ground.” Ph.D. dissertation, Cambridge University, UK.
Hamada, M., and Wakamatsu, K. (1996). “Liquefaction, ground deformation, and their caused damage to structures.” Special Report on the 1995 Hyogoken_Nanbu Earthquake – Investigation into Damage to Civil Engineering Structures, Japan Society of Civil Engineers, 1-47.
Horikoshi, K., Ohtsu, H., Tanaka, M., and Sueoko, T. (1997). “Centrifuge modeling of a pile subjected to lateral spreading of liquefied soil.” Geotechnical Engineering in Recovery from Urban Earthquake Disaster, 3rd Kansai International Geotechnical Forum on Comparative Geotechnical Engineering (KIG – Forum 97), Kansai Branch, Japanese Geotechnical Society, Osaka, Japan.
Horikoshi, K, Tateishi, A., and Fujiwara, T. (1998). “Centrifuge modeling of a single pile subjected to liquefaction-induced lateral spreading.” Special Issue of Soils and Foundations, Japanese Geotechnical Society, 193-208.
Horikoshi, P., Fujiwara, T., and Tateishi, A. (1998). “Pile behavior during seismically-induced lateral spreading of liquefied sand.” Proc. Intl. Conf. Centrifuge ’98, (T. Kimura, O. Kusakabe, and J. Takemura, eds.), Tokyo, Japan, Sept. 23-25, Vol. 1, pp. 377-382.
Iai, S. (2002). “Analysis of soil deformation around a cylindrical rigid body.” Proc. U.S.-Japan Seminar on Seismic Disaster Mitigation in Urban Area by Geotechnical Engineering, I. Towhata and R. W. Boulanger, eds., Anchorage, Alaska, June.

R-4
JRA (2002). Specifications for highway bridges. Japan Road Association, Preliminary English Version, prepared by Public Works Research Institute (PWRI) and Civil Engineering Research Laboratory (CRL), Japan, November.
Kagawa, T., Taji, Y., Sato, M., and Minowa, C. (1997). “Soil-pile-structure interaction in liquefying sand from large scale shaking table tests and centrifuge tests.” Seismic Analysis and Design for Soil-Pile-Structure Interactions, Geotechnical Special Publication No. 70, ASCE, 69-84.
Karube, D., and Kimura, M. (1996). “Damage to foundations of railway structures.” Special Issue of Soils and Foundations, Japanese Geotechnical Society, 201-210.
Kawamura, S., Nishizawa, T., and Wada, K. (1985). “Damage of pile due to liquefaction being revealed in 20 years after earthquake.” Nikkei Architecture, 7-29: 130-134 (in Japanese).
Koseki, J., Matsuo, O., Kondo, K., and Yoshizawa, T. (1998). “Effects of compaction of liquefiable sandy soil surrounding pile foundation.” Centrifuge 98, T. Kimura, O. Kusakabe & J. Takemura (eds), Balkema, Rotterdam, 1:277-282.Kutter, B. L. (1992)."Dynamic centrifuge modeling of geotechnical structures." Transportation Research Record 1336.
Kulasingam, R. (2003). Effects of void redistribution on liquefaction-induced deformations. Ph.D. thesis, University of California, Davis, CA.
Kutter, B. L., and Voss, T. (1995). ‘‘Analysis of data on plow resistance in dense, saturated, cohesionless soil.’’ Contract Rep. CR 95.004, Naval Facilities Engineering Service Center, Port Hueneme, Calif.
Lee, K.L., and Albaisa, A. (1974). “Earthquake induced settlements in saturated sands.” J. Geotech. Engrg., ASCE, 100(4), pp. 387-405.
Martin, G. R., March, M. L., Anderson, D. G., Mayes, R. L., and Power, M. S. (2002). “Recommended design approach for liquefaction induced lateral spreads.” Proc. Third National Seismic Conference and Workshop on Bridges and Highways, MCEER-02-SP04, Buffalo, N.Y.
Matlock, H. (1970). “Correlations of design of laterally loaded piles in soft clay.” Proc. Offshore Technology Conference, Houston, TX, Vol 1, No.1204, pp. 577-594.
Matlock, H., Foo, S.H., and Bryant, L.L. (1978). "Simulation of lateral pile behavior," Proceedings, Earthquake Engineering and Soil Dynamics, ASCE, pp. 600-619.
Matsui, T. (1993). “Case studies on cast-in-place bored piles and some considerations for design.” Deep Foundations on Bored and Auger Piles, Van Impe (ed.), Balkema, Rotterdam, 77-101.
Matsui, T., and Oda, K. (1996). “Foundation damage of structures.” Special Issue of Soils and Foundations, Japanese Geotechnical Society, 189-200.
Matsui, T., Kitazawa, M., Nanjo, A. and Yasuda, F. (1997). “Investigation of damaged foundations in the Great Hanshin earthquake disaster.” Seismic Behavior of Ground and Geotechnical Structures, Seco e Pinto (ed.), Balkema, Rotterdam, 235-242.
Meyersohn, W. D., O'Rourke, T. D. and Miura, F., (1992). “Lateral spread effects on reinforced concrete pile foundations.” Proc. 5th US-Japan Workshop on Earthquake Disaster Prevention for Lifeline Systems, Tsukuba, pp. 173-196.

R-5
Mokwa, R. L., and Duncan, J. M. (2000). “Investigation of the resistance of pile caps and integral abutments to lateral loading.” A report of research performed under sponsorship of the Virginia Transportation Research Council, Virginia Tech, Blacksburg, VA.
Mokwa, R.L., and Duncan, M.J. (2001). “Experimental Evaluation of Lateral-Load Resistance of Pile Caps.” J. of Geotechnical and Geoenvironmental Engrg., ASCE, Vol. 127(2), 185-192.
Mononobe, N. and Matsuo, H. (1929). “On the determination of earth pressures during earthquakes.” Proceedings, World Engineering Congress, 9 p.
Mosher, R.L. (1984). "Load Transfer Criteria for Numerical Analysis of Axial Loaded Piles in Sand." US Army Engineering Waterways Experimental Station, Automatic Data Processing Center, Vicksburg, Mississippi, January.
Nishizawa, S., Hashimoto, M., Sakata, Y., and Sonoi, K. (1998). “Investigation and analysis of a landing pier of steel pipe piles damaged by the 1995 Hyogoken-Nambu Earthquake.” Special Issue of Soils and Foundations, Japanese Geotechnical Society, 133-145.
National Research Council [NRC] (1985). Liquefaction of Soils During Earthquakes. National Academy Press, Washington, D.C.
Ogasawara, M., Tani, K., Sato, M., and Miyata, K. (1998). “Preventing pile-supported structure from lateral ground flow behind sheet pile wall.” Centrifuge 98, T. Kimura, O. Kusakabe & J. Takemura (eds), Balkema, Rotterdam, 1:383-388.
Oh-Oka, H., Onishi, K., Nanba, S., Mori, T., Ishikawa, K., and Shimazu, S. (1997). “Liquefaction-induced failure of piles in 1995 Kobe earthquake.” Geotechnical Engineering in Recovery from Urban Earthquake Disaster, 3rd Kansai International Geotechnical Forum on Comparative Geotechnical Engineering (KIG – Forum 97), Kansai Branch, Japanese Geotechnical Society, Osaka, Japan.
Oh-Oka, H., Fukui, M., Hatanaka, M., Ohara, J., and Honda, S. (1998). “Permanent deformation of steel pipe piles penetrating compacted fill at whart on Port Island.” Special Issue of Soils and Foundations, Japanese Geotechnical Society, 147-162.
Ohtomo, K. (1996). “Soil force on conduit pile system due to liquefaction-induced lateral flow.” Sixth Japan – U. S. Workshop on Earthquake Resistant Design of Lifeline Facilities and Countermeasures Against Soil Liquefaction, Report NCEER-96-0012, SUNY, Buffalo, NY, pp. 541 - 550.
Ohtsuki, A., Fukutake, K., and Sato, M. (1998). “Analytical and centrifuge studies of pile groups in liquefiable soil before and after site remediation.” Earthquake Engineering and Structural Dynamics, John Wiley & Sons, 27:1-14.
Okabe, S. (1926). “General theory of earth pressures,” Journal of the Japan Society of Civil Engineering, Vol. 12, No. 1.
O’Neill, M. W., and Gazioglu, S. M. (1984). “An evaluation of p-y relationships in clays.” Report to American Petroleum Institute, PRAC 82-41-2, University of Houston, TX.
O’Neil, M. W., and Murchison, J. M. (1983). “An evaluation of p-y resistance in sands.” Report to American Petroleum Institute, PRAC 82-41-1, University of Houston, TX.

R-6
Palmer, A. C. (1999). ‘‘Speed effects in cutting and plowing.’’ Geotechnique, London, 49(3), 285–294.
Ramos, R., Abdoun, T. H., and Dobry, R. (1999). “Centrifuge modeling of effect of superstructure stiffness on pile bending moments due to lateral spreading.” Seventh U. S. – Japan Workshop on Earthquake Resistant Design of Lifeleine Facilities and Countermeasures Against Soil Liquefaction, Report NCEER-99-0019, SUNY, Buffalo, NY, pp. 599 - 608.
Reese, L. C., Wang, S. T., and Long, J. H. (1989). “Scour from cyclic lateral loading of piles.” Proc. Offshore Technology Conference, Houston, TX, No. 6005, pp. 395-401.
Reese, L. C., Wang, S. T., Isenhower, W. M., Arrelaga, J.A., and Hendrix, J. A. (2000). LPILE Plus Verion 4.0m, Ensoft, Inc. Austin, TX.
Reese, L. C. and M. W. O'Neill. (1987). "Drilled Shafts: Construction Procedures and Design Methods." Report No. FHWA-HI-88-042, U.S. Department of Transportation, Federal Highway Administration, Office of Implementation, McLean, Virginia.
Robins, P. N., Tarin, R. L., Thompson, D. J., Higuchi, S., Mori, T., and Kutter, B. L. (1999). "Centrifuge modeling of the seismic response of LNG production facility structures: Phase III." Report UCD/CGM-99/02, University of California, Center for Geotechnical Modeling, Davis, CA.
Rollins, K. M., and Sparks, A. (2002). “Lateral resistance of full-scale pile cap with gravel backfill.” J. of Geotechnical & Geoenvironmental Engrg., ASCE, Vol. 128, No.9, pp. 711-723.
Sasaki, Y., Koseki, J., Shioji, K., Konishi, M., Kondo, Y., and Terada, T. (1997). “Damage to Higashinada sewage treatment plant by the 1995 Hyogoken-Nanbu earthquake.” Seismic Behavior of Ground and Geotechnical Structures, Seco e Pinto (ed.), Balkema, Rotterdam, 297-306.
Satoh, H., Ohbo, N., and Yoshizako, K. (1998). “Dynamic test on behavior of pile during lateral ground flow.” Centrifuge 98, T. Kimura, O. Kusakabe & J. Takemura (eds), Balkema, Rotterdam, 1:327-332
Sato, M., and Zhang, J. M. (1998). “Liquefaction-induced damage to caisson-type quay wall and its neighboring pile foundation.” Proc. Intl. Conf. Centrifuge ’98, (T. Kimura, O. Kusakabe, and J. Takemura, eds.), Tokyo, Japan, Sept. 23-25, Vol. 1, pp. 371-376.
Seed, H.B. 1986. Design problems in soil liquefaction. J. Geotechnical Engrg., ASCE, 113(8):827-845.
Seed, H.B., Martin, P. P., and Lysmer, J. (1975). “The generation and dissipation of pore water pressures during soil liquefaction.” Rept. No. UCB/EERC-75/26, Univ. of California, Berkeley.
Singh, P. (2002). “Behavior of piles in earthquake-induced lateral spreading.” MS thesis, University of California, Davis.
Singh, P., Subramanian, P. K., Boulanger, R. W., and Kutter, B. L. [2000 (a)]. “Piles under earthquake loading – centrifuge data report for PDS01.” Report No. UCD/CGMDR-00/05,

R-7
Center for Geotechnical Modeling, Department of Civil Engineering, University of California, Davis.
Singh, P., Boulanger, R. W., and Kutter, B. L. [2000 (b)]. “Piles under earthquake loading – centrifuge data report for PDS02.” Report No. UCD/CGMDR-00/06, Center for Geotechnical Modeling, Department of Civil Engineering, University of California, Davis.
Singh, P., Brandenberg, S. J., Boulanger, R. W., and Kutter, B. L. (2001). “Piles under earthquake loading – centrifuge data report for PDS03.” Report No. UCD/CGMDR-01/01, Center for Geotechnical Modeling, Department of Civil Engineering, University of California, Davis.
Stas, C. V. and Kulhawy F. H. (1984). Critical Evaluation of Design Methods for Foundations under Axial Uplift and Compression Loading, EPRI Report EL-3771, Palo Alto, Calif., 198 pp.
Taji, Y., Sato, M., and Yanagisawa (1998). “Modeling of a prototype soil-pile-structure system during seismic ground liquefaction.” Proc. Intl. Conf. Centrifuge ’98, (T. Kimura, O. Kusakabe, and J. Takemura, eds.), Tokyo, Japan, Sept. 23-25, Vol. 1, pp. 283 – 288.
Takahashi, A., Takemura, J., Kawaguchi, Y., Kusakabe, O., and Kawabata, N. (1998). “Stability of piles pier subjected to lateral flow of soils during earthquake.” J. Geotechnical and Geoenvironmental Engineering, ASCE, Vol. 124, No. 12, pp. 1195 - 1206.
Tamura, K., and Azuma, T. (1997). “Experimental study of the effects of liquefaction-induced ground flow on bridge foundations.” 13th US-Japan Bridge Engineering Workshop, US-Japan Panel on Wind and Seismic Effects, UJNR Tsukuba, Japan, Oct 2 and 3.
Tao, X., Kagawa, T., Minowa, C., and Abe, A. (1998). “Verification of dynamic soil-pile interaction.” Geotechnical Earthquake Engineering and Soil Dynamics III, Geotechnical Special Publication No. 75, ASCE, Vol. 2, 1199-1210.
Takahashi, A., Takemura, J., Kawaguchi, Y., and Kusakabe, O. (1998). Stability of piled pier subjected to lateral flow of soils during earthquake. Centrifuge 98, T. Kimura, O. Kusakabe & J. Takemura (eds), Balkema, Rotterdam, 1:365-370.
Terzaghi, K., Peck, R. B., and Mesri, G. (1996). Soil Mechanics in Engineering Practice. 3rd ed. New York, John Wiley and Sons, 549 pp.
Tokida, K., Matsumota, H., & Iwasaki, H. (1992). “Experimental study on drag acting on piles in ground flowing by soil liquefaction.” Proc. 4th US-Japan Workshop on Earthquake Resitant Design of Lifeline Facilities and Countermeasures for Soil Liquefaction, NCEER report 92-0019, SUNY, Buffalo, 511-523.
Tokimatsu, K., Mizuno, H., and Kakurai, M. (1996). “Building damage associated with geotechnical problems.” Special Issue of Soils and Foundations, Japanese Geotechnical Society, 219-234.
Tokimatsu, K., Oh-Oka, H., Shamoto, Y., Nakazawa, A., and Asaka, Y. (1997). “Failure and deformation modes of piles caused by liquefaction-induced lateral spreading in 1995 Hyogoken-Nambu earthquake.” Geotechnical Engineering in Recovery from Urban Earthquake Disaster, 3rd Kansai International Geotechnical Forum on Comparative

R-8
Geotechnical Engineering (KIG – Forum 97), Kansai Branch, Japanese Geotechnical Society, Osaka, Japan.
Tokimatsu, K., and Asaka, Y. (1998). “Effects of liquefaction-induced ground displacements on pile performance in the 1995 Hyogoken-Nambu earthquake.” Special Issue of Soils and Foundations, Japanese Geotechnical Society, 163-177.
Tokimatsu, K., Suzuki, H., and Suzuki, Y. (2001). “Back-calculated p-y relation of liquefied soils from large shaking table tests.” Fourth International Conference on Recent Advances in Geotechnical Earthquake Engineering and Soil Dynamics, S. Prakash, ed, University of Missouri – Rolla, paper 6.24.
Towhata, I., and Mizutani, T. (1999). ‘‘Effect of subsurface liquefaction on stability of embankment resting on surface.’’ Proc., 2nd Int. Conf. on Earthquake Geotech. Engrg., P. S. Seco e Pinto, ed., Balkema, Rotterdam, The Netherlands, 3, 1045–1058.
Vijayvergiya, V. N. (1977). "Load-Movement Characteristics of Piles." Proceedings, Ports 77 Conference, American Society of Civil Engineers, Long Beach, California, March.
Wilson, D. W., Boulanger, R. W., and Kutter, B. L. (1997a). “Soil-Pile-Superstructure Interaction at Soft of Liquefiable Soil Sites – Centrifuge Data Report for CSP2.” Report No. UCD/CGMDR-97/03, Center for Geotechnical Modeling, Department of Civil Engineering, University of California, Davis.
Wilson, D.W., Boulanger, R.W., and Kutter, B.L. (1997b). Soil-pile-superstructure interaction at soft or liquefiable soil sites - centrifuge data report for Csp3. UCD/CGMDR-97/04, Center Geotech. Modeling, UC Davis.
Wilson, D. W., (1998). “Soil-Pile-Superstructure interaction in liquefying sand and soft clay.” Ph.D. dissertation, University of California, Davis.
Wilson, D. W., Boulanger, R. W., and Kutter, B. L. (1999). “Lateral resistance of piles in liquefying soil.” OTRC’99 Conf. On Analysis, Design, Construction & Testing of Deep Foundations, J. M. Rosset, ed, Geotechnical Special Publication No. 88, ASCE, pp. 165-179.
Wilson, D. W., Boulanger, R. W., and Kutter, B. L. (1998). “Signal processing for and analyses of dynamic soil-pile-interaction experiments.” Proceedings, Centrifuge 98, Kimura, Kusakabe and Takemura, eds., Balkema, Rotterdam, 1: 135-140.
Wilson, D. W., Boulanger, R. W., and Kutter, B. L. (2000). “Seismic lateral resistance of liquefying sand.” J. of Geotechnical & Geoenvironmental Engrg., ASCE, Vol. 126, No.10, pp. 898-906.
Wong, K. S., and Teh, C. I. (1995). “Negative skin friction on piles in layered soil deposits,” Journal of Geotechnical Engineering, ASCE, 121(6), 457-465.
Yang, Z. (2002). “Development of geotechnical capabilities into OpenSees platform and their applications in soil-foundation-structure interaction analyses.” Ph.D. dissertation, University of California, Davis.
Yang, Z. (2000). “Numerical modeling of earthquake site response including dilation and liquefaction.” Ph.D. thesis, Department of Civil Engineering and Engineering Mechanics, Columbia University, New York, N.Y.

R-9
Yasuda, S., and Berril, J. B. (2000). “Observations of the earthquake response of foundations in soil profiles containing saturated sands.” Proc. GeoEng 2000 Conf., Melbourne, Australia, CD Rom
Yasuda, S., Kobayashi, T., Nomura, H., and Terauchi, T. (1996). “Shaking table tests on the lateral flow of the liquefied ground behind quay walls.” Sixth Japan – U. S. Workshop on Earthquake Resistant Design of Lifeline Facilities and Countermeasures Against Soil Liquefaction, Report NCEER-96-0012, SUNY, Buffalo, NY, pp. 275 - 288.
Yoshida, N., and Hamada, M. (1990). “Analysis of damages of foundation piles due to liquefaction-induced permanent ground displacements.” Proc. 8th Japan Earthquake Engineering Symposium, 1: 55-60.