Embed Size (px)
Citation preview

9th
European Workshop on Structural Health Monitoring
July 10-13, 2018, Manchester, United Kingdom
Creative Commons CC-BY-NC licence https://creativecommons.org/licenses/by-nc/4.0/
Piezoelectric transducer excitation for guided waves propagation on
pipeline with flexural wave modes
Xudong Niu1,2
, Hua-Peng Chen2 and Hugo R. Marques
3
1 National Structural Innovation Research Centre, TWI Ltd, Granta Park, Cambridge
CB21 6AL, UK, [email protected]
2 Department of Engineering Science, University of Greenwich, Chatham Maritime,
Kent ME4 4TB, UK, [email protected]
3 Integrity Management Group, TWI Ltd, Granta Park, Cambridge CB21 6AL, UK,
Abstract
Ultrasonic guided wave inspection is one of the non-destructive testing (NDT)
techniques available for the structural health monitoring of engineering structures.
Compared with other NDT techniques, guided waves can propagate over tens of metres
with a relatively high sensitivity to defects in the structure. For pipeline inspections, by
using an array of transducers, guide waves enable the identification of the location of
defects on the pipe circumference. The general sensitivity range of the operation is 3% -
9% reduction of the cross-sectional area, depending on the signal-to-noise ratio.
However, optimisation of guided wave testing method is still a requirement, as the
technique is currently subject to a complex analysis due to wide number of guided wave
modes generated. This can be done by optimising the transducer array design. In this
paper, the behaviour of a single piezoelectric transducer upon excitation in a tubular
structure is assessed. This is achieved through a combination of finite element analysis
and experimental studies. A group of wave modes are considered from the torsional
T(0,1) mode to several flexural wave modes. The behaviour of a single transducer
element is evaluated at a specific frequency of 35 kHz, as it is the interaction of the
generated wave modes with simulated notches. The core objective of the work is to use
the information gathered to optimise the design of transducer arrays aimed at exciting
the T(0,1) mode with a significant level of mode purity. This will significantly reduce
the complexity of guided wave analysis, enhancing effectively the health evaluation of
structures, and subsequently reduce the industry maintenance cost.
1. Introduction
In NDT techniques, structural integrity evaluation of pipelines by using ultrasonic
guided waves is particularly attractive since the outstanding advantages of guided waves
is to propagate over tens of metres along pipelines with a high sensitivity and low
attenuation under ideal conditions. In general, the operated frequency range of guided
Mor
e in
fo a
bout
this
art
icle
: ht
tp://
ww
w.n
dt.n
et/?
id=
2334
4
2
wave (GW) testing is from 20 kHz to 100 kHz [1], and Mudge and Speck [2] evaluated
that a 3% - 9% of cross-sectional area reduction of a pipe wall-thickness can be detected
by using guide wave testing. However, the higher level of sensitivity in pipe inspection
is still an area of interest for industry. The core objective of guided wave testing is to
only generate axisymmetric guided waves for defect detection. It needs a transmitter
with 360 degrees uniform loading on the pipe circumference [3]. However, many
commercial tools have gaps between their transducers [4]. Therefore, the exisitng
technique is subject to a complex analysis due to wide number of non-axisymmetric
wave modes generated. This can be solved by optimising transducer design.
The wave mode excitation and propagation in pipeline [5] and evaluation of structural
integrity for pipe inspection [6,7] have been widely investigated. Gazis [8] investigated
the propagation of three axisymmetric wave modes with their groups of non-
axisymmetric wave modes in a tubular structure. A nomenclature of X(m,n) is used to
describe these wave modes [9], in which X represents wave mode characteristics,
namely L, T and F for longitudinal, torsional and flexural wave modes, respectively; m
indicates the circumferential order (m = 1, 2, 3, …), and n indicates the wave mode
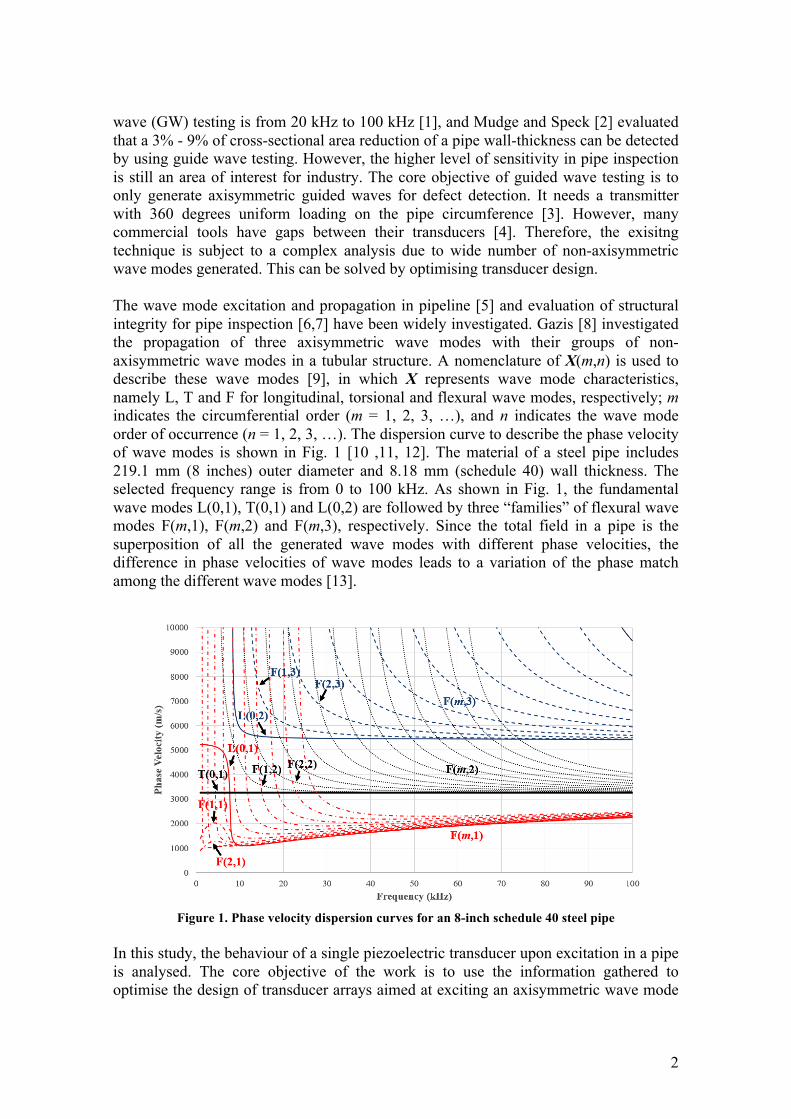
order of occurrence (n = 1, 2, 3, …). The dispersion curve to describe the phase velocity
of wave modes is shown in Fig. 1 [10 ,11, 12]. The material of a steel pipe includes
219.1 mm (8 inches) outer diameter and 8.18 mm (schedule 40) wall thickness. The
selected frequency range is from 0 to 100 kHz. As shown in Fig. 1, the fundamental
wave modes L(0,1), T(0,1) and L(0,2) are followed by three “families” of flexural wave
modes F(m,1), F(m,2) and F(m,3), respectively. Since the total field in a pipe is the
superposition of all the generated wave modes with different phase velocities, the
difference in phase velocities of wave modes leads to a variation of the phase match
among the different wave modes [13].
Figure 1. Phase velocity dispersion curves for an 8-inch schedule 40 steel pipe
In this study, the behaviour of a single piezoelectric transducer upon excitation in a pipe
is analysed. The core objective of the work is to use the information gathered to
optimise the design of transducer arrays aimed at exciting an axisymmetric wave mode

3
with a significant level of mode purity. Commercial finite element analysis (FEA)
software ABAQUS is adopted to simulate guided wave propagation on a 5000 mm long,
outer diameter 219.1 mm, wall-thickness 8.18 mm steel pipe. A single transducer is
modelled to produce shear traction in the circumferential direction at the top of the pipe
to generate torsional type guided waves T(m,1), composed of the foundational torsional
wave mode T(0,1) and torsional type flexural wave modes F(m,2). The angular profiles
by using polar plots illustrate the displacement distribution around the pipe
circumference at the different distances from the transducer location in the axial
direction. The sensitivity of defect on the single transducer at a specific frequency of 35
kHz is evaluated, as it is the interaction of the generated wave modes with simulated
notches. To reduce signal-to-noise ratio, the received signals from 24 equally spaced
points in the pipe circumference are superposed to suppress the undesired wave modes.
Finally, the experimental validation is undertaken by using a commercially available
tool, composing of three circumferential transducer arrays (i.e. collars). Each collar
includes 24 piezoelectric transducers with a gap of 33 degrees between start and end
transducers. The torsional type guided waves are generated and propagated on a 4450
mm, 8-inch, schedule 40 steel pipe.
2. Theoretical background
The theoretical background has been developed for guided wave excitation and
propagation in the axial direction of a hollow cylinder. If the structure is assumed as a
pipe-like structure with traction-free boundary conditions, the Navier’s governing wave
equation for guided wave propagation in an elastic medium can be written as [8]
2
2
2( )λ µ µ ρ
∂+ ∇∇⋅ + ∇ =
∂
UU U
t (1)
where λ and µ are Lamé constants, t and ρ indicate the time and the density, U
represents the displacement vector, 2∇ represents the three-dimensional Laplace
operator.
The assumptions of complete solutions for torsional waves are considered as [13]
( )
( )
( )
( )
( )
( ) ( 0,1, 2...)
( )
( )
θ ω
θ ω
θ ω
θ θ
θ ω
−
−
−
−
Φ =
= =
=
=
im i kz t
im i kz t
r r
im i kz t
im i kz t
z z
f r e e
H h r e e m
H h r e e
H h r e e
(2)
where Φ represents the dilatational scalar potential and ( , , )H r zξ ξ θ= represents the
displacement fields in the radial, circumferential and axial directions, respectively. The
terms of ( )( , , )h r r zξ ξ θ= are the corresponding displacement amplitudes composed of
4
Bessel functions in the radial direction; kz represents the wavenumber at the distance in
the axial direction, and ω represents the radian frequency and i = 1− .
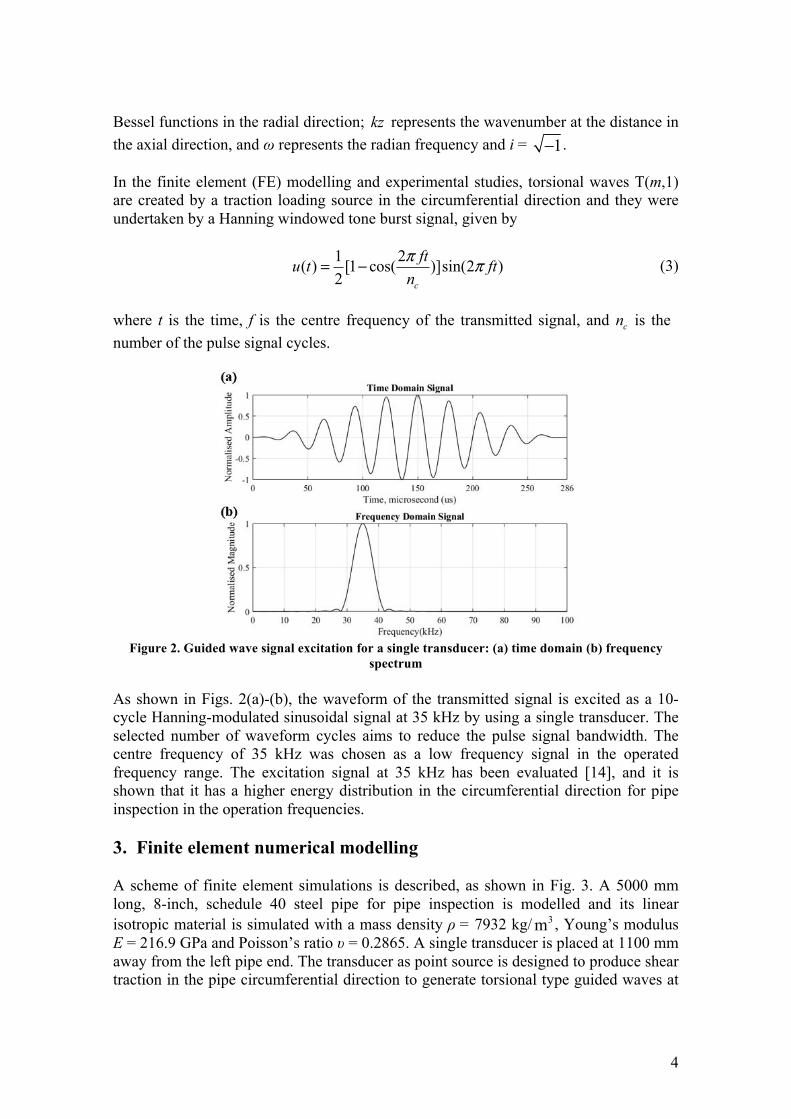
In the finite element (FE) modelling and experimental studies, torsional waves T(m,1)
are created by a traction loading source in the circumferential direction and they were
undertaken by a Hanning windowed tone burst signal, given by
1 2( ) [1 cos( )]sin(2 )
2
ππ= −
c
ftu t ft
n (3)
where t is the time, f is the centre frequency of the transmitted signal, and cn is the
number of the pulse signal cycles.
Figure 2. Guided wave signal excitation for a single transducer: (a) time domain (b) frequency
spectrum
As shown in Figs. 2(a)-(b), the waveform of the transmitted signal is excited as a 10-
cycle Hanning-modulated sinusoidal signal at 35 kHz by using a single transducer. The
selected number of waveform cycles aims to reduce the pulse signal bandwidth. The
centre frequency of 35 kHz was chosen as a low frequency signal in the operated
frequency range. The excitation signal at 35 kHz has been evaluated [14], and it is
shown that it has a higher energy distribution in the circumferential direction for pipe
inspection in the operation frequencies.
3. Finite element numerical modelling
A scheme of finite element simulations is described, as shown in Fig. 3. A 5000 mm
long, 8-inch, schedule 40 steel pipe for pipe inspection is modelled and its linear
isotropic material is simulated with a mass density ρ = 7932 kg/ 3m , Young’s modulus
E = 216.9 GPa and Poisson’s ratio υ = 0.2865. A single transducer is placed at 1100 mm
away from the left pipe end. The transducer as point source is designed to produce shear
traction in the pipe circumferential direction to generate torsional type guided waves at

5
the top of the pipe. The waveform of the pulse signal is excited by a 10-cycle Hanning
windowed pulse with the central frequency of 35 kHz and bandwidth of ±7 kHz. The
receiving arrays, composed of 24 uniformly spaced point receivers, are located at 0 mm,
1000 mm and 2000 mm away from the transducer, respectively. The No.1 and No. 7
receivers are located at 90 degrees and 0 degree in the cross-sectional area of the pipe
model.
Figure 3. FE modelling of an 8-inch schedule 40 steel pipe with a part-circumferential through-
thickness notch
The three through-thickness notch sizes are simulated in the pipe, i.e. 30 degrees (Case
No.1), 60 degrees (Case No.2) and 90 degrees (Case No.3) at the top of the pipe
circumference. The notch length is 4 mm in the axial direction, and the location of
notches is 3000 mm away from the transducer. The absorbing regions of 600 mm are
constructed for avoiding the reflection from the two pipe ends. The maximum length of
the elements is selected to be less than one-eighth per wavelength in the axial direction
for satisfactory accuracy [5]. Therefore, the mesh distribution is arranged as an average
mesh size of 4 mm in the axial direction and 4 elements in the pipe wall-thickness.
Meshes are generated with a total of 839,944 Hex elements (Case No.1), 839,888 Hex
elements (Case No.2) and 839,832 Hex elements (Case No.3). The impulse time of the
transmitted signal is 286 µs and the total time of wave propagation is 2.7 ms. The step
time is 200 ns.
The angular profiles of the T(m,1) mode group at different axial distances for the point
source loading on the 8-inch schedule 40 steel pipe at 35 kHz are shown in Figs. 4(a)-
(c). It shows that a narrower focused beam is generated upon a partial loading at 90
degrees, when the axial distance is located at the transducer location in Fig. 4(a). Then,
the energy spreads out as the propagated distance increases, as shown in Figs. 4(b)-(c).
Results show the energy distribution changes more sharply in the circumferential

6
direction in comparison with the result in Fig. 4(a), because the narrower loading length
leads a larger number of flexural wave modes.
Figure 4. The angular profiles of the T(m,1) mode group at different axial distances for a point
source loading on an 8-inch schedule 40 steel pipe at 35 kHz
On the contrary, an increased loading length on the pipe circumference can be
considered to suppress the undesired wave modes. Therefore, the wave modes with high
circumferential orders can be generated with small amplitudes. When a group of
torsional type wave modes are considered from the torsional fundamental wave mode
T(0,1) to several flexural wave modes, the influence of higher order modes can be
ignored in the energy distribution of a wave group.
Figure 5. Normalised circumferential displacements for the T(m,1) wave modes incident upon a
part-circumferential defect at the top of the pipe.
Figure 5 shows the normalised circumferential displacements for the T(0,1) and
propagation of higher order flexural wave modes in time domain. The results are
recorded at the axial distance 2000 mm away from the transducer by the No.1 (90
degrees) and No.7 (0 degree) receivers. It can be clearly seen that the results in Fig. 4(c)
and Fig. 5 agree well for the displacement distribution of the transmitted signal around
the pipe circumference. Results also show the torsional wave mode T(0,1) propagation
and its interaction with higher order flexural wave modes. The circumferential

7
displacements of the reflection from the notch have similar distribution to that of the
transmitted signal at No.1 and No.7 receivers because of the notch location.
Figure 6. Normalised circumferential displacement amplitudes by summing up the results at 24
receivers in time domain
To suppress the flexural wave modes, the received signals at 24 receivers at the
transducer location are superposed by post-processing. The results for the three notch
sizes are shown in Fig. 6. The wave mode T(0,1) can be easily seen at reflection from a
notch, but higher flexural wave modes have not been suppressed completely by
superposition of 24 receivers. Results show the normalised amplitude of the
circumferential displacements for reflection from a 60-degree notch is higher than that
of a 30-degree notch, but it has similar amplitudes to the result for a 90-degree notch.
Thus, it indicates that the higher flexural waves affect the results from the three notches.
More receiving locations should be considered for future work.
4. Experimental validation
Figure 7. Set up of vibrometer pipe experiment with a single transducer

8
To verify the FE simulations, an experimental work was undertaken, as shown in Fig. 7.
The torsional type wave modes were excited by a piezoelectric transducer. A 4450 mm,
8-inch, schedule 40 steel pipe without defects was used as specimen. The transducer
was placed at the pipe end. A non-scanned 3D laser vibrometer was used to measure 24
receiving points, which are equally spaced around the pipe at 2000 mm away from the
transducer. The No.1 and No.7 receivers are located at 82.5 degrees and 352.5 degrees
in angular profiles. The impulse signal is a 10-cycle Hanning-modulated sinusoidal
signal at 35 kHz.
Figure 8. Angular profiles of FE and experimental results
Figure 8 shows a comparison of normalised circumferential displacements obtained
from experimental measurements and finite element simulations by a polar plot. There
is a good agreement between the experimental and FEA results. Therefore, the FE
modelling for the guided wave excitation and propagation in the pipe is then verified
from the related experimental results. Results in Fig. 4(c) and Fig. 8 agree reasonably
well for the displacement distribution.
5. Conclusions
In this paper, the behaviour of a single piezoelectric transducer upon excitation in a
5000 mm, 8-inch, schedule 40 steel pipe is analysed. This is achieved through a
combination of finite element analysis and experimental studies. The FE simulations are
verified by experimental measurements. A group of wave modes are considered from
the torsional T(0,1) mode to higher flexural wave modes. The behaviour of a single
transducer element is evaluated at a specific frequency of 35 kHz, as it is the interaction
of the generated wave modes with a group of the simulated notches. The angular
profiles of the torsional type wave mode group at different axial distances for the point
source loading. The energy distribution for the narrower loading length becomes less
sharp, when the loading length increases in the circumferential direction. From the
information gathered, the design of transducer arrays is optimised to excite the T(0,1)
mode with a significant level of mode purity. After post-processing by superposition of
24 receivers, the sensitivity of a single transducer for pipe inspection is evaluated. To

9
further suppress higher flexural wave modes, an increased number of receiver locations
is required for future work.
Acknowledgements
This publication was made possible by the sponsorship and support of TWI Ltd. and University of Greenwich. The work was enabled through, and undertaken at, the National Structural Integrity Research Centre (NSIRC), a postgraduate engineering facility for industry-led research into structural integrity established and managed by TWI through a network of both national and international Universities. The authors would like to thank Dr Wenbo Duan for his contribution to the dispersion curves shown in Fig. 1. Author Contributions: Xudong Niu carried out the three-dimensional numerical analysis in ABAQUS and experimental studies. Hugo R. Marques supervised the experimental work; Xudong Niu and Hua-Peng Chen contributed to the drafting of the manuscript; Hua-Peng Chen and Hugo R. Marques supervised the work in this paper.
References
[1] P Mudge, “Field application of the Teletest long-range ultrasonic testing
technique”, Insight - Non-Destructive Testing and Condition Monitoring 43(2), pp
74-77, 2001.
[2] P Mudge and J Speck, “Long-range ultrasonic testing (LRUT) of pipelines and
piping”, Inspectioneering Journal 10(5), pp 1, 2004.
[3] X Niu, H-P Chen and HR Marques, “Piezoelectric transducer array optimization
through simulation techniques for guided wave testing of cylindrical structures”,
The 8th ECCOMAS Thematic Conference on Smart Structures and Materials
(SMART 2017), pp 424-435, 2017.
[4] X Niu, HR Marques and H-P Chen, “Sensitivity analysis of guided wave characters
for transducer array optimisation on pipeline inspections”, The 2017 World
Congress on Advances in Structural Engineering and Mechanics (ASEM17), 2017.
[5] DN Alleyne, MJS Lowe and P Cawley, “The reflection of guided waves from
circumferential notches in pipes”, Journal of Applied Mechanics 65(3), pp 635-
641, 1998.
[6] D Alleyne and P Cawley, “Long range propagation of Lamb waves in chemical
plant pipework”, Materials Evaluation 55, pp 504-508, 1997.
[7] P Wilcox, M Lowe and P Cawley, “The effect of dispersion on long-range
inspection using ultrasonic guided waves”, NDT & E International 34(1), pp 1-9,
2001.
[8] D Gazis, “Three dimensional investigation of the propagation of waves in hollow
circular cylinder. I. Analytical foundation”, J. Acoust. Soc. Am. 31, pp 573-578,
1959.
[9] M Silk and K Bainton, “The propagation in metal tubing of ultrasonic wave modes
equivalent to lamb waves”, Ultrasonics 17(1), pp 11-19, 1979.
[10] W Duan and R Kirby, “A numerical model for the scattering of elastic waves from
a non-axisymmetric defect in a pipe”, Finite Elements in Analysis and Design 100,

10
pp 28-40, 2015.
[11] W Duan, R Kirby and P Mudge, “On the scattering of elastic waves from a non-
axisymmetric defect in a coated pipe”, Ultrasonic 65, pp 228-241, 2016.
[12] W Duan R Kirby and P Mudge, “On the scattering of torsional waves from
axisymmetric defects in buried pipelines”, The Journal of the Acoustical Society of
America 141(5), pp 3250-3261, 2017.
[13] JL Rose, Ultrasonic Guided Waves in Solid Media, Cambridge: Cambridge
University Press, 2014.
[14] X Niu, HR. Marques and H-P Chen, “Transducer array optimisation for guided
wave testing of pipes using finite element numerical simulations and experimental
studies”, The 8th International Conference on Structural Health Monitoring of
Intelligent Infrastructure (SHMII8), 2017.