Embed Size (px)
Citation preview
PIE CHARTSCONTENT DOMAIN REFERENCES:
6S1
KS2 SATSPRACTICE QUESTIONS BY TOPIC
1 2 3 4 5 6 7 8 9 10
16
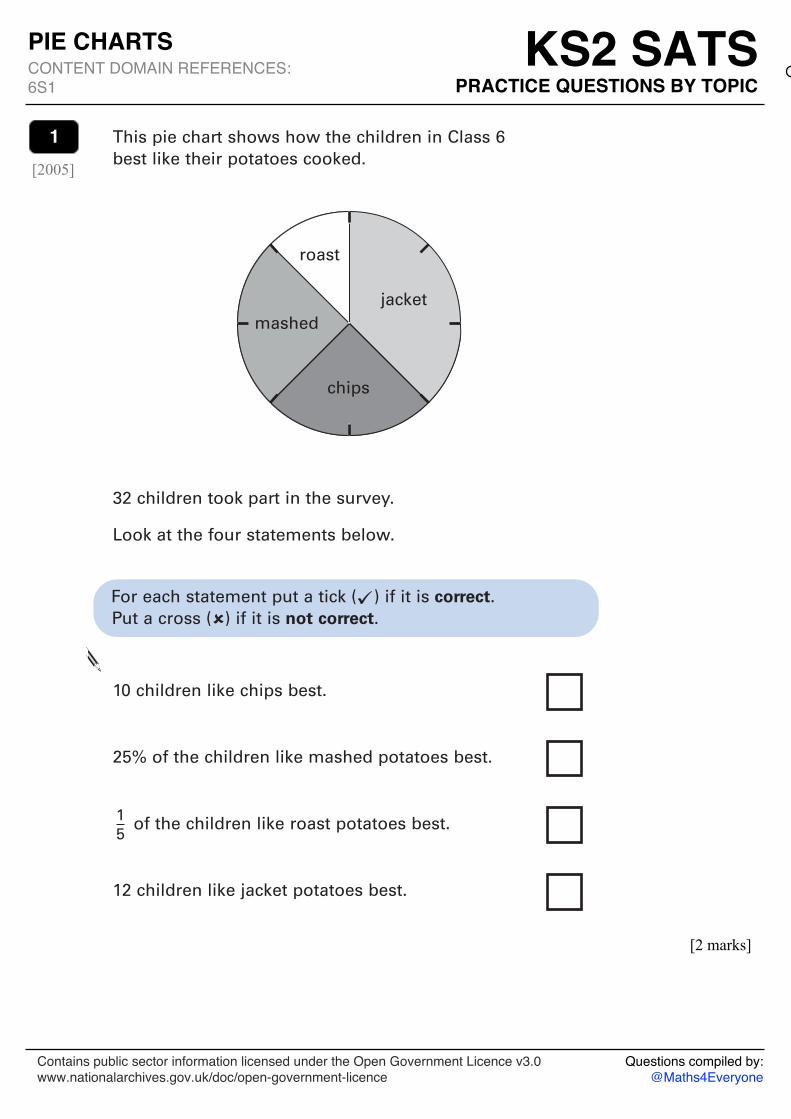
18 This pie chart shows how the children in Class 6 best like their potatoes cooked.
32 children took part in the survey.
Look at the four statements below.
10 children like chips best.
25% of the children like mashed potatoes best.
of the children like roast potatoes best.
12 children like jacket potatoes best.
15
For each statement put a tick ( ) if it is correct.Put a cross ( ) if it is not correct.
roast
jacket
chips
mashed
18ii
2 marks
18i
[2 marks]
11
[2005]
Questions compiled by:
@Maths4Everyone
Contains public sector information licensed under the Open Government Licence v3.0
www.nationalarchives.gov.uk/doc/open-government-licence
19
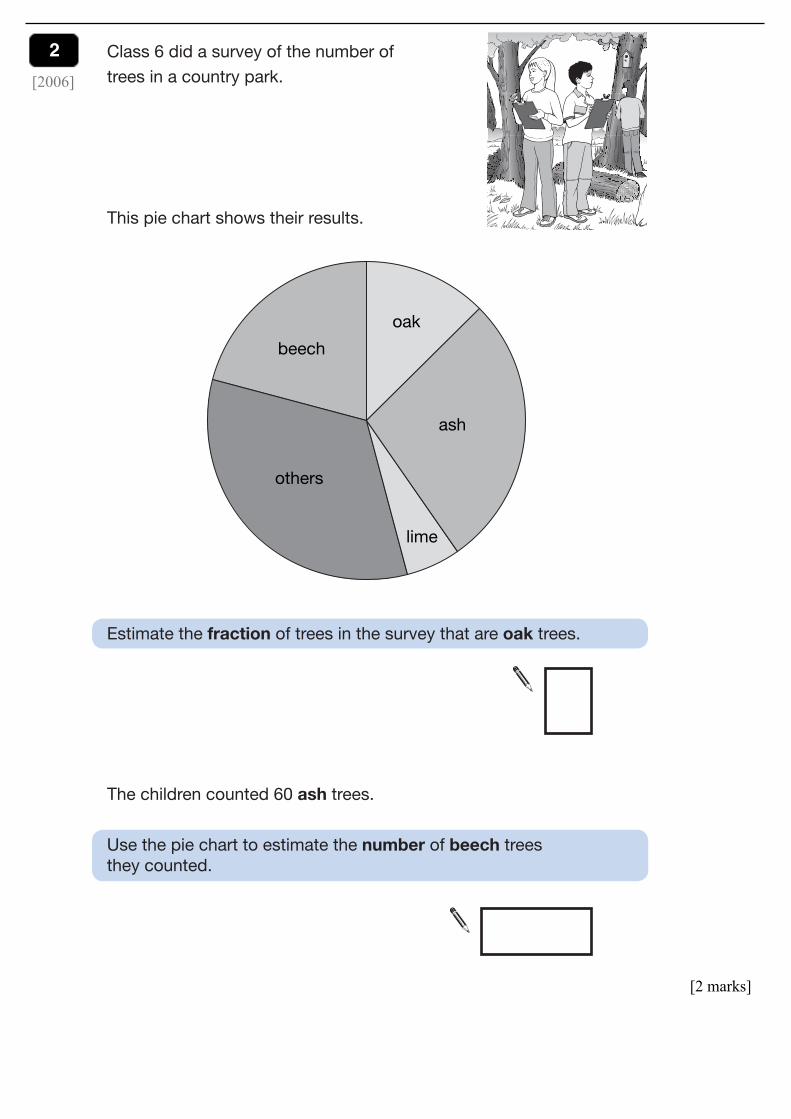
Class 6 did a survey of the number oftrees in a country park.
This pie chart shows their results.
beech
others
lime
ash
oak
Estimate the fraction of trees in the survey that are oak trees.
20a
1 mark
The children counted 60 ash trees.
Use the pie chart to estimate the number of beech trees they counted.
20b
1 mark
20
19 Total out of 5
[2 marks]
2
2[2006]
Sourced from SATs-Papers.co.uk https://www.SATs-Papers.co.uk
[2 marks]
33
[2012]
18
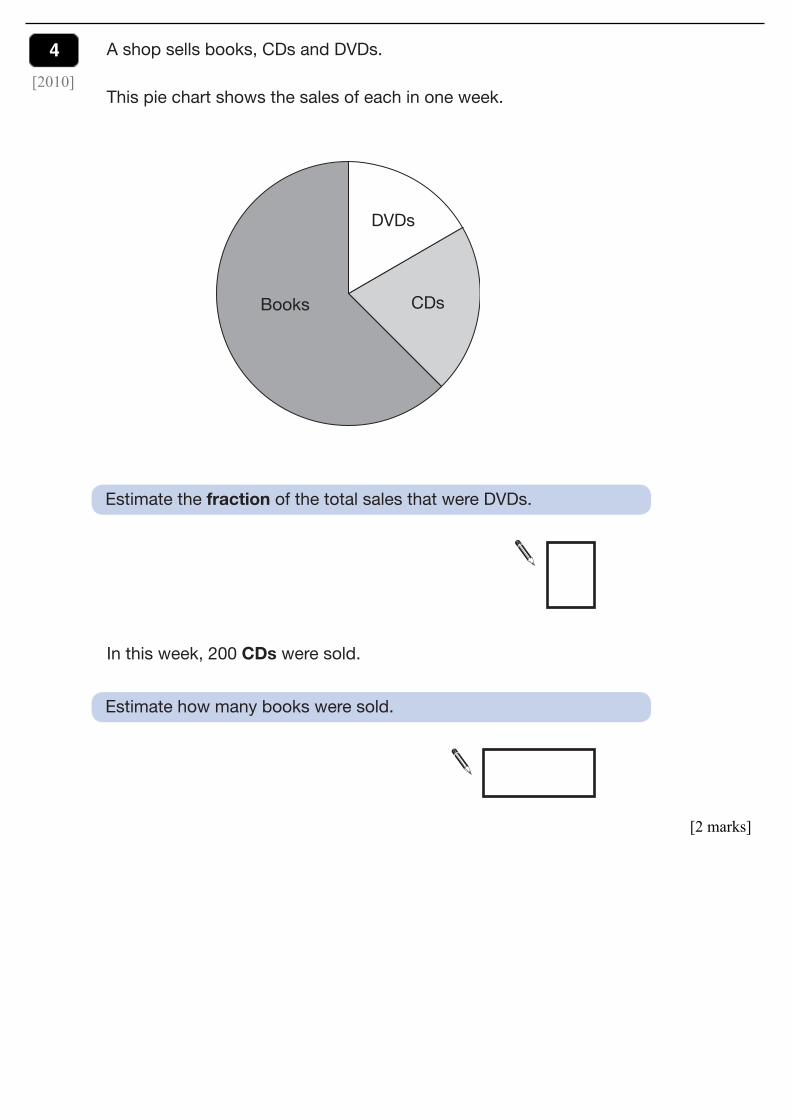
A shop sells books, CDs and DVDs.
This pie chart shows the sales of each in one week.
CDs
DVDs
Books
Estimate the fraction of the total sales that were DVDs.
22a
1 mark
In this week, 200 CDs were sold.
Estimate how many books were sold.
22b
1 mark
22
[2 marks]
4
4[2010]
17b
1 mark
17
17a
1 mark
13
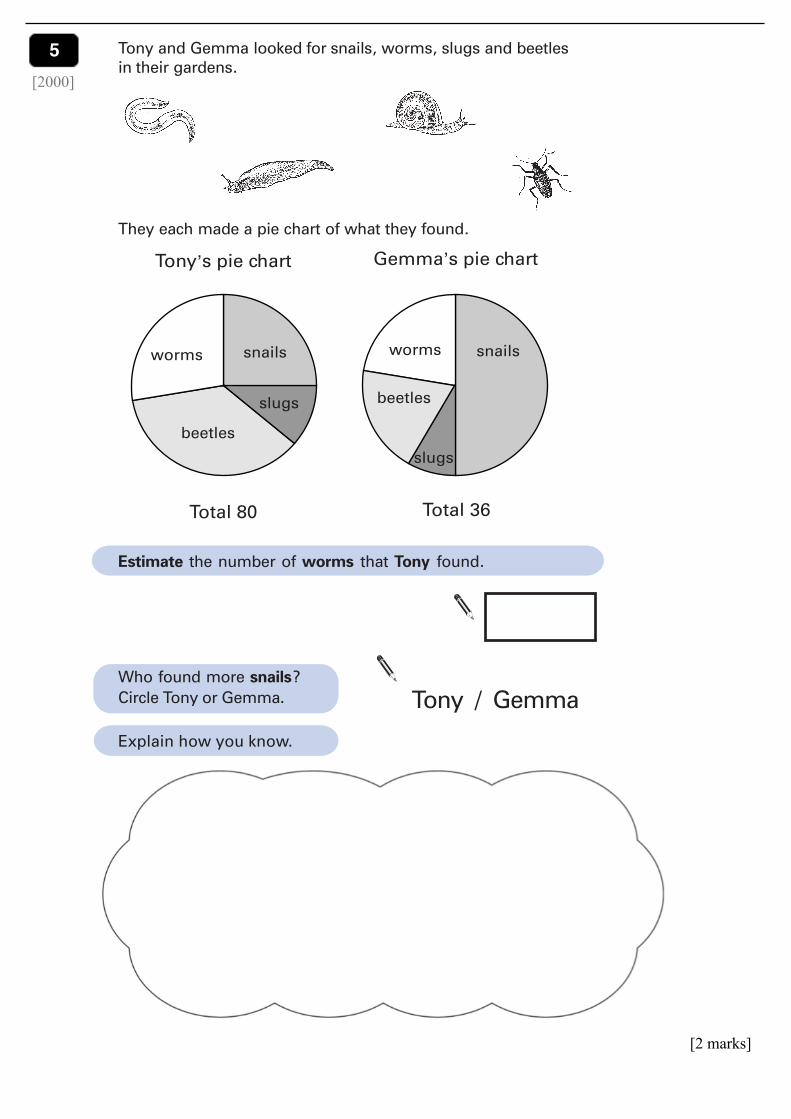
Tony and Gemma looked for snails, worms, slugs and beetlesin their gardens.
They each made a pie chart of what they found.
Estimate the number of worms that Tony found.
Who found more snails?Circle Tony or Gemma. Tony / Gemma
Explain how you know.
17b
1 mark
17
17a
1 mark
13
Tony and Gemma looked for snails, worms, slugs and beetlesin their gardens.
They each made a pie chart of what they found.
Estimate the number of worms that Tony found.
Who found more snails?Circle Tony or Gemma. Tony / Gemma
Explain how you know.
17b
1 mark
17
17a
1 mark
13
Tony and Gemma looked for snails, worms, slugs and beetlesin their gardens.
They each made a pie chart of what they found.
Estimate the number of worms that Tony found.
Who found more snails?Circle Tony or Gemma. Tony / Gemma
Explain how you know.17b
1 mark
17
17a
1 mark
13
Tony and Gemma looked for snails, worms, slugs and beetlesin their gardens.
They each made a pie chart of what they found.
Estimate the number of worms that Tony found.
Who found more snails?Circle Tony or Gemma. Tony / Gemma
Explain how you know.
17b
1 mark
17
17a
1 mark
13
Tony and Gemma looked for snails, worms, slugs and beetlesin their gardens.
They each made a pie chart of what they found.
Estimate the number of worms that Tony found.
Who found more snails?Circle Tony or Gemma. Tony / Gemma
Explain how you know.
17b
1 mark
17
17a
1 mark
13
Tony and Gemma looked for snails, worms, slugs and beetlesin their gardens.
They each made a pie chart of what they found.
Estimate the number of worms that Tony found.
Who found more snails?Circle Tony or Gemma. Tony / Gemma
Explain how you know.
[2 marks]
5
5[2000]
Page 19 of 24
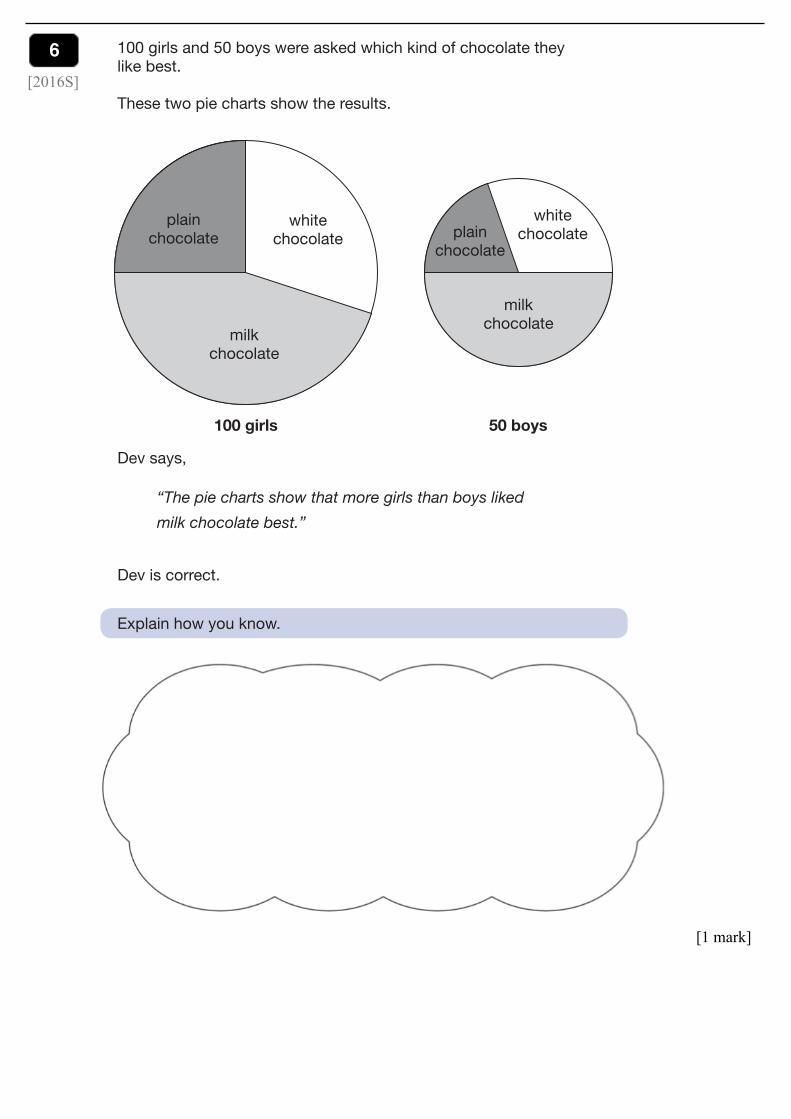
18 100 girls and 50 boys were asked which kind of chocolate they like best. These two pie charts show the results.
100 girls 50 boys
milkchocolate
white chocolateplain
chocolate
plain chocolate
white chocolate
milkchocolate
Dev says,
“The pie charts show that more girls than boys liked
milk chocolate best.”
Dev is correct.
Explain how you know.
1 mark
1 mark
M004088_chocolate pie – 14 April 2015 1:01 PM – Version 3
KS2 item template version 1.1
6S1
S00060A1924
[1 mark]
6
6[2016S]
20
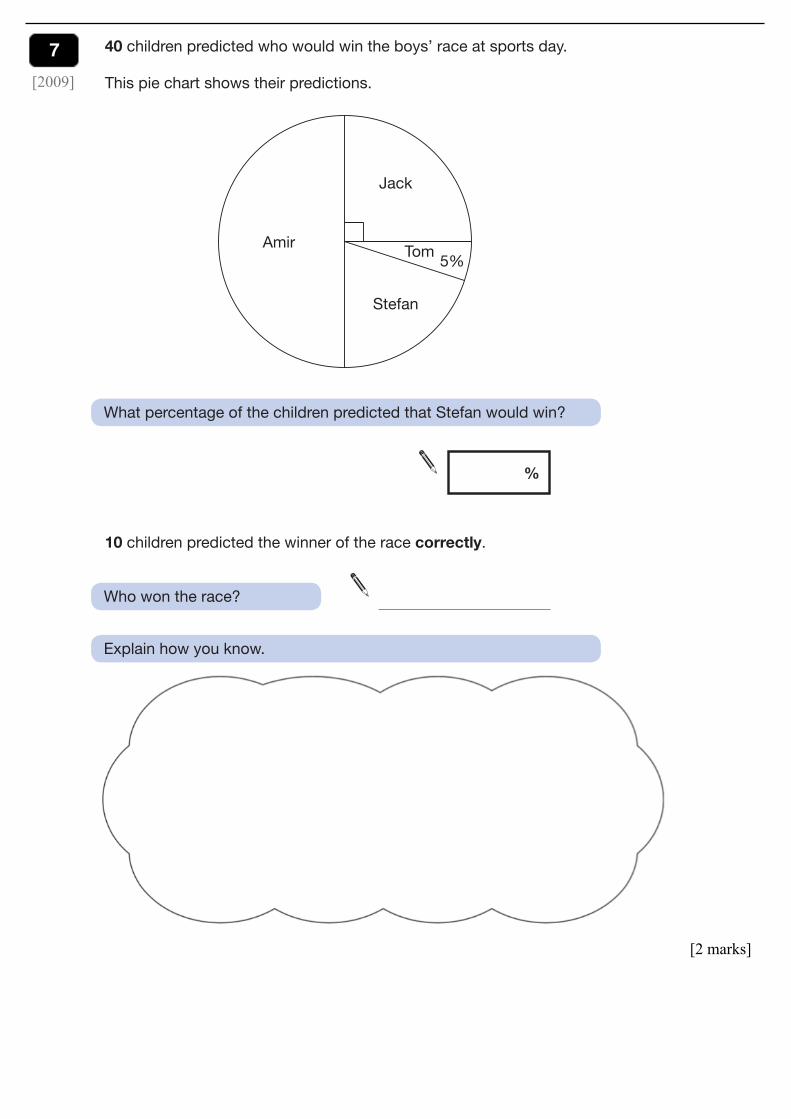
40 children predicted who would win the boys’ race at sports day.
This pie chart shows their predictions.
Tom 5%
Jack
Amir
Stefan
What percentage of the children predicted that Stefan would win?
% 21a
1 mark
10 children predicted the winner of the race correctly.
Who won the race?
Explain how you know.
21b
1 mark
21
289982_KS2Ma_2009_081212_v0.0_Ho20 20289982_KS2Ma_2009_081212_v0.0_Ho20 20 09/12/2008 16:28:0809/12/2008 16:28:08
[2 marks]
7
7[2009]
Total out of 617
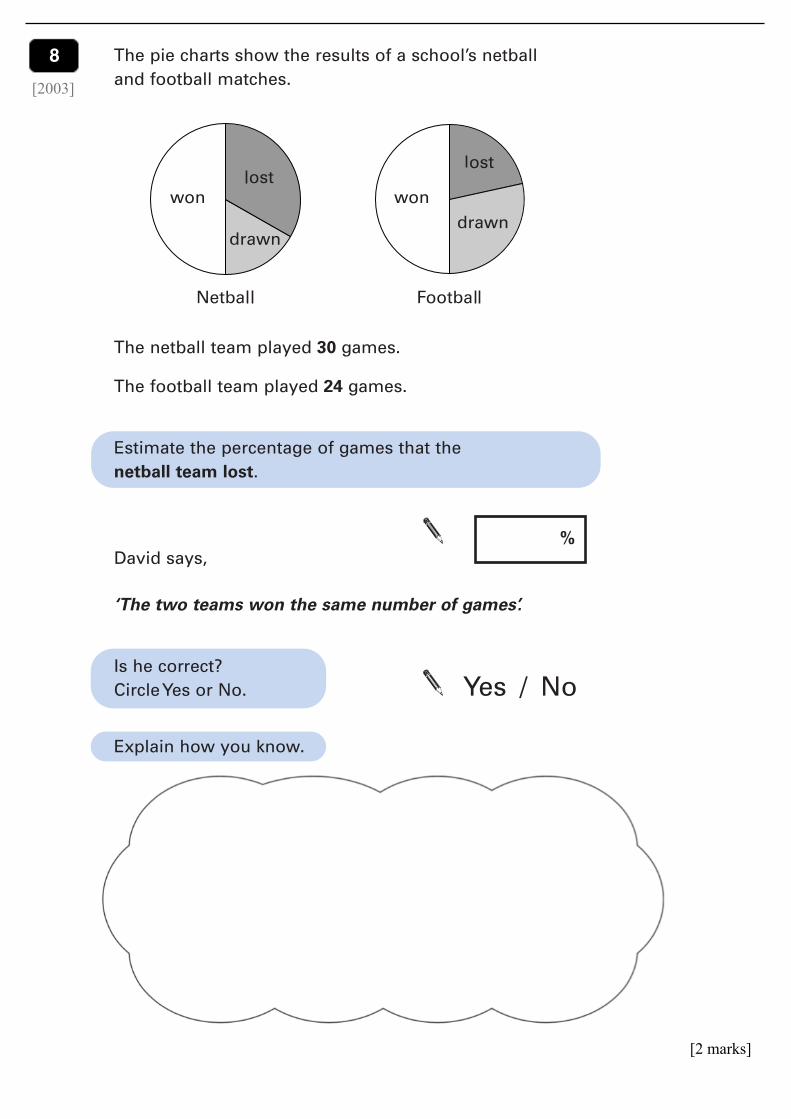
The pie charts show the results of a school’s netballand football matches.
The netball team played 30 games.
The football team played 24 games.
Estimate the percentage of games that the netball team lost.
David says,
‘The two teams won the same number of games’.
Is he correct?Circle Yes or No.
Explain how you know.
Yes / No
%
21
21a
1 mark
21b
1 markTotal out of 617
The pie charts show the results of a school’s netballand football matches.
The netball team played 30 games.
The football team played 24 games.
Estimate the percentage of games that the netball team lost.
David says,
‘The two teams won the same number of games’.
Is he correct?Circle Yes or No.
Explain how you know.
Yes / No
%
21
21a
1 mark
21b
1 mark
Total out of 617
The pie charts show the results of a school’s netballand football matches.
The netball team played 30 games.
The football team played 24 games.
Estimate the percentage of games that the netball team lost.
David says,
‘The two teams won the same number of games’.
Is he correct?Circle Yes or No.
Explain how you know.
Yes / No
%
21
21a
1 mark
21b
1 mark
[2 marks]
88
[2003]
6
6
2 marks
°
6
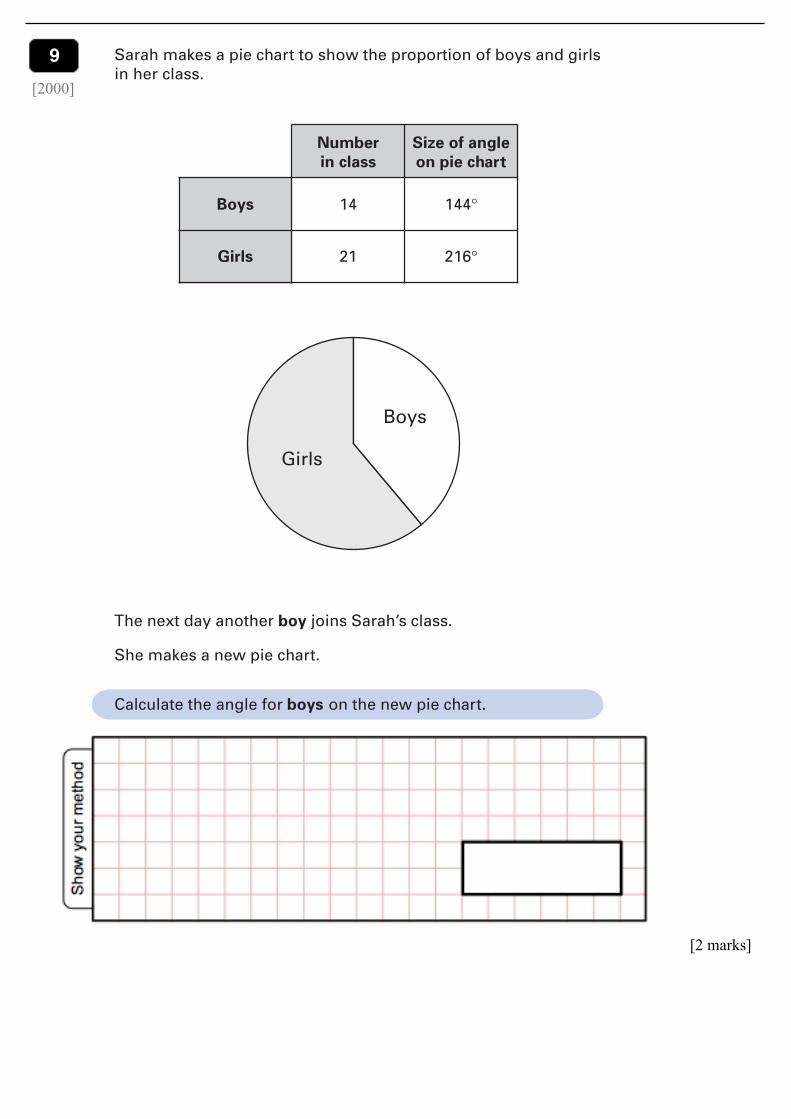
Sarah makes a pie chart to show the proportion of boys and girlsin her class.
The next day another boy joins Sarah’s class.
She makes a new pie chart.
Calculate the angle for boys on the new pie chart.
Number Size of anglein class on pie chart
Boys 14 144°
Girls 21 216°
[2 marks]
99
[2000]
22 1
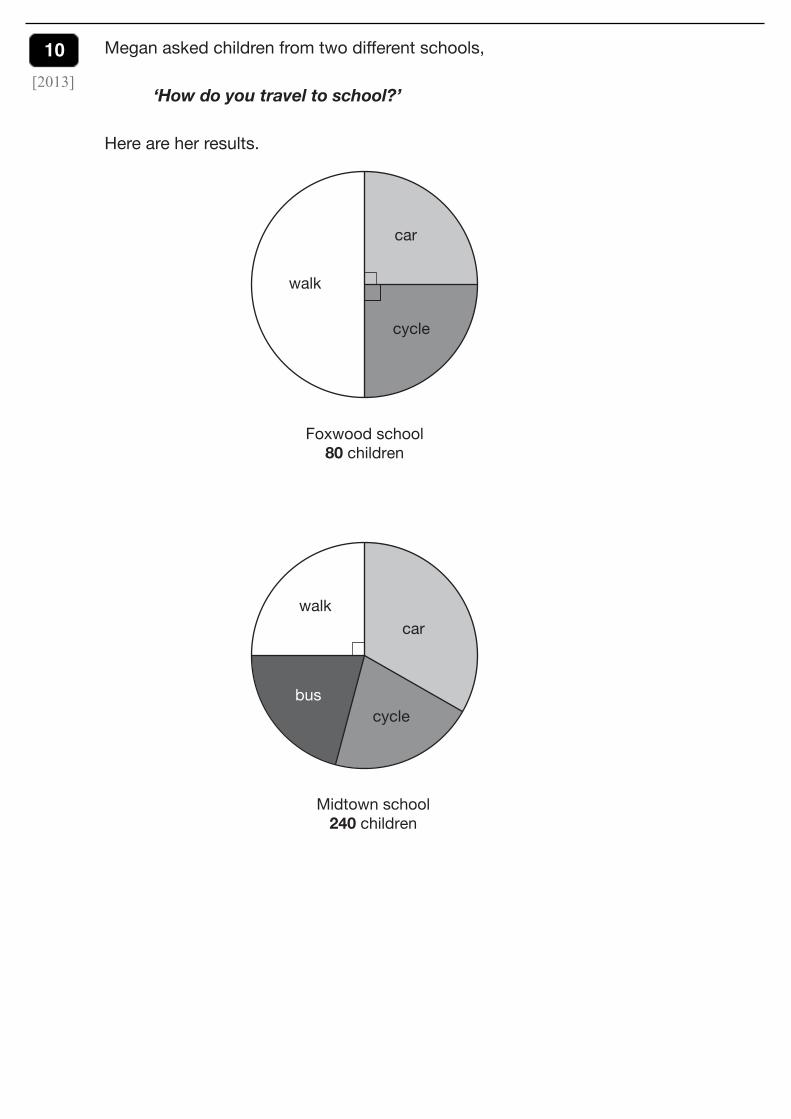
Megan asked children from two different schools,
‘How do you travel to school?’
Here are her results.
25
M0196 HD D2b1 UAM L5
car
walk
cycle
Foxwood school80 children
carwalk
cyclebus
Midtown school240 children
M0196_2 – 8 January 2013 3:50 PM – Version 4
[3 marks]
10
10[2013]
23 2
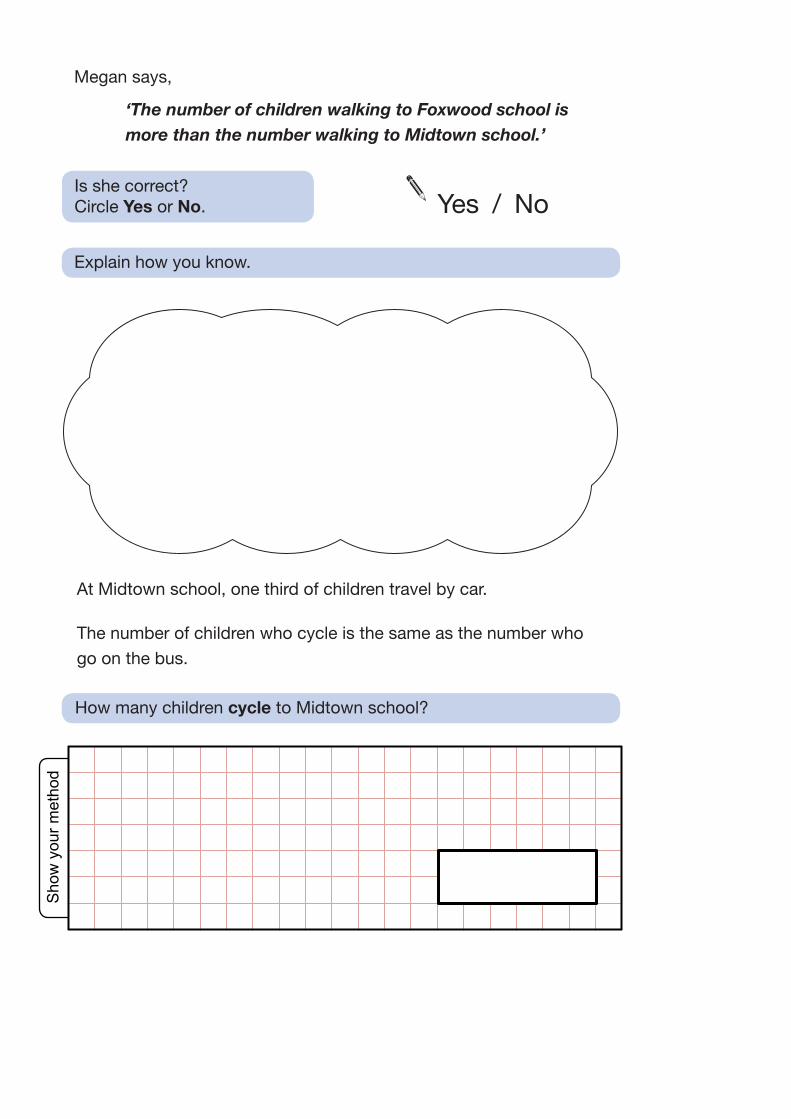
Megan says,
‘The number of children walking to Foxwood school is more than the number walking to Midtown school.’
Is she correct? Circle Yes or No.
Yes / No
Explain how you know.
25a
1 mark
At Midtown school, one third of children travel by car.
The number of children who cycle is the same as the number who go on the bus.
How many children cycle to Midtown school?
Show your
method
M0196 HD D2b1 L5
25bi
25bii
2 marks
M0196_2 – 8 January 2013 3:50 PM – Version 4
Total out of 3
Sho
w y
our m
etho
d
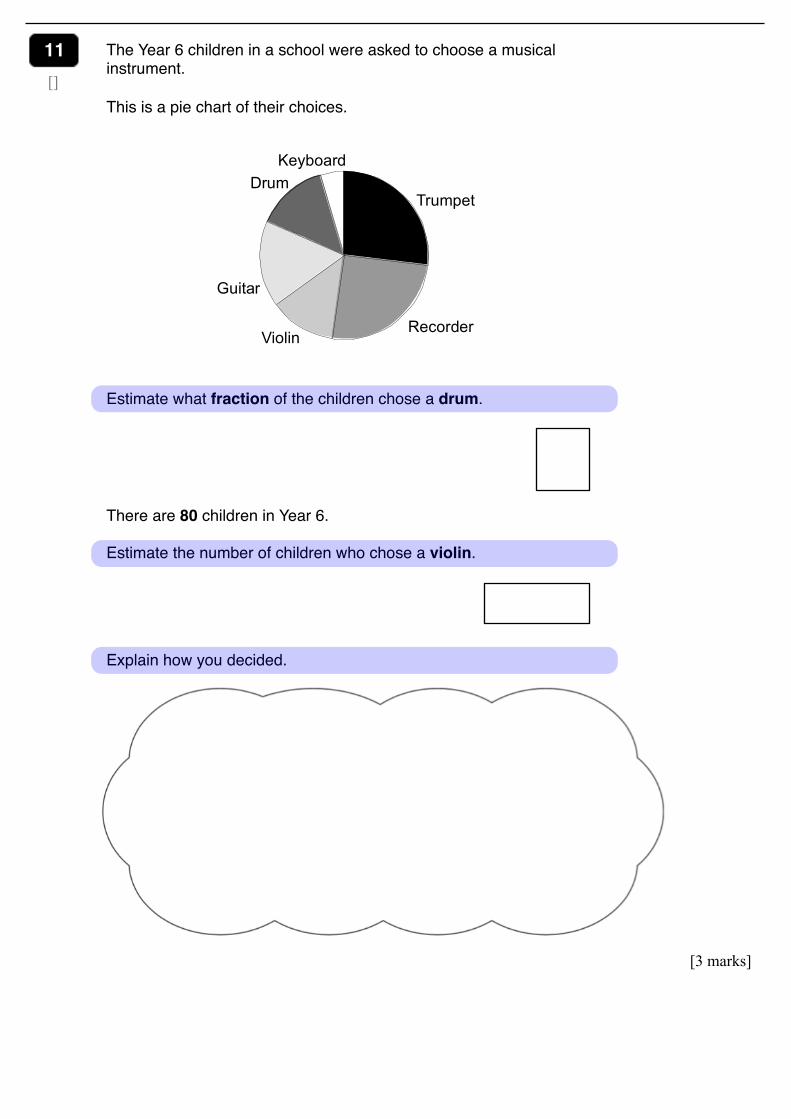
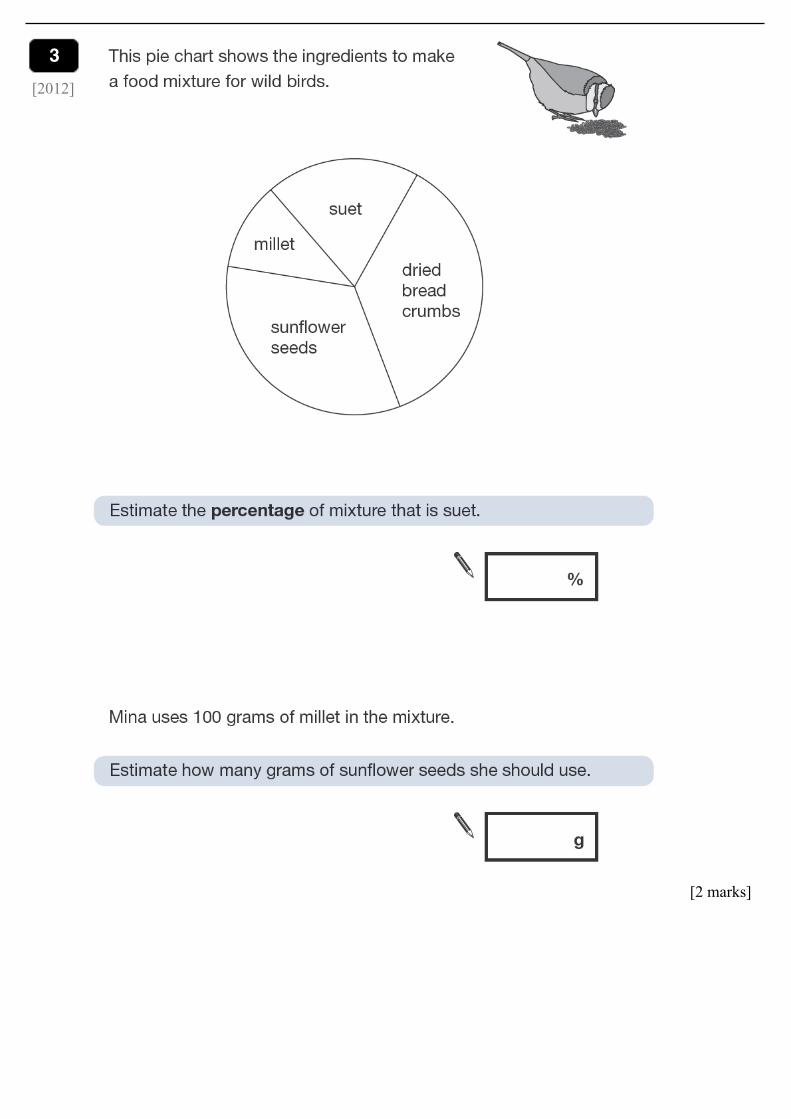
The Year 6 children in a school were asked to choose a musical instrument.
This is a pie chart of their choices.
5
10
15
Estimate what fraction of the children chose a drum.
There are 80 children in Year 6.
Estimate the number of children who chose a violin. 28
Sam spins A 100 times and B 100 times.
The arrows on the line show how many times each spinner lands on an odd number.
He spins C 100 times.
Put an arrow on the line to show your estimate of how many times spinner C will land on an odd number.
0 20 40 60 80 100
B A
1 mark
Show how you worked out your estimate.
1 mark
33. The Year 6 children in a school were asked to choose a musical instrument. This is a pie chart of their choices.
Guitar
ViolinRecorder
TrumpetDrum
Keyboard
Estimate what fraction of the children chose a drum.
1 mark
Explain how you decided.
[3 marks]
11
11[]