Embed Size (px)
Citation preview

7/26/2019 Physio Coursepack 2016
http://slidepdf.com/reader/full/physio-coursepack-2016 1/282
Tissues:
Cell and Organ Physiology
MedBio MSI 2016
Winter MEDC-30403
Lecture Notes
BSLC 115 8:00-10:50 a.m.
Module 1
Cell PhysiologyHanck, McGehee, & Xie
Module 2
Cardiovascular Physiology
Beiser, Poston, & Sattar
Module 3
Pulmonary PhysiologyHall, Naureckas, & Sattar
7/26/2019 Physio Coursepack 2016
http://slidepdf.com/reader/full/physio-coursepack-2016 2/282
!"##$%#& ( ) * * + , - . / 0 + , 1 2 3 4 5 6 * 6 0 3 7 8 9 :
; < % = ( > 8 ? 8 > @
T I M E S
Lecture 1: 08:00 - 08:50
Lecture 2: 09:00 -09:50
Lecture 3: 10:00 -10:50
R O O M S
General Lectures & Review Sessions Room: BSLC 115Histology labs Rooms: 402/406/412/416
Computer Simulation Labs Room: 018 Applied Physiology /Case Studies CPP Rooms: 346/350/354
Pulmonary Function Lab DCAM 5E
MODULE 1CELL PHYSIOLOGY
JANUARY
Mon 04 08:00-08:50 Introduction to Membrane Potential McGehee
09:00-09:50 Passive and Active Membrane Electrical Properties McGehee
10:00-10:50 Electrical and Chemical Synaptic Transmission McGehee
Tue 05 08:00-08:50 Neuromuscular Junction McGehee
09:00-09:50 Central Nervous System Synaptic Transmission McGehee
10:00-10:50 Receptor Signal Transduction and Second Messengers McGehee
11:00-12:00 Nerve and Muscle Histology Minilab/Review Greenwald
Wed 06 08:00-08:50 Skeletal Muscle I Hanck
09:00-09:50 Skeletal Muscle II Hanck
10:00-10:50 Cardiac Muscle Hanck
Thu 07 08:00-08:50 Smooth Muscle Hanck
09:00-09:50 Episodic Disorders (video/slides see chalk site) Xie
10:00-10:50 Loss of Function Disorders (video/slides see chalk site) Xie
Fri 08 08:00-09:50 REVIEW SESSION Greenwald/
Underriner
WEEKEND
Mon 11 08:00 EXAM 1 – Neuromuscular Physiology

7/26/2019 Physio Coursepack 2016
http://slidepdf.com/reader/full/physio-coursepack-2016 3/282
MODULE 2
CARDIOVASCULAR PHYSIOLOGY
Tue 12 08:00-08:50 Histology of Cardiovascular and Lymphatic Systems Sattar09:00-09:50 Overview of the Circulation/The Cardiac Pump Poston
10:00-10:50 Cardiac Electrophysiology I Beiser
Wed 13 08:00-08:50 Cardiac Electrophysiology II Beiser
09:00-09:50 Cardiac Electrophysiology III Beiser
10:00-10:50 Cardiovascular Histology Minilab/Review Greenwald
Thu 14 08:00-08:50 The Peripheral Circulation including Hemodynamics Beiser
09:00-09:50 Microcirculation & Intrinsic Regulation of Blood Flow Beiser
Fri 15 08:00-08:50 Control of Cardiac Output: Ventricular-Vascular Coupling Poston
09:00-09:50 Autonomic Regulation of the Heart & Circulation Beiser10:00-10:50 Pulmonary Circulation Poston
WEEKEND
Mon 18 MLK Day - No Class
Tue 19 08:00-10:50 Computer Simulation Lab Group 1 and 2 (Room 018) Poston/Beiser
Wed 20 08:00-08:50 Coronary Circulation Poston
09:00-09:50 Special Circulations Poston10:00-10:50 Cardiovascular Integration and Adaptation Poston
Thu 21 08:00-09:50 Applied Physiology: Case Studies Poston/Beiser
(Rooms: 346/350/354)
Fri 22 08:00-09:50 REVIEW SESSION Greenwald/
Grubbs
WEEKEND
Mon 25 08:00 EXAM 2 Cardiovascular Physiology

7/26/2019 Physio Coursepack 2016
http://slidepdf.com/reader/full/physio-coursepack-2016 4/282
MODULE 3
PULMONARY PHYSIOLOGY
Tue 26 08:00-08:50 Histology of Respiratory System Sattar
09:00-09:50 Respiratory System Statics I Naureckas
10:00-11:50 Pulmonary Histology Minilab/Review Greenwald
Wed 27 08:00-08:50 Respiratory System Statics II Naureckas
09:00-09:50 Respiratory Dynamics I Naureckas
10:00-10:50 Respiratory Dynamics II Naureckas
Thu 28 08:00-08:50 Ventilation and Diffusion Naureckas
09:00-11:00 Applied Physiology: Case Discussion Naureckas
Fri 29 Symposium - No Class
WEEKEND
FEBRUARY
Mon 01 08:00-08:50 O2 and CO2 Transport Naureckas
09:00-09:50 Ventilation-Perfusion Relations I Hall
10:00- 10:50 Ventilation-Perfusion Relations II Hall
Tue 02 08:00-08:50 Control of Ventilation Naureckas
09:00-09:50 Physiology of Exercise Naureckas
Wed 03 08:30-10:50 Pulmonary Function Lab – DCAM 5E Naureckas
Thu 04 08:00-09:50 REVIEW SESSION Jordan/
Padavil
Fri 05 8:30 EXAM 3- PULMONARY Physiology
WEEKEND

7/26/2019 Physio Coursepack 2016
http://slidepdf.com/reader/full/physio-coursepack-2016 5/282
"#$ %&'()'* +$,-./ ".01)2&(&2
!"##$%#& ' ( ) ) + , - . / 0 + , 1 2 3 4 5 6 ) 6 0 3 ' 6 7 / 4 (
3,4567859:5;<6= 1<6>?7@<9:5;<6 <A> B5;87A<6C "7>5;49D
1 7 A E < : E $ A F 7 6 8 < E ? 7 A
' 6 7 / 4 ( 8 5 / ( 9 : 6 /
06G 0<@?> HG I4?946 J & 2 ) & 2 & J >K4?946L84>?:?A4GK9>G5:M?:<N7G4>5
; + 9 7 ) : 3
06G 0<@?> HG I4?946 J & % ) & 2 & J >K4?946L84>?:?A4GK9>G5:M?:<N7G4>5
06G 0767EMC O<A:P J & % ) ' J * Q >M<A:PL5:M?:<N7G4>5
06G R4994 O<;; J & % ) ' ( * ( SM<;;L84>?:?A4GK9>G5:M?:<N7G4>5
06G 0<A?4; ":H4M44 Q 2 ( ) & J T & >8:N4M44L5:M?:<N7G4>5
06G -4> ,<564:P<9 J & % ) ' Q * U EA<564P<L84>?:?A4GK9>G5:M?:<N7G4>5
06G R<97A B79E7A J & % ) J Q 2 J R<97AGB79E7AL5:M79V?E<;9G4>5
06G O59<?A #<EE<6 J & % ) J % J Q M59<?AG9<EE<6L5:M79V?E<;9G4>5
06G -<7 W?4 J & % ) U 2 T & EX?4LA4567;7NCGK9>G5:M?:<N7G4>5
1 2 3 4 5 6 ) 6 0 3 ! ( + 9 2 5 , 0 < 4 4 5 4 : + , : 4
078?A?: 1<E<;<A7 " 7 > 5 ; 4 ( Y * >S:<E<;<A7L5:M?:<N7G4>5
"<6E?A H644AZ<;> " 7 > 5 ; 4 ' Y % N644AZ<;>L5:M?:<N7G4>5
[;;?97A H65KK9 " 7 > 5 ; 4 % Y U <N65KK9L5:M?:<N7G4>5
[5K64C R76><A " 7 > 5 ; 4 2 Y U <5K64CS76><AL5:M?:<N7G4>5
"?:M<4; \A>466?A46 " 7 > 5 ; 4 ' 8S5A>466?A46L5:M?:<N7G4>5
,?9M< +<>MZ< " 7 > 5 ; 4 ( A6Z<>MZ<L5:M?:<N7G4>5

7/26/2019 Physio Coursepack 2016
http://slidepdf.com/reader/full/physio-coursepack-2016 6/282
"#$%&&#'(#( )#*+ ,%%-.
Title: Basic Histology Text & AtlasAuthor: Junqueira et al
Edition: 12th
EditionPublisher: McGraw-Hill
Title: Physiology
Author: CostanzoEdition: 5
th Edition
Publisher: Saunders Elsevier
Title: Medical PhysiologyAuthor: Boron and BoulpaepEdition: 2nd
Publisher: Saunders Elsevier
Title: Wheater's Functional Histology, A Text and Colour AtlasAuthor: Burkitt, et al
Edition: 5th
Publisher: Churchill-Livingstone
For the cardiovascular module we also recommend:
Title: Cardiovascular PhysiologyAuthor: Pappano and Wier
Edition: 10th
Publisher: Mosby-Elsevier

7/26/2019 Physio Coursepack 2016
http://slidepdf.com/reader/full/physio-coursepack-2016 7/282
L e c t u r e N o t e s
Module 1
Cell PhysiologyHanck, McGehee, & Xie

7/26/2019 Physio Coursepack 2016
http://slidepdf.com/reader/full/physio-coursepack-2016 8/282
McGehee
Membrane Potential &
Ion ChannelsLecture 1

7/26/2019 Physio Coursepack 2016
http://slidepdf.com/reader/full/physio-coursepack-2016 9/282
Figure 1 - Plasma Membrane excludes ions.
Figure 2
Ion channels are an important class of membrane spanning glycoproteins that existin all cells and govern the flow of ions across membranes. In nerve and muscle theyregulate the rapid changes in membrane potential associated with action potentials andpostsynaptic potentials. Ca2+-influx controlled by
these channels can alter many metabolicprocesses within cells leading to activation of various enzymes and proteins. Ca2+-influx actsas a trigger for neurotransmitter release.
Channels are distinguished from eachother on the basis of their ionic selectivity andfactors that control their opening and closing, aprocess called gating. Ion selectivity is achievedthrough interactions between the ion andvarious amino acid residues that line the walls
of the channel pore. Gating involves aconformational change of the channel inresponse to changes in membrane voltage or to the binding of ligands.
To take an ion from a polar environment like water and move it intoa lipid environment, takes a lot of energy.It will not happen spontaneously. Thedielectric constant of water is ~80 andlipid ~2.
Ions in solution are surrounded bya cloud of water molecules which isenergetically favorable. Water providesa polar environment. The atoms reorientin relation to the ions in solution.
Ion channels are basically water filled channels that span the membrane. Theyprovide a polar environment inside the membrane that allows ions to cross under energetically favorable conditions.
The Na channel shown allows Na+ to enter or leave the cell, but it excludes other
ions like K+
or Ca2+
. That is the channels are selective for Na+
. There are also channels thatare selective for K+ ions and Ca2+ ions. Ion channels cannot select exclusively on the basisof ion size as Na+ has a size of 0.95 D, while K+ has a radius of 1.35 D. Thus how couldyou ever make a channel that would allow K+ into cells but exclude Na+?
How does selectivity between ion channels come about? Please see B. Hille, IonicChannels of Excitable Membranes, Sinauer Associates for a more complete description.Ionic hydration energies are large. Ions want to hold onto their waters tightly. The heat of

7/26/2019 Physio Coursepack 2016
http://slidepdf.com/reader/full/physio-coursepack-2016 10/282
Na+
K +
Ca2+
Figure 3 - A sodium Channel
hydration is defined in thermodynamics as theincrease of enthalpy as one mole of free ion in avacuum is dissolved in a large volume of water.Water stabilizes the ions by orienting
appropriately. Oxygens have a partial negativecharge while hydrogens have a partial positivecharge. Thus water is a permanent and strongdipole. Hydration energy then is the stabilizationgained by orienting water molecules appropriatelyand polarizing their electron clouds in the intenselocal field of the ion. Needless to say, if wedehydrate the ions, interactions with other chemical groups (mostly oxygens within the pore)must replace that energy. Ions do not go throughthe lipid membrane because the hydrophobic lipid
core does not have polar groups that interact with the ion.
Atom Radius (Å) -H hydration (KCal/ mol)Li+ 0.60 -131Na+ 0.95 -105K+ 1.33 -85Cs+ 1.69 -71
The change in free energy for the ion to enter the ion channel is equal to the differencein energy it takes to dehydrate the ion minus the energy the ion gets from interactions withchemical groups in the channel. Ions are not thought to dehydrate completely when enteringthe ion channels. Small ions hold onto their waters of hydration more tightly as they have a
more intense electric field. (For all cations with charge of +1, the electric field strength is simplya function of the diameter of the cationic species).
Let's say that there is an anionic site within the channels that a cation interacts with.From Coulomb's Law (remember freshman physics that you thought you would never have tosee again), the interaction energy (per mole) between a cation and anion depends inversely onthe sum of the anionic radius (r site) and the cationic radius (r c).
z is the charge (+1, +2 etc.) of the ion or site.N is Avogadro's number.
e is the elementary charge.

7/26/2019 Physio Coursepack 2016
http://slidepdf.com/reader/full/physio-coursepack-2016 11/282
K+ Na+
The equation can be simplified to:
Sodium which requires 20 KCalmore energy to dehydrate thanpotassium would not be favored bythis channel which does not supplya large interaction energy.
Small differences in energy give large differences in selectivity. For instance 4.2 KCal/ molegive 1000 to 1 difference in selectivity. This energy is quite small in relation to hydration energy.
As mentioned above selectivity occurs because of the interaction between ions andthe walls of the channels. Na, K, and Ca channels are thought to have selectivity filterswithin the pore region where chemical groups are arranged in such a way as to provideselectivity for certain groups.
Ion channels exist in either conducting or non conducting states. Na, K, and Ca
channels are voltage-dependent. At a typical neuronal resting potential they are closed. Ascells depolarize they open.
Na, Ca and many types of K channels enter a refractory state after they aredepolarized for a long period. This is called the inactivated state, where the channels areclosed again, even though the membrane voltage is still depolarized. The channels can bemodeled as follows.
Closed ö Open ö Inactivated
Depolarization
After a period of time at the resting potential channels return from the inactivated state andcan then open again. Channels do not reopen from the inactivated state.

7/26/2019 Physio Coursepack 2016
http://slidepdf.com/reader/full/physio-coursepack-2016 12/282
Figure 5 - Cells have resting potentials
Figure 6 - A simple bath
That electricity was involvedwith living cells was discovered inthe late eighteenth century. But itwasn't until this century that
scientists came to appreciate theelectrical nature of cells. Our understanding was based onphysics and chemistry developed inthe 19th century by scientists likevon Helmholtz, Nernst, SydneyRinger and others. In 1902, JuliusBernstein made the rather remarkable prediction that cellswould have resting potentials.Bernstein suggested that cell
membranes were selectivelypermeable to K ions and thus had aresting potential. They lost their resting potentials when permeabilities toother ions developed.
In the early 20th century scientists like Planck and Einstein were formulating newideas. Bernsteins's ideas were not tested directly until the 1940's when microelectrodeswere developed by Ling and Gerard. These are fine glass tubes that are drawn down to~0.5 micon tip size that can be used to impale living cells. When the electrodes are filledwith a salt solution, they report on the potential inside the cells.
How does a resting potential for a neuron or excitable cell come about? In most cellsthe resting potential is a result of the K+ gradient that exists. At rest many cells have K
channels, but not Na or Ca channels that are open.Sometimes Cl channels are important in setting theresting potential.
We’ll use a simple bath to illustrate our concepts. First let's look at the simplest case, aneutral substance separated into two pools. Thepartition keeps the two pools totally separate so
there is no way for diffusional or any other forces toact.
Let's change the system and give it a new property.We'll put a hole in the membrane that can pass this substance.

7/26/2019 Physio Coursepack 2016
http://slidepdf.com/reader/full/physio-coursepack-2016 13/282
Since there is a gradient this substance will diffuse out of the high concentration pool intothe low concentration pool. If we wait long enoughthe molecule will come to equilibrium in both pools as
long as no other forces are acting on it. Now let's lookat a slightly more complicated case.
Now we have two solutes, but we will give the hole arather remarkable property, that it can pass only oneof the solutes. X goes through the hole but Y doesnot. This is a real property of ion channels. What
happens if we wait until equilibrium is reached?
This is the equilibrium condition. Now let'sgo one step further and make the solute ions.

7/26/2019 Physio Coursepack 2016
http://slidepdf.com/reader/full/physio-coursepack-2016 14/282
Figure 10 - 59 mV potential difference between pools.
We have a pore that is permeable only to Kions and not the Cl ions. What happens now. Well if
you come back a long time later and look into the twopools and look at the solute concentrations you seethe following:
There is a 59 mV potential difference betweenthe two pools, when you put electrodes in the pools
and measure the difference.
How does this come about?
:
:

7/26/2019 Physio Coursepack 2016
http://slidepdf.com/reader/full/physio-coursepack-2016 15/282
What does this mean - Let's go back to our original condition:
Only K+ is permeable in this system not Cl-. If we start with water on both sides of thepartition and the dump in salt at time = 0 there will be no potential difference between thetwo pools at first. After a while a few K molecules would move from the 100 mM KCl side
to the 10 KCl side. This would create a potential between the pools with 100 mM KCl beingnegative with respect to the 10 mM KCl pool (it has more anions than cations). As moreK ions move to the low concentration pool, the potential in the high concentration pool ismade more negative and starts to attract KCl ions back into high K pool. The equilibriumpotential is that which is required to keep all the K ions in the high pool. That is theelectrical attraction exactly balances out the diffusion potential. That is what the NernstEquation tells you. So for our problem we get the following: Thus after a while we wouldmeasure -59 mV between the pools. If we had 1000 mM KCl in one pool and 10 mM KClin the second pool, we would measure -118 mV of potential difference between the pools.
We would measure -59 mV, with the 100 mM KCl pool being negative.If we had 1000 mM and 10 mM we would measure -118 mV.
How much charge separationdoes it take to get thesepotentials. In a cell that is ~10:icrons in diameter it takes
about 106
or 107
ions out of 1011 ions in the cell so it's asmall charge separation.
So we can get a cellpotential. And at -59 mV thepools are at equilibrium, theywill stay like that forever andnot run down. What are real
cells like?

7/26/2019 Physio Coursepack 2016
http://slidepdf.com/reader/full/physio-coursepack-2016 16/282
What is the resting potential inthis cell? Ignoring Ca2+ becausefor the moment that adds aneedless complication, we canuse the Goldman-Hodgkin-KatzEqn.
With his equation you canpredict the resting potential under a variety of conditions. The P's
are permeabilities. If the P's for Na and Cl are low then the equation reverts to the Nernstequation that we discussed before.
For instance at rest the permeability for K is very high and so the resting potentialof the cell is near the K reversal potential. Typically resting potentials are set by Kchannels. In some neurons resting potentials are set by Cl channels that are open. During
an action potential the permeability to Na rises dramatically so the peak of an actionpotential approaches the reversal potential for Na.
In neurons a typicalresting potential is -55 to -70mV. The resting potential isusually set by non-gatedchannels that are open all of
the t ime. The highestpermeability is to K+ ions butthere is sometimes a small Na+
ions as well. The resting potential is that potential where K+ efflux is balanced by Na+ influx.The reason that there is movement of ions is that the cells are not at equilibrium for either K+ ions (-75 to -80 mV is typical reversal potential) or for Na+ ions (+55 mV is typicalreversal potential). When the cell is at rest, the passive flux of Na+ and K+ into and out of the cell are balanced by active transport driven in the opposite direction by ATP-dependentNa-K pump.

7/26/2019 Physio Coursepack 2016
http://slidepdf.com/reader/full/physio-coursepack-2016 17/282
Figure 15 - Na, K and Cl fluxes at rest.
At rest the steady Na+ influx through non-gated channels is balanced by the steadyK+ efflux, so that the membrane potential is constant. This steady state balance changes
when the cell is depolarizedenough to trigger an action
potential. A transient depolarizingpotential, such as an excitatorysynaptic input causes somevoltage-gated Na channels toopen and the resulting increase inmembrane permeability to Na+
allows Na+ influx to outstrip K+
efflux and depolarize the cell.Positive charge builds up insidethe cell. As they depolarize moreNa channels open. This causes
more voltage-gated Na channelsto open, which produces a larger Na+ influx etc. This regenerativepositive feedback cycle developsexplosively driving the membranepotential to near the Na+
equilibrium potential (+55 mV).Because of K+ efflux, the Na+
reversal potential is never quitereached. Typical neuronal action potential reaches +15 mV to +45 mV.
Two processes repolarize the membrane terminating the action potential. Nachannels inactivate decreasing permeability to Na+. Second, voltage-gated K channelsopen after a lag. K+ efflux increases which repolarizes the membrane.
The Goldman-Hodgkin-Katz equation predicts all these different behaviors.
In squid axon which has a large action potential at rest
PK:PNa: PCl º 1/.04/.45
At the peak of the action potential:PK:PNa: PCl º 1/20/.45

7/26/2019 Physio Coursepack 2016
http://slidepdf.com/reader/full/physio-coursepack-2016 18/282
Passive Properties of Neurons
Lecture 2
McGehee

7/26/2019 Physio Coursepack 2016
http://slidepdf.com/reader/full/physio-coursepack-2016 19/282
Passive Membrane Properties:
When currents flow into cell, the membrane voltage changes more slowly.
Im = Ii + Ic Im is total membrane currentIi is ionic currentIc is capacitative current
Current flows through resistor and to charge capacitor (which is the plasma membrane).
V = Q/C

7/26/2019 Physio Coursepack 2016
http://slidepdf.com/reader/full/physio-coursepack-2016 20/282
Lipid bilayers with ion channels haveboth resistance and capacitance. Atypical cell membrane can bemodeled as a resistor in parallel witha capacitor. For this circuit if we give
a constant current step we see thefollowing (Fig 1).
Time Constant :
Vt = V∞(1-e-t/RC)
=RCis the time required to reach 0.63 V∞
Vt voltage at time point tV∞ voltage at steady stateR membrane resistanceC membrane capacitance
The size and shape of synapticpotentials is dictated by the number ofion channels open (R) and the
capacitance of the membrane (C).
Now we need to consider whathappens to that change in voltage as itmoves through the cell. With anyconductor, including copper wiresvoltage signals decay over distance.
Depolarization to a threshold potentialis required to initiate an actionpotential. Action potentials arefrequently initiated in the initialsegment, also called the axon hillock.
Figure 1: Membrane capacitance slows changes in
membrane potential (Vm)
Figure 2: Synaptic inputs decay over distance, which
determines whether the cell will fire an action potential. B
shows the threshold potential at different locations in a
neuron. The low threshold at the axon hillock is due to
the high density of voltage gated Na channels

7/26/2019 Physio Coursepack 2016
http://slidepdf.com/reader/full/physio-coursepack-2016 21/282

7/26/2019 Physio Coursepack 2016
http://slidepdf.com/reader/full/physio-coursepack-2016 22/282
Figure 5 - Decay of injected current as a function of distance.
it characterizes how far the voltage will spread. The length constant is defined as the
distance along the dendrite to the site where ∆Vm has decayed to 1/e or 37% of its initial
value.
Larger processes have longer space constants.
Rm is the resistance of the membrane
Ra is the resistance of the cytoplasm.
As current is injected at location 0 it produces a voltage. The voltage decrementswith distance.
The better the insulation of the membrane the higher is Rm and the longer 8. Currentcan spread further long the inner conductive core (cytoplasm) before leaking across themembrane. In the absence of channel channel activity 8 is 0.1 - 1 mm.

7/26/2019 Physio Coursepack 2016
http://slidepdf.com/reader/full/physio-coursepack-2016 23/282
Figure 6 - Space constant.
Figure 7 - Space constant affects signal conduction.
Passive spread current is calledelectrotonic conduction. The lengthconstant affects spatial summation, theprocess by which synaptic potentialsgenerated in different regions of the
neuron are added together (at the trigger zone aka the initial segment). For a cellwith a short length constant, synapticpotentials that are initiated at the distalend of dendrites will diminishconsiderably as they are passivelyconducted to the trigger zone. If so theycontribute relatively little to summation:Channels shape subthreshold voltageresponse (by changing membraneresistance) and provide the mechanism
for action potential and propagation.Both Na and Ca channels can initiateaction potentials. K currents help shapethe action potentials (ie. terminate) and
determine membrane excitability but are not strictly necessary for action potentials.
Due to the short space constant the signal is dramatically attenuated at the bottomsynapse but not the one on top.
For the case where threshold isreached at the trigger zone, an
action potential is initiated. Whathappens then?Let’s look at the case where weinject a current into the middle of an axon to produce a voltagechange.To get the maximum responsepossible from the nervous systemas we l l as i nc reas ingcomputational ability we want toincrease the speed of conduction.
One way to increase speed of propagation is to make giantnerve fibers. The passive spread of depolarization is the rate limiting step in thepropagation of an action potential.
An action potential generated in one segment of membrane supplies depolarizingcurrent to the adjacent membrane, causing it to depolarize toward threshold. The larger theaxoplasmic resistance Ra the smaller the current flow and thus the longer it takes tochange the charge on the membrane of the adjacent segment.

7/26/2019 Physio Coursepack 2016
http://slidepdf.com/reader/full/physio-coursepack-2016 24/282
Figure 8 - Action potential propagation.
Figure 9 - Conduction speed.
Remember that V=Q/C If the current is small it takes a long time to deliver thecharge.
Also the larger the capacitancethe more charge must be
deposited to produce a change inmembrane potential. Thereforethe time for electrotonic spread isgiven by both Cm and Ra. If theproduct of Cm*Ra is reducedpassive spread speed willincrease. Therefore speed isinversely related to Cm*Ra.
If we make giant nerve fibers Ra
decreases in proportion to the
square of the axon diameter whilethe capacitance (Cm) increaseslinearly with diameter. The neteffect is a decrease in Cm*Ra. Thisadaptation is carried to theextreme in the giantt axion of thesquid which is ~1 mm in diameter.Because this axon carries thesignal for the squid escaperesponse to danger it needs to befast.
A second mechanism for increasing conduction velocity byreducing Cm*R a is called
myelination, the wrapping of glial cell membranes around axons. This process isfunctionally equivalent to increasing the thickness of the membrane by 100 fold.Capacitance of a parallel plate capacitor is inversely proportional to the thickness of theinsulating material. As Cm decreases so does Cm*Ra. Myelination is much more effectivethan increasing the diameter of axons. Conduction in myelinated axons is faster than innon-myelinated axons of the same size, usually much faster.

7/26/2019 Physio Coursepack 2016
http://slidepdf.com/reader/full/physio-coursepack-2016 25/282
Figure 10 - Action potential propagation.
The length constant of the axon, 8, increases. As Cm goes down so does themembrane time constant J (the amount of charge required for the membrane capacitancegoes down because the capacitance goes down — remember V=Q/C . V stays constantas C decreases so does Q. As the effective surface area decreases the metabolic cost of an action potential decreases as well.
There are bare patches of membrane where myelination is interrupted. Myelinationinterferes with the normal regenerative mechanism of an action potential. Action potentialsare typically triggered on the bare membrane of the axon hillock. Because the resistanceof the membrane is high, the currents spread for long distances (myelination increasesmembrane resistance). The diminution of the current is not that much. Current reaches thenext patch of bare membrane, called the node of ranvier, where it initiates an actionpotential. Myelin is interrupted every 1-2 mm for a node. The bare patches of membraneare only 2 microns in length, but contain a very high density of Na channel and can
7/26/2019 Physio Coursepack 2016
http://slidepdf.com/reader/full/physio-coursepack-2016 26/282
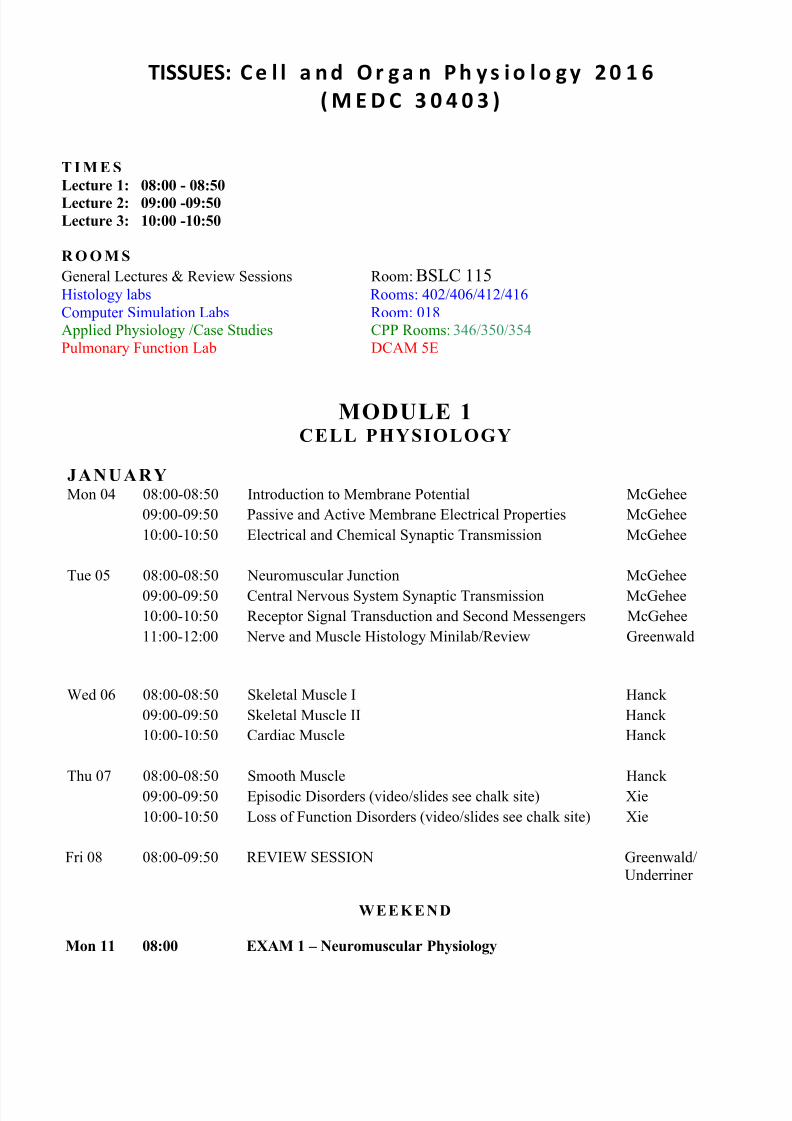
Figure 11 - Nodes of Ranvier.
Figure 12 - Action potentials are regenerated at nodes.
generate an inward Na current. The nodes thus boost the action potential which would dieout even with such a long space constant. In a typical neuron ~5 nodes are active duringthe rising phase of an action potential.
The action
potential spreadsquite rapidly alongthe internode due tothe low capacitanceof the myel insheath. Act ionpotentials slowdown as they crosst h e h i g hcapacitance nodes.T h u s a c t i o n
potentials appear to jump between nodes. This process is called saltatory conduction.
Several diseases of the nervous system such as multiple sclerosis causedemyelination. The lack of myelin slows down the conduction of the action potential and
can devastating effects onbehavior. In the demyelinatedregions act ion potent ia lpropagation. Sometimes actionpotential propagation is blocked.
Myelination is extremelyimportant for making a brain thatresponds rapidly, but withoutmaking it huge (as would be thecase if all neurons had giantaxons).

7/26/2019 Physio Coursepack 2016
http://slidepdf.com/reader/full/physio-coursepack-2016 27/282
Major points:Passive properties of cellsTime constant
Space ConstantMyelination

7/26/2019 Physio Coursepack 2016
http://slidepdf.com/reader/full/physio-coursepack-2016 28/282
Introduction To Synapses:
Electrical Synapses andThe Neuromuscular Junction
Lecture 3
McGehee

7/26/2019 Physio Coursepack 2016
http://slidepdf.com/reader/full/physio-coursepack-2016 29/282
Synapses are specialized zones of contact between cells. Each CNS neuron receives
about 1,000 synaptic inputs, although some neurons receive many more.Synapses can be electrical or chemical in nature. In the brain chemical synapsesare much more common. Electrical synapses are not as plastic as chemical synapses.Electrical synapses don’t show inhibition or long-lasting changes in efficacy. Chemicalsynapses are quite plastic. Transmission can be modified dramatically.Distance between pre- and post-synaptic membrane:Electrical - 3.5 nmChemical - 30-50 nm
Electrical synapses show cytoplasmic continuity between pre- and post-synaptic cells.Continuity established by gap junction channels. There is almost no synaptic delay inelectrical synapses. Transmission is usually bidirectional but sometimes rectification isobserved. Electrical synapses work best when pre-synaptic cell is same size or largerthan post synaptic cell.
Some electrical synapses rectify. That is they show electrical transmission in only

7/26/2019 Physio Coursepack 2016
http://slidepdf.com/reader/full/physio-coursepack-2016 30/282
one direction.
For speed nothing beats a gap junctionsynapse. In fact, the two neurons (pre-and post-synaptic) function almost as ifthey were one cell. Gap junctionchannels are found in cells that comeinto contact with each other with gap
junctions frequently forming betweenthese cells. Gap junctions channelscouple these cells electrically. Forinstance heart cells are coupled by gap
junction channels so they contractsynchronously. Gap junctions have alarge single channel conductance of100 pS (1 pS = 1/1012 ohms). Gap
junction channels are usually open butcan be closed by their cytoplasmicenvironment. They can be modulated
by pH, Ca2+
, or by second messengersystems activated byneurotransmitters. Low pH or elevatedCa2+ frequently close gap junctionchannels (conditions that exist whencells are damaged). Gap junctionchannels that rectify (pass currentprimarily in one direction) are voltage-dependent. That is voltage will open orclose the channels depending on the
voltage.
Gap junctionchannels areformed when twohemi-channels(called hemi-gaps) cometogether. Thechannels meet inthe gap betweenthe twomembranes and
come together toform a channel.Thecommunicatingchannels is ~ 1.5
– 2.0 nmdiameter hole thatconnects thecytoplasm of thepre- and post-
synaptic cells.

7/26/2019 Physio Coursepack 2016
http://slidepdf.com/reader/full/physio-coursepack-2016 31/282
Each hemi-gap is called a connexon. Each connexon is made up of six identical proteinsubunits called connexins which are each 75Å in length. The six connexins cometogether to form a hexagon. Gap junction channels are part of a gene superfamily. Eventhough there are many connexons each member of this family has a lot of similarities.
All seem to have similar four hydrophobic domains that are probably membranespanning. Two extracellular domains that are thought to be involved in the hemi-gapsrecognizing each other to form complete gap junctions channels. The cytoplasmic
regions vary greatly which is why there is a lot of variability in how they respond tomodulatory agents (pH, Ca2+, kinases etc.). Gap junction channels are very important inmany cells for allowing communication between cells especially developmental orregulatory signals. Compounds with molecular weight up to 100 can pass through gap
junction channels i.e. things like cAMP.
Chemical Transmission:Synaptic clefts are normally wider than normal extracellular space around
neurons. Morphologically synapses are clear. The pre-synaptic region is filled withvesicles containing neurotransmitter. In response to an action potential,neurotransmitter is released into synaptic cleft, diffuses across the cleft and then bindsto receptors on the post-synaptic side where it exerts an effect, frequently opening orclosing an ion channel. Neurotransmitters also activate receptors that are not directlylinked to ion channels but rather activate second messenger machinery inside the post-synaptic neurons. Because of this sequence there is a synaptic delay (which can be as
short as 0.3 ms). Chemical transmission can amplify signals. Since each pre-synapticvesicle can contain thousands of molecules of neurotransmitter thousands of ligand-gated ion channels can be opened. Thus in this system a small pre-synaptic neuroncan activate a large post-synaptic cell. Most neurons have pre-synaptic nerve terminalactive zones, but often neurotransmitter release occurs from regions that cannot easilybe identified as active zones. Frequently the same chemical neurotransmitter can havemultiple effects depending on the receptor it binds to. ACh can be excitatory orinhibitory depending on the neuron where it acts and the receptor to which it binds. Forinstance at the neuromuscular junction, ACh opens nicotinic ACh receptors anddepolarizes the post-synaptic cells initiating action potentials i.e. it's excitatory. Theheart has muscarinic ACh receptors. ACh releases on the heart activates potassium

7/26/2019 Physio Coursepack 2016
http://slidepdf.com/reader/full/physio-coursepack-2016 32/282
channels which makes the cellsvery non-excitable. In fact, AChcan almost completely stop theheart from beating by activatingthe muscarinic receptors.Sympathetic neurons have adifferent type of muscarinic AChreceptor than does heart.
Activation of this receptorinhibits a type of K channel(called M channels). After the Mchannels are inhibited the cellsbecome hyperexcitable. Verysmall synaptic inputs causethese cells to fire actionpotentials. In the exampleslisted above ACh has threedifferent effects on post-synaptic cells, dependent on
the post-synaptic neuron.[ACh receptors have been
grouped into nicotinic or muscarinic classes depending on whether nicotine ormuscarine acts as an agonist at these receptors. So far 5 different muscarinic AChreceptors have been identified and 9 nicotinic receptors].
Asmentioned above, receptors at synapses are of two types. Some receptors are
ionophoric. That is after they bind a neurotransmitter, an ion channel, which is part ofthe receptor, opens. These receptors include, nicotinic ACh receptors, GABA receptors,glycine receptors, and glutamate receptors. These receptors include both theneurotransmitter recognition site and the ion channel. Ionophoric receptors have severalsubunits that come togther to make the receptor. The total protein is quite large.Responses to neurotransmitters are very rapid (millisecond time scale).
Other types of receptors are not ionophoric. Rather they couple to second messengersystems inside the cell, rather than opening an ion channel directly. These receptorsinclude noradrenaline, serotonin and dopamine. These receptors are separate from ion

7/26/2019 Physio Coursepack 2016
http://slidepdf.com/reader/full/physio-coursepack-2016 33/282
channels and communicate via GTP binding proteinsand second messenger cascades. Secondmessenger linked receptors are single polypeptidesubunits. Responses are manifested much slower(seconds to minutes). Responses can last for manyminutes or if the second messengers activatetranscriptional machinery, effects can last for days ofweeks. Rather than direct effects, second
messenger receptor activation produces modulatoryresponses changing neuronal excitability.Modulatory synaptic pathways often serve asreinforcing stimuli in learning.
One of the best studies synapses is theneuromuscular junction because it is easy to studyboth the anatomy and physiology. Single musclefibers are usually innervated by one motor axon. Theneurotransmitter released in ACh which binds topost-synaptic ionophoric nicotinic ACh receptors.
The motor neuron innervates a specialized region ofthe
muscle called the end plate . Themotor axon loses its myelin coat nearthe end plate and splits into fine
branches about 2 :m in diameter. Atthe end of the branches arevaricosities called synaptic boutonswhich lie over depressions in themembrane called junctional folds. Thefolds are lined by basement membranea network of connective tissue thatcovers the muscle fiber. Both pre- andpost-synaptic cells secrete proteinsinto the synaptic clefts and junctionalfolds. The basement membrane brings
the appropriate pre- and post-synapticstructures into register. The boutonscontain all of the machinery necessaryfor release - active zones, synapticvesicles filled with ACh, and Cachannels which trigger the release.Ca2+ entering the pre-synaptic cellduring an action potential causessynaptic vesicles to fuse with themembrane at the active zone andtriggers release. Cleft is ~100 nm wide.

7/26/2019 Physio Coursepack 2016
http://slidepdf.com/reader/full/physio-coursepack-2016 34/282
Active zones are
positioned opposite post-synaptic junctional folds. At thetop of the fold is a geometriclattice of ACh receptors with adensity of ~10,000 receptorsper micron2. Each receptor is
about 8.5 nm in diameter. Nearthe bottom of the folds Nachannel convert the end platepotential to an action potential.
When the motor axon isstimulated action potentialsinvade the synaptic boutons,Ca channels open Ca2+ entersthe pre-synaptic cells causingfusion of vesicles with
membranes.
ACh binds to the post-synaptic membrane andcauses an end-plate potential(excitatory). Usually a synapticpotentials of ~70 mV isproduced by a single motorneuron, enough to trigger an
action potential. In theCNS most synaptic
potentials are ~1 mV,thus many synapsesmust activate to initiatean action potential.
Synapticpotentials are largestat the site of initiationand propagate awaypassively, unless anaction potential is
initiated. Synapticpotentials rise rapidlyand decay moreslowly. Once released
ACh diffuses acrossthe cleft rapidly to thereceptors. Not all AChmolecules find thereceptors due to
hydrolysis by acetylcholinesterase and diffusion out of the cleft. Decay of current is dueto time course of binding ACh. The current increase is more rapid than change in

7/26/2019 Physio Coursepack 2016
http://slidepdf.com/reader/full/physio-coursepack-2016 35/282
voltage due to the capacitance of membrane. It takes time for current to charge cellcapacitor. The ACh released does not stay in cleft long at all due to hydrolysis anddiffusion out of cleft.
ACh esterase ACh 666666666666666666666 acetate and choline.
The choline is taken up by the pre-synaptic nerve terminal via a high affinity
uptake system.When the ACh receptor opens it is permeable to both Na and K.
In voltage clamp experiments the reversal potential was found to be ~ 0 mV. No ionsknown reversed at 0 mV, so it was thought that the ACh receptor channels must bepermeable to more than one ion.
INa = gNa * (Vm - ENa)IK = gK * (Vm - EK)IEPSP = gEPSP * (Vm - EEPSP)
INa + IK = 0 at the reversal potentialgNa * (EEPSP - ENa) + gK * (EEPSP-EK) = 0
If gNa=gK then EEPSP = (ENa + EK)/2
gNa/gK = (EEPSP - EK)/(ENa - EEPSP) EK=-100 mV

7/26/2019 Physio Coursepack 2016
http://slidepdf.com/reader/full/physio-coursepack-2016 36/282
ENa=+55 mVTherefore gNa/gK = 1.8
In fact many cations gothrough the channel because it isso large but the main ones are Na
and K. Anions don't go throughbecause there are rings of negativecharge lining the channel. Thechannel allows K to leave the celland Na to enter to enter the cell.
Nicotinic ACh receptorchannels are not selective amongcations, but anions do not gothrough the channel. They are notcapable of producing regenerative
responses like Na channels. Themuscle ACh receptors are blockedby "-bungarotoxin.
To repeat:Presynaptic action potential 6 presynaptic Ca2+ influx 6 AChtransmitter release 6 Diffusion of
ACh across cleft 6 opening of post-synaptic ACh receptor channels 6 End plate potential(epsp) 6 Na channels open 6 action potential propagated in postsynaptic cell.
In the late 1970'sthe technology to studysingle ACh receptorchannels open andclose was invented.Using patch-clamptechniques we canmeasure theelementary currents.When ~200,000 AChreceptor channels open
we get the end platepotential. At -90 mV thecurrent through a singlechannel is about 2.7 pA(10-12 amps), so thesingle channel
conductance is ~ 30 pS. The channels open and close randomly. The mean open time is ~1millisec. During a typical 1 millisec opening of one ACh receptor channel ~17,000 Na ionsrush into the cell. The reversal potential for the unitary current is the same as for the total end

7/26/2019 Physio Coursepack 2016
http://slidepdf.com/reader/full/physio-coursepack-2016 37/282
plate current.
EEPSP = N x p0 x x (Vm - EEPSP)
N is the total number of ACh receptor channels activated.p0 is the percentage of time the activated channel spends openis the conductance of the unitary channel
(Vm - EEPSP) is the driving force on the ions
Thus the end plate current depends on the totalnumber of end plate channels, the probability that thechannels are open, the conductance of the open channeland the driving force. The probability that the channels areopen depends on the concentration of ACh. Each channelopening cause about 0.3 :V of depolarization. The rapid
rising phase of the EPSP is due to the nearly synchronous
activation of ~200,000 ACh receptorchannels. The ACh concentrationfalls in less than 1 ms due tohydrolysis and diffusion of theneurotransmitter. The ACh receptorsstart to close and current goes down.The apparent smooth decay of thecurrent is due to the closing ofthousand so f channels at randomintervals, each contributing a small
step of current.
At rest (-90 mV, for muscle) the ACh receptors open. Since we are near the potassiumreversal potential not a lot of potassium leaves the cell. Since we are far from the sodiumreversal potential a lot of sodium enters the cells and the cells depolarize (positive chargeenters the cell so inside of cell becomes more positive). As the cell depolarizes and reaches0 mV the sodium influx matches the potassium efflux and so the potential is stable at 0 mV.

7/26/2019 Physio Coursepack 2016
http://slidepdf.com/reader/full/physio-coursepack-2016 38/282
Nicotinic ACh receptorsare made up of 5subunits . There aretwo ", one $, one ,and one *.
Molecular weight ofeach subunit" - 40,000$ - 48,000
- 58,000* - 64,000
Total is 275,000. The " subunits bind the ACh, thus 2 molecules of ACh need to be bound before the channel opens.
"-bungarotoxin binds to the " subunit as well. The subunitsare encoded by 4 distinct but related genes. 50% of amino
acids are identical or conservatively substituted, suggestingthat the function of all 4 subunits are similar. It's thoughtthey're allderived from a common ancestor gene. It's thought thatthere are 4 membrane spanning subunits per subunit, M1 -M4.
It's thought that M2 and the segment connecting M2 and M3lines the channel. Amino acid sequence suggests thatsubunits are symmetrically arranged around a central pore.Cation selectivity is achieved through rings of negative
charge that flank the M2 region (mostly glutamate residues).There are negatively charged rings at both the cytoplasmicand extracellular side of the channel. These tend toconcentrate cations near the channels and repel anions.Replacing negative charges with neutral amino acidsreduces single channel conductance. About 6.0 nm of thechannel extends above the membrane bilayer. At theexternal surface the channel has a wide mouth of ~2.5 nm indiameter. Within the bilayer the channel narrows abruptly.
This is where M2 is thought to line the channel. The narrow region is quite short ~2.5 - 3.0 nmin length corresponding to the length of M2 and the hydrophobic core of the bilayer. As the
channel emerges from the inner surface of the bilayer it widens again. Therefore there arethree regions to the channel. A large entrance, a narrow transmembrane pore and a largeinternal membrane portion.

7/26/2019 Physio Coursepack 2016
http://slidepdf.com/reader/full/physio-coursepack-2016 39/282

7/26/2019 Physio Coursepack 2016
http://slidepdf.com/reader/full/physio-coursepack-2016 40/282
Major topics:Electrical SynapsesChemical Synapses
Neuromuscular JunctionNicotinic ACh receptors

7/26/2019 Physio Coursepack 2016
http://slidepdf.com/reader/full/physio-coursepack-2016 41/282
Synaptic Transmission in the CNS
Lecture 4
McGehee

7/26/2019 Physio Coursepack 2016
http://slidepdf.com/reader/full/physio-coursepack-2016 42/282
Signaling in the CNS is more
complicated than at the neuromuscular junction. CNS neurons get thousands ofinputs both excitatory and inhibitory
mediated by different receptors. Somereceptors are coupled to ion channels,while others are coupled to GTP bindingproteins and second messengercascades. Few synaptic inputs in theCNS give large enough PSPs to initiateaction potentials by themselves. Manysynaptic signals must summate to getan action potential. The central neuronsmust integrate a diverse set of inputsinto a coordinated response.
For instance:This simple circuit simultaneouslyexcites the quadriceps while inhibitingthe hamstring so that only one systemworks at any given time. If we stimulatea single DRG cell body all we get is ~0.3
mV of depolarization in the motor neuron. A lot of DRG neurons need to activatesimultaneously to fire the motor neuron. Even if there are sufficient excitatory inputs to fire thecells, inhibitory inputs can keep cells from firing.
In the CNS excitatorytransmitters open ion channelspermeable to Na and K. These arethe glutamate receptors.
The size of an EPSP is:VEPSP = IEPSP/gm
Because most transmittergated channels are voltageindependent, the number of channelsactivated depends on theconcentration of neurotransmitter.IEPSP = gEPSP x (Vm - EEPSP)
As the cell is made more negative thedriving force increases.Most neurons have a resting potentialin the range -55 to -70 mV.The threshold for firing an action

7/26/2019 Physio Coursepack 2016
http://slidepdf.com/reader/full/physio-coursepack-2016 43/282
potential in central neurons is quite low, usuallybetween -55 and -50 mV.
There are three different types of glutamatereceptors, defined on the basis of the
pharmacological agonist that activates the receptors,and each one is in fact a family of receptors. Themajor excitatory action in the CNS is produced whenglutamate binds to kainate and quisqualatereceptors.1. AMPA/ Kainate (also called non-NMDA)2. NMDA receptor3. Metabatrophic glutamate receptor
AmpA/ Kainate areceptors are permeable toboth Na and K. Some of these channels are
permeable to Ca
2+
as well. Both receptor channelsare low conductance.
Metabatropic receptors are linked to secondmessenger cascades via G-proteins
(phosphoinositide cascade) and not to ion channelsdirectly.
NMDA receptors (N-methyl-D-aspartate) areanother type of glutamate receptor that is directlylinked to a high conductance (50 pS) ionchannel. Pore is permeable to Na+, K+, and Ca2+.The channel is selectively blocked by APV(aminophosphonovalerate). The channel is alsoblocked by PCP, and probably represents the mainlocus of action of PCP in the CNS.
Although NMDA receptors are ligand gatedchannels they show many of the properties ofvoltage gated channels. Near the resting potential (-65 mV), the channels are blocked by the Mg2+ present in CSF. The channels are thus nonconductive even though they have bound agonist(NMDA or glutamate). As the cell is depolarized 20-30 mV by the activation of different excitatoryreceptors, the voltage forces the Mg2+ out of theNMDA receptor channel and it becomes conductiveto Na, K and Ca2+. Therefore the channels need both voltage and ligand to open effectively.

7/26/2019 Physio Coursepack 2016
http://slidepdf.com/reader/full/physio-coursepack-2016 44/282
At the single channel level thefollowing is observed.
AMPA/ kainate receptors areresponsible for the most rapid EPSPs
produced by glutamate. NMDAreceptors turn on more slowly thando AMPA receptors so it provides thelate current in the EPSP, if the EPSPis large enough to unblock the NMDAreceptors. The early fast currentobserved is due to AMPA receptors.
Ca2+
entry via NMDAreceptors is important for activatingCa2+-dependent second messenger
cascades, which are important in triggering long-term biochemical changes leading tomodification i.e. memory.
Excessive amounts ofglutamate are toxic to neurons.Glutamate is the major excitatorytransmitter in the brain. Almost allneurons have receptors for it.Nonetheless, prolonged exposureto glutamate produces neuronalcell death. In fact after tissuecultured neurons are exposed toglutamate briefly, many die. Most ofthe effect is due to Ca2+ entry viaNMDA receptors. Ca2+-dependentproteases are activated and Ca2+ entry leads to increased productionof toxic free radicals. Glutamate toxicity contributes to the neuronal cell death observed afterstroke, persistent epileptic seizures and in degenerative diseases like Huntington's chorea.
Agents that that block NMDA receptors may protectagainst the toxic effects of glutamate and are being extensively tested worldwide. Otherglutamate antagonists are neuroprotective as well as are anti-oxidants.
In most central neurons inhibitory neurotransmitters open Cl- channels. Thesechannels represent the target molecule for many drugs active in the CNS. About half of thesynapses in the CNS are inhibitory. If inhibitory synapses are blocked animals go intoconvulsions. The other inhibitory channels in the CNS involve K channels. Remember that EK is ~ -80 mV and ECl is ~ -70 mV. Therefore when each type of channel is activated the cellpotential is kept near the reversal potential for that ion.

7/26/2019 Physio Coursepack 2016
http://slidepdf.com/reader/full/physio-coursepack-2016 45/282
In some cells theresting potential is atECl, therefore when Clchannels open there isno change in potential.
But the Cl channelsopening shuntsexcitatory inputs andclamps cell at ECl.
VEPSP = IEPSP/ gm
IEPSP dependson the driving force onthe excitatory inputand the concentration
of neurotransmitter (i.e. how many channels are opened). As we make gm larger (ie. byopening GABA receptor channels), there is a smaller change in VEPSP and now threshold isno longer reached. Thus activating Cl- channels makes response to excitatory inputs smaller.To repeat: Normally when glutamate receptors are activated neurons depolarize to 0 mV.When GABA receptors are activated neurons want to stay at -70 mV. When both are openthe potential reached is somewhere between the two, but frequently not depolarized enoughto reach threshold for an action potential.
The opening of Cl or K channels inhibits neurons in three ways.1) Neurons are hyperpolarized and moved away from threshold,2) By increasing conductancethe cell is clamped near thereversal potential of theinhibitory ion.3) The increase in membraneconductance shunts theEPSP.
Cl channels arefrequently not influenced byvoltage (there are somevoltage-dependent Clchannels). Cl channels areusually activated by GABA orglycine (spinal chord andbrain stem). Bothneurotransmitters open similar Cl channels. GABA receptors are locus of action forbenzodiazepines (valium and librium) and barbiturates.
GABA receptors, glycine receptors & glutamate receptors are multisubunittransmembrane proteins that link the receptor and the ion channels together. GABA

7/26/2019 Physio Coursepack 2016
http://slidepdf.com/reader/full/physio-coursepack-2016 46/282
receptors have at least three subunits", $, . All three bind GABA although
the " subunit does so with the highest
affinity. binds barbiturates. " and $ bind benzodiazepines.
GABA and glycine are similarto Ach-activated channels. They have4 transmembrane segments (M1, M2,M3, M4). AMPA receptors are similarwith 4 transmembrane segments buthave almost no sequence homologywith ACh receptors. GABA andglycine are 35% - 40% similar andabout 15% - 20% to ACh receptors.The M2 region of GABA and glycine
receptors also lines the pore butcontains basic amino acids (arginineand lysine) so it has poitive rings ofcharge and thus attracts Cl andrepels cations.
All voltage and ligand-gated channels are thought to arrange subunits around a core toform a gated water filled pore. The switchfrom close to open isthought to involve a slight tilting ofsubunits and not radical realignment.
Different signals activate differentchannels. K channels that are alwaysopen generate the resting potential.
Voltage-gated K channelsrepolarize the membrane during an actionpotential. Second messenger gated Kchannels can hyperpolarize themembrane in some inhibitory synapses.
Excitatory and inhibitory signals
are integrated in a common trigger zone,in interneurons and motor neurons, calledthe axon hillock. This region has the mostNa channels per unit area and thus hasthe lowest threshold for activity. Neuronscan have thousands of inputs. Someinputs at at tip of apical dendrites, some on proximal dendrites and some on cell bodies(soma) etc. At the axon hillock all of the signals are integrated. 10 mV of depolarization will

7/26/2019 Physio Coursepack 2016
http://slidepdf.com/reader/full/physio-coursepack-2016 47/282
frequently produce an action potential. At the cell body 30 mV of depolarizationis required to produce an actionpotential.
Some cortical neurons havetrigger zones within the dendritic tree.Ca2+ action potentials can be observedin the dendrites of cortical neurons.Then these action potentials arepassively conducted to the cell bodyand axon hillock. Integration of signalsis not just the linear summation ofsignals (although inear summation isimportant).
Time constant and spaceconstant are important properties forsummation. Signals are propagated ornot depending on the passive propertiesof these neurons.
Synapses can be axo-axonic,axosomatic or axodendritic (spines orshafts). Dendro-dendritic andsomasomatic synapses are found butthey are relatively rare. Proximity of thesynapse to the trigger zone is importantin determining the effectiveness of thesynapse. The closer it is the larger theeffectiveness. Synapses on cell bodiesare often inhibitory, where they will havethe greatest effect.
Synapses on dendritic spines areoften excitatory (they use glutamate).Every spine has at least one synapse. Inhippocampus the spines haveNMDA receptors which Ca2+ into thespines. Spines also have lots of Ca2+/calmodulin kinase, which can beactivated by Ca
2+ entering postsynaptic
cell via NMDA receptors.
Synapses on axon terminals (axo-axonic) indirectly affect activity of post-synaptic cellby controlling amount of transmitter released.

7/26/2019 Physio Coursepack 2016
http://slidepdf.com/reader/full/physio-coursepack-2016 48/282
Many central neurons
have 20-40 main dendritesthat branch into even finerprocesses. Each branch has
two sites for synaptic input,the shafts and the spines.
Most AMPA receptors are not permeable to Ca
2+
.But there are exceptions. If the AMPA receptordoes not contain any GluR2 subunits then it isCa2+-permeable, or if all the subunits were notedited it is Ca2+ permeable. The editing replaces aglutamine with an arginine. Even a single subunitcontaining arginine prevents Ca2+ flux through thereceptor.

7/26/2019 Physio Coursepack 2016
http://slidepdf.com/reader/full/physio-coursepack-2016 49/282
Major topics:Central Nervous system synapsesGlutamate synapses - excitatory
GABA/ Glycine synapses - inhibitoryspatial and temporal summation

7/26/2019 Physio Coursepack 2016
http://slidepdf.com/reader/full/physio-coursepack-2016 50/282
Synaptic Transmission Mediated by Second
Messengers
Lecture 5
McGehee

7/26/2019 Physio Coursepack 2016
http://slidepdf.com/reader/full/physio-coursepack-2016 51/282
Receptors gate or modulate channels indirectly. Most operate via GTP binding protein
intermediates called G-proteins. Family includes "- and $-adrenergic receptors, most serotonin
receptors, dopamine receptors, muscarinic ACh receptors, GABAB receptors, receptors for
neuropeptides, metabotropic glutamate receptors, odorant receptors, rhodopsin etc.
As mentioned above these receptors are linked to G-proteins (there are also receptor tyrosine
kinases). These are proteins that take signal, a conformational change in the receptor, and carry it intothe cell to activate a transducer (the G-protein). These activate effectors. Frequently the effector is asecond messenger system itself (i.e. cAMP, cGMP etc.). This activates a biochemical cascade
resulting in phosphorylation or release of intracellular Ca2+
stores. In some instances G-proteins or
second messengers (cAMP, cGMP) can act directly on an ion channel or other final effector. Thesesecond-messenger linked receptors produce effects which are usually slow. The onset of effect is
usually slow (tenths of seconds to minutes). The effects of activating the receptors can last a long
time. Contrast this to the neurotransmitters that directly gate ion channels i.e. nicotinic ACh
receptors, glutamate receptors, GABAA receptors. There onset of effect is frequently less than onemsec and effect may last for ~10-100 ms. Many different receptors couple to the same second
messenger cascade. For instance, $-adrenergic receptors, CGRP receptors, D1-dopamine receptors,
and A2 adenosine receptors all usually activate the cAMP second messenger system.These receptors have seven transmembrane
segments and activates a G-protein (see Fig. 2).
Figure 1- Multiple effects of receptoractivation
RECEPTOR
G„Protein
Direct
Effect
Direct
Effect
2nd Messenger
Biochemical
Cascade
Ion
Channel
Figure 2 – Receptors have 7 TM segments

7/26/2019 Physio Coursepack 2016
http://slidepdf.com/reader/full/physio-coursepack-2016 52/282
Figure 3 – cAMP cycle
$-adrenergic receptor couples to the G-protein GS to activate adenylyl cyclase to increase activity of
the enzyme, resulting in increased cAMP production which then goes on to activate protein kinase A.
cAMP is a water soluble second messenger system which can diffuse within the cell. Therefore it can
act at a distance from where it is made.G-proteins are not integral membrane proteins. They are associated with the inner leaflet of the
plasma membrane. G-proteins are heterotrimeric molecules, that is they are composed
of three different subunit proteins called ", $, and ( There are at least 15 different " subunits of G-
proteins known so far and these couple to different membrane receptors (5 β and 14 γ) . Sometimes G-
proteins work on opposite sides of a reaction. For instance "-adrenergic receptors or certain
muscarinic receptors activate the G-protein called Gi which acts in an antagonist fashion to GS.

7/26/2019 Physio Coursepack 2016
http://slidepdf.com/reader/full/physio-coursepack-2016 53/282
The G-protein concentration in the brain is very high,specially concentration of the G-protein
called GO. Certain naturally occurring toxins target G-proteins to produce their effects. GS is permanently activated by cholera toxin (which is the first step in the pathogenesis of cholera). In
contrast the G-proteins called Gi and Go are inactivated by pertussis toxin, which causes whooping
cough. Fewer $( subunits exist and these are more tightly coupled to the membrane. G-proteins
amplify the signals arriving at the receptors as one activated receptor can activate many G-proteins.
Fig. 4 – Activation of Protein Kinase A
Cells have more G-protein molecules than individual receptors. For instance, activating a few
receptors can then activate many G-proteins which then will activate many adenylyl cyclase

7/26/2019 Physio Coursepack 2016
http://slidepdf.com/reader/full/physio-coursepack-2016 54/282
molecules.
The tetrameric holoenzyme R 2C2 is inactive. After binding cAMP the catalytic subunit of the kinase is
released and is active. Normally the regulatory subunits inhibit the catalytic subunits and thus prevent
them from phosphorylating substrate. But when they bind cAMP they change conformation and nolonger bind catalytic subunits. Catalytic subunits can then phosphorylate substrate (in the presence of
ATP) serine threonine residues.
Catalytic subunits of kinases
have features that are similarto each other. They are very
highly conserved. Each one
has an ATP binding site and a site that recognizes the substrate (specific amino acids). Regulatorysubunits usually bind to substrate recognition site.
Phosphodiesterase breaks down cAMP. As the levels of cAMP laws of mass action drive the
reaction above to the left and regulatory and catalytic subunits reassociate.An important feature of kinase regulatory domains is that they all contain a sequence
similar to phosphorylation sequence. For protein kinase A (cAMP-dependent kinase) the sequence is
arginine-arginine-X-serine. Other nearby sequences contribute to binding. Thus this region of the
regulatory subunit serves as a pseudo-substrate. Artificial peptides which act as substrates can bemade. Regulatory subunits can frequently be phosphorylated which markedly changes their activity.
Other important kinases have regulatory and catalytic domains combined in one protein i.e. cGMP-kinase, protein kinase C, Ca
2+/ calmodulin kinase etc. Nonetheless, they work in many ways like
protein kinase A. These molecules bend 180E to form hairpin so regulatory subunit can interact with
catalytic subunit.
Figure 5 – cAMP/ Protein kinase A cycle.

7/26/2019 Physio Coursepack 2016
http://slidepdf.com/reader/full/physio-coursepack-2016 55/282
Figure 6 – Protein kinases are related
Phospholipids also make second messengers. Two specific enzymes phospholipase A2 and phospholipase C are involved each of which is activated by G-proteins.
PIP2
PLC
IP + DAG
(PKC)3
Ca Channels
α βγ
When phospholipase C is activated IP3 is
formed. IP3 combines with specific receptors to release Ca2+
from endogenous stores. Also IP1, IP2,
IP4, IP5 are released. Some work as second messengers. Phosphatases remove phosphate groupsleaving inositol which is re-incorporated into membranes. DAG (diacylglycerol) is also produced by
phopholipase C. DAG stays within the membrane. Phospholipids are also required for activation of

7/26/2019 Physio Coursepack 2016
http://slidepdf.com/reader/full/physio-coursepack-2016 56/282
Figure 7 – 2nd
Messengers activated by lipid hydrolysis
PKC (protein kinase C). There are at least 9 isoforms for PKC. Major forms of PKC require Ca2+
foractivation while the minor forms do not. Inactive PKC is found in the cytoplasm. Active PKC is
translocated to membrane where it is functional.
Arachidonic acid can activate certain forms of PKC. When phospholipase A2 is activated
arachidonic acid is released and is rapidly converted to a family of active eicosanoid metabolites.
There is cross-talk between second messenger systems. Frequently proteins can be phosphorylated on more than one site by different kinases. For instance Ca channels have sites forPKA and PKC.

7/26/2019 Physio Coursepack 2016
http://slidepdf.com/reader/full/physio-coursepack-2016 57/282
K channels which are open at rest can be closed by phosphorylation. Thus small depolarizingcurrents would produce large depolarizations as the channels that are normally active at rest are
inhibited.
As we said before secondmessenger signals are much slower than
ligand gated channel signals. Forinstance:
ACh Muscarinic ACh Receptors (10 minutes)
Nicotinic ACh Receptors (20 msec)
Figure 8- Modulatory locations.
Slow synaptic actions typically modulate excitability. They can affect the threshold for spike
generation, amplitude and duration of action potential.Sometimes G-proteins interact directly with ion channels. ACh greatly decreases the heart rate.
When this occurs the cell is much less excitable.
Fig. 9 – Fast and slow synaptic transmission.

7/26/2019 Physio Coursepack 2016
http://slidepdf.com/reader/full/physio-coursepack-2016 58/282
Figure 10- Hippocampal neuron excitability is greatly increased by diminishing Ca
2+-activated K
currents.
Other channels are modulated directly by second messengers cAMP, cGMP or arachidonic
acid metabolites. Phosphorylation is not required.
cGMP6666
Opens cation selective channels in photoreceptors.
cAMP 6666 Opens cation selective channels in olfactory bulb.
Receptors usually (but not always) desensitize. That is prolonged exposure toneurotransmitters decreases efficacy, until transmitter has no effect at all.
Second messengers also regulate gene expression and thus can make long-lasting changes to
synaptic transmission.

7/26/2019 Physio Coursepack 2016
http://slidepdf.com/reader/full/physio-coursepack-2016 59/282
Figure 11 – Both short and long-term effects mediated by chemical transmitters.

7/26/2019 Physio Coursepack 2016
http://slidepdf.com/reader/full/physio-coursepack-2016 60/282
Major topics:
G-protein linked receptors
Second messenger cascades
Slow modulatory responses
Extra Figures

7/26/2019 Physio Coursepack 2016
http://slidepdf.com/reader/full/physio-coursepack-2016 61/282

7/26/2019 Physio Coursepack 2016
http://slidepdf.com/reader/full/physio-coursepack-2016 62/282

7/26/2019 Physio Coursepack 2016
http://slidepdf.com/reader/full/physio-coursepack-2016 63/282

7/26/2019 Physio Coursepack 2016
http://slidepdf.com/reader/full/physio-coursepack-2016 64/282
"
The Physiology of MuscleJim O’ReillyOffice 426 BSLC
Skeletal Muscle
You will recall that muscle is one of the four great cohorts of tissue (with neural tissue,
connective tissue and epithelia). Muscles are biological motors that convert the
chemical potential energy in high-energy phosphate bonds into force that is used to do
work and generate mechanical power. Muscle tissue will shorten when active, can be
extended under an external load and is capable of storing elastic potential energy. Like
all motors, muscle is not %100 efficient and an active muscle always produces copious
amounts of heat as well as force, work and power.
Humans have three distinct types of muscle: skeletal muscle, cardiac muscle and smooth muscle. Skeletal muscle (as the name implies) is attached to and works with
the skeletal system to produce motion and maintain posture. It is innervated by somatic
motor neurons and can be brought under voluntary control by the motor cortex (i.e.,
voluntary movements). It can also be recruited from
the brainstem (e.g., respiration when you are asleep)
and directly from the spinal chord (e.g., spinal
reflexes).
Motion is generally the first function of skeletal muscle
that comes to mind but it also plays a critical roll in
maintaining posture, driving venous return in the
peripheral circulation and heat production.
SKELETAL MUSCLE ORGANIZATION
Muscle > Fascicle > Muscle Fiber (= Muscle Cell) >
Myofibril > Sarcomere > Filament
The terms “muscle” and “fascicle” are applied
somewhat arbitrarily. A single “muscle” can be
functionally integrated with and always recruited in
concert with other nearby muscles (e.g. the collective
external rotators of the hip) or can include several
anatomically distinct parts (e.g., the triceps brachii or
serratus anterior) that tend to function as a unit. Other
muscles appear anatomically homogeneous yet are
composed of distinct or overlapping regions that are
used for different actions (e.g., the temporalis, pectoralis
major or trapezius). A fascicle is a bundle of muscle
cells that are parallel in orientation and tend to stay
together as a muscle is dissected. Fascicles are readily observed in well-cooked beef
(such as in a stew).

7/26/2019 Physio Coursepack 2016
http://slidepdf.com/reader/full/physio-coursepack-2016 65/282
#
A skeletal “muscle” is an organ that is composed of a variety of tissues in addition to
skeletal muscle tissue itself. This includes satellite cells (stem cells that regenerate
damaged muscle), the ends of motor and sensory nerve fibers, blood vessels and an
extensive connective tissue framework. This connective tissue is termed the investing
fascia and it defines the surface of the muscle, all of its major compartments, and
extends onto the surface of every individual muscle fiber. The part of the deep fasciadefining the surface of the muscle and its major compartments is termed the epimysium.
The perimysium defines fascicles and the endomysium covers the surface of each
individual muscle fiber. The investing fascia functions to anchor the muscle cells to each
other, and anchor the fascicles to tendons and bones. This investing fascia also acts as
a series elastic component of the organ as a whole that is capable of storing elastic
potential energy and releasing it to improve the energy efficiency of cyclical movements
and amplify muscle mass specific power output in explosive, episodic movements.
MUSCLE FIBER STRUCTURE AND ORGANIZATION
Skeletal muscle fibers are syncytia, arising from numerous myoblasts that fuse togetherduring development. As a consequence, each muscle fiber has numerous nuclei that arelocated in its periphery. Fibers are long and cylindrical, ranging from about 10-100 microns
in diameter and from around 600mm (sartorius) to 1mm (stapedius) in length.
The major components of muscle fibers include myofibrils, the t-tubule/sarcoplasmicreticulum network, and mitochondria. Myofibrils are composed of single row ofsarcomeres, stacked end to end and running the entire length of the fiber. The sarcomere
is the fundamental contractile unit of skeletal and cardiac muscle. Individual sarcomereshave a banded appearance and the sarcomeres of adjacent myofibrils are aligned suchthat the tissue itself has a banded appearance under a light microscope. This is why
skeletal muscle is also called “striated muscle”. Each myofibril is connected directly to thecell membrane (sarcolemma) of the muscle fiber via invaginations termed transversetubules (= t-tubules) and surrounded by sarcoplasmic reticulum. The roll of the t-tubule/SR
system in controlling muscle contraction will be discussed later. Mitochondria (=sarcosomes in muscle) are the membrane-bound organelles that generate ATP used tofuel muscle contraction. They form branching networks between the myofibrils that canrapidly hypertrophy or atrophy in response to exercise or lethargy.
SARCOMERE ORGANIZATION
Sarcomeres are composed of overlapping filaments that interact to generate force.
Actin and Associated Proteins
Actin monomers (globular or G-actin) bind to form actin filaments (F-actin). Two
strands of F-actin organize into a helix that has binding sites for myosin.
Tropomyosin dimers also form a long filament. The dimer lies on the edge of the
groove of the two actin strands across seven actin monomers. In the resting state,
tropomyosin blocks the myosin binding site on the F-actin.
Troponin has three subunits: Troponin T (TnT) binds to tropomyosin, troponin I and
troponin C. Troponin C (TnC) is calcium-sensitive, and each TnC will bind with up to 4
calcium ions. Troponin I (TnI) binds to actin and inhibits the interaction between actin
and myosin when in close proximity to the myosin binding site.

7/26/2019 Physio Coursepack 2016
http://slidepdf.com/reader/full/physio-coursepack-2016 66/282

7/26/2019 Physio Coursepack 2016
http://slidepdf.com/reader/full/physio-coursepack-2016 67/282
%
filament while the myosin heads stick out the sides. They extend from the M-line toward the
Z-disks. Myosin is connected to the Z-disk by the protein titin (called the third filament
system) that provides elasticity and support. The regions of the sarcomere are often
described as bands.
The A band (A for anisotropic) extends the full length of the thick filament.
The I band (I for isotropic), is a band that only includes the region of the thin filaments that don’t overlap with myosin. It reaches from the tip of one think
filament to the next (so it spans parts of two sarcomeres and crosses the Z-
disk).
The H band includes the region of myosin that does not overlap with actin (so it
crosses the M-line).

7/26/2019 Physio Coursepack 2016
http://slidepdf.com/reader/full/physio-coursepack-2016 68/282
&
SKELETAL MUSCLE CONTRACTION
Cross-bridge cycling - The sliding-filament model describes the mechanisms of muscle
contraction. Actin and myosin move past each other and cause sarcomere contraction
through cross-bridge cycling.
1. At rest: ATP binds to the ATPase site on myosin. Tropomyosin/troponin complex sits overthe high-affinity binding site for myosin preventing interaction.
2. Initiation of cross-bridge cycling: Cycling is initiated when calcium floods into the
myofilaments. Calcium binds to TnC causing tropomyosin to shift into the actin groove
exposing the high-affinity myosin binding site.
3. Formation of the cross bridge: Myosin plus ATP binds to actin. ATP splits into ADP and
Pi and the myosin head rachets along the actin with the dissociation of Pi.
4. Cross bridge release. ADP separates from myosin and a new ATP binds at which point
actin is released.
5. Continuing Contraction. Once myosin is separated from actin and the myosin head
positioned appropriately, the cycle can start again.
6. Ending contraction. Calcium uptake prevents the tropomysin/troponin shift on the actin
filament blocking the myosin binding site and ending the contraction.

7/26/2019 Physio Coursepack 2016
http://slidepdf.com/reader/full/physio-coursepack-2016 69/282
'
The force generated by a sarcomere
depends on the number of actin- myosin
crossbridges. As the sarcomere begins to
shorten, force increases until there is
complete overlap between actin and the
region of the thick filament that contains the
myosin heads. At this point, force generation plateaus. If contraction
continues so that actin filaments from the
two ends of the sarcomere overlap or
myosin reaches the Z- disks, force
decreases precipitously and the sarcomere
may be damaged.
CALCIUM RELEASE AND MUSCLE ACTIVATION
Calcium is critical for muscle function and the muscle cell is well adapted to deliver
calcium to the myofilaments during muscle contraction and to sequester calcium in order
for the muscle to relax.
The muscle cell
membrane, the
sarcolemma, extends
into the muscle fiber
forming transverse
tubules (T-tubules) that
branch around the
myofibrils at boundariesof the A-I bands.
Enlargements of the
sarcoplasmic reticulum
(SR), terminal cisternae,
border the T-tubules
forming the triad. The
SR is a major calcium
storage organelle.
Membrane depolarization travels along the sarcolemma and T-tubules. At the triad, depolarization activates mechanisms for calcium release. In skeletal muscle, ryanodine
receptors (RyR1) on the SR are activated via dihydropyridine receptors causing calcium
release from the SR through electromechanical coupling. Calcium is passively
released from the SR. At the end of the membrane depolarization, calcium is actively
pumped back into the SR.

7/26/2019 Physio Coursepack 2016
http://slidepdf.com/reader/full/physio-coursepack-2016 70/282
(
MUSCLE FIBER TYPES.
Muscle fibers have different characteristics that are related to their function.
Skeletal Muscle Fiber Types
Fibers can be fast contracting or slow contracting. This is due to differences in
speed of cycling of different myosin heavy chain isoforms. Fast muscle has a fast
isoform, slow has a slow isoform. This can be determined with antibody staining or
staining for myosin ATPase that differs with pH between the isoforms.
Fibers can be aerobic (use oxidative metabolism) or anaerobic (get energy through
glycolysis). Aerobic muscle tends to be darker than anaerobic muscle because it has
a much higher density of mitochondria, capillaries, and myoglobin. Succinate
dehydrogenase stain can be used to determine oxidative capacity.
With these characteristics, we generally classify muscle into three different fiber types:
Fast glycolytic (FG), Fast oxidative glycolytic (FOG) and slow oxidative (SO) fiber types.
FG fibers are fast but quick to fatigue as they deplete glycogen reserves, SO fibers are
slow but can work for longer with the continuing generation of energy through oxidative
metabolism. FOG fibers are intermediate.
In mammals, muscles are a mix of these different fiber types; however, depending on
muscle use or location in a muscle, one type may be more prevalent. Having
heterogeneous populations of fiber types allows he muscle to work in a range of
conditions. All muscle fibers in a given motor unit are of the same fiber type. This makes
sense functionally as those fibers will be activated together during movement.

7/26/2019 Physio Coursepack 2016
http://slidepdf.com/reader/full/physio-coursepack-2016 71/282
)
MOTOR UNITS HAVE
HOMOGENEOUS FIBERTYPES
All of the skeletal musclecells innervated by a singlelower (brain stem or spinalcord) motor neuron are called
a motor unit. A single motorneuron may innervate fromaround 10 to over 1000
fibers. With few exceptions,a given skeletal muscle fiberis innervated by only a single
motor neuron. All of themuscle fibers in a givenmotor unit are recruited in
unison and are the samefiber type.
SKELETAL MUSCLEGROWTH AND CHANGE
Skeletal muscle is a resilient
and responsive tissue. It has
an impressive ability to
change in response to many factors including, for example, injury or disuse, aging and
training. Skeletal muscle also has some ability to repair itself with satellite cells,
(myogenic precursor cells) and muscle side population cells that have some of the
characteristics of stem cells.
Skeletal muscle changes due to:
Disuse. Many factors including the lack of innervation or excitation by a motor neuron or
other incapacitating illnesses can lead to acute muscle atrophy. Specific atrophic
changes include decrease in muscle fiber size and in overall muscle mass. During acute
atrophy, fibers tend to shift toward faster fiber types. In the case muscle fiber atrophy
due to loss of innervation, it is possible for muscle to be re-innervated by other healthy
motor neurons. When this happens the re-innervated fibers take on the fiber type
characteristic of that motoneuron’s motor unit. Unlike normal human muscle in which
fiber types are mixed, re-innervation can result in patches of muscle of a single fiber
type. In cases of disuse in which there is no nervous system damage, rehabilitation can
restore normal muscle morphology and function.
Aging. Muscle experiences chronic atrophy during aging. Unlike atrophy associated with
injury, chronic atrophy involves decrease in fiber numbers as well as fiber size and fiber
numbers. Also, unlike acute atrophy, faster fiber types seem to be selectively lost during
chronic atrophy. Some of these differences, such as the loss of muscle fibers, are due to
the decrease in a muscle’s ability to repair itself with aging.
Training. Training can lead to muscle fiber hypertrophy, an increase in the size of muscle
fibers or in the oxidative capacity of SO fibers. In some cases, training can also cause

7/26/2019 Physio Coursepack 2016
http://slidepdf.com/reader/full/physio-coursepack-2016 72/282
*
changes in fiber type. In particular, myosin heavy chain isoforms can switch leading to
changes between FG and FOG fiber types but, in general, is not associated with
changes between slow and fast fiber types.
SKELETAL MUSCLE FUNCTION
FORCE GENERATION BY
MUSCLES – MOVEMENT AND
POSTURE.
We looked at how muscle
generates force during shortening
of a sarcomere and that
can be extrapolated to an entire
muscle. Muscle can also generate
force when it is not shortening and
even when it is extending.
Concentric Contraction -
contraction during shortening. The
force applied to the muscle is less than the force being generated by
it and the muscle shortens.
Isometric Contraction -
contraction at a constant length.
The force applied to the muscle is
the same as the force generated
by it.
Eccentric Contraction -
contraction during lengthening.
The force applied to the muscle isgreater than the force being
generated by it and causes
muscle extension.
Concentric and eccentric contraction can also be thought in terms of the work performed
by a muscle.
Work = Force * Distance.
Muscles can do positive and negative work: Positive work = overall more work
performed during concentric contraction. Negative work = overall more work performed
during eccentric contraction.

7/26/2019 Physio Coursepack 2016
http://slidepdf.com/reader/full/physio-coursepack-2016 73/282
"+
Work loops are useful for understanding the work
done by a muscle. A work loop plots length on
the X-axis vs. force on the Y-axis over an entire
contraction cycle. The area within the resulting
“loop” represents the overall work performed
during the cycle. Is it positive or negative work?
Without arrows on the work loop to indicate the direction of force and length change over time, it
is impossible to know whether overall work
performed during the cycle is positive or negative.
A counterclockwise loop = positive work, A
clockwise loop = negative work.
This is simple to see when the cycle involve only
concentric or eccentric contraction but what if the
muscle performs both concentric and eccentric
contraction during a cycle?
A work loop still results and the overall work
performed is either positive or negative.When a muscle generates positive work it is said
to be acting as a motor, when it generates
negative work it is said to be acting as a brake.
Much less is known about how myosin and actin
work in eccentric contraction than in concentric
contraction but that type of contraction is known
to be more damaging to muscle than concentric
contraction. There is some evidence that the
damage from eccentric contraction promotes
muscle growth through the repair process but this
hypothesis is under debate. It is thought that rather than releasing when ATP binds to
the myosin head (as in concentric contraction), much of the separation of myosin from
actin during eccentric contraction is due to mechanical pulling apart of that bridge. The
damage that occurs to the muscle cell during this process is likely a prime cause of
delayed onset muscle soreness that is particularly common after eccentric exercises. It
is unclear what causes this soreness – an inflammatory response, remodeling or other
factors. It is also unclear how the nervous system controls eccentric contractions but
appears to involve different patterns of motor unit recruitment and levels of excitation of
the muscle.
MUSCLE ARCHITECTURE
There are many ways to arrange muscle fibers in a skeletal muscle. Parallel (or strap)
muscles have fibers/fascicles run in nearly the same orientation, in series with their
tendon. Convergent muscles have fibers/fascicles arranged in a fan shape,
converging on a single tendon. Circular muscles have fibers/fascicles that form a ring
around an opening. Pennate muscles have muscle fibers that insert onto a central
tendon at an angle: Unipennate muscles have fibers that insert on the tendon from
one side, bipennate muscles have fibers that insert on the tendon from two sides, and
multipennate muscles have fibers that insert on a tendon from multiple sides, may
also include multiple tendons.

7/26/2019 Physio Coursepack 2016
http://slidepdf.com/reader/full/physio-coursepack-2016 74/282
10
While for some muscles it is necessary to generate high force, others may require less
force but need to contract over a longer distance. The organization of muscle fibers
relative to their tendons can help optimize for force or displacement. The two prime
contrasting examples are parallel fiber muscles and pennate muscles. In general,
pennate muscles can generate more force because, for a muscle of a given size, many
more fibers can insert onto a tendon. Although force production per fiber is decreased in
relation to their angle to the tendon, the large increase in fiber number leads to higher total force output. Because muscle fibers in the pennate arrangement are shorter, they
cannot contract as far and because they are at an angle to the tendon (and direction of
pulling), only a fraction of the length change of an individual fiber will translate to
displacement of the tendon. In a parallel fibered muscle, fewer fibers can insert onto its
tendon but those fibers can run the full length of the muscle. Because there are many
fewer fibers, force will be lower but because the muscle fibers (and thus sarcomeres) are
in series with the tendon, contraction of the muscle fiber allows the muscle to generate
force and shorten over a much greater distance than would be allowed with a pennate
arrangement.
HEAT PRODUCTION
Muscles produce heat – we experience this regularly, with its compensatory sweat,
during exertion. Although there are other tissues that can generate heat – such as brown
adipose tissue in newborns - As endotherms, we rely fundamentally on muscles as heat
generators to maintain a relatively consistent body temperature. Where does the heat
come from? Heat is given off as a bi-product of cycling of calcium back into the
sarcoplasmic reticulum by the calcium-ATPase pump, from mitochondria as a bi-product
of ATP production and from other sources, including friction of muscle cells during
contraction.
THERMOGENESIS
Shivering thermogenesis is the generation of heat using minor repeated muscle contractions that don’t lead to effective force generation. Shivering is mediated by
involuntary mechanisms and is often augmented by piloerection or “goosebumps”,
involving activation of the arrector pili muscles associated with each hair follicles. The
contraction of these muscles causes your hair to stand up. This behavior serves to
increase the thickness of the boundary layer of air between body and the external
environment in animals with thick fur coats. It probably still serves this function on our
scalp, but would seem to offer little help in retaining heat over the rest of our body (at
least for most of us).
Non-shivering thermogenesis is heat production that does not rely on muscle
contraction of shivering. Brown adipose tissue is not muscle but does contain a very
high density of mitochondria that can produce heat. This tissue is highly vascularized toallow the circulatory system to both provide sufficient oxygen to the mitochondria and
circulate heat produced throughout body. In humans, this tissue is primarily seen in
newborns.
7/26/2019 Physio Coursepack 2016
http://slidepdf.com/reader/full/physio-coursepack-2016 75/282
11
Cardiac Muscle
Cardiac muscle cells are incredible workhorses, contracting rhythmically without
voluntary control 24/7. For a 23 year old, a good resting heart rate is around 60 – 70
beats per minute and 150 or so during vigorous exercise. Even with a 60 bpm heart rate
and resting 24 hours a day, the heart (and thus the cardiac cells) would have to contract
86,400 times in 24 hours. Add in even a little movement and it easily goes above 100K.
Over a lifetime this adds up to billions of contractions. This is particularly amazing as
cardiac muscle does not have the regenerative properties of skeletal or smooth muscle.
So, not only does the heart have to beat many millions of times, but individual muscle
cells also have to meet these same demands.
In this lecture we will examine cardiac muscle. We will start with A. the overall
organization of cardiac muscle cells in the heart but will spend most of the time at
the tissue level examining B. the histology of cardiac muscle cells and how they
function. Specialized signal conducting cells and cardiac muscle cells’ inherent ability to
relay signals are critically important for activating and coordinating heart contraction. We
will discuss C. Excitation of cardiac muscle through gap junctions and specialized
conductive cells. At this point we will focus on the anatomical perspective but you will have detailed physiology of heart function later in the course. Disorders and diseases of
the heart are a major cause of hospitalization and death. If there is time at the end of
class, we will explore examples of how cardiac muscle cells are compromised by
disease and research on treating the damaged heart at the cellular level.
To understand cardiac muscle fibers and how they work, we need to understand how
they fit into the overall architecture of the heart. The cardiac muscle cells are organized
into the muscular layer of the heart called the myocardium. The myocardium is
sandwiched between connective tissue and epi-/endothelium that protect it and provide
support.
Pericardium: External to the myocardium are several connective tissue and
epithelial/mesothelial layers together called the pericardium. The pericardium surrounds
the heart and provides support and stabilization. It connects to other structures in the
thoracic cavity. Between pericardial layers there is a fluid-filled space. The innermost
layer of the pericardium, the epicardium, is tightly connected to the myocardium and
forms part of the heart wall.
Internal to the myocardium is the endocardium, a layer of connective tissue lined by an
endothelial layer that separates the myocardium from the blood it pumps.
CARDIAC MUSCLE ORGANIZATION.
The heart is an amazing structure and very different from the other muscular systems in
the body. Like the skeletal muscle, cardiac muscle is organized into fascicles but those
fascicles aren’t organized to pull on stiff skeletal structures but instead to squeeze the
spaces within them and, as a result, pump the blood from those spaces.
7/26/2019 Physio Coursepack 2016
http://slidepdf.com/reader/full/physio-coursepack-2016 76/282
12
Ventricles: Fascicles spiral around the ventricles allowing them to squeeze and pump
the blood within. Unlike skeletal fascicles, cardiac fascicles are not independent as many
cells cross between them as well as from more superficial to more deep layers of the
myocardium. The fiber orientations vary through the depth of the myocardium with the
deepest fibers running at significantly different angles from the superficial fibers. The left
ventricle additionally has a thick middle layer of the myocardium with a distinct
circumferential orientation. The biomechanics of this complex organization has not been
investigated in depth.
Atria: Cardiac muscle fibers associated with the atria are also organized into fascicles.
However, the myocardium is thinner and does not seem to show the complex changes
in fiber angle with depth as seen in the ventricles.
ANATOMY AND FUNCTION OF CARDIAC MUSCLE CELLS.
Cardiac muscle cells share some characteristics with skeletal muscle cells and others
with smooth muscle. They also have their own unique identifying features. Compare and
contrast the structure of these three muscle cell types in relation to how they function in
the organism.
Cardiac muscle cell summary of characteristics.
15-35 microns ("m) or so in diameter, 85 – 115 "m in length. 1-
2 nuclei located centrally in the cell.
Cardiac muscle have irregular shapes and often branch. Along with the
overlapping organization of fascicles, this helps generate an
integrated heart contraction. Rather than pulling along one axis, as generally
occurs in skeletal muscles, this organization helps the heart to squeeze the
heart chambers and the blood within them.
Cardiac cells are striated.
Contractions are involuntary. Cells are electrically coupled.
SR-T-tubule are organized in diads rather than triads.
Membrane structure.
Membranes of cardiac muscle cells have a number of interesting features that are
intrinsic to their function. Cardiac muscle fibers connect end-to-end through
intercalated disks. The disks can have transverse (run perpendicular the fiber) and
longitudinal (run parallel to the fiber) portions. Actin filaments adjacent to the
intercalated disk are connected to it through the fascia adherentes. One of the
important actin binding proteins at the fascia adherentes is N-RAP (nebulin-relatedanchoring protein) which appears important for both connecting to adjacent cells and
for myofibrillogenesis. Maculae adherentes (desmosomes) bind adjacent cardiac
muscle fibers through cadherins. Gap junctions are found in a number of different
tissues. In cardiac muscle, they allow electrical coupling between cells to propagate
waves of muscle contraction that squeeze heart chambers.
Structures that function in contraction
For the most part, the same basic mechanism and types of proteins that drive skeletalmuscle contraction are also important in cardiac muscle contraction.

7/26/2019 Physio Coursepack 2016
http://slidepdf.com/reader/full/physio-coursepack-2016 77/282
13
Sarcomere structure
Sarcomeres are organized serially in the muscle fiber with the same banding pattern as
in skeletal muscle They are composed of actin, myosin and other proteins also found in
skeletal muscle; however, in some cases, the protein isoforms in cardiac muscle are
different (for example, there are cardiac specific myosin heavy chain isoforms and
troponin isoforms). Despite these similarities in overall sarcomere structure, cardiac
muscle acts over a much narrower range of length change during contraction.
To understand the physiology of the heart and how cardiac muscle contracts to generate
pumping, it is important to understand the relationship between muscle contraction and
heart pumping.
The Frank-Starling law states that the greater the amount of blood that enters the
heart in a cycle, the greater the amount of blood that is pumped out. This implies that
the contractile mechanisms are able to generate a more forceful contraction when the
heart is more full. In fact, in cardiac muscle, the more the muscle fibers are stretched –
as would happen with increases in the heart’s blood volume – the more sensitive they
are to calcium and the more forceful their contractions become. This is a fantastic built-
in regulatory mechanism to modulate heart pumping with variation in blood volume.

7/26/2019 Physio Coursepack 2016
http://slidepdf.com/reader/full/physio-coursepack-2016 78/282
14
Several important differences between skeletal and cardiac muscle:
1. SR: As mentioned above, rather than having a triad structure with two SRs flanking a
t-tubule, a single SR and t-tubule form a diad.
2. Calcium stores: while in skeletal muscle the calcium needed from contraction has
been shown to come primarily from intracellular stores, cardiac muscle relies heavilyon extracellular calcium.
3. Proteins associated with calcium release: Calcium channels on the sarcolemma,
similar to dihydropyridine receptors, allow significant extracellular calcium to enter. That
calcium triggers a cardiac version of the ryanodine receptor, RyR2, to release calcium
from the SR in a process called calcium induced calcium release.
As might be expected by its constant activity, cardiac muscle is highly oxidative and
has a high density of mitochondria to generate ATP.
EXCITATION OF CARDIAC MUSCLE THROUGH GAP JUNCTIONS AND SPECIALIZED CELLS.
Gap junctions. In cardiac muscle gap junctions provide a mechanism for cells,
independent of innervation, to coordinate their activity. Gap junctions tend to be located
at the ends of cells, connecting in the longitudinal axis so excitation spreads along the
length of fibers and fascicles more rapidly than in the transverse direction. Gap junctions
are critical for normal cardiac function and abnormalities in these junctions are
associated with arrhythmic contraction.
Other excitatory and conductive cells. In addition to the conductive ability of
contractile myocytes (due to their gap junctions), other cells in the heart have been
specialized to form a network of cells that generate and conduct electrical signals. Youexamined this system that includes SA and AV nodes as well as specialized muscle
fibers when covering heart anatomy. We just recently marked the 100th
anniversary of
the comprehensive description of this system. Only relatively recently, cells of heart’s
electrical system have been shown to be derived from embryonic muscle precursor cells
(although this had been suspected by some researchers many decades earlier).
Purkinje cells are a good example of conductive cells that are relatively
straightforward to see in lab. They can frequently be observed between the contractile
muscle cells of the myocardium and the endocardium. Purkinje cells are larger than the
contractile myocytes and have large nuclei. They are organized together into bundles
that have been suggested to improve conduction speed. Often light staining of few
myofilaments can be seen near the periphery of the cell. This contrasts strikingly with
contractile muscle cells that are dominated throughout their cross-section by
myofilaments.

7/26/2019 Physio Coursepack 2016
http://slidepdf.com/reader/full/physio-coursepack-2016 79/282
15
Smooth Muscle
Smooth muscle functions in many internal organs including structures of the
gastrointestinal tract, the reproductive tracts and the circulatory system as well as the
uterus, urinary bladder, and iris of the eye. Like cardiac muscle, smooth muscle is
involuntary and there is generally direct inter-cell communication through gap junctions that allows electrical signals driving contraction to pass along the tissue; however,
overall smooth muscle histology and contraction is strikingly different from both skeletal
and cardiac muscle. We will start today by examining A. The morphology of smooth
muscle cells and their contractile mechanisms. We will also look at broader
organization to examine B. the tissue-level organization of smooth muscle in
relation to function as exemplified in several organ systems and C. its innervation.
THE ORGANIZATION AND CONTRACTION OF SMOOTH MUSCLE CELLS
Smooth muscle cell summary of characteristics:
are smooth – not visibly striated are typically around 20-100 microns long and 2-10 microns in diameter.
have a fusiform shape
have a single, elongate, centrally located nucleus
have involutary contractions
In histological sections, the most striking characteristic of smooth muscle is that it
doesn’t have the banding pattern that is so clear in skeletal and cardiac muscle cells.
This difference reflects the lack of sarcomeric organization in smooth muscle. Although
actin and myosin are still the key myofilaments in smooth muscle contraction, they are
arranged in a very different way than in other muscle types. In smooth muscle actin is
anchored to the membrane of the cell and to dense bodies within the cell. The dense
bodies are made in part of -actinin that bind to both actin thin filaments and
intermediate filaments. Smooth muscle fibers contain an extensive array of
intermediate filaments that form the cytoskeletal structure. The dense bodies and
intermediate filaments act to transmit force through the cell. Remember back to the role
of -actinin in the z disk of the sarcomere, it serves a similar role anchoring actin here.
Relative to the numbers of actin filaments in the cell, there are many fewer myosin thick
filaments in smooth muscle (15 actin: 1 myosin vs. 6:1). Myosin in smooth muscle does
not assemble into the bipolar organization of the thick filament of striated muscle
(relative to the medial M-line). The organization of myosins into a filament is more
variable and less understood than in striated muscle. However, individual myosin
molecules do have a similar organization of heavy chains and light chains, albeit with
smooth muscle specific protein isoforms. Unlike skeletal muscle, formation of cross
bridges requires the phosphorylation of one of the myosin light chains.
The other two main filament systems of the sarcomere – titin and nebulin are not present
in smooth muscle.
There are other proteins that play roles in smooth muscle contraction. While there is no
troponin, tropomyosin is still important on the actin filament. Although its role is still under
investigation, tropomyosin is believed to block the actin-binding site for myosin and
stabilize actin filaments as in striated muscle. Other protein, particularly calmodulin

7/26/2019 Physio Coursepack 2016
http://slidepdf.com/reader/full/physio-coursepack-2016 80/282
16
and caldesmon, are important to the position of tropomyosin. In the inactive state,
caldesmon is associated with actin and tropomyosin and believed to prevent
tropomyosin from shifting off of the myosin-binding site. When calcium ions enter the
cytosol of the cell, they bind to calmodulin (4:1). The calcium-calmodulin complex
interacts with caldesmon and is thought to cause it to loose its association with the actin
complex freeing tropomyosin to shift on the actin filament and allowing myosin to bind
and cross-bridge cycles to occur. When calcium levels decrease and calcium dissociates
from calmodulin, caldesmon returns to actin and myosin binding is blocked.
The calcium-calmodulin complex is also important for activating the myosin molecule,
allowing phosphorylation of the myosin light chain via activity of myosin light chain
kinase and, as a result, ATPase activity on the myosin heads.
Caldesmon may have an additional role in inactive muscle. It can bind to both actin and
myosin and may stabilize the relative positions of the filaments at rest by ‘latching’ them
in place.
While, as in other
muscles, contraction
relies on increases
in concentration of
intracellular calcium,
the elaborate
structure of t-tubules
and SR in striated
muscle is not
present in smooth
muscle. Like cardiacmuscle, voltage
gated calcium
channels in the
sarcolemma and
ryanodine receptors
are important for
calcium release
through calcium-
induced calcium release. As in cardiac muscle, sarcolemma calcium channels allow a
small increase in calcium inside the cell. This calcium causes the ryanodine receptor on

7/26/2019 Physio Coursepack 2016
http://slidepdf.com/reader/full/physio-coursepack-2016 81/282
17
the SR to release large amounts of calcium that activate contraction. Although the overall
mechanism is similar, the coupling between calcium release by calcium channels in the
sarcolemma and by ryanodine receptors on the SR is much more loosely coupled than in
cardiac muscle.
Smooth muscle cells are able to work effectively over a much larger range of lengths than
skeletal muscle and cardiac muscle allowing the muscle greater range of lengthening andshortening. This gives muscles organized around tubes or bladders, the ability to
accommodate considerable volume change and still be able to function.
Reticular fibers outside of the smooth muscle cells form a robust network, supporting
and connect smooth muscle cells to one another. During contraction, these fusiform cells
may take on a corkscrew shape that is also reflected in the deformation of its elongate
nucleus. When contraction ends reticular fibers and the cytoskeleton act to return the
muscle cells to their original shape.
ORGANIZATION OF SMOOTH MUSCLE CELLS INTO SMOOTH MUSCLE TISSUE.
Skeletal muscle often is organized into agonist-antagonist pairs. A simple example is the
biceps and the triceps muscles in our arms. The two muscles have complementary
functions, the biceps flexes our arms at the elbow and the triceps extend the arm
returning it to a straighter position. Smooth muscle is also frequently organized into
antagonistic muscles but those muscles are organized into layers rather than having
complementary insertions onto a skeletal element.
In the gut tube, generally smooth muscle occurs in pairs of layers, an inner circular layer of
muscle and an outer longitudinal layer. These two layers are coordinated, the circular
layer constricts and lengthens the tube while the longitudinal layer expands and shortens it.
Acting in concert with longitudinal waves of activation, they generate peristalsis and movement
of gut contents along its length. In the stomach, where considerable mixing occurs, a thirdoblique layer is added. The uterine tubes similarly have an inner circular layer and outer
longitudinal smooth muscle layer. The vas deferens has three layers; two longitudinal layers
separated by a middle circular layer.
Another important location of smooth muscle is in the eye. In the iris, antagonistic circular
and longitudinal muscles are finely coordinated to control aperture size.
Contraction of radially arranged dilator pupillae pulls the iris open and increases the aperture
size while contraction of sphincter pupillae muscles act like a purse string constricting the iris
and decreasing the size of the aperture

7/26/2019 Physio Coursepack 2016
http://slidepdf.com/reader/full/physio-coursepack-2016 82/282
18
.
SMOOTH MUSCLE ACTIVATION
Smooth muscle activation varies considerably with the function of the tissue.
Multiunit smooth muscle is smooth muscle in which muscle cells are organized into
motor units, like skeletal muscle. However, unlike skeletal muscle, smooth muscles cells
may be innervated by more than one motor neuron. Multiunit smooth muscle is used
when fine motor control is needed, as in the iris of the eye.
When fine control is not needed, as in visceral smooth muscle, there is less direct
innervation and some cells are not connected to nerves at all. Instead, these muscles
rely heavily on gap junctions to spread activation from a few nerves in a wave across the
tissue. Adjacent muscle layers (i.e. circular and longitudinal) do not connect via gap junctions as happens in cardiac muscle so that each layer is independently controlled.
Some smooth muscle contraction can also occur in the absence of any innervation.
Hormones, oxygen levels, and other chemical cues can cause contraction of smooth
muscle. Smooth muscle can also be excited to contract mechanically through stretching
of the cells as a result of activation of stretch dependent ion channels in the
sarcolemma.
Some smooth muscle tissue also has intrinsic rhythmicity to its excitation. The cells,
located between muscle layers, are called pacesetter cells or interstitial cells of Cajal.
They generate sub-threshold waves of excitation that pass through the muscle and
transmit excitation from nerves. They are believed to be specialized smooth muscle cells
but this is still under investigation.

7/26/2019 Physio Coursepack 2016
http://slidepdf.com/reader/full/physio-coursepack-2016 83/282
L e c t u r e N o t e s
Module 2
Cardiovascular PhysiologyBeiser, Poston, & Sattar

7/26/2019 Physio Coursepack 2016
http://slidepdf.com/reader/full/physio-coursepack-2016 84/282
THE UNIVERSITY OF CHICAGODIVISION OF BIOLOGICAL SCIENCES AND PRITZKER SCHOOL OF MEDICINE
TO: Students of Cell & Organ Physiology
FROM: David Beiser, MDJason Poston MD
Husain Sattar, MD
RE: Cardiovascular Physiology Module
Welcome to cardiovascular physiology! We hope you will enjoy learning about the circulation as
much as we will enjoy teaching you about it.
Please note that the lectures will in general follow the handouts closely. We encourage you totry and read the handouts in advance of the lectures in order that you may focus onunderstanding the concepts that are emphasized during the lectures. We have included a
reference sheet listing the equations and normal ranges for a number of circulatory parameters.
We believe that most of you will benefit from some supplemental reading from one of thesuggested physiology textbooks but will not expect you to know anything not covered in the
handouts or in the lectures. The handouts include figures from a number of sources, includingthe physiology textbooks by Levy & Pappano and by Boron & Boulpaep.
Compared with some other subjects you are studying, there are relatively few facts to learn. The
chief difficulty in cardiovascular physiology lies in being able to integrate the material. We will tryseveral approaches to help you do this, including provocative questions throughout the lecturenotes, problem sets and vignettes posted on Chalk, a healthy dose of clinical correlation, review
sessions with your teaching assistants, and laboratory sessions. The first of these lab sessions,
the Cardiovascular Physiology Laboratory, will provide you with an opportunity to exploreimportant physiological principles using the simulation program SimBiosys. This session will
formally cover the integrative response to Hemorrhagic Shock and Cardiac Tamponade. Thesecond laboratory session (Applied Physiology: Case Series) will provide you with additional
opportunities to work through physiology problems. Finally, we will several review sessionsincluding one during the regularly scheduled lecture time the day before the exam.
Again, welcome to cardiovascular physiology!
Sincerely,
David Beiser, MD Jason Poston, MD Husain Sattar, MD

7/26/2019 Physio Coursepack 2016
http://slidepdf.com/reader/full/physio-coursepack-2016 85/282
Beiser/Poston CV Overview & Cardiac Pump Cell & Organ Physiology: Cardiovascular
OVERVIEW OF THE CARDIOVASCULAR SYSTEM
&THE CARDIAC PUMP
Recommended reading
Levy & Pappano:
! Chapter 1: Overview of the circulation, blood, and hemostasis, pp. 1-4.! Chapter 4: The cardiac pump, especially pp. 64-79.
KEY CONCEPTS
! The main elements of the cardiovascular system include the cardiac pump, an array of
distributing (arteries) and collecting (veins) tubes, and a vast network of small vessels(capillaries).
! Increased myocardial fiber length, as occurs with an increase in ventricular filling duringdiastole (preload), results in an increase in the force of ventricular contraction. The heart
gets its preload from the systemic vessels (e.g. the systemic vessels play a critical role inthe control of the cardiac output—more on this later).
! Contractility is the performance of the heart at a given preload and afterload, and is chiefly
determined by intracellular Ca++.! Afterload, or the “load” against which the ventricle contracts, is chiefly regulated by changes
in the amount of peripheral resistance present in the arterioles.
! The cardiac cycle is the temporal sequence of pressure, volume, and flow events during onecontraction-relaxation cycle. It looks pretty complicated. But you just have to think your way
through it a few times. Really.
INTRODUCTION ( A brief overview of the cardiovascular system)The cardiovascular system delivers the essential ingredients for cellular metabolism—nutrients
absorbed from the gut and oxygen taken up by the lungs— to the tissues and eliminates their
metabolic waste products. The circulation is also involved in a number of homeostaticprocesses including regulation of the arterial blood pressure, the transport of hormones and
other circulating substances to their target sites, regulation of body temperature, and the variedadjustments required to respond to altered physiologic states such as exercise and
hemorrhage.
The main elements of the cardiovascular system include the cardiac pump, an array ofdistributing (arteries) and collecting (veins) tubes, and a vast network of small vessels(capillaries) that permit the rapid exchange of substances between the blood and tissues (see
Figure 1-2 below). The heart receives dark (deoxygenated) venous blood returning to the right
atrium and ventricle and pumps it through the lungs via the pulmonary circulation, whereoxygen is added to the blood and carbon dioxide is eliminated. The left atrium and left ventriclereceive this red (oxygenated) blood via the pulmonary veins and pump the blood to the tissues
of the body via the systemic circulation. During ventricular contraction (systole), more blood
is ejected into the aorta than runs off through the peripheral resistance located in the moredistal small arteries and arterioles, causing the walls of the aorta and its branches to be
distended outward. The recoil of these walls inward during ventricular relaxation (diastole)propels blood through the peripheral circulation, thereby dampening the pulsatile flow createdby the heart and providing continuous blood flow at the capillary level. Arteriolar smooth muscle
tone can be adjusted through a variety of neurohormonal and metabolic mechanisms to regulate
the arterial blood pressure and to distribute blood flow to different organs according to theirmetabolic needs. As a result, the arterioles have been called the “stopcocks” of the circulation.

7/26/2019 Physio Coursepack 2016
http://slidepdf.com/reader/full/physio-coursepack-2016 86/282
Beiser/Poston Cell & Organ Physiology: Cardiovascular
2
Because the total number of capillaries is enormous, the cross-sectional area of the capillarybed is very large, despite the small size of each vessel. The velocity of blood becomes quite
slow as a result, permitting effective exchange of substances across the vessel wall. Blooddrains from the capillaries sequentially into venules, small veins, large veins, the vena cava, and
the right atrium, accelerating as the total cross sectional area decreases (see Figure 1-3 below).
Approximately 2/3 of the total blood volume resides in the veins. A critically important point is
that while the cardiac pump provides the energy required for blood flow through the circulation,the cardiac output is controlled in normal individuals chiefly through the control of tone in the
veins, which controls the amount of blood returning to the right heart and therefore its preload (vide infra). If you can appreciate this principle by the end of this course you will know
something important about the cardiovascular system that many practicing physicians do not. This ventricular-vascular coupling will be explored in a future lecture, while other lectures willconsider other “extracardiac” facets of the cardiovascular system related to hemodynamics, the
autonomic nervous system, and various aspects of the arterial system, peripheral circulation,
Figure 1-4. Schematic diagram of the parallel
and series arrangement of the vesselscomposing the circulatory system. The capillarybeds are represented by thin lines connectingthe arteries (on the right) with the veins (on theleft). The crescent-shaped thickenings proximalto the capillary beds represent the arterioles(resistance vessels). (Redrawn from Green HD:In Glasser O, editor: Medical physics, vol 1,
Chicago, 1944, Mosby-Year Book.)
Figure 1-3. Phasic pressure, velocity of flow,and cross-sectional area of the systemic
circulation. The important features are theinverse relationship between velocity and cross-sectional area, the major pressure drop acrossthe small arteries and arterioles, and themaximal cross-sectional area and minimal flowrate in the capillaries. AO, Aorta; LA, largearteries; SA, small arteries; ART, arterioles;CAP, capillaries; VEN, venules; SV, small veins;
LV, large veins; VC, venae cavae.

7/26/2019 Physio Coursepack 2016
http://slidepdf.com/reader/full/physio-coursepack-2016 87/282
Beiser/Poston Cell & Organ Physiology: Cardiovascular
3
and microcirculation. The heart is important—who would deny it?—but it is worth remembering
that the name of this course is Cardiovascular Physiology, not cardiac physiology.
With this is mind, we’ll begin with the heart. The remainder of this lecture will deal with thecardiac pump.
THE CARDIAC PUMP
Force of cardiac contraction; also preload, contractility, and afterloadYou will recall from Dr. Hale’s lectures that the force of cardiac contraction depends upon the
resting length of the myocardial fibers, with an increase in initial sarcomere length resulting in an
increase in the force of contraction. The longer the myocyte, the greater the overlap of thick andthin filaments and the greater the number of crossbridge attachments. In addition, the sensitivity
of the contractile apparatus to calcium increases when the muscle is stretched.
You will also recall that excitation-contraction coupling is mediated by calcium. Calcium entersthe cell during excitation and stimulates the release of calcium from the sarcoplasmic reticulum
(calcium dependent calcium release). Calcium binds to troponin C, and the Ca++-troponin
complex interacts with tropomyosin to permit myosin and actin crossbridge cycling. A reductionin extracellular calcium results in decreased contractile force.
Experimental evidence supports the extrapolation of the above concept to the intact heart, withan increase in myocardial stretch (reflected as an increase in ventricular end-diastolic volume)
resulting in an increase in the force of ventricular contraction (measured as ventricularpressure). This is the Frank-Starling relationship. Imagine an experimental situation in which
the aortic valve is kept closed by a very high pressure afterload (vide infra) in the aorta. In thiscircumstance, ventricular systole is isometric: there is no ejection of blood and no change in
ventricular volume during systole. The maximal isometric pressure generated by the ventricle
during systole at each degree of filling can then be plotted. Figure 4-4 below illustrates thisconcept.
The figure below further illustrates this relationship, while ignoring the decrease in developed
force that occurs when myocardial fibers are stretched beyond their optimal length (thedownward sloping rightward portion of the systolic curve above). Notice that ventricular pressure
rises along the line ABC (the end-systolic pressure-volume curve) as initial ventricular volume
Figure 4-4. Relationship of myocardial resting fiber length(sarcomere length) or end-diastolic volume to developedforce or peak systolic ventricular pressure during ventricularcontraction in the intact dog heart. (Redrawn from PattersonSW, Piper H, Starling EH: J Physiol 48:465, 1914.)

7/26/2019 Physio Coursepack 2016
http://slidepdf.com/reader/full/physio-coursepack-2016 88/282
Beiser/Poston Cell & Organ Physiology: Cardiovascular
4
increases along the curvilinear line 123. This lower line is the left ventricular diastolic pressure-
volume curve.
V e n t r i c u l a r P r e s
s u r e
Ventricular Volume (ml)
1 2
3
A
B
C
Notice that left ventricular diastolic pressure does not exceed zero until a certain volume has
been added (approximately 50 ml). This is the unstressed volume. Subsequently, diastolicpressure rises in a curvilinear fashion as further increments of volume are added (the stressed
volume). The point on this diastolic pressure-volume curve to which the ventricle fills before itcontracts is called the preload, defined as the left ventricular end-diastolic volume (LVEDV).Clinically, the LVEDV is sometimes estimated from the left ventricular end-diastolic pressure
(LVEDP). This may be done at the time of cardiac catheterization by measuring the pressure
within the left ventricle. The preload to the heart depends to a great degree on the amount ofvenomotor tone that is present. This venomotor tone controls the amount of blood returning tothe heart, a concept which will be considered in more detail in a subsequent lecture.
The pericardium surrounds the heart loosely up to a given ventricular volume, but at greaterLVEDV it becomes stiff, limiting ventricular filling and imparting the pressure-volume relationship
seen on the rightward end of the curve above. This phenomenon is referred to as pericardialconstraint.
Clinical correlation: Certain conditions cause excess fluid to accumulate in the pericardial sac.
This pericardial effusion reduces the ventricular volume at which the pericardium becomes a
limiting membrane. In severe cases, cardiac filling is so impaired as to cause shock or evendeath. This condition is called cardiac tamponade. Therapy involves drainage of the fluidcollection.
Bonus: Why is it illegal to perform pericardiectomies on greyhounds in the state of Florida?
Certain diseases may impair cardiac contractility, or the performance of the heart at a given
preload and afterload. For instance, a patient with myocardial ischemia due to an acute
coronary artery thrombosis may exhibit a significant reduction in myocardial contractility. Thecardiac function curve in such a patient would be shifted downward and to the right, as in thepanel on the left below (dashed line). Substances such as epinephrine or digitalis enhance
contractility and shift the end systolic volume-pressure curve upward and to the left (dotted line).Certain conditions may impair diastolic filling of the ventricle, reflected by a shift in the diastolic
volume-pressure relationship upward and to the left, as shown in the panel on the right below
(dashed line). For instance, myocardial ischemia impairs diastolic relaxation, while longstandinghypertension causes the left ventricle to grow abnormally thick and stiff (left ventricular

7/26/2019 Physio Coursepack 2016
http://slidepdf.com/reader/full/physio-coursepack-2016 89/282
Beiser/Poston Cell & Organ Physiology: Cardiovascular
5
hypertrophy). Both diseases impair diastolic filling, and in both conditions, an increase in filling
pressure is required to maintain an adequate LVEDV.
V e n t r i c u l a r P r e s s
u r e
Ventricular Volume (ml)
1 2
3 V e n t r i c u l a r P r e s s
u r e
Ventricular Volume (ml)
A
B
C
Afterload is the “load” against which the heart must contract to eject blood. In plotting the
systolic volume-pressure curves above we have considered an artificial situation in which theafterload is sufficiently high as to prevent ventricular ejection of blood. This experiment allowed
us to determine the maximum ventricular pressure that could be generated for a given preloadand contractility. In reality, left ventricular afterload varies according to the peripheral resistance,which is chiefly regulated through the modulation of smooth muscle tone in the arterioles.
Stroke volume is the amount of blood ejected from the ventricle per beat, while ejectionfraction is the ratio of stroke volume to end-diastolic volume. A reduced ejection fraction—which can be calculated noninvasively with the use of echocardiography (ultrasound of the
heart utilizing Doppler flow)—is a sign of impaired cardiac contractility. THE THREE MAIN
DETERMINANTS OF STROKE VOLUME ARE PRELOAD, AFTERLOAD, ANDCONTRACTILITY! Anything that increases preload and contractility will increase stroke volume
for a given afterload. Similarly, anything that increases afterload will reduce stroke volume,given the same preload and contractility.
The cardiac cycle
The cardiac cycle consists of the sequential contraction and relaxation of the atria andventricles. The temporal sequence of pressure, volume and flow events is actually fairlyintuitive, but requires close study of the commonly shown figure below. Each panel in the figure
is correlated in time with the other panels and with the electrocardiogram at the bottom. The
cardiac cycle is divided into seven different phases. Sounds pretty complicated, right? IF YOUTRY TO LEARN THIS CYCLE AS IF YOU ARE MEMORIZING SOMEONE’S CALENDAR YOU
WILL GET INTO TROUBLE! Instead, concentrate on trying to understand what is going on thatleads to these tracings.
In general, the following sequence focuses on the left side of the heart.
Atrial systole begins shortly after the electrical activation of the atrium, indicated by the P waveon the electrocardiogram. Atrial contraction propels blood through the low-resistance mitral and
tricuspid valves into the left and right ventricles, respectively, which have already been passively
filled during ventricular diastole. This event is inscribed as an a wave on the left atrial andvenous pressure tracings and as a small increase in the ventricular pressure tracing. The atrial
“booster” or “kick” contributes relatively little (approximately 10%) to left LVEDV under normalconditions, and many patients with complete atrioventricular block or atrial fibrillation have few
symptoms at rest. However, the atrial kick becomes more important at fast heart rates (e.g.

7/26/2019 Physio Coursepack 2016
http://slidepdf.com/reader/full/physio-coursepack-2016 90/282
Beiser/Poston Cell & Organ Physiology: Cardiovascular
6
during exercise), when ventricular diastole is shortened, or when the ventricle is stiff or hard to
fill, as when left ventricular hypertrophy is present.
The onset of ventricular contraction is signaled by the peak
of the R wave on the electrocardiogram. The ventriclescontract to raise ventricular pressure and close the
atrioventricular valves (mitral valve and tricuspid valve). This
first phase of ventricular systole, between the closing of theatrioventricular valves and the opening of the semilunar(aortic and pulmonary) valves is called isovolumic
contraction because ventricular volume is constant. Thispressure increase is transmitted across the closed valves
and inscribed as a c wave on the left atrial and venouspressure tracings.
Eventually, left and right ventricular pressures rise above
that of the aorta and pulmonary artery, respectively, and the
semilunar valves open. The left ventricle continues tocontract forcefully, leading to an increase in both LV and
aortic pressure to a peak systolic pressure. The early, shortphase of ventricular ejection is called rapid e jection and is
characterized by a rapid increase in aortic blood flow and arapid decrease in LV volume. Note that left atrial pressure
falls during this phase; this is due to atrial stretch from rapiddescent of the base of the heart. The pressure generated by the LV begins to fall as ventricularvolume decreases. Blood flow from the aorta to the periphery exceeds blood flow from the LV
into the aorta during this phase, causing the pressure in the aorta to decline. During this
reduced ejection the pressure in the aorta actually exceeds the pressure in the ventricle due tothe storage of potential energy in the distended aorta. Flow continue from the LV into the aorta,however, because of momentum (think of shooting a bullet or a missile from a low pressure
weather system into a high pressure system—would the bullet suddenly stop?), although aortic
blood flow decreases rapidly as a result of this reversal in pressure gradient. Left atrial andvenous pressures rise throughout this period as blood continues to flow into the atria, inscribing
a v wave.
Once LV pressure falls below aortic pressure, the aortic valve closes, inscribing a “notch” or
incisura on the aortic pressure tracing because of a reflected pressure wave. This marks the
end of ventricular systole and the beginning of ventricular diastole. The first phase of ventriculardiastole is isovolumic relaxation, during which ventricular pressure falls rapidly whileventricular volume remains constant. Left atrial and venous pressures continue to rise
Figure 4-11. Left atrial, aortic, and leftventricular pressure pulses correlated intime with aortic flow, ventricular volume,heart sounds, venous pulse, and theelectrocardiogram for a complete cardiacc cle in the do .

7/26/2019 Physio Coursepack 2016
http://slidepdf.com/reader/full/physio-coursepack-2016 91/282
Beiser/Poston Cell & Organ Physiology: Cardiovascular
7
throughout this period until they exceed the rapidly falling ventricular pressures, and the mitral
valve opens. Rapid ventricular filling occurs as blood flows from the left atrium to the LV,aided by suction created by the still relaxing left ventricle. The next phase of ventricular filling,
diastasis, is marked by a gradual increase in left atrial, left ventricular, and venous pressuresas blood continues to return to the heart from the pulmonary circuit and from the systemic veins.
Blood flow continues from the aorta to the periphery throughout ventricular diastole, falling to anadir just prior to ventricular ejection (vide supra).
Events are similar on the right side of the heart, but occur at lower pressures because of the
lower resistance of the pulmonary circulation. Similarly, tricuspid valve closure occurs after
mitral valve closure, and pulmonic valve closure occurs after aortic valve closure.
Relating the cardiac cycle to the clinical examinationFour sounds are typically produced by the heart: S1, S2, S3, and S4. Typically only two—S1
and S2—are audible with a stethoscope. S1 and S2 are caused by oscillation of blood andvibration of the chamber walls caused by abrupt closure of the atrioventricular valves and
semilunar valves, respectively. S2 is somewhat higher in pitch than S1.
S1 = lubS2 = dub
S3, or the third heart sound, is due to rapid filling of the ventricle with sudden termination of
ventricular distension and deceleration of blood. This sound can be heard in children with thinchest walls and in adults with left ventricular failure, the latter case due to stretching of volume-
overloaded ventricles.
S4, or the fourth heart sound, is caused by atrial contraction. It can indicate an abnormally stiff
left ventricle and may be heard in many patients with left ventricular hypertrophy caused byyears of high blood pressure.
Valves that are narrowed or incompetent (leaky) can cause murmurs that may be heard by the
astute clinician. For instance, mitral regurgitation typically produces a holosytolic murmur (e.g. amurmur heard throughout systole) that is best heard at the cardiac apex and radiates to the
axilla. We might have time for me to play an example for you in class.
Inspection of the internal jugular vein can allow estimation of central venous pressure (and
therefore right atrial pressure) and is valuable clinically. This tracing looks very similar to the left
atrial pressure tracing but occurs sooner than the letter with respect to the electrocardiogram.Close inspection of the jugular vein may reveal discrete a, c, and v waves.
Clinical correlation: The diagnosis of congestive heart failure can frequently be made at the
bedside. For instance, the physical examination findings of an S3, an elevated jugular venouspressure, and peripheral edema support the diagnosis of congestive heart failure.
There are a number of excellent websites that have examples of murmurs. Remember thiswhen you do physical diagnosis next year. For instance, Cardiologysite.com
(http://www.cardiologysite.com/index.html) has numerous examples of murmurs linked to the
electrocardiogram and pressure tracings.

7/26/2019 Physio Coursepack 2016
http://slidepdf.com/reader/full/physio-coursepack-2016 92/282
Beiser/Poston Cell & Organ Physiology: Cardiovascular
8
Pressure-volume curve
The pressure-volume curve for the left ventricle for a single cardiac cycle is shown below.
Below are pressure-volume loops depicting alterations in the 3 determinants of stroke volume:contractility, preload, and afterload. I will show a real-time example of a pressure-volume loop in
class using the SimBiosys program. This program will be used during the laboratory sessions.
Pressure-volume loop ofthe left ventricle for a single
cardiac cycle.
Increased contractility (Figure B) allows ejection to a smaller end-systolic volume.
The end-systolic pressure-volume curve is shifted to the left, reflecting increased
contractility (note also the increased systolic pressure). Increased preload (FigureC) increases SV by ejecting from a greater LVEDV to the same LVESV (note again
the increased systolic pressure, in this case due to the Frank-Starling mechanism).

7/26/2019 Physio Coursepack 2016
http://slidepdf.com/reader/full/physio-coursepack-2016 93/282
Beiser/Poston Cell & Organ Physiology: Cardiovascular
9
MEASUREMENT OF CARDIAC OUTPUTThe equation for cardiac output is:
CO = HR x SV
where CO = cardiac output, HR = heart rate, and SV = stroke volume. There are several
methods for measuring cardiac output. One approach is uses a pulmonary artery catheter andis called the indicator dilution technique. The pulmonary artery catheter is a long, slender
catheter with a small balloon near its tip. This catheter is inserted into a large central vein like
the subclavian vein. Inflation of the balloon allows passage of the catheter tip along with thevenous return (like a boat on a stream) through the heart and into a branch of the pulmonary
artery. A small quantity of cold saline at a known temperature is injected into the right atriumthrough the catheter. A small thermistor at the tip of the catheter detects the temperature
change downstream. Blood flow can be calculated from the resulting thermodilution curve:
See Levy & Pappano for furtherdetails if you are interested. For
our purposes, you need only be
aware of this principle.
Increased afterload (Figure D below)
reduces SV through an increase in LVESV.

7/26/2019 Physio Coursepack 2016
http://slidepdf.com/reader/full/physio-coursepack-2016 94/282
David G. Beiser, MD, MS Cardiac electrophysiology I Cell & Organ Physiology: Cardiovascular
- 1 -
Cardiac electrophysiology I: Cardiac Action Potential, Automaticity, & Conduction
Recommended reading
Levy & Pappano 9th Edition:
• Chapter 2: Excitation: The Cardiac Action Potential • Chapter 3: Automaticity: Natural Excitation of the Heart (pp. 33 – 45)
Objectives
• Review cardiac E-C coupling, with close attention to calcium handling.
• Describe the specific ionic currents underlying the cardiac action potential (slow & fast). • Understand key differences between cardiac and skeletal muscle action potentials (APs).
• Understand absolute and relative refractory period designations.
• Describe the ionic basis of automaticity and the role of automaticity in normal physiology,
sinoatrial (SA) node dysfunction (sinus arrest) and AV block. • Become familiar with the mechanisms of cardiac automaticity modulation.
EXCITATION: THE CARDIAC ACTION POTENTIAL
Cardiac muscle cell contraction occurs through a stereotypical sequence known asexcitation-contraction (E-C) coupling. As with striated and smooth muscle, E-C coupling
begins with depolarization of the sarcolemmal membrane by an action potential.
Excitation-Contraction (E-C) Coupling (REVIEW). The concept of E-C coupling wasintroduced to you during lectures covering skeletal and cardiac muscle physiology. Toreview, E-C coupling involves the following events:
1. Action potential (AP) depolarization of the sarcolemmal and T-tubule system.
2. Membrane depolarization triggers the influx of Ca2+ via L-type Ca2+ channels.
o (NOTE: Unlike skeletal muscle, cardiac E-C coupling requires extracellular Ca2+) 3. Ryanodine receptor 2 (RyR2, cardiac type) channels in the sarcoplasmic reticulum (SR)
are activated by the initial rise of intercellular [Ca2+ ]i , thus amplifying the Ca2+ signal by thefurther release of Ca2+ from SR
stores – so called calcium-
induced calcium release
(CICR).4. Intracellular Ca2+ associates
with troponin C in the
sarcomere and stimulates
contraction (cardiac systole). 5. Release of Ca2+ from the
sarcomere causes relaxation(cardiac diastole) and its
reuptake into the SRcompartment by SERCA.
6. Remaining excess intracellularCa2+ (an incredible 28%) is
transported to the extracellular
space via Na/Ca exchange.

7/26/2019 Physio Coursepack 2016
http://slidepdf.com/reader/full/physio-coursepack-2016 95/282
David G. Beiser, MD, MS Cardiac electrophysiology I Cell & Organ Physiology: Cardiovascular
- 2 -
The 5-Phases of the Fast-Response Cardiac Action Potential
Atrial and ventricular muscle, along with the His-Purkinje conduction system, exhibit a fast-response cardiac action (AP) potential which has 5 distinct phases. As with skeletal muscle,
the cardiac action potential begins with a rapid membrane depolarization (Phase 0) via
inward Na+ currents (INa) conducted through voltage-gated Na+ channels. Following thisupstroke, there is a brief period of partial repolarization (Phase 1) mediated by outward K+
currents, followed by a plateau period (Phase 2) of sustained depolarization dominated byinward Ca2+ currents (ICa) conducted through L-type (long-lasting) Ca2+ channels. The
membrane potential is then rapidly repolarized (Phase 3) by an outward K+ current (IK) viadelayed-rectified K+ channels until the resting membrane potential is achieved (Phase 4).Excess intracellular Na+ is exchanged for extracellular K+ via Na/K ATPase exchangers.
Similarly, excess intracellular Ca2+ is eliminated an ATP-driven Ca + pump.
• Phase 0 – Depolarization (Upstroke): In thefast response a rapid upstroke is primarilyproduced by an inward INa conducted throughvoltage-gated Na+ channels. Similar to
skeletal muscle, voltage-dependent Na+
channels are activated (1-2 ms) as themembrane potential (Vm) suddenly
depolarizes across the cardiac cell’s thresholdpotential (about -65 mV). At this point Na+,
driven by a large concentration gradient andelectrostatic forces, rushes into the cell,
producing an inward INa current. As the Vm
crosses 0 mV, electrostatic forces areneutralized (actually they reverse direction);
however, the inward INa current persists briefly
(due to a continued Na+ concentrationgradient) producing an overshoot in
membrane potential. Immediately afteractivation, Na+ channels become inactivated
(recall the Hodgkin & Huxley model fromskeletal muscle) which lasts approximately
100 to 200 ms.

7/26/2019 Physio Coursepack 2016
http://slidepdf.com/reader/full/physio-coursepack-2016 96/282
David G. Beiser, MD, MS Cardiac electrophysiology I Cell & Organ Physiology: Cardiovascular
- 3 -
• Phase 1 – Early Partial Repolarization: Atrial, His-Purkinje, and ventricular cellsdisplay a notch (partial rapid repolarization) after the depolarization upstroke peak. Thisearly outward current is mediated primarily by voltage-dependent K+ channels (Kv4.3),
which rapidly inactivate.
• Phase 2 – Plateau: Following Phase 1, the membrane potentials of all excitable cardiac
cells (except the SA node cells) plateau around 0mV for a period of 200-400 msec. Thisplateau is maintained by a delicate balance between inward and outward currents.
o Inward Plateau Currents: By far, the dominant Ca2+ channels, which are inwardcurrent during Phase 2 is that of the long-lasting (L-type) initially triggered during
Phase 0 as Vm reaches a threshold potential of -20 mV. However, L-type Ca2+ channels have a slow response and don’t begin to open until the latter part of Phase
0. The inward INa currents (of Phase 0) make a minor/brief contribution to the inward
plateau, though they (as discussed above) rapidly inactivate.
o Outward Plateau Currents: Outward currents play a minor role during the plateauperiod. Despite large concentration gradients and electrostatic forces, only small
outward IK currents are produced initially. However as the plateau period
progresses, “one-way” delayed-rectified K+ channels gradually open, producinggradual repolarization. NOTE: The K + channels open during the resting Phase 4
(see below) are “inwardly-rectifying” and thus do not contribute to repolarization
during this period.
• Phase 3 – Repolarization: Delayed rectifier K+ channels (e.g. HERG, KvLQT1,KCNQ1) which began opening during the plateau, come on-line in full force during Phase3. As these outward currents overtake the declining inward Ca2+ currents, rapid
depolarization occurs.
• Phase 4 – Resting (time between action potentials): In the fast-response tissue of theatrial and ventricular muscle; and the cells of the His-Purkinje conduction system,resting membrane potential is determined primarily by the high conductance of inwardly
rectifying K+ channels (e.g. IK1), which close during depolarization and only re-open
during late repolarization, thus driving Vm towards the reversal potential of K+ (-94mV). A small inward Na+
current is also present which slightly depolarizes Vm to a resting
potential of -90 mV.
Clinical CorrelationThe activity of L-type Ca2+ channels can be inhibited by calcium channel antagonists
such as verapamil, nifedipine, and diltiazem. L-type Ca2+ can also be potentiated bythe !-adrenergic signaling of catecholamines, thus increasing contractility (the detailsof autonomic control will be discussed in a later lecture).

7/26/2019 Physio Coursepack 2016
http://slidepdf.com/reader/full/physio-coursepack-2016 97/282
David G. Beiser, MD, MS Cardiac electrophysiology I Cell & Organ Physiology: Cardiovascular
- 4 -
Cardiac AP of Slow-Response Tissue: The ionic basis of automaticity
The AP of pacemaker cells in theatrioventricular (AV) and sinoatrial (SA) nodes
is characterized by a slow-upstroke (Phase 0)and a spontaneously-depolarizing (up-sloping)Phase 4. Also, in the slow response AP, Phase
1 (partial repolarization) is absent. Phase 2(plateau) is brief and not flat and is blended with
Phase 3 (repolarization). For slow-response
tissue, focus on the following phases:
• Phase 0: Pacemaker cells have few, if any,Na+ channels and thus do not rapidly
depolarize. Instead, they depolarize in amuch slower fashion via inward ICa
mediated by voltage-dependent (long-
lasting, L-type) Ca2+ channels. Accordingly,the Phase 0 depolarization is much less steep and smaller magnitude.
• Phase 3: Tends to be less steep than in fast-response fibers.
• Phase 4: Pacemaker cells exhibit an unsteady resting potential which gradually
depolarizes – eventually reaching the threshold for L-type Ca2+ depolarization. Severalionic currents are thought to contribute to the slow depolarization including:
o Inward Na+ current known as I f (for “funny”), conducted through HCN1 channel, isthought to be primarily responsible for this gradual depolarization. It is induced by
hyperpolarization at the end of Phase 3.
o L-type Ca2 + are triggered towards the end of Phase 4 and thus begin to contributeto this slow depolarization.
o K+ outward currents (which oppose depolarization) diminish towards the end of
Phase 4, and thus also contribute to gradual depolarization.
Clinical CorrelationLike skeletal muscle, activation of Na
+ channels in the heart can be blocked by puffer fish toxin
tetrodotoxin TTX . Blockin Na+ can convert the u stroke in fast-res onse cells to a “slow
3 KEY differences between the cardiac and skeletal muscle action potentials
• Plateau Potentials – Cardiac action potential (AP) has long duration (~ 300 ms) ascompared to the skeletal muscle AP (~ 5 ms). This is due to the plateau potential, which isprimarily mediated by L-type calcium channels. The long duration precludes the fusion of
individual twitch contractions and tetany in the heart.
• Cell-to-Cell Conduction – Cardiac AP is conducted directly from cell-to-cell via gap junctions.
• Automaticity – Specialized cells within the cardiac conduction system have intrinsicpacemaker activity and can thus spontaneously self-generate an AP without an external
trigger (e.g. synaptic motor end-plate of skeletal muscle).

7/26/2019 Physio Coursepack 2016
http://slidepdf.com/reader/full/physio-coursepack-2016 98/282
David G. Beiser, MD, MS Cardiac electrophysiology I Cell & Organ Physiology: Cardiovascular
- 5 -
Absolute Refractory Period (ARP) and Relative Refractory Period (RRP)
• ARP: (aka Effective Refractory Period, ERP ) Following the initial upstroke (Phase 0) of
a cardiac action potential, there is an absolute refractory period during which time the
cell cannot fire another AP. This period represents the time it takes for voltage-
dependent Na+ channels to recover frominactivation and extends midway into Phase 3
where the Vm repolarizes to approximately -50mV. This refractory period precludes
summation of action potentials which couldresult in tetanic contraction of cardiac muscle,
thus allowing the heart muscle to relaxbetween beats (diastole). Before enough Na
channels recover, however, calcium channels
can generate an inward current and this canproduce a slow upstroke event, which cansometimes trigger extra beats.
• RRP: Recovery from inactivation is a stochastic event, with the probability of recovery
increasing as a function of time and degree of repolarization. During this period known
as the relative refractory period, APs can be triggered, but require a stronger than
normal depolarizing stimulus. In addition, APs during the relative refractory period tendto have smaller magnitudes. The channel mechanisms underlying this period are morediverse. It represents a time during which the potassium conductance is larger than it will
eventually be. This increase in K+ permeability, which time dependently diminishes, canbe "overcome" if more inward current is present to counteract the tendency of the K+
channels to keep the potential negative.
AUTOMATICITY: NATURAL EXCITATION OF THE HEARTUnlike skeletal muscle, some cardiac muscle cells exhibit automaticity (the ability to initiate
its own contraction) and rhythmicity (the regular contractions). These properties, whilenormally associated with the sinoatrial (SA) node, are also exhibited (albeit at a lowerfrequency) by the atrioventricular (AV) node and at times by cells of the His-Purkinje system.
This underlying property of cardiac tissue provides an important “back-up” pacemaker
system in disease states where the SA node fails to initiate a sinus beat.
• SA Node: During normal sinus rhythm (60-100 bpm), the cardiac beat originates from
cells in specialized region of the right atrium known as the SA node as well as 1-2 otherneighboring atrial sites which together comprise the atrial pacemaker complex. Cells ofthe SA node normally display the highest frequency of natural excitation. As this sinus
wave of depolarization spreads across the atria, it suppresses automaticity in other cellsin the atria (and ventricles) – thus determining heart rate. This phenomena which allowsthe SA node to be the dominant pacemaker is known as overdrive suppression – thesuppression of automaticity by high-frequency excitation.
• Ectopic Atrial Foci & Atrial Escape Rhythms: Occasionally, other cells within the atriaor specialized cells within the atrial conduction system display automaticity. These latent
pacemakers can serve as an important safety measure, triggering escape beats when
the SA node fails to fire due to disease or suppression by drugs or parasympathetic tone.In the case of persistent impairment of the SA node ectopic atrial foci will produce a

7/26/2019 Physio Coursepack 2016
http://slidepdf.com/reader/full/physio-coursepack-2016 99/282
David G. Beiser, MD, MS Cardiac electrophysiology I Cell & Organ Physiology: Cardiovascular
- 6 -
series of escape beats yielding a protective escape rhythm. Latent pacemaker cells can
also trigger premature atrial depolarizations (ectopic atrial beats) or continuous rhythmdisturbances such as paroxysmal atrial tachycardias (e.g. atrial fibrillation). We will
discuss arrhythmias more in Electrophysiology III .
• AV Node: Pacemaker cells within the atrioventricular (AV) node display naturalexcitation at a rate of around 40 – 60 bpm. In the absence of SA node excitation (e.g.
“sick sinus syndrome”), the AV node may become the dominant pacemaker.
• Purkinje Fibers: When conduction from the atria to the ventricles is blocked at the level
of the AV node (e.g. secondary to ischemia), idioventricular pacemakers within thespecialized Purkinje conduction fibers of the ventricles become the dominant pacemaker
– though at an extremely low rate (30-40 bpm) that generally does not result in adequate
cardiac output. Low cardiac output states such as complete block of the AV node aretrue emergencies that can quickly deteriorate into cardiac arrest.
Modulation of Pacemaker Rate: The firing rate of pacemaker cells can be modulated by avariety of synaptic, circulating factors, and pathophysiological conditions such as acidosis
and ischemia. (The autonomic modulation of cardiac activity will be covered in detail in a
later lecture. Here we introduce you to a few of the concepts).
• Autonomic synaptic efferents and circulating catecholamines: Unlike skeletal
muscle, the triggering of pacemaker cells in the SA node does not require synaptic input;however, synaptic inputs from the autonomic nervous system (sympathetic andparasympathetic), provide short-term modulation of intrinsic pacemaker rates through
ligand-gated channels. Catecholamines (norepinephrine released from sympathetic
nerve endings or circulating epinephrine from the adrenal medulla) increase pacemaker
rates by decreasing conductance of HCN1 (K+) channels through cAMP-mediated 2nd messenger signaling cascades. Catecholamines also increase slow inward Ca2+ and If
“funny” Na+ currents. These changes increase the slope of Phase 4 such that the
pacemaker cell Vm more rapidly reaches the threshold for action potential generation. Conversely, pacemaker firing rate is slowed by acetylcholine released from the vagal
nerves.
• Hormones: Pacemaker activity is also altered by hormones. For example, excesscirculating thyroid hormone (T3) in hyperthyroidism induces tachycardia while
hypothyroidism can produce bradycardia.
• Serum ion concentrations: Changes in the serum concentration of ions, particularly
potassium, can cause changes in SA nodal firing rate. Hyperkalemia induces
bradycardia or can even stop SA nodal firing. Hypokalemia increases the rate of phase 4depolarization and causes tachycardia.
Clinical CorrelationFor those gunning for a cardiology electrophysiology (EP) fellowship, note that cellsin and around the pulmonary veins are often the source of ectopic beats leading to
common atrial arrhythmias such as atrial fibrillation. EPs utilize intravascular
catheters to map the location of these aberrant cells and isolate them from the restof the atrium through precision electrocautery to form insulating scar tissue barriers.

7/26/2019 Physio Coursepack 2016
http://slidepdf.com/reader/full/physio-coursepack-2016 100/282
David G. Beiser, MD, MS Cardiac electrophysiology I Cell & Organ Physiology: Cardiovascular
- 7 -
• Cellular hypoxia: Hypoxia (usually due to ischemia) depolarizes the membranepotential causing bradycardia; severe hypoxia completely stops pacemaker activity –
inducing sinus arrest.
• Drugs: Various drugs used as antiarrhythmics also affect SA nodal rhythm. Calcium-channel blockers, for example, cause bradycardia by inhibiting the slow inward Ca++currents during phase 4 and phase 0. Drugs affecting autonomic control or autonomic
receptors (e.g., beta-blockers, muscarinic antagonists) directly or indirectly alterpacemaker activity. Digitalis causes bradycardia by increasing parasympathetic (vagal)
activity on the SA node; however, at toxic concentrations, digitalis increases automaticity
and therefore can cause tachyarrhythmias. This toxic effect is related to the inhibitoryeffects of digitalis on the membrane Na+/K+-ATPase, which leads to cellulardepolarization, increased intracellular calcium, and changes in ion conductances.
CONDUCTION OF FAST AND SLOW ACTION POTENTIALSThe conduction of action potentials through a cardiac muscle fiber occurs over the surface of
individual cells as action potentials in one region of a cell depolarize adjacent membrane –such “local circuit” conduction is also known as electrotonic (passive) conduction. The
ends of cardiac cells are mechanically-anchored to adjacent cells by intercalated disksWhen the wave of depolarization reaches the end of a cell, it is conducted to neighboring
cells via gap junctions which are non-selective, high conductivity, ion channels composed of
proteins known as connexins that form electrical connections between cells. Electrotonicconduction velocity is primarily determined by the resistive/capacitive properties of cell
membranes, gap junctions, and cytoplasm.
• Current Flow through Gap Junctions: An AP conducting from left to right causesintracellular current to flow from fully depolarized cells on the left, through gap junctions,
and into cell A. Depolarization of cell A causes current to flow from cell A to cell B (I AB).Part of I AB discharges the capacitance of cell B (depolarizing cell B), and part flows
downstream to cell C.
Clinical CorrelationDuring cardiac bypass surgery, cardiothoracic surgeons often temporarily stop the heartusing a cardioplegic solution that contains a high concentration of K
+.
Question: In which phase of E-C Coupling (systole or diastole) does the heart stop?

7/26/2019 Physio Coursepack 2016
http://slidepdf.com/reader/full/physio-coursepack-2016 101/282
David G. Beiser, MD, MS Cardiac electrophysiology I Cell & Organ Physiology: Cardiovascular
- 8 -
• Conduction of the Fast Response: In atrial muscle, ventricular muscle, and Purkinjefibers, a wave of depolarization triggers APs in muscle cells along the length of a cardiac
fiber. The conduction velocity of this propagating wave of depolarization is proportional
to the rate of change in membrane potential during Phase 0 (dVm/dt). Thus rapid
depolarization favors rapid conduction. In addition, conduction velocity is inversely
proportional to resting membrane potential during Phase 4, with lower membranepotentials resulting in faster conduction velocities.
• Conduction of the Slow Response: Electrotonic spread of is also responsible for
propagation of the slow response within the SA and AV nodes; however, the conduction
is much slower (0.02 – 0.1 m/s). By comparison, conduction of the fast response is 0.3 –1 m/s in myocardial cells and 1 – 4 m/s in the specialized conduction fibers of thePurkinje system.
!"#$% ' ()$*+,-% .%/,01*2 #34 5#631*(4% ,7 4%),/#+18#*1,3
4%)%34 ,3 *"% +%0,.%+2 ,7 13#0*1.#*%4 9# 0"#33%/$: ;"%
)+,<#<1/1*2 ,7 +%0,.%+2 1$ +%/#*%4 *, <,*" *15% #34 4%6+%% ,7
= 5 +%),/#+18#*1,3: ;"($> ?!$ #++1.136 4(+136 !"#$% @ A1//
)+,4(0% $/,A%+ ()$*+,-%$ ,7 $5#//%+ 5#631*(4% ,+ 3,
#0*1.#*1,3 #* #// B%77%0*1.% +%7+#0*,+2 )%+1,4C:
Clinical CorrelationFactors which influence the dynamics of Phase 0 or resting membrane potentials duringPhase 4 (e.g. catecholamines, ischemia, ionic concentrations) can drastically alter the rate ofdepolarization in the heart. Question: Predict the impact of increased extracellular K
+
concentration on conduction velocity?

7/26/2019 Physio Coursepack 2016
http://slidepdf.com/reader/full/physio-coursepack-2016 102/282
David G. Beiser, MD, MS Cardiac electrophysiology II Cell & Organ Physiology: Cardiovascular
- 1 -
Cardiac Electrophysiology II: The Surface Electrocardiogram
Recommended reading
Levy & Pappano 9th Edition:
• Chapter 3: Automaticity: Natural Excitation of the Heart (pp. 45-54)
Mohrman & Heller: Lange Series: Cardiovascular Physiology 6th Edition (optional)• Chapter 4: The Electrocardiogram (optional, though well-written)
Boron & Boulpaep:
• Chapter 20: Cardiac Electrophysiology and the ECG (great figures)
Objectives
• Understand the structure and function of the major components of the heart’s conduction
system.
• Describe the propagation of cardiac action potential during the normal cardiac cycle
• Describe the orientation of the heart’s dipole moment vector during different phases of
the ECG
• Derive frontal or precordial lead projections given the dipole moment vector
• Conversely, calculate the orientation of the mean electrical axis given a frontal lead ECG.
• Diagnose the discussed common dysrhythmias related to impulse initiation and AV
conduction.
CARDIAC CONDUCTION PATHWAYS:Depolarization and subsequent repolarization of the heart’s chambers follows a stereotypical
sequence that is determined by the structure of its conduction system.
Structure + Function
• SA Node (slow conduction ~ .05 m/s):
During sinus rhythm, pacemaker cells of the
sinoatrial (SA) node initially fire asdescribed in our last lecture. SA Node firing
is localized to a small region of the atrium.SA node firing is not evident on the surface
EKG (due to its small dipole moment vector
as explained below).
• Atrial Pathways (fast conduction ~1 m/s):During normal sinus rhythm, APs spread
radially from the SA node pacemakerthroughout the right atrium via regular atrial
muscle fibers. Simultaneously, a
specialized conduction pathway (interatrialmyocardial band, aka Bachmann’sbundle) conducts this depolarizing wave rapidly to the left atrium. The existence of a
fibrous (non-conductive) atrioventricular ring precludes the spread of the atrial impulse
directly to ventricles. Instead, internodal pathways rapidly conduct the signal to the AVnode. The spread of atrial excitation is reflected as the P-wave on the surface ECG.Clinical Relevance: Many abnormalities in atrial excitation and conduction can be
diagnosed by analysis of the P-wave. For example, though we cannot see the activationof the SA node, we can infer normal activity of the SA node by looking at shape of the P-
wave.

7/26/2019 Physio Coursepack 2016
http://slidepdf.com/reader/full/physio-coursepack-2016 103/282
David G. Beiser, MD, MS Cardiac electrophysiology II Cell & Organ Physiology: Cardiovascular
- 2 -
• AV Node (slow conduction ~ 0.05 m/s): Approximately 0.01 seconds after its originationat the SA node, the wave of depolarization arrives at the atrioventricular (AV) node,situated posteriorly on the right side of the interatrial septum and just above the
atrioventricular ring. AP propagation is greatly slowed as it traverses the AV node –
imparting a slight delay between atrial and ventricular AP propagation. The slow
response tissue of the AV node contributes to this delay as conduction velocity is
proportional to upstroke velocity (dVm/dt) during Phase 0. In addition, the small fiberdiameter within the AV node increases its resistance – further slowing conduction
velocity. Functionally, this delay has hemodynamic advantages, providing the optimaldelay to allow blood in the atria to empty into the ventricles (colloquially the atrial kick)
prior to ventricular contraction. Clinical Relevance: This AV node delay (PR Interval)
largely accounts for the delay between the onset of the P-wave (spread of atrialexcitation) and the QRS complex (spread of ventricular excitation) – the so-called PR
interval.
• Bundle of His (fast conduction ~ 1 m/s): The bundle of His, which emerges from the AVnode on the right side of the interventricular septum, is the proximal portion of the
ventricular conduction system.
• Bundle Branches (fast conduction ~ 1 m/s): The bundle of His divides into the right andleft bundle branches, which carry the signal to the muscle of both ventricles. The right
bundle branch conducts the electrical signal down the right side of interventricular
septum to the right ventricle. The left bundle branch perforates to the left side of theinterventricular septum and then most frequently divides into two main branches-the left
anterior fascicle (or hemibundle) and the left posterior fascicle.
• Purkinje Fibers (rapid conduction ~ 4 m/s): Both bundle branches ultimately divide intoa complex network of rapidly conducting Purkinje fibers that invest the ventricular walls.
Purkinje fibers are large diameter (i.e. fast conducting) cells and rapidly spreads the wave
of activation throughout both ventricles. The Purkinje network is also the major locus of
ventricular escape pacemakers (idioventricular pacemakers).
Ventricular Depolarization: “Frontal Plane” OverviewIn order to understand the genesis of the
surface electrocardiogram it is helpful to stepback and view the depolarization of theventricles within a “frontal plane” cross-
section of the heart. Keep in mind that this
pattern of depolarization is made possible by
the conduction anatomy described above.
1. SA node fires, depolarizes atria and then AV node.
2. After a short delay, the signal emerges via
the bundle of His and depolarizes the
interventricular septum from left to right.3. The anteroseptal region depolarizes via
the bundle branches.
4. The myocardium depolarizes from theendocardium (the cells lining the
ventricles) toward the epicardium (cells on

7/26/2019 Physio Coursepack 2016
http://slidepdf.com/reader/full/physio-coursepack-2016 104/282
David G. Beiser, MD, MS Cardiac electrophysiology II Cell & Organ Physiology: Cardiovascular
- 3 -
the outer surface of the heart). The left ventricle depolarizes at the apex, while the
Purkinje fibers are still in the process of conducting the action potential toward the baseof the left ventricle.
5. Depolarization spreads from the apex toward the base, carried by the Purkinje fibers.This spread to the base begins even as the signal in the "apex" is still spreading from the
endocardium to the epicardium. The last region to depolarize is the posterobasal regionof the left ventricle.
6. The ventricles are fully depolarized.
THE SURFACE ELECTROCARDIOGRAM: The surface electrocardiogram (ECG or EKG)provides an inexpensive and highly-repeatable measure of heart status. Clinically, the ECGcan provide a wealth of insight into a variety of cardiac parameters including:
• heart rate
• rhythm
• conduction
• anatomic orientation of the heart (axis)
• chamber size (magnitude of wave)• extent, location, and magnitude of ischemic myocardial damage
In addition, ECGs can also assist in the diagnosis of a wide variety of other classically non-
cardiac diseases/disturbances related to (for example): pulmonary function, endocrine
function, toxic exposure, drug overdose, trauma, temperature, infection, and inflammation.
Rather than measuring the electrical signal of individual cardiac APs, the ECG provides a netmeasure of the small extracellular signals (“local circuit currents”) produced by the movement
of action potentials (depolarization/repolarization) through cardiac myocytes. The surfaceECG provides a representation of the timing and direction of cardiac action potential
propagation through the heart projected onto 2 orthogonal (i.e. perpendicular) planes.
In order to obtain a standard 12-lead ECG, two electrodes are placed on the upperextremities (RA, LA), two on the lower extremities (RL, LL), and six on standard locations
(V1, V2, V3, V4, V5, V6) across the chest. In various combinations, the electrodes on theextremities generate the six limb leads (three standard and three augmented), and the chest
electrodes produce the six pre-cordial leads. In a lead, one electrode is treated as thepositive side of a voltmeter, and one or more electrodes as the negative side. Therefore, a
lead records the fluctuation in voltage difference between positive and negative electrodes.By varying which electrodes are positive and which are negative, the ECG machine records
a standard 12-lead ECG. Each lead records the heart from a unique angle and plane, that is,
from what is essentially a unique point of view.
The Prototypical ECG:Before tackling the physics of the ECG, we will consider a prototypical ECG signal. Thereare three waveforms and 3 intervals and 2 segments in the ECG.
• P Wave represents depolarization of the atria. There is an isoelectric period after the P
wave, when all the atrial cells are on in Phase 2 (plateau) and the ventricles have yet to
be depolarized.
• QRS Complex (80 – 100 msec) represents ventricular depolarization. This
depolarization triggers contraction of the ventricles. The QRS duration is the time it takesto depolarize both ventricles. This activation is coordinated in a specific pattern by the

7/26/2019 Physio Coursepack 2016
http://slidepdf.com/reader/full/physio-coursepack-2016 105/282
David G. Beiser, MD, MS Cardiac electrophysiology II Cell & Organ Physiology: Cardiovascular
- 4 -
Purkinje system. Clinical relevance: Diseased tissue typically decreases conduction
rates within the Purkinje system – widening the QRS complex.
• T Wave is repolarization of the ventricles.
Repolarization of the atria takes place during the
QRS, and it, therefore, is usually “buried” in the
QRS signal. • PR Interval (120 – 200 msec) is measured from
the beginning of the P wave to the beginning of
the QRS. It corresponds to the conduction timefrom the onset of atrial depolarization and
conduction through the AV node and the His-
Purkinje system, ending when the first ventricularcells are activated.
• RR Interval (rate dependent, 100 - 300 bpm =600 - 200 msec) is the distance between
successive R waves and represents the ventricular rate.
• QT Interval (300 – 450 msec) measures the time between the start of the Q wave
(ventricular depolarization) and the end of the T wave (ventricular repolarization). As youmight guess, this interval is quite sensitive to drugs that impact the length of Phase 2 orPhase 3. QT interval is inversely proportional to heart rate and thus must be corrected(adjusted) in the clinical setting. In general it is less than 50% of the RR interval.
• PR Segment: Represents the isoelectric period between full atrial depolarization and theonset of ventricular depolarization
• ST Segment: Represents the isoelectric period between full ventricular depolarizationand repolarization.
The Surface ECG Records the Dipole Moment Vector: Electrotonic conduction of theaction potential between adjacent cardiac cells is mediated by local circuit currents which aredriven by the potential difference between depolarized (positive charge) and resting
membranes (negative charge) through the conductive extracellular matrix. To understandhow these events are reflected in a surface ECG it is useful to invoke the concept of dipoles
and dipole moment vectors.
A dipole is a pair of positive and negative charges separated by a distance that have aparticular orientation in space. A dipole creates an electromagnetic force known as a dipole
moment vector whose magnitude is determined by the amount of charge and degree of
charge separation (the concept of a dipole moment vector and dipole vector is usedsomewhat interchangeably in the texts, so don’t get too caught up in the distinction).
The magnitude of the heart’s dipole moment vector is determined by the extent ofdepolarized tissue (amount of charge) and the size of the depolarized region (charge
separation). The net dipole vector is also determined by the consistency of orientationbetween individual dipoles as dipoles oriented in opposite directions cancel each other out.Thus depolarization of a small amount of tissue within a small region (e.g. SA node) createsa tiny dipole moment (which as mentioned before is not sensed by the surface ECG).
Conversely, simultaneous depolarization of a large mass of tissue across a large region (e.g.
left ventricle) creates many dipoles oriented in a similar direction – and a resulting largedipole moment vector. Note, that when all of the heart is either depolarized (Phase 2) or
resting (Phase 4), no boundary exists – thus no dipoles are present – this period is alsoknown as the isoelectric point (or period) on the ECG tracing.

7/26/2019 Physio Coursepack 2016
http://slidepdf.com/reader/full/physio-coursepack-2016 106/282
David G. Beiser, MD, MS Cardiac electrophysiology II Cell & Organ Physiology: Cardiovascular
- 5 -
Ventricular repolarization
(T wave)
Ventricular depolarization
(QRS)
Mean electrical
axis
AtrialDepolarization
(P wave)
Isoelectricpoint
Ventricular repolarization
(T wave)
Ventricular depolarization
(QRS)
Mean electrical
axis
AtrialDepolarization
(P wave)
Isoelectricpoint
Typical “frontal plane” vector cardiogram.
As the cardiac action potential
propagates through the heart, awave front of dipoles forms at the
boundary between polarized and
resting tissue – creating aninstantaneous dipole moment
vector. At any instant within thecardiac cycle, the surface ECG
measures the net dipole vectorwhich represents the vector sumof all individual dipole moment
vectors within the heart. As the tipof this vector rotates around the
isoelectric point, it traces a set of
complex loops in 3-dimensionalspace that can be displayed on an oscilloscope screen – a technique known as vectorcardiography. The mean electrical axis represents the instantaneous dipole vector during
the most peak phase of ventricular depolarization (aka R-wave peak of the QRS complex).
Understanding the concept of a rotating dipole vector is key to understanding the ECG.
Einthoven’s Triangle: Tracking the heart’s net dipole in the frontal plane As discussed above, at any instant in time, the net electromotive forces of the heart can be
represented by a dipole moment vector having both a 3-dimensional direction and a
magnitude within the chest. As mentioned above, the tip of this vector can easily bevisualized using vector cardiography; however, this technique is not commonly appliedclinically. Instead, a standard 12-lead ECG is used to record the projection of this vector on
two perpendicular planes – the frontal plane (defined by limb leads aka Einthoven’s Triangle)
and a transverse plane (defined by precordial leads). For his discovery of the mechanism ofthe electrocardiogram, Willem Einthoven was awarded the 1924 Nobel Prize in Physiology or
Medicine.

7/26/2019 Physio Coursepack 2016
http://slidepdf.com/reader/full/physio-coursepack-2016 107/282
David G. Beiser, MD, MS Cardiac electrophysiology II Cell & Organ Physiology: Cardiovascular
- 6 -
• Standard Limb Leads (I, II, III): Einthoven’s Triangle is the idealized frontal projectionplane defined by the placement of 3 limb electrodes (RA, LA, and LL). Each side of thetriangle defines a “lead”, separated by 60°, which measures the potential difference
between two bipolar electrodes. Each of these leads provides a somewhat unique view
of the dipole vector over time. The leads are defined electrically as follows:
Lead I = VLA – VRA
Lead II = VLL – VRA Lead III = VLL - VLA
• Augmented Limb Leads (aVR, aVL, aVF): Additional virtual (or “augmented”) leads are
defined by the use of unipolar electrodes which measure potential relative to the center of
the chest. These leads (e.g. aVR, aVF, aVL) provide additional “perspectives” on the 3-
dimensional electrical vector by measuring the projection of the dipole vector along a linebetween the limb electrodes (RA, LA, LL) and a point known as the central terminal ofWilson – though an oversimplification, this essentially involves measuring the potential of
a single limb lead (e.g. RA for aVR) relative to the other 2 leads (e.g. LA and LL).Derivations of the augmented leads can be found in the text.
• Converting Dipoles into the QRS Complex: ECG leads have a defineddirection and polarity. As the
dipole vector rotates through
space, each lead senses thecomponent of this vector which
projects along the lead andsubsequently provides a negative
or positive deflection on a scalartracing. When the vector points
along the lead a positive deflection
is produced – and vice versa. To
better understand this concept,consider the depolarization
sequence of the ventricles (seefigure) from the perspective of
Lead I. As the septum depolarizesleft-to-right, this produces a
leftward dipole, thus inducing asmall negative deflection (Q wave)
on the Lead I tracing. Next, as
the impulse travels down theseptum and into the ventricles, alarge net dipole is created inducing
an upward (R wave) in all 3 limbleads. Finally, depolarization ofthe left ventricle is completedproducing a small positive (Swave). Finally, the dipole vectordisappears once the entire
ventricle is depolarized – an
isoelectric period. Note that theprojection of the dipole vector isslightly different for each lead.
The QRS complex is the projection of the dipole momentvector on each of the standard limb leads.

7/26/2019 Physio Coursepack 2016
http://slidepdf.com/reader/full/physio-coursepack-2016 108/282
David G. Beiser, MD, MS Cardiac electrophysiology II Cell & Organ Physiology: Cardiovascular
- 7 -
• The Mean Electrical Axis: The position of the dipole moment vector during the peak ofventricular depolarization (peak of R-wave)is referred to as the mean electrical axis.
o Normal Axis (-30 to +90°):
Normally the mean electrical axis of
the ventricles points within the lower
left (anatomically speaking)quandrant of the frontal plane.
o Left Axis Deviation (-30 to -90°):can indicate a more transverse
anatomic orientation of the heart,left-ventricular hypertrophy, or a
decrease in right ventriculardepolarization.
o Right Axis Deviation (>90°): can
indicate a more longitudinalorientation of the heart, rightventricular hypertrophy, or a left-
ventricular conduction issue.
During the depolarization of ventricles (represented by the
QRS complex), the mean electrical axis of the heart in thefrontal plane is normally +60° relative to Lead I (+ =clockwise, opposite to mathematical convention). The
Mean electrical axis during ventricular depolarization is
influenced by the anatomic position and size of the heart.Changes in ventricular size (as can occur in heart failureand high blood pressure) can alter the size direction of this
vector. The direction of the mean electrical axis can be
easily measured on a vector cardiogram; however, on a
standard ECG, it requires a bit of vector math. Here are afew methods for calculating the mean electrical axis:
o Vector Addition Method: Vector addition canbe performed easily by plotting the amplitude of
leads I and II (or any frontal leads) along the
appropriate lead direction on and drawing theresultant vector.
o Equal R-Wave Method: In this method, identify2 frontal leads with R-waves of approximately
the same magnitude (and direction). The meanelectrical axis is midway between these two leads. For
example, identical R-waves in leads II and III would suggest
an axis of +90° (i.e. along aVF)o Inspection Methods: Identify the largest R-wave – the axis
likely is fairly close to this lead. Conversely, identify the lead
with the smallest R-wave – this lead is roughly perpendicularto the mean electrical axis.
o Geometric Method: (optional, see Boron & Boulpaep p. 500)
Though you should be able to calculate the mean electrical axis by at least one of these methods, in practice, the axis is usually calculated by the ECG machine.
I
II
I
II
Vector addition method

7/26/2019 Physio Coursepack 2016
http://slidepdf.com/reader/full/physio-coursepack-2016 109/282
David G. Beiser, MD, MS Cardiac electrophysiology II Cell & Organ Physiology: Cardiovascular
- 8 -
• Ventricular Repolarization – The T-wave conundrum (optional material): Considering the upright shape of the R-wave (depolarization of ventricles), it shouldsurprise you that repolarization of the ventricles produces an upright T-wave – indicating
a dipole moment in the same direction as repolarization. If repolarization occurred along
the same path as depolarization (down the septum and into the ventricles) we would
expect the T-wave to be inverted (because repolarization produces a dipole of reverse
polarity). Instead, repolarization is not quite as well coordinated as it depends on boththe channels in the cells locally and on flow of current from adjacent cells. Two
observations have been floated to explain the upright T-wave:
o Though not well-understood, the last ventricular cells to depolarize are actuallythe first cells to repolarize – thus this reverses the order of repolarization.
o APs of the epicardial cells are shorter than those in the endocardium, so the main
repolarization starts at the epicardium and moves to the endocardium through the
main wall of the left ventricle (opposite to depolarization). Therefore, the T wavetends to be in the same direction as the main QRS.
Note, the septal and right ventricular repolarization is sufficiently disorganized that it providesno coordinated wavefront. The T wave is perhaps the most variable part of the ECG
showing sensitivity to many parameters such as temperature, pH, electrolytes (e.g. K+), and
ischemia.
• Converting Dipoles into P Waves: As mentioned before the dipole moment of the SAnode is too small to be measured by the ECG; however, the dipole of the atria as they
depolarize, points primarily along the Lead II axis. Accordingly, Lead II is generally thebest lead for finding an upright P wave of consistent morphology.
• Precordial Leads: Six leads (V1, V2, V3, V4, V5, and V6) provide a picture of the dipole
moment as it progresses in the transverse plane. Similar to the augmented frontal leads,
these unipolar leads measure changes relative to a point located in the center of theheart (see figure). Dipole moments directed towards these electrodes produce positive
deflections while those directed away produce negative deflections. The precordial leadsare closer to the heart than the limb leads and consequently are more sensitive tochanges in dipole (and heart muscle) size. Thus for V1 and V2 (which sits far from the
left ventricle, along the sternum) only a small R-wave is produced as the dipole moment
is largelyperpendicular to the
line between thecenter of the heartand V1.By contrast,
the V6 lead (which is
situated close to theleft ventricle along themidaxillary line),
records a large
positive R-wave asdepolarization
spreads down theseptum and outwardtowards the left
ventricle.

7/26/2019 Physio Coursepack 2016
http://slidepdf.com/reader/full/physio-coursepack-2016 110/282
David G. Beiser, MD, MS Cardiac electrophysiology III Cell & Organ Physiology: Cardiovascular
- 1 -
Cardiac Electrophysiology III: Mechanisms of Cardiac Arrhythmias
Recommended reading
• Review cardiac conduction in Cardiac Electrophysiology I lecture
Objectives
• Understand the cellular mechanisms of conduction block & reentrant conduction.
• Understand cellular mechanisms, anatomic defects, and EKGs for commontachyarrhythmias & bradyarrhythmias.
• Diagnose the discussed common dysrhythmias related to impulse initiation and AV
conduction and reentry.
A FEW COMMON DYSRHYTHMIAS
Dysrhythmias are cardiac rhythm abnormalities that reflect disturbances of either impulsepropagation or impulse initiation. While a detailed discussion of the specific diagnosticcriteria is beyond the scope of this lecture, here we will introduce you to a few general
common dysrhythmias.
Sinoatrial Rhythms
• Normal Sinus Rhythm: This refers to a
beat emanating from the SA node atcharacteristic rate between 60 – 100 bpm(beats per minute) with a normal PR
interval.
• Sinus Arrhythmia: This variation in heart
beat is actually a normal response to therespiratory cycle. It is often quite
pronounced in kids.
• Sinus Tachycardia:
Sinus tachycardia
refers to a sinus rhythm(i.e. emanating from thesinus node) that is
faster than 100 bpm.This can occur as a
normal autonomic
response to exercise;however, as discussed in later lectures, can also reflect a response to variety of
pathophysiological states such as hemorrhage, hypoxia, fever, or infection.
• Sinus Bradycardia: Defined as a sinus rhythm less than 60 bpm. Sinus bradycardiacan occur in the setting of ischemia or severe hypoxia. In addition, trained athletes often
exhibit a profound resting bradycardia.
• Sinus Arrest: While the depolarization of the SA node is not reflected in the ECG, loss
of the SA node (as can occur in ischemia) is usually diagnosed by a change or loss of theP-wave, signaling the existence of an escape pacemaker.
Sinus Tachycardia. Rate > 100 bpm (~ 125 bpm).

7/26/2019 Physio Coursepack 2016
http://slidepdf.com/reader/full/physio-coursepack-2016 111/282
David G. Beiser, MD, MS Cardiac electrophysiology III Cell & Organ Physiology: Cardiovascular
- 2 -
• Premature Atrial Contractions: PACs are P-waves which emanate from an ectopicatrial pacemaker in between normal sinus beats. Following a PAC, the ventricles willdepolarize normally as the ectopic impulse still travels through the AV node to reach the
ventricles. PACs generally produce odd or inverted P-waves reflected a change in the
atrial dipole.
AV Transmission Blocks: The conduction of an impulse is blocked when it reaches aregion of the heart which is electrically unexcitable. This can occur at a variety of levels
between the atria and ventricles or within the conduction system of the ventricle itself.
• 1° AV Block reflects a slowing of
conduction through the AV node. On the
ECG, this appears as a long PR interval(> 200 ms).
• 2° AV Block is an intermittent conduction
block, in which the tissue conducts someimpulses but not others, of which there
are two types.o Möbitz Type I (aka Wenckebach block): Refers to progressive prolongation of
the PR interval on consecutive beats that is followed by a complete block of AV
conduction – resultling in a dropped beat (QRS complex). It almost always
suggests disease within the AV node.
o Möbitz Type II, is a partial block in which the PR interval is constant from beat tobeat, but every nth P-wave fails to conduct to the ventricles – resulting in a
dropped beat. The figure below shows 2:1 block.
• 3° AV Block refers to complete AV
conduction block where no atrialimpulses conduct to the ventricles. In
this case, the atria and ventricles aretriggered by separate (and independent)
pacemakers producing an ECGcharacterized by P-waves and QRS
complexes with no apparent relationship – a situation called AV dissociation. In
this case, escape pacemakers withinthe Purkinje fibers, which are quite slow and unreliable. Depolarization of the ventricles
may or may not follow normal conduction pathways (so the QRS complex is often wide
and misshapen) depending on the location of the block, and location of the escapepacemaker – this is a medical emergency!

7/26/2019 Physio Coursepack 2016
http://slidepdf.com/reader/full/physio-coursepack-2016 112/282
David G. Beiser, MD, MS Cardiac electrophysiology III Cell & Organ Physiology: Cardiovascular
- 3 -
Ventricular Conduction Blocks:
Another form of conduction block occursin the large branches of the His-Purkinje
fiber system ("bundle branch block).
With failure of the His-Purkinje fibersystem, the impulse is left to spread
slowly and inefficiently through theventricles by conducting from one
myocyte to the next. This alteredconduction changes the rapid andcoordinated spread of the AP
throughout the ventricle and thusimpacts conduction. In addition, it alters
the direction and magnitude of the ventricular depolarization vector (QRS complex) as
imaged by the surface ECG.
Reentrant Conduction: Under certain conditions, a cardiac impulse may produce self-
sustaining circuits of excitation known as reentry loops. Reentry underlies many commondysrhythmias of ordered and random (e.g. atrial fibrillation, ventricular fibrillation)
conduction.
• Normal Conduction: To understand reentry, imagine a conduction pathway (see figurebelow) involving a single Purkinje conduction fiber which bifurcates into two branches
which are then connected back to each other by a third bundle or a group of conducting
myocytes – this creates a closed conduction loop. Normally, when an impulse arrives, itwill propagate down both arms – leaving a zone of recently depolarized (and thusrefractory) cells in its wake. When these impulses later rejoin each other within the
connecting bundle, propagation of around the loop is extinguished as two fronts of
recently depolarized (and thus absolutely refractory) tissue meet – this is known as
bidirectional block.
• Reentrant Conduction: Reentrant conduction requires closed conduction loops,unidirectional block, and sufficiently long propagation times.
o Unidirectional block is a type of partial conduction in which impulses conduct in
one direction but not the other. Normal cardiac tissue conducts action potentialsin both directions. Injured tissue has a greater resistance, and thus slows
conduction and attenuates a wave of depolarization. To get an intuitiveunderstanding of unidirectional block, consider an asymmetric tissue lesion inwhich many more healthy cells may exist on one side of the lesion than the other
(Panel B below). In this situation, depolarization of the large group of healthy
cells (to the right of the lesion) is sufficient for triggering an AP in the small groupof cells underlying the lesion; conversely, depolarization of the small group of cellsunderlying the lesion is not sufficient for bridging the wave of depolarization past
the injured area – resulting in unidirectional block.

7/26/2019 Physio Coursepack 2016
http://slidepdf.com/reader/full/physio-coursepack-2016 113/282
David G. Beiser, MD, MS Cardiac electrophysiology III Cell & Organ Physiology: Cardiovascular
- 4 -
o Long propagation times: The effective refractory time of reentered tissue
adjacent to a unidirectional block must be less than propagation time around theloop. Such a situation can arise, for example, when tissue is injured (depressed
tissue has slower conduction). In addition, longer propagation times can becreated by increasing the length of a circuit which can occur if the surface area of
the atria or ventricles increases (e.g. secondary to dilated cardiomyopathy).

7/26/2019 Physio Coursepack 2016
http://slidepdf.com/reader/full/physio-coursepack-2016 114/282
David G. Beiser, MD, MS Cardiac electrophysiology III Cell & Organ Physiology: Cardiovascular
- 5 -
Reentrant Tachycardias: Reentrant tachycardias can occur within above the ventricles
(Supraventricular tachycardia) or within the ventricles.
• Supraventricular Reentrant Tachycardias: Reentrant circuits above the level of the
ventricles can include the atria (atrial flutter, atrial fibrillation), AV node (atrioventricular
nodal reentrant tachycardia (AVNRT)), accessory pathways (or bypass tracts) along the
groove of tissue between the atria and the ventricles (AV reentrant tachycardia AVRT) oralmost any combination of these. In most cases (except those involving bypass tracts),
these tachycardias are categorized as “narrow-complex” tachycardias since they displaynormal QRS duration. A detailed description of these will be presented in the 2nd year
curriculum. For now, we will focus on atrial tachycardias.
o Atrial Flutter: Atrial flutter is characterized by rapid and regular atrial activity at arate of 180 – 350 bpm. Thankfully, many of these beats arrive at the AV node
during its refractory period and thus do not conduct to ventricles – thus resulting in
a slower ventricular rate. Commonly observed ECG patterns include 2:1 block (e.g. atrial rate 300 bpm with ventricular rate of 150 bpm), 3:1 block, or variableblock (changing ratio beat-to-beat). From the surface ECG, atrial depolarization
takes on a “saw-tooth” like pattern reflecting a relatively large and fixed reentrantcircuit within the atria.
o Atrial fibrillation: Atrial fibrillation is characterized by “irregularly irregular” (i.e.no random) ventricular beats without discernable P-waves. This randomness is
quite distinctive when palpating a radial pulse while talking to the patient. The
random p-wave morphology reflects the wandering or chaotic nature of thereentrant atrial circuit. Such random activation does not result in coordinatedcontraction of the atrial and thus results in a loss of the “atrial kick” which leads to
a loss of cardiac output. While the AV node blocks most of these atrial impulses,
further loss of cardiac output leading to hypotension can occur if the ventricularrate becomes too fast to allow for effective diastolic filling.
Flutter waves: atrial rate ~ 300 bpm (1 large box)
(note, some p-waves are “buried” in the QRS and T-waves)
Flutter waves: atrial rate ~ 300 bpm (1 large box)
(note, some p-waves are “buried” in the QRS and T-waves)
Atrial Flutter with 3:1 block
Atrial fibrillation: Irregularly irregular narrow complex without P-waves

7/26/2019 Physio Coursepack 2016
http://slidepdf.com/reader/full/physio-coursepack-2016 115/282
David G. Beiser, MD, MS Cardiac electrophysiology III Cell & Organ Physiology: Cardiovascular
- 6 -
• Ventricular Arrhythmias: The most common ventricular arrythmias are (1) prematureventricular beats, (2) ventricular tachycardia, and (3) ventricular fibrillation. Ventriculararrhythmias are typically more dangerous because they can lead to a significant
reduction in cardiac output or cardiac arrest. As ventricular tachycardias often involve
conduction circuits outside the normal His-Purkinje system, the QRS duration is typically
prolonged. In addition, loss of coordinated conduction leads to a loss of coordinated
ventricular contraction which can lead to decreased (ventricular tachycardia) or no(ventricular fibrillation) cardiac output. Once again, a full discussion of these rhythms will
be presented next year.
o Premature Ventricular Beats: Clinically, these are often referred to aspremature ventricular contractions (PVCs). Similar to what occurs in the atria,
PVCs are common among healthy, asymptomatic, individuals and are oftenbenign in course. PVCs appear as additional wide-complex QRS complexes
between normally conducted narrow complex beats.
o
o can occur in healthy individuals o
o Ventricular Tachycardia:
o Ventricular Tachycardia: VT is a series of 3 or more PVCs. Arbitrarily, if it
persists for more than 30 seconds, produces symptoms (e.g. fainting aka
syncope), or requires termination, then it is designated sustained VT. Self-
terminating episodes are known as nonsustained VT. Unlike PVCs, patientswith VT usually have underlying structural heart disease or electrical, valvular, orcongenital cardiac abnormalities. Like the atrial flutter, ventricular tachycardiaoften exhibits a “fixed morphology” (monomorphic VT) reflecting a large and
relatively stable underlying reentrant circuit. Polymorphic VT results in QRS
complexes which continually change in shape suggesting multiple ectopic foci.The clinical significance of VT depends on the rate, symptoms and patient. If it is
relatively slow, it can often be well-tolerated. When rapid, it can quickly devolveinto ventricular fibrillation and cardiac arrest.
Unifocal (i.e. same ectopic focus) Premature Ventricular Contraction (PVC)
Monomorpic Ventricular Tachycardia

7/26/2019 Physio Coursepack 2016
http://slidepdf.com/reader/full/physio-coursepack-2016 116/282
David G. Beiser, MD, MS Cardiac electrophysiology III Cell & Organ Physiology: Cardiovascular
- 7 -
o Ventricular Fibrillation: VF is an immediate life-threat which leads to complete
loss of cardiac output, cardiac arrest, and death untreated. The VF ECG reflectswandering reentrant ventricular circuits which cause the ventricles to “quiver”
rather than contract in a coordinated (effective) fashion. Though usually forgotten
(and buried within the ventricular ECG signal) the atria continue to contractnormally during VF. The etiology of VF can often be traced to structural heart
disease, acute myocardial infarction (ischemia), acidosis, electrolyteabnormalities, hypoxemia, electrical injury, drug/medications, or familial
myocardial “channelopathies” such as Brugada Syndrome. The cornerstones ofVF treatment include rapid access to 911, early defibrillation, high qualitycardiopulmonary resuscitation (CPR), and advanced cardiac life support (ACLS).
Cardiac arrest is responsible for as many as 300,000 deaths in the U.S. eachyear.
Ventricular fibrillation: chaotic & polymorphic

7/26/2019 Physio Coursepack 2016
http://slidepdf.com/reader/full/physio-coursepack-2016 117/282
David G. Beiser, MD, MS Peripheral Circulation Med. Biology 303: Cardiac Physiology
- 1 -
1
5
4
3
2 1
5
4
3
2
The Peripheral Circulation
Recommended reading
Levy & Pappano:
! Chapter 6: HemodynamicsMohrman & Heller: Lange Series: Cardiovascular Physiology 6 th Edition (optional)
! Chapter 6: The Peripheral Vascular System (pages 93-108)
Objectives1. Gain familiarity with the layout of systemic circulations
2. Understand structure/function of peripheral vessels3. Develop intuitive understanding of hemodynamic forces and their clinical implications
a. Understand the determinants of vascular resistance
4. Understand how Ohm’s Law applies to cardiac output, SVR and MAPa. Understand the functional implications of series vs. parallel resistances
THE PERIPHERAL CIRCULATION: Capillary Beds in Parallel & Series 1) To a first approximation, the
peripheral arterial system is anetwork of parallel capillary bedscreated by successive generations
of branching arteries & arterioles
from a main trunk (the aorta).
2) Typically, oxygenated arterial blood
flows through a single capillary bed
before entering the venous system.
3) However, in some branches (e.g.renal circulation) blood flows
through two capillary beds in series before entering the venous system.
4) In still others (e.g. portal circulation)blood flows through a path
characterized by parallel and
sequential capillary beds.
5) In contrast, deoxygenated venousblood from the right heart can only
take a single pathway through thepulmonary artery and into the lung’s
capillary beds. The lung’s
circulation (to be covered in detail ina later lecture) itself branchesdistally into a massively parallel
network of capillaries.Clinical Correlation: A large blood
clot in the pulmonary artery can stop the flow of blood through the heart.

7/26/2019 Physio Coursepack 2016
http://slidepdf.com/reader/full/physio-coursepack-2016 118/282
David G. Beiser, MD, MS Peripheral Circulation Med. Biology 303: Cardiac Physiology
- 2 -
R
V I
!=
Ohm’s Law
V R I Pi Po
R
Q
R
P P Q oi "=!
R
V I
!=
Ohm’s Law
V R I Pi Po
R
Q
R
P P Q oi "=!
(cm2)
A = 2 10 1
V = 5 1 10
(cm/s)
Q = 10 cm3/s
Conservation of Volume: Qin = Qout
Area)Velocity)((Q =
(cm2)
A = 2 10 1
V = 5 1 10
(cm/s)
Q = 10 cm3/s
Conservation of Volume: Qin = Qout
Area)Velocity)((Q =
HEMODYNAMICS:
Compliance
Analogous to “capacitance” in physics, compliance is defined as the change in volume thatoccurs for a given change in pressure (Compliance = !V/!P). Thus highly compliant
vessels (e.g. inferior vena cava) can receive a large amount of additional volume withrelatively little change in venous pressure. Conversely, the small changes in volume
produces large changes in pressure within non-compliant (i.e. stiff) vessels such as anartery.
Flow rate Velocity
It is important to appreciate the distinction between blood velocity and flow rate. Simply
stated!
• Velocity (V) = fluid speed expressed as distance/time (e.g. cm/s)
• Flow Rate (Q) = volume flux expressed as volume/time (e.g. cm3/s, ml/s)
Conservation of Mass/VolumeOne of the central physical laws of hemodynamics (andmore generally fluid dynamics) deals with the idea of
conservation of mass. Simply stated, the volume of an
incompressible fluid (e.g. water or blood not air) enteringa conduit (e.g. a non-leaky copper pipe or blood vessel)
exactly equals the volume exiting. This implies that theaverage flow rate within a conduit does not change alongits length. Stated mathematically:
Qin = Qout
As a result of this physical law, it’s apparent that blood velocity varies inversely with vessel
cross-sectional area: Stated mathematically:
V = Q/A
Limitations: This simple relationship breaks down at very small time scales or when we addthe biologic complexity of pulsatile flows in distensible (i.e. compliant) and leaky (e.g.
capillaries) vessels; however, it works well for understanding simple hemodynamics.
Ohm’s Law Governs Blood FlowTo a first approximation, the physical
factors that govern blood flow areanalogous to those describing the flow ofelectrical current in a resistive circuit –
aka Ohm's Law, which states that current(I ) flow equals the voltage difference (V)
divided by circuit resistance (R). Drawingthe analogy to fluid flow, the voltage difference is the pressure difference (sometimes called
the pressure gradient or perfusion pressure), the electrical resistance is the resistance to
flow (R) of the blood vessel, and the current is the blood flow rate (Q).
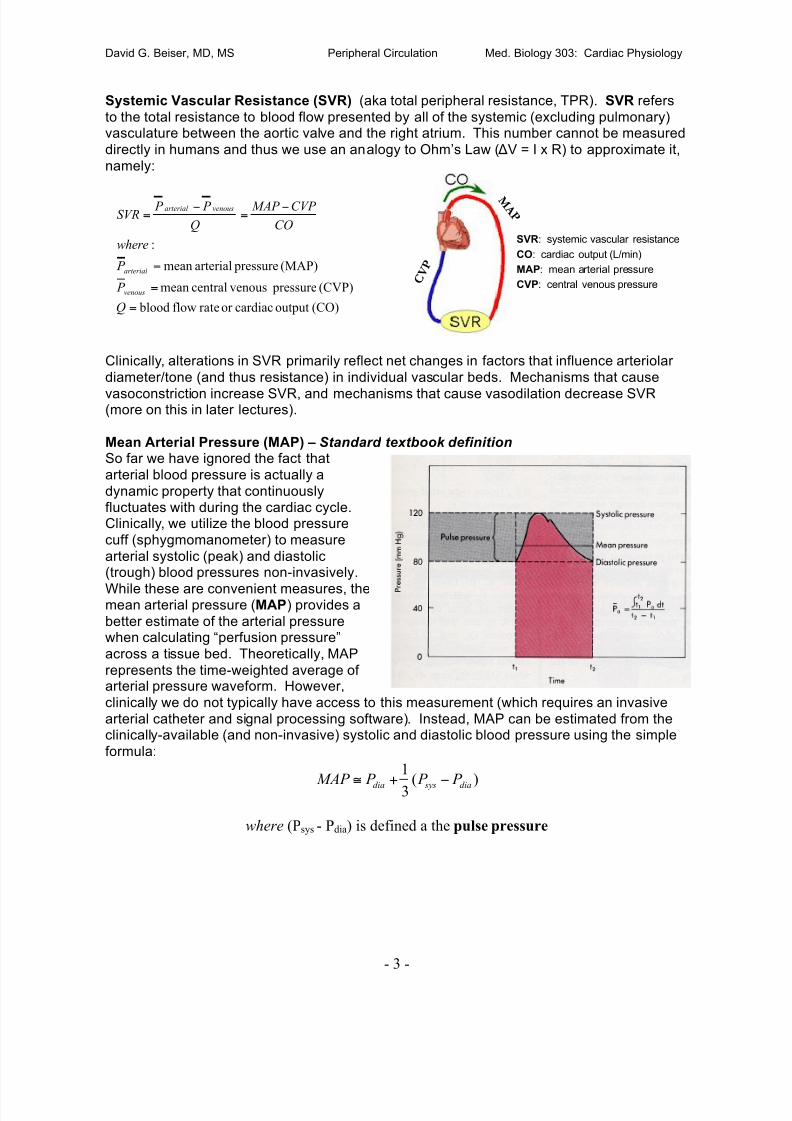
7/26/2019 Physio Coursepack 2016
http://slidepdf.com/reader/full/physio-coursepack-2016 119/282
David G. Beiser, MD, MS Peripheral Circulation Med. Biology 303: Cardiac Physiology
- 3 -
C V P
M A P
C V P
M A P
SVR: systemic vascular resistance
CO: cardiac output (L/min)
MAP: mean arterial pressure
CVP: central venous pressure
Systemic Vascular Resistance (SVR) (aka total peripheral resistance, TPR). SVR refers
to the total resistance to blood flow presented by all of the systemic (excluding pulmonary)vasculature between the aortic valve and the right atrium. This number cannot be measured
directly in humans and thus we use an analogy to Ohm’s Law ( "V = I x R) to approximate it,
namely:
Clinically, alterations in SVR primarily reflect net changes in factors that influence arteriolar
diameter/tone (and thus resistance) in individual vascular beds. Mechanisms that cause
vasoconstriction increase SVR, and mechanisms that cause vasodilation decrease SVR(more on this in later lectures).
Mean Arterial Pressure (MAP) – Standard textbook definitionSo far we have ignored the fact that
arterial blood pressure is actually a
dynamic property that continuouslyfluctuates with during the cardiac cycle.Clinically, we utilize the blood pressure
cuff (sphygmomanometer) to measure
arterial systolic (peak) and diastolic(trough) blood pressures non-invasively.
While these are convenient measures, themean arterial pressure (MAP) provides a
better estimate of the arterial pressurewhen calculating “perfusion pressure”
across a tissue bed. Theoretically, MAP
represents the time-weighted average ofarterial pressure waveform. However,
clinically we do not typically have access to this measurement (which requires an invasive
arterial catheter and signal processing software). Instead, MAP can be estimated from theclinically-available (and non-invasive) systolic and diastolic blood pressure using the simple
formula:
)(3
1
dia sysdia P P P MAP !+"
where (Psys - Pdia) is defined a the pulse pressure
(CO)outputcardiacorrateflow blood
(CVP) pressure venouscentralmean
(MAP) pressurearterialmean
:
=
=
=
!
=
!
=
Q
P
P
where
CO
CVP MAP
Q
P P SVR
venous
arterial
venousarterial

7/26/2019 Physio Coursepack 2016
http://slidepdf.com/reader/full/physio-coursepack-2016 120/282
David G. Beiser, MD, MS Peripheral Circulation Med. Biology 303: Cardiac Physiology
- 4 -
L R!
viscosity blood! R
4
1
r R
"
!
#
r1
r2
L1
L2
4
8
r
L
Q
P P R oi
"
""
=
$
=
#
%
Hydraulic Resistance Eq. L R!
viscosity blood! R
4
1
r R
"
!
#
r1
r2
L1
L2
4
8
r
L
Q
P P R oi
"
""
=
$
=
#
%
Hydraulic Resistance Eq.
L= tube length, r = tube radius, R=resistance, Pi =inflow pressure, Po=outflow pressure, # = bloodviscosity, Q = blood flow
Mean Arterial Pressure (MAP) – Beiser’s intuitive “geometric” definition
I have always had difficulty remembering random formulasbeyond those used in 10th grade geometry and physics.
Recall that MAP is defined as the time-weighted average
height of the arterial pressure wave-form. Note also thatthe arterial wave-form can be approximated by a triangle
(representing the pulse pressure waveform) sitting on-topof a rectangle (representing the diastolic blood pressure).
The average height of the pulse pressure triangle is equalto the height of triangle (aka the center of mass where halfthe mass of the triangle is above and half below). Now
reaching back to your inner-10th grader, remember that theaverage height of a triangle is 1/3 of its height. Of course
the average height the diastolic “rectangle” is the diastolic
blood pressure. Putting it together, MAP is defined as thediastolic blood pressure plus the average height of the pulse pressure “triangle”.
Physical Determinants of Resistance Above we introduced an aggregate measure of hydraulic resistance known as SVR. We will
now discuss the physical parameters that determine hydraulic resistance (R) and discuss therole of hydraulic resistance in determining blood flow rate. Interestingly, one of thefundamental laws governing the flow of fluid through cylindrical tubes was empirically derived
not by a physicist (or plumber) but rather a French physiologist (Jean Poiseuille, 1797-1869).
Poiseuille’s Law simply states that flow resistance increases with tube length (L) and bloodviscosity ("); while decreasing with increasing tube radius (actually inversely as the 4 th powerof the radius ~ think of it as the square of the conduit area). Strictly speaking, this law holds
only for laminar flows – breaking down when turbulence is introduced (discussed below).
Viscosity
The study of blood rheology (essentially thestudy of blood viscosity) is quite complex and
is covered in some depth in Chapter 6 of L&P.The important concepts are summarized
below. The viscosity of a “Newtonian” fluid
(e.g. water) may be determined via Poiseuille’sLaw by measuring the flow rate of a fluid
through a tube of known length and radius
under a constant pressure gradient. Sadly,blood is not a Newtonian fluid. Instead, it is
actually a suspension of erythrocytes within ahigh-protein fluid known as plasma. As a
suspension, blood viscosity depends greatly on the density of the suspension (i.e. hematocritratio). Thus anemic (decreased red blood cells) blood has a lower viscosity while
polycythemia (increased red blood cells) increases viscosity. Paradoxically, one of the “non-
Newtonian” properties of blood is that its viscosity decreases as vessel radius decreases in aphenomenon known as “shear thinning” (see L&P Chapter 6 for details). The extent of thisdecrease is partially dependent on the properties of the erythrocytes themselves.
Accordingly, poorly deforming erythrocytes (e.g. in setting of sickle-cell crisis orspherocytosis) display less shear thinning and thus increased hydraulic resistance. Blood
temperature also inversely effects resistance as hypothermia decreases plasma membranedeformability and thus increases blood viscosity.
1/3*PP
PP
“Center of Mass”
Pdia

7/26/2019 Physio Coursepack 2016
http://slidepdf.com/reader/full/physio-coursepack-2016 121/282
David G. Beiser, MD, MS Peripheral Circulation Med. Biology 303: Cardiac Physiology
- 5 -
To summarize, blood viscosity (and thus vascular resistance) is altered by:1) Hematocrit ratio (anemia vs. polycythemia)
2) Vessel diameter (shear-thinning)
3) Erythrocyte shape (sickle cell crisis, spherocytosis)4) Temperature (e.g. accidental or induced hypothermia)
Laminar vs. Turbulent FlowNormally, blood flows through vessels in a smooth and efficient manner defined by “laminarflow.” Laminar flow can be modeled as a collection of concentric tubes of blood sliding down
the length of the blood vessel. The outermost tube (touching the vessel wall) does not moveat all, while the innermost ring moves fastest. Laminar flow resistance follows Ohm’s Law
and thus increases linearly with increases in perfusion pressure.
Turbulent flow, which is characterized by chaotic flow “eddies”, results under certainconditions of viscosity, velocity and fluid density (through a concept known as the Reynolds
number). Under conditions of turbulence, resistance increases exponentially with velocity.
In the peripheral circulation, flow velocity is probably the most important factor leading toturbulence. Thus, turbulent flow can be generated by obstructions or irregularities along the
arterial system such as heart valves or carotid artery plaques. Such turbulence generatessound waves that can be auscultated with a stethoscope. Because higher velocities enhanceturbulence, heart murmurs intensify as flow velocities increase. Elevated cardiac output,
even across anatomically normal aortic valves, can cause physiologic murmurs due to
small amounts of turbulence. This can occur in during the 3rd trimester of pregnancy withassociated increases in cardiac output and anemia (which decreases blood viscosity). Bothfactors increase the Reynolds number and thus increase the likelihood of turbulence.
Vessel Cross-Sectional Area
In health, the body’s large/small arteries display very low resistance and thus are excellentblood conduits. Accordingly, only a small drop in blood pressure is seen across thelarge/small arteries. The largest drop in blood pressure occurs across the microvascular
network reflecting the high resistance of the arterioles. This illustration shows how thearterioles, which determine blood flow into the capillary beds, are actually the points where
vascular resistance is the highest.

7/26/2019 Physio Coursepack 2016
http://slidepdf.com/reader/full/physio-coursepack-2016 122/282
David G. Beiser, MD, MS Peripheral Circulation Med. Biology 303: Cardiac Physiology
- 6 -
321
321
321
1111
R R R R
P P
Q
P P
Q
P P
Q
P P
Q
QQQQ
t
oioioioi
t
t
++=
!
+
!
+
!
=
!
++=
Q1, R1
Q2, R2
Q3, R3
Pi PoQt Qt
321
321
321
1111
R R R R
P P
Q
P P
Q
P P
Q
P P
Q
QQQQ
t
oioioioi
t
t
++=
!
+
!
+
!
=
!
++=
Q1, R1
Q2, R2
Q3, R3
Pi PoQt Qt
Q1, R1
Q2, R2
Q3, R3
Pi PoQt Qt
50
40
30
20
10 V e l o c i t y ( c m / s ) 50
40
30
20
10
50
40
30
20
10 V e l o c i t y ( c m / s )
(Mohrman & Heller)
Velocity/Pressure/Area Profiles of the Peripheral Circulation
The arterial system branches distally into successive generations of smaller vessels thateventually each serve a single capillary bed. While individual arterial branches become
smaller with successive generations, the total number of vessels (and thus total cross-
sectional area) of each generation of branches actually increases – thus blood velocitydecreases along the arterial path. Low capillary blood velocity (~ 1 mm/s) facilitates
gas/nutrient exchange.
Parallel Resistances: As described above,
the peripheral circulation can be thought of asa closed-loop circuit made up of a network of
resistive capillary beds arranged in a largelyparallel fashion through branches off of main
trunk arteries (e.g. aorta). In this way, total
blood flow (Qt = 4-6 L/min in 70kg male) isdistributed across a myriad of capillary beds
supplying the body’s tissues. From
conservation of mass, we know that the totalflow rate (Qt) through this type of circuit is the
sum of the flow rates through individual parallelelements. If we divide this equation by the
perfusion pressure and apply Ohm’s Law to substitute “resistance” for this fraction we seethat the total resistance (Rt) of the network is less than the resistance of any individual
element. In hemodynamics we define the hydraulic conductance as the reciprocal of
resistance. Using conductances, we see that that total conductance is the sum of individualconductances.
Thus, while the resistance of an individual capillary is quite high (due to its small internaldiameter), the branching architecture of the capillary network creates a massively parallel
resistive network (estimates of ~ 1010 capillaries in the peripheral circulation) which, whenaggregated, contributes negligible resistance to the average capillary bed.

7/26/2019 Physio Coursepack 2016
http://slidepdf.com/reader/full/physio-coursepack-2016 123/282
David G. Beiser, MD, MS Peripheral Circulation Med. Biology 303: Cardiac Physiology
- 7 -
R1
R2
R3
PiQ Po
R2
P1 P2
321 R R R R
t ++=
R1
R2
R3
PiQ Po
R2
P1 P2
R1
R2
R3
PiQ Po
R2
P1 P2
321 R R R R
t ++=
Another way to conceptualize how parallel resistances add together is to recall a
simplified version of Poiseuille’s Law (stated above) which states that resistance is roughlyinversely proportional to the square of the vessel cross-sectional area. This relationship can
be applied to the aggregate cross-sectional area of a network of parallel vessels to estimate
hydraulic resistance. For example, unlike arterioles, capillaries contribute little to the totalresistance. To understand why, consider that the total cross-sectional area presented by the
entire capillary network (estimates range 1300 -- 4500 cm2) is approximately 10 – 20 timeslarger than that of the arteriole resistance vessels ( estimated range 50 – 500 cm2). If we
assume that the majority of the body’s capillaries are arranged in parallel to each other, wecan apply Poiseuille’s Law to estimate that capillary resistance is approximately 100 – 400times lower than that of the arterioles under basal conditions!
Clinical Correlations:
• In a massively parallel system large increases in resistance within an individual
branch (e.g. cross clamping a femoral artery) have a relatively small impact on total
resistance and thus little impact on blood pressure.
• In “shock” states (e.g. hemorrhagic shock) the body attempts to “shunt” blood to vital
organs by dramatically increasing the resistance of non-vital (e.g. skin, skeletal
muscle) tissues.
Series Resistances: Some capillary beds (e.g. renal peritubular/glomerular) are arranged in
a sequential fashion.
• Total resistance (Rt) in this type of arrangement equals the sum of individualresistances.
• Clinical Correlation: In the renal capillary beds, the peritubular capillary network is
anatomically connected in series with the glomerular capillary bed through theefferent arteriole such that changes in the physical determinants of renal GFR will
critically influence the hydraulic and oncotic pressures in the peritubular capillaries. As a consequence of this anatomic relationship, the hydraulic pressure in peritubular
capillary is significantly lower than that of the post-glomerular efferent arteriole,
allowing for re-absorption of filtered plasma.
Vessel Structure + Function
• Arteries (distribution, dampening )Vessels such as the aorta and largeand small arteries serve as conduits for
distributing blood to regional capillarybeds. Compliant arteries (e.g. theaorta) dilate during systole and contractduring diastole and thus serve as
“hydraulic filters” that “dampen” theheart’s pulsatile outflow to supply a
near continuous (and virtually non-
pulsatile) flow of oxygenated blood atthe level of the capillary.

7/26/2019 Physio Coursepack 2016
http://slidepdf.com/reader/full/physio-coursepack-2016 124/282
David G. Beiser, MD, MS Peripheral Circulation Med. Biology 303: Cardiac Physiology
- 8 -
• Veins (distribution, storage) These thin-walled conduits are the major source ofcompliance (defined in next section) in the
cardiovascular system. In fact, >65% of the
total blood volume resides within the large
veins. This high compliance system
“dampens” (i.e. attenuates) the influence oftotal blood volume on venous return to the
heart (i.e. preload). In other words, largechanges in volume produce relatively small
changes in venous pressure. ClinicalCorrelation: Large changes in intravascular
volume (e.g. during massive hemorrhage)produce relatively modest changes in
central venous pressure. The effect of
hemorrhage on venous pressure isminimized further by the autonomic nervoussystem (discussed in later lectures), which
decreases the compliance of the venoussystem leading to venous constriction and up to a 30% reduction in venous intravascular
volume. Venous constriction has very little impact on Systemic Vascular Resistance (see
Hemodynamics below for additional details).
• Arterioles (resistance, “stop-cocks” ) Arterioles (5-100 µm diameter) are comprised ofan inner layer of endothelial cells is encased by a circular layer of smooth muscle cellssurrounded by adventitia, which
is innervated primarily by thesympathetic nervous system.
Vessel resistance is modulatedby smooth muscle contraction
and relaxation. Changes in
arteriole resistance control thesystemic vascular resistance
(SVR) and direct the regionaldistribution of blood throughoutthe body (local and central
control mechanisms will be
discussed in later lectures.
• Metarteriole (local tissue bed
distribution) Metarterioles (10-20 µm diameter ) serve as “thoroughfare” conduits
connecting arterioles to venules (bypassing capillary beds). Their structures mirrors thatof arterioles except usually not innervated by autonomic nervous system.
• Capillary (filtration/exchange) Capillaries (5-10 µm dia, Length ~ 0.5-1.0 mm) are single
layer endothelial conduits devoid of smooth muscle (though capillaries do not contract,they do change conformational shape in response to certain biochemical stimuli throughthe action of actin/myosin fibers – yielding larger, leaky, pores). High total surface area
and low flow velocity promote efficient tissue oxygen/nutrient delivery. Capillary density
(i.e. anatomical distribution) within a tissue varies directly with tissue metabolic activity.Denser networks exist in heart vs. subcutaneous tissues.
• Venules (fine-tuning of capacitance/resistance) Venules are post-capillary vessels with athin smooth muscle layer and less abundant nerve innervation. They provide
capacitance as well as additional resistance distal to capillaries, which plays a role inregulating hydrostatic pressure within capillaries (discussed in Microcirculation lecture).

7/26/2019 Physio Coursepack 2016
http://slidepdf.com/reader/full/physio-coursepack-2016 125/282
David G. Beiser, MD, MS The Microcirculation Cell & Organ Physiology: Cardiovascular
- 1 -
The Microcirculation, Lymphatics & Local Control of Blood Flow
Recommended reading
Levy & Pappano:
• Chapter 8: The Microcirculation and Lymphatics
• Chapter 9: The Peripheral Circulation and Its Control (p. 157-167)
Mohrman & Heller: Lange Series: Cardiovascular Physiology 6th Edition (optional)• Chapter 6: The Peripheral Vascular System (pages 93-108)
• Chapter 7: Vascular Control (pages 117-133)
Objectives1. Become familiar with structure/function of the microcirculation
2. Understand the transcapillary mechanisms of gas, water, and solute transport
3. Understand (and apply clinically) the forces of capillary filtration/re-absorption4. Understand the local control mechanisms of the peripheral circulation (resistance)
a. Understand how intrinsic autoregulation regulates tissue blood flow
THE MICROCIRCULATIONFrom a reductionist biomedical engineering perspective, the human cardiovascular system isa two-pump (left and right ventricles) two-exchanger (lung and end-organs) system. Givenour focus so far on hemodynamic measures such as cardiac output, compliance, resistance,
and blood pressure it is easy to lose sight of the primary function of the cardiovascular
system – maintaining a suitable environment for cellular life through the delivery andexchange of nutrients, gases, waste, and thermal energy between tissues and the external
environment. At the level of the lungs and other organs, this exchange is exquisitelycontrolled by the arterioles, capillaries and venules constituting the microcirculation.

7/26/2019 Physio Coursepack 2016
http://slidepdf.com/reader/full/physio-coursepack-2016 126/282
David G. Beiser, MD, MS The Microcirculation Cell & Organ Physiology: Cardiovascular
- 2 -
Autoregulation
Muscle blood flow immediately after change in
perfusion pressure (closed circles) and following
autoregulatory compensation (open circles).
Box = autoregulatory range.
Microcirculation Structure + Function
The microcirculation is made up ofdistributed networks of arterioles, meta-
arterioles, capillaries, and venules. The
structure of each of these vessel types(introduced in the Peripheral Circulation
lecture) determines their function.
The regulation of regional blood flow (andthus gas/solute exchange) is primarilyachieved through dynamic changes in
pre-capillary resistance which is the netsum of hydraulic resistance presented by
small arteries, arterioles, and pre-capillary
sphincters. Arteries and arteriole vesselsconsist of endothelial layers wrapped bythick layers of vascular smooth muscle
cells (VSMC), which are innervated by nerve endings from the autonomic nervous system.
Arteriole diameter can vary between complete obliteration by strong contraction and infoldingof smooth muscle (acting as an arterial “stop-cock”) to maximal dilation. Under basal
conditions, the majority of vascular smooth muscle cells maintain partial contraction (basaltone). Passive stretch decreases vascular resistance while passive recoil increasesresistance. Pre-capillary sphincters are small cuffs of smooth muscle that are usually not
innervated but instead respond to local tissue conditions.
At their distal ends, true capillaries merge into venules (inner radius: 5-25 µm), which carryblood back into low-pressure veins that return blood to the heart. Venules have a
discontinuous layer of VSMCs and, therefore, can regulate local blood flow (though their
contribution to overall resistance is negligible). Venules may also exchange some solutesacross their walls.
INTRINSIC (LOCAL) CONTROL OF SYSTEMIC VASCULAR RESISTANCE (SVR): The cardiovascular system utilizes the control
of SVR to deliver blood to tissues at a flow
rate that optimally matches tissue metabolicdemand for O2,and nutrients while
simultaneously carrying away CO2 and other
waste products. Ultimately, SVR is controlledby a balance of intrinsic (autoregulatory) and
extrinsic (autonomic) mechanisms. Therelative importance of extrinsic vs. intrinsic
control varies across different tissue beds.For example, autonomic control predominates
in the skin while the control of heart vessels
resistance is dominated by local intrinsicfactors.

7/26/2019 Physio Coursepack 2016
http://slidepdf.com/reader/full/physio-coursepack-2016 127/282
David G. Beiser, MD, MS The Microcirculation Cell & Organ Physiology: Cardiovascular
- 3 -
Autoregulation: Autoregulation is an intrinsic mechanism, or vessel property, by which
capillary blood flow through is adjusted to maintain homeostasis in response to arterialtransmural pressure, blood velocity, and changes in local tissue metabolic activity. In many
tissues (most notably skeletal muscle), autoregulation allows for relatively constant tissue
blood flow across a wide range (20 -120 mmHg) of mean arterial pressures (perfusionpressures). Several autoregulatory mechanisms have been proposed to play a role in this
local control system:
• Myogenic mechanism (stretch):Increases in transmural pressure
(i.e. difference betweenintravascular and interstitial
hydrostatic pressures) stretchessmooth muscle in precapillary
vessels. Such stretching causes
stretch-depend ion channels toopen and trigger depolarizationand subsequent contraction of
smooth muscle. Such an increasein transmural pressure might be
expected to occur during periods
of increased cardiac output.Thus, at constant rates of tissuemetabolism, imposed changes in
arterial pressure are met with
changes in vascular resistancethat tend to maintain a constantblood flow within a local tissue
bed. This mechanism does not
require the endothelium.
To summarize, the Myogenic Mechanism...
! transmural pressure " stretches smooth muscle ! opens ion channels ! triggers smooth
muscle contraction " # arteriole diameter " ! resistance (R) " attenuates impact of
pressure change on local tissue flow rate (Q)
(The opposite occurs in response to decreases in transmural pressure)
• Endothelial release of Nitric Oxide (shear stress): In isolated coronary arteries,
perfused at constant transmural pressure, increases in flow velocity elicit vasodilation.
This vasodilation is mediated by nitric oxide (NO, formerly known as endothelium-derived relaxing factor or EDRF) and prostacyclin (PGI2) which are released byendothelial cells in response to a velocity-related increase in shear stress. NO freely
diffuses into smooth muscle, activates guanylate cyclase, increased cGMP inhibits Ca++
release and influx which promotes smooth muscle relaxation. This response is ablatedby removing the endothelial layer (see figure below ).
Schematically, shear stress impacts resistance as follows:
!blood velocity " !shear " !NO/PGI2 " !arteriole diameter (#R) " # blood velocity

7/26/2019 Physio Coursepack 2016
http://slidepdf.com/reader/full/physio-coursepack-2016 128/282
David G. Beiser, MD, MS The Microcirculation Cell & Organ Physiology: Cardiovascular
- 4 -
! blood flow
!
" [metabolites]
!
vasodilation
!
! resistance
!Reactive Hyperemia
Metabolic Mechanism
! blood flow
!
" [metabolites]
!
vasodilation
!
! resistance
!Reactive Hyperemia
Metabolic Mechanism
• Metabolic mechanism: Arterioles maintain a degree of basal tone (i.e. vasoconstriction)
or partial contraction under physiologic conditions. A variety of tissue metabolites (e.g.lactic acid, CO2, H
+) have been proposed as locally-synthesized “metabolic” vasodilators.
An increase in metabolic rate (e.g. during exercise or increased temperature) increasesthe production of these vasodilators and produces a subsequent increase in tissue bloodflow referred to as active hyperemia. In the setting of constant metabolic rate, increased
blood flow leads to “wash-out” of basal metabolites leading to compensatory
vasoconstriction. During periods of reduced blood flow or tissue ischemia, metabolitebuild up promotes vasodilation and thus produce a reactive hyperemia which increasesblood flow following the resumption of blood flow.
(Mohrman & Heller)
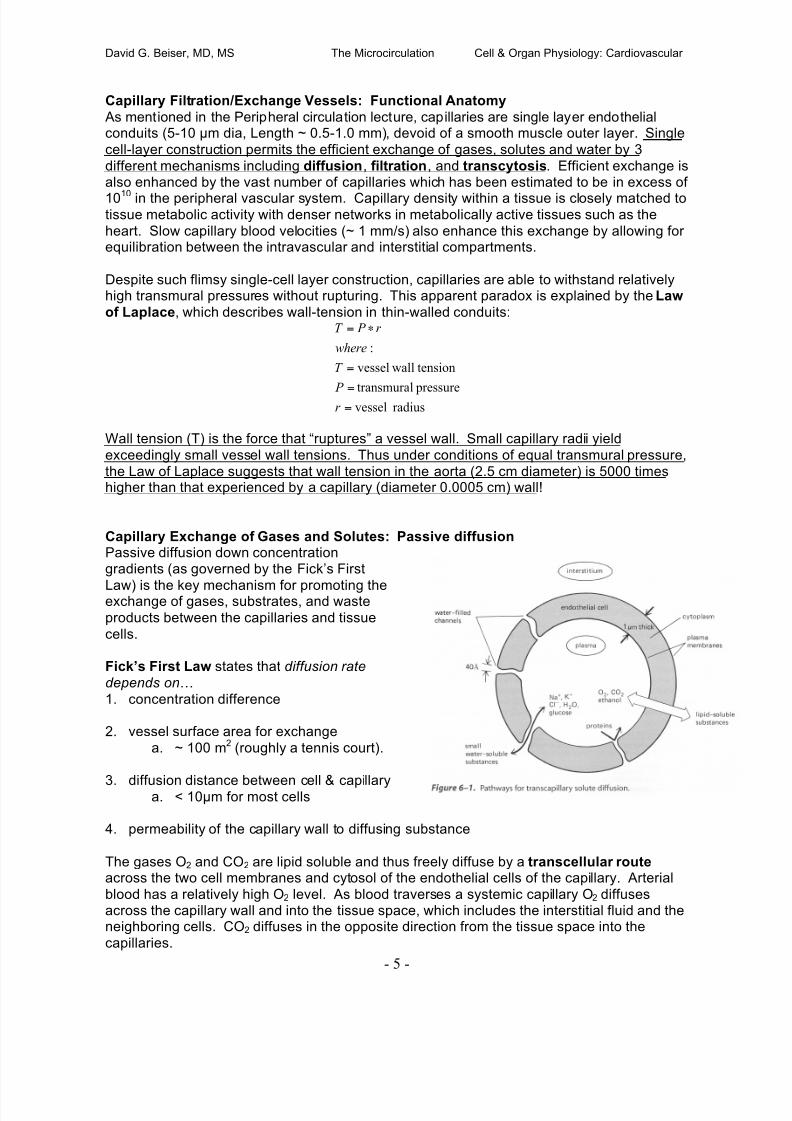
7/26/2019 Physio Coursepack 2016
http://slidepdf.com/reader/full/physio-coursepack-2016 129/282
David G. Beiser, MD, MS The Microcirculation Cell & Organ Physiology: Cardiovascular
- 5 -
Capillary Filtration/Exchange Vessels: Functional Anatomy
As mentioned in the Peripheral circulation lecture, capillaries are single layer endothelialconduits (5-10 µm dia, Length ~ 0.5-1.0 mm), devoid of a smooth muscle outer layer. Single
cell-layer construction permits the efficient exchange of gases, solutes and water by 3
different mechanisms including diffusion, filtration, and transcytosis. Efficient exchange isalso enhanced by the vast number of capillaries which has been estimated to be in excess of
1010 in the peripheral vascular system. Capillary density within a tissue is closely matched totissue metabolic activity with denser networks in metabolically active tissues such as the
heart. Slow capillary blood velocities (~ 1 mm/s) also enhance this exchange by allowing forequilibration between the intravascular and interstitial compartments.
Despite such flimsy single-cell layer construction, capillaries are able to withstand relativelyhigh transmural pressures without rupturing. This apparent paradox is explained by the Law
of Laplace, which describes wall-tension in thin-walled conduits:
radius vessel pressureltransmura
tensionwallvessel
:
=
=
=
!=
r
P
T
where
r P T
Wall tension (T) is the force that “ruptures” a vessel wall. Small capillary radii yield
exceedingly small vessel wall tensions. Thus under conditions of equal transmural pressure,
the Law of Laplace suggests that wall tension in the aorta (2.5 cm diameter) is 5000 timeshigher than that experienced by a capillary (diameter 0.0005 cm) wall!
Capillary Exchange of Gases and Solutes: Passive diffusionPassive diffusion down concentrationgradients (as governed by the Fick’s First
Law) is the key mechanism for promoting theexchange of gases, substrates, and waste
products between the capillaries and tissue
cells.
Fick’s First Law states that diffusion rate
depends on!
1. concentration difference
2. vessel surface area for exchange
a. ~ 100 m2 (roughly a tennis court).
3. diffusion distance between cell & capillarya. < 10µm for most cells
4. permeability of the capillary wall to diffusing substance
The gases O2 and CO2 are lipid soluble and thus freely diffuse by a transcellular route across the two cell membranes and cytosol of the endothelial cells of the capillary. Arterial
blood has a relatively high O2 level. As blood traverses a systemic capillary O2 diffusesacross the capillary wall and into the tissue space, which includes the interstitial fluid and theneighboring cells. CO2 diffuses in the opposite direction from the tissue space into the
capillaries.

7/26/2019 Physio Coursepack 2016
http://slidepdf.com/reader/full/physio-coursepack-2016 130/282
David G. Beiser, MD, MS The Microcirculation Cell & Organ Physiology: Cardiovascular
- 6 -
(Mohrman & Heller)
Capillary permeability to small polar particles such as sodium and potassium ions is thought
to be mediated by small water-filled openings known as channels, pores, intracellular clefts,and fenestration. As mentioned previously, capillary endothelial cells are unable to contract;
however, they are able to change conformational shape in response to certain biochemical
stimuli through the action of actin/myosin fibers – yielding larger, leaky, pores. Individualpores are thought to be about 40 $ as solutes greater than that size do not freely diffuse in
healthy capillaries. Thus albumin and other plasma protein are normally confined to thecapillary lumen.
Capillary Exchange of Solutes: Transcytosis
Large macromolecules can cross the capillary at low rates through pores; however, a secondmechanism for macromolecular translocation is known as transcytosis. Transcytosis
involves creation of pinocytotic vesicles at the luminal or extracellular side of the plasma
membrane which get pinched off, shuttle through the cytoplasm, fuse with other vesicles, andfinally fuse with the opposite plasma membrane to release their contents. The laws ofdiffusion do not apply directly to this mechanism.
Capillary Exchange of Water (Filtration/absorption):
About 20 liters per day of water is thought to be filtered back and forth through capillaryendothelium through both water-selective channels known as aquaporins and through small(clefts) pores between adjacent endothelial walls. The Starling Equation estimates the
direction and magnitude of net water filtration across the capillary wall to the interstitium.
The equation simply computes the algebraic sum of outward pressures (hydrostatic +oncotic) and inward pressures (hydrostatic + oncotic) on water filtration and then andmultiplies this sum by a proportionality (or filtration) constant (k) to get the magnitude (and
units) correct:
where... Qf = rate of fluid movement from capillary lumen to interstitium (ml/min)
k = filtration constant (ml/min/mmHg)
Pc , Pi = hydrostatic pressure of capillarylumen and interstitium (mmHg)
!c , !i = colloid osmotic (or oncotic) pressureof plasma and interstitium
(Inward) (Outward)
)]()[(
!
+!+= ciic f P P k Q " "

7/26/2019 Physio Coursepack 2016
http://slidepdf.com/reader/full/physio-coursepack-2016 131/282
David G. Beiser, MD, MS The Microcirculation Cell & Organ Physiology: Cardiovascular
- 7 -
Water is also subject to the laws of
diffusion governing solutes and gases.While somewhat confusing to think
about, the diffusional exchange of H20
across the capillary beds is thought tobe on the order of 80,000 liters/day.
Thus, the diffusional exchange of H20occurs at a much higher rate than
filtration. However, this diffusionalexchange is not thought to contributesignificantly to the next movement of
H20. In other words, 80,000 litersdiffuse out of the capillaries, and 80,000
liters diffuse back in. DON’T GET
HUNG UP ON THIS POINT!
Lymphatic Drainage:
Water filtration at the arteriolar end ofcapillaries exceeds reabsorption at the
venular end by 2 to 4 liters/day. Underhealthy conditions, the lymphatic system isresponsible for returning most of this net
fluid and solute back to the intravascular
compartment in order to maintain a steadystate. Lymphatic flow also returns ~ 25-50% of total plasma proteins/day to the
vascular compartment each day. This flow
is augmented by skeletal musclecontraction. Lymphatics are absent from some tissues (e.g., myocardium, brain). They are
most prevalent in the skin and the genitourinary, respiratory, and gastrointestinal tracts. Thelarge lymphatic vessels, like the veins, have valves, which restrict the movement of lymph in
the retrograde direction. These large lymphatics ultimately drain into the left and rightsubclavian veins (via thoracic duct).

7/26/2019 Physio Coursepack 2016
http://slidepdf.com/reader/full/physio-coursepack-2016 132/282
David G. Beiser, MD, MS The Microcirculation Cell & Organ Physiology: Cardiovascular
- 8 -
Clinical Correlations: The Starling equation is never actually calculated in a clinical setting
because we do not have access to any of its variables; however, it is important to develop anunderstanding of the forces involved in water filtration in order to develop an intuitive feel for
the impact of the multitude of therapies and disease states which have the potential to impact
filtration.
For example, disease states such as severe burns, trauma, sepsis, toxic exposure andcardiac arrest increase capillary permeability, leading to significant increases in the filtration
constant, along with leakage of proteins into the interstitial space, increasing the interstitial
osmotic pressure ( ! i) -- an outward force. In the setting of normal blood pressures, this oftenleads to interstitial edema formation.
To enhance your filtration “intuition”, use the Starling relationship to predict the clinical impact
of the following diseases/therapies. Which conditions promote interstitial fluid (edema orascites) formation, vascular re-absorption, lymphatic flow or changes in filtration constant?
Write your answers schematically below:
• Severe dehydration (think salt and water deficit)
• Protein malnutrition (think plasma proteins)
• Intravenous albumin infusion
• Intravenous H 2 0 infusion
• Protein wasting disease state (e.g. nephrotic syndrome)
• Hemorrhagic shock
• Prolonged standing (why is standing different from walking?)
• Lymphatic blockage (e.g. following radical mastectomy or elephantitis --
beware “Google Image” search of this topic requires a strong stomach)
• Inflammation (think increased capillary leakiness)

7/26/2019 Physio Coursepack 2016
http://slidepdf.com/reader/full/physio-coursepack-2016 133/282
Jason Poston, MD Cell & Organ Physiology: CV physiology
CONTROL OF CARDIAC OUTPUT: VENTRICULAR-VASCULAR COUPLING
Recommended reading
Levy & Pappano:
! Chapter 7: The arterial system
! Chapter 10: Control of cardiac output: coupling of heart and blood vessels
KEY CONCEPTS
! The arterial system acts as a hydraulic filter. ! The compliance (change in volume per change in pressure) of the arterial system varies
from person to person, and tends to decrease with age.
! The blood pressure is determined by the amount of blood in the arterial system and thearterial compliance.
! Pulse pressure is proportional to stroke volume, and inversely proportional to arterialcompliance.
! The systemic vessels are responsible for providing the heart’s preload, and thus play amajor role in controlling cardiac output.
! Cardiac output and venous return are closely related and can only differ transiently.
So far we’ve discussed the heart and the blood vessels independently. Today we will stitchthem back together and begin to discuss how they interact to control the blood pressure and the
cardiac output.
THE ARTERIAL SYSTEM
The hydraulic filterLet’s begin with a brief discussion of the arterial system. Dr. Beiser has already described a
number of the properties of this system.
How does the body convert an intermittent cardiac output to a continuous flow at the capillary
level? It does so by ejecting the stroke volume into an array of elastic conduits in line with high-resistance terminals. The energy stored in the walls of the aorta and similar conducting vessels
serves to propel blood into the periphery during diastole as seen in the panel on the left below.
Systole
Diastole
If, however, you remove the aorta and other large conducting vessels and replace them with
lead pipes, the capillaries will no longer receive flow during diastole. This is because the walls of

7/26/2019 Physio Coursepack 2016
http://slidepdf.com/reader/full/physio-coursepack-2016 134/282
Jason Poston, MD Cell & Organ Physiology: CV physiology
2
the lead pipes are not distensible, and therefore cannot store any of the stroke volume to be
subsequently propelled peripherally during diastole.
Aging causes a stiffening of the aorta (a true “hardening of the arteries”; see the panel on theright above). This panel shows pressure-volume relationships for aortas obtained at autopsy
from humans in different age-groups. The pressure that results from the injection of a given
volume increases with age. This means that aging causes the aorta to become less compliant:
Compliance = ! volume! pressure
What makes a blood pressure?The blood pressure is determined by the amount of blood in the arterial system and the arterial
compliance. As discussed above, arterial compliance varies between individuals, increasingwith age and with other conditions leading to hardening of the arteries. However, arterial
compliance is relatively constant for a given individual. Thus, blood pressure is regulated frommoment to moment chiefly by altering the arterial blood volume. This volume is determined by
the rate of inflow (the cardiac output) and the rate of outflow (the peripheral runoff). A sudden
increase in cardiac output will increase blood pressure (so long as peripheral resistance isconstant) because more blood is transferred from the venous circuit to the arterial system thanruns off from the arterial system to the venous circuit. Similarly, an increase in peripheral
resistance will increase the blood pressure (so long as cardiac output remains constant) byholding more blood on the arterial side.
The following figure from Levy and Pappano describes the measurement of the blood pressure
with a sphygmomanometer.
The relationship between pulse pressure and stroke volume
Dr. Beiser discussed how we can estimate the mean arterial pressure from the systolic and
diastolic blood pressures. Now let’s consider another concept, the pulse pressure:
pulse pressure = systolic BP – diastolic BP
Measurement of the blood
pressure. I still have my blood pressure cuff from medical
school. For the most part, it has
been used on my medicalschool roommates and my
family.

7/26/2019 Physio Coursepack 2016
http://slidepdf.com/reader/full/physio-coursepack-2016 135/282
Jason Poston, MD Cell & Organ Physiology: CV physiology
3
An increased pulse pressure—say, from 50 mm Hg (BP 120/70) to 80 mm Hg (BP 160/80)—
may indicate that the arterial compliance is reduced, as occurs in many older patients with so-called isolated systolic hypertension:
An increase in stroke volume may also increase the pulse pressure. Septic shock is an exampleof this phenomenon. Imagine a patient with a reduced blood pressure (80/30) but a robust pulse
pressure (50 mm Hg). In this case, mean arterial pressure is reduced because of the sepsis-
induced reduction in peripheral resistance. This reduced peripheral resistance decreases leftventricular afterload and allows the ejection of a greater stroke volume, reflected by a “wide”
pulse pressure.
Clinical correlation: We apply this principle regularly in the intensive care unit when we evaluate
patients with shock. Clinically, the patient with shock due to sepsis (serious infection) presents
with signs of an elevated cardiac output and peripheral vasodilation, with warm extremities,brisk capillary refill, bounding pulses, and a wide pulse pressure. Conversely, the patient with
shock due to hypovolemia or heart failure presents with signs of a reduced cardiac output andperipheral vasoconstriction, with cool extremities, sluggish capillary refill, thready pulses, and a
narrow pulse pressure.
Bonus: In your evaluation of a patient in shock, you determine that the patient is suffering from alow cardiac output form of shock. How can you distinguish hypovolemia from heart failure onphysical examination?
120
80
40
0Low Cardiac Output High Cardiac Output
Figure 7-12. For a given volume increment (V2 - V1), areduced arterial compliance (compliance B compliance A)results in an increased pulse pressure [(P4 - P1) > (P3 -P2)].
Aortic pressure tracing as seen in two
different clinical states. Pulse pressure is
proportional to stroke volume, and inversely
proportional to arterial compliance.

7/26/2019 Physio Coursepack 2016
http://slidepdf.com/reader/full/physio-coursepack-2016 136/282
Jason Poston, MD Cell & Organ Physiology: CV physiology
4
CONTROL OF CARDIAC OUTPUT: VENTRICULAR-VASCULAR COUPLING
Introduction
This next part can be a little tricky. Let’s take a moment to consider why this subject is worthdiscussing.
What is the cardiac output?
Cardiac output = stroke volume x heart rate
What are the determinants of stroke volume?
! Preload
• Afterload
• Contractility
Afterload is controlled through changes in arteriolar smooth muscle tone. Contractility, whichdescribes cardiac performance in the setting of a given preload and afterload, is an intrinsic
property of the heart, albeit one that can be modified by external influences such as sympatheticstimulation or drugs (e.g. digitalis). Preload determines myocardial fiber length and thus theforce of contraction.
Because the systemic vessels provide the heart’s preload, they play a major role incontrolling cardiac output.
The vascular function curveConsider a simplified model of the cardiovascular system. Let’s consider the heart as a single
pump. The heart pumps blood into the arterial system, which has high resistance, highpressure, low volume and low compliance. Blood passes through this circuit into the venous
system, which has low resistance, low pressure, high volume, and high compliance. If the heart
suddenly stops, what will happen?
PAPra Pla
P pl
CO2 O2
CO2 O2
In the moment immediately following cardiac arrest, blood flow will continue from the arterialsystem to the venous system, while the heart will no longer transfer blood from the venous side
to the arterial side. As a result, arterial pressure will fall, while venous pressure will rise.
Because the compliance of the venous system is approximately 20x that of the arterial system,
A simplified model of the cardiovascularsystem. Pra=right atrial pressure,
Pla=left atrial pressure, Ppl=pleural
pressure, P A=alveolar pressure.

7/26/2019 Physio Coursepack 2016
http://slidepdf.com/reader/full/physio-coursepack-2016 137/282
Jason Poston, MD Cell & Organ Physiology: CV physiology
5
the venous pressure will rise 1 mm Hg for every 20 mm Hg fall in arterial pressure. Ultimately,
the arterial and venous pressures will become equal. The pressure that results (whichunfortunately has more than one name) is the mean circulatory pressure (Pmc) or mean
systemic pressure (Pms). This pressure is determined by the volume of blood in the systemand the compliance of the system.
If the heart is restarted, what will happen? The heart will begin to transfer blood from the high
compliance, high volume venous system to the low compliance, low volume arterial side. Thepressure on the venous side will fall, but much more slowly than the arterial pressure will rise(1/20th the rate, in fact). The mirror image of the above experiment is the result. In fact, this
experiment can be performed in dogs by replacing the heart with a mechanical pump, permittingprecise control of the cardiac output. The change in central venous pressure produced bychanges in cardiac output can be plotted on a vascular function curve.
Pms is affected by changes in blood volume or venomotor tone. In fact, the regulation of
venomotor tone is one of the principal mechanisms by which the cardiac output is controlled.The vascular function curve is shifted leftward or rightward in response to decreases or
increases in blood volume or venomotor tone, respectively (see panel on the left below). The
slope of the vascular function curve is affected by changes in peripheral resistance, withincreases in resistance resulting in a clockwise rotation of the curve (see panel on the rightbelow).
Figure 10-3. Changes in central venous pressure producedby changes in cardiac output. The mean circulatory pressure
(or static pressure), Pmc, is the equilibrium pressurethroughout the cardiovascular system when cardiac output is0. Points B and A represent the values of venous pressure atcardiac outputs of 1 and 5 L/min, respectively.
Figure 10-5 The changes in arterial (Pa) and centralvenous (Pv) pressures produced by changes in
systemic blood flow (Qr) in a canine right-heartbypass preparation. Stepwise changes in Qr wereproduced by altering the rate of a mechanical pump.(From Levy MN: Circ Res 44:739, 1979.)

7/26/2019 Physio Coursepack 2016
http://slidepdf.com/reader/full/physio-coursepack-2016 138/282
Jason Poston, MD Cell & Organ Physiology: CV physiology
6
These curves are also called venous return curves. Venous return is really another way ofsaying “cardiac output”, but applies to the blood flow returning to the heart. The equation for
venous return is:
Venous return = Pms – RA pressure
Resistance to venous return
Pms thus is the driving pressure for venous return. An increase in Pms, as with transfusion orincreased venomotor tone, will increase venous return, as will a decrease in resistance to
venous return (RVR). An example of the latter is the opening of an abdominal arterio-venous
fistula between the aorta and inferior vena cava, causing a large fraction of the cardiac output totraverse a low resistance circuit. Septic shock is another example of a condition characterized
by a reduction in peripheral resistance, when poorly understood metabolic factors cause a largenumber of small, low-resistance, arteriovenous shunts to be opened. Conversely, an increase in
peripheral resistance will decrease venous return.
Ventricular-vascular coupling
You already know the cardiac function curve. It is an extrapolation of the Frank-Starlingrelationship to the entire heart, and it describes cardiac output as a function of preload—in thiscase, central venous pressure. It is possible to analyze the coupling between the heart and
systemic vessels by plotting the cardiac function curve and vascular function curve (also calledthe venous return curve) on the same axis:
The equilibrium point occurs at the intersection of these two curves. At steady state,
cardiac output equals venous return. Perturbations in the system may cause transientdeviations from this point. Ultimately, however, a new equilibrium point is established. Thefollowing panels illustrate perturbations in the system:
Figure 10-8. Typical vascular and cardiac function curvesplotted on the same coordinate axes. Note that to plotboth curves on the same graph, the X and Y axes for thevascular function curves had to be reversed. Thecoordinates of the equilibrium point, at the intersection of
the cardiac and vascular function curves, represent thestable values of cardiac output and central venouspressure at which the system tends to operate. Anyperturbation (e.g., a sudden increase in venous pressureto point A) institutes a sequence of changes in cardiacoutput and venous pressure that restore these variablesto their equilibrium values.

7/26/2019 Physio Coursepack 2016
http://slidepdf.com/reader/full/physio-coursepack-2016 139/282
Jason Poston, MD Cell & Organ Physiology: CV physiology
7
PRA (mmHg)
V e n o u
s R e t u r n ( C O ) l / m i n
0 10
PRA (mmHg)
V e n o u s R e t u r n ( C O ) l / m i n
0 10
Let’s take the example of reduced myocardial contractility and consider it in more detail in thepanel below. Immediately after a reduction in myocardial contractility—say, from acutemyocardial ischemia—the cardiac output will be reduced (A to B). As a result, the transfer of
blood from the venous side to the arterial side will also be reduced. This net transfer of blood to
the venous side will increase cardiac preload, causing a consequent increase in cardiac output(B to C). Because this point is still below the intersection point of the two curves, the drivingpressure for blood flow from the arteries to the veins across the peripheral resistance will
continue to transfer blood to the veins at a rate greater than the heart can transfer blood fromthe veins to the arteries. With each subsequent beat, however, venous pressure rises, further
increasing the cardiac output (although not back to baseline), until the new equilibrium point isreached.
Clinical correlation: A patient with this condition may have physical examination signs of a
reduced cardiac output (e.g. reduced pulse pressure from reduced stroke volume) and elevated
right atrial pressure (jugular venous distension).
PRA (mmHg)
V e n o u s R e t u r n ( C O ) l / m i n
0 10
A
B
C
D
Blood transfusion. The vascular
function curve is shifted to the right.The new equilibrium point (arrow) isshifted upward and to the right, at a
higher cardiac output and centralvenous (right atrial) pressure.
Reduced myocardial contractility.
The cardiac function curve is shiftedto the right. The new equilibriumpoint is shifted downward and to the
right, at a lower cardiac output andhigher central venous (right atrial)
pressure.
Reduced myocardial contractility. See text for details.

7/26/2019 Physio Coursepack 2016
http://slidepdf.com/reader/full/physio-coursepack-2016 140/282
Jason Poston, MD Cell & Organ Physiology: CV physiology
8
Here’s a great example of how the systemic vessels control the cardiac output. Remember,
Pms is the driving pressure for venous return. Here’s the equation again:
Venous return = Pms – RA pressurePeripheral resistance
As Pms is reduced, the driving pressure for venous return is reduced. As less blood returns tothe heart, the preload will fall, leading to a reduction in cardiac output. How might Pms fall? One
way would be to lacerate your carotid artery with a razor in a shaving accident. As Dr. Beiser willdiscuss and as you will examine in the laboratory session, the body compensates for this acute
blood loss through a variety of mechanisms including an increase in sympathetic tone.
Venoconstriction reduces the compliance of the venous system, increasing Pms (remember, 2/3of the blood is in the veins, so squeezing the veins can affect Pms). In addition, sympathetically-
mediated constriction of the resistance vessels in the skin diverts blood flow away from the skinand toward the general circulation and vital organs. This further increases Pms and mitigates
the adverse consequences of hemorrhage. You will see what happens when the autonomicnervous system is “deactivated” in the laboratory.
If you put the two pumps—the right and left ventricles—in series, the analysis becomes a littlemore complicated. Still, it uses the same techniques we have just applied. Briefly, if leftventricular function is suddenly reduced—say, by an acute reduction in blood flow due to
occlusion of the left anterior descending coronary artery—the immediate consequence will bethat left ventricular cardiac output will fall, while right ventricular cardiac output remains the
same. This disparity in ventricular outputs will result in a progressive increase in left atrialpressure, tending to restore left ventricular cardiac output to normal through the Frank-Starling
mechanism. At the same time, there will be a progressive fall in right atrial pressure, decreasingright ventricular cardiac output through a reduction in preload. Ultimately, a new equilibrium
point is achieved characterized by an increased pulmonary venous pressure and a reduced—
but equal—cardiac output for the two ventricles.
Clinical correlation: An increase in left atrial pressure can have serious clinical consequences.This pressure is transmitted back to the lungs, causing a rise in capillary hydrostatic pressure
that, if sufficiently high, can lead to transudation of fluid into the lungs. This condition, calledpulmonary edema, can result in hypoxia and an increase in the work of breathing.
Remember the Starling equation from Dr. Beiser’s lecture?

7/26/2019 Physio Coursepack 2016
http://slidepdf.com/reader/full/physio-coursepack-2016 141/282
David G. Beiser, MD, MS Autonomic Regulation Cell & Organ Physiology: Cardiovascular
- 1 -
C V P
M A P
C V P
M A P
SVR: systemic vascular resistance
CO: cardiac output (L/min)
MAP: mean arterial pressure
CVP: central venous pressure
CO
CVP MAP
Q
P P SVR
venousarterial !
=
!
=
Autonomic Regulation of the Heart and Circulation
Recommended reading
Levy & Pappano:
! Chapter 5: Regulation of the Heartbeat
! Chapter 9: Peripheral Circulation (pp. 170-177)
Mohrman & Heller (Lange Series): Cardiovascular Physiology 6th Edition (optional)! Chapter 7: Vascular Control (pp. 129-135)
! Chapter 9: Regulation of Arterial Pressure (pp. 161-182)
Objectives
1. Describe cardiovascular autonomic nervous system anatomy/innervation,2. Explain the effects of neurotransmitters/hormones on inotropy, chronotropy, and
vasomotor tone.3. Compare & contrast autonomic vs. autoregulatory (intrinsic) control mechanisms
4. Predict response of individual autonomic reflexes to environmental stress
5. Predict integrated autonomic reflex responses to environmental stress
INTRODUCTION
As discussed in the “Peripheral Circulation” lecture, homeostatic autoregulation mechanisms work independently to optimize local the tissue perfusion conditions in the face
of variations in flowrate and pressure. Accordingly, autoregulation mechanisms alone areinsufficient for the task of defending the perfusion in critical organs. Such coordinated control
is provided by the autonomic nervous system (ANS), which regulates blood pressurethrough an elegant system of sensory organs and feedback control mechanisms. Here we
discuss a few of the major cardiovascular reflexes that provide short-term regulation of
systemic blood pressure through rapid changes in vascular tone, heart rate and myocardialcontractility.
Determinants of Mean Arterial Pressure (review)
Recall from Ohm’s Law that mean arterial bloodpressure (MAP) is determined by cardiac output
(CO), central venous pressure (CVP) andsystemic vascular resistance (SVR).Furthermore, recall that cardiac output is
determined by the product of heart rate (HR)
and stroke volume (SV).
CO = HR x SV
The simplicity of these two formulae belies acomplex interaction of hemodynamic,
heterometric (i.e. ventricular-vascular coupling),autoregulatory, and autonomic factors thatultimately determine their instantaneous
solution on a beat-to-beat basis. Today we will review the autonomic factors controlling heart
rate, myocardial contractility, venous capacitance and arterial vasoconstriction that governMAP.
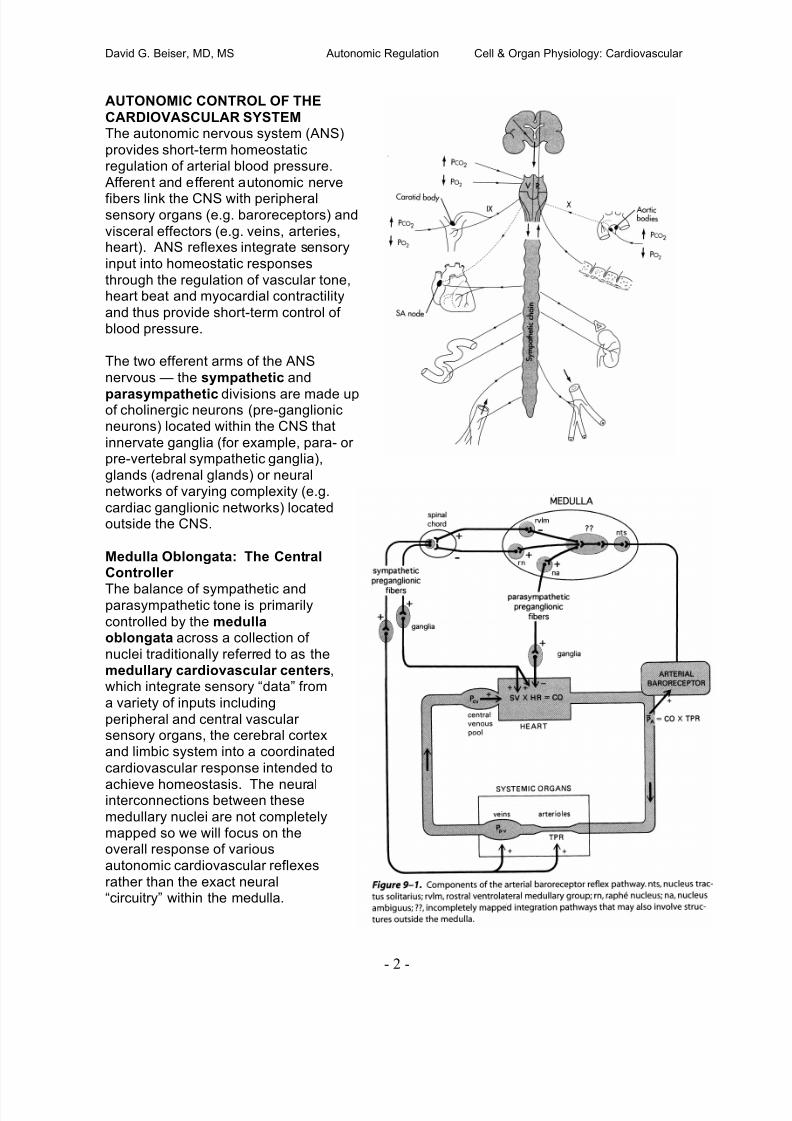
7/26/2019 Physio Coursepack 2016
http://slidepdf.com/reader/full/physio-coursepack-2016 142/282
David G. Beiser, MD, MS Autonomic Regulation Cell & Organ Physiology: Cardiovascular
- 2 -
AUTONOMIC CONTROL OF THE
CARDIOVASCULAR SYSTEMThe autonomic nervous system (ANS)
provides short-term homeostaticregulation of arterial blood pressure.
Afferent and efferent autonomic nerve
fibers link the CNS with peripheralsensory organs (e.g. baroreceptors) and
visceral effectors (e.g. veins, arteries,heart). ANS reflexes integrate sensory
input into homeostatic responses
through the regulation of vascular tone,heart beat and myocardial contractility
and thus provide short-term control ofblood pressure.
The two efferent arms of the ANS
nervous — the sympathetic and
parasympathetic divisions are made upof cholinergic neurons (pre-ganglionicneurons) located within the CNS that
innervate ganglia (for example, para- orpre-vertebral sympathetic ganglia),
glands (adrenal glands) or neuralnetworks of varying complexity (e.g.
cardiac ganglionic networks) locatedoutside the CNS.
Medulla Oblongata: The CentralController
The balance of sympathetic andparasympathetic tone is primarily
controlled by the medullaoblongata across a collection of
nuclei traditionally referred to as themedullary cardiovascular centers,which integrate sensory “data” from
a variety of inputs including
peripheral and central vascularsensory organs, the cerebral cortexand limbic system into a coordinated
cardiovascular response intended to
achieve homeostasis. The neuralinterconnections between these
medullary nuclei are not completelymapped so we will focus on theoverall response of various
autonomic cardiovascular reflexes
rather than the exact neural“circuitry” within the medulla.

7/26/2019 Physio Coursepack 2016
http://slidepdf.com/reader/full/physio-coursepack-2016 143/282
David G. Beiser, MD, MS Autonomic Regulation Cell & Organ Physiology: Cardiovascular
- 3 -
Cardiac adrenergic/cholinergic receptors, effectors and responses
Sympathetic (NE) Parasympathetic (ACh)
Cardiac Effector Receptor (Response) Receptor(Response)
SA Node !1 (tachycardia ++) M2 (bradycardia +++)
AV Node !1 ("conduction) M2 (#conduction)
myocardium !1 ("contractility +++) M2 (#contractility +)
coronary vessels $1 (constriction +++),
!2 (vasodilation +)
N/A
The nucleus tractus solitarious (NTS) is the principle integrative center for circulatory control,
receiving afferent inputs from peripheral sensors (e.g. baroreceptors & chemoreceptors) viathe sensory portions of the vagus (CN X) and glossopharyngeal (CN IX) nerves. Neurons
from the NTS make polysynaptic projections to efferent neurons mediating parasympatheticand sympathetic outflow.
Parasympathetic motor nucleiThe nucleus ambiguous (vagal motor nucleus) provides tonic parasympathetic tone to the
heart. Activation of the NTS by sensory afferents causes activation of interneuronprojections from the NTS to the nucleus ambiguous – thus increasing parasympathetic
outflow. Parasympathetic activation also involves inhibition the tonically-active sympathetic
RVLM nucleus of the medulla.
Sympathetic vasomotor areaCardiovascular sympathetic efferents originate in the tonically-active rostral ventrolateral
medulla (RVLM, or vasomotor area). The RVLM receives tonic inhibitory input from the NTS.Modulation of these inhibitory inputs will increase/decrease sympathetic outflow.
To summarize, the medullary cardiovascular centers consist primarily of:
• NTS – input area projects interneurons to other medullary centers
• Nucleus ambiguous (vagal motor nucleus)
o Tonic parasympathetic activation to heart (discussed below)
• Rostral ventrolateral medulla (RVLM)
o Provides tonic sympathetic activation to CV system (discussed below)
o Primarily inhibited by NTS
• Raphé nucleuso Inhibits spinal sympathetic outflow
Autonomic Cardiac Efferent Anatomy, Neurotransmitters, Hormones, Receptors,Effectors and Responses
The heart receives tonic inputs from both the sympathetic and parasympathetic divisions of
the ANS; however, under normal resting conditions, parasympathetic activity generallydominates. Fibers from both divisions project to the cardiac pacemaker cells of the sinoatrial(SA) node, atrioventricular (AV) node, myocardium and vascular endothelium.
Parasympathetic fibers also invest the vessels of the cranial (head) and sacral (genitalia,bladder and large bowel). The cardiac adrenergic (sympathetic) and cholinergic
(parasympathetic) receptors, effectors and responses are summarized in the table below:

7/26/2019 Physio Coursepack 2016
http://slidepdf.com/reader/full/physio-coursepack-2016 144/282
David G. Beiser, MD, MS Autonomic Regulation Cell & Organ Physiology: Cardiovascular
- 4 -
Parasympathetic Efferent Anatomy
Efferent fibers from the vagal motor nucleus travel via the vagus nerve to synapse with post-ganglionic cells on the epicardial surface or within the myocardium, primarily in the region of
the sinoatrial (SA) and atrioventricular (AV) nodes – the SA and AV nodes are the maineffectors of the parasympathetic cardiovascular response. Parasympathetic fibers also
project to a limited number of blood vessels in the cranial and pelvic regions.
Parasympathetic Efferent Response
The parasympathetic (cholinergic) response in the heart is mediated by acetylcholine whichis released by post-ganglionic neurons to bind to muscarinic, M2, receptors in the heart.
Binding of muscarinic receptors decreases heart rate, slows conduction and, to a much
lesser extent, decreases contractility.
Parasympathetic release of acetylcholine% 1. Binds M2 receptors primarily in cardiac Sinoatrial (SA) node
a. Induces bradycardia (or asystole when activation is strong)2. Decreased AV conduction (can cause heart block)
3. Partially antagonizes the release of norepinephrine from sympathetic nerve endings.
4. Decreases atrial contractility (& ventricular to small extent – not so clinically relevant)5. Vasodilation (primarily certain viscera such as the gut and pelvic organs)
Sympathetic Efferent AnatomyProjections from the RVLM synapse with preganglionic neurons in the lower cervical and
upper thoracic segments of the spinal cord and synapse with post-ganglionic neurons ateither the stellate or middle cervical ganglia. Post-ganglionic sympathetic fibers synapse
within the myocardium, vasculature and nodal regions of the heart. Pre-ganglionic fibersalso project to the adrenal medulla which can release circulating catecholamines (e.g.
epinephrine and norepinephrine) to preserve blood pressure in response to environmental
stress (humoral response described below). Also of major importance to the cardiovascularsystem, post-ganglionic sympathetic fibers invest
smooth muscle cells of the vast majority of the body’ssmall arteries, arterioles and veins. Exceptions to this
rule are discussed in the lecture on “SpecialCirculations.”
Sympathetic Efferent ResponseSympathetic outflow promotes increased blood
pressure and blood flow to vital organs (e.g. brain,
heart). The cardiac sympathetic response is primarilymediated by !1- adrenergic receptors whichpromote increased firing of the SA node, increased
conduction of the AV node and enhanced myocardial
contractility. Figure 5-20 displays the effect ofnorepinephrine infusion on left ventricular stroke
work. Note that for a given left-ventricular end-diastolic pressure (preload) stroke work increasesfollowing NE infusion. To a small extent, sympathetic
release of NE in the heart also binds coronary $1-
adrenergic receptors. However, the vasoconstrictiveeffect of this binding is thought to be largelyattenuated by autoregulatory vasodilation of coronary
arteries.

7/26/2019 Physio Coursepack 2016
http://slidepdf.com/reader/full/physio-coursepack-2016 145/282
David G. Beiser, MD, MS Autonomic Regulation Cell & Organ Physiology: Cardiovascular
- 5 -
Sympathetic release of NE in the heart%
1. Increases heart rate by activation of SA and AV nodes !1-adrenergic receptors2. Increases contractility via both !1-adrenergic receptors on cardiac cell membranes
and rate-related changes in intracellular Ca++ concentration.
3. Increases cardiac relaxation rate (i.e. lusitropy) during diastole4. Increases Pms (mean systemic pressure) through venous vasoconstriction
5. NET RESPONSE: Increases cardiac output
Clinical Correlation: The normal restingheart rate (~ 70 bpm) is determined
primarily by the firing rate of thesinoatrial (SA) node. While local factors
such as temperature and atrial stretchcan impact SA node firing rate, it is
primarily determined by the balance
between tonic sympathetic and parasympathetic outflow from the ANS.Stimulation of the vagus nerve
produces instantaneous release ofacetylcholine from nerve endings which
can slow or stop SA node firing and
slow AV conduction. Most often, anincrease in either sympathetic or parasympathetic tone is accompanied
by a concomitant reciprocal decrease in
the opposing division. In healthyindividuals at rest, parasympathetic
tone ordinarily prevails. This isdemonstrated in Figure 5-1 by blockade of parasympathetic tone (via atropine) which
produces marked tachycardia while blockade of sympathetic tone (using a beta-blocker)reduces heart rate only slightly.
Sympathetic Vascular Receptors, Effectors and Responses
Much of the body’s small arteries, arterioles and veins are invested with efferent fibers fromthe sympathetic division of the autonomic nervous system. These tonically-activesympathetic fibers deliver a basal level of norepinephrine (NE) which produces smooth
muscle vasoconstriction through peripheral "1-adrenergic receptors or relaxation through
!2-adrenergic receptors. While the end result is primarily vasconstriction, in some vascularbeds (such as skeletal muscle) the ratio !2 to "1 receptors is large and thus the end result is
vasodilation. The vessels of the brain and heart are thought to be only minimally responsiveto norepinephrine and epinephrine – accordingly, increased sympathetic tone promotesblood flow to these vital organs. Circulating (humoral) epinephrine, also plays an important
role in regulating vascular tone in response to environmental stress and will be discussed
below. NOTE: Only blood vessels in the cranial (head) and sacral (pelvic viscera) receive parasympathetic innervation.

7/26/2019 Physio Coursepack 2016
http://slidepdf.com/reader/full/physio-coursepack-2016 146/282
David G. Beiser, MD, MS Autonomic Regulation Cell & Organ Physiology: Cardiovascular
- 6 -
Sympathetic Humoral Response – “fight or flight” In addition to these organ-targeted projections, preganglionic neurons synapse with
chromaffin cells the adrenal medulla to control the release of humoral (epinephrine >>norepinephrine) sympathetic mediators. Epinephrine binds to ! receptors with greater affinity
than " receptors. Thus low to moderate concentrations of circulating epinephrine will
produce vasodilation while high concentrations lead to vasoconstriction.
Circulating epinephrine:1. Binds to ! >>$ -adrenergic receptors
2. Increases heart rate and myocardial contractility (& CO)
3. Augments venous constriction to increase Pms.4. Reduces systemic vascular resistance at low-moderate concentrations. While
somewhat confusing, this net decrease in resistance occurs because vasculareffects of epinephrine vary greatly in each bed depending on the proportion of $1-
receptors (constricting splanchnics, skin, renal vessels) and !2-adrenergicreceptors (dilating skeletal muscle vessels).
5. NET RESPONSE: Moderately increases mean arterial pressure (MAP)
Circulating norepinephrine:1. Higher affinity for $- than !-adrenergic receptors
2. Primarily causes vasoconstriction 3. NET RESPONSE: Increases MAP more than epinephrine
Circulating hormones: A variety of hormones including thyroid hormone, insulin and
glucagon can act to directly increase cardiac contractility and heart rate (thyroid1. Thyroid Hormone enhances myocardial contractility and increases heart rate
through the up-regulation of !-adrenergic receptors.
2. Insulin has direct positive inotropic effect on the heart independent of glucose.3. Glucagon is a potent inotrope which operates through mechanisms quite similar
to catecholamines
AUTONOMIC CARDIOVASCULAR REFLEXES Autonomic reflexes maintain
cardiovascular homeostasis througha variety of sensory receptors whichprovide the medulla with input
regarding, for example, arterial and
ventricular pressure(baroreceptors); arterial and central(medullary) PCO2 (chemoreceptors)
and atrial stretch. The baroreceptor
and stretch reflexes are mostrelevant to the control of cardiac
performance.
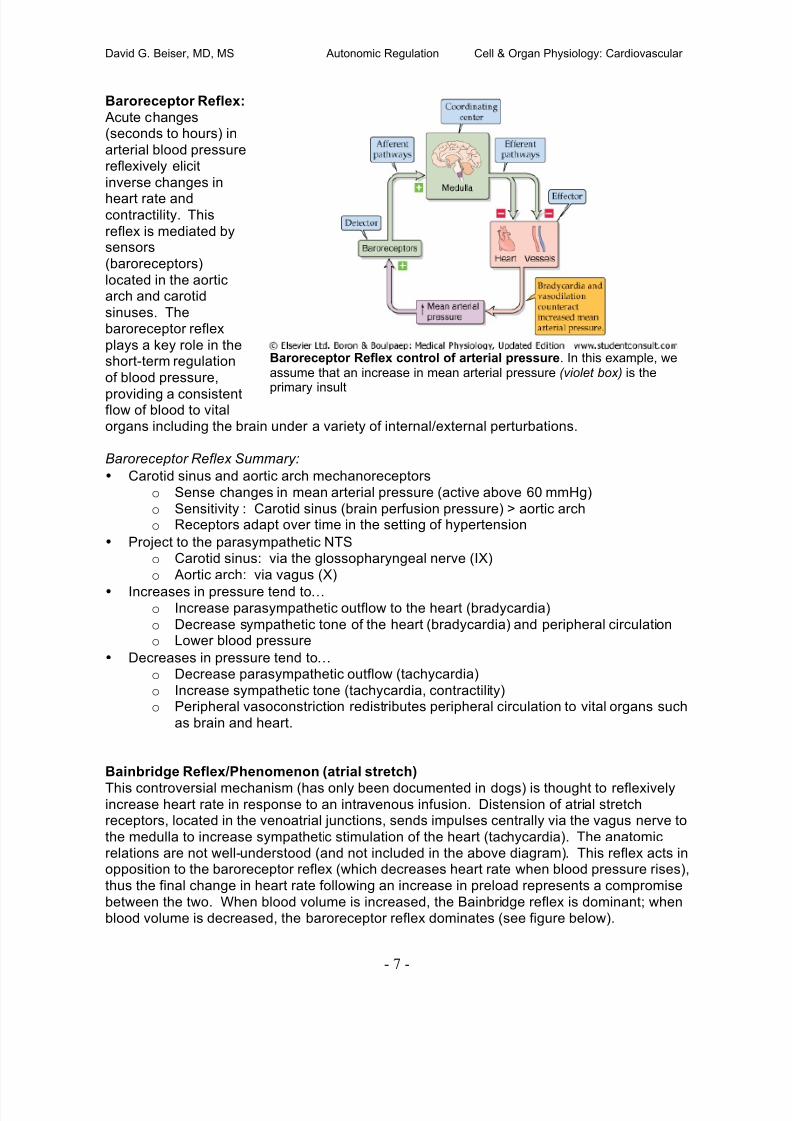
7/26/2019 Physio Coursepack 2016
http://slidepdf.com/reader/full/physio-coursepack-2016 147/282
David G. Beiser, MD, MS Autonomic Regulation Cell & Organ Physiology: Cardiovascular
- 7 -
Baroreceptor Reflex control of arterial pressure. In this example, weassume that an increase in mean arterial pressure (violet box) is the
primary insult
Baroreceptor Reflex:
Acute changes(seconds to hours) in
arterial blood pressurereflexively elicit
inverse changes in
heart rate andcontractility. This
reflex is mediated bysensors
(baroreceptors)
located in the aorticarch and carotid
sinuses. Thebaroreceptor reflex
plays a key role in theshort-term regulation
of blood pressure,
providing a consistentflow of blood to vitalorgans including the brain under a variety of internal/external perturbations.
Baroreceptor Reflex Summary:
• Carotid sinus and aortic arch mechanoreceptors
o Sense changes in mean arterial pressure (active above 60 mmHg)
o Sensitivity : Carotid sinus (brain perfusion pressure) > aortic archo Receptors adapt over time in the setting of hypertension
• Project to the parasympathetic NTS
o Carotid sinus: via the glossopharyngeal nerve (IX)
o Aortic arch: via vagus (X)
• Increases in pressure tend to% o Increase parasympathetic outflow to the heart (bradycardia)
o Decrease sympathetic tone of the heart (bradycardia) and peripheral circulationo Lower blood pressure
• Decreases in pressure tend to%
o Decrease parasympathetic outflow (tachycardia)
o Increase sympathetic tone (tachycardia, contractility)o Peripheral vasoconstriction redistributes peripheral circulation to vital organs such
as brain and heart.
Bainbridge Reflex/Phenomenon (atrial stretch)
This controversial mechanism (has only been documented in dogs) is thought to reflexivelyincrease heart rate in response to an intravenous infusion. Distension of atrial stretchreceptors, located in the venoatrial junctions, sends impulses centrally via the vagus nerve to
the medulla to increase sympathetic stimulation of the heart (tachycardia). The anatomicrelations are not well-understood (and not included in the above diagram). This reflex acts inopposition to the baroreceptor reflex (which decreases heart rate when blood pressure rises),
thus the final change in heart rate following an increase in preload represents a compromise
between the two. When blood volume is increased, the Bainbridge reflex is dominant; whenblood volume is decreased, the baroreceptor reflex dominates (see figure below).

7/26/2019 Physio Coursepack 2016
http://slidepdf.com/reader/full/physio-coursepack-2016 148/282
David G. Beiser, MD, MS Autonomic Regulation Cell & Organ Physiology: Cardiovascular
- 8 -
Bainbridge Reflex dominates at normal volumes. At lowvolumes, the response is dominated by the baroreflex.
Peripheral Chemoreceptor Reflexes:
In addition to the dominant baroreceptor reflex, a secondary reflex mediated by peripheralchemoreceptors plays a role in short-term regulation of blood pressure. The peripheral
chemoreceptors lie close to the baroreceptors. There are two types of peripheralchemoreceptors: the carotid bodies and the aortic bodies.
During normal physiology, this reflex is primarily involved in the regulation of respiration;however, to a lesser extent (and potentially only during times of severe hypoxia/ischemia) it
regulates heart rate and vascular tone. Peripheral chemoreceptors respond to changes in
the arterial blood PCO2 (hypercapnia), pH (acidosis) or PO2 (hypoxia) via specialized sensoryneurons located in the base of the carotid arteries (carotid bodies) and the arch of the aorta.
The peripheral chemoreceptor reflex is unique in that it involves a mixture of sympathetic and
parasympathetic outflow. Specifically, primary stimulation of these receptors inducessimultaneous sympathetic vasoconstriction of peripheral blood vessels while increasing vagal
outflow to the heart (producing bradycardia). In contrast, baroreceptors exert a negativedrive on the medullary vasomotor center (causing vasodilation) while also decreasing heartrate. When hypoxia and hypercapnia coexist (asphyxia) a more pronounced and synergistic
response occurs. Chemoreceptors also exist in the ventrolateral medulla (VLM) and raphe
nucleus. Central chemoreceptors respond primarily to changes in PCO2 and pH.

7/26/2019 Physio Coursepack 2016
http://slidepdf.com/reader/full/physio-coursepack-2016 149/282
David G. Beiser, MD, MS Autonomic Regulation Cell & Organ Physiology: Cardiovascular
- 9 -
Primary Response to Chemoreceptor Activation: Ventilation fixed
The Chemoreceptor Paradox
Chemoreceptor-induced bradycardia is difficult to demonstrate and only occurs whenventilation is fixed or inhibited (e.g. forced apnea or breath-holding). In fact, under real-life
conditions, hypoxia causes tachycardia. This is due to a complex interaction with thepulmonary system whereby chemoreceptors trigger respiration which in turn stimulates
pulmonary stretch recepters, triggering a reflex tachycardia. Thus the net effect of hypoxia inthe intact animal is tachycardia (see below figure).
Clinical Correlation: In a patient requiring intubation for respiratory compromise, difficultairway anatomy can occasionally lead to long periods of apnea while the physician struggles
to visualize, and correctly place, an endotracheal breathing tube in a patient with respiratoryfailure. During this period, respiration is typically inhibited pharmacologically leading to

7/26/2019 Physio Coursepack 2016
http://slidepdf.com/reader/full/physio-coursepack-2016 150/282
David G. Beiser, MD, MS Autonomic Regulation Cell & Organ Physiology: Cardiovascular
- 10 -
(Mohrman & Heller)
drops in arterial PO2 while PCO2 quickly rises – thus triggering the chemoreceptor reflex
leading to profound bradycardia, hypoperfusion and occasionally cardiac arrest. Pre-treating the patient with 100% oxygen and hyperventilation can forestall this response
dramatically. This response can also be ablated by atropine (frequently used in pediatrics).
Hormonal Reflexes (vasopressin and atrial natriuretic peptide)Stimulation of the atrial stretch receptors reduces the secretion of vasopressin (antidiuretic
hormone) by the posterior pituitary gland thus leading leading to increased urine volume.Synergistically with this action, atrial stretch causes the release of atrial natriuretic peptide
(ANP) which dilates resistance and capacitance vessels and promotes diuresis through
increased sodium/water excretion. Both of these actions serve to lower blood pressure.
EXTRINSIC CONTROL OF PERIPHERAL BLOOD FLOW:
Sympathetic Tone
Much of the body’s small
arteries, arterioles and veinsare invested with efferentfibers from the sympathetic
division of the autonomicnervous system. These
tonically-active sympatheticfibers deliver a basal level of
norepinephrine (NE) whichproduces smooth muscle
vasoconstriction through "1-
adrenergic receptors. Asmall minority of vessels,
primarily those subserved bycranial (head) and sacral
(genitalia, bladder and largebowel) spinal segments
receive parasympathetic input(although the parasympathetic division plays a prominent role in heart rate regulation – to becovered in a later lecture).
Sympathetic efferents originate from a complex of brainstem nuclei called the medullarycardiovascular center . Within this center, broad subdivisions can be distinguished such asthe vasomotor area and a cardioinhibitory area. This area integrates “data” from a variety
of peripheral and central sources including peripheral vascular “sensors”, central
chemoreceptors, the cerebral cortex and limbic system and offers a coordinatedcardiovascular response via targeted neural efferent projections and humoral (i.e. circulating)
factors (e.g. endogenous catecholamines such as epinephrine/norepinephrine) released fromthe adrenal medulla. This autonomic system of feedback and control mediates a variety ofcardiovascular reflexes (e.g. the baroreceptor reflex) which are important in the short-term
maintenance of adequate blood pressure through regulation of vascular tone, heart beat and
myocardial contractility. NOTE: The details of these cardiovascular reflexes and integrationwill be covered in a later lecture.

7/26/2019 Physio Coursepack 2016
http://slidepdf.com/reader/full/physio-coursepack-2016 151/282
David G. Beiser, MD, MS Autonomic Regulation Cell & Organ Physiology: Cardiovascular
- 11 -
Clinical Correlation: Blockade of this centrally-mediated basal sympathetic tone can occur
(e.g. following a cervical spinal cord injury) can produce marked hypotension.
--- DO NOT MEMORIZE THIS TABLE – It’s just here for reference --
Table 22-1. EFFECTS OF SYMPATHETIC AND PARASYMPATHETIC PATHWAYS ONTHE CARDIOVASCULAR SYSTEM
EFFECTORRESPONSE
ANATOMICPATHWAY
NEUROTRANSMITTERRELEASED ATEFFECTOR RECEPTOR
Tachycardia Sympathetic Norepinephrine !1 on cardiac pacemaker
Bradycardia Parasympathetic Acetylcholine M2 on cardiac pace-maker
Increase cardiac
contractility
Sympathetic Norepinephrine !1 on cardiac myocyte
Decrease cardiaccontractility
Parasympathetic Acetylcholine M2 on cardiac myocyte
Presynaptic M2 receptoron noradrenergic neuron
Vasoconstriction inmost blood vessels(e.g., skin)
Sympathetic Norepinephrine $1 on VSMC
Vasoconstriction someblood vessels
Sympathetic Norepinephrine $2 on VSMC
Vasodilation in mostblood vessels (e.g.,
muscle)
Adrenal medulla Epinephrine !2 on VSMC
Vasodilation in erectile
blood vessels
Parasympathetic Acetylcholine Presynaptic M2 receptor
on noradrenergic neurons
Acetylcholine M3 on endothelial cell
NO NO receptor (i.e., GC)inside VSMC
VIP VIP receptor on VSMC
Vasodilation in blood
vessels of salivarygland
Parasympathetic Acetylcholine M3 receptor on gland cell
Vasodilation in blood
vessels of muscle in"fight or flight" response
Sympathetic Acetylcholine Presynaptic M2 receptor
on noradrenergic neurons
NANC Receptor on VSMC
AC, adenylyl cyclase; cAMP, cyclic adenosine, monophosphate; GC, guanylyl cyclase;GIRK, G-protein-activated/inwardly rectifying K+ channel; NANC, non-adrenergic/non-cholinergic; NO, nitric oxide; NOS, nitric oxide synthase; PLC, phospholipase C; VIP,vasoactive intestinal peptide; VSMC, vascular smooth-muscle cell.

7/26/2019 Physio Coursepack 2016
http://slidepdf.com/reader/full/physio-coursepack-2016 152/282

7/26/2019 Physio Coursepack 2016
http://slidepdf.com/reader/full/physio-coursepack-2016 153/282
Jason Poston, MD Cell & Organ Physiology: CV physiology
2
Physical factors regulating coronary blood flow
! Autoregulation: Dr. Beiser discussed this concept in the peripheral circulation
lecture. The figure on the left below illustrates this phenomenon as it applies tocoronary blood flow.
! Mechanical compression of the blood vessels during systole. The contracting
myocardium squeezes blood vessels coursing through it. Thus, blood flow is highestduring early diastole. See the figure on the right below.
Neural and neurohormonal factors regulating coronary blood flow
Overall, these factors play are thought to play a minor role in the regulation of coronary bloodflow.
! Stimulation of sympathetic nerve fibers causes coronary artery vasoconstriction. Inaddition, sympathetic stimulation increases the heart rate, limiting the amount of time the
heart spends in diastole. Both of these processes tend to reduce coronary blood flow.Yet, sympathetic stimulation is associated with an overall increase in coronary blood
flow. Why? The reason is that sympathetic stimulation leads to an increase in heart rateand contractility with a consequent increased in metabolic demand. This increasedmetabolic demand dilates resistance vessels as discussed below, overcoming the
tendency toward reduced blood flow engendered by the processes above.
! Alpha recepors (constrictors) and beta receptors (dilators) are found on thecoronary vessels, and the coronary resistance vessels participate in the baroreceptorand chemoreceptor reflexes.
! Vagal nervous stimulation causes mild coronary artery vasodilation.
Clinical correlation: Transplanted hearts are denervated due to sectioning of the postganglionic
nerves that innervate the heart. As a result, transplant recipients are unable to sense cardiacpain due to loss of ventricular sympathetic afferents responsible for this sensation. In addition,this denervation limits exercise capacity. Still, it is remarkable that this loss of sympathetic
innervation is tolerated as well as it is. Interestingly, in many cases the heart undergoes
sympathetic reinervation, although this process is usually slow and not complete.

7/26/2019 Physio Coursepack 2016
http://slidepdf.com/reader/full/physio-coursepack-2016 154/282
Jason Poston, MD Cell & Organ Physiology: CV physiology
3
Metabolic factors regulating coronary blood flow
Coronary blood flow increases in direct proportion to myocardial metabolic activity. If
oxygen supply is not sufficient to meet the oxygen demand of the myocardium, vasodilatingsubstances are released. The metabolic mediators of vasodilation are unclear but likely include
CO2, hypoxia, lactate, K+, prostaglandins, the opening of ATP-sensitive K+ channels, and
vasodilating substances such as adenosine and nitric oxide.
Effects of diminished coronary blood flow
! Myocardial ischemia occurs when there is inadequate delivery of oxygen to the tissue.
The endocardium is typically more severely affected than the epicardium. This conditionmay affect the entire heart, as when the patient has a low blood pressure (say, fromhemorrhage) or a specific area of the heart. The latter may occur with coronary
atherosclerosis. In this condition, the diseased vessel may supply sufficient oxygen to
the tissue under resting conditions, but be unable to increase coronary blood flow inresponse to increased metabolic demand, as occurs during exercise. Angina and
reduced cardiac function may result. ! Myocardial infarction or necrosis occurs when myocardial ischemia is severe and/or
prolonged. Death of the tissue occurs.
! Myocardial stunning refers to a temporary reduction in myocardial contractility due to
a brief period of severe ischemia followed by reperfusion. ! Myocardial hibernation is a reduction in myocardial performance due to a
downregulation of metabolism in response to persistently decreased coronary blood
flow. Myocardial performance returns to normal once coronary blood flow is returned to
normal. ! Coronary collateral vessels develop in response to gradual and persistent reductions
in blood flow. Shear stress caused by increased blood flow velocity at sites of narrowingserves as the stimulus for angiogenesis.
Clinical correlation: A number of techniques have been developed to restore blood flow to the
heart in patients with coronary atherosclerosis. In coronary artery bypass graft surgery thediseased vessel (or vessels) is surgically bypassed using an artery (internal mammary artery) orvein (saphenous vein) harvested from another site. A technique referred to as angioplasty
involves the insertion of a balloon-tipped catheter into the diseased vessel. The obstructing
lesion is fractured and flattened as the balloon is inflated. Sometimes a stent is placed acrossthe diseased area to prevent future narrowing.
Coronary blood flow increasesin direct proportion to metabolic
demand.

7/26/2019 Physio Coursepack 2016
http://slidepdf.com/reader/full/physio-coursepack-2016 155/282
Jason Poston, MD Cell & Organ Physiology: CV physiology
4
THE PULMONARY CIRCULATION
Structure and function
The lung’s blood supply arises from two distinct circulations: the bronchial circulation and thepulmonary circulation. The bronchial circulation receives approximately 2% of the entire cardiac
output and supplies blood to the non-gas exchanging regions of the lung. Bronchial arteries
arise from the aorta and thus are under systemic pressure.
The principle role of the pulmonary circulation is essentially to permit a stream of blood to beexposed to a stream of gas, resulting in the oxygenation of mixed venous blood. Form follows
function in the pulmonary circulation, as illustrated by the observation that the pulmonary
arteries and the airways lie in close proximity to each other. The main pulmonary arterybranches into lobar arteries that enter the lungs at the hila and branch into ever-smaller arteries
and arterioles until terminating in a dense network of capillaries that intercalate with the alveoli.Oxygenated blood is collected by the pulmonary veins, which lie in the interlobular and
interlobar connective tissue septae, and eventually empty into the left atrium by way of fourlobar veins. In addition to permitting the oxygenation of blood, the pulmonary circulation
performs several additional vital functions, delivering substrates to the lung parenchyma,
activating and inactivating various vasoactive substances, filtering clot and microbes from theblood, and serving as a reservoir of blood for the left heart.
Pulmonary blood flowThe pulmonary circulation functions as a high-flow, low-resistance circuit that accommodates
the entire cardiac output at a pressure 1/7th that of the systemic circulation. Why the differencebetween the two circulations? Whereas high systemic pressures are necessary for supplying
blood to diverse sites at different flow rates, the pulmonary circulation is not required to adjustits blood flow to suit the needs of a variety of different microcirculations. Low pulmonary artery
pressures also ensure that transudation of fluid from the capillary bed into the lung is minimized,
thereby preserving gas exchange.
Pulmonary vascular resistance (PVR) can becalculated through the use of the following
relationship, which relates the resistance of acircuit to the pressure differential across the
circuit and the flow rate of the liquid (Ohm’s lawanalogy):
(Pa – Pb) = I * R
where (Pa – Pb) represents the pressure
difference across the circuit, I = the flow rate ofthe liquid, and R = resistance to flow. This
relationship can also be remembered as it iscommonly written for electrical circuits, V = IR, with V = voltage, which is analogous to pressure.The PVR can be calculated clinically through the use of a pulmonary artery catheter . This
long, slender catheter is typically inserted into a large central vein, such as the subclavian vein.
A small balloon on the tip of the catheter is inflated with air and the catheter tip is passedsequentially through the right atrium, right ventricle, and pulmonary artery, its passage guided
by pulmonary blood flow like a boat on a stream. Eventually, the tip of the catheter wedges intoa small pulmonary artery:
PPAPLA

7/26/2019 Physio Coursepack 2016
http://slidepdf.com/reader/full/physio-coursepack-2016 156/282
Jason Poston, MD Cell & Organ Physiology: CV physiology
5
Leff AR, Schumacker PT. Respiratory Physiology: Basics and Applications.
Because the balloon effectively blocks further pulmonary arterial blood flow in the small vessel
within which it is lodged, the pressure transducer at the tip of the catheter measures thepressure of the static column of blood that lies between the tip of the catheter and the left
atrium. This pressure is called the pulmonary capillary wedge pressure (PCWP), and usually
serves as a reasonably accurate approximation of left atrial pressure and, in the absence ofmitral valve disease, left ventricular end-diastolic pressure. The PCWP also reflects the outflow
pressure of the pulmonary circulation, and therefore can be used to calculate pulmonary
vascular resistance, utilizing two additional measurements obtained through this procedure, theinflow pressure (mean pulmonary artery pressure, MPAP) and pulmonary blood flow (cardiacoutput, as calculated using the thermodilution technique briefly discussed in our lecture on
the cardiac pump). By rearranging the general relationship shown above and inserting these
measured values, we can arrive at the formula used to calculate PVR:
(Pa – Pb) = I * R(MPAP – PCWP) = CO * PVR
PVR= (MPAP – PCWP)/CO**Multiplication by the constant 80 produces units in dyne x s x cm-5 .
The distribution of blood flow
Because the pulmonary blood vessels are not made of iron but are flexible, the distribution ofblood flow is affected by gravity. Transmural pressure (the pressure inside the vessel minus thepressure outside the vessel) increases with gravity from apex to base in an erect individual.
Blood vessels dilate in response to this increase in distending pressure. As a result, blood flow
to the base of the lung is greater than to the apex (see panel on the left below).
Blood flow per alveolusaccording to region of lung
(bottom, middle, or top).

7/26/2019 Physio Coursepack 2016
http://slidepdf.com/reader/full/physio-coursepack-2016 157/282
Jason Poston, MD Cell & Organ Physiology: CV physiology
6
In contrast to the pressures in the pulmonary circulation, the alveolar pressure is essentially the
same from top to bottom. When alveolar and vascular pressures are considered together, it isapparent that three zones of pulmonary blood flow exist. These are commonly referred to as
West zones, after the physiologist John West, who first described them.
• In the bottommost zone (zone III), pulmonary capillary pressure exceeds alveolarpressure. The driving gradient for flow is thus the pressure in the pulmonary artery minus
the pressure in the pulmonary vein.
• In the middle zone (zone II), alveolar pressure lies between pulmonary arterial andpulmonary venous pressures. Capillaries in this zone will flutter between the open and
closed states. The driving pressure for pulmonary blood flow in this zone is the
difference between the pulmonary arterial and the alveolar pressure.
• In the topmost zone (zone I), alveolar pressure exceeds intravascular pressures.
Capillaries are not perfused in this region.
Regulation of pulmonary blood flow is both passive & active
Regulation of blood flow in the pulmonary circulation is both passive and active. An example ofpassive regulation is provided by the response to exercise. During exercise, healthy youngindividuals may increase their cardiac output up to four-fold. Despite this, pulmonary arterypressure does not increase significantly. For this to be so, PVR must decrease. This occurs
through the distension and recruitment (e.g. opening) of small arterioles and capillaries. The
volume of blood contained in the lung may double during exercise, reflecting a significant
increase in the capacitance of the pulmonary blood vessels.
West zones. Pulmonary arteries are depicted on the left side of thefigure, while pulmonary veins are shown on the right. From top to
bottom are zones I, II, and III. Alveolar pressure is the same in all 3
zones. See text for details.

7/26/2019 Physio Coursepack 2016
http://slidepdf.com/reader/full/physio-coursepack-2016 158/282
Jason Poston, MD Cell & Organ Physiology: CV physiology
7
The graphs below show how a small increase in pulmonary arterial pressure is associated witha sizable reduction in PVR and increase in pulmonary blood flow via this mechanism:
Changes in lung volume also affect pulmonary vascular resistance. Pulmonary blood vessels
are very complaint. As a result, changes in transmural pressure cause them to be deformed
rather easily. Vessels that are surrounded by alveoli—so-called “alveolar vessels”—tend to be
crushed when you take a deep breath, as the expanding alveoli compress the vessels coursingbetween them (see figures below). On the other hand, vessels that are not surrounded by
alveoli—“extra-alveolar vessels”—dilate as you take a deep breath, as pleural pressure and thepressure in the interstitial space surrounding these vessels becomes more negative, pullingthem open. These effects on pulmonary vascular resistance oppose each other. Total
resistance is lowest at functional residual capacity (FRC), or the lung volume present at the endof a normal expiration (more on this in pulmonary physiology!).
Hicks GH. Cardiopulmonaryanatomy and physiology.

7/26/2019 Physio Coursepack 2016
http://slidepdf.com/reader/full/physio-coursepack-2016 159/282
Jason Poston, MD Cell & Organ Physiology: CV physiology
8
Active regulation of PVR, achieved by the active contraction or relaxation of smooth muscle,occurs in response to a number of diverse influences. The most important of these factors is the
alveolar oxygen tension. Alveolar hypoxia is a potent pulmonary artery vasoconstrictor. Thismechanism of hypoxic pulmonary vasoconstriction has been shown to be present in isolated
lung tissue, demonstrating that it requires neither systemic circulating mediators nor an intactnervous system for its expression. The precise mechanism for sensing and effecting this
response is still unclear. It appears that hypoxia acts directly on pulmonary vascular smooth
muscle cells, probably by inhibiting K+ channels, leading to smooth muscle cell depolarization,Ca2+ influx via voltage-gated Ca2+ channels, and smooth-muscle contraction. This mechanism is
critically important for matching ventilation with perfusion, serving to redirect blood flow awayfrom poorly ventilated areas to areas with higher oxygen tensions (more on this in pulmonary
physiology). Unfortunately, this mechanism can also lead to disease.
Can you think of situations or conditions in which hypoxic vasoconstriction may be harmful?
Why?
A number of other substances have been identified as important regulators of pulmonaryvascular tone. In fact, this resting tone appears to reflect a balance between vasodilating
substances like prostacyclin and nitric oxide, and vasoconstrictor substances such as
angiotensin II and endothelin-1. Next year I will have the opportunity to tell you more about theclinical importance of these mediators in the treatment of a disease called primary pulmonary
hypertension.
Of note, while the pulmonary blood vessels are innervated by the autonomic nervous system it
does not appear that neural regulation of pulmonary vascular tone is very important clinically.
TLC = total lung capacity (the volume of air in your lungs at the end of a maximalinhalation). RV = residual volume (the volume of air left in your lungs after you haveexhaled completely). Total resistance is lowest at FRC = functional residual capacity (seetext).

7/26/2019 Physio Coursepack 2016
http://slidepdf.com/reader/full/physio-coursepack-2016 160/282
Jason Poston, MD Cell & Organ Physiology: CV physiology
SPECIAL CIRCULATIONS (PART II)
Recommended reading
Levy & Pappano:
! Chapter 12: Special circulations
KEY CONCEPTS• The cutaneous circulation regulates body temperature and is chiefly regulated by the
sympathetic nervous system.
• The skeletal muscle circulation plays an important role in regulating blood pressure via the
baroreceptor reflex. While at rest this circulation is chiefly under sympathetic control, during
exercise metabolic factors heavily influence local blood flow.
• The brain governs its own blood flow, chiefly through metabolic mechanisms.
• The splachnic circulation is a reservoir of blood that may be mobilized in response to stress,
as in exercise or hemorrhage.
• The renal circulation helps “defend” cardiac output and mean arterial pressure, chiefly
through activation of the renin-angiontensin-aldosterone system in response to a decreasein renal perfusion.
In this lecture we will pick up where we left off on our coverage of special circulations.
CUTANEOUS CIRCULATION
• The primary function of the cutaneous circulation is to regulate core body temperature.
• Mechanisms of heat loss:
o Convective. Determined by:! Skin-air temperature gradient
! Cutaneous blood flow
o Evaporative. Determined by:
! Rate of sweat production
! Skin-air water vapor pressure gradient
• There are two types of resistance vessels in the skin: arterioles and arteriovenous
(AV) anastomoses.o Arterioles. Similar to arterioles elsewhere in the body in that they exhibit basal
tone and are controlled both by the sympathetic nervous system and local
regulatory factors. They exhibit autoregulation of blood flow and reactivehyperemia. An example of the latter can be seen when there is an increase in
skin blood flow (causing the skin to be very red) after a blood pressure cuff isdeflated. Still, sympathetic control is the most important influence.
o AV anastamoses. Shunt blood from arterioles to venules and venous plexuses.
Found principally in so-called “apical skin” (the fingertips, palms of hands, soles
of feet, toes, lips, nose, and ears). Vessels are richly innervated by sympathetic
fibers. Different from cutaneous arterioles in that they do not exhibit basal tone,are not under metabolic control, and do not exhibit autoregulation or reactivehyperemia.
• Cutaneous vessels respond both to changes in ambient temperature and to core bodytemperature.
o Placing your hand in ice water causes vasoconstriction locally and also in the
other extremities, whether or not a blood pressure cuff is inflated on the arm. If
the circulation is intact, however (e.g. the cuff is deflated), part of the reflex
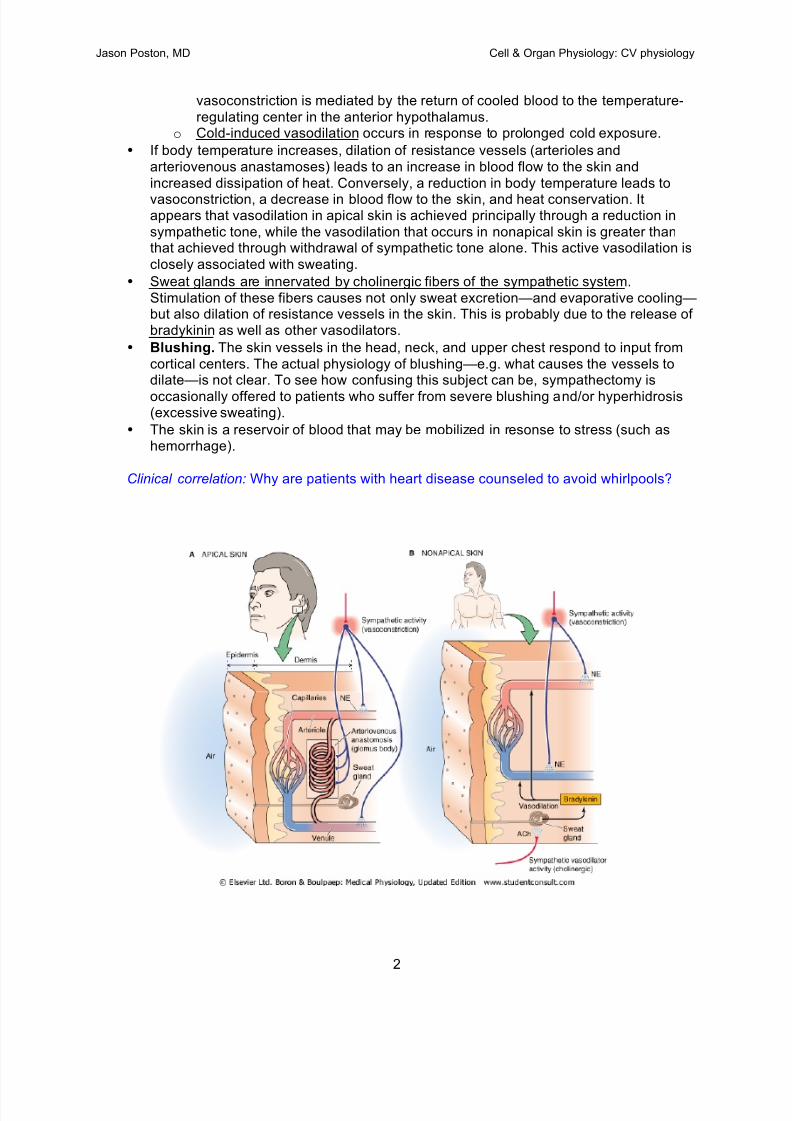
7/26/2019 Physio Coursepack 2016
http://slidepdf.com/reader/full/physio-coursepack-2016 161/282
Jason Poston, MD Cell & Organ Physiology: CV physiology
2
vasoconstriction is mediated by the return of cooled blood to the temperature-
regulating center in the anterior hypothalamus.o Cold-induced vasodilation occurs in response to prolonged cold exposure.
• If body temperature increases, dilation of resistance vessels (arterioles and
arteriovenous anastamoses) leads to an increase in blood flow to the skin and
increased dissipation of heat. Conversely, a reduction in body temperature leads to
vasoconstriction, a decrease in blood flow to the skin, and heat conservation. Itappears that vasodilation in apical skin is achieved principally through a reduction in
sympathetic tone, while the vasodilation that occurs in nonapical skin is greater thanthat achieved through withdrawal of sympathetic tone alone. This active vasodilation is
closely associated with sweating.
• Sweat glands are innervated by cholinergic fibers of the sympathetic system.
Stimulation of these fibers causes not only sweat excretion—and evaporative cooling—but also dilation of resistance vessels in the skin. This is probably due to the release ofbradykinin as well as other vasodilators.
• Blushing. The skin vessels in the head, neck, and upper chest respond to input from
cortical centers. The actual physiology of blushing—e.g. what causes the vessels todilate—is not clear. To see how confusing this subject can be, sympathectomy is
occasionally offered to patients who suffer from severe blushing and/or hyperhidrosis(excessive sweating).
• The skin is a reservoir of blood that may be mobilized in resonse to stress (such ashemorrhage).
Clinical correlation: Why are patients with heart disease counseled to avoid whirlpools?

7/26/2019 Physio Coursepack 2016
http://slidepdf.com/reader/full/physio-coursepack-2016 162/282
Jason Poston, MD Cell & Organ Physiology: CV physiology
3
SKELETAL MUSCLE CIRCULATION
• The vascular bed in the skeletal muscle is very large. As such, the arterioles in this bedcontribute significantly to peripheral resistance, and regulation of skeletal muscle
vascular tone plays an important role in regulation of the blood pressure and the
baroreceptor reflex.
• Regulation of skeletal muscle arteriolar tone is dominated by the sympathetic nervous
system at rest . Stimulation of alpha receptors on vascular smooth muscle via
norepinephrine released from sympathetic adrenergic neurons leads to arteriolar
vasoconstriction. Epinephrine released from the adrenal gland or during exercise
stimulates beta receptors, leading to vasodilation.• During exercise, local blood flow increases in response to increased metabolic demand
and the release of adenosine, lactate, and K+. In fact, muscle blood flow may increase
20x the resting level during exercise!
• Muscular contraction and one-way valves propel blood from the periphery to the heart.
The pumping action of skeletal muscle
promotes venous return.
Participation of the skeletal muscle
vascular bed in the baroreceptor reflex.

7/26/2019 Physio Coursepack 2016
http://slidepdf.com/reader/full/physio-coursepack-2016 163/282
Jason Poston, MD Cell & Organ Physiology: CV physiology
4
SOME THOUGHTS ON THE CEREBRAL, SPLACHNIC, AND RENAL CIRCULATIONS
You will cover these topics in more detail in your discussions of the brain, digestive system, and
kidney. However, there are a few “big-picture” points about each of these systems that are
worth discussing now, while we are considering the cardiovascular system as a whole.
CEREBRAL CIRCULATION• The brain is extremely intolerant of hypoxia—more so than any other tissue in the body.
• The brain governs its own blood supply.
• The volume of blood and extravascular fluid in the brain must be kept relatively constant.Otherwise, the pressure within the cranium—a rigid structure—would rise to dangerous
levels. Autoregulation is important in maintaining constant cerebral blood flow.
• Cerebral blood flow is mostly controlled via metabolic factors, including CO2 (a
vasodilator), adenosine, and K+.
SPLACHNIC CIRCULATION
• The splachnic circulation supplies the gastrointestinal tract, spleen, liver, and pancreas.
• The mechanisms of blood flow regulation are complex and vary from organ to organ.
• Food intake increases splanchnic blood flow from 30-100%.
• The splachnic circulation is both a reservoir of blood and a site of adjustable resistance.
• Sympathetic efferents of the enteric nervous system cause vasoconstriction of thesplachnic circulation and mobilization of blood to the central circulation in response to
exercise and hemorrhage.
Clinical correlation: Why shouldn’t you exercise soon after eating?
Local blood flow increases in response to increases inneuronal activity and metabolic demand.

7/26/2019 Physio Coursepack 2016
http://slidepdf.com/reader/full/physio-coursepack-2016 164/282
Jason Poston, MD Cell & Organ Physiology: CV physiology
5
RENAL CIRCULATION
The renal circulation will be discussed in detail in renal physiology. For now, I only want you to
appreciate that a considerable amount of interaction exists between the cardiovascular system
and the kidneys. One example follows:
A decrease in mean arterial pressure and therefore renal perfusion pressure is sensed by
mechanoreceptors in the afferent arterioles of the kidney. This stimulus activates the renin-angiotensin-aldosterone system, leading to a number of responses that attempt to restore
arterial pressure to normal. These responses include increased renal sodium reabsorption,
leading to an increase in blood volume. This increased blood volume leads directly to anincrease in mean arterial pressure and also to an increase in venous return, which increasescardiac output through the Frank-Starling mechanism. This increase in cardiac output increases
mean arterial pressure and improves renal perfusion. Angiotensin II also constricts veins and
arterioles, increasing venous return and peripheral resistance, and thereby also increasingmean arterial pressure.
To summarize:
• Decreased renal perfusion (as in hemorrhage or dehydration) leads to activation of the
renin-angiotensin-aldosterone system.
• The activation of this system leads to increased sodium reabsorption.
• Angiotensin is released and acts as a vasoconstrictor.
• These effects tend to restore cardiac output and mean arterial pressure towards normal.
Local blood flow increases in response to increases in
neuronal activity and metabolic demand.

7/26/2019 Physio Coursepack 2016
http://slidepdf.com/reader/full/physio-coursepack-2016 165/282

7/26/2019 Physio Coursepack 2016
http://slidepdf.com/reader/full/physio-coursepack-2016 166/282
Jason Poston, MD Cell & Organ Physiology: CV physiology
2
Hemorrhage evokes the following compensatory mechanisms: the baroreceptor reflex,
chemoreceptor reflexes, cerebral ischemic responses, reabsorption of tissue fluids, release ofendogenous vasoconstrictor substances, and renal conservation of salt and water. The major
elements of these mechanisms are considered below.
! A reduction in mean arterial pressure and pulse pressure decreases the stimulation of the
carotid sinus and aortic arch baroreceptors, leading to ! vagal tone and "sympathetic tone.This results in an increase in heart rate and contractility. The increase in sympathetic tone
also causes venoconstriction, increasing Pms and increasing the driving pressure forvenous return (and thus increasing preload). Vasoconstriction of blood vessels in the skin,
liver, and lungs diverts blood flow from these organs to the general circulation, further
augmenting Pms, and to the brain and heart.
! Chemoreceptors are stimulated by local tissue hypoxia due to inadequate blood flow,
increasing peripheral vasoconstriction. Hypoxia also stimulates respiration, aiding venousreturn.
! Cerebral ischemia from inadequate cerebral perfusion activates the sympathoadrenal
system, leading to a massive sympathetic discharge. With more severe hypotension,however, the sympathetic system may become depressed while vagal centers are activated,
provoking bradycardia and worsening hypotension.
! Reabsorption of tissue fluids occurs when arteriolar constriction and reduced venous
pressures reduce capillary hydrostatic pressures to the point where the net reabsorption ofinterstitial fluid occurs (Starling forces again!). The body may “autoinfuse” approximately 1liter per hour of interstitial fluid through this mechanism. The following figure depicts
changes in arterial blood pressure and plasma colloid osmotic pressure in response to
phlebotomy. The reduction in colloid osmotic pressure is due to hemodilution fromreabsorption of tissue fluid.
Venous return increases duringinspiration. Inspiration (in box) reduces
intrathoracic pressure (ITP, shown inupper panel), reducing the pressure inthe right atrium (RAP) and other greatvessels in the thorax. This increases the
driving pressure for venous return (Pms-
RAP), increasing superior vena cavaflow (SVCF, lower panel) and therebycardiac preload. JVP = jugular venous
pressure; FAP = femoral arterialressure.
Changes in arterial blood pressure and
plasma colloid osmotic pressure inresponse to phlebotomy.

7/26/2019 Physio Coursepack 2016
http://slidepdf.com/reader/full/physio-coursepack-2016 167/282
Jason Poston, MD Cell & Organ Physiology: CV physiology
3
! Release of the endogenous vasoconstrictors epinephrine and norepinephrine from theadrenal medulla, vasopressin from the posterior pituitary gland, and angiotensin II via
activation of the renin-angiotensin-aldosterone system.
! Renal conservation of salt and water in response to reduced renal perfusion and a
consequent reduction in the glomerular filtration rate. This reduces renal reabsorption of salt
and water. In addition, the renin-angiotensin-aldosterone system is activated, withaldosterone stimulating sodium reaborption.
Hemorrhage also activates a number of decompensatory mechanisms. These include:
! Cardiac dysfunction may result from a reduction in coronary blood flow due to hypotension(remember, the mean aortic pressure is the driving pressure for coronary blood flow).
Sympathetically mediated tachycardia also reduces coronary blood flow by reducing theamount of time spent in diastole. These reductions in coronary blood flow occur at the same
time that metabolic demand is increased due to an increase in (a) heart rate, (b) contractility,and (c) afterload (from increased peripheral resistance). Myocardial ischemia may result,
reducing cardiac function and causing further reductions in the arterial pressure. This may
lead to further reductions in coronary blood flow, invoking a positive feedback loop (in thiscase, a downward spiral ) that, uninterrupted, leads to death.
Clinical correlation: Older patients with preexisting coronary artery disease (and a decreasedability to increase myocardial blood flow) are more likely than younger patients to suffer a
myocardial infarction during the course of a gastrointestinal hemorrhage.
Bonus: which part of the heart is most likely to suffer this infarct? Why?
! Acidosis caused by tissue hypoxia leads to anaerobic metabolism and a lactic acidosis.The effects of acidosis on the cardiovascular system are controversial, but it overall reduces
cardiac function. It also reduces the sensitivity of the heart and resistance vessels to theeffects of catecholamines.
! Central nervous system depression may result from several reductions in cerebralperfusion, as discussed previously.
! Alterations in blood clotting (hypercoagulability initially, followed by hypocoagulability)
and depression of the reticuloendothelial system may also occur. The latter results in
decreased phagocytosis of endotoxins released by the normal bacterial flora of the intestinaltract. These endotoxins cause severe vasodilation by inducing arteriolar smooth muscledilation. We will not consider these mechanisms further.
Whether or not a patient survives hemorrhage depends on the severity of the hemorrhage, thestrength of the compensatory mechanisms relative to the decompensatory mechanisms, and
the presence of medical comorbidities. For instance, younger patients generally have strongercompensatory mechanisms than older patients.
Clinical correlation: Younger patients may lose an extraordinary amount of blood before their
blood pressure falls. This is due to the fact that their hearts are usually healthy and theircompensatory systems are robust. Yet, such a patient may actually be in shock, with criticallyreduced blood flow to the gut, kidney, and other vascular beds. The astute clinician will not be

7/26/2019 Physio Coursepack 2016
http://slidepdf.com/reader/full/physio-coursepack-2016 168/282
Jason Poston, MD Cell & Organ Physiology: CV physiology
4
deceived by the relatively normal blood pressure and will diagnose shock by way of other signs:
cold, clammy extremities (due to intense vasoconstriction), tachycardia, a reduced pulsepressure (indicating a reduced stroke volume), and tachypnea (due to activation of the
chemoreceptor reflexes from tissue hypoxia).
EXERCISE
The oxygen consumed by the body—VO2—may increase 60-fold with exercise. Thisdramatic increase in metabolic activity requires a significant increase in blood flow to exercising
muscles in order to supply oxygen and nutrients and eliminate carbon dioxide and other waste
products. The major cardiovascular responses are summarized below.
! Central command refers to a set of cardiovascular responses initiated when an increase inphysical activity is anticipated . These responses are initiated by the cerebral cortex and
result in an increase in sympathetic outflow to the heart and blood vessels and a decreasein parasympathetic outflow to the heart.
! Sympathetic activation increases cardiac contractility and heart rate while also increasingarteriolar resistance in the skin, kidneys, and splachnic bed, thereby diverting blood flow toexercising muscle. (Later, as core body temperature rises, blood flow to the skin increases
in order to dissipate heat). Coronary blood flow and skeletal muscle blood flow increase inproportion to metabolic demand through the release of vasoactive metabolites as discussed
previously. Skeletal muscle dilation decreases peripheral resistance and therefore leftventricular afterload, decreasing myocardial work and increasing stroke volume.
! Interestingly, a given increase in oxygen consumption requires a somewhat lesser increase
in muscle blood flow due to an increase in oxygen extraction in the tissues. This is
facilitated by enhanced unloading of oxygen due to a leftward shift of the oxyhemoglobindissociation curve as blood courses through skeletal muscle characterized by a reduced pH
and increased temperature.
! Chemoreceptors respond to changes in ambient pH, pCO2, and pO2, regulatingrespiratory responses (and to a lesser extent cardiovascular responses), increasing the
depth (and later in exercise, the rate) of respiration. This will be discussed in more detail inpulmonary physiology. Stimulation of these receptors also increases sympathetic tone.
! Actively contracting muscle stimulates intramuscular mechanoreceptors and local
chemoreceptors that send afferent fibers to the central nervous system, which increasessympathetic neural outflow.
! Venous return is aided by the respiratory and skeletal muscle pumps. An increase in
the rate and depth of respiration promotes venous return through a reduction in intrathoracicpressure (vide supra), while skeletal muscle contraction and one-way venous valves propel
blood back to the heart.
Why does the cardiac output increase during exercise?
The cardiac output may increase 6-fold during exercise. Remember the determinants of cardiac
output:
CO = SV x HR

7/26/2019 Physio Coursepack 2016
http://slidepdf.com/reader/full/physio-coursepack-2016 169/282
Jason Poston, MD Cell & Organ Physiology: CV physiology
5
Both the stroke volume and heart rate are increased during exercise. In fact, the increase inheart rate (say, from 60 to 180 in a young person) is considerably greater than the increase in
stroke volume (say, from 80 to 100). It is therefore tempting to conclude that an increase inheart rate is the principal mechanism for the increase in cardiac output. This is an
oversimplification, however. The evidence for this is as follows:
! Increasing the heart rate from 60 to 180 by electrical stimulation does not increase the
cardiac output in a resting animal. Thus, stroke volume decreases as the heart rateincreases and there is less time for filling. The animal’s cardiac output is therefore likely
chiefly controlled by the systemic vessels (which determine preload), which are
unaffected by pacing the heart.
! Dogs in whom the heart’s autonomic innervation has been ablated still experience an
increase in cardiac output during exercise, chiefly through an increase in stroke volume(although the heart rate does increase somewhat because of its response to circulating
catecholamines). Give that dog a beta-blocker (a beta-adrenergic receptor blockingagent), however, and exercise performance is impaired, probably because it prevents
catecholamine-induced increases in heart rate and contractility.
! Patients taking beta-blockers have reduced exercise capacity, but not so much as onemay think, so long as they have preserved cardiac function.
Thus, an increase in heart rate may contribute to an increase in cardiac output, but it is not theprinciple factor as it may appear from a simple analysis of the CO equation above.
Why can most of you run farther than I can?Training is associated with an increase in the maximum VO2 the individual can obtain, reflectingan increase in the capacity to perform sustained exercise. Training results in a lower resting
heart rate, a greater stroke volume, and a lower peripheral resistance. Sympathetic tone is
reduced, and parasympathetic tone is enhanced. Physical training also results in improvedoxygen extraction in the muscles, which also show an increase in capillary density and the
number of mitochondria. While all these phenomena are well known, the precise determinantsof exercise limitation are rather poorly understood.

7/26/2019 Physio Coursepack 2016
http://slidepdf.com/reader/full/physio-coursepack-2016 170/282
Jason Poston, MD Cell & Organ Physiology: CV physiology
6
Make notes here#
Cardiovascular responses to exercisethat involve the skeletal muscle.

7/26/2019 Physio Coursepack 2016
http://slidepdf.com/reader/full/physio-coursepack-2016 171/282
Jason Poston, MD Cell & Organ Physiology: CV physiology
7
Cardiovascular responses toexercise. A global view.

7/26/2019 Physio Coursepack 2016
http://slidepdf.com/reader/full/physio-coursepack-2016 172/282
REFERENCE PARAMETERS & CALCULATIONS
CARDIOVASCULAR PHYSIOLOGYCell & Organ Physiology
Systolic blood pressure (SBP) 100-140 mmHg
Diastolic blood pressure (DBP) 60-90 mmHg
Pulse pressure (PP=SBP-DBP) 30-50 mmHg
Mean arterial pressure (MAP) DBP + 1/3(PP)
Heart rate (HR) 60-90 bpm
Body surface area (BSA) 1.6-1.9 m2
Stroke volume (SV) 50-100 mL
Stroke index (SI) SV/BSA = 35-50 mL/m2
Right atrial pressure (~ central venous pressure) (Pra, CVP) 2-8 mmHg
Mean systemic pressure (Pms) 10-15 mmHg
Resistance to venous return (Rvr) 1-2 mmHg/L/min
Pulmonary systolic pressure 16-24 mmHg
Pulmonary diastolic pressure 5-12 mmHg
Pulmonary pulse pressure 8-15 mmHg
Mean pulmonary artery pressure (MPAP) 9-16 mmHg
Mean pulmonary capillary wedge pressure (PCWP) 5-12 mmHg
Cardiac output (CO = SV x HR) 4-6 L/min
Cardiac index (CI = CO/BSA) 2.5-3 L/min/m2
Systemic vascular resistance (SVR) 10-15 mmHg/L/minSVR = (MAP – Pra)/CO (900-1200 dyne*s/cm5)
Pulmonary vascular resistance 1.5-2.5 mmHg/L/minPVR = (MPAP – PCWP)/CO (120-200 dyne*s/cm5)
Venous return (VR) 4-6 L/minVR = (Pms – Pra)/Rvr

7/26/2019 Physio Coursepack 2016
http://slidepdf.com/reader/full/physio-coursepack-2016 173/282
L e c t u r e N o t e s
Module 3
Pulmonary PhysiologyHall, Naureckas, & Sattar

7/26/2019 Physio Coursepack 2016
http://slidepdf.com/reader/full/physio-coursepack-2016 174/282
1
Med Bio 303Cell and Organ PhysiologyRespiratory StaticsJanuary 27-28, 2014
In the beginning, life was easy (from the standpoint of cellular respiration). In single cells, entry
of oxygen into the cell and the exit of carbon dioxide occur through simple diffusion. Cellsconsume oxygen using aerobic metabolism and produce carbon dioxide. Oxygen tension
decreases intracellularly, creating a diffusion gradient with respect to the surroundingenvironment; oxygen enters the cell as a result of this gradient. As carbon dioxide builds up
within the cell, this creates a gradient in the opposite direction, with CO2 leaving the cell againthrough simple diffusion. (See figure 1)
As organisms become more complex and
energetic, these gradients quickly becomeexhausted due to local depletion of oxygen
and accumulation of carbon dioxide in thearea immediately around the cell.
Thus, an essential function of thecardiovascular and pulmonary systems is to
maintain these gradients to allow cellularrespiration to continue in a highly active
multi-cellular organism. Many of theadaptations that allow mammals to be so
successful, such as the four-chamber heart
and red cells lacking nuclei, developed tomake this process more efficient.Figure 1
Figure 2 to the right is a highly
simplified schematic representation ofthe lung. Ventilation moves oxygen
into the alveoli and carbon dioxide out(this movement is generated by the
muscles of the diaphragm and chestwall; more on this later). Oxygen
diffuses through the alveoli into the blood circulating in the pulmonary
capillary. The circulation delivers thisoxygen to the peripheral tissues. This
same circulation removes carbondioxide from the peripheral tissues,
which then diffuses back into the Figure 2
O2
CO2O
2 CO2

7/26/2019 Physio Coursepack 2016
http://slidepdf.com/reader/full/physio-coursepack-2016 175/282
2
alveoli. The bulk flow of air in and out of the lungs to maintain gradients at the alveolar levelrequires air movement and can best be understood from the standpoint of the statics and
dynamics of the lung. The study of statics refers to the forces acting on a body at rest. In the case
of the lung, this refers to those forces determining lung volumes.
Measurement of Lung Volumes
As the famous Scottish physicist Lord Kelvin stated, “When you can measure what you are
speaking about, and express it in numbers, you know something about it; but when you cannotmeasure it, when you cannot express it in numbers, your knowledge is of a meager and
unsatisfactory kind...” The beginning of such knowledge in respiratory physiology - the abilityto measure lung volumes in a consistent fashion - began with the water seal spirometer, first
invented by John Hutchinson in 1844. This device collects expired air between two cylindersusing water to seal the space in between. The volume of air moving into and out of the
spirometer was initially recorded on a rotating cylinder. In modern spirometers this data iscollected electronically using a mouthpiece that measures flow rather than volume.
Figure 3
Figure 3 above demonstrates a spirometry tracing. It would be worthwhile to study this figure asthese volumes and capacities will be referred to repeatedly in the following lectures (and are easy
targets for exam questions). In this graph time is plotted on the x-axis. Volume is plotted on they-axis; in this example volume inspired by the subject is positive and exhaled volume negative.
The volume that enters and exits the subject during quiet breathing is known as the tidal volume(TV). In normal tidal breathing inhalation is active and exhalation is passive. At the end of
passive exhalation the lung reaches a value known as the functional residual capacity. A capacityis made up of two or more volumes, in this case the expiratory reserve volume and the residual
volume. The expiratory reserve volume (ERV) is the amount of air that can be exhaled from theend of a normal tidal volume until no further air can be expired despite the subject’s greatest

7/26/2019 Physio Coursepack 2016
http://slidepdf.com/reader/full/physio-coursepack-2016 176/282
3
effort. The amount of air remaining in the lungs at this point is referred to as the residual volume(RV). Inspiratory reserve volume is the volume of air that can be inhaled in addition to a normal
tidal inspiration, i.e. once a normal inhalation is made; one continues to inhale until the lungs arefilled. This additional volume is the IRV.
In a vital capacity maneuver the subject inhales maximally from FRC (i.e. from the state at theend of a normal exhalation) and the lungs become fully inflated. The volume of air containedwithin the lungs at this point is the total lung capacity (TLC). The patient then exhales to RV
(i.e. exhales as much as possible). The total volume of air between these two values is the vitalcapacity (VC = ERV + TV + IRV). Note that the VC is a dependent value, because any process
that alters TLC or RV (including inadequate effort during the maneuver) will alter the VC.
Hutchinson demonstrated that lung volumes were proportional to height. It was later shown thatthese volumes also varied with age, with increasing values until early adulthood, followed by an
inexorable decline thereafter. By measuring lung volumes on a large number of individuals,regression equations can be use to determine a “predicted value” for any given a subjects age,
height and gender. The actual volumes for the subject can be divided by this predicted value toyield a “percent predicted”. One fortunate coincidence of pulmonary function testing is that two
standard deviations on either side of the mean, the normal range, correspond to roughly 80 to120% of the predicted value.
The problem with the use of spirometry to determine lung volumes becomes self evident when
one considers the RV as that volume which remains in the lung at the end of maximal exhalation.With spirometry alone one can directly measure the VC and the ERV, but not TLC, FRC or RV.
Two methods are commonly used to measure the amount of air within the lung without requiring
it to exit the lung. The first technique relies on inert gas dilution. This technique uses the
principle of conservation of mass. A known concentration of an inert gas such as helium isinhaled into the lung. The air constituting the TLC then dilutes this gas. The exhaledconcentration of gas can then be measured and TLC calculated.
C1!V1 = C2!V2 is the general form of the equation. Where C is concentration and V is volume.
[He]1!IV = [He]2!TLC is the form of the equation where [He] is the concentration of helium
gas.
Solving for TLC: TLC= IV!([He]1/[He]2), where IV = inhaled volume of gas = vital capacity
This method assumes that the helium gas distributes quickly and mixes completely with the aircontained within the lung. These conditions are violated in individuals with severe obstructive
diseases (e.g. COPD). Therefore TLC tends to be underestimated in subjects suffering fromthese conditions.
A second method of measurement utilizes a plethysmograph, or “body box”, to measure the FRC
directly using Plethysmography. To accomplish this, the subject is sealed within a closedcontainer, usually made of transparent plastic to minimize claustrophobia, and pants against a

7/26/2019 Physio Coursepack 2016
http://slidepdf.com/reader/full/physio-coursepack-2016 177/282
4
closed shutter, thereby compressing the air within the lung slightly. The pressure is thenmeasured both at the mouthpiece and within the box. Because the box is a closed system, the
amount by which the subject’s lungs (and hence chest wall) expand to accommodate the inspiredair will lower the volume of the box not occupied by the subject by the same amount, thereby
increasing the pressure within the box (remember the ideal gas law!). Plethysmography will be
demonstrated more fully during your workshop demonstration in the hospital.
By Boyles Law: P1V1 = P2V2; Where V1 is FRC and V2 = FRC + !V (the change in volume with
panting this value can be determined by the change in pressure within the box)
FRC!Patm = (FRC + !V) ! (Patm + !P) where !P = Change in pressure at the mouthpiece
FRC!Patm = FRC!Patm +FRC!!P+ Patm !!V + !V!!P
!V!!P is very small and can be neglected making it easy to solve for FRC
FRC = - Patm !!V/!P
Once FRC is known the remainder of the lung volumes can be obtained in combination withspirometry using simple arithmetic.
Determinants of Lung Volumes
Lung volumes are determined by the mechanical properties of the lung, the chest wall, and byrespiratory muscle strength. In order to best understand how these different components of the
respiratory system interact, we can start with a simple model of the lung as an elastic sphere.
The pressure within the lung is the alveolar pressure represented as PA. The pressure on theoutside of the lung is the intrapleural pressure PPl. The difference in pressure between the insideof the lung and the outside of the lung (PA – PPl) is known as the trans-pulmonary pressure. It is
this trans-pulmonary pressure that provides the distending pressure for the lung. Countering thisdistending pressure is the elastic recoil pressure of the lung. This pressure, which increases with
volume (think of a rubber band’s recoil force increasing as it is stretched out more and more), iscreated by the elastic elements of the lung. This force is additive to the intrapleural pressure
such that PA = Pel + PPl. In a staticsituation where the lung is held motionless
at any lung volume the transpulmonary pressure (Ptp) will be equal to the elastic
recoil pressure:PA = Pel + PPl
PPl = PA – Pel
Ptp = PA – PPl = PA – (PA – Pel)
Ptp = Pel
PelP A PPl
PtpPelP A PPl
Ptp
Figure 4

7/26/2019 Physio Coursepack 2016
http://slidepdf.com/reader/full/physio-coursepack-2016 178/282
5
At FRC, the natural resting point of the lung, The Pel is equal to about 5 cm of water. (A cm of
water is the amount of pressure is takes to raise a column of water within a manometer one cm)As the alveolar pressure will be zero, assuming an open glottis, the pleural pressure, using the
first equation above, must be -5cm of water, which is what is usually observed in normal lungs.
One of the important properties of the lung is lung compliance. Compliance is the relationship between the volumes and pressures within the respiratory system and is given by the formula:
C =!V/!P. Lungs are said to be compliant when a small change in pressure results in a largechange in volume. Stiff non-compliant lungs demonstrate only a small change in volume for a
given pressure.
Compliance is also dependent on the amount of lung available. Figure 5 demonstrates the effectof successively removing lung by surgical resection and its effect on lung compliance. The same
effect can be seen when individual alveoli are lost to atelectasis (collapse) or flooding withedema fluid.
Figure 5
Of note, compliance also has a large impact on the work of breathing. As you remember fromcollege physics, Work = Force x Distance. As pressure is expressed as F/cm
2 and Volume is

7/26/2019 Physio Coursepack 2016
http://slidepdf.com/reader/full/physio-coursepack-2016 179/282
6
expressed in cm3. The product of P x V, that is the change in volume induced by a change in
pressure, is expressed in units of work F x cm and is equal to the amount of work required to
effect that change in volume.
When discussing the recoil properties of the lung we have used the analogy of a rubber band
implying that stretch of elastic proteins within the walls of the alveoli and airways accountsentirely for PEL. In reality, the majority of the elastic recoil pressure in the intact lung is due tosurface tension, the inevitable consequence of being land mammals and the requirement for gas
exchange across an air liquid interface. The effects of an air liquid interface can be seen infigure 6 which depicts the pressure volume curve for the lung when inflated with air or with
saline. The x-axis depicts pressure as the independent variable and volume is on the y-axis.Two important differences can be note between these two graphs. The first is that it takes
significantly less pressure to inflate a saline filled lung than an air filled lung. The second is thatthe airway filled lung demonstrates significant hysteresis- that is that it requires higher pressures
to inflate the lung to a given pressure than is required to maintain the lung at a given volumeonce it is achieved. Both of these effects can be explained by the presence of surface tension and
the substance that has evolved to counteract surface tension: surfactant.
Figure 6.
In order to understand how surface tension is created we need to think in molecular terms.
Figure 7 demonstrates two separate atoms both with a nucleus and electrons. The electrons inthe atom will be of course tightly associated with the nucleus. The nucleus of each atom will
also be attracted to the electrons of the neighboring atom. This will cause the two atoms toapproach each other until the repulsive force of the electrons prevents the two nuclei from
coming any closer. This force is known as the Van der Waals force and the optimal distance thatresults in the lowest energy state is known as the Van der Waals radius. This is the force that
causes most matter together rather than gravity which is very weak at small scales. Water, whichmakes up a substantial portion of the surface lining fluid of the alveoli, is dipolar by virtue of the
fact that electrons are more strongly attracted to the oxygen nucleus within the molecule than thehydrogen nuclei resulting in the oxygen being slightly negatively charged with respect to the

7/26/2019 Physio Coursepack 2016
http://slidepdf.com/reader/full/physio-coursepack-2016 180/282
7
hydrogen atoms. This imbalance in electron distribution results in a relatively strong form ofelectrostatic attraction between molecules called hydrogen bonding.
Consider a glass of water. A water molecule situated in the center of the glass is subject to the
forces of hydrogen bonding to all of the water molecules surrounding it. Because these forces
are uniform in all directions, the net force on the water molecule will add up to zero. At thesurface of the water, however, the forces acting on any given molecule are asymmetrical due tothe presence of an air-liquid interface. The forces of the molecules on the surface of the glass
line up to result in a tension pulling inward, tension being simply a force per unit length.
If you take the water molecules from the surface of the glass and form them into a sphere, youhave created a bubble. Bubbles are spherical in shape as this shape results in the smallest surface
area for a given volume. A bubble remains stable due to the fact that as surface tension of thewater molecules reduces the surface area, the air trapped within the bubble becomes compressed
until the pressure within the bubble is in equilibrium with the surface tension. The relationship between the radius of a sphere and the pressure required to maintain that radius for a given
surface tension is:
P =2T/r where P is pressure within the bubble, T is the wall tension and r is the radius.
Note that as the radius of the bubble decreases, the pressure required to maintain the sphere at agiven radius increases in an inverse relationship. In a closed sphere equilibrium is achieved as
the volume within the sphere decreases inversely to the third power of the radius and theresultant compression of the air contained within the bubble quickly yields the necessary
pressure.
Now consider what happens when a hole is poked in the side of the bubble. In this circumstance
the air within the bubble leaks out and the system quickly becomes unstable as the pressurerequired to maintain the radius can no longer be maintained. In fact the bubble will continue toget smaller as the pressure required increases as the bubble shrinks. A bubble with a hole in it is
an exact analogy of an alveolus as there needs to be an opening in the wall of the alveolus forventilation to occur. Alveoli are inherently unstable.
The reason why we are able to breathe air and exchange oxygen and carbon dioxide across an air
liquid interface is the presence of surfactant. Surfactant had the property of having a variablesurface tension. It is made up of a number of components but the largest single component is
phosphatidylcholine a molecule with a hydrophilic head and hydrophobic tails. The hydrophilicheads dissolve in the surface lining fluid of the alveoli and float on the surface by virtue of the
hydrophobic component of the molecules. The charge on the hydrophobic component of themolecule is such that the molecules of phosphatidylcholine repel each other the more closely
they are compacted together stabilizing the alveolus. The net effect is an overall reduction insurface tension. The surface tension of water is approximately 80 dyne-cm whereas the
equilibrium surface tension of surfactant is close to 25 dyne-cm.
The importance of surfactant can be demonstrated by the condition known as respiratory distresssyndrome. In this syndrome infants who are born prematurely have not yet developed surfactant

7/26/2019 Physio Coursepack 2016
http://slidepdf.com/reader/full/physio-coursepack-2016 181/282
8
and are unable to open their alveoli in order to breath. In the era before mechanical ventilationwas available to provide an external pressure to force open the alveoli, this condition was
uniformly fatal. Artificial surfactants were developed in the 1980’s and have markedly reducedrespiratory complications in pre-term infants.
While we have been dealing with a relatively simplified model of the isolated lung, in reality(and thankfully) lungs are contained within the thorax coupled to the chest wall by negative pressure within the pleural space. To understand the mechanical interaction between the lung
and the chest wall it is instructive to consider each component separately. One property of lungmechanics is that the same result is obtained whether you apply a pressure internally by pushing
air into the airways with a syringe or by exerting a negative pressure around to lungs. Thisallows a pressure vs. volume curve for the lung to be created by inflating the lung to a series of
volumes and measuring the pressure required.
- Pressure (cm H2O) +
TLC
RV
Lung
- Pressure (cm H2O) +
TLC
RV
Lung
Figure 7
The overall theme for the lungs is that lungs want to get smaller. This is consistent with the
simplified elastic sphere model discussed above. Of interest is what happens when thetranspulmonary pressure becomes large or negative. When the transpulmonary pressure
decreases below zero, the lung volume does not decrease further. This occurs because the smallairways of the lung are tethered open by outward pull from inflated lung parenchyma. As the
lung deflates during exhalation, the pull on these small airways is progressively less, andeventually they close, trapping some gas in the alveoli. This effect is exaggerated with age,
especially with obstructive airways diseases, resulting in gas trapping at quite large lungvolumes. With higher pressures, the lung becomes increasingly stiffer with a greater amount of
pressure required for any change in volume. It is this stiffness at higher lung volumes thatmainly determines the total lung capacity.
A similar pressure/volume curve can be created for the chest wall. In this case the theme is that
the chest wall wants to get big. This is observed in the case of a pneumothorax, where airinadvertently enters the pleural space. Not only does the lung collapse inward, but the chest wall
will recoil outwards as evidenced by an increase in the space between ribs on a CXR. The lungis very compliant (big change in volume for a small change in pressure) at large lung volumes

7/26/2019 Physio Coursepack 2016
http://slidepdf.com/reader/full/physio-coursepack-2016 182/282
9
but much stiffer and less compliant at low lung volumes. In the absence of the airway closurementioned above, the mechanical properties of the chest wall tend to determine the residual
volume. - Pressure (cm H2O) +
TLC
RV
Chest Wall
- Pressure (cm H2O) +
TLC
RV
Chest Wall
Figure 8
Figure 8The pressure volume relationship can be determined by summing the pressures for the lung and
the chest wall at any given volume. This is shown by the yellow line in the diagram above. Notethat at FRC these pressures add up to zero consistent with its role as the natural resting point of
the lung; that is, the point at which the outward recoil of the chest wall is matched by the inwardrecoil of the lung. The balance of forces between the chest wall and the lung therefore
determines the lung volumes. In cases where the lung compliance is reduced (stiffer, more
elastic lungs) the lung will win the tug of war between itself and the chest wall and the FRC andother lung volumes will be smaller (See B above, showing fibrosis causing lower lungcompliance). In situations where the lung compliance is increased such as emphysema (See B
above), lung volumes are increased as the chest wall wins the battle.

7/26/2019 Physio Coursepack 2016
http://slidepdf.com/reader/full/physio-coursepack-2016 183/282
10
Left to its own devices, the lungs would settle at FRC and remain there forever if it were not forthe respiratory muscles. The musculature of the respiratory system is hugely overpowered with
respect to what is required to achieve TLC. In terms of pressure, it takes approximately -60 cmof inspirational pressure to move to the far end of the pressure volume curve above. Most
individuals can create pressures on the order of -200 cm of water. Similarly, significant
weakness in the muscles of exhalation needs to occur before RV is significantly decreased.When this does occur, residual volume rises and total lung capacity decreases resulting inmarked decreases in the vital capacity that is caught in-between.
Figure 9
The lung model represented above is of course highly simplified in a number of ways, the mostobvious being the regional differences in ventilation due to gravity. To understand how gravity
might influence the mechanical properties of the lung, it is helpful to consider a Slinky TM, a toy popular in the latter half of the 20
th century consisting of a stainless steel spring which acts as a
good stand-in for the elastic properties of the lung. If you hold a Slinky from one end and let theother end hit the floor, the weight of the lower parts of the spring will result in progressively
larger amount of stretch as you move up the spring. If the spring is stretched further the percentchange between each coil will be much greater at the base of the spring where it is less stretched
at baseline than at the top of the spring. In the same way, the apex of the lung will be moreinflated at FRC due to gravitational effects than the base of the lung. For this reason, during
inspiration, a larger amount of ventilation will go to the bases of the lungs than the apex. Theimplications of this heterogeneity of ventilation will be discussed in the section on
Ventilation/Perfusion relationships.

7/26/2019 Physio Coursepack 2016
http://slidepdf.com/reader/full/physio-coursepack-2016 184/282
1
Med Bio 30300Cell and Organ PhysiologyRespiratory DynamicsJanuary 28, 2015
The figure below is the simplified schematic representation of the lung we discussed during thelecture on the static properties of the lung. Ventilation moves oxygen into the alveoli and carbon
dioxide out. Oxygen diffuses from the alveoli to the blood, and the circulation delivers thisoxygen to the peripheral tissues. This same circulation removes carbon dioxide from the
peripheral tissues that then diffuses back into the alveoli to be exhaled. The bulk flow of air inand out of the lungs to maintain gradients at the alveolar level requires air movement and can
best be understood from the standpoint of fluid dynamics.
Figure 1
Through the course of the next two lectures we will discuss the forces acting on air to move it inand out of the lungs and how these may be altered in disease. Changes that increase the amount
of work required to create this air movement may be perceived by patients as shortness of breath,hence understanding of these processes will allow you to better understand the basis of
pulmonary diseases you will be called upon to treat.
Air movement in the atmosphere, such as wind, is created by differences in air pressure with airmolecules moving from areas of high pressure to areas of low pressure. Within the lungs this

7/26/2019 Physio Coursepack 2016
http://slidepdf.com/reader/full/physio-coursepack-2016 185/282
2
movement needs to be constrained by some structure to be distributed to the enormous surfacearea of the alveoli (more about that in the diffusion lecture).
P1
P2
P1
P2
Figure 2
As simple way to study this problem is to consider the pressure required to push a fluid (liquid orgas) through a tube or airway. One of the first physiologists to consider this problem was Jean
Poiseulle, a French nineteenth century physician who studied the flow of blood through vesselsusing a model of rigid tubes. Through a series of experimental observations he was able to
identify a relationship between the diameter of a tube, its length, the viscosity of a fluid and the pressure required to move a given fluid through a tube at a given velocity. This relationship is
known as Poiseulle’s law:
Where V = Flow (first derivative of volume with respect to time), P = pressure, r = tube radius,
l=tube length and ! = viscosity of inspired air.
This equation works well as long as a number of conditions are met. The fluid has to be Newtonian, meaning that the viscosity does not change with flow. The tubes have to be non-
collapsible and flow needs to be laminar. While this model is fairly simple, it turns out that atleast one of these conditions turns out to be untrue in almost any airway you consider.
The pressure required to move air through a tube is critically dependent on the flow regimen.
The most efficient (that is, requiring the lowest pressure for a given flow) flow profile is laminarflow. The pressure drop along a tube or in this profile is completely due to frictional energy loss
as one layer of fluid slides along the next. In the diagram below, the speed of flow along theairway is greatest in the center and drops off until it reaches zero at the airway wall. The flow is
greatest at the center due to the fact that each layer as you move towards the center of the pipe issliding against neighboring layers with increasing velocities.
(P1-P2) " r 4
8 ! l=

7/26/2019 Physio Coursepack 2016
http://slidepdf.com/reader/full/physio-coursepack-2016 186/282
3
Figure 3 - Laminar Flow
This is similar to the flow observed in a large river where the current will me much greater at the
center of the river than along the bank. A graph of flow velocity versus distance from the centerwill be parabolic in shape.
Laminar Flow
0 mph
2 mph
4 mph
0 mph
2 mph
Figure 4
As flow rates increase, flow becomes chaotic and achieves turbulent flow. In this case the
pressure required to move air through the tube at a given velocity is increased as compared tolaminar flow due to the energy required to change direction of the air molecules as they swirl
around. Remember for physics that a change in direction requires acceleration and henceincreased force (or pressure: force per unit area) to achieve this acceleration.
Figure 5 – Turbulent flow

7/26/2019 Physio Coursepack 2016
http://slidepdf.com/reader/full/physio-coursepack-2016 187/282
4
The tendency for flow to be laminar or turbulent can be predicted using the Reynolds number:
Where D= tube diameter, u = average velocity, # = fluid density and ! = viscosity. A Reynoldsnumber of > 2000 is generally associated with turbulent flow. This equation can be used to
demonstrate that flow in the trachea is likely to be turbulent.
For the trachea:
U= 150 cm/second
!= 0.0012 g/cm3
"=1.83x10⁻⁴ g/sec*cm
D= 3 cm
Re = 2950
As most airways are small, and flows are relatively low, the majority of flow in the lungs is
laminar except in the large bronchi. An easy way to determine whether or not flow is laminar isto use your stethoscope: if you can hear breath sounds, the flow is not laminar. Most breath
sounds are created by what is known as transitional flow where turbulent eddies are created at branch points where airways divide:
Figure 6
While we are modeling a single airway in the above examples, in reality, the lung is comprised
of millions of airways each with their own airways resistance (R aw = $P/$ V). Counter-
e =D u #
!

7/26/2019 Physio Coursepack 2016
http://slidepdf.com/reader/full/physio-coursepack-2016 188/282
5
intuitively, resistance is greatest in the large airways and least at the peripheral airways. Whilethe trachea is the largest airway, there is only one trachea per customer, while there are millions
of smaller airways giving a much greater surface area as demonstrated below (remember howresistance works in parallel circuits – this is the same principle at work here):
Mouth Alveoli
Trachea
Segmental
Bronchi
Terminal
Bronchi
Cross-sectional
Area
Figure 7
What are the consequences of airways resistance on the work of breathing? A simple model of
these effects can be seen on the following page. In this model a piston is used to mimic the
effects of the diaphragm and chest wall on pleural pressure. P pl is equal to the intrapleural pressure, which is negative in most instances. Alveolar pressure Palv is the pressure within thegas exchange units at the end of the airways and the transpulmonary pressure Ptp is the difference
between these two. Transpulmonary pressure is equal to the elastic recoil (Pel) pressure in thelecture on lung statics.

7/26/2019 Physio Coursepack 2016
http://slidepdf.com/reader/full/physio-coursepack-2016 189/282
6
Ptp = 5Palv=0
Ppl=-5
Patm = 0
time
Inspiration Expiration
FRC = 0
Volume(liters)
0.5
0.40.3
0.2
0.1
-6
-7
-8
-9
PleuralPressure(cm H2O)
+0.5
-0.5
ExpiratoryFlow
(liters/sec)
+1
-1
AlveolarPressure(cm H2O)
A
B
CD
A
B
C
D
A
B
CD
B’
At FRC
Lung Volume = 3000 ml
Figure 8a
Ptp = 5
Palv=-1
Ppl=-6
Patm = 0
time
Inspiration Expiration
FRC = 0
Volume(liters)
0.50.40.3
0.2
0.1
-6
-7
-8
-9
PleuralPressure(cm H2O)
+0.5
-0.5
ExpiratoryFlow
(liters/sec)
+1
-1
AlveolarPressure
(cm H2O)
A
B
CD
A
B
C
D
A
B
CD
B’
Start of Inspiration
Lung Volume = 3000 ml
Figure 2b
At rest, Palv and Patm will be equivalent because flow = 0. At point A on figure 8a the lung is at
FRC and the inward elastic recoil pressure is balance by the negative pleural pressure pulling thelung toward the chest wall. Remaining at the same point on the diagram, a respiratory effort is
now initiated (Figure 8b). The pleural pressure now becomes slightly more negative. As thelung volume hasn’t changed the elastic recoil pressure remains the same therefore alveolar
pressure decreases by an amount equivalent to the decrease in the pleural pressure.

7/26/2019 Physio Coursepack 2016
http://slidepdf.com/reader/full/physio-coursepack-2016 190/282
7
Ptp = 7
Palv=-1
Ppl=-8
Patm = 0
time
Inspiration Expiration
FRC = 0
Volume
(liters)
0.5
0.40.3
0.2
0.1
-6
-7
-8-9
Pleural
Pressure
(cm H2O)
+0.5
-0.5
Expiratory
Flow
(liters/sec)
+1
-1
Alveolar
Pressure(cm H2O)
A
B
CD
A
B
C
D
A
B
CD
B’
During Inspiration
Lung Volume = 3300 ml
Ptp = 9
Palv= 0
Ppl=-9
Patm = 0
time
Inspiration Expiration
FRC = 0
Volume
(liters)
0.5
0.40.3
0.2
0.1
-6
-7
-8
-9
Pleural
Pressure(cm H2O)
+0.5
-0.5
Expiratory
Flow(liters/sec)
+1
-1
Alveolar
Pressure(cm H2O)
A
B
CD
A
B
C
D
A
B
CD
B’
End Inspiration
Lung Volume = 3500 ml
Figure 8c
In the next panel (Figure 8c), points B and B’ on the graph represent mid inspiration. As the
lung volume has increased, so has the transpulmonary or elastic recoil pressure. The difference between B and B’ in the intrapleural pressure represents the difference in intrapleural pressure
created by airways resistance. Note that this is equivalent to the difference between theatmospheric and alveolar pressures. At point C on the diagram the lung is at end inspiration. As
the lung now has 500ml of additional volume the transpulmonary pressure has now increased to9. As flow has stopped, there is again no difference between the atmospheric and alveolar
pressures.
Ptp = 7
Palv= 1
Ppl=-6
Patm = 0
time
Inspiration Expiration
FRC = 0
Volume
(liters)
0.5
0.40.3
0.2
0.1
-6-7
-8
-9
PleuralPressure
(cm H2O)
+0.5
-0.5
Expiratory
Flow
(liters/sec)
+1
-1
Alveolar
Pressure
(cm H2O)
A
B
CD
A
B
C
D
A
B
CD
B’
During Exhalation
Lung Volume = 3300 ml
Ptp = 5
Palv=0
Ppl=-5
Patm = 0
time
Inspiration Expiration
FRC = 0
Volume(liters)
0.5
0.40.3
0.2
0.1
-6-7
-8
-9
PleuralPressure(cm H2O)
+0.5
-0.5
Expiratory
Flow(liters/sec)
+1
-1
AlveolarPressure
(cm H2O)
A
B
CD
A
B
C
D
A
B
CD
B’
At FRC
Lung Volume = 3000 ml
Figure 8d
This next panel (left, Figure 8d)) represents mid-expiration. As inspiratory effort ceases
(expiration in tidal breathing is passive) pleural pressure become less negative. As
transpulmonary pressure remains increased at this higher volume, this results in a positivealveolar pressure. The final panel at end expiration completes the cycle. While this may appearesoteric, the ability to differentiate the cause of elevated airways pressure, whether due to
abnormal lung compliance or increased airways resistance is of great use when treating patientsin the intensive care unit.

7/26/2019 Physio Coursepack 2016
http://slidepdf.com/reader/full/physio-coursepack-2016 191/282
8
!P
!PR
!Pc
l/s
Cm H2O
90
1.2
0
-0.8
l/s
Cm H2O
90
1.2
0
-0.8
Figure 9
Pressures and flows can be directly measure when a patient is intubated in the intensive care unit.
An endotracheal tube is inserted into the trachea and a balloon is inflated to seal off the space between the tube and the trachea. Pressure and flow are measured at the end of this tube. The
figure at the upper right represents pressure (upper panels) and Flow (lower panels) curves from patients with obstructive airways disease (left panels) and restrictive lung disease (right panels).
The x-axis in each graph is time. These graphs demonstrate what is known as an inspiratory pause hold maneuver. This test takes advantage of the fact that in the absence of flow the
pressure at one end of the tube is the same as on the other end. At the end of inspiration just before flow stops the pressure at the airway opening is the sum of pressure losses down the tube
and airways due to resistance as well as the pressure required to inflate the lung. When flow isstopped the pressure drop due to airways resistance is removed and only that pressure required to
hold the lung in an inflated state remains. On the left, showing obstructive disease, there is aminimal plateau, as most of the peak pressure was due to airways resistance. On the right the
pressure remains high during an inspiratory hold, as the lung is restricted and requires increased
pressures to hold the lung at this volume (low compliance). (By the way, these pressures would be truly frightening if you actually observed them on an intubated patient and would requireimmediate action to prevent lung injury.)
This maneuver helps distinguish between two of the main categories of abnormal lung
physiology: restrictive lung diseases, which are those that result in increase work of breathingdue to decreased lung compliance, and obstructive lung disease, those diseases that result in
reduced air flow. Examples of restrictive lung disease include Interstitial Pulmonary Fibrosis(IPF), sarcoidosis, obesity and chest wall deformities such as scoliosis. Obstructive diseases
include asthma, emphysema and chronic bronchitis. Some diseases such as sarcoidosis canmanifest both obstructive and restrictive physiology.
We have spent a great deal of discussion on airways resistance (R aw). As mentioned above, the
majority of airway resistance is concentrated in the upper airways. As demonstrated in thediagram below, resistances in parallel result is a reduced overall resistance (1/2+1/2+1/2+1/2=2
R T=1/2) whereas resistances in series are additive (2+2+2+2=8= R T). The resistance of theairways can therefore be modeled as a combination of parallel and serial resistances.

7/26/2019 Physio Coursepack 2016
http://slidepdf.com/reader/full/physio-coursepack-2016 192/282
9
R1 R2 R3 R4
R1
R2
R3
R4
RT=R1+R2+R3+R4
1/RT
= 1/R1+ 1/R2 + 1/R3+ 1/R4
Trachea MainstemBronchi
Lobar Bronchi
Segmental
Bronchi
.02
.04
.06
.08
0 5 10 15 20
Conducting
Zone
Respiratory
Zone
R e s i s t a n c e ( c m H 2
O / l i t e r / s e c )
Airway Generation
Shutter Closed:
Mouth Pressure = Alveolar Pressure
Alveolar pressure correlated withbox pressure
Shutter Open:
Air flow measure at mouth
Alveolar pressure inferred from
Box pressure
R=Pressure/Flow
PM
PB
PB
VM
Figure 10
Airways resistance can be directly measured in the PFT lab. The patient pants against a closedshutter in an enclosed box. As the shutter is closed the pressure measures at the mouth are the
same as the alveolar pressure due to the fact that flow during this phase of the measurement iszero. This allows a “standard curve” of box-pressure versus alveolar-pressure to be created.
Then when the shutter is opened the patient then pants again and the amount of flow can bemeasured to calculate resistance:
Raw=
!PM
!VM
. <2
I
!V
(!VM/!PB)
(!PM
/!PB
)=
Figure 11

7/26/2019 Physio Coursepack 2016
http://slidepdf.com/reader/full/physio-coursepack-2016 193/282
10
It is important to note that the airways resistance in normal lung is extremely low: less than 2cmH2O/L/sec. It is also important to note that this measurement is made at very low flows and does
not measure change due to dynamic obstruction seen in diseases such as emphysema. Airwayresistance is also usually measured at functional residual capacity, but can be measured at any
lung volume. It is important to note though that the value may change at differing lung values
due to differing airway diameters created by changes in the interparenchymal tethering forces atdiffering volumes. These forces in the lung, the interconnectedness of the lung, become moreimportant when talking about the factors that limit airflow during a forced expiratory maneuver.
Figure 12
Figure 13
V
Volume (liters)
(l/sec)RV
TLC
Figure 12 represents the various lung volumes.The amount of air that can be exhaled from the lung between the Total Lung Capacity (TLC) and
the Residual Volume (RV) is the Vital Capacity. When measured as part of a forced expiratorymaneuver, this measurement is referred to as the forced vital capacity. Another way of
representing spirometric data is by means of a flow volume loop. This is a same data shown onthe previous slide with volume as the X axis and flow as the Y axis. Note that there is no time
axis. This maneuver is performed with the patient coached to perform at maximum effort. Notealso that the flows obtained are linearly dependent on volume with the greatest flows occurring

7/26/2019 Physio Coursepack 2016
http://slidepdf.com/reader/full/physio-coursepack-2016 194/282
11
at TLC at the beginning of the forced expiratory maneuver and the flows dropping off to zero atresidual volume (RV).
This dependence between lung volume andmaximal airflow is reinforced in the diagram
to the left. If maximal expiratory maneuvers
are made starting at various percentages ofvital capacity, the maximal flow at the startof expiration corresponds to the same
velocity at that point of expiration in a flowvolume curve initiated at 100% of vital
capacity. Also note that the amount of flowat any percentage of vital capacity increases
with increasing effort but then plateaus at agiven flow above which increases in effort
results in no additional increases in flow.This raises the question of what limits
maximal air flow during forced expiration.
75 50 25 0
Figure 3
The diagram at the upper left is a crude drawing of a waterfall. This is useful analogy for theflow-limiting segment of the airway. Just as the level of water at the base of the waterfall does
not effect on the flow of water up to the waterfall nor does any downstream obstruction, airwaycharacteristics downstream of the flow-limiting segment of airways will not affect airflow. In a
forced expiration, the initial flow-limiting segment is in the most proximal airways beginningwith the trachea. As lung volume decreases as the patient expires, the flow-limiting segment
moves to smaller and smaller airways.

7/26/2019 Physio Coursepack 2016
http://slidepdf.com/reader/full/physio-coursepack-2016 195/282
12
Pel(v)
PalvPsfr
Ptot
V. A
Plat
Ptm
Ppl
Ppl = Pleural Pressure
Palv = Alveolar Pressure
Pel = Elastic Recoil
Plat = Side stream Pressure
Ptot = Total Pressure
Ptm= Transmural Pressure
A = Luminal Area
Figure 4
The diagram above summarizes the pressures acting on a given segment of airway. A number of
pressures have already been discussed including the alveolar pressure Palv and the elastic recoil pressure, P
el. Another pressure diagrammed above is the pressure due to frictional resistance,
essentially what is measured by the R aw determination in the PFT lab. There are two otherimportant pressures that we have yet to discuss: the side stream pressure, the Plat, and the
transmural pressure or Ptm which is the difference between Plat and the pleural pressure, P pl.These pressures are important, as they are what determine the luminal area of the airway as
demonstrated in the diagram at the upper left. This graph represents the relationship betweentransmural pressure and cross sectional area in a floppy tube. Think of a very thin walled piece of
Tygon tubing. Values to the right of the y axis represent positive transmural pressures leading tosmall but noticeable increases in the cross sectional area of an inflated airway. Values to the left
represent negative trans-mural pressures leading to various degrees of airways collapse.
Kinetic Energy = ! ! u2
D = 3cm D = 3cmD = 2.1cm
140 cm/sec 140 cm/sec280 cm/sec
Pressure =
Potential
Energy
Mouth Alveoli
Trachea
Segmental
Bronchi
Terminal
Bronchi
Cross-sectional
Area
fastslow
Figure 5What would possibly lead to a negative transmural pressure when a large positive alveolar
pressure is being created upstream during a forced expiratory maneuver? If you remember backto your organic chemistry lab in college, there was a device attached to the faucets in the lab that
would create a vacuum that could be used in a number of experiments. Forcing a fluid throughan area of reduced cross sectional area creates this drop in pressure. As the same amount of fluid
has to cross through a smaller area, the velocity must increase (unfortunately this does not applyto cars on the Dan Ryan during construction). As velocity increases the kinetic energy in the
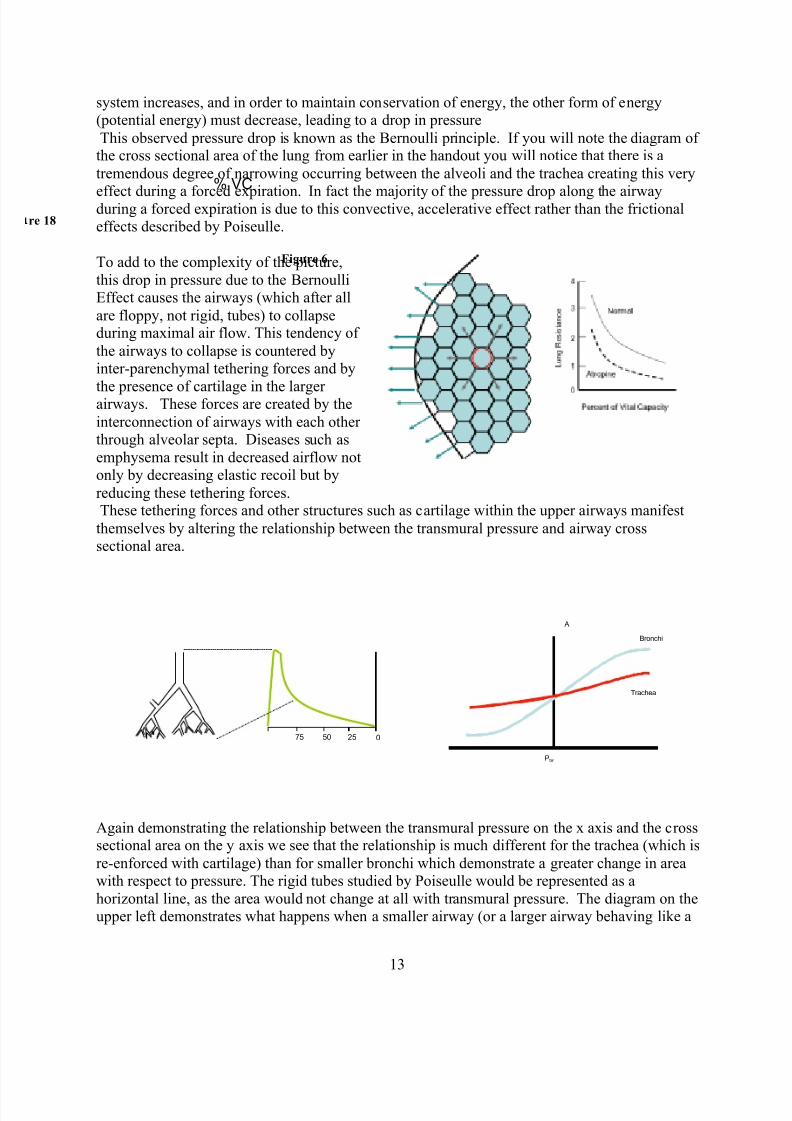
7/26/2019 Physio Coursepack 2016
http://slidepdf.com/reader/full/physio-coursepack-2016 196/282
13
system increases, and in order to maintain conservation of energy, the other form of energy(potential energy) must decrease, leading to a drop in pressure
This observed pressure drop is known as the Bernoulli principle. If you will note the diagram ofthe cross sectional area of the lung from earlier in the handout you will notice that there is a
tremendous degree of narrowing occurring between the alveoli and the trachea creating this very
effect during a forced expiration. In fact the majority of the pressure drop along the airwayduring a forced expiration is due to this convective, accelerative effect rather than the frictionaleffects described by Poiseulle.
To add to the complexity of the picture,
this drop in pressure due to the BernoulliEffect causes the airways (which after all
are floppy, not rigid, tubes) to collapseduring maximal air flow. This tendency of
the airways to collapse is countered byinter-parenchymal tethering forces and by
the presence of cartilage in the largerairways. These forces are created by the
interconnection of airways with each otherthrough alveolar septa. Diseases such as
emphysema result in decreased airflow notonly by decreasing elastic recoil but by
reducing these tethering forces.These tethering forces and other structures such as cartilage within the upper airways manifest
themselves by altering the relationship between the transmural pressure and airway crosssectional area.
Again demonstrating the relationship between the transmural pressure on the x axis and the crosssectional area on the y axis we see that the relationship is much different for the trachea (which is
re-enforced with cartilage) than for smaller bronchi which demonstrate a greater change in areawith respect to pressure. The rigid tubes studied by Poiseulle would be represented as a
horizontal line, as the area would not change at all with transmural pressure. The diagram on theupper left demonstrates what happens when a smaller airway (or a larger airway behaving like a
% VC
A
Ptm
Bronchi
Trachea
Figure 6
re 18
75 50 25 0

7/26/2019 Physio Coursepack 2016
http://slidepdf.com/reader/full/physio-coursepack-2016 197/282
14
smaller airway due to excessive narrowing or collapsibility) becomes the flow-limiting segmentearly in the forced expiratory maneuver. This effect leads to the characteristic scooping seen on
the flow volume loop with obstructive airways disease.

7/26/2019 Physio Coursepack 2016
http://slidepdf.com/reader/full/physio-coursepack-2016 198/282
1
Med Bio 30300Cell and Organ PhysiologyVentilation and DiffusionJanuary 29, 2015
In the previous lecture we discussed the physics of the movement of air through the
airways. In the current lecture we will discuss how this air movement alters thecomposition of air within the alveoli, thereby determining arterial PCO2. We will also
discuss diffusion of gas across a membrane and discuss why some gasses equilibratemore quickly than others. We will also discuss the physics of gas exchange in the
systemic capillaries.
Rib orientation determines thoracic (lung) volume
Figure 1
We had earlier described a simplistic model of the lung using a piston to represent the
diaphragm. This acts to create a negative pressure within the pleural space that in turndraws air into the lung. The minute volume - the amount of air entering and leaving the
lung each minute - is equal to the tidal volume of each breath multiplied by the number of breaths per minute. In reality the motive power for respiration is a bit more complex. In
addition to the diaphragm, the volume of the chest cavity is altered by the orientation ofthe ribs. The muscles of the neck and the intercostal muscle act to elevate the ribs in a
more horizontal direction, thereby increasing the anterior-posterior dimensions of thelung. This component of respiration is especially prominent during heavy exercise or in a
patient who is laboring to breath with heavy use of the accessory muscles of respiration.
An understanding of the mechanics of the chest wall also helps account for the increasedwork of breathing associated with chest wall deformity. In addition to altering chest wall
compliance, these disorders can also make breathing less efficient by altering the normal positioning of the ribs during inspiration and expiration.

7/26/2019 Physio Coursepack 2016
http://slidepdf.com/reader/full/physio-coursepack-2016 199/282
2
Figure 2
150 ml
3,000 ml
Minute Ventilation = TV x Frequency
15 breaths/min
Tidal volume = 500 ml
= 500 ml x 15 per min = 7,500 ml/min
Anatomical dead space ventilation:
150 ml x 15 per min = 2,250 ml/min
Alveolar ventilation:
350 ml x 15 per min = 5,250 ml/min
Lung Ventilation
Conducting
Airways
Alveolar Gas
Figure 3
The diagrams above give the “vital statistics” of total ventilation and anatomical dead
space ventilation. The total minute ventilation (MV or VE for Expired Ventilation) is
equal to the volume taken in with each tidal breath multiplied by the number of breaths per minute. Not all of the ventilation is effective in participating in CO2 elimination. Thefirst 150ml that is inhaled into the alveoli consists of air inhaled from the conducting
airways that represents “used” air from the previous breath. This “dead space” ventilationdoes not effectively contribute to alveolar ventilation. Out of a total minute ventilation of
7500 ml/minute, only 5250 represents alveolar ventilation.

7/26/2019 Physio Coursepack 2016
http://slidepdf.com/reader/full/physio-coursepack-2016 200/282
3
The table to the leftdemonstrates the
components of air. As
noted in the diagramambient air is the dry airaround us in the
atmosphere. Inspired airrepresents the
composition of air afterit has been humidified to
100% saturation withwater. This has to occur
to prevent the drying ofthe alveolar membranes.
This usually occurs inthe nose and upper
airway but sometimeswill also occur in the lower airways. Even with very cold dry air with rapid ventilation,
air is completely humidified before it reaches the alveoli.
When discussing the components of a gas, the concept of partial pressure is often used.This would be the pressure that a single component gas would exert if it were removed
from the gas mixture and placed in an equivalent volume. A partial pressure of a gas can be calculated by multiplying the barometric pressure of a gas mixture (in this case air) by
the fraction of the gas mixture that is made up by that particular gas. As an example for
oxygen: at sea level barometric pressure (PB) is 760 mmHg (where a mmHg is the pressure required to raise a column of mercury by one mm). The fraction of oxygen inthe atmosphere is 0.2093. Therefore the partial pressure of Oxygen (PO2) is 760!0.2093
= 159.1. When calculating the partial pressure in fully humidified inspired air, thecontribution of water vapor to the partial pressure needs to be subtracted. At 37 C° the
vapor pressure of water is 47 mmHg. Thus the calculated value for the partial pressureinspired oxygen (PiO2) at sea level is FiO2!(PB-PH2O) = 0.2093!(760-47)=149.2.
GAS PARTIAL PRESSURES
Dry Ambient Air Inspired Air Alveolar gasGas Fraction Gas tensions Gas tension Gas TensionNitrogen .7809 593.5 556.8 566Oxygen .2093 159.1 149.2 100Carbon dioxide .0003 0.23 0.21 40Argon .0095 7.2 6.8 6.9Water 0 0 47 47
Total 1.00 760 760 760
Ambient gas: Pgas = PB * dry gas fraction
Warm, humidified gas: P as = (PB-47) * dry gas fraction
Ambient Air Inspired Air
Alveolar Gas

7/26/2019 Physio Coursepack 2016
http://slidepdf.com/reader/full/physio-coursepack-2016 201/282
4
Inspired Air:
PiO2 = FiO2( Patm – PH2O)
PiO2 = 0.21(760-47)
Alveolar Gas:
P AO2 = PiO2 – PCO2/RER
CO2
O2
Conducting
Airways
Alveolar
Gas
Figure 4
This next diagram demonstrates the calculations for partial pressures of oxygen at various
points throughout the airway. The alveolar partial oxygen pressure (PAO2) is equal to theinspired partial pressure of oxygen minus the partial pressure of the oxygen that has left
the alveolus. This can be estimated by knowing the PACO2, the partial pressure of carbondioxide in the alveolus, which fortunately is almost equivalent to the partial pressure of
carbon dioxide in the bloodstream, the PaCO2. The latter can be measured directly via anarterial puncture performed in the radial artery. The amount of O2 leaving the alveolus
and the PACO2 are related to each other by a value called the respiratory exchange ratio(RER). This is usually approximately 0.8 but can vary with diet. Note the standard
notation for subscripts of PA for alveolar partial pressures and Pa for arterial partial pressures. Note also the bias of pulmonary physiologists reserving the capital letter for
the alveoli!

7/26/2019 Physio Coursepack 2016
http://slidepdf.com/reader/full/physio-coursepack-2016 202/282
5
VD
VI VE
VA
Q
VCO2 = ml CO2 delivered into alveolar gas each minute
VCO2 = ml CO2 exhaled by the lung each minute
VCO2 = V A X F ACO2
..
.
.
Figure 5
While breathing is tidal and circulation through the pulmonary vasculature is pulsetile, itis sometimes useful to think in terms of a continuous flow model. In this construct the
tidal breathing is averaged into a continuous value, as is the blood flow Q (this is thesame a cardiac output). The VCO2 is equivalent to the amount of CO2 produced by the
body each minute and at steady state is equivalent to the amount of CO2 expired by thelung each minute. This expired VCO2 is of course equivalent to the alveolar ventilation
(VA) multiplied by the fraction of the alveolar gas that is carbon dioxide (FACO2). Asnoted above, not all of ventilation is effective: a certain amount the “dead space
ventilation” is wasted. The alveolar ventilation is thus the total ventilation VE minus thedead space ventilation VD.
Physiologic Dead Space
V
V
T
D
2
20.1
CO P
CO P
A
E !=
P A
CO2
= 40P
ACO
2= 0
PET
CO2
= 20
Figure 6
Dead space can be either anatomic (as in the earlier slide) or physiologic. A pulmonaryembolus is an example of a cause of physiologic dead space. In the example above a
large blood clot occludes the left pulmonary artery. This lung is ventilated but does notexchange CO2 or oxygen with the blood stream. The total minute ventilation will need to
double to maintain a normal PaCO2. Thus the CO2 measured at end expiration (whichcorresponds to alveolar gas) will be the average of the value found in the alveoli of each
lung.

7/26/2019 Physio Coursepack 2016
http://slidepdf.com/reader/full/physio-coursepack-2016 203/282
6
The fraction of dead space can be calculated using the above equation. The fraction of
total ventilation that is wasted on dead space is equal to: one minus the end expiratoryCO2 at the mouth divided by the PACO2 of the alveoli that are participating in gas
exchange with the alveolar vessels. Fortunately this is the same as the arterial CO2, the
PCO2 that can be directly measured via arterial puncture. For the previous example, theend tidal (ET) expired CO2 is measured as 20, the arterial PaCO2 is 40, thus Vd/Vt= 1 –20/40 =.5 giving a dead space fraction of 0.5 or 50%
Alveolar Ventilation Controls PCO2
100
80
60
40
20
0 A l v e o l a r P C O 2
( t o
r r )
5 10 15 2520
VCO2 = 250 ml/min
(Rest)
VCO2 = 750 ml/min
(Mild Exercise)
H y p e r
H y p o v
e n t i l a t i o n
Alveolar Ventilation l/min
Figure 7This graph of PCO2 versus Alveolar ventilation demonstrates how Alveolar ventilationalters the PCO2. When the production of CO2 increases, e.g. with exercise, the amount of
ventilation required must increase to maintain normal PACO2.When ventilation increasesenough to drop the PACO2 below normal, this is called hyperventilation. When ventilation
is insufficient to allow for a normal PACO2, this is defined as hypoventilation.
The movement of air into the alveoli is of no use if it cannot diffuse into the bloodstreamto be carried to the peripheral tissues. We need to discuss how gasses cross the alveolarmembrane and enter the bloodstream.

7/26/2019 Physio Coursepack 2016
http://slidepdf.com/reader/full/physio-coursepack-2016 204/282
7
Fick’s Law of Diffusion of Gasses
V gas = ( !P) A.D
T
Thickness T
!P
Gas Diffusion
Ml/min
Diffusivity = D
D is Proportional
To Solubility and
To 1/(MW)0.5
Figure 8
This diagram outlines the parameters that are important in the diffusion of gas across a
membrane. Diffusion is proportional to the pressure gradient across the membrane andthe area of the membrane (A) available for diffusion. The flow is also proportional to a
parameter called “diffusivity” that is related to solubility of the gas and the inverse of thesquare root of its molecular weight. Diffusion is inversely proportional membrane
thickness. The lung is optimized to allow diffusion with an alveolar surface areaequivalent to the size of a tennis court and a membrane thickness made up only of a
single endothelial cell and a single epithelial cell.

7/26/2019 Physio Coursepack 2016
http://slidepdf.com/reader/full/physio-coursepack-2016 205/282
8
5
4
3
2
1
0
20 40 60 80 100
Gas Partial Pressure mmHg
D i s s o l v e d G a s C o n t e n t ( m
l / d l ) Ether
N2O O2
N2
He
Higher Solubility
Lower Solubility
Figure 9
The solubility of a gas is the volume of a gas (at standard temperature and pressure) that
will dissolve into a liquid or a membrane for given partial pressures. The slope of theline for each gas is proportional to its solubility. Ether, an old fashioned anesthetic agent
is highly soluble whereas helium is not very soluble. This makes it very useful for thegas dilution determinations of TLC. It is also very useful for deep sea diving, as very
little helium will dissolve at depth, preventing the formation of bubbles in the bloodstream as a diver ascends.
Alveolar PHe= 300 mmHg
Blood Element
MixedVenousBlood
EndCapillary
Blood
Blood Element
MixedVenousBlood
EndCapillary
Blood
Blood Element
Low Solubility Gas High Solubility Gas
300
150
0
Distance Along Capillary
0.0005
0
Distance Along Capillary
0.001
PHe
inbloodelement
Pether
inb
loodelement
Alveolar Pether = 0.001 mmHg
The time required to reach equilibration is the same
MixedVenous
Blood
EndCapillary
Blood
Blood Element
Alveolar Pco = 0.1 mmHg
MixedVenous
Blood
EndCapillary
Blood
Blood Element
Alveolar Pco2 = 40 torr
Alveolar Po2 = 100 torr
Carbon Monoxide Equilibrates
Very Slowly (Diffusion Limited)
O2 and CO2 Equilibrate at
moderate rates
Time Along Capillary (sec).75.25 .75.25
Time Along Capillary (sec)0 .5.5 0
O2
CO2
PCO
inbloodelement
0.1
PO2
inbloodele
ment
Pco2
inbloodelement
40
100
40
46
Figure 10
As long as a gas is inert (that is, it does not react with the blood in the alveolar
capillaries) the equilibration time, that is, how long it take the gas in the alveolus to comeinto equilibrium with the blood, will be the same regardless of solubility. A poorly
soluble gas such as helium will diffuse slowly across a membrane but by the same token,it will take only a small amount of this gas to fully saturate an element of blood traveling
through the capillary. In a highly soluble gas, a large quantity of gas will be required to

7/26/2019 Physio Coursepack 2016
http://slidepdf.com/reader/full/physio-coursepack-2016 206/282
9
reach equilibrium but as this gas diffuses quickly, it will also reach equilibrium with the blood before it exits the capillary. Both of these gases are said to be perfusion limited, as
the amount of gas exiting the alveolus is dependent on how much blood is flowingthrough the capillary, and will not be increased by enhanced diffusion.
In contrast, carbon monoxide is diffusion limited. That is, it equilibrates so slowly thatthe blood element traversing the capillary is nowhere near saturated, and the amount ofcarbon monoxide being delivered to the peripheral tissues is dependent on diffusion.
Carbon dioxide and oxygen both interact strongly with blood and hence haveequilibration rates that are slower than those of inert gasses but nevertheless are still
perfusion limited under normal conditions.
Carbon Monoxide exhibits
Very high solubility
Oxygen and CO2 Exhibit
Moderate solubility in Blood
O2 CO2 and CO all exhibit
Low solubility in the blood gas
membrane
Figure 11
The reason why these gasses equilibrate more slowly is that they are are relativelyinsoluble in the blood-gas membrane but moderately soluble, in the case of oxygen and
carbon dioxide, and highly soluble, in the case of carbon monoxide, in blood. Thismeans that a large quantity of the gas will have to diffuse across to reach equilibrium but
that diffusion will occur slowly due the low membrane solubility. This can be expressedmathematically but boils down to the same thing as shown below:

7/26/2019 Physio Coursepack 2016
http://slidepdf.com/reader/full/physio-coursepack-2016 207/282
10
Gases equilibrate across the blood-gas membrane at a rate
determined by the solubility in the membrane relative to the
solubility in blood:
Helium: Low solubility in membrane, low solubility in blood
- Fast equilibration
Ether: High solubility in membrane, high solubility in blood
-Fast equilibration
Carbon monoxide: Low solubility in membrane, enormous
solubility in blood
-Slow equilibration
Oxygen and CO2: Somewhere in between
)1()(
t
final gas e P t P !
" #
#=
" solubility in membrane
! solubility in blood
Mixed
Venous
Blood
Blood Element
Alveolar Po2 = 100 torr
.75.25
Time Along Capillary (sec)
.50
O2
PO2
inb
loodelement
40
100
End
Capillary
Blood
Diffusion Limitation at Maximum Exercise
Figure 12
The one case in which oxygen delivery is diffusion limited is in a highly trained athletesuch as Lance Armstrong during maximal exercise. Such athletes are so cardiovascularly
fit that they can move an element of blood through the capillary at such a rate thatequilibration does not occur. This effect is exaggerated at high altitude.

7/26/2019 Physio Coursepack 2016
http://slidepdf.com/reader/full/physio-coursepack-2016 208/282
11
Exchange of O2 and CO2 along a systemic capillary
Blood
Flow
Arterial
End Venous
End
O2 CO2 CO2 CO2 CO2O2 O2 O2
Tissue Cylinder
Figure 13
Figure 13 shows a tissue cylinder demonstrating the unloading of oxygen and uptake of
carbon dioxide from the peripheral tissue. In instances of low flow or hypoxemia, tissuesat the venous end will be disproportionately
affected.
Diffusion can be directly measured by usingsmall, non-hazardous, quantities of inhaled
carbon monoxide. As was shown earlier, thisgas is diffusion limited, making calculations
simpler. The test actually measures thediffusion of gas across the alveolar membrane
through the plasma and the binding of the gasto hemoglobin (that is the quantity of Theta
shown above in the diagram). For this reason,the diffusing capacity test described in the
following slides is dependent on hemoglobinconcentration.
re 14

7/26/2019 Physio Coursepack 2016
http://slidepdf.com/reader/full/physio-coursepack-2016 209/282
12
From Fick’s Law
Therefore
But for CO uptake, P2=0, so
diffusing capacity for CO is ACO
CO LCO
P
V D =
Carbon Monoxide “Diffusing Capacity” Test
T
D A P Vgas !
"= )(
L D P Vgas !"= )(
)( 21 P P
V D CO
LCO#
=
Example of CO Diffusing Capacity
Patient inhales 0.3% CO, holds breath 10 seconds, then
exhales. During the breath-hold, the lungs take up 0.67 ml
of CO (i.e. 4.0 ml/min). The average alveolar PCO during
breath-hold was 0.1 mmHg.
ACO
CO LCO
P
V D =
mmHg ml mmHg
ml
D LCO min//401.0
min0.4
==
The area, diffusivity and thickness variables are replaced by a quantity called the
diffusing capacity DL. This is another value that we routinely measure in the pulmonaryfunction laboratory. The avid binding of carbon monoxide to hemoglobin maintains a
partial pressure of 0 in the bloodstream, simplifying the equations above.
The slide above right is an example of how this test would be performed on an actual patient. The thickness of the alveolar membrane does not change much (those processes
that markedly thicken alveolar membranes also tend to wipe out vessels). What this testactually measures clinically is the surface area of the lung that is participating in gas
exchange with the capillaries. Diseases that wipe out capillaries such as emphysema oridiopathic pulmonary fibrosis will cause a decrease in the diffusing capacity or DLCO.

7/26/2019 Physio Coursepack 2016
http://slidepdf.com/reader/full/physio-coursepack-2016 210/282
1
Med Bio 30300Cell and Organ PhysiologyCO2 and Oxygen TransportFebruary 2, 2015
In the last lecture we discussed ventilation and diffusion. The next challenge of the
cardio-respiratory system is to transport oxygen in the bloodstream to peripheral tissuesand to bring carbon dioxide back to the lung for removal (see schematic Fig. 1).
Mixed
Venous
CvO2
Arterial
CaO2
Systemic Tissue
VCO2
VO2
VO2 V
CO2
..
. .
Figure 1
Fick’s Relationship for O2 Transport:
Systemic Oxygen Delivery = QT !CaO2
Oxygen Return = QT ! CvO2
Oxygen consumption (VO2) is the difference between delivered and
returned Oxygen: VO2 = QT! (CaO2 - CvO2)
The equation at the bottom is the one that most commonly comes to mind when Fick’sname is mentioned. It proves useful when assessing the adequacy of oxygen delivery in
an individual in the Intensive care unit. Delivery of oxygen to the systemic tissues isequal to the amount of oxygen in a deciliter of blood (CaO2) multiplied by how much
blood flows through the lung and out to the peripheral tissues (Cardiac Output or Qt).Blood returning from the peripheral tissues isn’t devoid of oxygen. In fact, under normal
conditions only 25% of the oxygen content is usually extracted. The amount of oxygenreturning from the peripheral tissue is equal to the CvO2 - or venous content - multiplied

7/26/2019 Physio Coursepack 2016
http://slidepdf.com/reader/full/physio-coursepack-2016 211/282
2
by cardiac output. The amount of oxygen consumed, the VO2, is the difference betweenthe two.
7607601.0100%Total
470.00.00.0Water
7.07.20.00950.95 Argon etc.
0.210.230.00030.03CarbonDioxide
149.2159.10.209320.93Oxygen
556.8593.50.780978.09Nitrogen
Partial Pressure in
inspired air
(saturated with
H2O at body
temperature)
Partial Pressure
In dry ambient air
Dry Gas FractionPercent in Dry Air Gas Species
Definition: Gas Partial Pressures
Partial Pressure = Gas Fraction X Total Barometric Pressure
At sea level, total barometric pressure = 760 mmHgWater vapor pressure at 37° = 47 mmHg
Figure 2
The table in Figure 2 above demonstrates the components of air. Ambient air is the dryair around us in the atmosphere. Inspired air represents the composition of air after it has been humidified to 100% saturation with water. This has to occur to prevent the drying
of the alveolar membranes. This usually occurs in the nose and upper airway butsometimes will also occur in the lower airways. Even with very cold dry air with rapid
ventilation, air is completely humidified before it reaches the alveoli.
A partial pressure of a gas can be calculated by multiplying the barometric pressure of agas mixture (in this case air) by the fraction of the gas mixture that is made up by that
particular gas. As an example for oxygen (Fig. 2 above): at sea level barometric pressure(PB) is 760 mmHg (where one mmHg is the pressure required to raise a column of
mercury by one mm). The fraction of oxygen in the atmosphere is 0.2093. Therefore the partial pressure of Oxygen (PO2) is 760!0.2093 = 159.1. When calculating the partial
pressure in fully humidified inspired air, the contribution of water vapor to the partial pressure needs to be subtracted. At 37 C the vapor pressure of water is 47 mmHg. Thus
the calculated value for the partial pressure inspired oxygen (PiO2) at sea level is FiO2! (PB-PH2O) = 0.2093! (760-47)=149.2.
The above equations describe the partial pressures of oxygen in air; but what does it
mean to speak of a partial pressure of a gas in a liquid? The easiest way to think of thisconcept is that the partial pressure of a gas in liquid is the concentration of gas that is
dissolved in a liquid in equilibrium with this gas in the gas phase at a given partial pressure. In the example above, a liquid is equilibrated with a large volume of gas at
160mmHg.
Oxygen is carried in the blood in two forms:
1. Dissolved in the water and lipid of blood
Dissolved O2 content = PO2 ! 0.003 (the solubility factor)
If PO2 = 100 mmHg, dissolved O2 content = 0.3 ml/dl
2. Bound to the hemoglobin (Hgb) molecule
PO2 =760(.21)
= 160 mmHg
PBar =PO2 = 160 mmHg
PO2 = 160 mmHg PO2 = 160 mmHg

7/26/2019 Physio Coursepack 2016
http://slidepdf.com/reader/full/physio-coursepack-2016 212/282
3
Each Hgb can bind up to 4 O2 molecules; 1g of Hgb can bind up to 1.39 ml
O2.
Hemoglobin-bound content depends on the concentration of hemoglobin,
and the percentage of its binding sites that are carrying O2 molecules
If [Hgb] = 14 g/dl and O2 Saturation = 97% when PO2 = 100 mmHg
then Hgb–bound content = 1.39 ml O2/g Hgb!
14 g/dl!
0.97 = 18.88 ml/dl
Plasma by itself is a very poor carrier of oxygen, as demonstrated by the relative content
of oxygen in plasma compared to the content of oxygen bound to hemoglobin, asdemonstrated in the equations above.
CaO2 (ml/dl) = 1.39 ! [Hgb](g/dl) ! %Sat + PO2 ! 0.003
This is an equation you should know. The first part of the equation expresses the amount
of oxygen bound to hemoglobin; the second, the amount of oxygen dissolved in plasma.Generally the term denoting the dissolved oxygen is small and can be neglected. When
the concentration of hemoglobin is very low, however, this term becomes moreimportant.
0
5
10
15
20
D i s s o l v e d O x y g e n C o
n t e n t ( m l / d l )
20 40 60 80 100
Dissolved Oxygen
Oxygen Partial Pressure (mmHg)
Figure 3
The graph in Figure 3 above demonstrates the poor solubility of oxygen in water.

7/26/2019 Physio Coursepack 2016
http://slidepdf.com/reader/full/physio-coursepack-2016 213/282
4
! "
"
!
02-
Heme
02-
Heme
02-
Heme
02-
Heme
The adult
hemoglobin (Hb
A) has two !
chains and
two " chains,
each carrying aporphyrin heme
group
O2 binds reversibly at each of the 4 heme
groups on hemoglobin molecules
O2
Figure 4
The four chains in hemoglobin (two alpha and two beta) interact: as each heme molecule binds oxygen, it influences the binding constant of the other molecules for oxygen.
Mutations involving single amino acid substitutions can produce profound changes in theO2 binding characteristics of the red cell. Sickle Cell disease results from a single aminoacid substitution that causes the hemoglobin to precipitate out in deoxygenated
environments.
Sickle Cell Disease Normal
Definitions: O2 Content, Partial Pressure and O2 saturation:
• O2 content represents the volume of O2 (ml) carried per 100 ml blood (dl).• Gases diffuse from areas of higher partial pressure to lower partial pressure.
• O2 saturation represents the percentage of heme binding sites that are
occupied by O2 molecules
Figure 5

7/26/2019 Physio Coursepack 2016
http://slidepdf.com/reader/full/physio-coursepack-2016 214/282
5
20 40 60 80 100
Oxygen Partial Pressure mmHg
0
20
40
60
100
80
H e m o g l o b i n S a t u r a t i o n ( % )
Carbon Monoxide +Hemoglobin
Oxygen +Hemoglobin
Carbon monoxide competes with O2 for binding
at heme sitesWhen CO binds to a heme group on Hb, it alters
the affinity of O2 for the remaining heme sites
Note the difference in definition between O2 content (ml/dl)
and hemoglobin saturation (%)
20 40 60 80 100
Oxygen Partial Pressure (mmHg)
20
40
60
100
80
H e m o g l o b i n S a t u r a t i o n ( % )
Oxygen+Hemoglobin
With 50% carboxyhemoglobin
Oxygen +Hemoglobin
(7 or 14 g/dl)
20 40 60 80 100
5
10
15
20
O x y g e n C o
n t e n t ( m l / d l )
Oxygen +Hemoglobin 14 g/dl
Oxygen +Hemoglobin 7 g/dl
Oxygen+Hemoglobin
With 50% carboxyhemoglobin
Oxygen Partial Pressure (mmHg)
Figure 6
These graphs in Figure 6 demonstrate why carbon monoxide is bad for you and why that bag of charcoal on your deck advises against grilling indoors. Carbon monoxide binds
much more avidly to hemoglobin than oxygen, competitively inhibiting the binding ofoxygen. Even when not occupying all the heme sites, carbon monoxide adversely affects
the binding of oxygen to the unoccupied sites, lowering oxygen content in the blood.
20 40 60 80 100
Oxygen Partial Pressure (mmHg)
0
20
40
60
100
80
H e m o g l o b i n S a
t u r a t i o n ( % )
The affinity of hemoglobin for O2 changes rapidly
under physiological conditions
Temperature
PCO2
2,3-DPG
pH
TemperaturePCO2
2,3-DPG
pH
Figure 7
A variety of compensatory mechanisms shift the oxyhemoglobin saturation curve in
response to changing conditions. For example, high carbon dioxide levels in the peripheral tissues and reduced pH favor the unloading of oxygen. This is known as theBohr Effect, named after Neils Bohr’s father.
Carbon dioxide is carried by blood in three forms:
1. Dissolved in blood
Dissolved CO2 content increases in proportion to PCO2

7/26/2019 Physio Coursepack 2016
http://slidepdf.com/reader/full/physio-coursepack-2016 215/282
6
2. Reversibly bound to Hgb at the N terminus of the a and B chains
of hemoglobin, forming carbamino compounds:
3. As bicarbonate ions:
CO2 + H2O = H2CO3 = H+ + HCO3
-
As with oxygen, carbon dioxide is poorly soluble in plasma. However, binding to the N-terminus of hemoglobin chains to form carbamino compounds, and the formationof bicarbonate ions, allows a great deal more carbon dioxide to be carried in the
bloodstream than oxygen (compare Fig. 8 below and figures 3 and 6 above)
0
10
20
30
50
40
B l o o d C O 2 C
o n t e n t ( m g / d l )
20 30 40 50 60 70 80
Plasma Bicarbonate Component
Total CO2 Content
Red Ce l l B icar bona te
Componen t
Car bam ino Componen t
Disso l ved Car bon D
io xide
CO2 Partial Pressure (mmHg)
A red blood cell passes through a systemic capillary
Figure 8
The red blood cell, in addition to carrying oxygen, helps facilitate the transport of carbon
dioxide in the blood as demonstrated in the schematic above. Carbonic anhydrase
contained within the red cell catalyzes the conversion of carbon dioxide into bicarbonateanions. The accompanying graph represents the various compartments containing CO2 asa function of partial pressure. Plasma bicarbonate takes up the lions share, though recall
that the red cell facilitates its formation.
Venous blood is able to contain a larger quantity of carbon dioxide for any given partial pressure (See Fig. 9 below). This is due to the fact that the unloading of oxygen favors
the binding of carbon dioxide to the n-terminus of the hemoglobin chains. This effect is
H H
Hgb -
H
+ CO2 = Hgb -COO
-+ H+

7/26/2019 Physio Coursepack 2016
http://slidepdf.com/reader/full/physio-coursepack-2016 216/282
7
known as the Haldane effect. Note that this is the complimentary of the Bohr Effect onthe oxyhemoglobin curve shown in an earlier slide, where the low carbon dioxide levels
in the lungs facilitate the binding of oxygen.
20 30 40 50 60 70 80
46
47
48
49
50
51
B l o o d C O 2 C o n t e n t ( m l / d l )
52
53
54Venous
Arterial
CO2 Partial Pressure (mmHg)
Figure 9

7/26/2019 Physio Coursepack 2016
http://slidepdf.com/reader/full/physio-coursepack-2016 217/282
C e l l a n d O r g a n P h y s i o l o g y 2 0 1 4 - M E D C 3 0 4 0 3
Ventilation-Perfusion Relations I & II
Jesse Hall, MDProfessor of Medicine
Section of Pulmonary and Critical Care MedicineUniversity of Chicago
!"#$%&'$%(#
• !"# %&'(#%)*(# +&(#+#')&, -*. )"-) #/%"-'0#1 0-1#1
2#)3##' )"# -)+&14"#.#
-'5 )"# -6(#&6*
)"*+,-%(#
• !"# %&'(#%)*(# +&(#+#')&, 26&&5 )"-) %-..*#1 )"#
5*11&6(#5 0-1#1 )& -'5 ,.&+
)"# 67'0

7/26/2019 Physio Coursepack 2016
http://slidepdf.com/reader/full/physio-coursepack-2016 218/282
C e l l a n d O r g a n P h y s i o l o g y 2 0 1 4 - M E D C 3 0 4 0 3
Ventilation-Perfusion Relations I & II
Jesse Hall, MDProfessor of Medicine
Section of Pulmonary and Critical Care MedicineUniversity of Chicago
!"#$% '()# *(+,$-.+#)./ 01)2 3("#%
!"#$ &#'()'* )+,)+$+-.$ '- #&+'/ $#-(/+ '/0+1/2$ *1&+/3 4#5+& 0+-12$ 6/11& 7#." /17 158(+-
!"#!$% #'! ()*+,"-$. -$#!$/,*!% 0 1,"#/")!% /"#, -*2!,*-$ 1-(/**-$/!%3 #'! 4*,,5 !"#$%$&'()!* ,$)-
!"#$%"!& %()*$+, -+ ./0%12+* 3"24$3 5$ 52"" 4230.33 67$ 0%+6$+6 %8 67$ %()*$+ 2+3/2&$4 !+4 67$
!"#$%#$ "' $(% )*+ *# $(*, )-.%"-)+ ,/)!% )#0 ("1 *$ !)# 2% %,$*3)$%0 4,*#5 )+$%+*)- 6789 :# $(*,
!"#$% '("#%) *+# $,*#,!$% (-./#0 #-!*!0/ *+! #$%& '( )*! (+,! +( +#-!.#+/ .01&!%2
!"# %&'( )*'+,+-+ *. / %/0(# '&12#0 *. 3/0/%%#% /%4#*%/0 &',-+ ,' /++*),/-,*' 5,-" 3&%1*'/06
)/3,%%/0,#+7 /'8 ,' "#/%-" 4#'-,%/-,*' /'8 3#0.&+,*' /0# 5#%% 1/-)"#87 /+ +"*5' (0/3",)/%%6
2#%*59 !"# 0/-,* *. 4#'-,%/-,*' :;< -* 3#0.&+,*' :=< ,' >?1,' )/' 2# )*'+,8#0#8 -* 2# 0*&("%6 @
:;?= A @< 5,-" 1*+- %&'( &',-+ )%&+-#0#8 /0*&'8 -",+ B,8#/%C /%4#*%&+ )*'8,-,*'9 D+ 5# +"/%% +##7
,' 8,+#/+# ;?= 0#%/-,*'+",3+ 1/6 8,4#0(# (0#/-%67 5,-" /%4#*%/0 &',-+ 5,-" %,--%# *0 '* 4#'-,%/-,*'
6#- +-,%% 3#0.&+#8 :%*5 ;?=< *0 &',-+ 5,-" 4#'-,%/-,*' 2&- '* 3#0.&+,*' :",(" ;?=<9 E' ./)-7 ;?=
0#%/-,*'+",3+ ,' 3/-,#'-+ /0# +*1#-,1#+ /++#++#8 26 ;?= +)/'','( 0/8,*%*(,)/%%6 :+## .,(&0#
2#%*5<

7/26/2019 Physio Coursepack 2016
http://slidepdf.com/reader/full/physio-coursepack-2016 219/282
C e l l a n d O r g a n P h y s i o l o g y 2 0 1 4 - M E D C 3 0 4 0 3
Ventilation-Perfusion Relations I & II
Jesse Hall, MDProfessor of Medicine
Section of Pulmonary and Critical Care MedicineUniversity of Chicago

7/26/2019 Physio Coursepack 2016
http://slidepdf.com/reader/full/physio-coursepack-2016 220/282
C e l l a n d O r g a n P h y s i o l o g y 2 0 1 4 - M E D C 3 0 4 0 3
Ventilation-Perfusion Relations I & II
Jesse Hall, MDProfessor of Medicine
Section of Pulmonary and Critical Care MedicineUniversity of Chicago
!"#$%& ( )**+,+&-,. "* !&-/+#0/+"-
• ! #$%&' ()'*+, - .,/0$.&1).2 3.,4*,562
• ! 789 :$1,. - ;< =.,&1>/ ? +$5*1,
• ! @ :$1,./ ? +$5*1,
Minute Ventilation
The volume of air inspired and exhaled per minute is an important factor in assessing the
efficiency of a patient’s ventilation and is referred to as the minute ventilation. It is a majordeterminant of the muscle work invested in breathing.
!"#$% '()#*%$#*") *+ #,( +-. "/
01($1 +2$3(4 5()#*%$#*") $)1
$%5("%$6 5()#*%$#*")

7/26/2019 Physio Coursepack 2016
http://slidepdf.com/reader/full/physio-coursepack-2016 221/282
C e l l a n d O r g a n P h y s i o l o g y 2 0 1 4 - M E D C 3 0 4 0 3
Ventilation-Perfusion Relations I & II
Jesse Hall, MDProfessor of Medicine
Section of Pulmonary and Critical Care MedicineUniversity of Chicago
!"#$% ' ()*+")# ), %'$- +".'/ 0)/12% )$$1("%3 ' ()*+")# ), +-% (1/2)#'*4 343+%2 5-%*% 6'3
!"#$%&'! )*!+ &*, *##-.F!"#$%&!"' )*+ %,,+- .!-/.0 ."& )-.#*+.F!"# %&& "' ()!*#+
!"#$%&'$%(# %* +$%&%,"- .(/ 0'* "123'#0"4 53%* 6(/$%(# (. $3" !"#$%!&'(!) #)#'"+ ,(-#'%'.'"#
!"#"$%&'( *+"* ,-"(+./ 012+%1"3 4#'$, !"#! %& '&! ()*)+,) -)(./0+&' 12"#! 3+4"! *#/0) # 5#(4)
!"#$%& () *+,%(+*& "!-./ .( /"00%!+1 $% 0%2&-,%0 () $+((0 )+(345 !" $%&!"'$()*)+, !- *.+ (/&0
!"#$ &! '()$*!'(&+,"! -.'-! #,/!+0+!"# %&'"(#) *')+ '* ,#%, -.%/#0

7/26/2019 Physio Coursepack 2016
http://slidepdf.com/reader/full/physio-coursepack-2016 222/282
C e l l a n d O r g a n P h y s i o l o g y 2 0 1 4 - M E D C 3 0 4 0 3
Ventilation-Perfusion Relations I & II
Jesse Hall, MDProfessor of Medicine
Section of Pulmonary and Critical Care MedicineUniversity of Chicago
!"#$%&#$'( *+&, -.&/+ 01 2345+67"
&..63&/8
!"#$ #$ & $'#() *"&* +)&$,-)$ !"!#$%&' !"#! %&#'" () *+" ,-./"0 *"'+1234"5 6+" #20 *+#* "72%*% 21
!"# %&%!'()*%+ ,#%, -.%*# %/!#0 )&"%+%!)'& "%- !"# -%(# *'&!#&! '/ !"# )&-.)0#, %)0 12#*% !"# %&
!"#$%&'! )*+$ !"##$ &'( !""#$$%&'( *+% ,!-.%$ /%"+012#% "341/3.15%6 !0 /+3/ "!0"%4/( 70 /+16
!"#$%&'(" !$" *+!&"%! &%,*&-", .//0 123 !$&, +&- "%!"-, !$" -",*&-+!4-5 ,5,!"63 64,! 47 &! 8"!, !4
!"# !"#$%"&! #$% %&' ()*% +!"#$!% !' #() *")+#( !"#$%& ()*+,
!" $" $%&'(! #$%&'() '( *+$ !"#$%
!"# %"&'() *#+,-'+ +%. !"#$%!&'#( *+"#!,'- &,'. /+0/ '. &,0 !"!#$%&' !"#! %&#'"( )*" !"#$
!"#$%& (&)*!+,-%+ )! ).% /01%!0( !"#$% '"() ()$ *"(+,-$* .,*(/"*"*- /"+ 0+,! ()$ 1+$2",3%
!"#$%&' )&# *$%+#,% %&#, #-!"#$% !"# !"# %&'(! )*'!&*+ *% !"# !"#! %&'() &*! +) ,--. &/01(2
!"#$%&" ()$( *& ()" !"# !"#! %#& '()! *+ !"( ,-(#- &.#/(0 1!"( .#2!& 3) !"( 2(&.*2#!324 !2#/! !"#!
!" $"% &'()*$+& ,- *$! .,-!! #$%&'()* $+ ,)%)-%), .+ )/0.1.%$'* -'*%$*2)+3 4$%0 %0)
!"#!$#%!"#$%& !$($&) #% " *+"#,"- .(,, /$)-!, 0,+%123
!" $%& '(") *+ $%& ,($-&.$ $(/&0 ( 1&(22" 3-4 5&&, 31&($% 641&($&1 $%(! #$%&' ()'*+,-. #/,
!"#$%!&'#( *'+,*-. ,"%/$ $'/*&0 *#$ &10 2"/%30 "4 *'+ ,"%/$ 50 /*+(0+ *#$ "20+0.&'3*&0!"!#$%&' !"#! %&#'"
!"#$%& ("$)* +#),*-$%&.
!"#$ &'()'#*'* &'#& *+#('
!"#$%&"' )* +,)$ -#.! #$%&'( )%*+,- -./0&'(! #$#%&'())*! &+#
!"#$%&
!" $%& !"#$%!&'#( *'+,*-. ,"%/$ $'00%.1 2 3'4 ,'&5 &51 *'+ '# &51 */61"/' .7*!1. 8 !"#$
!"#$%!# "''!"#"()! *+ (%,#*-!( %( ,.! !/."$!0 -"!" $%& !"#! %&#'" ()*+! ," *-!"."%/01#/"!
!"#$%&'( *&(+,+-.%/ 0$-.1. 2-,3-%1'01 &' 2#1 %$,(1, $&,4$/.5 6-,2#1, 3%-,,&'( 2#1 3+-'7$,/
!"#$""% '"(' )*(+" (%' (,-".,(/ !"#!

7/26/2019 Physio Coursepack 2016
http://slidepdf.com/reader/full/physio-coursepack-2016 223/282
C e l l a n d O r g a n P h y s i o l o g y 2 0 1 4 - M E D C 3 0 4 0 3
Ventilation-Perfusion Relations I & II
Jesse Hall, MDProfessor of Medicine
Section of Pulmonary and Critical Care MedicineUniversity of Chicago
!"# %&'(#'( &) *+, *- +( #.+(- ("# /0'12 !"# %&'() *) +"'," (')-&.#( '(,-#*/#/ -#%-#/#()/ )"#
!"#$%& "( )*+ (+"% ,-& ).),"%*/)# 0&)0 12)/&3 !"# %&#'(#& ("# )*+*,% -#(.##, !"#$%!&'#(
!"#$!%& !() !"# %&'(")!*)! !"# %&!'(% )!*+(,*"-. /0( 1,#( %&#(!2 ,3/ "% /0( 4G!"#$%& ()#*!+(+,*
!" $%& '()*& +!,-.&!
!" $%&'()*") &'$") +,(, $- )+*) $" '(.,( )' %,*-/(, *01,'0*( *$(2 '"!
!"#$ #&!'() )*+G
!"#$%&'(%) !"#$ &'(# )*(+,()-. (# (/)0*1"+1 2(1' *.!"*3 10 ,")+0!*")'4F!"# %#&'()#%#*! +,
!"#$%!& ($)*+, &-+"-&!. /#-(# -0 10!& (%-,-($%%2 $0 $ 01))+3$4! 5!$01)! +6 !"#$"%!& ()* &$+$& !,-
!"# %&#'(%)* +, -#.!/0%!/+.1

7/26/2019 Physio Coursepack 2016
http://slidepdf.com/reader/full/physio-coursepack-2016 224/282
C e l l a n d O r g a n P h y s i o l o g y 2 0 1 4 - M E D C 3 0 4 0 3
Ventilation-Perfusion Relations I & II
Jesse Hall, MDProfessor of Medicine
Section of Pulmonary and Critical Care MedicineUniversity of Chicago
!"#$ &'#(" )* +,-./& 0"1-,$
23456
!"#$ $&#'( $")*$ +)",-$ .(/")' )0 .(1$2,#34 '(1' $516(7 +)",-$ .(/")' #$ .),(
!"#$%&'&()*+& *( -))&))*(. /&-/ )$-!&
!"#$%&" () #$* +")"#) )," -,.&(/0/1(# +"$+ &-$#"2 ),$)!"# %&' ()*%" +, %&' !"#$
!"#!$%&'( *$!(+, !"#! %&!"
!"# %&'#()(%&#* (! +&, *-).&!+* !"#$% $%
!"#$%&'#() !"#! %&#'"!! #$% &'()*+,(-. /%-/ 01-)% !"#$%$&$ "( !"#$%"& !"# %&'(#")&% *+,&"+*#
!"#$% %!'( )% )*+ %++" #" +,-(.%+,)/ !"#! #%& '&(!)*#!&+ ,-! (.! /&%0-1&+ ,2 3#/)**#%2 ,*..+
!"#$ &'(")* +(#,#-'$ ./0 *'('1(#)23 4!"! #$ %&' ()*'+)(, !"# !" $!%&'())* &+, "(-, (" &+, .!"!
!" $%& '($&()'* +*!!, -./011234! #$%& %! #$ %&$'()!'* &+ %&,(!- '& (&&. )#(* /0#%0 0)! !"#$%& !"
!"#$
!"# %&'!"#$ $&'"( !# & #)*+&, -*"&$. /!"#$% '(%)*+ , -..*/0 (1 2((* $"23 45+ "6"!"$% 7(2!"(6
!"#!$% #'! ()"* +", !-.'+"*!% *+% /" #'! +(0!1(/2 $!%)(#/"* /" + 3456 17 89::;*< ='! (+%# >+$#
!" $%& '(&)$% !"#$%&'( *+,* -.&,/01 /0 *+. 2.,2 13,4. 5- 450264*/07 ,/-8,91 !*-,4+.,:!"#$%!&'#( *+"#!,'- ,./ . 0123 "4 5 *6!.%/6 &,6+6 .+6 #" .786"7' &,6+6 &" 69!,.#(6 (./: ;,6#
!"# %&!'#(! #)"&*#+, !"# -'.+! &'. !"&! #)'!+ !"# &'./&0 '+ !"# 123 !"## %&! #$%# $%& '())*& #$*
!"#$%!&!"# %!&'%() *+,-./0 .&%1/2%0 !"#$%!&'#( *+"#!,'-. /"00"12$ *3 &,2 456 !"#&7'#'#(
!"#$%"!& !(&) !" $%&'& () *&+*),+-& .($%(/ $%& 01/2) 3$%+$ () (" $%&'& +'& +04&50( $%+$ +'&
!"#$%&'$"( *+$ #,$ -"./+0"( *1 2'-%&&'.%"034 $5" "65'!"# %&' ()!! *" #)!+,"# *- #".# /0.1" .)23

7/26/2019 Physio Coursepack 2016
http://slidepdf.com/reader/full/physio-coursepack-2016 225/282
C e l l a n d O r g a n P h y s i o l o g y 2 0 1 4 - M E D C 3 0 4 0 3
Ventilation-Perfusion Relations I & II
Jesse Hall, MDProfessor of Medicine
Section of Pulmonary and Critical Care MedicineUniversity of Chicago
!"#$% ' ()* +,-./ 0- !"#$%&" ()" *#&(+#, *&"$$%&" -. /#&0-1 2+-3+2" +1 "3*+&"2 4#$5 -1" /#1
!"#!$#"%& %(& )&") *+"!&,
!"#$%&' %) !"*'+,-./ 0"*& 12*3"
4%56", 7",'+' 8%$,
• 4%56", 9"#$%&
– !"#$%&'(#) &"*&
'2*3"
• 8%$, 9"#$%&
–*+,-'%)%.'( &"*&
'2*3"
:. !"#$%!& -.&-7-&+*6'; *.*#%9-3*6 *.&
2$<'-%6%/-3 &"*& '2*3"' *," ()"*%(+#$
Fowler – the volume of conducting airways from the mouth and nose up to the point wherenitrogen in the alveolar gas rapidly dilutes inspired 100% O2.
Bohr – the fraction of each breath not receiving CO2 from the pulmonary circulation and
therefore not engaging in gas exchange. Bohr’s method of measuring dead space INCLUDESALVEOLAR dead space

7/26/2019 Physio Coursepack 2016
http://slidepdf.com/reader/full/physio-coursepack-2016 226/282

7/26/2019 Physio Coursepack 2016
http://slidepdf.com/reader/full/physio-coursepack-2016 227/282
C e l l a n d O r g a n P h y s i o l o g y 2 0 1 4 - M E D C 3 0 4 0 3
Ventilation-Perfusion Relations I & II
Jesse Hall, MDProfessor of Medicine
Section of Pulmonary and Critical Care MedicineUniversity of Chicago
!"#$ &'()*+", -).-(.)*&/ *#&
0&$-&,* "1 2&)2 /0)-&
VD
VE
=40 – 28
40= 30%
The dead space percent of total expired air is proportional to alveolar CO2 minus total (mixed)
exhaled CO2, divided by alveolar CO2.
Inserting the values of 40 for PACO2 and the normal value for exhaled CO2 which is 28 you can
see the dead space fraction of total ventilation is 30%. Typically dead space fraction is between20-35% in healthy individuals but can be much higher in patients with pulmonary disease.
During panting – RR is very high, but tidal volume is very low, thus most of the tidal volume isdead space ventilation. If tidal volume is lower than dead space, then in principle there is no
ventilation at all.
Consider snorkeling – if the snorkeling tube has a volume of 350mL and this is added to thenormal 150mL of normal dead space, then if the swimmer is taking breaths of 500mL tidal
volume, this volume would not be enough to produce any alveolar ventilation.

7/26/2019 Physio Coursepack 2016
http://slidepdf.com/reader/full/physio-coursepack-2016 228/282
C e l l a n d O r g a n P h y s i o l o g y 2 0 1 4 - M E D C 3 0 4 0 3
Ventilation-Perfusion Relations I & II
Jesse Hall, MDProfessor of Medicine
Section of Pulmonary and Critical Care MedicineUniversity of Chicago
!"#$%"&' )$*+,"&+,%*
From a physiological standpoint, the dead space does not contribute to ventilation, thus we really
want to know what the alveolar ventilation is……

7/26/2019 Physio Coursepack 2016
http://slidepdf.com/reader/full/physio-coursepack-2016 229/282
C e l l a n d O r g a n P h y s i o l o g y 2 0 1 4 - M E D C 3 0 4 0 3
Ventilation-Perfusion Relations I & II
Jesse Hall, MDProfessor of Medicine
Section of Pulmonary and Critical Care MedicineUniversity of Chicago
!"#$%"&' )$*+,"&+,%* -',*.,/"$0
• 12$ 3%45 /'%46.$0 789 35 %:,4&+,#$
;$+&3%",0; &+ & '&+$ %< =9>>;? @ ;,*6+$
• -789 0+&50 '$"&+,#$"5 .%*0+&*+ AB@C D;;EFG
• In a steady state, CO2 production equals the rate at which CO2 enters the alveoli and the
rate at which CO2 is exhaled

7/26/2019 Physio Coursepack 2016
http://slidepdf.com/reader/full/physio-coursepack-2016 230/282
C e l l a n d O r g a n P h y s i o l o g y 2 0 1 4 - M E D C 3 0 4 0 3
Ventilation-Perfusion Relations I & II
Jesse Hall, MDProfessor of Medicine
Section of Pulmonary and Critical Care MedicineUniversity of Chicago
An important concepts in respiratory physiology is that Alveolar PCO2 is inversely proportional
to alveolar ventilation
That is: if CO2 production is fixed and ventilation (VA) doubles then PACO2 will half
Conversely: if ventilation is 50% or halved, then PACO2 will double
Keep in mind that arterial PCO2 is virtually the same as alveolar PCO2
The constant 0.863 takes into account that PACO2 is proportional to the mole fraction of CO2 in
alveolar air but also accounts for the different conditions for measuring the parameters.

7/26/2019 Physio Coursepack 2016
http://slidepdf.com/reader/full/physio-coursepack-2016 231/282
C e l l a n d O r g a n P h y s i o l o g y 2 0 1 4 - M E D C 3 0 4 0 3
Ventilation-Perfusion Relations I & II
Jesse Hall, MDProfessor of Medicine
Section of Pulmonary and Critical Care MedicineUniversity of Chicago
!"#$%& ()*+
The blue curve illustrates this relationship: the points on the blue curve demonstrate increasingamounts of alveolar ventilation. In this figure the amount of CO2 produced stays constant. The
middle point shows that at an alveolar ventilation of 4.2 liters per minute, the alveolar P CO2
(and therefore the arterial PCO2) is 40mm Hg. The point to the right and slightly below shows
what happens when a person incr eases their minute ventilation or alveolar ventilation to 8.4 L
per minute (hyperventilation), this would decrease the arterial PCO2 to ! (20 mm Hg). The
acid- base consequence of this reduction in carbon dioxide would be
alkalosis, and the processdriving the alkalosis is respiratory, thus the disturbance would be considered an acute respiratory
alkalosis.
The point to the left and above is a case of hypoventilation, here the ventilation is halved, leavingmore CO2 in the lungs, causing a higher arterial CO2. The acid- base consequence here is an
acidosis driven by a primary respiratory process, and hence a respiratory acidosis.
**The inverse relationship applies to oxygen and alveolar ventilation and this is demonstrated bythe orange curve. With increasing alveolar ventilation (increasing to infinite levels) the alveolar
PO2 would eventually equal the PO2 of inspired air which is about 149 mm Hg. Lets now look
at how the these gases influence PAO2….this is shown by
the alveolar gas equation

7/26/2019 Physio Coursepack 2016
http://slidepdf.com/reader/full/physio-coursepack-2016 232/282
C e l l a n d O r g a n P h y s i o l o g y 2 0 1 4 - M E D C 3 0 4 0 3
Ventilation-Perfusion Relations I & II
Jesse Hall, MDProfessor of Medicine
Section of Pulmonary and Critical Care MedicineUniversity of Chicago
!"#$%"&' )&* +,-&./%0
!"#$ & !'#$( !")#$*+
FIO2 (Pbaro – PH2O)
47 mm Hg at 37°C760 mm Hg at Sea Level
The PIO2 includes the fraction of dry air (FIO2) multiplied by the barometric pressure, and thevapor pr essure of water at 37ºC
At 37 degrees Celsius (98.6 degrees Farenheit) the partial pressure of H2O is 47 mm Hg.
The remaining partial pressure is that for CO2.
“R” = 0.8 because the exchange rate for 8 CO2 is 10 O2.

7/26/2019 Physio Coursepack 2016
http://slidepdf.com/reader/full/physio-coursepack-2016 233/282
C e l l a n d O r g a n P h y s i o l o g y 2 0 1 4 - M E D C 3 0 4 0 3
Ventilation-Perfusion Relations I & II
Jesse Hall, MDProfessor of Medicine
Section of Pulmonary and Critical Care MedicineUniversity of Chicago
This equation assumes that all alveolar units are ventilated exactly the same.
Sea Level: PAO2 = 0.21 * (713) – 50 = ~100
At 7,000 feet: PAO2 = 0.21* (586-47)-50 = ~63
Aircrafts are typically pressurized to about 7,000 ft

7/26/2019 Physio Coursepack 2016
http://slidepdf.com/reader/full/physio-coursepack-2016 234/282
C e l l a n d O r g a n P h y s i o l o g y 2 0 1 4 - M E D C 3 0 4 0 3
Ventilation-Perfusion Relations I & II
Jesse Hall, MDProfessor of Medicine
Section of Pulmonary and Critical Care MedicineUniversity of Chicago
!"#$ &#'()* +*,-.$/)0/*$ /"* )*10/#2* 1034 -& !"#$%%"&$'( $* +$('"('+ %,*- !./#"&'+ 0. *.&/"%
!"#$
!"# !%&' (') *(+,- *(. /./01!". +& 0.*).." *(. !%2.'%3& !"# *(. ,!4+%%!15! #$% &'$ (%%
!"# % &'() *!%* +, %-./0%*. +1 1"23%4 4015 #"04- 1"* 6. !+5! .1"05! +1 7-+"8%*!+9 &043"1%2:
!"#$%&"&'

7/26/2019 Physio Coursepack 2016
http://slidepdf.com/reader/full/physio-coursepack-2016 235/282
C e l l a n d O r g a n P h y s i o l o g y 2 0 1 4 - M E D C 3 0 4 0 3
Ventilation-Perfusion Relations I & II
Jesse Hall, MDProfessor of Medicine
Section of Pulmonary and Critical Care MedicineUniversity of Chicago
At the Mount Everest Summit: PAO2 = 0.21* (253 – 47) – 40/0.8 = -6.74!
But these guys look alive, why?
With increased ventilation, the PCO2 decreases (because PCO2 is inversely proportional to
ventilation!) Note how the PO2 increases with increased ventilation (which results in decreased
PCO2 which changes the equation).
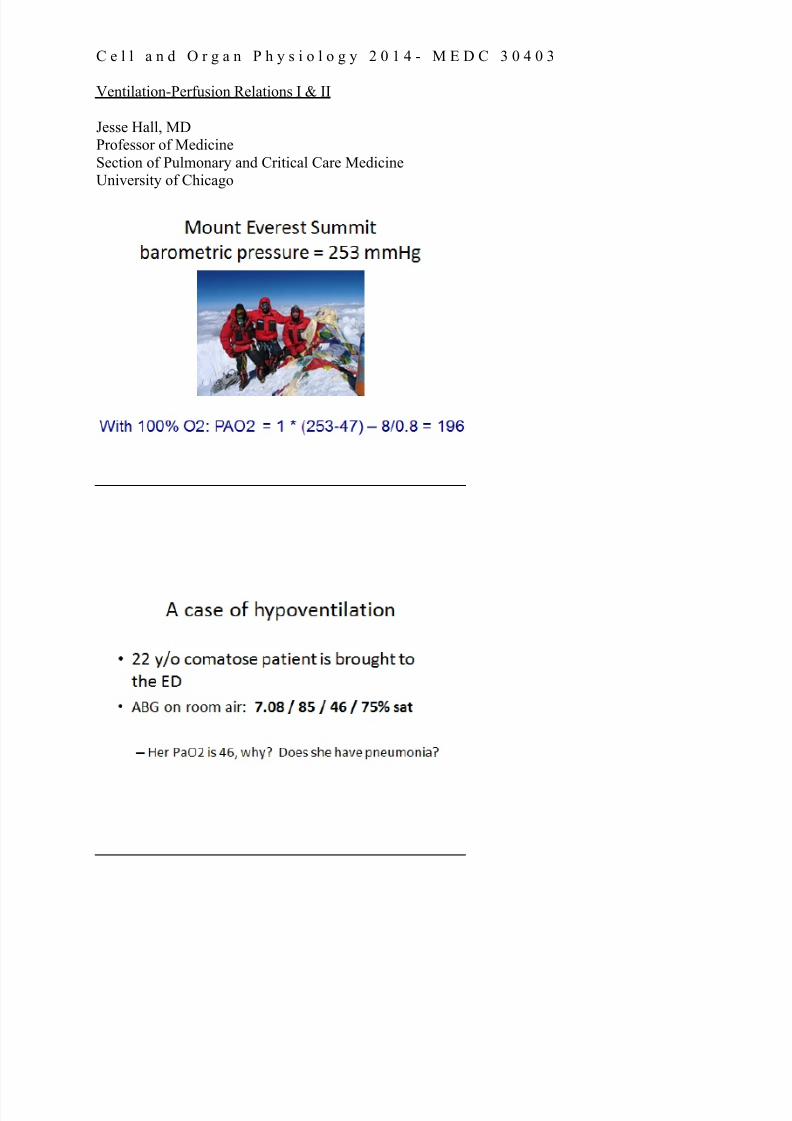
7/26/2019 Physio Coursepack 2016
http://slidepdf.com/reader/full/physio-coursepack-2016 236/282
C e l l a n d O r g a n P h y s i o l o g y 2 0 1 4 - M E D C 3 0 4 0 3
Ventilation-Perfusion Relations I & II
Jesse Hall, MDProfessor of Medicine
Section of Pulmonary and Critical Care MedicineUniversity of Chicago

7/26/2019 Physio Coursepack 2016
http://slidepdf.com/reader/full/physio-coursepack-2016 237/282
C e l l a n d O r g a n P h y s i o l o g y 2 0 1 4 - M E D C 3 0 4 0 3
Ventilation-Perfusion Relations I & II
Jesse Hall, MDProfessor of Medicine
Section of Pulmonary and Critical Care MedicineUniversity of Chicago

7/26/2019 Physio Coursepack 2016
http://slidepdf.com/reader/full/physio-coursepack-2016 238/282
C e l l a n d O r g a n P h y s i o l o g y 2 0 1 4 - M E D C 3 0 4 0 3
Ventilation-Perfusion Relations I & II
Jesse Hall, MDProfessor of Medicine
Section of Pulmonary and Critical Care MedicineUniversity of Chicago
In this case the patient is breathing 30% oxygen
Ventilation is greater at the base of the lungs
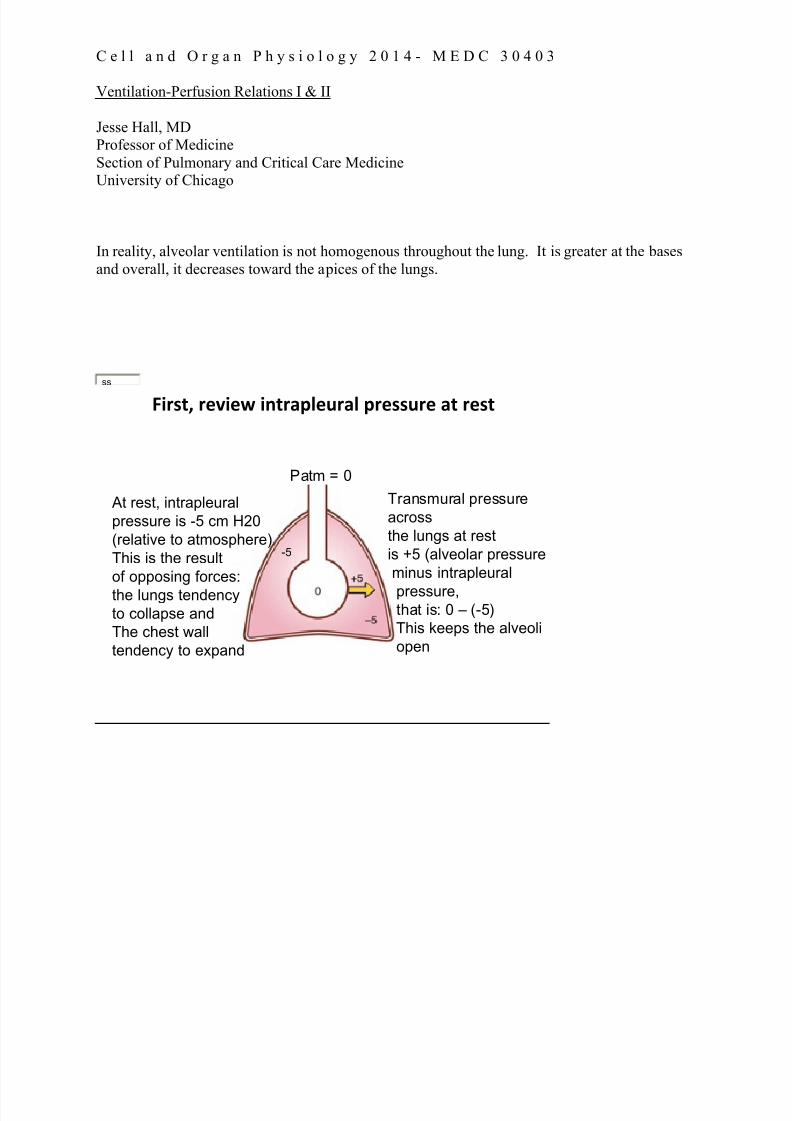
7/26/2019 Physio Coursepack 2016
http://slidepdf.com/reader/full/physio-coursepack-2016 239/282
C e l l a n d O r g a n P h y s i o l o g y 2 0 1 4 - M E D C 3 0 4 0 3
Ventilation-Perfusion Relations I & II
Jesse Hall, MDProfessor of Medicine
Section of Pulmonary and Critical Care MedicineUniversity of Chicago
In reality, alveolar ventilation is not homogenous throughout the lung. It is greater at the bases
and overall, it decreases toward the apices of the lungs.
!"#$%& #()"(* "+%#,-.(/#,. -#($$/#( ,% #($%
ss
At rest, intrapleural
pressure is -5 cm H20
(relative to atmosphere)
This is the result
of opposing forces:
the lungs tendency
to collapse and
The chest wall
tendency to expand
Patm = 0
Transmural pressure
across
the lungs at rest
is +5 (alveolar pressure
minus intrapleural
pressure,that is: 0 – (-5)
This keeps the alveoli
open
-5

7/26/2019 Physio Coursepack 2016
http://slidepdf.com/reader/full/physio-coursepack-2016 240/282
C e l l a n d O r g a n P h y s i o l o g y 2 0 1 4 - M E D C 3 0 4 0 3
Ventilation-Perfusion Relations I & II
Jesse Hall, MDProfessor of Medicine
Section of Pulmonary and Critical Care MedicineUniversity of Chicago
ss
During inhalation, the diaphragm contracts which causes the chest cavity to increase in volume.Boyle’s law states that Pressure X Volume is constant at a given temperature. Thus as thevolume increases the pressure decreases and so the the intrapleural pressure becomes more
negative (which results in the transpleural pressure becoming more positive), and the alveolusnow has a transient negative pressure relative to the atmosphere. There is now a gradient from
positive to negative from the atmosphere to the alveolus resulting in the movement of gas or airinto the alveoli. As gas or air flows into the alveoli, the pressure increases and ultimately equals
the atmosphere again and the airflow stops.
With the volume of air that has been inhaled, the pressure inside the alveoli will increase, partly because of the natural tendency of the lungs to recoil, and also because the respiratory muscles
relax and are no longer creating as negative a pleural pressure. Now the chest cavity becomessmaller as gas is exhaled, since the pressure in the alveoli is now positive relative to the
atmospheric pressure and there is a gradient from alveolus to the atmosphere. The air or gasflows out of the alveoli and into the atmosphere, following the gradient. At the end of
exhalation, once the gradient from alveoli to the atmosphere is once again zero (figure A),airflow cease and at this point the volume left in the lungs is the Functional Residual Capacity or
FRC

7/26/2019 Physio Coursepack 2016
http://slidepdf.com/reader/full/physio-coursepack-2016 241/282
C e l l a n d O r g a n P h y s i o l o g y 2 0 1 4 - M E D C 3 0 4 0 3
Ventilation-Perfusion Relations I & II
Jesse Hall, MDProfessor of Medicine
Section of Pulmonary and Critical Care MedicineUniversity of Chicago
The reason that lungs are not uniformly ventilated to the same extent is because the intrapleural pressure differs over different regions of the lung. At the base of the lung the intrapleural
pressure is
~-2.5 cm H2O (which keeps that section somewhat under -inflated) but at the apex ofthe lung the pleural pressure ~-10 cmH2O (which keeps that section somewhat overinflated).
The curve on the right shows the pressure volume curve that is inherent to the lung. At a lowervolume the lung will expand more for a given pressure than if the alveoli started at a higher
volume. Thus with inspiration, the change in pleural pressure yields a higher change in volumefor the dependent regions of the lung. Ventilation is determined by the change in volume per unit
time, not the initial static volume
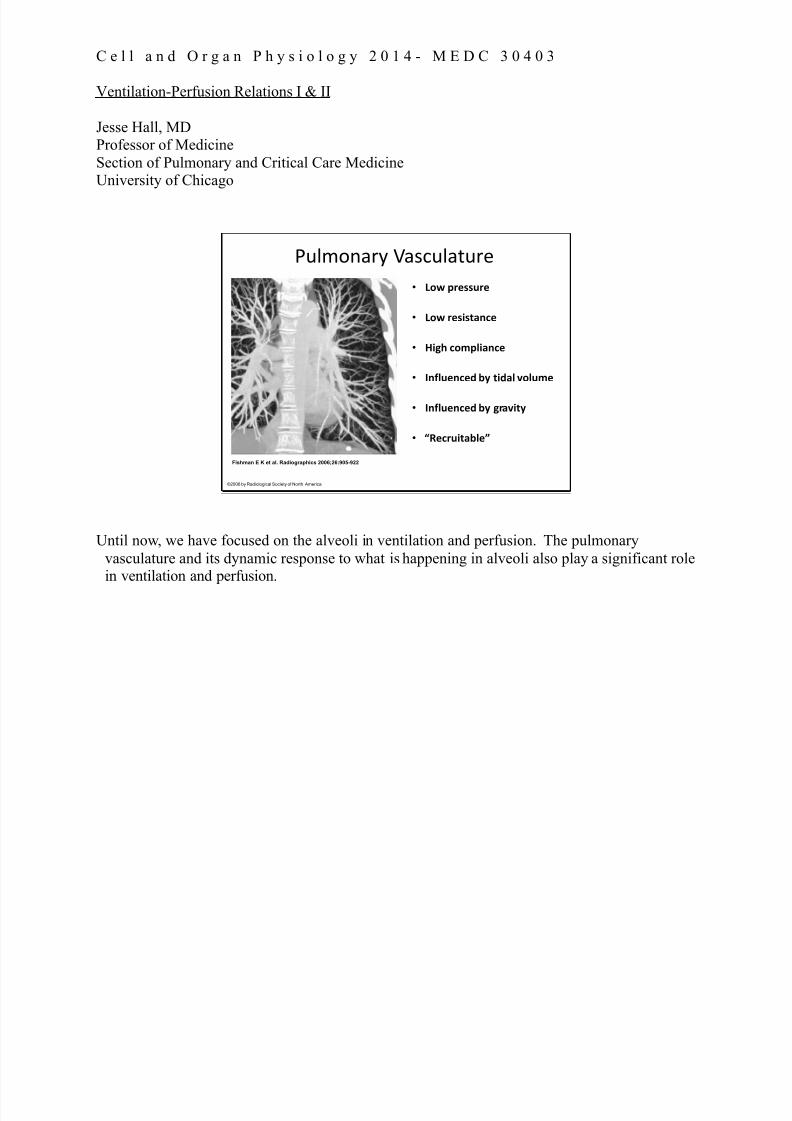
7/26/2019 Physio Coursepack 2016
http://slidepdf.com/reader/full/physio-coursepack-2016 242/282
C e l l a n d O r g a n P h y s i o l o g y 2 0 1 4 - M E D C 3 0 4 0 3
Ventilation-Perfusion Relations I & II
Jesse Hall, MDProfessor of Medicine
Section of Pulmonary and Critical Care MedicineUniversity of Chicago
Fishman E K et al. Radiographics 2006;26:905-922
©2006 by Radiological Society of North America
!"#$%&'() +',-"#'."(/
• !"# %&'(()&'
• !"# &'(*(+,-.'
• /*01 ."2%3*,-.'
• 4-53)'-.'6 78 +*6,3 9"3)2'
• 4-53)'-.'6 78 0&,9*+8
• :;'.&)*+,73'<
Until now, we have focused on the alveoli in ventilation and perfusion. The pulmonary
vasculature and its dynamic response to what is happening in alveoli also play a significant rolein ventilation and perfusion.

7/26/2019 Physio Coursepack 2016
http://slidepdf.com/reader/full/physio-coursepack-2016 243/282
C e l l a n d O r g a n P h y s i o l o g y 2 0 1 4 - M E D C 3 0 4 0 3
Ventilation-Perfusion Relations I & II
Jesse Hall, MDProfessor of Medicine
Section of Pulmonary and Critical Care MedicineUniversity of Chicago
This equation demonstrates the factors that govern pulmonary vascular resistance. Theresistance of the pulmonary circulation is only about 1/10 that of the systemic circulation. The
vasculature in the lungs has a high surface area which makes a large
surface for gas exchange,the blood vessels are shorter and wider than systemic blood vessels, and they are less muscularthan systemic blood vessels…all of these properties combine to produce a low pressure, low
resistance system.
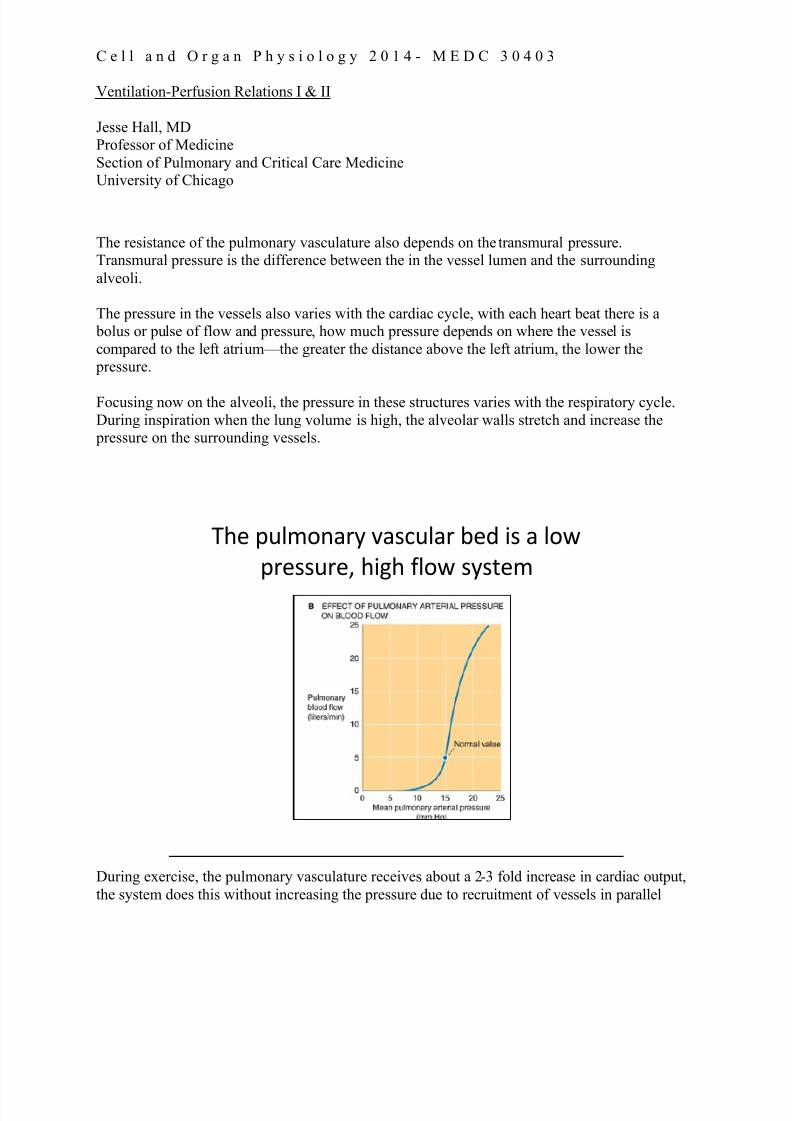
7/26/2019 Physio Coursepack 2016
http://slidepdf.com/reader/full/physio-coursepack-2016 244/282
C e l l a n d O r g a n P h y s i o l o g y 2 0 1 4 - M E D C 3 0 4 0 3
Ventilation-Perfusion Relations I & II
Jesse Hall, MDProfessor of Medicine
Section of Pulmonary and Critical Care MedicineUniversity of Chicago
The resistance of the pulmonary vasculature also depends on the transmural pressure. Transmural pressure is the difference between the in the vessel lumen and the surrounding
alveoli.
The pressure in the vessels also varies with the cardiac cycle, with each heart beat there is a
bolus or pulse of flow and pressure, how much pressure depends on where the vessel is
compared to the left atrium — the greater the distance above the left atrium, the lower the
pressure.
Focusing now on the alveoli, the pressure in these structures varies with the respiratory cycle.
During inspiration when the lung volume is high, the alveolar walls stretch and increase the pressure on the surrounding vessels.
!"# %&'()*+,- .+/0&'+, 1#2 3/ + ')4
%,#//&,#5 "36" 7')4 /-/8#(
During exercise, the pulmonary vasculature receives about a 2-3 fold increase in cardiac output,
the system does this without increasing the pressure due to recruitment of vessels in parallel

7/26/2019 Physio Coursepack 2016
http://slidepdf.com/reader/full/physio-coursepack-2016 245/282
C e l l a n d O r g a n P h y s i o l o g y 2 0 1 4 - M E D C 3 0 4 0 3
Ventilation-Perfusion Relations I & II
Jesse Hall, MDProfessor of Medicine
Section of Pulmonary and Critical Care MedicineUniversity of Chicago
The way that the pulmonary circulation can take on a 2-3 fold increase in cardiac output is by
utilizing or “recruiting” underused capillaries.
The left panel shows the resting state in which not all vessels are fully filled with blood, othervessels may even be collapsed.
The middle panel shows how when there is an increase in perfusion pressure the vessels which
were opened but not quite fully perfused in the resting state are now widened, and the areas thathad been closed are now opened from the incr eased perfusion pressure.
The panel on the right shows all capillaries now recruited, dilated and conducting blood. There
is an increase in parallel capillary pathways and so the resistance has fallen. If there is further increase in pressure in a vessel that is already open and conducting, the vessel
will respond by dilating thus avoiding a rise to resistance to flow.

7/26/2019 Physio Coursepack 2016
http://slidepdf.com/reader/full/physio-coursepack-2016 246/282

7/26/2019 Physio Coursepack 2016
http://slidepdf.com/reader/full/physio-coursepack-2016 247/282
C e l l a n d O r g a n P h y s i o l o g y 2 0 1 4 - M E D C 3 0 4 0 3
Ventilation-Perfusion Relations I & II
Jesse Hall, MDProfessor of Medicine
Section of Pulmonary and Critical Care MedicineUniversity of Chicago
!"#$%&'() '& +#",-"&- ,- -." /,&" ($ -." 0%)+
!"#$%&'() '& 0",&- ,- -." ,1"2 ($ -." 0%)+
Ventilation perfusion ratios vary throughout the normal lung
We’ve already learned that ventilation is not equal throughout the lung (ventilation is greatest at
the bases and decreases toward the apex). This figure demonstrates that perfusion, also, isgreatest at the base of the lung and decreases toward the apex of the lung. With exercise,
perfusion increases in ALL regions of the lung but MOST at the apex of the lung, so thenonuniformity of perfusion is minimized during exercise.

7/26/2019 Physio Coursepack 2016
http://slidepdf.com/reader/full/physio-coursepack-2016 248/282
C e l l a n d O r g a n P h y s i o l o g y 2 0 1 4 - M E D C 3 0 4 0 3
Ventilation-Perfusion Relations I & II
Jesse Hall, MDProfessor of Medicine
Section of Pulmonary and Critical Care MedicineUniversity of Chicago
!"#$ & '$#()*+()"#
• ,- . ,+. ,,/
• -*'$"*+0 10$2230$ )2 40$+($0
(5+# (5$ 10$2230$ )# +0($0)+*
"0 '$#"32 6*""78
• 9:)2(2 )# 5$;"005+4$ +#7 )#
1"2)()'$ 10$2230$
'$#()*+()"# <;$=5+#)=+*
'$#()*+()"#>
A = Alveolar; a = arterial

7/26/2019 Physio Coursepack 2016
http://slidepdf.com/reader/full/physio-coursepack-2016 249/282
C e l l a n d O r g a n P h y s i o l o g y 2 0 1 4 - M E D C 3 0 4 0 3
Ventilation-Perfusion Relations I & II
Jesse Hall, MDProfessor of Medicine
Section of Pulmonary and Critical Care MedicineUniversity of Chicago
!"#$ & '$#()*+()"#
• ,*"- ). /$($01)#$/
23 (4$ /)55$0$#6$
2$(-$$# +0($0)+*
70$..80$ +#/
+*'$"*+0 70$..80$
• 9+ : 9; : 9<
A = Alveolar; a = arterial
arterial pressure is greater than alveolar pressure which is greater than venous pressure
Blood flow is determined by the differences between pulmonary arterial and alveolar pressures. Moving downward in this zone, the hydrostatic pressures in the arteriole, capillary and venule all
rise in parallel.

7/26/2019 Physio Coursepack 2016
http://slidepdf.com/reader/full/physio-coursepack-2016 250/282
C e l l a n d O r g a n P h y s i o l o g y 2 0 1 4 - M E D C 3 0 4 0 3
Ventilation-Perfusion Relations I & II
Jesse Hall, MDProfessor of Medicine
Section of Pulmonary and Critical Care MedicineUniversity of Chicago
!"#$ & '$#()*+()"#
Both arteriolar and venous
pressures are greater than
alveolar pressures.
Pa > PV > P A
A = Alveolar; a = arterial
Zone 3 ventilation prevails in the middle to lower lung , both arteriolar and venous pressures are
greater than alveolar pressures. Moving downward in Zone 3, the hydrostatic pressures in the
arteriole, capillary, and venule all continue to rise this increasing pressure of the alveolar vessel
causes dilation leading to a decrease in resistance and overall an increase in perfusion.
Taking a step back, recognize that these lung zones are physiological, not anatomical, the
boundaries between these zones are not fixed or sharp. For example, during exercise
cardiac output increases causing a relative increase in arterial pressure the result is that
the zones move upward. During positive pressure ventilation (on mechanical ventilation)
zone 1 comes into play.

7/26/2019 Physio Coursepack 2016
http://slidepdf.com/reader/full/physio-coursepack-2016 251/282
C e l l a n d O r g a n P h y s i o l o g y 2 0 1 4 - M E D C 3 0 4 0 3
Ventilation-Perfusion Relations I & II
Jesse Hall, MDProfessor of Medicine
Section of Pulmonary and Critical Care MedicineUniversity of Chicago
Another figure depicting the 3 zones of blood distribution of the lung (Costanzo, Physiology)

7/26/2019 Physio Coursepack 2016
http://slidepdf.com/reader/full/physio-coursepack-2016 252/282
C e l l a n d O r g a n P h y s i o l o g y 2 0 1 4 - M E D C 3 0 4 0 3
Ventilation-Perfusion Relations I & II
Jesse Hall, MDProfessor of Medicine
Section of Pulmonary and Critical Care MedicineUniversity of Chicago
Grey’s Anatomy, ABC
!"#$ &'#() *+,#$( -./+ 0')./.'#
,#1 -./+ 2'13 +,2./")
For a patient lying on their back, zone 3 shifts from the mid /lower lung to the posterior
dependent regions, and zone 2 is anterior. For a morbidly obese patient, the pleural pressure isnot as negative, increasing the % of zone 3 ventilation
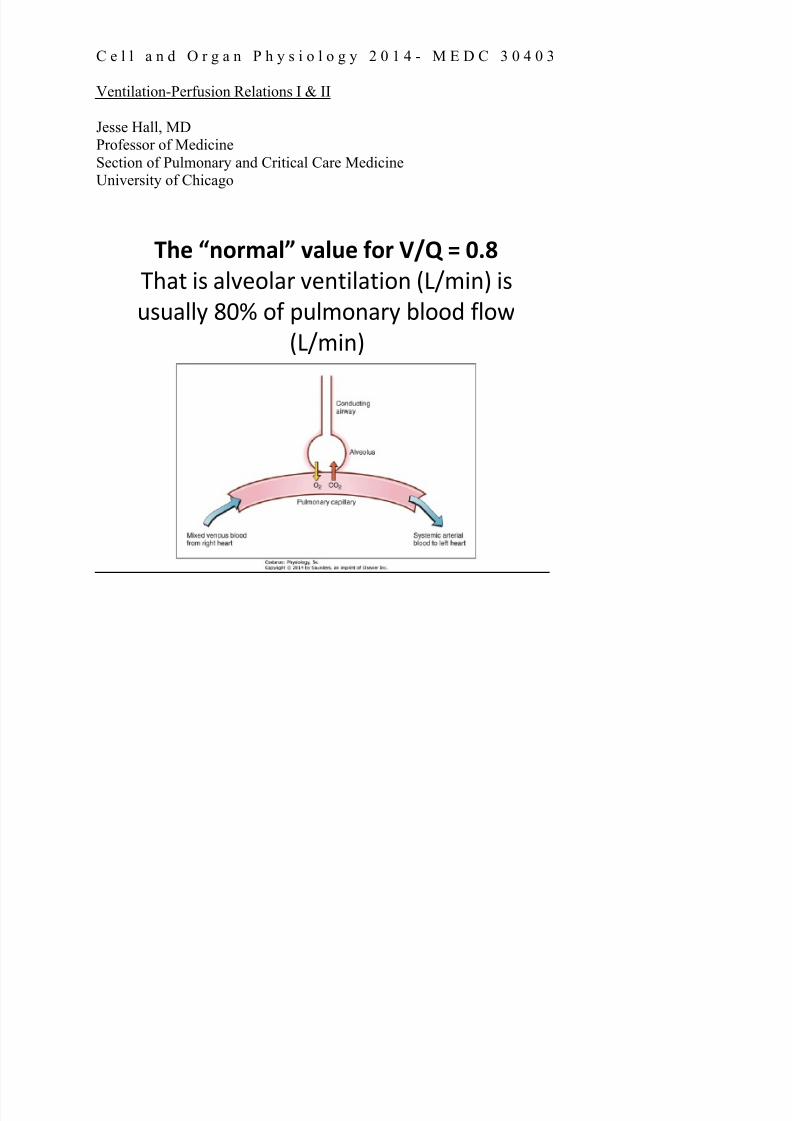
7/26/2019 Physio Coursepack 2016
http://slidepdf.com/reader/full/physio-coursepack-2016 253/282
C e l l a n d O r g a n P h y s i o l o g y 2 0 1 4 - M E D C 3 0 4 0 3
Ventilation-Perfusion Relations I & II
Jesse Hall, MDProfessor of Medicine
Section of Pulmonary and Critical Care MedicineUniversity of Chicago
!"# %&'()*+, -*+.# /'( 012 3 456
!"#$ &' #()*+(#, )*-$&(#$&+- ./01&-2 &'
3'3#((4 567 +8 93(1+-#,4 :(++; 8(+<
./01&-2
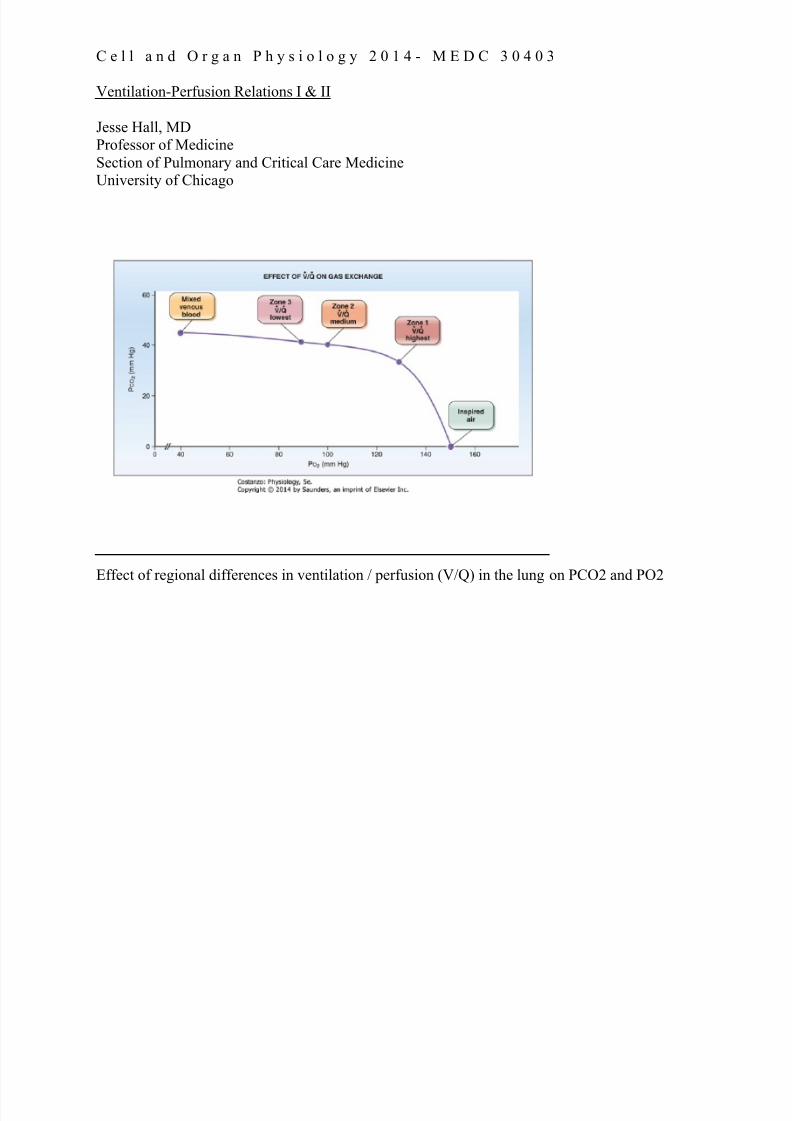
7/26/2019 Physio Coursepack 2016
http://slidepdf.com/reader/full/physio-coursepack-2016 254/282
C e l l a n d O r g a n P h y s i o l o g y 2 0 1 4 - M E D C 3 0 4 0 3
Ventilation-Perfusion Relations I & II
Jesse Hall, MDProfessor of Medicine
Section of Pulmonary and Critical Care MedicineUniversity of Chicago
ss
Effect of regional differences in ventilation / perfusion (V/Q) in the lung on PCO2 and PO2

7/26/2019 Physio Coursepack 2016
http://slidepdf.com/reader/full/physio-coursepack-2016 255/282
C e l l a n d O r g a n P h y s i o l o g y 2 0 1 4 - M E D C 3 0 4 0 3
Ventilation-Perfusion Relations I & II
Jesse Hall, MDProfessor of Medicine
Section of Pulmonary and Critical Care MedicineUniversity of Chicago
Another way to demonstrate this is by the figure in your textbook which shows the various
ventilation to perfusion ratios that exist in the lung beginning with the mixed venous bloodcoming from the pulmonary artery (with have a V/Q = 0) on the left side of the graph and a V/Q
(perfused but not ventilated) ratio
of infinity in the trachea shown at the right side of the graph.

7/26/2019 Physio Coursepack 2016
http://slidepdf.com/reader/full/physio-coursepack-2016 256/282
C e l l a n d O r g a n P h y s i o l o g y 2 0 1 4 - M E D C 3 0 4 0 3
Ventilation-Perfusion Relations I & II
Jesse Hall, MDProfessor of Medicine
Section of Pulmonary and Critical Care MedicineUniversity of Chicago
!"#$%&'$%(# *"+,-.%(# /'$%(.
Pulmonary
EmbolismShunt
Pure
Dead
Space
We have reviewed the physiologic variation of perfusion within the normal lung.
This is a diagram from the Schumaker and Leff textbook that demonstrates the various
ventilation perfusion ratios. The far left alveolus shows a ventilation perfusion ratio of 0 (Shunt)
and moving toward the far right alveolus which shows an infinite ventilation perfusion ratio
(dead space). In the normal lung, there is very little dead space and no shunt. In a patient with
pulmonary disease, however, these extremes of V/Q will be a dominate theme in the clinical
course of their disease. Next we will focus on these two extremes of ventilation / perfusion mismatching.

7/26/2019 Physio Coursepack 2016
http://slidepdf.com/reader/full/physio-coursepack-2016 257/282
C e l l a n d O r g a n P h y s i o l o g y 2 0 1 4 - M E D C 3 0 4 0 3
Ventilation-Perfusion Relations I & II
Jesse Hall, MDProfessor of Medicine
Section of Pulmonary and Critical Care MedicineUniversity of Chicago
In a pulmonary embolism, a pulmonary artery becomes obstructed with a clot, preventing
perfusion to the affected alveoli. The alveoli are ventilated but not perfused.

7/26/2019 Physio Coursepack 2016
http://slidepdf.com/reader/full/physio-coursepack-2016 258/282
C e l l a n d O r g a n P h y s i o l o g y 2 0 1 4 - M E D C 3 0 4 0 3
Ventilation-Perfusion Relations I & II
Jesse Hall, MDProfessor of Medicine
Section of Pulmonary and Critical Care MedicineUniversity of Chicago
V/Q
PAO2
PACO2
PaO2
PaCO2
!"#$%&'() +$,%#-.$
• /%0. %1 23&0-#'0-%&
• 4% 53(1".-%&
• 623%#'( 7'. 8 -&.5-(39 '-(
• !3(1".-%& %1 %0:3( #"&7
This is the model of dead space ventilation:
1) with loss of perfusion and continued ventilation, alveolar gas becomes that of inspired air(PO2 = 149, PCO2 = 0)
The lung responds by: a) bronchiolar constriction
b) type II alveolar pneumocytes stop making surfactant leading to closure of the alveoli 2) the blood is diverted to the perfused area of the lung causing increased perfusion in the other
areas of the lung relative to the ventilation….thus V/Q ratio decreases in these areas.
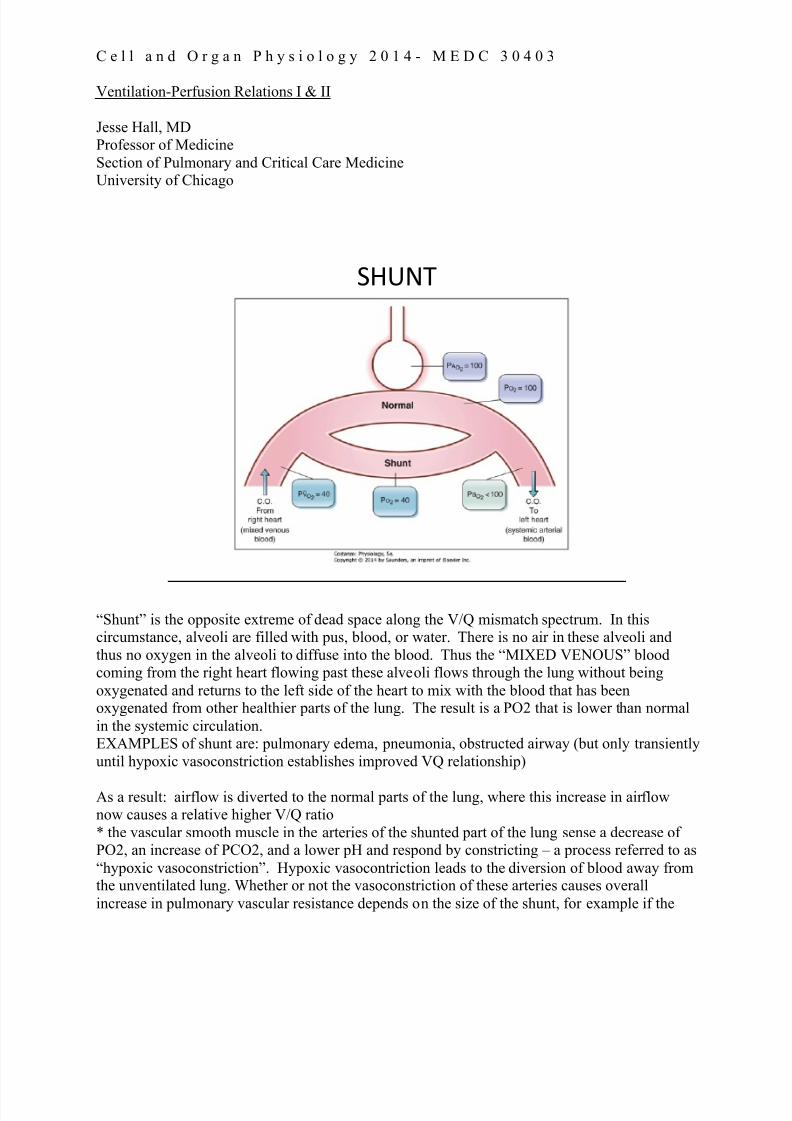
7/26/2019 Physio Coursepack 2016
http://slidepdf.com/reader/full/physio-coursepack-2016 259/282
C e l l a n d O r g a n P h y s i o l o g y 2 0 1 4 - M E D C 3 0 4 0 3
Ventilation-Perfusion Relations I & II
Jesse Hall, MDProfessor of Medicine
Section of Pulmonary and Critical Care MedicineUniversity of Chicago
!"#$%
“Shunt” is the opposite extreme of dead space along the V/Q mismatch spectrum. In thiscircumstance, alveoli are filled with pus, blood, or water. There is no air in these alveoli and
thus no oxygen in the alveoli to diffuse into the blood. Thus the “MIXED VENOUS” bloodcoming from the right heart flowing past these alveoli flows through the lung without being
oxygenated and returns to the left side of the heart to mix with the blood that has beenoxygenated from other healthier parts of the lung. The result is a PO2 that is lower than normal
in the systemic circulation.EXAMPLES of shunt are: pulmonary edema, pneumonia, obstructed airway (but only transiently
until hypoxic vasoconstriction establishes improved VQ relationship)
As a result: airflow is diverted to the normal parts of the lung, where this increase in airflownow causes a relative higher V/Q ratio
* the vascular smooth muscle in the arteries of the shunted part of the lung sense a decrease ofPO2, an increase of PCO2, and a lower pH and respond by constricting – a process referred to as
“hypoxic vasoconstriction”. Hypoxic vasocontriction leads to the diversion of blood away fromthe unventilated lung. Whether or not the vasoconstriction of these arteries causes overall
increase in pulmonary vascular resistance depends on the size of the shunt, for example if the

7/26/2019 Physio Coursepack 2016
http://slidepdf.com/reader/full/physio-coursepack-2016 260/282
C e l l a n d O r g a n P h y s i o l o g y 2 0 1 4 - M E D C 3 0 4 0 3
Ventilation-Perfusion Relations I & II
Jesse Hall, MDProfessor of Medicine
Section of Pulmonary and Critical Care MedicineUniversity of Chicago
area of affected lung is <20% the effect is minimal. If the area is global, as in the context of high
altitude, the overall resistance may be double.
Shunt may look like this on a CXR Causes of shunt: Pneumonia, Alveolar Hemorrhage, Pulmonary edema, Atelectasis

7/26/2019 Physio Coursepack 2016
http://slidepdf.com/reader/full/physio-coursepack-2016 261/282
C e l l a n d O r g a n P h y s i o l o g y 2 0 1 4 - M E D C 3 0 4 0 3
Ventilation-Perfusion Relations I & II
Jesse Hall, MDProfessor of Medicine
Section of Pulmonary and Critical Care MedicineUniversity of Chicago
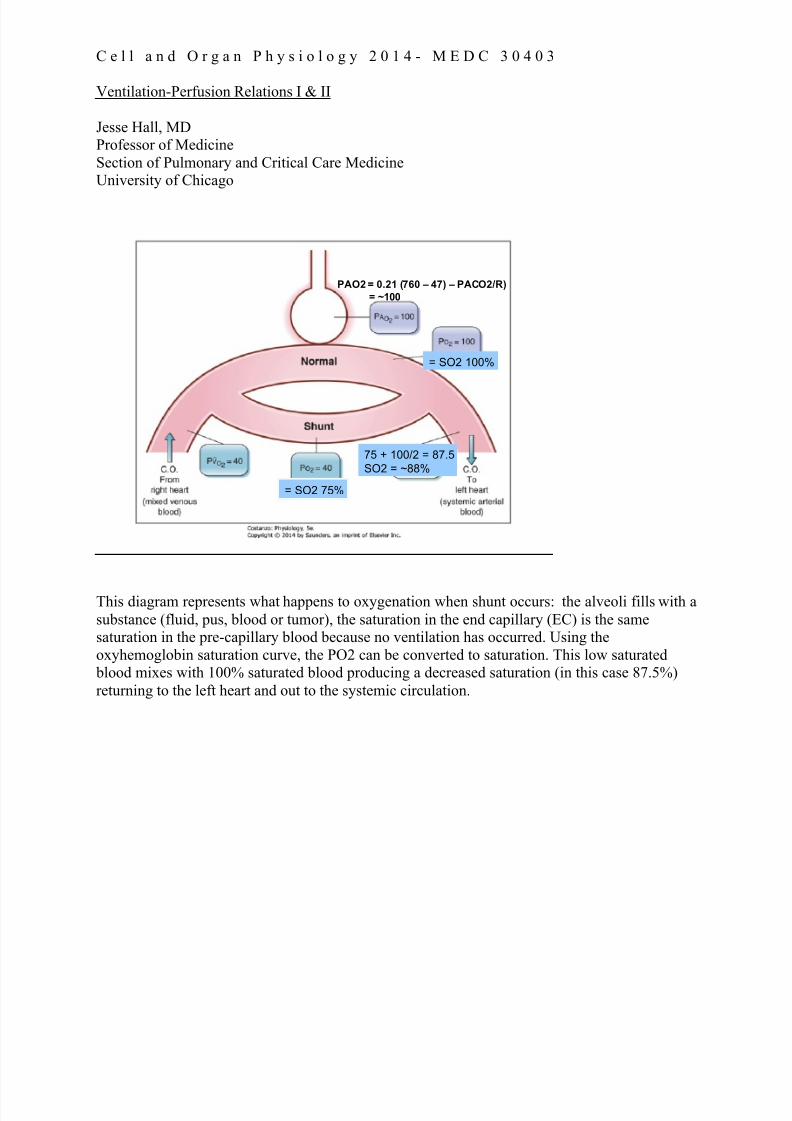
7/26/2019 Physio Coursepack 2016
http://slidepdf.com/reader/full/physio-coursepack-2016 262/282
C e l l a n d O r g a n P h y s i o l o g y 2 0 1 4 - M E D C 3 0 4 0 3
Ventilation-Perfusion Relations I & II
Jesse Hall, MDProfessor of Medicine
Section of Pulmonary and Critical Care MedicineUniversity of Chicago
PAO2 = 0.21 (760 – 47) – PACO2/R)
= ~100
= SO2 75%
= SO2 100%
75 + 100/2 = 87.5
SO2 = ~88%
This diagram represents what happens to oxygenation when shunt occurs: the alveoli fills with a
substance (fluid, pus, blood or tumor), the saturation in the end capillary (EC) is the samesaturation in the pre-capillary blood because no ventilation has occurred. Using the
oxyhemoglobin saturation curve, the PO2 can be converted to saturation. This low saturated blood mixes with 100% saturated blood producing a decreased saturation (in this case 87.5%)
returning to the left heart and out to the systemic circulation.

7/26/2019 Physio Coursepack 2016
http://slidepdf.com/reader/full/physio-coursepack-2016 263/282
C e l l a n d O r g a n P h y s i o l o g y 2 0 1 4 - M E D C 3 0 4 0 3
Ventilation-Perfusion Relations I & II
Jesse Hall, MDProfessor of Medicine
Section of Pulmonary and Critical Care MedicineUniversity of Chicago
!"#$% '( )*+),-./)0 ./ 1'21 3456
PAO2 = 1 (760 – 47) – PACO2/R)
= ~663
PAO2 = 663
PO2 = 663
SO2 = 100%
= SO2 75%
75 + 100/2 = 87.5
SO2 = ~88%
This is an example of administering 100% oxygen to a patient with a shunt. Unfortunately, no
matter how high the pressure of oxygen is in the alveoli and blood vessel, the hemoglobin
cannot be saturated more than 100%. T he blood leaving the shunted area has the same
saturation of “mixed venous” blood (because no ventilation occurred, so it was as if the bloodisn’t even in the lung at all). The blood leaving the ventilated alveoli has a saturation of 100%,
the mixture of the blood coming from each of these units is called “venous admixture” and willalways have a saturation less than 100%. This inability to raise the patient’s oxygen even
with supplemental oxygen is a defining feature of shunt.

7/26/2019 Physio Coursepack 2016
http://slidepdf.com/reader/full/physio-coursepack-2016 264/282
C e l l a n d O r g a n P h y s i o l o g y 2 0 1 4 - M E D C 3 0 4 0 3
Ventilation-Perfusion Relations I & II
Jesse Hall, MDProfessor of Medicine
Section of Pulmonary and Critical Care MedicineUniversity of Chicago
!"#$#%&''( #'' *&$#+,$- .&/+ & '01 2#3+4 /+,05-
03(6+, 45+ $0 .#6. 03(6+, +3$"&%$#0,
PAO2 = 1 (760 – 47) – PACO2/R)
= ~663
PAO2 = 663
PO2 = 663
SO2 = 100%
= SO2 50%
50 + 100/2 = 75
SO2 = 75%PVO2 = 27 PO2 = 27
Critically ill patients have lower than normal mixed venous oxygen saturations because of anincrease in oxygen extraction. The venous blood coming into to alveoli is lower than in a normal
healthy state. This exacerbates the problems of venous admixture. In these cases attempts aremade to decrease the high metabolism that is extracting the higher amounts of oxygen from the
circulating blood. Examples of therapeutic options are: putting a patient on mechanicalventilation to rest the respiratory muscles, or a cooling blanket for a febrile patient. At the same
time it is important to make sure oxygen content is maximal. As you know oxygen content ishemoglobin and cardiac output (CaO2 = 1.39 X Hgb X %saturation + PaO2 X 0.003), thus
ensuring the patient is not anemic is important in the treatment of shunt and patients with heartfailure may require medicines to increase cardiac output.
FACT: You become hypoxic by perfusing nonventilated alveoli

7/26/2019 Physio Coursepack 2016
http://slidepdf.com/reader/full/physio-coursepack-2016 265/282
C e l l a n d O r g a n P h y s i o l o g y 2 0 1 4 - M E D C 3 0 4 0 3
Ventilation-Perfusion Relations I & II
Jesse Hall, MDProfessor of Medicine
Section of Pulmonary and Critical Care MedicineUniversity of Chicago
!"##$%&• '($) +,$-( .+ $/0"1 234 05 101$6 7(81.6$1.08 $8) -$8
/( (+1.#$1() /& "+.89 1:( ;0:% (<"$1.08
• =67(06$% >?@A .+ !"#$%&$'( ,%0,0%1.08$6 10 $67(06$%7(81.6$1.08
• >=@A B CD@A EFG2 ##H9I J >=?@A K 3LM
• N:( ,"6#08$%& 7$+-"6$1"%( .+ $ 60O ,%(++"%(P 60O
%(+.+1$8-(P $8) )*+),-./01* +&+1(#
• Q(81.6$1.08 >(%5"+.08 .+ :(1(%09(8(0"+ 1:%0"9:0"1
1:( 6"89
• H&,0R(#.$ 1:$1 .+ )*2)/+.3)4 10 +",,6(#(81$6 0R&9(8
.+ +"99(+1.7( 05 +:"81

7/26/2019 Physio Coursepack 2016
http://slidepdf.com/reader/full/physio-coursepack-2016 266/282
1
Med Bio 30300Cell and Organ PhysiologyControl of VentilationFebruary 3, 2015
We have spent the last several lectures discussing the physiology of respiration.Ventilation is controlled by the central nervous system, with both voluntary and
involuntary input. In this lecture we will discuss the ventilatory centers of the brain andhow central and peripheral O2 and CO2 sensors are integrated to regulate ventilation.
There are a number of demands placed on the control of ventilation. Baseline ventilation
needs to be maintained, but the degree of ventilation also needs to be increased inresponse to increased metabolic demand or exercise. The respiratory system also
provides the rapid component of the body’s response to alterations in acid basehomeostasis. The central nervous system also responds to airway irritation and
atelectasis (the collapse of part or all of a lung) with coughing, sighs and yawns. Speech
requires the ability for all of this control to be overridden by the upper cortical areas toallow phonation.
The schematic in Figure 1 depicted above depicts mechanisms of respiratory control.
Figure 1

7/26/2019 Physio Coursepack 2016
http://slidepdf.com/reader/full/physio-coursepack-2016 267/282
2
In the simplest of models, a“central pattern generator”
transmits a signal to themuscles of respiration via
spinal motor neurons. These
have their motor nuclei in theregion of C3-C5. The fact thatinjuries to this level result in an
inability to maintain respirationhas been know since the time
of Galen, who observed thatgladiators with wounds to this
area would no longer makerespiratory efforts, as opposed
to those with transections below this point.The location of the central pattern generator has been localized to the medulla in the
brainstem.
Innervation of the Muscles of Respiration
Lumbar Ventral HornSpinal Nerves Abdominal Muscles
Thoracic Ventral HornIntercostal NerveInternal Intercostals
Secondary Muscles of Expiration
Facial NucleusFacial Nerve VIINares
Spinal Accessory
Nucleus C1-C5
Spinal Accessory XISternocleidomastoid and
Trapezius
Hypoglossal NucleusHypoglossal XIITongue
Nucleus ambiguusVagus CN X and
Glossopharnyngeal IX
Larynx and Pharynx
Secondary Muscles of Inspiration
Thoracic Ventral HornIntercostal NerveExternal Intercostals
Ventral Horn C3-C5Phrenic NerveDiaphragm
Primary Muscles of Inspiration
Location of the Cell
Body of MNNerveMuscles
Figure 3
The table in Figure 3 above lists the innervations of the muscles of respiration. The primary muscles of respiration (diaphragm and external intercostals) are used during
quiet inspiration. There are no primary muscles of expiration (as in quiet tidal breathing),as expiration is passive. The secondary muscles of inspiration can be divided into two
groups: (1) those that further assist in changing the conformation of the rib cage, such asthe sternocleidomastoid muscles, and (2) those that help hold the upper airway open
during inspiration, such as the nares and the laryngeal and pharyngeal muscles. The lackof activity in these last two groups during the deeper levels of sleep is though to be a
Figure 2

7/26/2019 Physio Coursepack 2016
http://slidepdf.com/reader/full/physio-coursepack-2016 268/282
3
contributor to sleep apnea. The secondary muscles of expiration assist in forcing air outof the lungs during active expiration.
Figure 4
Figure 4 above demonstrates the effects of sectioning the brain and spinal cord at variouslevels. If the cord is transected above C3-5 there is no phrenic nerve output, but output to
the hypoglossal nerve continues, indicating that the central pattern generator is still
active. If a transection occurs above the medulla, activity continues both in the phrenicand hypoglosal nerves.
Figure 5: Nerve activity measuredfrom the inspiratory pre-motor
neuron during inspiration andexpiration. The x axis represents
time and the y axis represents thefiring rate of motor neurons in the
central pattern generator measuredelectrically from single fibers.
Pre-motor nerve activity during normal quiet breathing
Figure 5

7/26/2019 Physio Coursepack 2016
http://slidepdf.com/reader/full/physio-coursepack-2016 269/282
4
The activity of central pattern generation, and hence the level of ventilation, can beinfluenced by both central and peripheral chemoreceptors. The central receptor is most
sensitive to the pCO2, whereas the peripheral chemoreceptors respond to hypoxemia, pH,and pCO2.
Central
Pattern
Generator
RespiratoryMuscles
S p i n a l C o r d
Brainstem
Central
Chemoreceptor
Sensory
Integration
Peripheral
Chemoreceptor
PCO2
pH
PO2
Stretch
Receptors
CN X CN IX
“Forebrain”
Figure 6
Further input occurs from stretch receptors: proprioceptors that sense muscle activity and
position, as well as J receptors within the lung that respond to lung stiffness and
atelectasis. The upper levels of the brain can modulate the effects of the brainstem or candirectly activate the muscles of respiration via the spinal nerves. This allows you tooverride your normal respiratory pattern during speech or other activities.

7/26/2019 Physio Coursepack 2016
http://slidepdf.com/reader/full/physio-coursepack-2016 270/282
5
Decreases in arterial PO2 stimulate ventilation through peripheral chemoreceptors
Figure 7
The peripheral chemoreceptors are located primarily in the carotid sinus and to a lesser
extent in the arch of the aorta. The carotid body is an organ that has a very high rate ofoxygen consumption. Thus, when the PaO2 level falls in the carotid (an important site to
monitor) the rapid O2 consumption within this organ will cause a quick response inrespiration.
0
10
20
30
40
50
60
M i n u t e V e n t i l a t i o n
20 40 60 80 100 120 140
Arterial PO2
PCO2 = 36
PCO2 = 44
PCO2 = 49
Peripheral Chemoreceptors respond to both Oxygen and CO2
0
10
20
30
40
50
M i n u t e V e n t i l a t i o n
20 30 40 50
Arterial PCO2
Increases in PaCO2 stimulate ventilation via peripheral and central chemoreceptors
PaO2 = 37
PaO2 = 47
PaO2 = 110
Figure 8
The left diagram in Figure 8 demonstrates how the degree of response to hypoxemia will be markedly altered by PCO2 levels. This diagram demonstrates why it’s a bad idea to
hyperventilate prior to diving. At low PCO2 values the respiratory drive to breath islessened in response to hypoxemia to the point that unconsciousness may ensue.
Conversely, oxygen levels as shown at the upper right will affect the response ofventilation to various levels of carbon dioxide. Each curve represents the response of
ventilation to various levels of PaCO2 while holding PaO2 at a constant level.
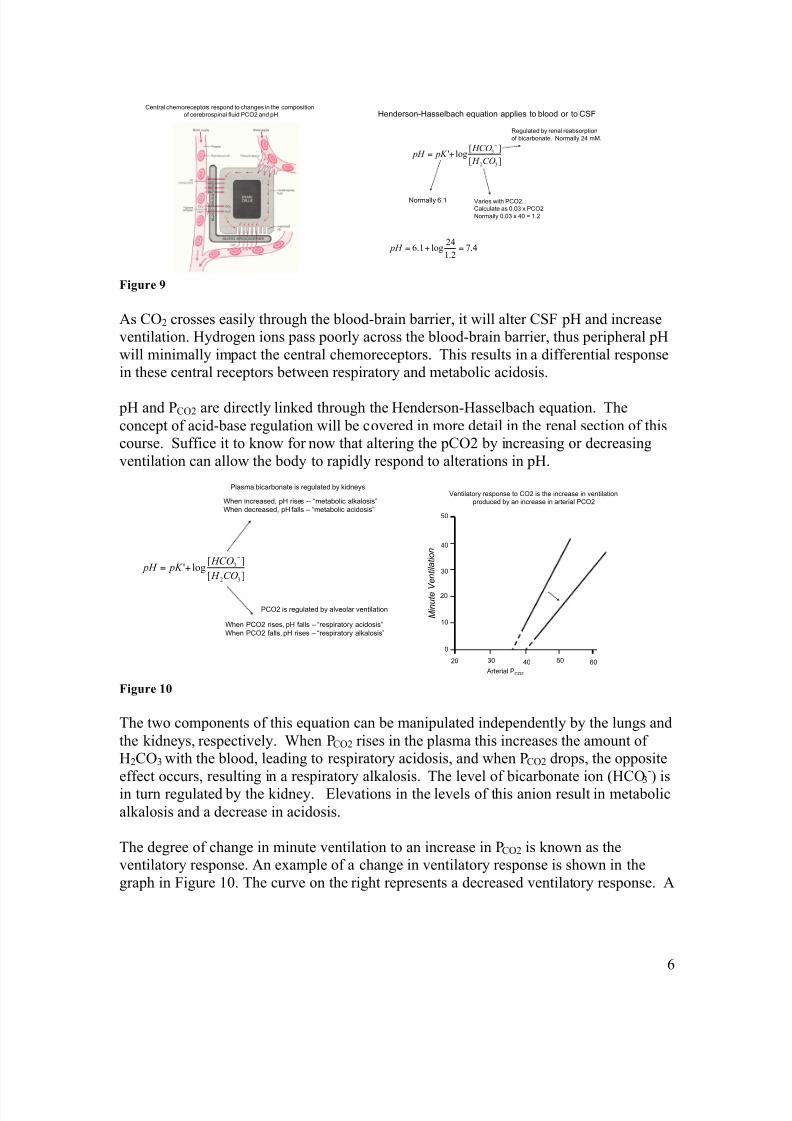
7/26/2019 Physio Coursepack 2016
http://slidepdf.com/reader/full/physio-coursepack-2016 271/282
6
Central chemoreceptors respond to changes in the composition
of cerebrospinal fluid PCO2 and pH
][
][log'
32
3
CO H
HCO pK pH
!
+=
Henderson-Hasselbach equation applies to blood or to CSF
Normally 6.1 Varies with PCO2.
Calculate as 0.03 x PCO2
Normally 0.03 x 40 = 1.2
Regulated by renal reabsorption
of bicarbonate. Normally 24 mM.
4.72.1
24log1.6 =+= pH
Figure 9
As CO2 crosses easily through the blood-brain barrier, it will alter CSF pH and increaseventilation. Hydrogen ions pass poorly across the blood-brain barrier, thus peripheral pH
will minimally impact the central chemoreceptors. This results in a differential responsein these central receptors between respiratory and metabolic acidosis.
pH and PCO2 are directly linked through the Henderson-Hasselbach equation. The
concept of acid-base regulation will be covered in more detail in the renal section of thiscourse. Suffice it to know for now that altering the pCO2 by increasing or decreasing
ventilation can allow the body to rapidly respond to alterations in pH.
][
][log'
32
3
CO H
HCO pK pH
!
+=
When increased, pH rises -- “metabolic alkalosis”
When decreased, pH falls – “metabolic acidosis”
When PCO2 rises, pH falls – “respiratory acidosis”
When PCO2 falls, pH rises – “respiratory alkalosis”
Plasma bicarbonate is regulated by kidneys
PCO2 is regulated by alveolar ventilation
0
10
20
30
40
50
M i n u t e V e n t i l a t i o n
20 30 40 50
Arterial PCO2
60
Ventilatory response to CO2 is the increase in ventilation
produced by an increase in arterial PCO2
Figure 10
The two components of this equation can be manipulated independently by the lungs and
the kidneys, respectively. When PCO2 rises in the plasma this increases the amount ofH2CO3 with the blood, leading to respiratory acidosis, and when PCO2 drops, the opposite
effect occurs, resulting in a respiratory alkalosis. The level of bicarbonate ion (HCO3-) is
in turn regulated by the kidney. Elevations in the levels of this anion result in metabolic
alkalosis and a decrease in acidosis.
The degree of change in minute ventilation to an increase in PCO2 is known as theventilatory response. An example of a change in ventilatory response is shown in the
graph in Figure 10. The curve on the right represents a decreased ventilatory response. A

7/26/2019 Physio Coursepack 2016
http://slidepdf.com/reader/full/physio-coursepack-2016 272/282
7
decreased ventilatory response can lead to chronic respiratory acidosis in the settings ofimpaired ventilation such as COPD.
Abnormal Breathing Patterns
Cheynne-Stokes breathing
Apneuistic breathing
Figure 11
Alterations in respiratory control in certain disease states can result in altered respiratory
patterns that can be observed clinically. The graphs above describe Cheynne Stokesrespiration and apneuistic breathing. This is an abnormal ventilatory response where the
response to CO2 leads to alternating episodes of hyperventilation and apnea. This can be
seen in the setting of CHF, brain injury, or during sleep at high altitude. Apneuistic breathing can be seen in brain injury (pons) or with heavy narcotic use. This respiratory pattern is characterized by deep prolonged inspiration interspersed with brief expirations.

7/26/2019 Physio Coursepack 2016
http://slidepdf.com/reader/full/physio-coursepack-2016 273/282
1
Med Bio 30300Cell and Organ PhysiologyPhysiology of ExerciseFebruary 3, 2015
This final section combines principles discussed in prior lectures on both pulmonary and
cardiovascular physiology. It highlights the reason for the immense reserves available in boththese systems. The mammalian cardiopulmonary system is optimized to deliver oxygen to
muscles to a degree exceeded only by birds. Figure 1 below demonstrates a previously presented(over)simplified model.
In this model, tidal ventilation maintains
a diffusion gradient for oxygen andcarbon dioxide. Oxygen in taken up by
the pulmonary circulation at the sametime as carbon dioxide is removed.
Oxygen is then delivered by thecardiovascular system (the heart is
conspicuous in its absence in thisdiagram) by means of the peripheral
circulation. Oxygen is then taken upalong with energy producing substrates
by the systemic tissues in order to produce ATP. ATP is then utilized to
drive cellular processes including actin-
myosin cross bridge cycling.
The cardiopulmonary system needs to respond to requirements for oxygen delivery over a 12
fold range, while at the same time eliminating the escalating amounts of CO2 produced byrespiration in order to maintain a normal serum pH (Recall that PCO2 is the rapid-response
component of acid/base regulation). Figure 2 below demonstrates the responses of the variouscomponents of the “supply chain” of oxygen delivery required to meet these goals.
..
Mixed
VenousCaO
2
Arterial
CaO2
Systemic Tissue (Muscle)
VCO2
VO2
VO2 V
CO2
. .
Cardio-Respiratory System: Simplified Model
Figure 1

7/26/2019 Physio Coursepack 2016
http://slidepdf.com/reader/full/physio-coursepack-2016 274/282
2
In a break from the usual lung centered view of this group of lectures, we’ll consider the far endof this diagram first, namely the bioenergetics of skeletal muscle. Skeletal muscle contracts as aresult of actin/myosin cross-bridge formation, which derives its energy from the hydrolysis of
ATP. In skeletal muscle this energy is stored in the form of creatine phosphate that can beconverted back to ATP by means of creatine phosphokinase (CPK). ATP can be produced
aerobically either from fats (such as palmitate) or carbohydrates (such as glucose) oranaerobically from carbohydrates. Protein, while utilized during starvation states, is not usually
metabolized for energy production either at rest or with exercise. The energy equations for fatsand carbohydrates are demonstrated schematically below:
Lungs
PulmonaryCirculation
Heart/Blood
VO2
VCO2
QO2
QCO2 QCO2
QO2
Muscle/Mitochondria
!TV!RR
Recruitment!HR!SV
ArteriolarDilation
! RQ Aerobic/
AnaerobicMetabolism
SystemicCirculation
Response:
Figure 2 Bioenergetics of Muscle

7/26/2019 Physio Coursepack 2016
http://slidepdf.com/reader/full/physio-coursepack-2016 275/282
3
+
6 O2 + C6H12O6 = 6 CO2 + 6 H2O+ 36 ATP ~P:O2 = 6
RQ = 1.0
0 O2 + C6H12O6 = 2 C3H6O3 + 2 ATP ~P:O2 = ∞
RQ = ?
23 O2 + C16H32O2 = 16 CO2 + 16 H2O+ 130 ATP ~P:O2 = 5.65
+
RQ = 0.71
Figure 3: Aerobic metabolism of fat (top), aerobic metabolism of carbohydrates (middle), anaerobic
metabolism of carbohydrates (bottom)
Note that as one moves down the diagram from aerobic metabolism of fat to anaerobicmetabolism of carbohydrates, a number of tradeoffs occur. Fats are most highly energy dense,
producing the most energy per gram of substrate, but require the most oxygen per high-energy phosphate bond formed. Fat also produces the least carbon dioxide for the amount of oxygen
consumed, resulting the lowest respiratory quotient, R, a concept we discussed in the lecture on
ventilation-perfusion relationships. Anaerobic metabolism is the least efficient mechanism ofATP production per gram of substrate, but has the virtue of requiring no oxygen at all. Oxygendelivery is the primary limiting factor in maximal exercise. Therefore the cellular level response
to the demands of exercise includes increased oxygen extraction and an alteration in the energysubstrates utilized. This involves a transition from fat metabolism + carbohydrate metabolism
with mild exercise towards primarily carbohydrate metabolism (mostly glucose and glycogen)with heavy exercise. With maximal exercise, anaerobic metabolism also appears while aerobic
metabolism of carbohydrates continues. Because glucose stores are limited, this reduced relianceon fat metabolism imposes a limitation on exercise as glucose stores are depleted; the infamous
wall faced by marathon runners at approximately mile 20.
While it makes no sense to talk about a respiratory quotient with anaerobic metabolism (as nooxygen is involved), there is CO2 production in the absence of oxygen consumption as thehydrogen ions created by lactic acid combine with sodium bicarbonate. Furthermore, the
additional acid load as bicarbonate is consumed results in a greater ventilation requirement inorder to maintain a normal pH.
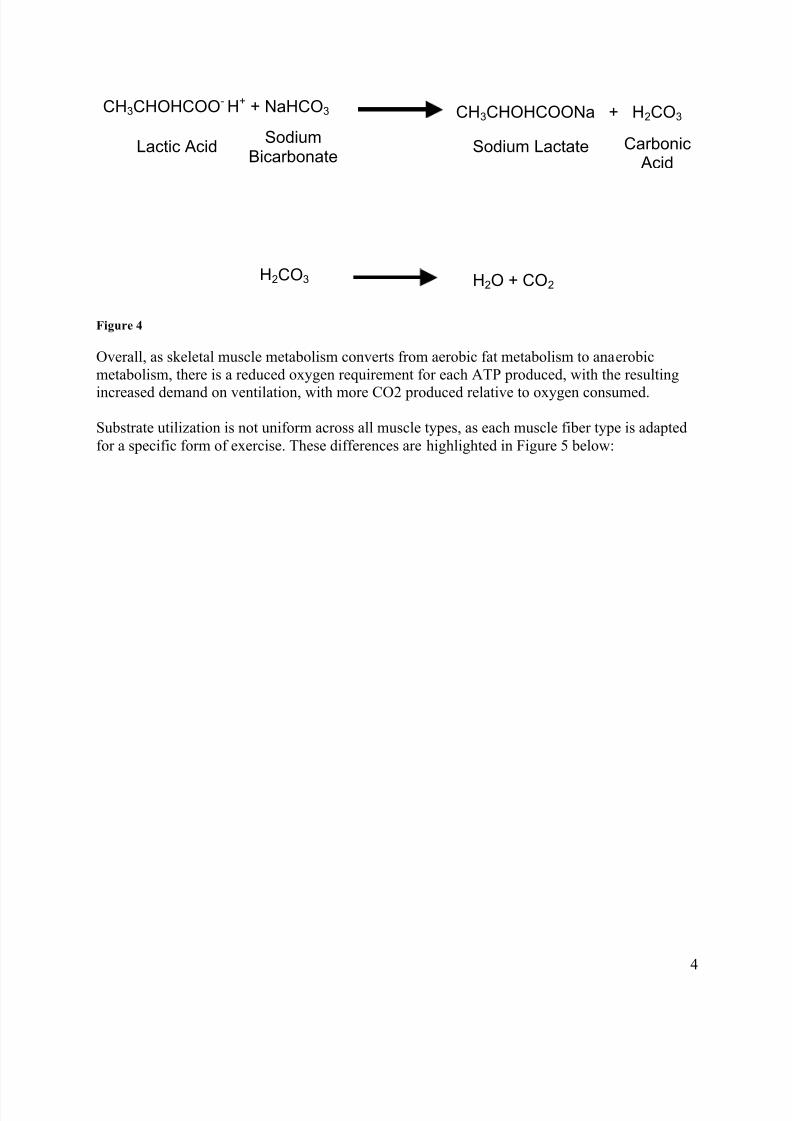
7/26/2019 Physio Coursepack 2016
http://slidepdf.com/reader/full/physio-coursepack-2016 276/282
4
Overall, as skeletal muscle metabolism converts from aerobic fat metabolism to anaerobic
metabolism, there is a reduced oxygen requirement for each ATP produced, with the resulting
increased demand on ventilation, with more CO2 produced relative to oxygen consumed.
Substrate utilization is not uniform across all muscle types, as each muscle fiber type is adapted
for a specific form of exercise. These differences are highlighted in Figure 5 below:
CH3CHOHCOO- H+ + NaHCO3 CH3CHOHCOONa + H2CO3
Lactic AcidSodium
BicarbonateSodium Lactate Carbonic
Acid
H2CO3 H2O + CO2
Figure 4

7/26/2019 Physio Coursepack 2016
http://slidepdf.com/reader/full/physio-coursepack-2016 277/282
5
CharacteristicsType ISlow oxidation
Type IIAFast oxidation
Type IIBFast glycolytic
“Color” Red Red White
Myoglobin content High High Low
Triglyceride content High Moderate Low
Glycogen content " No appreciable differences #
Oxidation potential(mitochondrial content;
oxidative enzyme potential;capillary density)
High High Low
Fiber diameter Moderate Small Large
Contractile behavior (time to
peak tension followingactivation)
Slow Fast Fast
Figure 5: Muscle Types
Slow oxidative (or “slow twitch”) fibers develop active tension less quickly than other fiber
types and are better suited for oxidative metabolism than are fast twitch fibers, which in turnhave higher glycolytic capacity. For this reason, slow twitch fibers are more suited for activities
requiring endurance. On the other hand, the ability to slam-dunk is facilitated by an adequatesupply of fast twitch fibers.
Cardiovascular Response to Exercise
Because oxygen uptake in normal individuals is perfusion limited, the delivery of oxygen by the
cardiovascular system is the limiting factor for maximal exercise in the absence of disease. Thecardiovascular system can respond to the demands of exercise both by increasing cardiac output
and by means of the peripheral circulation. As the cardiac output is the product of stroke volumemultiplied by heart rate, the normal cardiac response to exercise involves both. In a non-athlete,
heart rate can triple with exercise from approximately 70 up to 210 beats per minute, dependingon age. Stroke volume is increased somewhat during exercise, mainly through the action of
increasing venous return and through the response of the peripheral circulation mediated bycirculating chatechols.
With cardiovascular training, stroke volume at all heart rates increases and the heart rate requiredto deliver a given cardiac output at any level of exercise decreases. This explains the low restingheart rate seen in performance athletes. These same athletes similarly have markedly elevated
maximal oxygen delivery at maximal heart rate, which explains their phenomenal exercisecapacity. It is this acquired cardiac conditioning that is responsible for improved athletic
performance with training (for aerobic pursuits).

7/26/2019 Physio Coursepack 2016
http://slidepdf.com/reader/full/physio-coursepack-2016 278/282
6
Dynamic control of the cardiovascular system is mediated through the autonomic nervous systemwith a decrease in parasympathetic activity to the heart and an increase in sympathetic activity.
A slight increase in heart rate can be seen even before the start of exercise, due to consciousanticipation. As exercise begins, circulating catecholamines such as epinephrine further augment
heart rate and mobilize glucose from glycogen stores. Sympathetically mediated
vasoconstriction results in increased venous return, augmented physically by the action ofmuscle contraction on the veins.
Another effect of the autonomic system, in addition to local vasodilatation of arterioles mediated by nitric oxide, is to redistribute blood flow away from the viscera and towards the skeletal
muscles. The magnitude of this effect is illustrated by the fact that, at rest, only 15-20% of thecardiac out put goes to the skeletal muscle (approximately 1 liter/min), whereas during maximal
exercise 80% of a markedly increase cardiac output is distributed to the skeletal muscles (on therange of 15 liters/min or greater). In addition to arteriolar dilation, this process is driven by
increases in blood pressure that may increase to 210 mmHg. As stroke volume is also increased,an elevation in the arterial pulse pressure (the difference between the systolic and diastolic
pressure) is also seen.
Respiratory Response to Exercise:
As we have noted in this series of lectures, the lung uses only a small portion of its ventilatorycapacity to meet basal metabolic demands. For this reason, individuals with significant amounts
of obstruction, restriction, and/or ventilation/perfusion abnormalities may have minimalsymptoms at rest. However, during exercise, minor abnormalities in ventilation/perfusion
relationships or more significant abnormalities in lung mechanics may become exercise limiting.In clinical practice, you may find, however, that patients will tend to subconsciously limit their
activity in response and still remain somewhat asymptomatic in the face of fairly significant
disease.
In normal individuals, pH, PaCO2 and PaO2 remain relatively constant over a wide range of
aerobic exercise. As oxygen consumption increases, carbon dioxide increases as well, resultingin an increased requirement for greater alveolar ventilation in order to maintain the same PaCO2
and prevent acidosis. This is demonstrated in the left panel of Figure 6 below. The arrow on the
00 11 22 33
8080
4040
VCOVCO22 (l/min)(l/min)
VVAA
(l/min)(l/min) }
3030
40405050
PaCOPaCO22
00 22 44
33
VOVO22 (l/min)(l/min)
VCOVCO22
(l/min)(l/min)
}1.01.0
0.850.85
0.70.7
R R
6

7/26/2019 Physio Coursepack 2016
http://slidepdf.com/reader/full/physio-coursepack-2016 279/282

7/26/2019 Physio Coursepack 2016
http://slidepdf.com/reader/full/physio-coursepack-2016 280/282
8
Cardiopulmonary Exercise Testing
Figure 8
The diagram above demonstrates one technique of assessing exercise performance in the pulmonary function laboratory using graded exercise. The patient is seated on a bicycle
ergometer. The patient breathes through a scuba mouthpiece where airflow and theconcentrations of inhaled and exhaled oxygen and carbon dioxide are measured. Airflow can be
integrated to yield volume, and in concert with the oxygen and carbon dioxide measurements,can be used to calculate VO2 and VCO2. The patient is instructed to pedal at a fixed rate against
an increasing amount of resistance. This results in an increasing power output (work/time) in astepwise fashion with approximately 1-second increments. While true steady state is not
achieved with a one-minute interval, this allows an assessment of exercise at a series of levelsfrom rest up to and including maximal exercise, where maximal exercise corresponds to the
highest VO2 achieved during the test.

7/26/2019 Physio Coursepack 2016
http://slidepdf.com/reader/full/physio-coursepack-2016 281/282
9
Figure 9 above represents an idealized exercise study in a normal individual. Note that oxygen
consumption (VO2) increases linearly in parallel with power output (watts). Heart rate (notshown) also increases linearly with workload until the maximum heart rate is achieved. The
respiratory exchange ratio, R, increases towards 1. As lactate production due to anaerobicmetabolism increases and exceeds the blood’s buffering capacity, the pH begins to fall, marking
the onset of anaerobic metabolism. Note that VO2 continues to increase, even after the onset ofanaerobic metabolism, until maximum exercise is achieved. In order to respond to this excess
CO2 production created by the buffering effect of bicarbonate, minute ventilation (VE) increases beyond the amount required to keep up with increasing VO2, resulting in an increase in the
VE/VO2 ratio. Initially the increase in VE parallels the VCO2 curve, resulting in a steady, VE/VCO2 ratio, the so-called isocapnic buffering phase. As the pH continues to fall, chemoreceptors are
increasingly stimulated, resulting in a further respiratory response to the acidosis. At this point
the VE and VCO2 curves begin to diverge resulting in an increase in the VE /VCO2 ratio.
-3 -2 -1 0 1 2 3 4 5 6 7 8 9 10 11
Time (Minutes)
0
175
Workload
(Watts)
0.7
1.7
30
50
R
VE/VC02
VE/VO2
R
VE/VCO2
VE/VO2
200
500
1000
1500
2000
2500VO2
l/min)
VCO2l/min)
1020
30
40
50
60
70
VE
L/minVO2
VCO2
VE
Anaerobic
Threshold
IsocapnicBuffering

7/26/2019 Physio Coursepack 2016
http://slidepdf.com/reader/full/physio-coursepack-2016 282/282
The figure to the