Embed Size (px)
Citation preview

PHYSICIAN DISPENSING IN
WORKERS’ COMPENSATION
Dongchun Wang
WC-12-24
July 2012
WORKERS COMPENSATION RESEARCH INSTITUTE CAMBRIDGE, MASSACHUSETTS
1copyright © 2012 workers compensation research institute

COPYRIGHT © 2012 BY THE WORKERS COMPENSATION RESEARCH INSTITUTE ALL RIGHTS RESERVED. NO PART OF THIS BOOK MAY BE COPIED OR
REPRODUCED IN ANY FORM OR BY ANY MEANS WITHOUT WRITTEN PERMISSION OF THE WORKERS COMPENSATION RESEARCH INSTITUTE.
ISBN 978-1-61471-961-8 (online)
PUBLICATIONS OF THE WORKERS COMPENSATION RESEARCH INSTITUTE DO NOT NECESSARILY REFLECT THE OPINIONS OR POLICIES
OF THE INSTITUTE’S RESEARCH SPONSORS.
2
___________________________________________________________________________________________________P H Y S I C I A N D I S P E N S I N G I N W O R K E R S ' C O M P E N S A T I O N
copyright © 2012 workers compensation research institute

ACKNOWLEDGEMENTS
This report benefited from the contributions of numerous colleagues, both within and outside WCRI. I am
grateful to the two technical reviewers, Dr. Peter Barth, University of Connecticut, and Dr. Jeff Harris, J.
Harris Associates, Inc., whose comments and suggestions not only helped to improve the quality of the final
report, but also provided valuable input and guidance for future studies. Comments from a number of
other reviewers also helped to improve the clarity of the report. In light of this, I would like to give my
thanks to Dr. William Gaines, Dr. Margaret Atwell, Kimberly Schlosser, Artemis Emslie, and Cynthia Page.
Kevin Tribout and Adam Fowler from PMSI, Kimberly Schlosser and Angela Jenkins from Progressive
Medical, Inc., and Stephanie Deeley of WCRI contributed tremendously to the update of state policies and
recent legislative and regulatory activities regarding fee schedules for workers’ compensation
pharmaceuticals and related areas. I am grateful for the generous help they provided. Also critical to the
study was the capable assistance from my colleagues at WCRI, Eric Harrison, Syd Allan, Juxiang Liu, and
Te-Chun Liu—their contributions were indispensable in the pharmacy database construction, quality
assurance, and programming support. Much appreciation goes to Dr. Philip Borba and his staff, who
contributed to the development of the Detailed Benchmark/Evaluation Database, which made this study
possible. Special thanks to Dr. Richard Victor, executive director of the Institute, for his invaluable input
and guidance throughout the study process.
I wish to thank Sarah Solorzano and Linda Carrubba for their superior administrative assistance that
helped to improve the readability and accuracy of the report, and Sarah Solorzano, who managed the review
and publication process.
Of course, any errors or omissions that remain in the report are the responsibility of the author.
Dongchun Wang
Cambridge, Massachusetts
July 2012
copyright © 2012 workers compensation research institute3
___________________________________________________________________________________________________P H Y S I C I A N D I S P E N S I N G I N W O R K E R S ' C O M P E N S A T I O N

TABLE OF CONTENTS
List of Tables 5
List of Figures 6
Executive Summary 7 Summary of Major Findings 7 Data, Approach, and Caveats 13
1. Introduction 15 Background 15 Organization of This Report 17
2. Data and Methods 18
Data and Representativeness 18 Identifying Prescription Drugs and Dispensing Points 20 Key Benchmark Metrics Discussed in This Report 21 Capturing Prescriptions That Were Filled by Injured Workers 22 Limitations and Caveats 23
3. Prevalence and Growth of Physician Dispensing 24
4. Price Premium Paid for Physician-Dispensed Prescriptions 30
5. Certain Drugs Prescribed Only When Physicians Dispense 38
6. Patient Access to Physician-Dispensed Drugs: Lessons from the California Reforms 41
Appendix A: State Policies on Pharmacy Fee Schedules and Physcian Dispensing 49
Appendix B: Potential Impact of Different Quantity and Strength on Price Comparisons 54
Glossary 56
References 58
4copyright © 2012 workers compensation research institute
___________________________________________________________________________________________________P H Y S I C I A N D I S P E N S I N G I N W O R K E R S ' C O M P E N S A T I O N

LIST OF TABLES
A Prevalence and Costs of Physician Dispensing, 2010/2011 / 8
B Growth of Physician Dispensing, 2007/2008–2010/2011 / 9
C Trends in Prices per Pill Paid for Physician- and Pharmacy-Dispensed Prescriptions for
Selected States: Hydrocodone-Acetaminophen (Vicodin®), 2007/2008–2010/2011 / 11
2.1 Actual Number of Claims and Prescriptions Included in the Analysis / 19
3.1 Prevalence and Costs of Physician Dispensing, 2010/2011 / 26
3.2 Growth of Physician Dispensing, 2007/2008–2010/2011 / 27
3.3 Changes in Prescribing and Dispensing of Certain Drugs for Selected States, 2007/2008 and
2010/2011 / 29
4.1 Comparing Prices per Pill Paid for Physician- and Pharmacy-Dispensed Prescriptions for Top Five
Common Drugs, 2010/2011 / 31
4.2 Trends in Prices per Pill Paid for Physician- and Pharmacy-Dispensed Prescriptions for Selected
States, 2007/2008–2010/2011 / 34
5.1 Prescribing Patterns Associated with Physician Dispensing: Omeprazole (Prilosec®) and Ranitidine
HCL (Zantac®), 2010/2011 / 40
6.1 Changes in Prices per Pill Paid to Physicians and Pharmacies for Top Five Common Drugs:
California Pre- and Post-Reform Experience, 2006/2007 and 2008/2009 / 43
6.2 Changes in Prescribing Patterns for Carisoprodol (Soma®): California Pre- and Post-Reform
Experience, 2006/2007 and 2008/2009 / 45
6.3 Changes in Prescribing Patterns for Ranitidine HCL (Zantac®) and Omeprazole (Prilosec®):
California Pre- and Post-Reform Experience, 2006/2007 and 2008/2009 / 46
6.4 Percentage of Generics Dispensed by and Prices Paid to Physicians and Pharmacies in Pre-
Reform California, 2006/2007 / 48
6.5 Physicians' Share of Prescriptions in Pre- and Post-Reform California and Percentage of Generics
Dispensed by and Prices Paid to Physicians and Pharmacies in Post-Reform California / 48
A.1 Summary of State Policies on Fee Schedules for Physician- and Pharmacy-Dispensed Prescription
Drugs / 51
B.1 Prices per Pill Paid for Physician- and Pharmacy-Dispensed Prescriptions: Example of
Hydrocodone-Acetaminophen, Holding Quantity and Strength Constant, 2010/2011 / 55
5
___________________________________________________________________________________________________P H Y S I C I A N D I S P E N S I N G I N W O R K E R S ' C O M P E N S A T I O N
copyright © 2012 workers compensation research institute

LIST OF FIGURES
3.1 Percentage of All Prescriptions That Were Dispensed by Physicians, 2010/2011 / 25
3.2 Percentage of Prescription Payments That Were for Physician-Dispensed Prescriptions,
2010/2011 / 25 5.1 Percentage of Claims with Prescriptions That Had Omeprazole (Prilosec®) or Ranitidine HCL
(Zantac®), 2010/2011 / 39 6.1 Changes in Prices per Pill Paid for Physician- and Pharmacy-Dispensed Prescriptions: California
Pre- and Post-Reform Experience, 2006–2008 / 42 6.2 Changes in Physician Dispensing Patterns: California Pre- and Post-Reform Experience, 2006–
2008 / 44
___________________________________________________________________________________________________
copyright © 2012 workers compensation research institute6
P H Y S I C I A N D I S P E N S I N G I N W O R K E R S ' C O M P E N S A T I O N

EXECUTIVE SUMMARY
This study reports on the rapid growth of physician-dispensed pharmaceuticals for injured workers under
state workers’ compensation. The study finds that physician-dispensed drugs became increasingly common
in most states that permit physician dispensing. At the same time, the prices paid for physician-dispensed
drugs were often substantially higher than if the same drugs were dispensed by a retail pharmacy. Moreover,
the prices paid to dispensing physicians rose rapidly for medications that were commonly dispensed by
physicians, while the prices paid to pharmacies for the same drugs changed little or fell.
The study also shows examples of physicians writing prescriptions for and dispensing certain drugs
(e.g., omeprazole [Prilosec®] and ranitidine HCL [Zantac®]) that are available without a prescription in a
drug or grocery store at a much lower price. Finally, the study examines the results of the California fee
schedule reforms, providing evidence of the impact on prices paid, patient access to physician-dispensed
prescriptions, and physician prescribing and dispensing patterns for certain drugs.
The study compares 23 states,1 including Arkansas, Connecticut, Florida, Illinois, Indiana, Iowa,
Louisiana, Maryland, Michigan, Minnesota, New Jersey, North Carolina, Pennsylvania, Virginia, and
Wisconsin. Five states (Arizona, California, Georgia, South Carolina, and Tennessee) recently adopted
reforms aimed at reducing the costs of physician-dispensed drugs. The data include post-reform results for
Arizona2 and California3 and pre-reform baselines for Georgia, South Carolina, and Tennessee. Also
included are three states where physician dispensing is prohibited in general (Massachusetts, New York, and
Texas).
SUMMARY OF MAJOR FINDINGS
Physician dispensing was common in workers’ compensation, as seen in 2010/2011 claims.4 In Florida,
Illinois, pre-reform Georgia, Maryland, and Connecticut, as well as post-reform Arizona and
California, physicians dispensed 28–53 percent of all prescriptions, representing 28–63 percent of total
spending on pharmaceuticals in workers’ compensation claims (Table A). Note that in post-reform
Arizona and California, the cost share of physician dispensing was not greater than the frequency,
partly because of the price reduction for physician-dispensed drugs due to the fee schedule reforms.
1 The states included represent a range of different policies toward physician dispensing and are of average or larger-than-average size, representing more than two-thirds of the workers’ compensation benefits in the United States. 2 The data for Arizona include the early results of the fee schedule reforms, which are not specifically discussed in the report. 3 California post-reform results are discussed in the Executive Summary and in Chapter 6. 4 The underlying data include prescriptions for claims with more than seven days of lost time that had prescriptions filled and paid for by a workers’ compensation payor over the defined period. 2010/2011 refers to claims with injuries occurring from October 1, 2009, through September 30, 2010, and prescriptions through March 31, 2011. Similar notation is used for other years.
7
___________________________________________________________________________________________________P H Y S I C I A N D I S P E N S I N G I N W O R K E R S ' C O M P E N S A T I O N
copyright © 2012 workers compensation research institute

Table A Prevalence and Costs of Physician Dispensing, 2010/2011
State Percentage of All Rx That Were
Dispensed by Physicians Percentage of Rx Payments That
Were Paid for Physician-Dispensed Rx
Illinois 43% 63%
Florida 45% 62%
Californiaa 53% 52%
Georgiaa 36% 48%
Maryland 35% 47%
Connecticut 28% 37%
Arizonaa 32% 28%
Pennsylvania 20% 27%
South Carolinaa 18% 26%
Tennesseea 20% 25%
Michigan 24% 22%
Louisiana 7% 19%
North Carolina 14% 18%
Indiana 22% 17%
Wisconsin 11% 15%
Iowa 15% 12%
Virginia 10% 12%
New Jersey 18% 12%
Minnesota 4% 3%
Arkansas 4% 3%
Notes: The underlying data include prescriptions for claims with more than seven days of lost time that had prescriptions filled and paid for by a workers' compensation payor over the defined period. 2010/2011 refers to claims with injuries occurring from October 1, 2009, through September 30, 2010, and prescriptions through March 31, 2011. Three states (Massachusetts, New York, and Texas) where physician dispensing is not allowed in general are not included.
a Five states (Arizona, California, Georgia, South Carolina, and Tennessee) recently adopted reforms aimed at reducing the costs of physician dispensing (see Appendix A for more detail). The data included are post-reform for Arizona and California, and pre-reform for Georgia, South Carolina, and Tennessee. Lessons learned from California's post-reform experience are discussed in Chapter 6.
Key: Rx: prescriptions.
Over the three years covered by the study, from 2007/2008 to 2010/2011, the frequency and cost of
physician dispensing grew rapidly in a number of states (Table B).
Illinois saw the fastest growth in physician dispensing. Physicians’ share of all prescriptions
increased from 26 to 43 percent, and the dollar share increased even more, from 22 to 63 percent
of all prescription payments.
Connecticut: Physician dispensing also grew rapidly, from 18 to 28 percent of all prescriptions
and from 16 to 37 percent of all prescription payments.
Florida: Physician dispensing continued to grow in Florida—the physicians’ share of all
prescriptions dispensed increased from 35 to 45 percent. Their share of all prescription payments
rose from 43 to 62 percent.
South Carolina: Physician dispensing increased in South Carolina from 12 to 18 percent of all
prescriptions, and from 10 to 26 percent of total spending on prescriptions. South Carolina
8
___________________________________________________________________________________________________P H Y S I C I A N D I S P E N S I N G I N W O R K E R S ' C O M P E N S A T I O N
copyright © 2012 workers compensation research institute

adopted regulations, effective December 2011, which aimed at limiting the price differential
between what physicians and pharmacies were paid for the same drug.
Georgia: Physicians’ share of prescriptions dispensed in Georgia increased from 30 to 36 percent
and the dollar share increased from 32 to 48 percent over the three years. Georgia adopted fee
schedule reforms, effective April 2011, aimed at reducing the costs of physician dispensing.
In four states (Pennsylvania, Tennessee, Maryland, and Wisconsin), the costs of physician
dispensing also grew rapidly, although the frequency of physician dispensing grew moderately
over the same period. This occurred because of large increases in the prices of physician-
dispensed drugs, while the prices paid to pharmacies for the same medications changed little or
fell. Physicians’ share of prescription payments increased from 15 to 27 percent in Pennsylvania,
14 to 25 percent in Tennessee, 36 to 47 percent in Maryland, and from 5 to 15 percent in
Wisconsin (Table B). Tennessee adopted regulations, effective August 2012, which aimed at
limiting the price differential between what physicians and pharmacies were paid for the same drug.
Table B Growth of Physician Dispensing, 2007/2008–2010/2011 Percentage of All Rx That
Were Dispensed by Physicians
Percentage of Rx Payments That Were Paid for
Physician-Dispensed Rx State
2007/2008 2010/2011
Percentage Point
Change 2007/2008 2010/2011
Percentage Point
Change
Illinois 26% 43% 17 22% 63% 41
Connecticut 18% 28% 10 16% 37% 21
Florida 35% 45% 10 43% 62% 19
South Carolinaa 12% 18% 6 10% 26% 16
Georgiaa 30% 36% 6 32% 48% 16
Pennsylvania 17% 20% 3 15% 27% 12
Tennesseea 15% 20% 5 14% 25% 11
Maryland 33% 35% 2 36% 47% 11
Wisconsin 8% 11% 3 5% 15% 10
North Carolina 12% 14% 2 10% 18% 8
Indiana 17% 22% 5 9% 17% 8
Virginia 7% 10% 3 5% 12% 7
Michigan 23% 24% 1 15% 22% 7
Arizonaa 27% 32% 5 23% 28% 5
Louisiana 11% 7% -4 17% 19% 2
New Jersey 11% 18% 7 10% 12% 2
Iowa 16% 15% -1 11% 12% 1
Minnesota 3% 4% 1 2% 3% 1
Arkansas 2% 4% 2 2% 3% 1
Californiaa 56% 53% -3 55% 52% -3
Notes: The underlying data include prescriptions for claims with more than seven days of lost time that had prescriptions filled and paid for by a workers' compensation payor over the defined period. 2010/2011 refers to claims with injuries occurring from October 1, 2009, through September 30, 2010, and prescriptions through March 31, 2011; similar notation is used for other years. Three states (Massachusetts, New York, and Texas) where physician dispensing is not allowed in general are not included. a Five states (Arizona, California, Georgia, South Carolina, and Tennessee) recently adopted reforms aimed at reducing the costs of physician dispensing (see Appendix A for more detail). The data included are partially post-reform for Arizona, post-reform for California, and pre-reform for Georgia, South Carolina, and Tennessee. Lessons learned from California's post-reform experience are discussed in Chapter 6.
Key: Rx: prescriptions.
___________________________________________________________________________________________________
copyright © 2012 workers compensation research institute9
P H Y S I C I A N D I S P E N S I N G I N W O R K E R S ' C O M P E N S A T I O N

For most drugs that were commonly dispensed by physicians, the prices per pill paid for an individual
drug when dispensed by physicians were often 60–300 percent higher than the prices paid for the same
drug when dispensed at a retail pharmacy. This large premium paid to physicians was observed in
2010/2011 claims in most states where physician dispensing was common.
We found large increases in the prices per pill paid to physicians for a number of drugs commonly
dispensed by physicians over the period from 2007/2008 to 2010/2011. In contrast, the prices paid to
pharmacies for the same drugs remained stable or decreased over the same period (see Table C for
hydrocodone-acetaminophen [Vicodin®] as an example).5
Illinois saw very rapid growth in prices paid to physicians for several common drugs, including
hydrocodone-acetaminophen (Vicodin®, 66 percent), meloxicam (Mobic®, 39 percent), and
tramadol HCL (Ultram®, 24 percent). In contrast, the prices of these drugs dispensed at
pharmacies stayed the same or dropped over the same period of time (a 2 percent decrease for
hydrocodone-acetaminophen [Vicodin®] and tramadol HCL [Ultram®] and a 24 percent
decrease for meloxicam [Mobic®]).
In Connecticut, the average price per pill paid for physician-dispensed hydrocodone-
acetaminophen (Vicodin®) increased 54 percent over the three-year period, while the prices paid
to pharmacies for the same drug decreased by 10 percent over three years.6
In Florida, prices paid to physicians for hydrocodone-acetaminophen (Vicodin®) did not change
over the three years, while prices paid to pharmacies for the same drug decreased by 12 percent.
We saw increases in the prices paid to physicians for several other drugs commonly dispensed by
Florida physicians, but the growth appeared to have slowed over the study period.
In South Carolina, the prices paid for physician-dispensed hydrocodone-acetaminophen
(Vicodin®) increased 50 percent between 2007/2008 and 2010/2011, while the prices paid to
pharmacies for the same drug decreased by 11 percent over three years. Prices paid to physicians
for meloxicam (Mobic®) also increased in South Carolina by 37 percent, while the prices of the
same drug when dispensed at pharmacies dropped 23 percent. 7
In Georgia, the prices paid for physician-dispensed hydrocodone-acetaminophen (Vicodin®)
increased slightly, by 6 percent, while the prices paid to pharmacies for the same drug dropped 8
percent.8 For a number of common drugs dispensed by physicians in the state, it appears that the
prices paid to both pharmacies and physicians fell over the three years. However, the prices paid
for physician-dispensed prescriptions were still higher than the prices paid to pharmacies for the
same drug.
5 When discussing a specific drug, we use the drug name that reflects the active ingredients of the drug and include a brand name in parentheses that has the same active ingredients. For example, hydrocodone-acetaminophen has two active ingredients—hydrocodone and acetaminophen. Vicodin® and Norco® are two brand names for hydrocodone-acetaminophen. Throughout the report, we refer to this drug as hydrocodone-acetaminophen (Vicodin®) for brevity; similar notation is used for other drugs. 6 Prices paid to physicians in Connecticut for several other drugs also had a double-digit increase over the same period, including propoxyphene-N w/APAP (Darvocet-N®). 7 Prices paid to physicians in South Carolina for several other drugs also had a double-digit increase over the same period, including naproxen (Aleve®). 8 Considerable increases in prices paid to physicians were also seen for gabapentin (Neurontin®) and tramadol-acetaminophen (Ultracet®).
___________________________________________________________________________________________________
copyright © 2012 workers compensation research institute10
P H Y S I C I A N D I S P E N S I N G I N W O R K E R S ' C O M P E N S A T I O N

In Pennsylvania, Tennessee, Maryland, and Wisconsin, where physicians’ share of drug spending
grew rapidly, prices paid for physician-dispensed prescriptions also increased for several drugs
commonly dispensed by physicians, while prices paid to pharmacies changed little or fell. For
example, the average price per pill paid to physicians for hydrocodone-acetaminophen
(Vicodin®) increased 78 percent in Maryland, 48 percent in Wisconsin, 23 percent in
Pennsylvania, and 6 percent in Tennessee, while the prices paid to pharmacies for the same drug
fell by 2 to 11 percent in the four states.
Table C Trends in Prices per Pill Paid for Physician- and Pharmacy-Dispensed Prescriptions for Selected Statesa: Hydrocodone-Acetaminophen (Vicodin®), 2007/2008–2010/2011
2007/2008 2008/2009 2009/2010 2010/2011 Percentage Change from 2007/2008 to
2010/2011
Illinois Physician-dispensed Rx $0.87 $1.13 $1.35 $1.44 66%
Pharmacy-dispensed Rx $0.54 $0.55 $0.53 $0.53 -2%
Connecticut
Physician-dispensed Rx $0.93 $1.53 $1.47 $1.43 54%
Pharmacy-dispensed Rx $0.41 $0.41 $0.36 $0.37 -10%
Florida
Physician-dispensed Rx $1.08 $1.11 $1.15 $1.08 0%
Pharmacy-dispensed Rx $0.49 $0.49 $0.43 $0.43 -12%
South Carolinab
Physician-dispensed Rx $0.80 $1.11 $1.09 $1.20 50%
Pharmacy-dispensed Rx $0.46 $0.46 $0.43 $0.41 -11%
Georgiab
Physician-dispensed Rx $0.96 $0.97 $1.11 $1.02 6%
Pharmacy-dispensed Rx $0.51 $0.51 $0.49 $0.47 -8%
Pennsylvania
Physician-dispensed Rx $0.92 $0.78 $1.09 $1.13 23%
Pharmacy-dispensed Rx $0.39 $0.37 $0.34 $0.35 -10%
Tennesseeb
Physician-dispensed Rx $1.05 $1.01 $1.06 $1.11 6%
Pharmacy-dispensed Rx $0.53 $0.53 $0.52 $0.52 -2%
Maryland
Physician-dispensed Rx $0.83 $1.03 $1.54 $1.48 78%
Pharmacy-dispensed Rx $0.39 $0.37 $0.38 $0.36 -8%
Wisconsin
Physician-dispensed Rx $0.77 $0.86 $0.97 $1.14 48%
Pharmacy-dispensed Rx $0.46 $0.46 $0.42 $0.41 -11%
Notes: The underlying data include prescriptions for claims with more than seven days of lost time that had prescriptions filled and paid for by a workers' compensation payor over the defined period. 2010/2011 refers to claims with injuries occurring from October 1, 2009, through September 30, 2010, and prescriptions filled through March 31, 2011; similar notation is used for other years. a Included are the states where physicians' share of drug spending grew rapidly or very rapidly (see Table B).
b The data included are pre-reform for Georgia, South Carolina, and Tennessee, where the recent reforms were aimed at reducing the prices paid for physician-dispensed prescriptions.
Key: Rx: prescriptions.
___________________________________________________________________________________________________
copyright © 2012 workers compensation research institute11
P H Y S I C I A N D I S P E N S I N G I N W O R K E R S ' C O M P E N S A T I O N

Some physician-dispensers wrote prescriptions for certain drugs that were available at pharmacies over
the counter (without a prescription). When they did so, they were paid 5–15 times higher prices
compared with what was charged by a national chain of pharmacies for the over-the-counter drug.9
Both omeprazole (Prilosec®) and ranitidine HCL (Zantac®) were rarely prescribed by doctors in
most study states. However, 8–11 percent of injured workers in Florida, Georgia, Illinois, and
Maryland received at least one prescription for omeprazole (Prilosec®) or ranitidine HCL
(Zantac®).10 Almost all were dispensed at physician offices.
The price at Walgreens for Prilosec OTC® is about 64 cents per pill.11 However, when physicians
dispensed the drug, the average price per pill paid to physicians ranged from 5 to 8 dollars in
most states where physician dispensing was common.
The price at Walgreens for ranitidine HCL (Zantac®) is 33–42 cents per pill, depending on
strength and quantity.12 When physicians dispensed the drug, the average price paid per pill was
4 to 7 dollars in the four states mentioned above.
LESSONS LEARNED FROM CALIFORNIA
In March 2007, California changed its fee schedule that governs reimbursement of physicians for the
prescriptions they dispense. It required that the relevant fee schedule rate for physician-dispensed drugs be
based on the original manufacturer National Drug Code (NDC) for the drug—the same rule that applies to
pharmacies. Since then, a number of states adopted a similar policy to control prices for physician-
dispensed prescriptions, including Arizona (effective October 2009), Georgia (April 2011), South Carolina
(December 2011), and Tennessee (August 2012).13
For these states and the states where issues regarding physician dispensing have been actively debated
(e.g., Florida for physician dispensing of drugs other than Schedule II and III narcotics, Hawaii, and
Maryland), several lessons learned from the California experience may be valuable.
First, supporters of physician dispensing have been concerned that physicians will stop dispensing after
a large reduction in price. If physicians stop dispensing, they expressed concern that patient compliance
would suffer and poorer patient outcomes would be the result. The California post-reform experience
shows that many physicians continued to dispense prescriptions, even when the prices paid were lower.
In 2010/2011 claims (three years after the reform), about half of all prescriptions in California
were physician dispensed. Instead of dispensing more expensive repackaged drugs, many
9 Retail prices are available for over-the-counter drugs at www.walgreens.com. 10 Both drugs are indicated for acid reflux and may be used to protect against gastric irritation or erosion from taking non-steroidal anti-inflammatory drugs (NSAIDs). 11 Prilosec OTC® acid reducer is the same as prescription Prilosec® 20 mg. The price for a 42-count box of Prilosec OTC® is $26.99. Prices were retrieved on May 29, 2012, from www.walgreens.com. 12 The unit price per pill for a 30-pill bottle of Zantac® is 33 cents and for a 24-pill box of Zantac® 150 mg is about 42 cents. Prices were retrieved on May 29, 2012, from www.walgreens.com. 13 The fee schedule change in Tennessee was delayed from June 2012 to August 2012. The delay only affects the effective dates, not the substance of the fee schedule change.
___________________________________________________________________________________________________P H Y S I C I A N D I S P E N S I N G I N W O R K E R S ' C O M P E N S A T I O N
12copyright © 2012 workers compensation research institute

physicians dispensed non-repackaged drugs and were paid the same prices as were paid to
pharmacies for the same drug.14
Fifty-five percent of prescriptions were dispensed by physicians in the first quarter of 2007,
immediately before the 2007 change. That dropped to 44 percent in the same quarter of 2008
after the fee schedule change.15 At the same time, the percentage of all physician-dispensed
prescriptions that were repackaged drugs decreased from 43 to 11 percent.
The second concern expressed by supporters of physician dispensing is that costs could rise if physician
dispensing were eliminated or reduced. They argue that physicians almost always dispense less
expensive generic versions of drugs, while pharmacies dispense both brand names and generics.
We found that for the medications commonly dispensed by physicians, generics were almost
always dispensed by both physicians and pharmacies. Moreover, when generic drugs were
dispensed, physician-dispensers were paid much higher prices per pill than pharmacies for the
same prescription.
The 2007 change in California seems to have changed prescribing practices for certain drugs.
We saw a considerable drop in the number of prescriptions for carisoprodol (Soma®) after the
large price reduction for the drug, a medication that was not frequently prescribed in most states
where physician dispensing was uncommon.
We also found that California physicians substituted omeprazole (Prilosec®) for ranitidine HCL
(Zantac®). Both drugs are indicated for acid reflux and may be prescribed by some physicians for
ulcer disease related to the side effect of taking nonsteroidal anti-inflammatory agents (NSAIDs).
Omeprazole (Prilosec®) was more expensive than ranitidine HCL (Zantac®), but the price
premium for ranitidine HCL was higher than that for omeprazole prior to the 2007 fee schedule
reforms in California.16 Both are available without a prescription at most pharmacies.
DATA, APPROACH, AND CAVEATS
The data used for this study include approximately 758,000 claims with more than seven days of lost time
that received at least one prescription paid under workers’ compensation—nearly 5.7 million prescriptions.
The claims are from 23 states, including Arkansas, Arizona, California, Connecticut, Florida, Georgia,
Illinois, Indiana, Iowa, Louisiana, Maryland, Massachusetts, Michigan, Minnesota, New Jersey, New York,
North Carolina, Pennsylvania, South Carolina, Tennessee, Texas, Virginia, and Wisconsin. These states
represent over two-thirds of the workers’ compensation benefits paid in the United States. The data
represent 21–47 percent of all cases, depending on the state, for the 23 states included in this study.
14 While it may seem unusual for physicians to dispense non-repackaged drugs, it is possible in that if a physician is affiliated with a provider network or multispecialty clinic that owns an onsite pharmacy, the physician may send the injured worker to the pharmacy to fill the prescriptions written. We see some evidence suggesting the existence of this relationship, which may explain why some physicians continued to write prescriptions to the patient and dispense them at the onsite pharmacy. 15 The results reported for California were based on a separate analysis that tracked changes in physicians’ share of prescriptions on a quarterly basis. Unlike the analysis based on an average 12 months of experience, this type of analysis focuses on the prescriptions filled by calendar quarter and, therefore, better tracks changes in fee schedule reforms. See Chapter 6 for a more detailed description. 16 According to two physicians who reviewed a draft of the report, there is medical evidence that omeprazole (Prilosec®) is somewhat more effective than ranitidine HCL (Zantac®) in treating ulcer disease from taking NSAIDs. This might help explain the change in prescribing patterns for the two drugs before and after the fee schedule reforms.
___________________________________________________________________________________________________P H Y S I C I A N D I S P E N S I N G I N W O R K E R S ' C O M P E N S A T I O N
13copyright © 2012 workers compensation research institute

By prescription, we mean either a new prescription or a refill of an existing prescription. We excluded
prescription medications dispensed at a hospital. We also excluded prescription medications that were
administered rather than dispensed (e.g., injections received at a physician’s office).
The analyses of trends in this report were based on claims with an average of 12 months’ experience.
The reader should be aware that these are snapshots for prescribing and dispensing patterns during the first
year of injury, on average. Prescribing patterns may be different for subsequent years or longer maturities.
In addition, we focused on claims where the worker had at least seven days of lost time from work and at
least one prescription paid by a workers’ compensation payor.
Compared with data on other medical services, the data provided to WCRI on workers’ compensation
prescriptions were less complete for some data sources. We excluded those data sources where our tests
suggested that the data provided were not complete and were likely to bias the study results. The data are
not necessarily representative of the population of cases in some states. The data cover the voluntary
market, the self-insured market, and state funds where they exist, but do not cover the small residual market
in states with distinct residual markets. For two states, we are also missing data from some large regional
insurers.17
17 We do not provide more detailed information regarding the states and data sources due to a confidentiality concern.
___________________________________________________________________________________________________P H Y S I C I A N D I S P E N S I N G I N W O R K E R S ' C O M P E N S A T I O N
14copyright © 2012 workers compensation research institute

1
INTRODUCTION
Some physicians write prescriptions and dispense them directly to patients at their offices. When physicians
dispense, they are often paid more than pharmacies for the same prescription. In several states, physician dispensing
has been a significant driver of prescription costs. Among the study states where physician dispensing is permitted, a
number of states have recently adopted reforms aimed at reducing the prices paid for physician-dispensed drugs by
limiting the prices to what is paid to pharmacies for the same drug (or a small premium above), including California
(March 2007), Arizona (October 2009), Georgia (April 2011), South Carolina (December 2011), and Tennessee
(August 2012). In other states, legislative or regulatory reforms have been debated (for example, in Florida,1 Hawaii,
Michigan, and Maryland).
This study reports on the very rapid growth in physician-dispensed pharmaceuticals for injured workers under
state workers’ compensation. The study finds that physicians significantly expanded the share of all prescriptions that
they dispensed, and the price premium that they received above what was paid to pharmacies has increased—
significantly, in a number of states. The study also draws some useful lessons from California’s post-reform
experience, providing some evidence that helps address certain concerns about policies seeking to control the prices
paid for physician-dispensed drugs.
BACKGROUND
The recent policy debate has focused on the prices paid for prescriptions dispensed by physicians. Recent reforms
have not sought to limit the ability of physicians to dispense drugs directly to their patients. One important
exception is found in Florida. Legislation passed in 2011, aimed at so-called pill mills, prohibited physicians from
dispensing Schedule II and III narcotics.
Physician dispensing is one example of a larger set of issues that are often referred to as physician self-referral.2
The federal law governing most physician self-referral is known as the Stark Law, which was initially passed in the
U.S. Congress in 1989, and subsequently amended in 1993 and 2007, to ban physician self-referrals of Medicare and
1 In Florida, legislation passed in 2011, aimed at eliminating so-called pill mills, prohibited physicians from dispensing Schedule II and III narcotics. Physician dispensing (of non-narcotic drugs) was also debated during the legislative session in the past two years. 2 Numerous studies have provided evidence of overutilization of medical services as a result of physician self-referral in response to financial incentives, including physician ownership interests in laboratories (U.S. Department of Health and Human Services, Office of the Inspector General, 1989), MRI facilities (Aronovitz, 1994; Hillman et al., 1990, 1992, and 1995; Gazelle et al., 2007; and Baker, 2010), ambulatory surgical centers and specialty hospitals (Mitchell, 2005; U.S. General Accounting Office, 2003; Yee, 2012), and physician ownership in physical therapy and rehabilitation services (Mitchell and Scott, 1992; Mitchell and Sass, 1995). However, only a few studies have documented over-prescribing and associated economic costs that stem from higher-priced physician dispensing, including the California studies of physician dispensing in workers’ compensation (Wynn, 2005; Neuhauser et al., 2006) and several others outside workers’ compensation that have drawn lessons from international studies (Iizuka, 2007; Currie et al., 2010; Chen et al., 2011).
15
___________________________________________________________________________________________________P H Y S I C I A N D I S P E N S I N G I N W O R K E R S ' C O M P E N S A T I O N
copyright © 2012 workers compensation research institute

Medicaid patients for designated health services (DHS) to facilities in which the physicians or members of the
physician’s group have a financial interest.3 There are exceptions to the Stark Law known as the bona fide employee
and in-office ancillary services exceptions. The bona fide employee exception allows physician self-referrals to an
employee of an affiliated vertically integrated firm. The in-office ancillary services exception allows physicians to
perform certain in-office services, including dispensing prescription drugs.4
Physician dispensing is not new. What is new is the increased frequency with which physicians have dispensed
prescription medications, especially since the relatively recent emergence of repackaged drugs, which makes
physician dispensing of prescription drugs easier and more profitable.5 What is also more recent is the growing price
differential between what physicians and pharmacies are paid for the same drug.
Advocates for physician dispensing note certain advantages. First, for some injured workers, it may mean greater
compliance with the medication therapy the doctor prescribes, because when the injured worker is given a
prescription to be filled at a pharmacy, there is a possibility that this worker will not actually fill the prescription.
Second, it saves the patient time—especially for patients who live in remote areas that are long distances from the
nearest pharmacy. Finally, it maximizes the benefit of prompt treatment, since some medications (e.g., antibiotics in
some cases) should be taken as soon as possible.
Opponents of physician dispensing express several concerns. First, they argue that the price differential charged
for physician-dispensed drugs is often excessive. Second, they contend that patient compliance is less of an issue in
workers’ compensation than for non-occupational medical care—since the majority of workers’ compensation
prescriptions are for pain medications, rather than for maintenance drugs (e.g., hypertension or cholesterol
medications) where compliance is a concern. Third, they argue that pharmacies or pharmacy benefit managers are
better positioned than physician-dispensers to identify drug safety issues, such as drug interactions, narcotics abuse
or diversion, or duplicate therapies.
The public policy questions that are commonly debated are
Should physician dispensing be permitted or prohibited?
If permitted, should physicians be paid a premium price above what pharmacies are paid? If so, how large
should the premium be?
In the United States, five states have prohibited physicians from dispensing prescription drugs in general, by law.
Three of them are included in this study (Massachusetts, New York, and Texas). The only other states that prohibit
physician dispensing are Montana and Utah. In other states, issues related to physician dispensing are more or less
addressed through state workers’ compensation policies on pharmacy fee schedules, which set maximum
reimbursement rates for pharmaceuticals dispensed at pharmacies and physician offices. 3 The Stark Law was named after Congressman Fortney Pete Stark. Stark I, a provision in the Omnibus Budget Reconciliation Act of 1989 (OBRA 1989), which was effective January 1, 1992, banned self-referral arrangements for clinical laboratory services under the Medicare program. The OBRA of 1993, known as Stark II, extended the ban to an additional list of designated health services beginning in 1995, which also included significant modification to the in-office ancillary services exceptions. The ban also extended to services and supplies provided to Medicaid beneficiaries. The Development of Phases I and II of the Stark regulations began in 1998. Stark II Phase III was published on September 5, 2007. It is widely believed that the Stark Law has restricted physician self-referral practices, but the extent of the restrictive effects is not well known (Manchikanti and McMahon, 2007). 4 Drawing lessons from other countries on the same issue, Chen and his colleagues provided evidence that suggests physicians may exploit the in-office ancillary exception to continue dispensing prescriptions at a higher price or exploit the bona fide employee exception to hire on-site pharmacists or acquire pharmacies (Chen et al., 2011). 5 Repackagers purchase the drugs in bulk and package them in smaller, convenient quantities (e.g., 30, 60, 90, etc.). In the process of repackaging, the companies are allowed to assign a new National Drug Code and assign a new, often much higher average wholesale price for the repackaged drugs. In our data, we see individual physicians and multispecialty clinics who dispense repackaged drugs, but little evidence that pharmacies dispense repackaged drugs.
16
___________________________________________________________________________________________________P H Y S I C I A N D I S P E N S I N G I N W O R K E R S ' C O M P E N S A T I O N
copyright © 2012 workers compensation research institute

Appendix A provides a summary of state policies on pharmacy fee schedules and physician dispensing as of June
2012, highlighting major changes in fee schedules that have been made since 2007.
ORGANIZATION OF THIS REPORT
This report provides five additional chapters. Chapter 2 summarizes the data and approach used for this study.
Chapter 3 describes the prevalence and growth of physician dispensing in 23 larger states. In Chapter 4, we present
price comparisons between physician- and pharmacy-dispensed prescriptions for the same drugs and examine the
growth in prices paid. In Chapter 5, we offer some evidence that certain drugs, that may otherwise not be prescribed
if the prescription is filled at a pharmacy, are only prescribed when physicians dispense. Chapter 6 examines lessons
learned from the California post-reform experience. We describe how the reform that equalized prices paid
regardless of dispensing point affected patient access to physician-dispensed drugs and how prescribing practices
may have changed. These lessons may be useful for policymakers in other states as they consider whether reforms
like those in California would reduce the costs associated with physician dispensing.
Appendix A summarizes state policies on fee schedules for workers’ compensation pharmaceuticals, covering
pharmacy fee schedules and policies on physician dispensing. It also highlights major changes in the states studied
that had or will have a significant impact on pharmacy costs. Appendix B describes a test of how sensitive the results
of the price comparison were to the differences in the quantity per prescription and the strength for physician- and
pharmacy-dispensed drugs. For readers who are less familiar with some terminologies used in the report, we provide
a glossary.
17
___________________________________________________________________________________________________P H Y S I C I A N D I S P E N S I N G I N W O R K E R S ' C O M P E N S A T I O N
copyright © 2012 workers compensation research institute
2
DATA AND METHODS
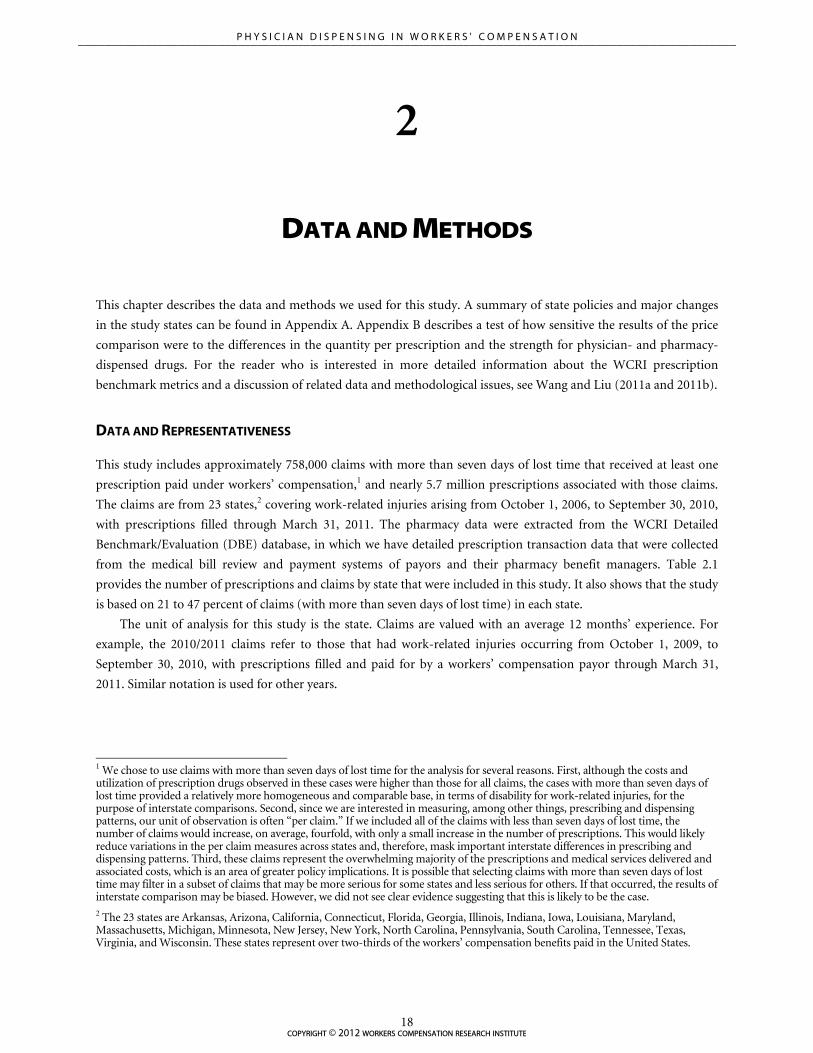
This chapter describes the data and methods we used for this study. A summary of state policies and major changes
in the study states can be found in Appendix A. Appendix B describes a test of how sensitive the results of the price
comparison were to the differences in the quantity per prescription and the strength for physician- and pharmacy-
dispensed drugs. For the reader who is interested in more detailed information about the WCRI prescription
benchmark metrics and a discussion of related data and methodological issues, see Wang and Liu (2011a and 2011b).
DATA AND REPRESENTATIVENESS
This study includes approximately 758,000 claims with more than seven days of lost time that received at least one
prescription paid under workers’ compensation,1 and nearly 5.7 million prescriptions associated with those claims.
The claims are from 23 states,2 covering work-related injuries arising from October 1, 2006, to September 30, 2010,
with prescriptions filled through March 31, 2011. The pharmacy data were extracted from the WCRI Detailed
Benchmark/Evaluation (DBE) database, in which we have detailed prescription transaction data that were collected
from the medical bill review and payment systems of payors and their pharmacy benefit managers. Table 2.1
provides the number of prescriptions and claims by state that were included in this study. It also shows that the study
is based on 21 to 47 percent of claims (with more than seven days of lost time) in each state.
The unit of analysis for this study is the state. Claims are valued with an average 12 months’ experience. For
example, the 2010/2011 claims refer to those that had work-related injuries occurring from October 1, 2009, to
September 30, 2010, with prescriptions filled and paid for by a workers’ compensation payor through March 31,
2011. Similar notation is used for other years.
1 We chose to use claims with more than seven days of lost time for the analysis for several reasons. First, although the costs and utilization of prescription drugs observed in these cases were higher than those for all claims, the cases with more than seven days of lost time provided a relatively more homogeneous and comparable base, in terms of disability for work-related injuries, for the purpose of interstate comparisons. Second, since we are interested in measuring, among other things, prescribing and dispensing patterns, our unit of observation is often “per claim.” If we included all of the claims with less than seven days of lost time, the number of claims would increase, on average, fourfold, with only a small increase in the number of prescriptions. This would likely reduce variations in the per claim measures across states and, therefore, mask important interstate differences in prescribing and dispensing patterns. Third, these claims represent the overwhelming majority of the prescriptions and medical services delivered and associated costs, which is an area of greater policy implications. It is possible that selecting claims with more than seven days of lost time may filter in a subset of claims that may be more serious for some states and less serious for others. If that occurred, the results of interstate comparison may be biased. However, we did not see clear evidence suggesting that this is likely to be the case. 2 The 23 states are Arkansas, Arizona, California, Connecticut, Florida, Georgia, Illinois, Indiana, Iowa, Louisiana, Maryland, Massachusetts, Michigan, Minnesota, New Jersey, New York, North Carolina, Pennsylvania, South Carolina, Tennessee, Texas, Virginia, and Wisconsin. These states represent over two-thirds of the workers’ compensation benefits paid in the United States.
18
___________________________________________________________________________________________________P H Y S I C I A N D I S P E N S I N G I N W O R K E R S ' C O M P E N S A T I O N
copyright © 2012 workers compensation research institute

Table 2.1 Actual Number of Claims and Prescriptions Included in the Analysis
State Number of Claims Included
Number of Rx Included
Number of Claims Included as a Percentage of All Claims in the
Population
Arizonaa 11,539 68,545 22%
Arkansas 6,579 44,250 35%
Californiaa 134,578 1,508,155 31%
Connecticut 19,516 99,255 43%
Florida 52,442 433,946 27%
Georgiaa 20,196 210,634 29%
Illinois 45,033 254,874 30%
Indiana 16,343 93,550 33%
Iowa 8,202 42,134 21%
Louisiana 11,518 150,554 32%
Maryland 22,869 157,460 29%
Massachusettsb 29,743 109,053 44%
Michigan 27,585 149,573 38%
Minnesota 19,359 87,192 31%
New Jersey 42,709 147,040 46%
New Yorkb 56,356 318,198 34%
North Carolina 20,713 174,511 29%
Pennsylvania 57,625 370,202 35%
South Carolinaa 11,460 108,483 46%
Tennesseea 20,355 181,740 31%
Texasb 88,644 803,415 47%
Virginia 15,913 101,358 35%
Wisconsin 18,847 73,032 24%
Notes: The claims included are those that had more than seven days of lost time and complete medical details for injuries occurring from October 1, 2006, to September 30, 2010. The prescription transaction data are for those prescriptions filled through March 31, 2011, and paid under workers' compensation that are associated with the claims included. a Five states (Arizona, California, Georgia, South Carolina, and Tennessee) recently adopted reforms aimed at reducing the costs of physician dispensing (see Appendix A for more detail). The data included are partially post-reform for Arizona, post-reform for California, and pre-reform for Georgia, South Carolina, and Tennessee.
b In Massachusetts, New York, and Texas, physician dispensing is not allowed in general (see Appendix A for more detail).
Key: Rx: prescriptions.
Unlike in other WCRI benchmark reports, the data included in this study may not necessarily be representative
of the total population of claims in some states for several reasons. First, the data cover the voluntary market, self-
insured market, and state funds where they exist, but do not cover the residual market in the states with a distinct
residual market. Fortunately, these residual markets were small in the study states over the period we analyzed.
Second, we were missing data from some large regional insurers for two states, which may affect the
representativeness of the data for the states. Third, compared with data on other medical services, the data provided
19
___________________________________________________________________________________________________P H Y S I C I A N D I S P E N S I N G I N W O R K E R S ' C O M P E N S A T I O N
copyright © 2012 workers compensation research institute

to WCRI on workers’ compensation prescriptions were less complete for some data sources. We excluded those data
sources where our tests suggested that the data provided were not complete and were likely to bias the study results.3
IDENTIFYING PRESCRIPTION DRUGS AND DISPENSING POINTS
By prescription, we mean either a new prescription or a refill of an existing prescription. We excluded prescription
medications that were billed by a hospital or administered in a physician’s offices (e.g., injections received at a
physician’s office).4 We also excluded nonprescription medicines and certain medical supplies or equipment that are
billed under a National Drug Code (NDC).5
The data come from various bill review and payment systems of payors and their pharmacy benefit managers.
The data for each prescription typically contain the amounts charged and paid, the number of pills (for orally-
administered drugs in pill form),6 the date of service, and a code that identifies the transaction as a prescription. This
code could be an NDC, a Current Procedural Terminology (CPT) code, a Healthcare Common Procedure Coding
System (HCPCS) code, or a code for prescription medications specific to a data source.
The NDCs were linked to the Medi-Span® data that identify the type of medication (e.g., therapeutic class,
narcotics, and federal-level narcotic schedules), its strength, and the manufacturer or repackaging firm for the
medication.7 For the pharmacy-dispensed prescriptions, the NDC data were complete. For the prescriptions
dispensed in physicians’ offices, however, the NDC data were less complete for several data sources in the earlier
years of the study period.8 For any prescription that was missing an NDC, we were unable to determine the name of
the medication and its strength. We included these prescriptions in benchmarks that characterize overall costs and
utilization, but did not include them in the benchmark metrics that are based on NDC data. To maximize the
representativeness, we included a data source for the NDC-based metrics if the prescriptions with NDCs in the data
source were representative of all prescriptions from that data source. As a result, a smaller number of data sources
were included for these NDC-based metrics, compared with those included for the broader prescription
benchmarks.
The quality of data tended to vary from one year to another due to the improvement of the pharmacy data over
time. For the trend analysis, we excluded additional data sources where the data quality was not consistent across
years. This affected a limited number of metrics.
As mentioned at the beginning of this section, this study focuses on prescriptions that were dispensed either at
3 This may affect the representativeness of the data if the claims from those excluded data sources were different in some way or had different experiences. 4 Injectable medications are typically coded using the J codes in the Healthcare Common Procedures Coding System (a.k.a., HCPCS J-codes). 5 One challenge was to distinguish prescription drugs in the data from prescriptions that were written for nonprescription medicines, or certain medical supplies or equipment. The NDC structure assigns codes to prescriptions, some nonprescription medicines, and some medical supplies or equipment. We excluded from the pharmacy data those nonprescription medicines and medical supplies and equipment by screening for particular NDCs. 6 Over 90 percent of the prescription medications included in this study are in oral dosage form. The non-oral medications may be in the form of a pad, patch, cream, or lotion. 7 Medi-Span® is a publisher which offers a series of comprehensive drug databases, tools, and applications utilized by health care professionals. Medi-Span® is part of Wolters Kluwer Health, Inc. We used Medi-Span’s Master Drug Data Base (MDDB®) v2.5 to get detailed information on individual drugs for constructing our pharmacy database (see Medi-Span®, 2005). 8 In the 2010/2011 data, NDCs were present in over 97 percent of pharmacy-dispensed prescriptions and 89–98 percent of physician-dispensed prescriptions. NDCs among physician-dispensed prescriptions were less complete for a small number of data sources in some states in the 2007/2008 data—68–96 percent of the physician-dispensed prescriptions had NDCs in that year.
20
___________________________________________________________________________________________________P H Y S I C I A N D I S P E N S I N G I N W O R K E R S ' C O M P E N S A T I O N
copyright © 2012 workers compensation research institute

pharmacies or at the office of the prescribing physician. When physicians dispense medications, they typically
dispense repackaged drugs for various reasons (e.g., patient convenience and higher price paid).9
In order to divide prescriptions into two groups, physician- and pharmacy-dispensed prescriptions, we used two
variables in the data—the provider group, a field that indicates whether the prescription was billed by a physician or
non-physician, and the Medi-Span® indicator, which identifies repackaged drugs by the NDCs assigned for
repackaged drugs during the Food and Drug Administration (FDA) drug approval process. Since we excluded
prescriptions billed by hospitals, we classified a prescription as a physician-dispensed prescription if the prescription
was billed by a physician or if the Medi-Span® indicator labeled the prescription as one for a repackaged drug (even
when the provider group was a non-physician). Note that we included mail-order prescriptions in the definition of
pharmacy-dispensed prescriptions.
KEY BENCHMARK METRICS DISCUSSED IN THIS REPORT
In comparing the prices paid for physician- and pharmacy-dispensed prescriptions, we relied on the average price
per pill paid for a specific drug. We also focused on comparing the prices for generic drugs that were most
commonly dispensed by physicians. This is appropriate because, for the medications commonly dispensed by
physicians, generics were almost always dispensed by both physicians and pharmacies.10
The price per pill paid for a generic drug has an obvious advantage over the price per prescription because it
takes into account the difference in the number of pills per prescription and the difference in price between brand
names and generics. However, the same measure may still reflect price differentials in the strength and per-packet
quantity to the extent that a large difference exists between physician- and pharmacy-dispensed prescriptions. For
example, the price per pill for a 30-pill bottle of ibuprofen (Motrin®) is somewhat higher than the price per pill for a
90-pill bottle of the same drug. A drug product with a stronger strength would also cost more than the same drug
with a lower strength. We checked the number of pills per prescription and selectively reviewed more detailed data
on a drug product and its strength when making a price comparison. We also tested how sensitive the results of the
price comparison were to these potential confounding factors. In these analyses, we saw little evidence that this
should be a serious concern, especially given the size of the differences in the prices we are reporting.11
Other key benchmark metrics we used for this study include the percentage of all prescriptions and prescription
payments that were for physician-dispensed prescriptions, as well as the percentage of claims with prescriptions that
had a specific drug commonly dispensed by physicians. We also report the percentage of all prescriptions that were
for repackaged drugs in the analysis of California’s pre- and post-reform experience.
Since the completeness of NDCs in the prescription transaction data has improved considerably over the study
period for some data sources, especially among prescriptions that were dispensed by a physician, one potential
concern is that the improvement may overstate the growth of physician dispensing (and repackaging) and it may also
9 Conceivably, physicians who are affiliated with physician groups and multispecialty clinics can also dispense the same, but non-repackaged, drugs, since these practice groups and clinics may own an onsite pharmacy through vertical integration between a physician practice and a pharmacy. We observed some of this in our data. Conceptually, we define physician-dispensed prescriptions as those that are dispensed and billed for by the physician (i.e., independent practitioners and physicians practicing in physician groups, occupational rehabilitation centers, and multispecialty clinics). With this definition, prescriptions dispensed at an onsite pharmacy affiliated with a physician group or multispecialty clinic under the same financial entity are considered physician-dispensed prescriptions, which is appropriate for this study. 10 Our data show that physicians rarely dispensed other drugs that are only available as brand names. Those single-source brand name drugs are mostly dispensed at pharmacies. 11 See Appendix B for a description of the sensitivity analysis, in which we provided the results of the price comparison for 5 mg hydrocodone-acetaminophen (Vicodin®) at 30 or 60 pills per prescription. These combinations were most commonly seen among physician- and pharmacy-dispensed prescriptions for the drug.
copyright © 2012 workers compensation research institute
___________________________________________________________________________________________________P H Y S I C I A N D I S P E N S I N G I N W O R K E R S ' C O M P E N S A T I O N
21

compromise the price comparison for individual drugs for physician- and pharmacy-dispensed prescriptions. Based
on how we constructed the benchmark measures, we believe that this should not be a serious concern for the
following reasons. First, we identified physician-dispensed prescriptions using two variables as described above—the
provider group established in the DBE database and the Medi-Span® indicator for repackaged drugs. The provider
group identified a vast majority of the prescriptions that were dispensed by a physician.12 For prescriptions that were
not associated with the physician as a provider group, over 92 percent of them had NDCs in our data across the
years. Because the NDCs were complete among those prescriptions, the Medi-Span® indicator for repackaged drugs
adequately reclassified prescriptions that were dispensed by a physician, but not associated with the physician in our
data, as physician-dispensed prescriptions. Second, the improvement in the completeness of the NDCs may affect
how the prevalence and growth of repackaged drugs were quantified because repackaged drugs were identified only
based on the Medi-Span® indicator for repackaged drugs, which is dependent on the completeness of NDCs.
However, for several states, including California and Florida, NDCs were complete for all the data sources in our
data throughout the entire study period. For these states, the prevalence and growth of repackaging are most likely to
be accurately quantified.13 Third, the price comparisons in this study were made for individual drugs, which were
identified through the NDCs. To ensure the accuracy of the prices paid for physician- and pharmacy-dispensed
prescriptions for individual drugs, we excluded a few data sources which had less complete NDCs in the earlier years
of the study period. It is unlikely that, for the same drug in the same market, the prices paid by the payors (or data
sources) included for the price comparison were very different from the prices paid by those excluded. In addition,
we made sure that the data sources included accounted for a significant share of the market in each state. For these
reasons, we believe that the levels and trends in the prices paid for physician- and pharmacy-dispensed prescriptions
were measured properly across the years studied.
CAPTURING PRESCRIPTIONS THAT WERE FILLED BY INJURED WORKERS
There was substantial variation across states in the percentage of claims with more than seven days of lost time that
had at least one prescription paid by a workers’ compensation payor, as shown in Table 2.1. It is not surprising that
physician prescribing practices vary from state to state. The WCRI CompScope™ Medical Benchmarks identify large
variations in other types of medical practice patterns (e.g., surgery rates, use of diagnostics, and frequency and timing
of pain management). However, we expected that most cases in which the worker lost more than seven days of work
would be sufficiently serious to warrant a prescription, and yet a number of them did not have prescriptions in our
data.
There are several possible reasons for this. First, chiropractors provide care as the sole treating provider more
often in some states than in others. Since chiropractors do not prescribe, interstate variation in the level of
involvement of chiropractors as treating providers may be part of the explanation.
Second, some prescriptions may be paid for by non-workers’ compensation payors, in part because pharmacies
may be submitting them to other payors—especially for workers who have prescription coverage in their non-
occupational health insurance. This is consistent with a study of workers’ compensation cases of state employees in
12 By construction, the provider group definitively identifies services provided and billed by the physician. Since all prescriptions were identified by using NDCs and data source-specific codes for prescriptions, those prescriptions associated with the physician as a provider group are most likely physician-dispensed prescriptions. We observed that the NDCs were increasingly more complete among this set of prescriptions. 13 In this study, we report the percentage of all prescriptions that were for repackaged drugs only for California. See Chapter 6, in which we discuss changes in physician dispensing and repackaging in California before and after the fee schedule change in 2007 that equalized the prices paid for physician- and pharmacy-dispensed prescriptions.
copyright © 2012 workers compensation research institute
___________________________________________________________________________________________________P H Y S I C I A N D I S P E N S I N G I N W O R K E R S ' C O M P E N S A T I O N
22

New York,14 all of whom were covered by group health insurance that included prescription coverage (Stapleton et
al., 2001). By combining the records of the state fund and the group health insurers’ interviews with workers, the
study found that 21 percent of all drug expenditures for those injured workers were paid by the state fund, 69
percent by health insurers, and 9 percent by the worker without reimbursement.
Third, some workers may have paid for their prescriptions out of pocket and received reimbursements
subsequently from workers’ compensation payors. Some of these transactions might not be captured in our data if
they were not submitted or were misidentified since they go through very different channels. However, our case
review of individual claims did not find strong evidence suggesting that this would be a major contributing factor to
the missing prescription issue.15
It is possible that some results based on claims with prescriptions, especially for the per-claim utilization
measures, may be biased for benchmarking the costs and utilization of prescriptions filled by injured workers
because of the reasons stated previously. We assessed the extent of this potential bias with a sensitivity analysis. Based
on our analysis, we concluded that although it is possible, this was unlikely to affect the results in a material way. For
this study, since it is relies more on the data at the prescription-transaction level and less on per-claim utilization, the
results presented in this report should be less sensitive to the issue discussed.
LIMITATIONS AND CAVEATS
The trends analyses in this report were based on claims with an average 12 months’ experience. The reader should be
aware that these are only snapshots of prescribing and dispensing patterns during the first year of injury, on average.
Prescribing patterns may be different for subsequent years or longer maturities. In addition, we focus on claims
where the worker had at least seven days of lost time from work and at least one prescription paid by a workers’
compensation payor.
Compared with data on other medical services, the data provided to WCRI on workers’ compensation
prescriptions were less complete for some data sources. We excluded these data sources where our tests suggested
that the data provided were not complete and were likely to bias the study results. The data are not necessarily
representative of the population of cases in some states. The data cover the voluntary market, the self-insured
market, and state funds where they exist, but do not cover the small residual market in states with distinct residual
markets. For two states, we are also missing data from some large regional insurers.
14 The New York State Insurance Fund handles the workers’ compensation claims of state employees. 15 To assess the extent of this issue, we conducted individual case reviews of 50 cases with several data sources. In these reviews, we found some incidences where the payment transactions indicated a reimbursement for an out-of-pocket payment, some of which might have been paid for prescription drugs. However, this only involved approximately 10–15 percent of the cases we reviewed, which is not enough to explain the large difference we observed in the measure.
23
___________________________________________________________________________________________________P H Y S I C I A N D I S P E N S I N G I N W O R K E R S ' C O M P E N S A T I O N
copyright © 2012 workers compensation research institute

3
PREVALENCE AND GROWTH OF PHYSICIAN DISPENSING
Physician dispensing was common and growing in 2010/2011 in many of the states studied.1 In 13 of the 20
study states that permit physician dispensing, at least 1 in 6 prescriptions was dispensed at a physician’s office.
In 6 of these states (California, Florida, Illinois, Georgia, Maryland, and Arizona), physicians dispensed at
least 1 in 3 prescriptions. Physician-dispensed prescriptions accounted for 47 to 63 percent of the total cost of
prescriptions in these states, except Arizona (28 percent). See Figures 3.1–3.2 and Table 3.1. Among the 7
other states where physicians dispensed at least 1 in 6 prescriptions in the state, physicians’ share of
prescription payments ranged from 12 percent in New Jersey at the low end to 37 percent of all prescription
spending in Connecticut at the high end. Note that in most states, physician dispensing accounted for a larger
share of total prescription spending than its share of all prescriptions dispensed. This occurred because the
prices of physician-dispensed prescriptions were much higher than pharmacy-dispensed prescriptions for the
same drugs, which was especially the case for Illinois, Florida, Georgia, Maryland, and Louisiana.2
As indicated in Figures 3.1–3.2 and Table 3.1, five states recently adopted reforms aimed at reducing the
costs of physician-dispensed prescriptions. Among the five states, California and Arizona have post-reform
experience showing in the data.3 The data included in this report for the other three states (Georgia, South
Carolina, and Tennessee) are pre-reform. In addition, Florida now prohibits physicians from dispensing
Schedule II and III narcotics. This change occurred after the period examined in this study.
Among the ten states where physician dispensing was less common, three states (Massachusetts, New
York, and Texas) prohibit physician dispensing by law. In Arkansas, physicians are permitted to dispense
prescription drugs, but physician-dispensed drugs are subject to the same fee schedule as pharmacies in the
state, which requires reporting the purchasing price for the drug dispensed. No dispensing fees are paid for
physician-dispensed prescriptions. Minnesota also permits physician dispensing, but the state Board of
Medical Practice requires physicians who dispense medications to register with the Board. In addition,
physicians are required to disclose to patients that the physician profits from dispensing the drug and that the
patient has the option of obtaining the drugs elsewhere. Louisiana limits physician dispensing by the type of
drug. Appendix A summarizes state policies and major changes on pharmacy fee schedules and physician
dispensing.
1 2010/2011 refers to claims with injuries occurring from October 1, 2009, through September 30, 2010, and prescriptions filled and paid for through March 31, 2011. Similar notation is used for other years. 2 Chapter 4 presents price comparisons between physician- and pharmacy-dispensed prescriptions for the same drug. 3 Lessons learned from the California post-reform experience are discussed in Chapter 6. We do not specifically discuss the early results of the Arizona reforms in this report.
24
___________________________________________________________________________________________________P H Y S I C I A N D I S P E N S I N G I N W O R K E R S ' C O M P E N S A T I O N
copyright © 2012 workers compensation research institute

0%
10%
20%
30%
40%
50%
60%
MA NY TX AR MN LA VA WI NC IA SC NJ TN PA IN MI CT AZ MD GA IL FL CA
Per
cen
tag
e o
f All
Rx
That
Wer
e P
hys
icia
n-
Dis
pen
sed
Rx
a a a bb b b b
0%
10%
20%
30%
40%
50%
60%
70%
MA NY TX AR MN NJ VA IA WI IN NC LA MI TN SC PA AZ CT MD GA CA FL IL
Per
cen
tag
e o
f Rx
Pay
men
ts T
hat
Wer
e M
ade
for
Ph
ysic
ian
-Dis
pen
sed
Rx
a a a b bbb b
Figure 3.1 Percentage of All Prescriptions That Were Dispensed by Physicians, 2010/2011
Notes: The underlying data include prescriptions for claims with more than seven days of lost time that had prescriptions filled and paid for by a workers' compensation payor over the defined period. 2010/2011 refers to claims with injuries occurring from October 1, 2009, through September 30, 2010, and prescriptions through March 31, 2011. a In Massachusetts, New York, and Texas, physician dispensing is not allowed in general (see Appendix A for more detail). b Five states (Arizona, California, Georgia, South Carolina, and Tennessee) recently adopted reforms aimed at reducing the costs of physician-dispensed prescriptions (see Appendix A for more detail). For California and Arizona, the data included reflect post-reform experience in the state. For Georgia, South Carolina, and Tennessee, the data included are pre-reform. Lessons learned from California's post-reform experience are discussed in Chapter 6.
Key: Rx: prescriptions. Figure 3.2 Percentage of Prescription Payments That Were for Physician-Dispensed Prescriptions, 2010/2011
Notes: The underlying data include prescriptions for claims with more than seven days of lost time that had prescriptions filled and paid for by a workers' compensation payor over the defined period. 2010/2011 refers to claims with injuries occurring from October 1, 2009, through September 30, 2010, and prescriptions through March 31, 2011. a In Massachusetts, New York, and Texas, physician dispensing is not allowed in general (see Appendix A for more detail). b Five states (Arizona, California, Georgia, South Carolina, and Tennessee) recently adopted reforms aimed at reducing the costs of physician-dispensed prescriptions (see Appendix A for more detail). For California and Arizona, the data included reflect post-reform experience in the state. For Georgia, South Carolina, and Tennessee, the data included are pre-reform. Lessons learned from California's post-reform experience are discussed in Chapter 6.
Key: Rx: prescriptions.
25
___________________________________________________________________________________________________P H Y S I C I A N D I S P E N S I N G I N W O R K E R S ' C O M P E N S A T I O N
copyright © 2012 workers compensation research institute

Table 3.1 Prevalence and Costs of Physician Dispensing, 2010/2011
State Percentage of All Rx That Were Dispensed by Physicians
Percentage of Rx Payments That Were Paid for Physician-Dispensed Rx
Illinois 43% 63%
Florida 45% 62%
Californiaa 53% 52%
Georgiaa 36% 48%
Maryland 35% 47%
Connecticut 28% 37%
Arizonaa 32% 28%
Pennsylvania 20% 27%
South Carolinaa 18% 26%
Tennesseea 20% 25%
Michigan 24% 22%
Louisiana 7% 19%
North Carolina 14% 18%
Indiana 22% 17%
Wisconsin 11% 15%
Iowa 15% 12%
Virginia 10% 12%
New Jersey 18% 12%
Minnesota 4% 3%
Arkansas 4% 3%
Massachusettsb n/a n/a
New Yorkb n/a n/a
Texasb n/a n/a
Notes: The underlying data include prescriptions for claims with more than seven days of lost time that had prescriptions filled and paid for by a workers' compensation payor over the defined period. 2010/2011 refers to claims with injuries occurring from October 1, 2009, through September 30, 2010, and prescriptions through March 31, 2011. a Five states (Arizona, California, Georgia, South Carolina, and Tennessee) recently adopted reforms aimed at reducing the costs of physician-dispensed prescriptions (see Appendix A for more detail). For California and Arizona, the data included reflect post-reform experience in the state. For Georgia, South Carolina, and Tennessee, the data included are pre-reform. Lessons learned from California’s post-reform experience are discussed in Chapter 6. b In Massachusetts, New York, and Texas, physician dispensing is not allowed in general (see Appendix A for more detail).
Key: n/a: not applicable; Rx: prescriptions.
Over the study period from 2007/2008 to 2010/2011, physician dispensing of prescription drugs became
increasingly common in most states that we studied (Table 3.2). In 9 of the 23 states studied, the share of
prescription spending represented by physician dispensing grew rapidly or very rapidly. Most striking was
Illinois, where physician-dispensed prescriptions grew to 63 percent of total prescription spending—up from
22 percent in just three years.
26
___________________________________________________________________________________________________P H Y S I C I A N D I S P E N S I N G I N W O R K E R S ' C O M P E N S A T I O N
copyright © 2012 workers compensation research institute

Table 3.2 Growth of Physician Dispensing, 2007/2008–2010/2011
Percentage of All Rx That Were Dispensed by
Physicians
Percentage of Rx Payments That Were Paid for
Physician-Dispensed Rx State
2007/2008 2010/2011
Percentage Point
Change 2007/2008 2010/2011
Percentage Point
Change
Illinois 26% 43% 17 22% 63% 41
Connecticut 18% 28% 10 16% 37% 21
Florida 35% 45% 10 43% 62% 19
South Carolinaa 12% 18% 6 10% 26% 16
Georgiaa 30% 36% 6 32% 48% 16
Pennsylvania 17% 20% 3 15% 27% 12
Tennesseea 15% 20% 5 14% 25% 11
Maryland 33% 35% 2 36% 47% 11
Wisconsin 8% 11% 3 5% 15% 10
North Carolina 12% 14% 2 10% 18% 8
Indiana 17% 22% 5 9% 17% 8
Virginia 7% 10% 3 5% 12% 7
Michigan 23% 24% 1 15% 22% 7
Arizonaa 27% 32% 5 23% 28% 5
Louisiana 11% 7% -4 17% 19% 2
New Jersey 11% 18% 7 10% 12% 2
Iowa 16% 15% -1 11% 12% 1
Minnesota 3% 4% 1 2% 3% 1
Arkansas 2% 4% 2 2% 3% 1
Californiaa 56% 53% -3 55% 52% -3
Massachusettsb n/a n/a n/a n/a n/a n/a
New Yorkb n/a n/a n/a n/a n/a n/a
Texasb n/a n/a n/a n/a n/a n/a
Notes: The underlying data include prescriptions for claims with more than seven days of lost time that had prescriptions filled and paid for by a workers' compensation payor over the defined period. 2010/2011 refers to claims with injuries occurring from October 1, 2009, through September 30, 2010, and prescriptions through March 31, 2011; similar notation is used for other years.
a Five states (Arizona, California, Georgia, South Carolina, and Tennessee) recently adopted reforms aimed at reducing the costs of physician dispensing (see Appendix A for more detail). The data included are partially post-reform for Arizona, post-reform for California, and pre-reform for Georgia, South Carolina, and Tennessee. Lessons learned from California's post-reform experience are discussed in Chapter 6. b In Massachusetts, New York, and Texas, physician dispensing is not allowed in general (see Appendix A for more detail).
Key: n/a: not applicable; Rx: prescriptions.
Very rapid increases in spending on physician-dispensed prescriptions were seen in Connecticut (21
percentage points), Florida (19 percentage points), South Carolina (16 points), and Georgia (16 points). Note
that both South Carolina and Georgia recently adopted reforms, after the period covered by these data, aimed
at reducing the costs of physician dispensing.
27
___________________________________________________________________________________________________P H Y S I C I A N D I S P E N S I N G I N W O R K E R S ' C O M P E N S A T I O N
copyright © 2012 workers compensation research institute

In Pennsylvania, Tennessee, Maryland, and Wisconsin (listed in Table 3.2), rapid growth was also seen in
physicians’ share of prescription payments, although the frequency of physician dispensing increased
moderately. This occurred because of large increases in the prices of physician-dispensed drugs, while the prices
paid to pharmacies for the same medications changed little or fell. One of these states (Tennessee) adopted
reforms aimed at reducing the costs of physician dispensing, after the period covered by the data.
The striking growth of physician dispensing in Illinois (over three years) deserves more discussion. It was
the product of the following:
A large increase in the frequency of physician dispensing—from 26 to 43 percent of all prescriptions.
Rapid increases in the prices paid for common drugs when dispensed by physicians, while the prices of the
same drug dispensed by pharmacies changed little or fell. For example, the average price paid for physician-
dispensed hydrocodone-acetaminophen (Vicodin®)4 grew by 66 percent between 2007/2008 and
2010/2011 claims, while the price of the same drug dispensed at pharmacies remained stable (Table 4.2).
Physician-dispensers increasingly prescribed and dispensed medications that were available at much
lower prices at pharmacies without prescriptions (e.g., over-the-counter drugs). For example,
omeprazole (Prilosec®) was prescribed for less than 1 percent of patients in 2007/2008, but for 7 percent
of patients in 2010/2011. Almost all of these prescriptions were dispensed by physicians (94 percent of all
prescriptions for the drug in 2010/2011 claims) rather than pharmacies. The prices paid to physician-
dispensers for omeprazole (Prilosec®) increased from $4.71 to $8.08 per pill over that period (Table 5.1).
The cost per pill at Walgreens without a prescription was $0.64.5
It is worth noting that meloxicam (Mobic®) was another drug that was increasingly prescribed and
dispensed by physicians over the study period, contributing to the rapid growth in frequency and costs of
physician dispensing.
Meloxicam (Mobic®) is a nonsteroidal anti-inflammatory agent (NSAID) commonly used to treat mild
to moderate pain and inflammation in the back, neck, and leg. In mid-2006, several generic versions of the
brand name Mobic® were approved by the FDA. In the subsequent years, repackaged generic Mobic®, or
meloxicam, became available in the market.
As Table 3.3 shows, physician-dispensed meloxicam (Mobic®) increased considerably. This can be seen
in several states where physician dispensing grew rapidly. In Illinois, for example, 9 percent of physician-
dispensed prescriptions were for meloxicam (Mobic®) in 2010/2011, up by 7 percentage points (Table 3.3).
At the same time, physicians’ share of meloxicam (Mobic®) prescriptions also increased—in Illinois, 80
percent of meloxicam prescriptions were dispensed by physicians in 2010/2011, increased from 29 percent in
2007/2008. As a result, 14 percent of patients in Illinois received meloxicam (Mobic®) in 2010/2011; only 4
percent received it in 2007/2008. Note that the average price paid for generic meloxicam (Mobic®) was $2.92
per pill at pharmacies, but $5.81 per pill when dispensed by physicians in 2010/2011 claims (Table 4.1). The
increased use of meloxicam (Mobic®) was accompanied by a decrease in prescriptions for less-expensive
4 When discussing a specific drug, we use the drug name that reflects the active ingredients of the drug and include a brand name in parentheses that has the same active ingredients. For example, hydrocodone-acetaminophen has two active ingredients—hydrocodone and acetaminophen. Vicodin® and Norco® are two brand names for hydrocodone-acetaminophen. Throughout the report, we refer to this drug as hydrocodone-acetaminophen (Vicodin®) for brevity; similar notation is used for other drugs. 5 The price for a 42-count box of Prilosec OTC® is $26.99. Prices were retrieved on May 29, 2012, from www.walgreens.com.
28
___________________________________________________________________________________________________
copyright © 2012 workers compensation research institute
P H Y S I C I A N D I S P E N S I N G I N W O R K E R S ' C O M P E N S A T I O N

ibuprofen (Motrin®). According to one expert who reviewed a draft of the report, there is a lack of medical
evidence suggesting that meloxicam (Mobic®) is more effective than ibuprofen (Motrin®). However, the cost
for meloxicam (Mobic®) was much higher when dispensed by physicians.
Table 3.3 Changes in Prescribing and Dispensing of Certain Drugs for Selected States,a 2007/2008 and 2010/2011
Percentage of MDRx That
Were for the Drug Dispensed by Physicians
Percentage of Rx for the Drug That Were MDRx
2007/2008 2010/2011
Percentage Point
Change 2007/2008 2010/2011
Percentage Point
Change
Illinois
Meloxicam (Mobic®) 2% 9% 7 29% 80% 51
Omeprazole (Prilosec®) 0% 6% 6 64% 94% 30
Connecticut
Meloxicam (Mobic®) 1% 6% 5 18% 64% 46
Omeprazole (Prilosec®) 0% 1% 1 80% 61% -19
Florida
Meloxicam (Mobic®) 2% 10% 8 40% 74% 34
Omeprazole (Prilosec®) 2% 4% 2 87% 90% 3
South Carolinab
Meloxicam (Mobic®) 1% 8% 7 9% 40% 31
Omeprazole (Prilosec®) 0% 0% 0 0% 9% 9
Georgiab
Meloxicam (Mobic®) 3% 8% 5 41% 59% 18
Omeprazole (Prilosec®) 0% 3% 3 59% 87% 28
Pennsylvania
Meloxicam (Mobic®) 2% 6% 4 27% 45% 18
Omeprazole (Prilosec®) 0% 1% 1 13% 42% 29
Tennesseeb
Meloxicam (Mobic®) 5% 10% 5 24% 39% 15
Omeprazole (Prilosec®) 0% 0% 0 22% 21% -1
Maryland
Meloxicam (Mobic®) 1% 5% 4 28% 65% 37
Omeprazole (Prilosec®) 1% 2% 1 66% 97% 31
Wisconsin
Meloxicam (Mobic®) 1% 5% 4 6% 30% 24
Omeprazole (Prilosec®) 0% 1% 1 0% 17% 17
Notes: The underlying data include prescriptions for claims with more than seven days of lost time that had prescriptions filled and paid for by a workers' compensation payor over the defined period. 2010/2011 refers to claims with injuries occurring from October 1, 2009, through September 30, 2010, and prescriptions through March 31, 2011; similar notation is used for other years.
a Included are the states where physicians' share of drug spending grew rapidly or very rapidly (see Table 3.2).
b The data included are pre-reform for Georgia, South Carolina, and Tennessee, where the recent reforms were aimed at reducing the prices paid for physician-dispensed prescriptions.
Key: MDRx: physician-dispensed prescriptions; Rx: prescriptions.
29
___________________________________________________________________________________________________
copyright © 2012 workers compensation research institute
P H Y S I C I A N D I S P E N S I N G I N W O R K E R S ' C O M P E N S A T I O N

4
PRICE PREMIUM PAID FOR PHYSICIAN-DISPENSED
PRESCRIPTIONS
For many drugs that were commonly dispensed by physicians, the prices per pill paid to dispensing physicians
averaged 60–300 percent higher than the prices paid to pharmacies if the same prescriptions were filled at
pharmacies.1 Over the study period, the prices for physician-dispensed prescriptions also grew rapidly in
many states, while the prices paid to pharmacies for the same drugs had little change or fell.2
Table 4.1 compares the prices paid for physician-dispensed and pharmacy-dispensed prescriptions, for
each of the five drugs that were most commonly dispensed by physicians in 2010/2011.3 The states included
are the 19 states in our sample where physician dispensing was permitted, except California.4 For each of the
five common drugs, the states are ordered from left to right by lowest to highest price premium for physician-
dispensed drugs.
Hydrocodone-acetaminophen (Vicodin®) is the most common narcotic medication dispensed by
physicians as well as pharmacies. When physicians dispensed the drug, the average price per pill paid to
dispensing physicians was approximately 60–300 percent higher than what pharmacies were paid if the same
prescription was filled at a pharmacy (Table 4.1). In Maryland, the unit price for hydrocodone-
acetaminophen (Vicodin®) was $1.48 per pill when physicians dispensed the drug, more than four times the
price paid to pharmacies for the same drug. Connecticut was the second highest—the average price paid per
pill for hydrocodone-acetaminophen (Vicodin®) was $1.43 if dispensed by a physician and $0.37 if filled at a
pharmacy. Arizona had an average unit price of $0.74 per pill for physician-dispensed prescriptions and $0.44
per pill for pharmacies. Note that the fee schedule changes in Arizona, effective October 2009, were aimed at
reducing the costs of physician-dispensed prescriptions by setting reimbursement for physician-dispensed
1 The percentage of the prices paid to physicians over and above what is paid to pharmacies is often referred to as a price premium for physician dispensing. The price premiums can be seen for nearly all common drugs dispensed by physicians although they vary by state and by the type of drug. 2 The higher and steadily growing prices for physician-dispensed prescriptions were mainly because of physician dispensing of repackaged drugs. 3 The five drugs were the highest ranking drugs based on the share of physician-dispensed prescriptions for each individual drug in many states studied, especially the states where physician dispensing was common. Since the distribution varied from one state to another, several other drugs were among the five highest ranking drugs in some states. For simplicity, we selected these five drugs for the report. These five drugs accounted for 50–60 percent of physician-dispensed prescriptions in all study states except Georgia, Maryland, and Louisiana (45–50 percent) and Florida (43 percent). The five drugs were also commonly used to treat injured workers in each state regardless of dispensing point. In our sample, these five drugs combined represent 40–55 percent of all prescriptions in all states except New Jersey (32 percent). 4 California is not included in the analysis in this chapter. Lessons learned from the California post-reform experience are discussed in Chapter 6.
30
___________________________________________________________________________________________________P H Y S I C I A N D I S P E N S I N G I N W O R K E R S ' C O M P E N S A T I O N
copyright © 2012 workers compensation research institute

MN AZb AR IN IA TNb GAb VA FL IL LA WI NC SCb NJ PA MI CT MD
Hydrocodone-acetaminophen (Vicodin®)
Prices per pill paid for MDRx $0.47 $0.74 $1.07 $1.05 $1.02 $1.11 $1.02 $0.94 $1.08 $1.44 $1.17 $1.14 $1.35 $1.20 $1.23 $1.13 $0.98 $1.43 $1.48
Prices per pill paid for PDRx $0.30 $0.44 $0.54 $0.51 $0.48 $0.52 $0.47 $0.43 $0.43 $0.53 $0.43 $0.41 $0.47 $0.41 $0.40 $0.35 $0.29 $0.37 $0.36
% of MDRx price above PDRx 57% 68% 98% 106% 113% 113% 117% 119% 151% 172% 172% 178% 187% 193% 208% 223% 238% 286% 311%
AR MN IN AZb WI FL TNb VA IA CT NC IL GAb SCb NJ LA MD MI PA
Ibuprofen (Motrin®)
Prices per pill paid for MDRx – – $0.42 $0.49 $0.47 $0.58 $0.56 $0.53 $0.55 $0.57 $0.59 $0.59 $0.62 $0.60 $0.64 $0.68 $0.62 $0.58 $0.82
Prices per pill paid for PDRx $0.28 $0.23 $0.30 $0.30 $0.27 $0.31 $0.29 $0.27 $0.28 $0.29 $0.27 $0.27 $0.28 $0.26 $0.27 $0.28 $0.25 $0.20 $0.26
% of MDRx price above PDRx – – 40% 63% 74% 87% 93% 96% 96% 97% 119% 119% 121% 131% 137% 143% 148% 190% 215%
AR MN VA IA IN AZb TNb WI GAb NJ PA FL SCb MI IL CT NC MD LA
Meloxicam (Mobic®)
Prices per pill paid for MDRx – – – – $4.07 $3.62 $4.66 $4.85 $4.62 $4.34 $4.76 $5.25 $4.74 $3.99 $5.81 $5.25 $7.62 $5.02 $8.11
Prices per pill paid for PDRx $3.10 $2.53 $3.26 $3.07 $3.50 $2.94 $3.60 $3.60 $3.28 $3.04 $3.26 $3.38 $2.91 $2.01 $2.92 $2.15 $3.00 $1.76 $2.49
% of MDRx price above PDRx – – – – 16% 23% 29% 35% 41% 43% 46% 55% 63% 99% 99% 144% 154% 185% 226%
AR MN AZb IN FL NJ TNb WI GAb IA IL PA VA SCb NC MD CT MI LA
Tramadol HCL (Ultram®)
Prices per pill paid for MDRx – – $1.06 $1.37 $1.46 $1.67 $1.54 $1.60 $1.45 $1.46 $1.60 $1.66 $1.66 $1.52 $1.70 $1.52 $1.55 $1.23 $2.36
Prices per pill paid for PDRx $0.83 $0.68 $0.72 $0.82 $0.84 $0.95 $0.87 $0.90 $0.81 $0.80 $0.82 $0.81 $0.79 $0.71 $0.77 $0.64 $0.65 $0.43 $0.71
% of MDRx price above PDRx – – 47% 67% 74% 76% 77% 78% 79% 83% 95% 105% 110% 114% 121% 138% 138% 186% 232%
AR MN IN IA AZb TNb VA WI GAb NC NJ SCb CT IL FL PA MI MD LA
Cyclobenzaprine HCL (Flexeril®)
Prices per pill paid for MDRx – – $1.09 $1.06 $1.20 $1.42 $1.34 $1.33 $1.44 $1.55 $1.60 $1.51 $1.55 $1.63 $1.70 $1.78 $1.36 $1.78 $2.44
Prices per pill paid for PDRx $0.98 $0.77 $1.11 $1.06 $1.03 $1.11 $1.04 $0.97 $1.04 $1.05 $1.02 $0.96 $0.98 $1.03 $1.07 $0.97 $0.58 $0.75 $0.82
% of MDRx price above PDRx – – -2% 0% 17% 28% 29% 37% 38% 48% 57% 57% 58% 58% 59% 84% 134% 137% 198%
Table 4.1 Comparing Prices per Pill Paid for Physician- and Pharmacy-Dispensed Prescriptions for Top Five Common Drugs, 2010/2011a
Notes: The underlying data include prescriptions for claims with more than seven days of lost time that had prescriptions filled and paid for by a workers' compensation payor over the defined period. 2010/2011 refers to claims with injuries occurring from October 1, 2009, through September 30, 2010, and prescriptions through March 31, 2011. a In Massachusetts, New York, and Texas, physicians are not allowed in general to dispense prescription drugs (see Appendix A for more detail). These three states are not included in this analysis.
b Five states (Arizona, California, Georgia, South Carolina, and Tennessee) recently adopted reforms aimed at reducing the costs of physician-dispensed prescriptions (see Appendix A for more detail). For Arizona, the data included reflect the early results of post-reform experience in the state. For Georgia, South Carolina, and Tennessee, the data included are pre-reform. California is not included in the analysis in this chapter. Lessons learned from California’s post-reform experience are discussed in Chapter 6.
Key: –: not reported because the cell size is less than 30 prescriptions; MDRx: physician-dispensed prescriptions; PDRx: pharmacy-dispensed prescriptions.
31
___________________________________________________________________________________________________P H
Y S I C
I A N
D I S P E N
S I N G
I N W
O R K
E R S ' C O
M P E N
S A T I O
N
copyright © 2012 w
orkers compensation research institute
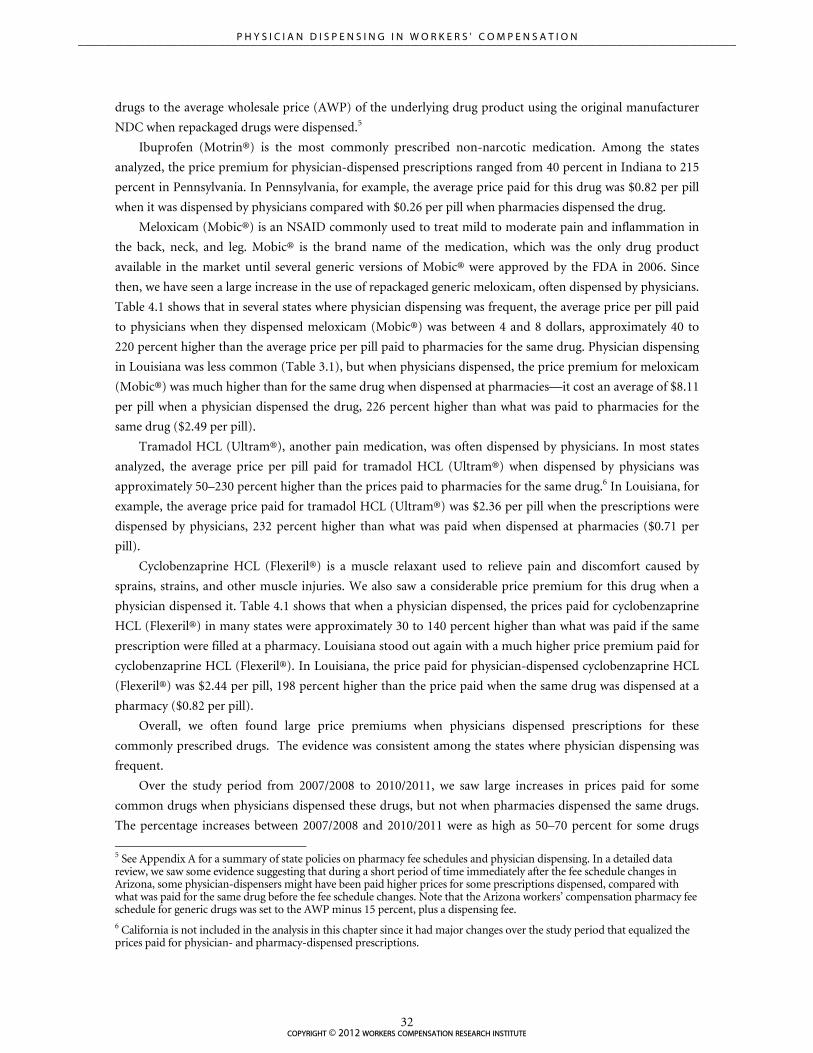
drugs to the average wholesale price (AWP) of the underlying drug product using the original manufacturer
NDC when repackaged drugs were dispensed.5
Ibuprofen (Motrin®) is the most commonly prescribed non-narcotic medication. Among the states
analyzed, the price premium for physician-dispensed prescriptions ranged from 40 percent in Indiana to 215
percent in Pennsylvania. In Pennsylvania, for example, the average price paid for this drug was $0.82 per pill
when it was dispensed by physicians compared with $0.26 per pill when pharmacies dispensed the drug.
Meloxicam (Mobic®) is an NSAID commonly used to treat mild to moderate pain and inflammation in
the back, neck, and leg. Mobic® is the brand name of the medication, which was the only drug product
available in the market until several generic versions of Mobic® were approved by the FDA in 2006. Since
then, we have seen a large increase in the use of repackaged generic meloxicam, often dispensed by physicians.
Table 4.1 shows that in several states where physician dispensing was frequent, the average price per pill paid
to physicians when they dispensed meloxicam (Mobic®) was between 4 and 8 dollars, approximately 40 to
220 percent higher than the average price per pill paid to pharmacies for the same drug. Physician dispensing
in Louisiana was less common (Table 3.1), but when physicians dispensed, the price premium for meloxicam
(Mobic®) was much higher than for the same drug when dispensed at pharmacies—it cost an average of $8.11
per pill when a physician dispensed the drug, 226 percent higher than what was paid to pharmacies for the
same drug ($2.49 per pill).
Tramadol HCL (Ultram®), another pain medication, was often dispensed by physicians. In most states
analyzed, the average price per pill paid for tramadol HCL (Ultram®) when dispensed by physicians was
approximately 50–230 percent higher than the prices paid to pharmacies for the same drug.6 In Louisiana, for
example, the average price paid for tramadol HCL (Ultram®) was $2.36 per pill when the prescriptions were
dispensed by physicians, 232 percent higher than what was paid when dispensed at pharmacies ($0.71 per
pill).
Cyclobenzaprine HCL (Flexeril®) is a muscle relaxant used to relieve pain and discomfort caused by
sprains, strains, and other muscle injuries. We also saw a considerable price premium for this drug when a
physician dispensed it. Table 4.1 shows that when a physician dispensed, the prices paid for cyclobenzaprine
HCL (Flexeril®) in many states were approximately 30 to 140 percent higher than what was paid if the same
prescription were filled at a pharmacy. Louisiana stood out again with a much higher price premium paid for
cyclobenzaprine HCL (Flexeril®). In Louisiana, the price paid for physician-dispensed cyclobenzaprine HCL
(Flexeril®) was $2.44 per pill, 198 percent higher than the price paid when the same drug was dispensed at a
pharmacy ($0.82 per pill).
Overall, we often found large price premiums when physicians dispensed prescriptions for these
commonly prescribed drugs. The evidence was consistent among the states where physician dispensing was
frequent.
Over the study period from 2007/2008 to 2010/2011, we saw large increases in prices paid for some
common drugs when physicians dispensed these drugs, but not when pharmacies dispensed the same drugs.
The percentage increases between 2007/2008 and 2010/2011 were as high as 50–70 percent for some drugs
5 See Appendix A for a summary of state policies on pharmacy fee schedules and physician dispensing. In a detailed data review, we saw some evidence suggesting that during a short period of time immediately after the fee schedule changes in Arizona, some physician-dispensers might have been paid higher prices for some prescriptions dispensed, compared with what was paid for the same drug before the fee schedule changes. Note that the Arizona workers’ compensation pharmacy fee schedule for generic drugs was set to the AWP minus 15 percent, plus a dispensing fee. 6 California is not included in the analysis in this chapter since it had major changes over the study period that equalized the prices paid for physician- and pharmacy-dispensed prescriptions.
___________________________________________________________________________________________________
32copyright © 2012 workers compensation research institute
P H Y S I C I A N D I S P E N S I N G I N W O R K E R S ' C O M P E N S A T I O N

that were dispensed by physicians in some states. In contrast, the average price paid to pharmacies for the
same drug was fairly stable or decreased.7
Table 4.2 shows the changes between 2007/2008 and 2010/2011 in the average price per pill paid for
physician- and pharmacy-dispensed prescriptions for the top five drugs that were most commonly dispensed
by physicians. Included in the table are the states with rapid or very rapid growth in the cost share of
physician dispensing. We discuss the results for several states to illustrate the divergent trends in the prices
paid for physician- and pharmacy-dispensed prescriptions. For some states, we mention additional drugs that
have also experienced rapid increases in price.8
In Illinois, we saw dramatic increases in the prices paid for most drugs that were commonly dispensed by
Illinois physicians, 20–60 percent increases over the three-year period. As Table 4.2 shows, the average price
paid to physicians for hydrocodone-acetaminophen (Vicodin®) increased 66 percent, from $0.87 per pill in
2007/2008 to $1.44 per pill in 2010/2011. Prices paid increased 39 percent for meloxicam (Mobic®) and 24
percent for tramadol HCL (Ultram®) over the three-year period. In a sharp contrast, the prices per pill paid
to pharmacies for the same common drugs remained stable or decreased slightly over the same period.
In Florida, prices paid to physicians increased for a number of drugs that were commonly dispensed by
physicians, including cyclobenzaprine HCL (Flexeril®), naproxen (Aleve®), cephalexin (Keflex®), and
propoxyphene-N w/APAP (Darvocet-N®). Table 4.2 shows that the price paid for cyclobenzaprine HCL
(Flexeril®) was $1.44 per pill in 2007/2008, which increased 18 percent to $1.70 per pill in 2010/2011. Over
the same period, the unit price paid to pharmacies for most common drugs remained stable or dropped. Note
that the prices paid to physicians increased in Florida, but the rate of growth appears to have been slower over
three years, compared with that in the other study states.
In South Carolina, the prices paid for hydrocodone-acetaminophen (Vicodin®) increased 50 percent
between 2007/2008 and 2010/2011, while the prices paid to pharmacies for the same drug decreased by 11
percent. Prices paid to physicians for meloxicam (Mobic®) also increased in South Carolina by 37 percent,
while the prices of the same drug when dispensed at pharmacies dropped 23 percent. Prices paid to physicians
for several other drugs also had a double-digit increase over three years, including naproxen (Aleve®).
7 The decreases in the prices paid for pharmacy-dispensed prescriptions that appear in our data might have been the result of a number of factors, including increased network penetration, network discounts, and increased use of mail order services. Our benchmark metrics do not cover these dimensions in the forthcoming third edition of WCRI’s Prescription Benchmarks—we may expand the benchmark metrics in future studies. Note that the average price per pill paid for individual drugs used in the price comparison was the price for generic versions of the drug. This measure is more appropriate to use because it ensures more comparable results and most of the drugs commonly dispensed by physicians are generics. As a result, an increased use of generic drugs over time does not explain why we see a price drop for pharmacy-dispensed prescriptions. 8 For brevity, these additional drugs are not included in Table 4.2.
33
___________________________________________________________________________________________________P H Y S I C I A N D I S P E N S I N G I N W O R K E R S ' C O M P E N S A T I O N
copyright © 2012 workers compensation research institute

2007/2008 2008/2009 2009/2010 2010/2011Percentage Change from 2007/2008 to 2010/2011
Connecticut
Hydrocodone-acetaminophen (Vicodin®)
Physician-dispensed Rx $0.93 $1.53 $1.47 $1.43 54%
Pharmacy-dispensed Rx $0.41 $0.41 $0.36 $0.37 -10%
Ibuprofen (Motrin®)
Physician-dispensed Rx $0.53 $0.58 $0.57 $0.57 8%
Pharmacy-dispensed Rx $0.34 $0.32 $0.28 $0.29 -15%
Meloxicam (Mobic®)
Physician-dispensed Rx $4.87 $5.04 $5.40 $5.25 8%
Pharmacy-dispensed Rx $2.99 $3.41 $2.00 $2.15 -28%
Tramadol HCL (Ultram®)
Physician-dispensed Rx $1.57 $1.65 $1.52 $1.55 -1%
Pharmacy-dispensed Rx $0.81 $0.78 $0.64 $0.65 -20%
Cyclobenzaprine HCL (Flexeril®)
Physician-dispensed Rx $1.48 $1.52 $1.43 $1.55 5%
Pharmacy-dispensed Rx $1.22 $1.17 $0.95 $0.98 -20%
Florida
Hydrocodone-acetaminophen (Vicodin®)
Physician-dispensed Rx $1.08 $1.11 $1.15 $1.08 0%
Pharmacy-dispensed Rx $0.49 $0.49 $0.43 $0.43 -12%
Ibuprofen (Motrin®)
Physician-dispensed Rx $0.54 $0.57 $0.57 $0.58 7%
Pharmacy-dispensed Rx $0.33 $0.33 $0.32 $0.31 -6%
Meloxicam (Mobic®)
Physician-dispensed Rx $5.27 $5.53 $5.11 $5.25 0%
Pharmacy-dispensed Rx $3.52 $3.62 $3.49 $3.38 -4%
Tramadol HCL (Ultram®)
Physician-dispensed Rx $1.42 $1.48 $1.51 $1.46 3%
Pharmacy-dispensed Rx $0.83 $0.82 $0.81 $0.84 1%
Cyclobenzaprine HCL (Flexeril®)
Physician-dispensed Rx $1.44 $1.56 $1.71 $1.70 18%
Pharmacy-dispensed Rx $1.15 $1.13 $1.09 $1.07 -7%
Georgiab
Hydrocodone-acetaminophen (Vicodin®)
Physician-dispensed Rx $0.96 $0.97 $1.11 $1.02 6%
Pharmacy-dispensed Rx $0.51 $0.51 $0.49 $0.47 -8%
Ibuprofen (Motrin®)
Physician-dispensed Rx $0.60 $0.57 $0.59 $0.62 3%
Pharmacy-dispensed Rx $0.35 $0.34 $0.32 $0.28 -20%
Meloxicam (Mobic®)
Physician-dispensed Rx $6.31 $5.35 $4.91 $4.62 -27%
Pharmacy-dispensed Rx $3.90 $3.55 $3.45 $3.28 -16%
Tramadol HCL (Ultram®)
Physician-dispensed Rx $1.66 $1.71 $1.55 $1.45 -13%
Pharmacy-dispensed Rx $0.85 $0.83 $0.82 $0.81 -5%
Cyclobenzaprine HCL (Flexeril®)
Physician-dispensed Rx $1.59 $1.48 $1.44 $1.44 -9%
Pharmacy-dispensed Rx $1.15 $1.16 $1.08 $1.04 -10%
continued
Table 4.2 Trends in Prices per Pill Paid for Physician- and Pharmacy-Dispensed Prescriptions for Selected States,a
2007/2008–2010/2011
34
___________________________________________________________________________________________________P H Y S I C I A N D I S P E N S I N G I N W O R K E R S ' C O M P E N S A T I O N
copyright © 2012 workers compensation research institute

2007/2008 2008/2009 2009/2010 2010/2011Percentage Change from 2007/2008 to 2010/2011
Illinois
Hydrocodone-acetaminophen (Vicodin®)
Physician-dispensed Rx $0.87 $1.13 $1.35 $1.44 66%
Pharmacy-dispensed Rx $0.54 $0.55 $0.53 $0.53 -2%
Ibuprofen (Motrin®)
Physician-dispensed Rx $0.56 $0.57 $0.60 $0.59 5%
Pharmacy-dispensed Rx $0.33 $0.33 $0.30 $0.27 -18%
Meloxicam (Mobic®)
Physician-dispensed Rx $4.17 $4.89 $5.97 $5.81 39%
Pharmacy-dispensed Rx $3.82 $3.77 $3.50 $2.92 -24%
Tramadol HCL (Ultram®)
Physician-dispensed Rx $1.29 $1.45 $1.57 $1.60 24%
Pharmacy-dispensed Rx $0.84 $0.84 $0.84 $0.82 -2%
Cyclobenzaprine HCL (Flexeril®)
Physician-dispensed Rx $1.41 $1.48 $1.55 $1.63 16%
Pharmacy-dispensed Rx $1.13 $1.10 $1.03 $1.03 -9%
Maryland
Hydrocodone-acetaminophen (Vicodin®)
Physician-dispensed Rx $0.83 $1.03 $1.54 $1.48 78%
Pharmacy-dispensed Rx $0.39 $0.37 $0.38 $0.36 -8%
Ibuprofen (Motrin®)
Physician-dispensed Rx $0.57 $0.60 $0.61 $0.62 9%
Pharmacy-dispensed Rx $0.29 $0.28 $0.27 $0.25 -14%
Meloxicam (Mobic®)
Physician-dispensed Rx $3.13 $3.92 $5.42 $5.02 60%
Pharmacy-dispensed Rx $2.22 $2.27 $2.09 $1.76 -21%
Tramadol HCL (Ultram®)
Physician-dispensed Rx $1.40 $1.51 $1.54 $1.52 9%
Pharmacy-dispensed Rx $0.66 $0.62 $0.63 $0.64 -3%
Cyclobenzaprine HCL (Flexeril®)
Physician-dispensed Rx $1.44 $1.52 $1.55 $1.78 24%
Pharmacy-dispensed Rx $0.93 $0.82 $0.76 $0.75 -19%
Pennsylvania
Hydrocodone-acetaminophen (Vicodin®)
Physician-dispensed Rx $0.92 $0.78 $1.09 $1.13 23%
Pharmacy-dispensed Rx $0.39 $0.37 $0.34 $0.35 -10%
Ibuprofen (Motrin®)
Physician-dispensed Rx $0.65 $0.64 $0.75 $0.82 26%
Pharmacy-dispensed Rx $0.30 $0.29 $0.27 $0.26 -13%
Meloxicam (Mobic®)
Physician-dispensed Rx – $3.41 $4.36 $4.76 –
Pharmacy-dispensed Rx $3.79 $3.70 $3.47 $3.26 -14%
Tramadol HCL (Ultram®)
Physician-dispensed Rx $1.47 $1.43 $1.61 $1.66 13%
Pharmacy-dispensed Rx $0.82 $0.80 $0.77 $0.81 -1%
Cyclobenzaprine HCL (Flexeril®)
Physician-dispensed Rx $1.46 $1.52 $1.52 $1.78 22%
Pharmacy-dispensed Rx $1.17 $1.09 $1.03 $0.97 -17%
continued
Table 4.2 Trends in Prices per Pill Paid for Physician- and Pharmacy-Dispensed Prescriptions for Selected States,a
2007/2008–2010/2011 (continued)
35
___________________________________________________________________________________________________P H Y S I C I A N D I S P E N S I N G I N W O R K E R S ' C O M P E N S A T I O N
copyright © 2012 workers compensation research institute

2007/2008 2008/2009 2009/2010 2010/2011Percentage Change from 2007/2008 to 2010/2011
South Carolinab
Hydrocodone-acetaminophen (Vicodin®)
Physician-dispensed Rx $0.80 $1.11 $1.09 $1.20 50%
Pharmacy-dispensed Rx $0.46 $0.46 $0.43 $0.41 -11%
Ibuprofen (Motrin®)
Physician-dispensed Rx $0.53 $0.61 $0.58 $0.60 13%
Pharmacy-dispensed Rx $0.35 $0.32 $0.29 $0.26 -26%
Meloxicam (Mobic®)
Physician-dispensed Rx $3.46 $4.10 $4.31 $4.74 37%
Pharmacy-dispensed Rx $3.80 $3.52 $2.91 $2.91 -23%
Tramadol HCL (Ultram®)
Physician-dispensed Rx $1.42 $1.43 $1.48 $1.52 7%
Pharmacy-dispensed Rx $0.81 $0.82 $0.83 $0.71 -12%
Cyclobenzaprine HCL (Flexeril®)
Physician-dispensed Rx $1.33 $1.43 $1.52 $1.51 14%
Pharmacy-dispensed Rx $1.16 $1.14 $0.99 $0.96 -17%
Tennesseeb
Hydrocodone-acetaminophen (Vicodin®)
Physician-dispensed Rx $1.05 $1.01 $1.06 $1.11 6%
Pharmacy-dispensed Rx $0.53 $0.53 $0.52 $0.52 -2%
Ibuprofen (Motrin®)
Physician-dispensed Rx $0.47 $0.45 $0.47 $0.56 19%
Pharmacy-dispensed Rx $0.34 $0.33 $0.32 $0.29 -15%
Meloxicam (Mobic®)
Physician-dispensed Rx $4.04 $3.79 $4.09 $4.66 15%
Pharmacy-dispensed Rx $3.62 $3.85 $3.54 $3.60 -1%
Tramadol HCL (Ultram®)
Physician-dispensed Rx $1.46 $1.55 $1.46 $1.54 5%
Pharmacy-dispensed Rx $0.85 $0.82 $0.86 $0.87 2%
Cyclobenzaprine HCL (Flexeril®)
Physician-dispensed Rx $1.33 $1.29 $1.36 $1.42 7%
Pharmacy-dispensed Rx $1.11 $1.10 $1.11 $1.11 0%
Wisconsin
Hydrocodone-acetaminophen (Vicodin®)
Physician-dispensed Rx $0.77 $0.86 $0.97 $1.14 48%
Pharmacy-dispensed Rx $0.46 $0.46 $0.42 $0.41 -11%
Ibuprofen (Motrin®)
Physician-dispensed Rx $0.44 $0.44 $0.49 $0.47 7%
Pharmacy-dispensed Rx $0.31 $0.30 $0.28 $0.27 -13%
Meloxicam (Mobic®)
Physician-dispensed Rx – – $5.60 $4.85 –
Pharmacy-dispensed Rx $3.61 $3.69 $3.74 $3.60 0%
Tramadol HCL (Ultram®)
Physician-dispensed Rx $1.17 $1.46 $1.52 $1.60 37%
Pharmacy-dispensed Rx $0.79 $0.80 $0.77 $0.90 14%
Cyclobenzaprine HCL (Flexeril®)
Physician-dispensed Rx $1.32 $1.32 $1.08 $1.33 1%
Pharmacy-dispensed Rx $1.05 $1.05 $1.01 $0.97 -8%
Key: –: not reported because the cell size is less than 30 prescriptions; Rx: prescriptions.
Notes: The underlying data include prescriptions for claims with more than seven days of lost time that had prescriptions filled and paid for by a workers' compensation payor over the defined period. 2007/2008 refers to claims with injuries occurring from October 2006 through September 2007 and prescriptions filled through March 2008; similar notation is used for other years.
b The data included are pre-reform for Georgia, South Carolina, and Tennessee, where the recent reforms were aimed at reducing the prices paid for physician-dispensed prescriptions.
a We reported the prices and percentage changes in prices paid for physician- and pharmacy-dispensed prescriptions for the states where physicians' share of drug spending grew rapidly or very rapidly (see Table 3.2).
Table 4.2 Trends in Prices per Pill Paid for Physician- and Pharmacy-Dispensed Prescriptions for Selected States,a
2007/2008–2010/2011 (continued)
36
___________________________________________________________________________________________________P H Y S I C I A N D I S P E N S I N G I N W O R K E R S ' C O M P E N S A T I O N
copyright © 2012 workers compensation research institute

In Georgia, the prices paid for physician-dispensed hydrocodone-acetaminophen (Vicodin®) increased
by 6 percent, while the prices paid to pharmacies for the same drug dropped 8 percent. A double-digit
increase in prices paid to physicians was also seen for gabapentin (Neurontin®) and tramadol-acetaminophen
(Ultracet®), while the prices paid to pharmacies for the same drugs fell over the three-year period. For a
number of common drugs dispensed by physicians in the state, it appears that the prices paid to both
pharmacies and physicians fell over the three years. However, the prices per pill paid for physician-dispensed
prescriptions were still higher than the prices paid to pharmacies for the same drug (Table 4.2).
In Connecticut, we saw large increases for several drugs that were commonly dispensed by physicians,
including hydrocodone-acetaminophen (Vicodin®), propoxyphene-N w/APAP (Darvocet-N®), and
gabapentin (Neurontin®). Table 4.2 shows that the prices paid for hydrocodone-acetaminophen (Vicodin®)
increased from $0.93 to $1.43 per pill when physicians dispensed the drug, a 54 percent increase over the
three-year period. In contrast, the unit price paid to pharmacies for the same drug decreased from $0.41 to
$0.37 per pill over the same period.
In Pennsylvania, Tennessee, Maryland, and Wisconsin, where physicians’ share of drug spending grew
rapidly, prices paid for physician-dispensed prescriptions also increased for several drugs commonly
dispensed by physicians, while prices paid to pharmacies changed little or fell. For example, the average price
per pill paid to physicians for hydrocodone-acetaminophen (Vicodin®) increased 78 percent in Maryland, 48
percent in Wisconsin, 23 percent in Pennsylvania, and 6 percent in Tennessee, while the prices paid to
pharmacies for the same drug fell by 2 to 11 percent in the four states.
copyright © 2012 workers compensation research institute37
___________________________________________________________________________________________________P H Y S I C I A N D I S P E N S I N G I N W O R K E R S ' C O M P E N S A T I O N

5
CERTAIN DRUGS PRESCRIBED ONLY WHEN PHYSICIANS DISPENSE
The price premium paid to dispensing physicians over and above what is paid to pharmacies for the same
drugs directly adds to the costs of prescriptions. It may also add indirectly to the prescription costs, because a
higher price premium may influence physician prescribing patterns such that a physician may prescribe
certain medications to the patient, based less on clinical indications and more on the profitability of the
drug.1
We found some evidence suggesting that this might be the case. As Figure 5.1 shows, in most study states,
few injured workers (less than 2 percent of claims with prescriptions) received a prescription for either
omeprazole (Prilosec®) or ranitidine HCL (Zantac®), two ulcer drugs that are commonly used for acid reflux
and are available over the counter at pharmacies. However, these two drugs were prescribed for
approximately 8–11 percent of the claims with prescriptions in Illinois, Maryland, Georgia, and Florida.
Table 5.1 shows the frequency of prescribing either of the two drugs, the prevalence of physician
dispensing, and the prices paid for physician- and pharmacy-dispensed prescriptions for each of the two
drugs.2 Included in the table are the results for all study states except California.3 The states where physician
dispensing was most common are listed on the far right of the table.
The table shows that in 2010/2011 claims, omeprazole (Prilosec®) and ranitidine HCL (Zantac®) were
rarely prescribed in most study states. However, among the states where physician dispensing was common,
especially in Florida, Georgia, Illinois, and Maryland, 8–11 percent of the injured workers were given either
omeprazole (Prilosec®) or ranitidine HCL (Zantac®) or both. In three of the four states, the average prices per
pill paid for the two drugs when dispensed by physicians were nearly twice as high as what were paid to
pharmacies for the same drug.4
It should be noted that the retail price for Prilosec OTC®, which is the same as generic omeprazole 20
1 What we found is consistent with economic theory and a large amount of empirical evidence for overutilization of medical services in the presence of self-referral. Research has found an over-prescribing of certain medications because of the financial incentive associated with physician dispensing. Studies on this topic include a study of physician dispensing in California workers’ compensation (Nehauser et al., 2006) and three studies outside workers’ compensation in Japan (Iizuka, 2007), Taiwan (Chen et al., 2011), and China (Currie, et al., 2010). 2 The price premium, reflected in the price comparison, is the amount paid to physicians for a drug that is over and above the price paid for the same drug when dispensed at pharmacies. 3 California is not included in the analysis in this chapter. For an analysis of California’s post-reform experience, please see Chapter 6. 4 Note that the prices paid to pharmacies for the same drug were higher in Illinois and Maryland than in Florida and Georgia. This is likely due to the fact that Illinois and Maryland did not have pharmacy fee schedules while Florida and Georgia tied their pharmacy fee schedules to the AWP.
38
___________________________________________________________________________________________________P H Y S I C I A N D I S P E N S I N G I N W O R K E R S ' C O M P E N S A T I O N
copyright © 2012 workers compensation research institute

mg, is about 64 cents per pill.5 Zantac® is less expensive than Prilosec®—the price for nonprescription
Zantac® is about 33–42 cents per pill, depending on strength and quantity.6
The results presented above suggest that some physician-dispensers may prescribe certain drugs because
of the extra income to be obtained from dispensing and that when not dispensing, these doctors either do not
use the medications for their patients, or suggest that the patient obtain the medication from the drug store or
grocery store without the need for a prescription. Also, in the states where these drugs were prescribed, a vast
majority of these prescriptions were dispensed by physicians, rather than dispensed at pharmacies.
Figure 5.1 Percentage of Claims with Prescriptions That Had Omeprazole (Prilosec®) or Ranitidine HCL (Zantac®), 2010/2011
Notes: The underlying data include claims with more than seven days of lost time that had prescriptions filled and paid for by a workers' compensation payor over the defined period. 2010/2011 refers to claims with injuries occurring from October 1, 2009, through September 30, 2010, and prescriptions through March 31, 2011. a Five states (Arizona, California, Georgia, South Carolina, and Tennessee) recently adopted reforms aimed at reducing the costs of physician-dispensed prescriptions (see Appendix A for more detail). The data included reflect the early post-reform results for Arizona and are pre-reform for Georgia, South Carolina, and Tennessee. California is not included in the analysis in this chapter. Lessons learned from California’s post-reform experience are discussed in Chapter 6.
b In Massachusetts, New York, and Texas, physician dispensing is not allowed in general (see Appendix A for more detail).
Key: Rx: prescriptions.
5 The price for a 42-count box of Prilosec OTC® is $26.99. Prices were retrieved on May 29, 2012, from www.walgreens.com. 6 The unit price per pill for a 30-pill bottle of Zantac® is 33 cents and for a 24-pill box of Zantac® 150 mg is about 42 cents. Prices were retrieved on May 29, 2012, from www.walgreens.com.
0%
2%
4%
6%
8%
10%
12%
IN SC TX IA NJ LA NY AR VA WI NC MA CT MI MN PA TN AZ IL MD GA FL
Per
cen
tag
e o
f Cla
ims
wit
h R
x
b bb a aaa
39
___________________________________________________________________________________________________P H Y S I C I A N D I S P E N S I N G I N W O R K E R S ' C O M P E N S A T I O N
copyright © 2012 workers compensation research institute

Measure MAb NYb TXb AR MN LA VA WI NC IA SCc NJ TNc PA IN MI CT AZc MD GAc IL FL
Likelihood of prescribing certain drugs
% of claims that had omeprazole (Prilosec®) or ranitidine HCL (Zantac®) 1% 1% <1% 1% 2% 1% 1% 1% 1% <1% <1% <1% 2% 2% <1% 2% 1% 2% 8% 11% 8% 11%
Prevalence of physician dispensing
% of all Rx that were dispensed by physicians 1% 1% 2% 4% 4% 7% 10% 11% 14% 15% 18% 18% 20% 20% 22% 24% 28% 32% 35% 36% 43% 45%
Price comparison
Prices per pill paid for omeprazole (Prilosec®) when dispensed by…
Physicians – – – – – – – – – – – – – – – – – – $5.27 $6.10 $8.08 $7.07
Pharmacies – – – – – – – – – – – – – – – – – – $4.74 $3.00 $4.49 $3.64
Walgreensa $0.64 $0.64 $0.64 $0.64
Prices per pill paid for ranitidine HCL (Zantac®) when dispensed by…
Physicians – – – – – – – – – – – – – – – – – – $3.91 $4.21 $6.88 $4.81
Pharmacies – – – – – – – – – – – – – – – – – – $3.84 $2.35 $3.63 $2.63
Walgreensa $0.42 $0.42 $0.42 $0.42
Table 5.1 Prescribing Patterns Associated with Physician Dispensing: Omeprazole (Prilosec®) and Ranitidine HCL (Zantac®), 2010/2011 a
Notes: The underlying data include prescriptions for claims with more than seven days of lost time that had prescriptions filled and paid for by a workers' compensation payor over the defined period. 2010/2011 refers to claims with injuries occurring from October 1, 2009, through September 30, 2010, and prescriptions through March 31, 2011.
Key: – : not reported because only a small percentage of claims had the drug; Rx: prescriptions.
b In Massachusetts, New York, and Texas, physician dispensing is not allowed in general (see Appendix A for more detail).
c Five states (Arizona, California, Georgia, South Carolina, and Tennessee) recently adopted reforms aimed at reducing the costs of physician-dispensed prescriptions (see Appendix A for more detail). The data included reflect the early post-reform results for Arizona and are pre-reform for Georgia, South Carolina, and Tennessee. California is not included in the analysis in this chapter. Lessons learned from California’s post-reform experience are discussed in Chapter 6.
a Prilosec OTC® acid reducer is the same as prescription Prilosec® 20 mg. The price for a 42-count box of Prilosec OTC® is $26.99. The unit price per pill for a 30-pill bottle of Zantac® is 33 cents and for a 24-pill box of Zantac® 150 mg is about 42 cents. Prices were retrieved on May 29, 2012, from www.walgreens.com.
40
___________________________________________________________________________________________________P H
Y S I C
I A N
D I S P E N
S I N G
I N W
O R K
E R S ' C O
M P E N
S A T I O
N
copyright © 2012 w
orkers compensation research institute

6
PATIENT ACCESS TO PHYSICIAN-DISPENSED
DRUGS: LESSONS FROM THE CALIFORNIA
REFORMS
When reforms are considered in various states, a common concern is that patients may no longer have access
to physician-dispensed medications if physicians are not paid a large price premium over what pharmacies
are paid for the same drug. In March 2007, California adopted reforms that equalized the prices paid to
physicians and pharmacies for the same drugs dispensed. The experience in California should be useful for
other states considering reforms.
Supporters of physician dispensing often raise two concerns about reforms that reduce the prices paid for
physician-dispensed drugs:
Patient access and outcomes would be hurt. Physicians would stop dispensing prescription drugs in
response to the large drop in the prices. If this occurs, patient compliance with medication therapy would
suffer and, therefore, the quality of care and patient outcomes would suffer.
Prescription costs would increase because physicians dispense lower price generic drugs more frequently
than pharmacies.
As a result of the California reforms, the average price per pill paid for physician-dispensed prescriptions
decreased to the same level as that for pharmacy-dispensed prescriptions (Figure 6.1).
The prices paid to dispensing physicians and pharmacies for the same drug were similar for most
common drugs after the fee schedule change in California (Table 6.1). Prior to the reforms (2006/2007), for
example, the average price per pill paid for tramadol HCL (Ultram®) was $1.33 per pill when dispensed by
physicians and $0.54 per pill when filled at a pharmacy. After the reforms (2008/2009), the prices for
tramadol HCL (Ultram®) were the same for physician- and pharmacy-dispensed prescriptions, averaging
$0.49 per pill. Similar results can be seen for most other drugs that were commonly dispensed by physicians
in California.
The 2007 fee schedule change in California nearly eliminated the use of more-expensive repackaged
drugs. Despite that, many California physicians continued to dispense prescription drugs, and often
dispensed the same drugs as they did pre-reform. The difference was that instead of using repackaged drugs,
physicians in post-reform California often dispensed the same drugs but obtained from manufacturers rather
than repackagers, at the same prices paid to pharmacies in the state. As Figure 6.2 shows, the percentage of all
prescriptions that were dispensed by physicians decreased from about 55 percent in the first quarter of 2007
41
___________________________________________________________________________________________________P H Y S I C I A N D I S P E N S I N G I N W O R K E R S ' C O M P E N S A T I O N
copyright © 2012 workers compensation research institute

(immediately prior to the reforms) to 44 percent in the first quarter of 2008 (after the reforms).1 Over the
same period of time, the percentage of all prescriptions that were for repackaged drugs decreased from 43 to
11 percent. Many physicians continued to dispense prescription drugs to their patients.2
Figure 6.1 Changes in Prices per Pill Paid for Physician- and Pharmacy-Dispensed Prescriptions: California Pre- and Post-Reform Experience, 2006–2008a
Notes: The underlying data include prescriptions filled from January 2006 to December 2008 for claims with more than seven days of lost time that had injuries occurring within two years prior to a given quarter. 2006Q1 refers to the first quarter of 2006; similar notation is used for other quarters.
a Effective March 2007, California had fee schedule changes that equalized physician- and pharmacy-dispensed prescriptions. We report the California results to provide evidence for several study states where similar changes have been made or physician dispensing has been actively debated in recent years. California's post-reform results are described and analyzed in a report by the California Workers' Compensation Institute (Swedlow and Ireland, 2009).
Key: Rx: prescriptions.
1 To assess the impact of California’s fee schedule reforms on dispensing patterns, we did a separate analysis that measured the percentage of prescriptions for physician-dispensed and repackaged drugs on a quarterly basis. This type of analysis focuses on prescriptions filled during a calendar quarter. To hold the claim maturity constant, we included claims that had injuries occurring within two years prior to a given calendar quarter. This was the same analysis we did in Prescription Benchmarks for Florida, 2nd Edition (Wang and Liu, 2011b). Note that the estimated physician share of prescriptions for the same calendar quarter in this current study was higher than reported in the 2011 study, especially for the later quarters of the analysis period. The difference was largely due to several improvements made to the pharmacy data, including more complete data from the most recent data submission and improved mapping of dispensing points, which remapped prescriptions billed by occupational rehabilitation centers and other physician groups to physician-dispensed prescriptions. 2 Those physicians who continued to dispense and dispensed non-repackaged drugs may likely be affiliated with physician groups, multispecialty clinics, or occupational rehabilitation centers which may have an onsite pharmacy. The physician-dispensed prescriptions we identified include prescriptions filled with repackaged drugs and the drugs that were identified as being dispensed by physicians in their offices (including the offices of independent practitioners, occupational rehabilitation centers, and multispecialty clinics). See Chapter 2 for a more detailed description of our definition of physician-dispensed prescriptions and how we identified them in the data.
$0.00
$0.20
$0.40
$0.60
$0.80
$1.00
$1.20
$1.40
$1.60
$1.80
2006Q1 2006Q2 2006Q3 2006Q4 2007Q1 2007Q2 2007Q3 2007Q4 2008Q1 2008Q2 2008Q3 2008Q4
Pri
ces
per
Pill
Pai
d
Physician-dispensed Rx Pharmacy-dispensed Rx
42
___________________________________________________________________________________________________P H Y S I C I A N D I S P E N S I N G I N W O R K E R S ' C O M P E N S A T I O N
copyright © 2012 workers compensation research institute

Table 6.1 Changes in Prices per Pill Paid to Physicians and Pharmacies for Top Five Common Drugs: California Pre- and Post-Reform Experience, 2006/2007 and 2008/2009a
Average Price per Pill Paid
MDRx PDRx
Percentage of Prices Paid for MDRx above
PDRx
Hydrocodone-acetaminophen (Vicodin®)
Pre-reform 2006/2007 $0.85 $0.43 98%
Post-reform 2008/2009 $0.52 $0.48 8%
Ibuprofen (Motrin®)
Pre-reform 2006/2007 $0.59 $0.23 157%
Post-reform 2008/2009 $0.28 $0.22 27%
Meloxicam (Mobic®)
Pre-reform 2006/2007 $3.87 $2.07 87%
Post-reform 2008/2009 $0.88 $0.83 6%
Tramadol HCL (Ultram®)
Pre-reform 2006/2007 $1.33 $0.54 146%
Post-reform 2008/2009 $0.49 $0.49 0%
Cyclobenzaprine HCL (Flexeril®)
Pre-reform 2006/2007 $1.43 $0.64 123%
Post-reform 2008/2009 $0.52 $0.54 -4%
Notes: The underlying data include prescriptions for claims with more than seven days of lost time that had prescriptions filled and paid for by a workers' compensation payor over the defined period. 2008/2009 refers to claims with injuries occurring from October 1, 2007, through September 30, 2008, and prescriptions filled through March 31, 2009; similar notation is used for other years. a Effective March 2007, California had fee schedule changes that equalized physician- and pharmacy-dispensed prescriptions. We report the California results to provide evidence for several study states where similar changes have been made or physician dispensing has been actively debated in recent years. The post-reform results are described and analyzed in a report by the California Workers' Compensation Institute (Swedlow and Ireland, 2009).
Key: MDRx: physician-dispensed prescriptions; PDRx: pharmacy-dispensed prescriptions; Rx: prescriptions.
43
___________________________________________________________________________________________________P H Y S I C I A N D I S P E N S I N G I N W O R K E R S ' C O M P E N S A T I O N
copyright © 2012 workers compensation research institute

Figure 6.2 Changes in Physician Dispensing Patterns: California Pre- and Post-Reform Experience, 2006–2008a
Notes: The underlying data include prescriptions filled from January 2006 to December 2008 for claims with more than seven days of lost time that had injuries occurring within two years prior to a given quarter. 2006Q1 refers to the first quarter of 2006; similar notation is used for other quarters.
a Effective March 2007, California had fee schedule changes that equalized physician- and pharmacy-dispensed prescriptions. We report the California results to provide evidence for several study states where similar changes have been made or physician dispensing has been actively debated in recent years. California's post-reform results are described and analyzed in a report by the California Workers' Compensation Institute (Swedlow and Ireland, 2009).
Key: Rx: prescriptions.
We did see that prescribing practices might have changed for several drugs that were more commonly
prescribed in states where physician dispensing was common, but prescribed less often in states where
physician dispensing was less common. One such drug is carisoprodol (Soma®), a muscle relaxant often used
to treat muscle spasms caused by an injury or other muscle problems. As Table 6.2 shows, 19 percent of
California injured workers with prescriptions received carisoprodol (Soma®) in 2006/2007. After the
reimbursement rates were reduced from an average of $3.16 to $0.66 per pill, we found the drug was
prescribed to 13 percent of patients in 2008/2009. It is worth noting that the use of carisoprodol (Soma®) is
controversial. Although it is a potent muscle relaxant and relatively inexpensive, the side effects of the drug
and its potential for drug abuse and dependence raised concerns about inappropriate utilization leading to
potential mental and physical impairment, even fatal overdose. Because of these drug safety concerns, this
drug has been excluded from the formularies adopted by workers’ compensation agencies in Texas and
Washington State.
0%
10%
20%
30%
40%
50%
60%
70%
80%
2006Q1 2006Q2 2006Q3 2006Q4 2007Q1 2007Q2 2007Q3 2007Q4 2008Q1 2008Q2 2008Q3 2008Q4
Per
cen
tag
e o
f All
Rx
That
Wer
e ...
Physician-dispensed repackaged Rx Physician-dispensed non-repackaged Rx
44
___________________________________________________________________________________________________P H Y S I C I A N D I S P E N S I N G I N W O R K E R S ' C O M P E N S A T I O N
copyright © 2012 workers compensation research institute

Table 6.2 Changes in Prescribing Patterns for Carisoprodol (Soma®): California Pre- and Post- Reform Experience, 2006/2007 and 2008/2009a
Pre-Reform 2006/2007
Post-Reform 2008/2009
Percentage (point) Change
% of claims with Rx that had carisoprodol (Soma®) 19% 13% -6
% of claims with Rx that had carisoprodol (Soma®) dispensed by physicians 17% 9% -8
Prevalence of physician dispensing/repackaging
% of all Rx that were physician-dispensed Rx 64% 53% -11
% of all Rx that were for repackaged drugsb 60% 11% -49
Prices for MDRx and PDRx
Average price per pill paid for carisoprodol (Soma®) when dispensed by…
Physicians $3.16 $0.66 -79%
Pharmacies $0.55 $0.63 15%
Notes: The underlying data include prescriptions for claims with more than seven days of lost time that had prescriptions filled and paid for by a workers' compensation payor over the defined period. 2008/2009 refers to claims with injuries occurring from October 1, 2007, through September 30, 2008, and prescriptions filled through March 31, 2009; similar notation is used for other years. a Effective March 2007, California had fee schedule changes that equalized physician- and pharmacy-dispensed prescriptions. We report the California results to provide evidence for several study states where similar changes have been made or physician dispensing has been actively debated in recent years. California’s post-reform results are described and analyzed in a report by the California Workers' Compensation Institute (Swedlow and Ireland, 2009).
b By our definition, repackaged drugs are classified as physician dispensed. See Chapter 2 for more details.
Key: MDRx: physician-dispensed prescriptions; PDRx: pharmacy-dispensed prescriptions; Rx: prescriptions.
We also saw changes in the prescribing patterns of two drugs—omeprazole (Prilosec®) and ranitidine
HCL (Zantac®), both of which are indicated for acid reflux and may be used to protect against gastric
irritation or erosion from taking NSAIDs.3 However, the prices paid for the two drugs were different—
omeprazole (Prilosec®) was more expensive than ranitidine HCL (Zantac®), but the price premium for
ranitidine HCL was much higher when dispensed by physicians prior to the 2007 fee schedule changes in
California (Table 6.3). It appears that the combined frequency of prescribing and dispensing the two drugs
changed little, but omeprazole (Prilosec®) was used more often to substitute for ranitidine HCL (Zantac®).
Table 6.3 shows the substitution that occurred before and after the 2007 reforms that equalized prices
paid for physician- and pharmacy-dispensed prescriptions in California. As Table 6.3 shows, the percentage
of claims that received prescriptions for ranitidine HCL (Zantac®) decreased from 12 to 3 percent while
omeprazole (Prilosec®) increased from 2 to 14 percent. The average price paid for ranitidine HCL (Zantac®)
was $3.08 per pill when dispensed by physicians before the 2007 fee schedule change, which dropped to $1.02
per pill after the fee schedule change. Omeprazole (Prilosec®) was more expensive than ranitidine HCL
(Zantac®)—$3.15 per pill for Prilosec® and $1.02 per pill for Zantac® when physician-dispensed post-reform.
3 According to two physicians who reviewed a draft of the report, there is medical evidence that omeprazole (Prilosec®) is somewhat more effective than ranitidine HCL (Zantac®) in treating the ulcer disease that results from taking NSAIDs. This might help to explain why physicians used omeprazole (Prilosec®) more often after the 2007 fee schedule changes.
45
___________________________________________________________________________________________________P H Y S I C I A N D I S P E N S I N G I N W O R K E R S ' C O M P E N S A T I O N
copyright © 2012 workers compensation research institute

However, the price reduction post-reform for omeprazole (Prilosec®) was smaller than that for ranitidine
HCL (Zantac®), as shown in Table 6.3. Also note that both drugs were available at much lower costs at
pharmacies without prescriptions.4
Table 6.3 Changes in Prescribing Patterns for Ranitidine HCL (Zantac®) and Omeprazole (Prilosec®): California Pre- and Post-Reform Experience, 2006/2007 and 2008/2009a
Pre-Reform 2006/2007
Post-Reform 2008/2009
Percentage (point) Change
% of claims with Rx that had the drug…
Omeprazole (Prilosec®) 2% 14% 12
Ranitidine HCL (Zantac®) 12% 3% -9
% of claims with Rx that had the drug dispensed by physicians…
Omeprazole (Prilosec®) 1% 12% 11
Ranitidine HCL (Zantac®) 12% 2% -10
Prevalence of physician dispensing/repackaging
% of all Rx that were physician-dispensed Rx 64% 53% -11
% of all Rx that were for repackaged drugsb 60% 11% -49
Prices for MDRx and PDRx
Average price per pill paid for MDRx
Omeprazole (Prilosec®) $4.28 $3.15 -26%
Ranitidine HCL (Zantac®) $3.08 $1.02 -67%
Average price per pill paid for PDRx
Omeprazole (Prilosec®) $3.60 $3.44 -4%
Ranitidine HCL (Zantac®) $0.53 $0.50 -6%
Notes: The underlying data include prescriptions for claims with more than seven days of lost time that had prescriptions filled and paid for by a workers' compensation payor over the defined period. 2008/2009 refers to claims with injuries occurring from October 1, 2007, through September 30, 2008, and prescriptions filled through March 31, 2009; similar notation is used for other years. a Effective March 2007, California had fee schedule changes that equalized physician- and pharmacy-dispensed prescriptions. We report the California results to provide evidence for several study states where similar changes have been made or physician dispensing has been actively debated in recent years. California’s post-reform results are described and analyzed in a report by the California Workers' Compensation Institute (Swedlow and Ireland, 2009).
b By our definition, repackaged drugs are classified as physician dispensed. See Chapter 2 for more details.
Key: MDRx: physician-dispensed prescriptions; PDRx: pharmacy-dispensed prescriptions; Rx: prescriptions.
Would patient compliance with medication therapy suffer if some physicians stop dispensing? Some
supporters of physician dispensing argue that an injured worker may not fill the prescription if he or she has
to go to a pharmacy instead of conveniently getting the pills at the physician’s office. As previously described,
many physicians continued to dispense prescriptions in California after the fee schedule change. The results
4 See Chapter 5 for prices available for the two drugs at www.walgreens.com.
46
___________________________________________________________________________________________________P H Y S I C I A N D I S P E N S I N G I N W O R K E R S ' C O M P E N S A T I O N
copyright © 2012 workers compensation research institute

did suggest that some physicians may stop dispensing in response to a large price reduction. The patients of
those physicians would have to go to a pharmacy to fill a prescription. However, after looking at the distance
to pharmacies that were willing to fill workers’ compensation prescriptions from the homes of injured
workers and from the offices of the physicians visited, Neuhauser and his colleagues found no evidence that
the 2007 fee schedule change in California would be likely to compromise workers’ access to needed
medicine—most injured workers had convenient access to pharmacies willing to fill workers’ compensation
prescriptions (Neuhauser et al., 2006).5
It is also worth noting that 65–76 percent of all prescriptions were for pain medications, depending on
the state (Wang and Liu, 2011a). The problems of noncompliance are clear for maintenance drugs, such as
drugs for hypertension or high cholesterol. It is less clear what sort of compliance problems may arise with
pain medications among injured workers.6
The second concern often expressed by supporters of physician dispensing is that prescription costs
would increase because physicians dispense generic drugs more often than pharmacies. In raising this
concern, these advocates sometimes cite WCRI studies in a way which unfortunately reflects a
misunderstanding of what the data show.
Tables 6.4 and 6.5 present additional data, from California pre- and post-reform experience, that help
clarify the issues related to this concern. Table 6.4 shows that for specific drugs commonly dispensed by
physicians in pre-reform California, physicians and pharmacies dispense generics equally often, except for
tramadol HCL (Ultram®). Among these common drugs, the prices per pill paid to physicians for a specific
drug were approximately 100–500 percent higher than what were paid to pharmacies for the same drug
(Table 6.4). After the 2007 fee schedule change, physicians’ share of prescriptions for each of the same drugs
decreased in California, but little change was seen in the percentage of generics between physician- and
pharmacy-dispensed prescriptions. At the same time, the prices paid per pill for the same drug when
dispensed by physicians were similar to what was paid to pharmacies (Table 6.5).
Overall, for specific drugs that are commonly dispensed by physicians, physicians and pharmacies
dispense generics equally often. However, physicians rarely dispense drugs that are only available as brand
names, which are more often dispensed by pharmacies. California’s pre- and post-reform experience suggests
that if some physicians stop dispensing prescription drugs in response to a large price reduction, pharmacies
would dispense the same prescriptions at a lower price than if the same drug were dispensed by a physician,
resulting in a decrease in prescription costs.
5 The authors found that in 2004, the average worker lived within 1.2 miles of a pharmacy. If workers needed to go to a pharmacy from their physicians’ offices, they could travel less than 1 mile to a pharmacy willing to fill workers’ compensation prescriptions. 6 According to one expert who reviewed a draft of the report, there are few studies that provide medical evidence supporting the notion that physician dispensing of prescription drugs helps improve the compliance of medication therapy, especially for the medications used for palliative care.
47
___________________________________________________________________________________________________P H Y S I C I A N D I S P E N S I N G I N W O R K E R S ' C O M P E N S A T I O N
copyright © 2012 workers compensation research institute

Table 6.4 Percentage of Generics Dispensed by and Prices Paid to Physicians and Pharmacies in Pre- Reform California, 2006/2007
Percentage of Rx for Generic Rx
Average Price per Pill Paid for Generic Rx Top 10 Drugs Commonly Dispensed by
Physicians in California (73% of all MDRx in 2006/2007)
Percentage of All MDRx
That Were for the Drug MDRx PDRx MDRx PDRx Percentage
Difference
Hydrocodone-acetaminophen (Vicodin®) 16% 100% 100% $0.85 $0.43 98%
Ibuprofen (Motrin®) 16% 100% 100% $0.59 $0.23 157%
Naproxen (Aleve®) 10% 99% 100% $1.76 $0.56 214%
Carisoprodol (Soma®) 8% 100% 100% $3.16 $0.55 475%
Ranitidine HCL (Zantac®) 6% 100% 100% $3.08 $0.53 481%
Propoxyphene-N w/APAP (Darvocet-N®) 5% 99% 99% $1.05 $0.44 139%
Cyclobenzaprine HCL (Flexeril®) 5% 97% 95% $1.43 $0.64 123%
Tramadol HCL (Ultram®) 4% 98% 88% $1.33 $0.54 146%
Cephalexin (Keflex®) 2% 100% 100% $2.74 $0.79 247%
Etodolac (Lodine®) 2% 99% 100% $1.91 $0.96 99%
Notes: The underlying data include claims with more than seven days of lost time that had prescriptions filled over the defined period. 2006/2007 refers to claims with injuries occurring from October 1, 2005, through September 30, 2006, and prescriptions filled through March 31, 2007.
Key: MDRx: physician-dispensed prescriptions; PDRx: pharmacy-dispensed prescriptions; Rx: prescriptions.
Table 6.5 Physicians' Share of Prescriptions in Pre- and Post-Reform California and Percentage of Generics Dispensed by and Prices Paid to Physicians and Pharmacies in Post-Reform California
Percentage of Rx for the Drug That Were MDRx
Percentage of Rx for Generic Rx
Average Price per Pill Paid for Generic Rx Top 10 Drugs Commonly Dispensed
by Physicians in California (46% of all MDRx in 2008/2009) 2006/2007 2008/2009 MDRx PDRx MDRx PDRx Percentage
Difference
Hydrocodone-acetaminophen (Vicodin®) 55% 36% 99% 100% $0.52 $0.48 8%
Ibuprofen (Motrin®) 83% 53% 99% 100% $0.28 $0.22 27%
Naproxen (Aleve®) 88% 59% 99% 100% $0.69 $0.54 28%
Carisoprodol (Soma®) 83% 54% 100% 94% $0.66 $0.50 32%
Ranitidine HCL (Zantac®) 95% 69% 100% 100% n/a $0.50 n/a
Propoxyphene-N w/APAP (Darvocet-N®) 75% 50% 99% 100% $0.40 $0.41 -2%
Cyclobenzaprine HCL (Flexeril®) 77% 51% 88% 85% $0.52 $0.54 -4%
Tramadol HCL (Ultram®) 74% 53% 99% 79% $0.49 $0.49 0%
Cephalexin (Keflex®) 68% 35% 99% 97% $0.82 $0.80 2%
Etodolac (Lodine®) 87% 77% 99% 100% $1.00 $0.86 16%
Notes: The underlying data include claims with more than seven days of lost time that had prescriptions filled over the defined period. 2006/2007 refers to claims with injuries occurring from October 1, 2005, through September 30, 2006, and prescriptions filled through March 31, 2007; similar notation is used for other years.
Key: MDRx: physician-dispensed prescriptions; n/a: not applicable (less than 1 percent of MDRx); PDRx: pharmacy-dispensed prescriptions; Rx: prescriptions.
48
___________________________________________________________________________________________________P H Y S I C I A N D I S P E N S I N G I N W O R K E R S ' C O M P E N S A T I O N
copyright © 2012 workers compensation research institute

APPENDIX A:
STATE POLICIES ON PHARMACY FEE SCHEDULES
AND PHYSICIAN DISPENSING
Table A.1 provides a summary of state policies regarding pharmacy fee schedules and physician dispensing.
The information is provided to help the readers when they interpret the results reported. Several sources were
used to update the summary, including
information about the state laws, regulations, and policies documented in two previous WCRI reports
(Victor and Petrova, 2006a and 2006b) and the Medical Cost Containment Inventory (WCRI, 2011);
information on public policies and recent developments shared by two pharmacy benefit management
organizations—PMSI and Progressive Medical, Inc.; and
information collected, by WCRI staff, through numerous phone calls to state agencies, emails exchanged
with a number of system participants who are knowledgeable about pharmacy fee schedules, and internet
searches of online documents.
As of June 2012, 3 of the 23 study states (Massachusetts, New York, and Texas) prohibit physicians from
dispensing prescription drugs by law. For each of the three states, there are certain exceptions to the
prohibition law. In Massachusetts, physicians may dispense drugs only when necessary for the immediate and
proper treatment of the patient until it is possible for the patient to have a prescription filled at a pharmacy.1
Physicians in New York may dispense up to a 72-hour supply of prescription drugs in a number of restricted
circumstances, including dispensing drugs in a medical emergency, in an office which is situated 10 miles or
more from a registered pharmacy, or at no charge to their patients.2 In Texas, physicians are allowed to
dispense prescription drugs in rural counties in the state.3
Several states permit physician dispensing, but in some states, such as Arkansas and Minnesota, state
medical practices appear to be restrictive. In Arkansas, physicians are permitted to dispense prescription
drugs, but physician-dispensed drugs are subject to the same fee schedule as pharmacy-dispensed drugs.
According to the pharmacy fee schedule, dispensing physicians (as well as pharmacists) are required to report
the purchasing price for the drug dispensed, and physicians do not receive dispensing fees for drugs dispensed
in their offices. Moreover, under the Arkansas Medical Practices Act, no physicians licensed in the state shall
dispense narcotic drugs without prior approval by the Arkansas State Medical Board after application to the
board and on the showing of need. Minnesota permits physician dispensing, but the state Board of Medical
Practice requires physicians who dispense medications to register with the Board. In addition, physicians are 1 See the Massachusetts Administration of the Government, Title XV, Chapter 94C, Section 9 for more details. 2 See the New York Education Law Article 137, Section 6807(2) for more details. 3 A rural area is defined as an area in which there is no pharmacy within a 15-mile radius of the physician’s office and which is within either a county with a total population of 5,000 or less or a city or town with a population of less than 2,500, according to the most recent federal census (see Texas Administrative Code, Title 22, part 9 for more details).
49
___________________________________________________________________________________________________P H Y S I C I A N D I S P E N S I N G I N W O R K E R S ' C O M P E N S A T I O N
copyright © 2012 workers compensation research institute

required to disclose to patients that the physician profits from dispensing the drug and that the patient has
the option of obtaining the drug elsewhere.
Louisiana limits physician dispensing of narcotics to a 48-hour supply, but physicians are permitted to
dispense non-narcotic drugs. In Florida, physicians are prohibited from dispensing Schedule II and Schedule
III narcotics.
Five states (Arizona, California, Georgia, South Carolina, and Tennessee) allow physician dispensing but
have adopted reforms aimed at limiting price markups for physician-dispensed prescriptions.4 For the rest of
the states, state policies are either permissive or silent regarding physician dispensing.
It is worth noting that several states in this group had frequent physician dispensing and experienced
large growth of physician dispensing over the study period. In Florida, physician dispensing of prescription
drugs other than Schedule II and III narcotics has been actively debated during the legislative sessions of the
past few years, but the state policy remains silent on physician dispensing. In Maryland, a change in
reimbursement for physician-dispensed prescriptions was proposed, but no changes have been made to
address issues of physician dispensing.
4 The fee schedule changes related to physician dispensing in Tennessee were delayed from June 2012 to August 2012. The delay only affected the effective date, not the substance of the fee schedule changes.
50
___________________________________________________________________________________________________P H Y S I C I A N D I S P E N S I N G I N W O R K E R S ' C O M P E N S A T I O N
copyright © 2012 workers compensation research institute

Maximum Rates Set Using
Formulaic Fee Schedule
Reimbursement for
Brand Name Drugsa
Reimbursement for
Generic Drugsa
Physician Dispensing Licensing Requirements and Restrictions
Workers' Compensation Fee Schedule for
Repackaged/Physician-Dispensed Drugs
Arkansas Yes Lesser of AWP or provider's usual charge,
$5.13
Lesser of AWP or provider's usual charge,
$5.13
Limitedb License for dispensing required, only for 72-hour
supply for emergency
No dispensing fee for doctors
Arizona Reimbursements for physician-dispensed Rx
(September 2009)
Yes AWP - 5%, $7.00 AWP - 15%, $7.00 Allowed License for dispensing required
Reimbursements set to AWP of underlying NDC, effective
October 2009c
California Reimbursements for physician-dispensed Rx
(March 2007)
Yes AWP - 17%, $7.25 Lesser of AWP - 17% or CA-MAC or FUL, $7.25
Allowed No license required Reimbursements set to Medicaid level using
underlying NDC, effective
March 2007d
Connecticut Yes AWP, $5.00 AWP, $8.00 Silent License for dispensing required for controlled substances; no license
required in general
Silent
Florida Prohibition of physician dispensing of Schedule II
and III narcotics (2011)
Yes AWP, $4.18 AWP, $4.18 Prohibited for Schedule II and III narcotics, effective
2011; silent for other prescription drugs
License for dispensing required
Silente
Georgia Reimbursements for physician-dispensed Rx
(April 2011)
Yes AWP, $4.06 AWP, $6.08 Allowed No license required (state law allows physicians to dispense after notifying the GA Composite Medical
Board in writing of their intent as a dispensing
physician)
Reimbursements set to AWP of underlying NDC, effective
April 2011f
Illinois Reimbursements for physician-dispensed Rx
(2011)
No Provider's U&C Provider's U&C Allowed Not available Reimbursements set to AWP plus $4.18 dispensing fee,
effective June 2011g
Indiana No Provider's U&C Provider's U&C Silent License for dispensing required; physician
assistant cannot dispense
Silent
Iowa No Provider's U&C Provider's U&C Silent License for dispensing required
Silent
Louisiana Yes AWP + 10%, $5.77 AWP + 40%, $5.77 Allowed for non-narcotic drugs; limited for
narcotics to 48-hour supply
License for dispensing required
Silenth
Maryland No Provider's U&C Provider's U&C Permitted License for dispensing required
Silenti
continued
Table A.1 Summary of State Policies on Fee Schedules for Physician- and Pharmacy-Dispensed Prescription Drugs
Workers' Compensation Pharmacy Fee Schedule Physician Dispensing of Prescription DrugsMajor Changes Since 2007
State
51
___________________________________________________________________________________________________P H
Y S I C
I A N
D I S P E N
S I N G
I N W
O R K
E R S ' C O
M P E N
S A T I O
N
copyright © 2012 w
orkers compensation research institute

Maximum Rates Set Using
Formulaic Fee Schedule
Reimbursement for
Brand Name Drugsa
Reimbursement for
Generic Drugsa
Physician Dispensing Licensing Requirements and Restrictions
Workers' Compensation Fee Schedule for
Repackaged/Physician-Dispensed Drugs
Massachusetts Yes WAC + 5%, $3.00j
FUL, $3.00j Prohibited in generalk n/a n/a
Michigan Yes AWP - 10%, $3.50 AWP - 10%, $5.50 Permitted License for dispensing controlled substances
required
Reimbursement set to AWP - 10%, plus a
dispensing feel
Minnesota Yes Bi-furcatedPaper: AWP, $5.14
Electronic: AWP - 12%, $5.14
Bi-furcatedPaper: AWP, $5.14
Electronic: Lesser of AWP - 12% or MAC,
$3.65
Limitedm No license required Not available
New Jersey No Provider's U&C Provider's U&C Limited to only 7-day supply, with rural
exceptions
No license required Not available
New York Pharmacy fee schedule (2008)
Yes AWP - 12%, $4.00 AWP - 20%, $5.00 Prohibited in generalk n/a Reimbursements set to AWP of underlying NDC
North Carolina No Provider's U&C Provider's U&C Permitted License for dispensing required
Not available
Pennsylvania Yes AWP + 10%n AWP + 10%n Permitted No license required Reimbursements limited to
AWP + 10%o
South Carolina Reimbursements for physician-dispensed Rx
(2011)
Yes AWP, $5.00 AWP, $5.00 Allowed License for dispensing required
Reimbursements set to AWP of underlying NDC, with no
dispensing fee, effective
December 2011p
Tennessee Reimbursements for physician-dispensed Rx
(2012)
Yes AWP, $5.10 AWP, $5.10 Permitted No license required Reimbursement set to AWP of underlying NDC, effective
August 2012q
Texas Yes AWP + 9%, $4.00 AWP + 25%, $4.00 Prohibited in generalk n/a n/a
Virginia No Provider's U&C Provider's U&C Permittedr License for dispensing required, inspection of
location required
Not available
Wisconsin Yes AWP, $3.00 AWP, $3.00 Permitted No license required Not available
continued
a The data presented are the reimbursement rate, plus a dispensing fee.
Physician Dispensing of Prescription Drugs
Note: Policies are current as of June 2012. Indicated in the major changes column are policy changes that have been made since 2007, affecting reimbursements for pharmacy- and physician-dispensed prescriptions. Web site addresses are valid as of June 20, 2012.
b In Arkansas, physicians are permitted to dispense prescription drugs, but physician-dispensed drugs are subject to the same fee schedule as pharmacies in the state, which requires reporting the purchasing price for the drug dispensed. No dispensing fees are paid for physician-dispensed prescriptions. Moreover, under the Arkansas Medical Practices Act, no physicians licensed shall dispense narcotic drugs without prior approval by the Arkansas State Medical Board after application to the board and on the showing of need.
Workers' Compensation Pharmacy Fee Schedule
Table A.1 Summary of State Policies on Fee Schedules for Physician- and Pharmacy-Dispensed Prescription Drugs (continued)
State Major Changes Since 2007
52
___________________________________________________________________________________________________P H
Y S I C
I A N
D I S P E N
S I N G
I N W
O R K
E R S ' C O
M P E N
S A T I O
N
copyright © 2012 w
orkers compensation research institute
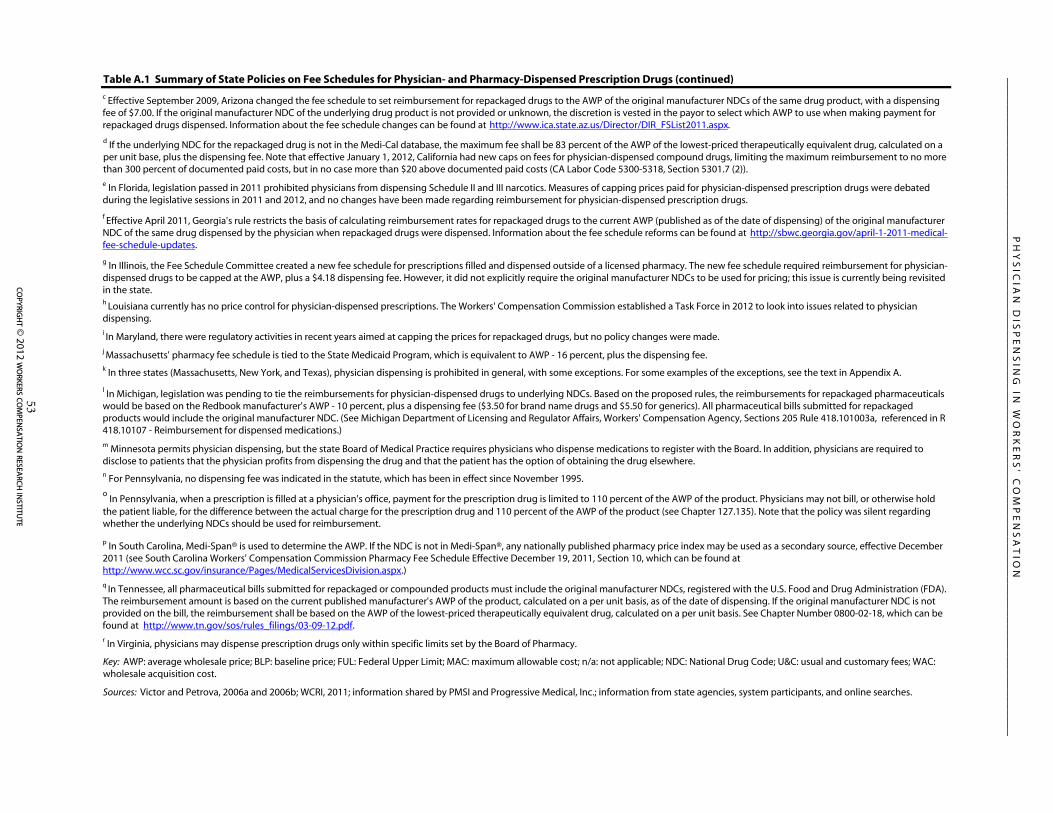
Table A.1 Summary of State Policies on Fee Schedules for Physician- and Pharmacy-Dispensed Prescription Drugs (continued)
Key: AWP: average wholesale price; BLP: baseline price; FUL: Federal Upper Limit; MAC: maximum allowable cost; n/a: not applicable; NDC: National Drug Code; U&C: usual and customary fees; WAC: wholesale acquisition cost.
Sources: Victor and Petrova, 2006a and 2006b; WCRI, 2011; information shared by PMSI and Progressive Medical, Inc.; information from state agencies, system participants, and online searches.
r In Virginia, physicians may dispense prescription drugs only within specific limits set by the Board of Pharmacy.
o In Pennsylvania, when a prescription is filled at a physician's office, payment for the prescription drug is limited to 110 percent of the AWP of the product. Physicians may not bill, or otherwise hold
the patient liable, for the difference between the actual charge for the prescription drug and 110 percent of the AWP of the product (see Chapter 127.135). Note that the policy was silent regarding whether the underlying NDCs should be used for reimbursement.
p In South Carolina, Medi-Span® is used to determine the AWP. If the NDC is not in Medi-Span®, any nationally published pharmacy price index may be used as a secondary source, effective December 2011 (see South Carolina Workers' Compensation Commission Pharmacy Fee Schedule Effective December 19, 2011, Section 10, which can be found at http://www.wcc.sc.gov/insurance/Pages/MedicalServicesDivision.aspx.)q In Tennessee, all pharmaceutical bills submitted for repackaged or compounded products must include the original manufacturer NDCs, registered with the U.S. Food and Drug Administration (FDA). The reimbursement amount is based on the current published manufacturer's AWP of the product, calculated on a per unit basis, as of the date of dispensing. If the original manufacturer NDC is not provided on the bill, the reimbursement shall be based on the AWP of the lowest-priced therapeutically equivalent drug, calculated on a per unit basis. See Chapter Number 0800-02-18, which can be found at http://www.tn.gov/sos/rules_filings/03-09-12.pdf.
n For Pennsylvania, no dispensing fee was indicated in the statute, which has been in effect since November 1995.
l In Michigan, legislation was pending to tie the reimbursements for physician-dispensed drugs to underlying NDCs. Based on the proposed rules, the reimbursements for repackaged pharmaceuticals would be based on the Redbook manufacturer's AWP - 10 percent, plus a dispensing fee ($3.50 for brand name drugs and $5.50 for generics). All pharmaceutical bills submitted for repackaged products would include the original manufacturer NDC. (See Michigan Department of Licensing and Regulator Affairs, Workers' Compensation Agency, Sections 205 Rule 418.101003a, referenced in R 418.10107 - Reimbursement for dispensed medications.)
i In Maryland, there were regulatory activities in recent years aimed at capping the prices for repackaged drugs, but no policy changes were made.
h Louisiana currently has no price control for physician-dispensed prescriptions. The Workers' Compensation Commission established a Task Force in 2012 to look into issues related to physician dispensing.
e In Florida, legislation passed in 2011 prohibited physicians from dispensing Schedule II and III narcotics. Measures of capping prices paid for physician-dispensed prescription drugs were debated during the legislative sessions in 2011 and 2012, and no changes have been made regarding reimbursement for physician-dispensed prescription drugs.
f Effective April 2011, Georgia's rule restricts the basis of calculating reimbursement rates for repackaged drugs to the current AWP (published as of the date of dispensing) of the original manufacturer NDC of the same drug dispensed by the physician when repackaged drugs were dispensed. Information about the fee schedule reforms can be found at http://sbwc.georgia.gov/april-1-2011-medical-fee-schedule-updates.
c Effective September 2009, Arizona changed the fee schedule to set reimbursement for repackaged drugs to the AWP of the original manufacturer NDCs of the same drug product, with a dispensing fee of $7.00. If the original manufacturer NDC of the underlying drug product is not provided or unknown, the discretion is vested in the payor to select which AWP to use when making payment for repackaged drugs dispensed. Information about the fee schedule changes can be found at http://www.ica.state.az.us/Director/DIR_FSList2011.aspx.
m Minnesota permits physician dispensing, but the state Board of Medical Practice requires physicians who dispense medications to register with the Board. In addition, physicians are required to disclose to patients that the physician profits from dispensing the drug and that the patient has the option of obtaining the drug elsewhere.
k In three states (Massachusetts, New York, and Texas), physician dispensing is prohibited in general, with some exceptions. For some examples of the exceptions, see the text in Appendix A.
g In Illinois, the Fee Schedule Committee created a new fee schedule for prescriptions filled and dispensed outside of a licensed pharmacy. The new fee schedule required reimbursement for physician-dispensed drugs to be capped at the AWP, plus a $4.18 dispensing fee. However, it did not explicitly require the original manufacturer NDCs to be used for pricing; this issue is currently being revisited in the state.
j Massachusetts' pharmacy fee schedule is tied to the State Medicaid Program, which is equivalent to AWP - 16 percent, plus the dispensing fee.
d If the underlying NDC for the repackaged drug is not in the Medi-Cal database, the maximum fee shall be 83 percent of the AWP of the lowest-priced therapeutically equivalent drug, calculated on a per unit base, plus the dispensing fee. Note that effective January 1, 2012, California had new caps on fees for physician-dispensed compound drugs, limiting the maximum reimbursement to no more than 300 percent of documented paid costs, but in no case more than $20 above documented paid costs (CA Labor Code 5300-5318, Section 5301.7 (2)).
53
___________________________________________________________________________________________________P H
Y S I C
I A N
D I S P E N
S I N G
I N W
O R K
E R S ' C O
M P E N
S A T I O
N
copyright © 2012 w
orkers compensation research institute

APPENDIX B:
POTENTIAL IMPACT OF DIFFERENT QUANTITY
AND STRENGTH ON PRICE COMPARISONS
In Chapter 2, we discussed the method used for comparing the prices per pill paid for physician- and
pharmacy-dispensed prescriptions. One concern was that the difference in the strength and the quantity per
prescription between physician- and pharmacy-dispensed prescriptions in a state might affect the result of
price comparisons. We address this issue and provide test results in this appendix.
When comparing the prices paid for physician- and pharmacy-dispensed prescriptions, we used the
average price per pill paid for a specific drug and focused on comparing the prices paid for the generic drugs
that were most commonly dispensed by physicians.
The price per pill paid for a generic drug has an obvious advantage over the price per prescription
because it takes into account the difference in the number of pills per prescription and the difference in
price between brand names and generics. However, the same measure may still reflect price differentials in
the strength and per-packet quantity to the extent that a large difference exists between physician- and
pharmacy-dispensed prescriptions. We tested how sensitive the result of the price comparison could be to
this issue using 5 mg hydrocodone-acetaminophen (Vicodin®) with 30 and 60 pills per prescription as an
example. As Table B.1 shows, the price premiums for physician-dispensed prescriptions above the prices for
pharmacy-dispensed prescriptions were consistent with the results reported, for the states where we had
enough observations (i.e., a minimum of 30 prescriptions included in the computation).
Based on the results of the test, we believe that these two potential confounding factors are unlikely to
distort the results of price comparisons, especially in the states where the differences were substantial.
54
___________________________________________________________________________________________________P H Y S I C I A N D I S P E N S I N G I N W O R K E R S ' C O M P E N S A T I O N
copyright © 2012 workers compensation research institute

AR AZa CAa CT FL GAa IA IL IN LA MAb MD MI MN NC NJ NYb PA SCa TNa TXb VA WI
Prices per pill paid for hydrocodone-acetaminophen (5 mg, 30 pills per Rx)
MDRx – $0.69 $0.57 $1.58 $1.02 $1.17 – $1.33 $0.87 – n/a – $1.17 – $1.30 – n/a $1.36 $1.34 $1.10 n/a – $1.23
PDRx $0.49 $0.45 $0.51 $0.35 $0.38 $0.39 $0.48 $0.49 $0.45 $0.45 $0.29 $0.35 $0.30 $0.34 $0.44 $0.38 $0.38 $0.30 $0.35 $0.46 $0.43 $0.42 $0.40
Percentage difference – 54% 11% 358% 167% 196% – 172% 94% – n/a – 293% – 196% – n/a 357% 279% 141% n/a – 207%
Prices per pill paid for hydrocodone-acetaminophen (5 mg, 60 pills per Rx)
MDRx – – $0.53 – $0.92 $1.10 – $1.52 – – n/a – – – $1.09 – n/a $0.88 – $1.00 n/a – –
PDRx $0.45 $0.40 $0.41 $0.28 $0.34 $0.36 $0.39 $0.44 $0.45 $0.46 $0.26 $0.32 $0.24 $0.26 $0.36 $0.33 $0.30 $0.30 $0.30 $0.37 $0.42 $0.34 $0.35
Percentage difference – – 29% – 171% 207% – 246% – – n/a – – – 202% – n/a 197% – 172% n/a – –
Table B.1 Prices per Pill Paid for Physician- and Pharmacy-Dispensed Prescriptions: Example of Hydrocodone-Acetaminophen, Holding Quantity and Strength Constant, 2010/2011
Notes: The underlying data include prescriptions for claims with more than seven days of lost time that had prescriptions filled and paid for by a workers' compensation payor over the defined period. 2010/2011 refers to claims with injuries occurring in October 1, 2009, through September 30, 2010, and prescriptions through March 31, 2011.
Key: –: not reported because the cell size is less than 30 prescriptions; MDRx: physician-dispensed prescriptions; n/a: not applicable; PDRx: pharmacy-dispensed prescriptions; Rx: prescriptions.
a Five states (Arizona, California, Georgia, South Carolina, and Tennessee) recently adopted reforms aimed at reducing the costs of physician dispensing (see Appendix A for more detail). The data included are post-reform for Arizona and California, and pre-reform for Georgia, South Carolina, and Tennessee.
b In Massachusetts, New York, and Texas, physician dispensing is not allowed in general (see Appendix A for more detail).
55
___________________________________________________________________________________________________P H
Y S I C
I A N
D I S P E N
S I N G
I N W
O R K
E R S ' C O
M P E N
S A T I O
N
copyright © 2012 w
orkers compensation research institute

GLOSSARY
average wholesale price (AWP): Published by First DataBank and Medi-Span®. The AWP operates as an
available price index that represents the most common wholesaler price charged to customers.1
The AWP does not necessarily represent the actual sales price in any single transaction. The payors
may negotiate for lower prices. In workers’ compensation systems, however, the AWP is often used
as a price benchmark for pharmacy reimbursements of prescription drugs.
brand name drug: A drug known by a specific registered name and/or trademark with a chemical
formulation currently under patent by its owner/manufacturer.
compound drugs: Compound drugs are not available through traditional prescriptions and are prepared by
a pharmacist to customize a medication to meet a patient’s individual needs. They are also known
as compounded drugs. Convenience in administration of medication is a large component of
compounded drugs. Examples of convenient administration include a transdermal preparation for
topical use or suspension for oral use.
Current Procedural Terminology (CPT) codes: A system of coding used to identify procedures and
services performed by physicians and other medical providers.
generic alternative: A drug that does not necessarily contain the same active chemical ingredient as a brand
name pharmaceutical but has been categorized as belonging to the same pharmacological or
therapeutic class as the branded product.
generic equivalent: A drug which contains the same active chemical ingredients as the original patented
brand name pharmaceutical. A generic equivalent or “generic” drug is considered to be identical to
the original in dose, strength, route of administration, safety, efficacy, and intended use.
manufacturer NDC: See underlying NDC.
Medi-Span®: A publisher which offers a series of comprehensive drug databases, tools, and applications
utilized by health care professionals. Medi-Span® is part of Wolters Kluwer Health, Inc.
MDRx: The symbol used to indicate physician-dispensed prescriptions.
Narcotic: A legal term that is used to classify substances, such as opioids, under the Single Convention on
Narcotic Drugs, 1961, and the U.S. Controlled Substance Act. Since marijuana and cocaine are also
legally classified as narcotics, some may prefer to use the terms opiate, opioid, or prescription
narcotics when discussing the medical use of narcotics for pain relief. We use narcotics to refer to
prescription narcotics in this report.
National Drug Code (NDC): A unique 11-digit code assigned by the U.S. Food and Drug Administration
(FDA) to each medication in the United States that is intended for use on humans. The number
identifies the specific drug product, its strength and dosage, package size, manufacturer, and
repackaging firm.
non-repackaged drugs: Refers to the drugs produced and labeled by the original manufacturers of the drug.
The term is mostly used in the context of physician dispensing as a counterpart of repackaged
1 Medi-Span®. 2005. Master Drug Data Base (MDDB®) v2.5: Documentation Manual. Published by Wolters Kluwer Health, Inc.
56
___________________________________________________________________________________________________P H Y S I C I A N D I S P E N S I N G I N W O R K E R S ' C O M P E N S A T I O N
copyright © 2012 workers compensation research institute

drugs. See repackaged drugs.
over-the-counter (OTC) medication: Refers to a drug that does not require a prescription, for which the
FDA determines that the drug can be safely self-prescribed by non-physicians. OTC drugs are
available at a drug store or grocery store. Motrin®, Prilosec®, and Zantac® (described in this
report) are among the common OTC drugs.
PDRx: The symbol used to indicate pharmacy-dispensed prescriptions.
pharmacy benefit manager (PBM): A firm that contracts with payors to manage their prescription benefits
through price discounts, utilization management, data processing, and other services. A PBM may
have its own pharmacies or contracts with pharmacies for price discounts.
pharmacy fee schedule: A schedule of maximum reimbursement levels for drugs dispensed at pharmacies
as part of workers’ compensation laws.
physician-dispenser: Physicians who write prescriptions and dispense the prescribed medications at their
offices directly to the patient and receive payments for the medications dispensed.
physician dispensing: Refers to the practice of physicians dispensing prescription drugs at their offices
directly to the patient. There are three states in our study where physician dispensing is prohibited
in general—Massachusetts, New York, and Texas.
price premium for physician dispensing: Refers to the percentage difference in the price paid for
physician-dispensed prescriptions that is over and above the price paid to pharmacies for the same
drug.
repackaged drugs: Refers to drugs that are repackaged by a repackager into smaller, ready-to-dispense
quantities from larger bulk containers of the same drug produced by manufacturers. Repackaged
drugs have to be approved by the FDA, which assigns an NDC for each repackaged drug (a.k.a.,
repackager NDC). The AWP of a repackager NDC for a drug is usually higher than the AWP of a
manufacturer NDC for the same drug. repackager NDC: Refers to the NDC of a repackaged drug. A repackaged drug has to be approved by the
FDA, which then assigns it a new NDC. The AWP of a repackager NDC for a drug is usually higher
than the AWP of a manufacturer NDC for the same drug.
Rx: The symbol used to indicate prescriptions.
single-source drugs: The brand name drugs that are under patent protection. The patent guarantees that no
other pharmaceutical companies may manufacture the drug until the patent expires. A single-
source drug contains a unique active ingredient (responsible for the drug’s effect), dosage, and
dosage form, all of which are approved by the FDA as safe and effective to treat a particular illness
and protected under the patent.
underlying NDC: Refers to the NDC of the original drug that is underlying the repackaged drugs dispensed
by physicians. It is also known as original NDC or manufacturer NDC as opposed to repackager
NDC.
wholesale acquisition cost (WAC): Represents the cost at which wholesalers purchase drug products from a
pharmaceutical manufacturer, as reported by that manufacturer. The WAC does not necessarily
represent the actual sales price in any single transaction, as any manufacturer may agree to sell its
product at a lower price through inclusion of discounts or rebates. The WAC is typically lower
than the AWP.
57
___________________________________________________________________________________________________P H Y S I C I A N D I S P E N S I N G I N W O R K E R S ' C O M P E N S A T I O N
copyright © 2012 workers compensation research institute

REFERENCES
Afendulis, C., and D. P. Kessler. 2006. Tradeoffs from integrating diagnosis and treatment in markets for
health care. National Bureau of Economic Research working paper 12623. Retrieved from
http://www.nber.org/papers/w12623 (accessed July 16, 2012).
Aronovitz, L. 1994. Referrals to physician-owned imaging facilities warrant HCFA’s scrutiny. General
Accounting Office (GAO) report to the U.S. House of Representatives: Washington, DC.
Publication GAO/HEHS-95-2.
Baker, L. 2010. Acquisition of MRI equipment by doctors drives up imaging use and spending. Health
Affairs 29 (12): 2252–2259.
California Workers’ Compensation Institute (CWCI). 2005. California workers’ compensation repackaged
drugs analysis: 2004 dates of service (prescriptions). Oakland, CA: CWCI.
Chen, B., P. Gertler, and C. Yang. 2011. Physician ownership of non-physician medical services. Stanford
University APARC Seminar Series. Retrieved from http://iis-
db.stanford.edu/evnts/6569/Chen_051711.ppt (accessed July 16, 2012).
_______. 2010. Legal restrictions on physician ownership of non-physician medical services. Working paper.
Retrieved from
http://www.econ.uchile.cl/uploads/addon/archivo/post/5720/GertlerRestrictingPhysicansfromOw
ningNonPhysicanMedicalServices.pdf (accessed July 16, 2012).
Currie, J., W. Lin, and W. Zhang. 2010. Patient knowledge and antibiotic abuse: Evidence from an audit study
in China. National Bureau of Economic Research working paper 16602. Retrieved from
http://www.nber.org/papers/w16602 (accessed July 16, 2012).
Eggleston, K. 2011. Prescribing institutions: Explaining the evolution of physician dispensing. Asia Health
Policy Program working paper #24. Stanford University. Retrieved from http://iis-
db.stanford.edu/pubs/23374/AHPPwp_24.pdf (accessed July 16, 2012).
Gazelle, G., E. Halpern, H. Ryan, and A. Tramontano. 2007. Utilization of diagnostic medical imaging:
Comparison of radiologist referral versus same-specialty referral. Radiology 245 (2): 517.
Hillman, B., C. Joseph, M. Mabry, J. Sunshine, S. Kennedy, and M. Noether. 1990. Frequency and cost of
diagnostic imaging in office practice: A comparison of self-referring and radiologist-referring
physicians. New England Journal of Medicine 323: 1604–1608.
Hillman, B., G. Olson, R. Colbert, and L. Bernhardt. 1995. Response to a payment policy denying
professional charges for diagnostic imaging by nonradiologist physicians. The Journal of the
American Medical Association 274 (11): 885–887.
Hillman, B., G. Olson, P. Griffith, J. Sunshine, C. Joseph, S. Kennedy, W. Nelson, and L. Bernhardt. 1992.
Physicians' utilization and charges for outpatient diagnostic imaging in a Medicare population.
The Journal of the American Medical Association 268 (15): 2050–2054.
Iizuka, T. 2007. Experts’ agency problems: evidence from the prescription drug market in Japan. RAND
Journal of Economics 38 (3): 844–862.
Jacobson, M., and J. P. Newhouse. 2010. Expect the unexpected? Physicians’ responses to payment changes.
Expert Voices (November 2010). The NIHCM Foundation. Retrieved from
http://nihcm.org/pdf/EV-JacobsonNewhouseFINAL.pdf (accessed July 16, 2012).
58
___________________________________________________________________________________________________P H Y S I C I A N D I S P E N S I N G I N W O R K E R S ' C O M P E N S A T I O N
copyright © 2012 workers compensation research institute

Jacobson, M., C. C. Earle, J. P. Newhouse. 2011. Geographic variation in physicians’ responses to a
reimbursement change. The New England Journal of Medicine 365 (22): 2049–2052.
Lipton, B., C. Laws, and L. Li. 2011. Workers’ compensation prescription drug study: 2011 update. Boca Raton,
FL: NCCI Holdings, Inc.
Manchikanti, L., and E. B. McMahon. 2007. Physician refer thyself: Is Stark II, Phase III the final voyage?
Pain Physician 10: 725–741.
Medi-Span®. 2005. Master drug data base (MDDB®) v2.5: Documentation manual. Indianapolis, IN: Wolters
Kluwer Health, Inc.
Mitchell, J. 2005. Effects of physician-owned limited-service hospitals: Evidence from Arizona. Health
Affairs Supplemental Web Exclusives: W5-481-90.
Mitchell, J., and T. Sass. 1995. Physician ownership of ancillary services: Indirect demand inducement or
quality assurance? Journal of Health Economics 14 (3): 263–289.
Mitchell, J., and E. Scott. 1992. Physician ownership of physical therapy services. The Journal of the
American Medical Association 268 (15): 2055–2059.
Neuhauser, F., A. Swedlow, L. Gardner, and E. Edelstein. 2000. Study of the cost of pharmaceuticals in
workers’ compensation. Oakland, CA: Commission on Health and Safety and Workers’
Compensation. Retrieved from http://www.dir.ca.gov/CHSWC/Pharmacy/Pharmareport.html
(accessed July 16, 2012).
Neuhauser, F., A. Swedlow, and B. Wynn. 2006. Impact of physician-dispensing of repackaged drugs on
California workers’ compensation, employers cost, and workers’ access to quality of care. A study for
the Commission on Health and Safety and Workers’ Compensation.
PMSI. 2011. Annual drug trends report for workers’ compensation: Pharmacy spend trends and impacts.
Tampa, FL: PMSI.
Rodwin, M., and E. Okamoto. 2000. Physicians’ conflicts of interest in Japan and the United States: Lessons
for the United States. Journal of Health Politics, Policy and Law 25 (2): 343–375.
Stapleton, D., G., Livermore, J. Cores, M. Nowak, and E. Eiseman. 2001. Evaluation of the New York State
ONECARD Rx workers’ compensation benefit: Final report. Prepared for State of New York,
Department of Civil Service. Project Officer: Stephanie Washington. Prepared by the Lewin Group,
Inc. and Cornell University. Retrieved from
http://www.umassmed.edu/uploadedfiles/NYStateONECARDRx.pdf (accessed July 16, 2012).
Swedlow, A. 2005. Changes in prescription drug utilization, reimbursement and accessibility following adoption
of the California workers’ compensation pharmacy fee schedule. Early returns on workers’ comp
medical reforms: Part 4. Oakland, CA: CWCI.
Swedlow, A., and J. Ireland. 2009. Analysis of post-reform outcomes: Changes in pharmaceutical utilization
and reimbursement in the California workers’ compensation system. Oakland, CA: CWCI.
U.S. Census Bureau. 2008. Income, poverty, and health insurance coverage in the United States: 2007.
Retrieved from http://www.census.gov/prod/2008pubs/p60-235.pdf (accessed July 16, 2012).
U.S. Department of Health and Human Services, Office of the Inspector General (OIG). 1989. Financial
arrangements between physicians and health care business. OAI-12-88-01410. May 1989.
U.S. General Accounting Office (GAO). 2003. Specialty hospitals: Geographic location, services provided, and
financial performance. Report to Congress. GAO-04-167. October 2003.
Victor, R., and P. Petrova. 2006a. The cost and use of pharmaceuticals in workers’ compensation: A guide for
policymakers. Cambridge, MA: Workers Compensation Research Institute.
59
___________________________________________________________________________________________________P H Y S I C I A N D I S P E N S I N G I N W O R K E R S ' C O M P E N S A T I O N
copyright © 2012 workers compensation research institute

_______. 2006b. State policies affecting the cost and use of pharmaceuticals in workers’ compensation: A
national inventory. Cambridge, MA: Workers Compensation Research Institute.
Wang, D., and T. Liu. 2011a. Prescription benchmarks, 2nd edition: Trends and interstate comparisons.
Cambridge, MA: Workers Compensation Research Institute.
_______. 2011b. Prescription benchmarks for Florida, 2nd edition. Cambridge, MA: Workers Compensation
Research Institute.
Workers Compensation Research Institute (WCRI). 2011. Workers' compensation medical cost containment:
A national inventory, 2011. Cambridge, MA: Workers Compensation Research Institute.
Wynn, B. 2005. Paying for repackaged drugs under the California workers’ compensation official medical fee
schedule. Santa Monica, CA: RAND.
Yee, C. 2012. Why surgeon owners of ambulatory surgical centers do more surgery than non-owners.
Cambridge, MA: Workers Compensation Research Institute.
60
___________________________________________________________________________________________________P H Y S I C I A N D I S P E N S I N G I N W O R K E R S ' C O M P E N S A T I O N
copyright © 2012 workers compensation research institute

Other WCRI Publications
Medical Costs, Utilization, and Health Care Delivery designing workers’ compensation medical fee schedules. Olesya Fomenko and Te-Chun Liu. June 2012.
wc-12-19. compscope™ medical benchmarks for california, 12th edition. Rui Yang. May 2012. wc-12-02. compscope™ medical benchmarks for florida, 12th edition. Rui Yang. May 2012. wc-12-03. illinois medical cost drivers prior to 2011 reforms: compscope™ medical benchmarks, 12th edition. Evelina
Radeva. May 2012. wc-12-04. compscope™ medical benchmarks for louisiana, 12th edition. Carol A. Telles. May 2012. wc-12-05. compscope™ medical benchmarks for maryland, 12th edition. Rui Yang. May 2012. wc-12-06. compscope™ medical benchmarks for massachusetts, 12th edition. Evelina Radeva. May 2012. wc-12-07. compscope™ medical benchmarks for michigan, 12th edition. Bogdan Savych. May 2012. wc-12-08. medical benchmarks for minnesota, compscope™ 12th edition. Sharon E. Belton. May 2012. wc-12-09. medical benchmarks for new jersey, compscope™ 12th edition. Carol A. Telles. May 2012. wc-12-10. early impact of outpatient fee schedule reduction in north carolina: compscope™ medical benchmarks,
12th edition. Carol A. Telles. May 2012. wc-12-11. compscope™ medical benchmarks for pennsylvania, 12th edition. Evelina Radeva. May 2012. wc-12-12. monitoring the impact of reforms in texas: compscope™ medical benchmarks, 12th edition. Carol A. Telles.
May 2012. wc-12-13. medical benchmarks for virginia, compscope™ 12th edition. Carol A. Telles. May 2012. wc-12-14. compscope™ medical benchmarks for wisconsin, 12th edition. Evelina Radeva. May 2012. wc-12-15. why surgeon owners of ambulatory surgical centers do more surgery than non-owners. Christine A. Yee.
May 2012. wc-12-17. wcri medical price index for workers’ compensation, fourth edition (mpi-wc). Rui Yang and Olesya Fomenko.
March 2012. wc-12-20. hospital outpatient cost index for workers’ compensation. Rui Yang and Olesya Fomenko. January 2012.
wc-12-01. wcri medical price index for workers’ compensation, third edition (mpi-wc). Rui Yang. August 2011. wc-11-37. prescription benchmarks, 2nd edition: trends and interstate comparisons. Dongchun Wang and Te-Chun Liu.
July 2011. wc-11-31. prescription benchmarks for florida, 2nd edition. Dongchun Wang and Te-Chun Liu. July 2011. wc-11-32. prescription benchmarks for washington. Dongchun Wang and Te-Chun Liu. July 2011. wc-11-33. interstate variations in use of narcotics. Dongchun Wang, Kathryn Mueller, and Dean Hashimoto. July 2011.
wc-11-01. impact of preauthorization on medical care in texas. Christine A. Yee, Philip S. Borba, and Nicole Coomer.
June 2011. wc-11-34. workers' compensation medical cost containment: a national inventory, 2011. April 2011. wc-11-35. prescription benchmarks for minnesota. Dongchun Wang and Richard A. Victor. October 2010. wc-10-53. prescription benchmarks for florida. Dongchun Wang and Richard A. Victor. March 2010. wc-10-06. prescription benchmarks for illinois. Dongchun Wang and Richard A. Victor. March 2010. wc-10-05. prescription benchmarks for louisiana. Dongchun Wang and Richard A. Victor. March 2010. wc-10-10. prescription benchmarks for maryland. Dongchun Wang and Richard A. Victor. March 2010. wc-10-08. prescription benchmarks for massachusetts. Dongchun Wang and Richard A. Victor. March 2010. wc-10-07. prescription benchmarks for michigan. Dongchun Wang and Richard A. Victor. March 2010. wc-10-09. prescription benchmarks for north carolina. Dongchun Wang and Richard A. Victor. March 2010. wc-10-16. prescription benchmarks for new jersey. Dongchun Wang and Richard A. Victor. March 2010. wc-10-15. prescription benchmarks for pennsylvania. Dongchun Wang and Richard A. Victor. March 2010. wc-10-11.
copyright © 2012 workers compensation research institute

prescription benchmarks for tennessee. Dongchun Wang and Richard A. Victor. March 2010. wc-10-13. prescription benchmarks for texas. Dongchun Wang and Richard A. Victor. March 2010. wc-10-12. prescription benchmarks for wisconsin. Dongchun Wang and Richard A. Victor. March 2010. wc-10-14. fee schedules for hospitals and ambulatory surgical centers: a guide for policymakers. Nicole M. Coomer.
February 2010. wc-10-01. national inventory of workers’ compensation fee schedules for hospitals and ambulatory surgical
centers. Nicole M. Coomer. February 2010. wc-10-02. workers’ compensation medical cost containment: a national inventory. August 2009. wc-09-15. wcri flashreport: information requested by medicare to support decision-making on medicare secondary
payer regulations. Ramona P. Tanabe. April 2009. fr-09-01. wcri medical price index for workers’ compensation, second edition (mpi-wc). Stacey M. Eccleston with the
assistance of Juxiang Liu. June 2008. wc-08-29. wcri flashreport: connecticut fee schedule rates compared to state medicare rates: common medical
services delivered to injured workers by nonhospital providers. Stacey M. Eccleston. December 2007. fr-07-04.
wcri flashreport: what are the most important medical conditions in workers’ compensation. August 2007. fr-07-03.
wcri flashreport: what are the most important medical conditions in new york workers’ compensation. July 2007. fr-07-02.
wcri flashreport: analysis of illustrative medical fee schedules in wisconsin. Stacey M. Eccleston, Te-Chun Liu, and Richard A. Victor. March 2007. fr-07-01.
wcri medical price index for workers’ compensation: the mpi-wc, first edition. Stacey M. Eccleston. February 2007. wc-07-33.
benchmarks for designing workers’ compensation medical fee schedules: 2006. Stacey M. Eccleston and Te-Chun Liu. October 2006. wc-06-14.
analysis of the workers’ compensation medical fee schedules in illinois. Stacey M. Eccleston. July 2006. wc-06-28.
state policies affecting the cost and use of pharmaceuticals in workers’ compensation: a national inventory. Richard A. Victor and Petia Petrova. June 2006. wc-06-30.
the cost and use of pharmaceuticals in workers’ compensation: a guide for policymakers. Richard A. Victor and Petia Petrova. June 2006. wc-06-13.
how does the massachusetts medical fee schedule compare to prices actually paid in workers’ compensation? Stacey M. Eccleston. April 2006. wc-06-27.
the impact of provider choice on workers’ compensation costs and outcomes. Richard A. Victor, Peter S. Barth, and David Neumark, with the assistance of Te-Chun Liu. November 2005. wc-05-14.
adverse surprises in workers’ compensation: cases with significant unanticipated medical care and costs. Richard A. Victor. June 2005. wc-05-16.
wcri flashreport: analysis of the proposed workers’ compensation fee schedule in tennessee. Stacey M. Eccleston and Xiaoping Zhao. January 2005. fr-05-01.
wcri flashreport: analysis of services delivered at chiropractic visits in texas compared to other states. Stacey M. Eccleston and Xiaoping Zhao. July 2004. fr-04-07.
wcri flashreport: supplement to benchmarking the 2004 pennsylvania workers’ compensation medical fee schedule. Stacey M. Eccleston and Xiaoping Zhao. May 2004. fr-04-06.
wcri flashreport: is chiropractic care a cost driver in texas? reconciling studies by wcri and mgt/texas chiropractic association. April 2004. fr-04-05.
wcri flashreport: potential impact of a limit on chiropractic visits in texas. Stacey M. Eccleston. April 2004. fr-04-04.
wcri flashreport: are higher chiropractic visits per claim driven by “outlier” providers? Richard A. Victor April 2004. fr-04-03.
wcri flashreport: benchmarking the 2004 pennsylvania workers’ compensation medical fee schedule. Stacey M. Eccleston and Xiaoping Zhao. March 2004. fr-04-01.
evidence of effectiveness of policy levers to contain medical costs in workers’ compensation. Richard A. Victor. November 2003. wc-03-08.
copyright © 2012 workers compensation research institute

wcri medical price index for workers’ compensation. Dongchun Wang and Xiaoping Zhao. October 2003. wc-03-05.
wcri flashreport: where the medical dollar goes? how california compares to other states. Richard A. Victor and Stacey M. Eccleston. March 2003. fr-03-03.
patterns and costs of physical medicine: comparison of chiropractic and physician-directed care. Richard A. Victor and Dongchun Wang. December 2002. wc-02-07.
provider choice laws, network involvement, and medical costs. Richard A. Victor, Dongchun Wang, and Philip Borba. December 2002. wc-02-05.
wcri flashreport: analysis of payments to hospitals and surgery centers in florida workers’ compensation. Stacey M. Eccleston and Xiaoping Zhao. December 2002. fr-02-03.
benchmarks for designing workers’ compensation medical fee schedules: 2001–2002. Stacey M. Eccleston, Aniko Laszlo, Xiaoping Zhao, and Michael Watson. August 2002. wc-02-02.
wcri flashreport: changes in michigan’s workers’ compensation medical fee schedule: 1996–2002. Stacey M. Eccleston. December 2002. fr-02-02.
targeting more costly care: area variation in texas medical costs and utilization. Richard A. Victor and N. Michael Helvacian. May 2002. wc-02-03.
wcri flashreport: comparing the pennsylvania workers’ compensation fee schedule with medicare rates: evidence from 160 important medical procedures. Richard A. Victor, Stacey M. Eccleston, and Xiaoping Zhao. November 2001. fr-01-07.
wcri flashreport: benchmarking pennsylvania’s workers’ compensation medical fee schedule. Stacey M. Eccleston and Xiaoping Zhao. October 2001. fr-01-06.
wcri flashreport: benchmarking california’s workers’ compensation medical fee schedules. Stacey M. Eccleston. August 2001. fr-01-04.
managed care and medical cost containment in workers’ compensation: a national inventory, 2001–2002. Ramona P. Tanabe and Susan M. Murray. December 2001. wc-01-04.
wcri flashreport: benchmarking florida’s workers’ compensation medical fee schedules. Stacey M. Eccleston and Aniko Laszlo. August 2001. fr-01-03.
the impact of initial treatment by network providers on workers’ compensation medical costs and disability payments. Sharon E. Fox, Richard A. Victor, Xiaoping Zhao, and Igor Polevoy. August 2001. dm-01-01.
the impact of workers’ compensation networks on medical and disability payments. William G. Johnson, Marjorie L. Baldwin, and Steven C. Marcus. November 1999. wc-99-5.
fee schedule benchmark analysis: ohio. Philip L. Burstein. December 1996. fs-96-1. the rbrvs as a model for workers’ compensation medical fee schedules: pros and cons. Philip L. Burstein. July
1996. wc-96-5. benchmarks for designing workers’ compensation medical fee schedules: 1995–1996. Philip L. Burstein. May
1996. wc-96-2. fee schedule benchmark analysis: north carolina. Philip L. Burstein. December 1995. fs-95-2. fee schedule benchmark analysis: colorado. Philip L. Burstein. August 1995. fs-95-1. benchmarks for designing workers’ compensation medical fee schedules: 1994–1995. Philip L. Burstein.
December 1994. wc-94-7. review, regulate, or reform: what works to control workers’ compensation medical costs. Thomas W.
Grannemann, ed. September 1994. wc-94-5. fee schedule benchmark analysis: michigan. Philip L. Burstein. September 1994. fs-94-1. medicolegal fees in california: an assessment. Leslie I. Boden. March 1994. wc-94-1. benchmarks for designing workers’ compensation medical fee schedules. Stacey M. Eccleston, Thomas W.
Grannemann, and James F. Dunleavy. December 1993. wc-93-4. how choice of provider and recessions affect medical costs in workers’ compensation. Richard B. Victor and
Charles A. Fleischman. June 1990. wc-90-2. medical costs in workers’ compensation: trends & interstate comparisons. Leslie I. Boden and Charles A.
Fleischman. December 1989. wc-89-5.
copyright © 2012 workers compensation research institute

Worker Outcomes how have worker outcomes and medical costs changed in wisconsin? Sharon E. Belton and Te-Chun Liu. May
2010. wc-10-04. comparing outcomes for injured workers in michigan. Sharon E. Belton and Te-Chun Liu. June 2009. wc-09-31. comparing outcomes for injured workers in maryland. Sharon E. Belton and Te-Chun Liu. June 2008. wc-08-15. comparing outcomes for injured workers in nine large states. Sharon E. Belton, Richard A. Victor, and Te-Chun
Liu, with the assistance of Pinghui Li. May 2007. wc-07-14. comparing outcomes for injured workers in seven large states. Sharon E. Fox, Richard A. Victor, and Te-Chun
Liu, with the assistance of Pinghui Li. February 2006. wc-06-01. wcri flashreport: worker outcomes in texas by type of injury. Richard A. Victor. February 2005. fr-05-02. outcomes for injured workers in california, massachusetts, pennsylvania, and texas. Richard A. Victor, Peter
S. Barth, and Te-Chun Liu, with the assistance of Pinghui Li. December 2003. wc-03-07. outcomes for injured workers in texas. Peter S. Barth and Richard A. Victor, with the assistance of Pinghui Li and
Te-Chun Liu. July 2003. wc-03-02. the workers’ story: results of a survey of workers injured in wisconsin. Monica Galizzi, Leslie I. Boden, and
Te-Chun Liu. December 1998. wc-98-5. workers’ compensation medical care: effective measurement of outcomes. Kate Kimpan. October 1996.
wc-96-7.
Benefits and Return to Work return to work after a lump-sum settlement. Bogdan Savych. July 2012. wc-12-21. factors influencing return to work for injured workers: lessons from pennsylvania and wisconsin. Sharon
E. Belton. November 2011. wc-11-39. the impact of the 2004 ppd reforms in tennessee: early evidence. Evelina Radeva and Carol Telles. May 2008.
fr-08-02. factors that influence the amount and probability of permanent partial disability benefits. Philip S. Borba
and Mike Helvacian. June 2006. wc-06-16. return-to-work outcomes of injured workers: evidence from california, massachusetts, pennsylvania,
and texas. Sharon E. Fox, Philip S. Borba, and Te-Chun Liu. May 2005. wc-05-15. who obtains permanent partial disability benefits: a six state analysis. Peter S. Barth, N. Michael Helvacian,
and Te-Chun Liu. December 2002. wc-02-04. wcri flashreport: benchmarking oregon’s permanent partial disability benefits. Duncan S. Ballantyne and
Michael Manley. July 2002. fr-02-01. wcri flashreport: benchmarking florida’s permanent impairment benefits. Richard A. Victor and Duncan S.
Ballantyne. September 2001. fr-01-05. permanent partial disability benefits: interstate differences. Peter S. Barth and Michael Niss. September 1999.
wc-99-2. measuring income losses of injured workers: a study of the wisconsin system—A WCRI Technical Paper.
Leslie I. Boden and Monica Galizzi. November 1998. permanent partial disability in tennessee: similar benefits for similar injuries? Leslie I. Boden. November
1997. wc-97-5. what are the most important factors shaping return to work? evidence from wisconsin. Monica Galizzi and
Leslie I. Boden. October 1996. wc-96-6. do low ttd maximums encourage high ppd utilization: re-examining the conventional wisdom. John A.
Gardner. January 1992. wc-92-2. benefit increases and system utilization: the connecticut experience. John A. Gardner. December 1991.
wc-91-5. designing benefit structures for temporary disability: a guide for policymakers—Two-Volume Publication.
Richard B. Victor and Charles A. Fleischman. December 1989. wc-89-4.
copyright © 2012 workers compensation research institute

return to work incentives: lessons for policymakers from economic studies. John A. Gardner. June 1989. wc-89-2.
income replacement for long-term disability: the role of workers’ compensation and ssdi. Karen R. DeVol. December 1986. sp-86-2.
Cost Drivers and Benchmarks of System Performance compscopeTM benchmarks for california, 12th edition. Rui Yang, with the assistance of Syd Allan. December 2011.
wc-11-41. compscopeTM benchmarks for florida, 12th edition. Rui Yang, with the assistance of Syd Allan. December 2011.
wc-11-42. baseline for monitoring the impact of 2011 reforms in illinois: compscopeTM benchmarks, 12th edition.
Evelina Radeva, with the assistance of Syd Allan. December 2011. wc-11-43. compscopeTM benchmarks for louisiana, 12th edition. Carol A. Telles, with the assistance of Syd Allan. December
2011. wc-11-44. compscopeTM benchmarks for maryland, 12th edition. Rui Yang, with the assistance of Syd Allan. December 2011.
wc-11-45. compscopeTM benchmarks for massachusetts, 12th edition. Evelina Radeva, with the assistance of Syd Allan.
December 2011. wc-11-46. compscopeTM benchmarks for michigan, 12th edition. Bogdan Savych, with the assistance of Syd Allan. December
2011. wc-11-47. benchmarks for minnesota, compscopeTM 12th edition. Carol A. Telles, with the assistance of Syd Allan. December
2011. wc-11-48. benchmarks for new jersey, compscopeTM 12th edition. Carol A. Telles, with the assistance of Syd Allan. December
2011. wc-11-49. baseline for evaluating impact of 2011 reforms in north carolina: compscopeTM benchmarks, 12th edition.
Carol A. Telles, with the assistance of Syd Allan. December 2011. wc-11-50. compscopeTM benchmarks for pennsylvania, 12th edition. Evelina Radeva, with the assistance of Syd Allan.
December 2011. wc-11-51. monitoring the impact of reforms and recession in texas: compscopeTM benchmarks, 12th edition. Carol A.
Telles, with the assistance of Syd Allan. December 2011. wc-11-52. benchmarks for virginia, compscopeTM 12th edition. Carol A. Telles, with the assistance of Syd Allan. December
2011. wc-11-53. compscopeTM benchmarks for wisconsin, 12th edition. Evelina Radeva, with the assistance of Syd Allan. December
2011. wc-11-54. early impact of 2007 reforms in new york. Carol A. Telles and Ramona P. Tanabe. December 2011. wc-11-38. compscopeTM benchmarks for tennessee, 11th edition. Evelina Radeva, Nicole M. Coomer, Bogdan Savych, Carol A.
Telles, Rui Yang, and Ramona P. Tanabe, with the assistance of Syd Allan. January 2011. wc-11-13. baseline trends for evaluating the impact of the 2007 reforms in new york. Ramona P. Tanabe and Carol A.
Telles. November 2010. wc-10-36. updated baseline for evaluating the impact of the 2007 reforms in new york. Ramona P. Tanabe, Stacey
Eccleston, and Carol A. Telles. April 2009. wc-09-14. interstate variations in medical practice patterns for low back conditions. Dongchun Wang, Kathryn
Meuller, Dean Hashimoto, Sharon Belton, and Xiaoping Zhao. June 2008. wc-08-28. wcri flashreport: timeliness of injury reporting and first indemnity payment in new york: a comparison
with 14 states. Carol A. Telles and Ramona P. Tanabe. March 2008. fr-08-01. baseline for evaluating the impact of the 2007 reforms in new york. Ramona P. Tanabe, Stacey Eccleston, and
Carol A. Telles. March 2008. wc-08-14. why are benefit delivery expenses higher in california and florida? Duncan S. Ballantyne and Carol A. Telles.
December 2002. wc-02-06. compscopeTM
benchmarks: massachusetts, 1994–1999. Carol A. Telles, Aniko Laszlo, and Te-Chun Liu. January 2002. cs-01-03.
compscopeTM benchmarks: florida, 1994–1999. N. Michael Helvacian and Seth A. Read. September 2001. cs-01-1.
copyright © 2012 workers compensation research institute

wcri flashreport: where the workers’ compensation dollar goes. Richard A. Victor and Carol A. Telles. August 2001. fr-01-01.
predictors of multiple workers’ compensation claims in wisconsin. Glenn A. Gotz, Te-Chun Liu, and Monica Galizzi. November 2000. wc-00-7.
area variations in texas benefit payments and claim expenses. Glenn A. Gotz, Te-Chun Liu, Christopher J. Mazingo, and Douglas J. Tattrie. May 2000. wc-00-3.
area variations in california benefit payments and claim expenses. Glenn A. Gotz, Te-Chun Liu, and Christopher J. Mazingo. May 2000. wc-00-2.
area variations in pennsylvania benefit payments and claim expenses. Glenn A. Gotz, Te-Chun Liu, and Christopher J. Mazingo. May 2000. wc-00-1.
benchmarking the performance of workers’ compensation systems: compscopeTM measures for minnesota.
H. Brandon Haller and Seth A. Read. June 2000. cs-00-2. benchmarking the performance of workers’ compensation systems: compscopeTM
measures for massachusetts. Carol A. Telles and Tara L. Nells. December 1999. cs-99-3.
benchmarking the performance of workers’ compensation systems: compscopeTM measures for california.
Sharon E. Fox and Tara L. Nells. December 1999. cs-99-2. benchmarking the performance of workers’ compensation systems: compscopeTM
measures for pennsylvania. Sharon E. Fox and Tara L. Nells. November 1999. cs-99-1.
cost drivers and system performance in a court-based system: tennessee. John A. Gardner, Carol A. Telles, and Gretchen A. Moss. June 1996. wc-96-4.
the 1991 reforms in massachusetts: an assessment of impact. John A. Gardner, Carol A. Telles, and Gretchen A. Moss. May 1996. wc-96-3.
the impact of oregon’s cost containment reforms. John A. Gardner, Carol A. Telles, and Gretchen A. Moss. February 1996. wc-96-1.
cost drivers and system change in georgia, 1984–1994. John A. Gardner, Carol A. Telles, and Gretchen A. Moss. November 1995. wc-95-3.
cost drivers in missouri. John A. Gardner, Richard A. Victor, Carol A. Telles, and Gretchen A. Moss. December 1994. wc-94-6.
cost drivers in new jersey. John A. Gardner, Richard A. Victor, Carol A. Telles, and Gretchen A. Moss. September 1994. wc-94-4.
cost drivers in six states. Richard A. Victor, John A. Gardner, Daniel Sweeney, and Carol A. Telles. December 1992. wc-92-9.
performance indicators for permanent disability: low-back injuries in texas. Sara R. Pease. August 1988. wc-88-4.
performance indicators for permanent disability: low-back injuries in new jersey. Sara R. Pease. December 1987. wc-87-5.
performance indicators for permanent disability: low-back injuries in wisconsin. Sara R. Pease. December 1987. wc-87-4.
Administration/Litigation workers’ compensation laws as of january 2012. Joint publication of IAIABC and WCRI. Ramona P. Tanabe.
March 2012. wc-12-18. workers’ compensation laws, 3rd edition. Joint publication of IAIABC and WCRI. Ramona P. Tanabe. October
2010. wc-10-52. avoiding litigation: what can employers, insurers, and state workers’ compensation agencies do?.
Richard A. Victor and Bogdan Savych. July 2010. wc-10-18. workers’ compensation laws, 2nd edition. Joint publication of IAIABC and WCRI. June 2009. wc-09-30. did the florida reforms reduce attorney involvement? Bogdan Savych and Richard A. Victor. June 2009.
wc-09-16. lessons from the oregon workers’ compensation system. Duncan S. Ballantyne. March 2008. wc-08-13. workers’ compensation in montana: administrative inventory. Duncan S. Ballantyne. March 2007. wc-07-12. workers’ compensation in nevada: administrative inventory. Duncan S. Ballantyne. December 2006. wc-06-15.
copyright © 2012 workers compensation research institute

workers’ compensation in hawaii: administrative inventory. Duncan S. Ballantyne. April 2006. wc-06-12. workers’ compensation in arkansas: administrative inventory. Duncan S. Ballantyne. August 2005. wc-05-18. workers’ compensation in mississippi: administrative inventory. Duncan S. Ballantyne. May 2005. wc-05-13. workers’ compensation in arizona: administrative inventory. Duncan S. Ballantyne. September 2004. wc-04-05. workers’ compensation in iowa: administrative inventory. Duncan S. Ballantyne. April 2004. wc-04-02. wcri flashreport: measuring the complexity of the workers’ compensation dispute resolution processes in
tennessee. Richard A. Victor. April 2004. fr-04-02. revisiting workers’ compensation in missouri: administrative inventory. Duncan S. Ballantyne. December
2003. wc-03-06. workers’ compensation in tennessee: administrative inventory. Duncan S. Ballantyne. April 2003. wc-03-01. revisiting workers’ compensation in new york: administrative inventory. Duncan S. Ballantyne. January 2002.
wc-01-05. workers’ compensation in kentucky: administrative inventory. Duncan S. Ballantyne. June 2001. wc-01-01. workers’ compensation in ohio: administrative inventory. Duncan S. Ballantyne. October 2000. wc-00-5. workers’ compensation in louisiana: administrative inventory. Duncan S. Ballantyne. November 1999. wc-99-4. workers’ compensation in florida: administrative inventory. Peter S. Barth. August 1999. wc-99-3. measuring dispute resolution outcomes: a literature review with implications for workers’ compensation.
Duncan S. Ballantyne and Christopher J. Mazingo. April 1999. wc-99-1. revisiting workers’ compensation in connecticut: administrative inventory. Duncan S. Ballantyne. September
1998. wc-98-4. dispute prevention and resolution in workers’ compensation: a national inventory, 1997–1998. Duncan S.
Ballantyne. May 1998. wc-98-3. workers’ compensation in oklahoma: administrative inventory. Michael Niss. April 1998. wc-98-2. workers’ compensation advisory councils: a national inventory, 1997–1998. Sharon E. Fox. March 1998.
wc-98-1. the role of advisory councils in workers’ compensation systems: observations from wisconsin. Sharon E.
Fox. November 1997. revisiting workers’ compensation in michigan: administrative inventory. Duncan S. Ballantyne and Lawrence
Shiman. October 1997. wc-97-4. revisiting workers’ compensation in minnesota: administrative inventory. Carol A. Telles and Lawrence
Shiman. September 1997. wc-97-3. revisiting workers’ compensation in california: administrative inventory. Carol A. Telles and Sharon E. Fox.
June 1997. wc-97-2. revisiting workers’ compensation in pennsylvania: administrative inventory. Duncan S. Ballantyne. March
1997. wc-97-1. revisiting workers’ compensation in washington: administrative inventory. Carol A. Telles and Sharon E. Fox.
December 1996. wc-96-10. workers’ compensation in illinois: administrative inventory. Duncan S. Ballantyne and Karen M. Joyce.
November 1996. wc-96-9. workers’ compensation in colorado: administrative inventory. Carol A. Telles and Sharon E. Fox. October 1996.
wc-96-8. workers’ compensation in oregon: administrative inventory. Duncan S. Ballantyne and James F. Dunleavy.
December 1995. wc-95-2. revisiting workers’ compensation in texas: administrative inventory. Peter S. Barth and Stacey M. Eccleston.
April 1995. wc-95-1. workers’ compensation in virginia: administrative inventory. Carol A. Telles and Duncan S. Ballantyne. April
1994. wc-94-3. workers’ compensation in new jersey: administrative inventory. Duncan S. Ballantyne and James F. Dunleavy.
April 1994. wc-94-2. workers’ compensation in north carolina: administrative inventory. Duncan S. Ballantyne. December 1993.
wc-93-5. workers’ compensation in missouri: administrative inventory. Duncan S. Ballantyne and Carol A. Telles. May
1993. wc-93-1.
copyright © 2012 workers compensation research institute

workers’ compensation in california: administrative inventory. Peter S. Barth and Carol A. Telles. December 1992. wc-92-8.
workers’ compensation in wisconsin: administrative inventory. Duncan S. Ballantyne and Carol A. Telles. November 1992. wc-92-7.
workers’ compensation in new york: administrative inventory. Duncan S. Ballantyne and Carol A. Telles. October 1992. wc-92-6.
the ama guides in maryland: an assessment. Leslie I. Boden. September 1992. wc-92-5. workers’ compensation in georgia: administrative inventory. Duncan S. Ballantyne and Stacey M. Eccleston.
September 1992. wc-92-4. workers’ compensation in pennsylvania: administrative inventory. Duncan S. Ballantyne and Carol A. Telles.
December 1991. wc-91-4. reducing litigation: using disability guidelines and state evaluators in oregon. Leslie I. Boden, Daniel E.
Kern, and John A. Gardner. October 1991. wc-91-3. workers’ compensation in minnesota: administrative inventory. Duncan S. Ballantyne and Carol A. Telles. June
1991. wc-91-1. workers’ compensation in maine: administrative inventory. Duncan S. Ballantyne and Stacey M. Eccleston.
December 1990. wc-90-5. workers’ compensation in michigan: administrative inventory. H. Allan Hunt and Stacey M. Eccleston. January
1990. wc-90-1. workers’ compensation in washington: administrative inventory. Sara R. Pease. November 1989. wc-89-3. workers’ compensation in texas: administrative inventory. Peter S. Barth, Richard B. Victor, and Stacey M.
Eccleston. March 1989. wc-89-1. reducing litigation: evidence from wisconsin. Leslie I. Boden. December 1988. wc-88-7. workers’ compensation in connecticut: administrative inventory. Peter S. Barth. December 1987. wc-87-3. use of medical evidence: low-back permanent partial disability claims in new jersey. Leslie I. Boden.
December 1987. wc-87-2. use of medical evidence: low-back permanent partial disability claims in maryland. Leslie I. Boden.
September 1986. sp-86-1.
Vocational Rehabilitation improving vocational rehabilitation outcomes: opportunities for early intervention. John A. Gardner.
August 1988. wc-88-3. appropriateness and effectiveness of vocational rehabilitation in florida: costs, referrals, services, and
outcomes. John A. Gardner. February 1988. wc-88-2. vocational rehabilitation in florida workers’ compensation: rehabilitants, services, costs, and outcomes.
John A. Gardner. February 1988. wc-88-1. vocational rehabilitation outcomes: evidence from new york. John A. Gardner. December 1986. wc-86-1. vocational rehabilitation in workers’ compensation: issues and evidence. John A. Gardner. June 1985. s-85-1.
Occupational Disease liability for employee grievances: mental stress and wrongful termination. Richard B. Victor, ed. October
1988. wc-88-6. asbestos claims: the decision to use workers’ compensation and tort. Robert I. Field and Richard B. Victor.
September 1988. wc-88-5.
copyright © 2012 workers compensation research institute

Other workers’ compensation: where have we come from? where are we going?. Richard A. Victor and Linda L.
Carrubba, eds. November 2010. wc-10-33. recession, fear of job loss, and return to work. Richard A. Victor and Bogdan Savych. April 2010. wc-10-03. wcri flashreport: what are the prevalence and size of lump-sum payments in workers’ compensation:
estimates relevant for medicare set-asides. Richard A. Victor, Carol A. Telles, and Rui Yang. November 2006. fr-06-01.
the future of workers’ compensation: opportunities and challenges. Richard A. Victor, ed. April 2004. wc-04-03.
managing catastrophic events in workers’ compensation: lessons from 9/11. Ramona P. Tanabe, ed. March 2003. wc-03-03.
wcri flashreport: workers’ compensation in california: lessons from recent wcri studies. Richard A. Victor. March 2003. fr-03-02.
wcri flashreport: workers’ compensation in florida: lessons from recent wcri studies. Richard A. Victor. February 2003. fr-03-01.
workers’ compensation and the changing age of the workforce. Douglas J. Tattrie, Glenn A. Gotz, and Te-Chun Liu. December 2000. wc-00-6.
medical privacy legislation: implications for workers’ compensation. Ramona P. Tanabe, ed. November 2000. wc-00-4.
the implications of changing employment relations for workers’ compensation. Glenn A. Gotz, ed. December 1999. wc-99-6.
workers’ compensation success stories. Richard A. Victor, ed. July 1993. wc-93-3. the americans with disabilities act: implications for workers’ compensation. Stacey M. Eccleston, ed. July
1992. wc-92-3. twenty-four-hour coverage. Richard A. Victor, ed. June 1991. wc-91-2. These publications can be obtained by visiting our web site at www.wcrinet.org or by sending a written request by fax to (617) 661-9284, or by mail to
Publications Department Workers Compensation Research Institute 955 Massachusetts Avenue Cambridge, MA 02139
copyright © 2012 workers compensation research institute

About the Institute
The Workers Compensation Research Institute is a nonpartisan, not-
for-profit research organization providing objective information
about public policy issues involving workers’ compensation systems.
The Institute does not take positions on the issues it researches;
rather it provides information obtained through studies and data
collection efforts that conform to recognized scientific methods,
with objectivity further ensured through rigorous peer review
procedures.
The Institute’s work helps those interested in improving workers’
compensation systems by providing new, objective, empirical infor–
mation that bears on certain vital questions:
How serious are the problems that policymakers want to
address?
What are the consequences of proposed solutions?
Are there alternative solutions that merit consideration? What
are their consequences?
The Institute’s work takes several forms:
Original research studies on major issues confronting workers’
compensation systems
Original research studies of individual state systems where
policymakers have shown an interest in reform and where
there is an unmet need for objective information
Sourcebooks that bring together information from a variety of
sources to provide unique, convenient reference works on
specific issues
Periodic research briefs that report on significant new
research, data, and issues in the field
Benchmarking reports that identify key outcomes of state
systems
copyright © 2012 workers compensation research institute