Embed Size (px)
Citation preview

PHYSICAL SCIENCEPHYSICAL SCIENCEChapter 1: The Nature of Chapter 1: The Nature of ScienceScience
Section 1: The Methods of ScienceSection 1: The Methods of Science
11

What is science?What is science?
The term science is derived from the latin word The term science is derived from the latin word scientia, meaning “knowledge.”scientia, meaning “knowledge.”
22

There are 3 Major There are 3 Major Categories of ScienceCategories of Science
1. Earth science—71. Earth science—7thth grade—investigates grade—investigates Earth and spaceEarth and space
2. Life science—82. Life science—8thth grade—deals with grade—deals with living thingsliving things
3. Physical science3. Physical science—9—9thth grade—study of grade—study of matter and energymatter and energy
33

The Scientific MethodThe Scientific Method
An organized set of An organized set of investigation investigation procedures is called procedures is called the the scientific scientific method.method.
44

STEP 1STEP 1
STATE THE PROBLEM (after making STATE THE PROBLEM (after making observations)observations)
The problem is often stated in the form of The problem is often stated in the form of a question (Why…? How…?)a question (Why…? How…?)
55

STEP 2STEP 2
RESEARCH AND GATHER RESEARCH AND GATHER INFORMATIONINFORMATION
Learn about the background of the Learn about the background of the problem.problem.
What other tests have scientists already What other tests have scientists already performed? performed?
66

STEP 3STEP 3
FORM A HYPOTHESIS—A FORM A HYPOTHESIS—A hypothesis hypothesis is a possible explanation for a problem.is a possible explanation for a problem.
““Educated Guess”Educated Guess” PredictionPrediction
77

STEP 4STEP 4
TESTING A HYPOTHESISTESTING A HYPOTHESIS
Make observationsMake observations Build a modelBuild a model Perform an experimentPerform an experiment
88
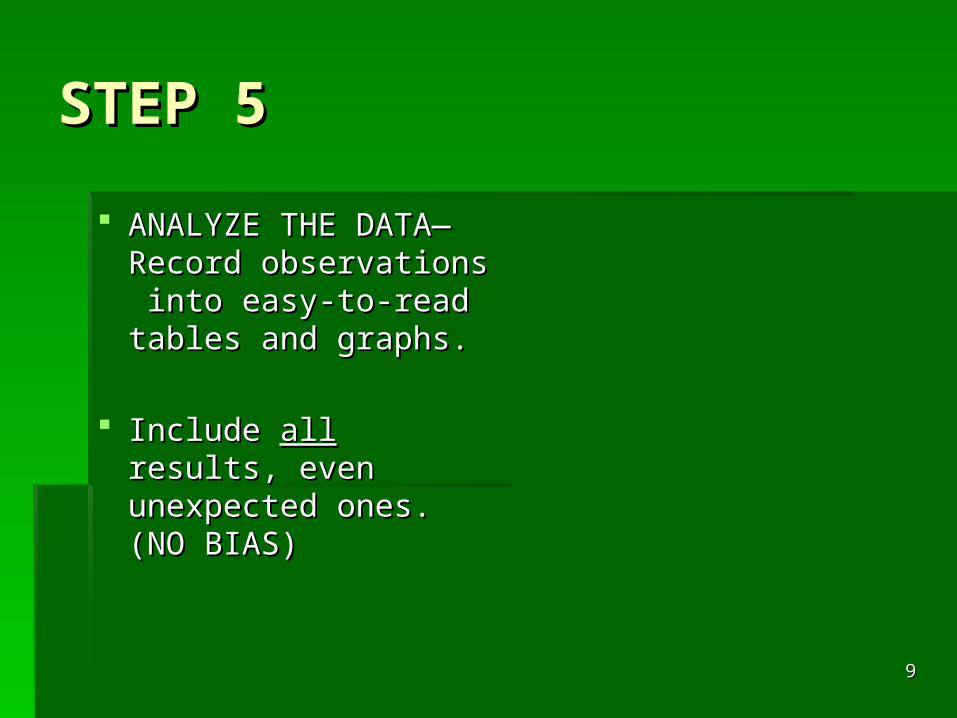
STEP 5STEP 5
ANALYZE THE ANALYZE THE DATA—Record DATA—Record observations into observations into easy-to-read tables easy-to-read tables and graphs. and graphs.
Include Include allall results, results, even unexpected even unexpected ones. (NO BIAS)ones. (NO BIAS)
99
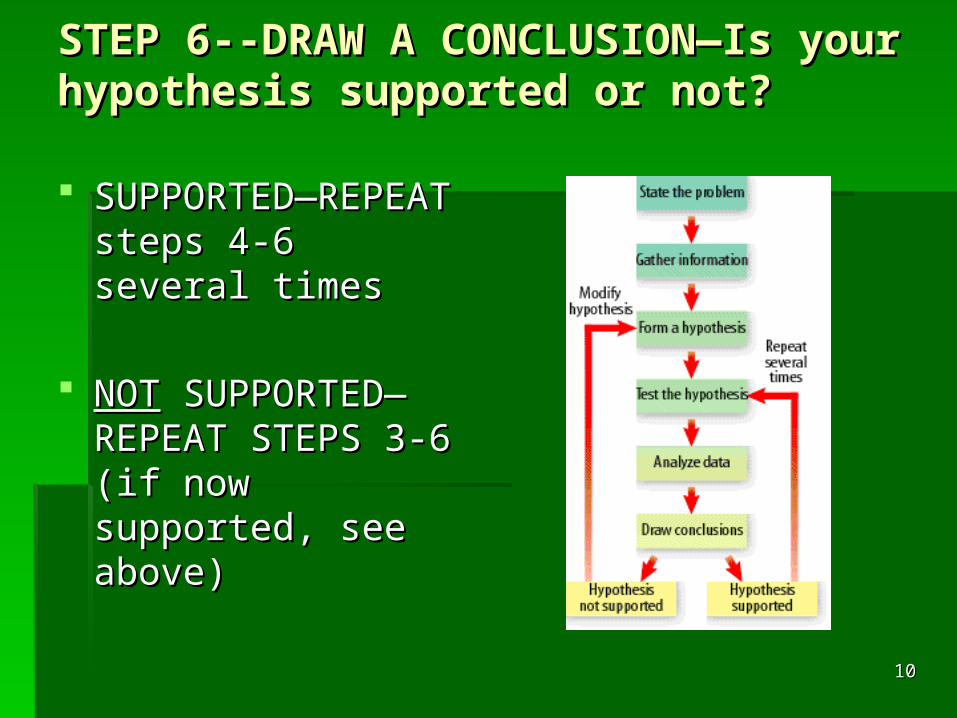
STEP 6--DRAW A CONCLUSION—Is STEP 6--DRAW A CONCLUSION—Is your hypothesis supported or not? your hypothesis supported or not?
SUPPORTED—SUPPORTED—REPEAT steps 4-6 REPEAT steps 4-6 several timesseveral times
NOTNOT SUPPORTED— SUPPORTED—REPEAT STEPS 3-6 REPEAT STEPS 3-6 (if now supported, see (if now supported, see above)above)
1010

VARIABLESVARIABLES
A A variablevariable is a quantity that can have is a quantity that can have more than a single value.more than a single value.
An experiment usually contains at least 2 An experiment usually contains at least 2 variables.variables.
1111

EXPERIMENTEXPERIMENT
Which brand of Which brand of fertilizer helps plants fertilizer helps plants to grow the biggest?to grow the biggest?
1212

List variables—factors that might List variables—factors that might cause plants to grow bigger.cause plants to grow bigger.
Amount of sunlightAmount of sunlight Amount of waterAmount of water Type of fertilizerType of fertilizer Type of soilType of soil Room temperature Room temperature Plant typePlant type
1313

What is the What is the independent independent variable?variable?
The variable you change to see how it The variable you change to see how it will affect the will affect the dependent dependent variable.variable.
The scientist is able to choose the The scientist is able to choose the independent variable.independent variable.
Ex. The brand of fertilizerEx. The brand of fertilizer
1414

What is the What is the dependent dependent variable?variable?
The dependent variable changes The dependent variable changes according to the changes in the other according to the changes in the other variable. variable.
The scientist is not able to choose the The scientist is not able to choose the dependent variable.dependent variable.
Ex. The amount of plant growthEx. The amount of plant growth1515

ConstantsConstants
A A constantconstant is a factor that does is a factor that does notnot change when other variables change.change when other variables change.
Constants remain the same throughout the Constants remain the same throughout the experiment.experiment.
Examples—amount of sunlight, amount of Examples—amount of sunlight, amount of water, room temperature, type of soil, water, room temperature, type of soil, plant type plant type
1616

ControlControl
A A controlcontrol is the standard by which the test is the standard by which the test results can be compared.results can be compared.
One plant has no fertilizer. This plant is the One plant has no fertilizer. This plant is the controlcontrol..
Ex. Three fertilized plants grow between Ex. Three fertilized plants grow between 2-3 cms. VS. The 2-3 cms. VS. The unfertilized unfertilized plant grows plant grows 1.5 cms. 1.5 cms.
1717

Are Are sciencescience and and technologytechnology the same?the same? Science Science is acquiring is acquiring
knowledge.knowledge.
Technology Technology is the is the application of science application of science to to help help people.people.
1818
Sweet 80’s Picture

CHAPTER 1: THE CHAPTER 1: THE NATURE OF SCIENCENATURE OF SCIENCE
Section 2: Standards of Section 2: Standards of MeasurementMeasurement
1919

A A standardstandard is an exact quantity is an exact quantity that people agree to use for that people agree to use for comparison.comparison.
English MeasurementEnglish Measurement
System (U.S.A.)System (U.S.A.) MilkMilkgallongallon LumberLumberfootfoot PotatoesPotatoespoundpound
Metric (Other Nations)Metric (Other Nations) Based on multiples Based on multiples
of 10 and developed of 10 and developed in the late 1700’s.in the late 1700’s.
Milk→ LiterMilk→ Liter Lumber→MeterLumber→Meter Potatoes→ KilogramPotatoes→ Kilogram
2020

In 1960, an improved version of the In 1960, an improved version of the metric system was devised, known as metric system was devised, known as the the International System of UnitsInternational System of Units, , abbreviated abbreviated SISI..
SI BASE UNITSSI BASE UNITS
2121
QUANTITY QUANTITY
MEASUREDMEASUREDUNITUNIT SYMBOLSYMBOL
LengthLength metermeter mm
MassMass kilogramkilogram kgkg
TimeTime second second ss
TemperatureTemperature kelvinkelvin KK
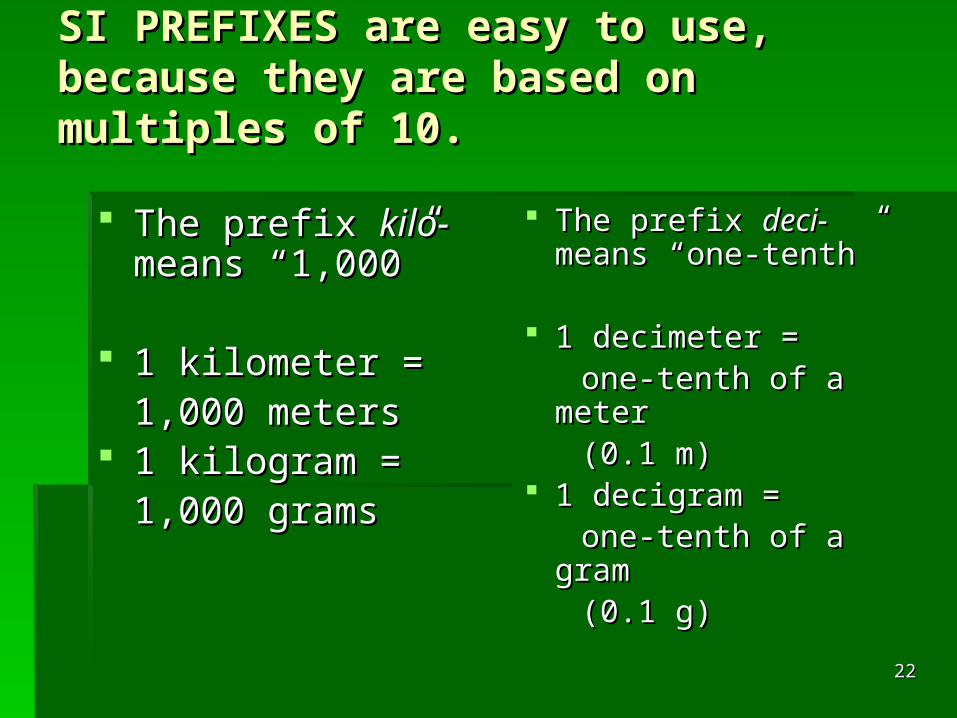
SI PREFIXES are easy to use, SI PREFIXES are easy to use, because they are based on because they are based on multiples of 10.multiples of 10.
The prefix The prefix kilo-kilo- means “1,000”means “1,000”
1 kilometer = 1 kilometer = 1,000 meters1,000 meters
1 kilogram = 1 kilogram = 1,000 grams1,000 grams
The prefix The prefix deci-deci- means “one-tenth”means “one-tenth”
1 decimeter = 1 decimeter = one-tenth of a meterone-tenth of a meter (0.1 m)(0.1 m) 1 decigram = 1 decigram = one-tenth of a gram one-tenth of a gram (0.1 g)(0.1 g)
2222

COMMON SI PREFIXESCOMMON SI PREFIXES
PREFIXPREFIX SYMBOLSYMBOL MULTIPLYING MULTIPLYING FACTORFACTOR
Kilo-Kilo- kk 1,0001,000
Hecto-Hecto- hh 100100
Deca-Deca- dada 1010
BASE UNITBASE UNIT BASE UNITBASE UNIT BASE UNITBASE UNIT
Deci-Deci- dd 0.10.1
Centi-Centi- cc 0.010.01
Milli-Milli- mm 0.0010.0012323

CONVERTING BETWEEN SI CONVERTING BETWEEN SI UNITSUNITS
Conversion factorsConversion factors are used to change are used to change one unit to another.one unit to another.
Ex. 1,000 mL = 1 LEx. 1,000 mL = 1 L
1,000 mL1,000 mL = = 1 1 LL
1 L 1 L1 L 1 L
A A conversion factorconversion factor is a ratio that is equal is a ratio that is equal to one.to one.
CFCF 1,000 mL 1,000 mL = 1 = 1
1 L1 L OROR 1L1L = 1= 1
1,000 mL1,000 mL
2424

To convert units, you To convert units, you multiply by the appropriate multiply by the appropriate conversion factor.conversion factor.
Ex. 1.255 L = ? mLEx. 1.255 L = ? mL
1.255 L x 1.255 L x 1,000mL1,000mL = =
1 L1 L
1,255 mL1,255 mL
2525

MEASURING DISTANCEMEASURING DISTANCE
The SI unit of length The SI unit of length is the meter, m.is the meter, m.
Length is measured Length is measured as the distance as the distance between 2 points. between 2 points.
2626

The size of the unit you measure with The size of the unit you measure with will depend on the size of the object will depend on the size of the object being measured.being measured. Distance from home Distance from home
to school to school
== kmkm
Length of your pencil Length of your pencil
= cm= cm
2727
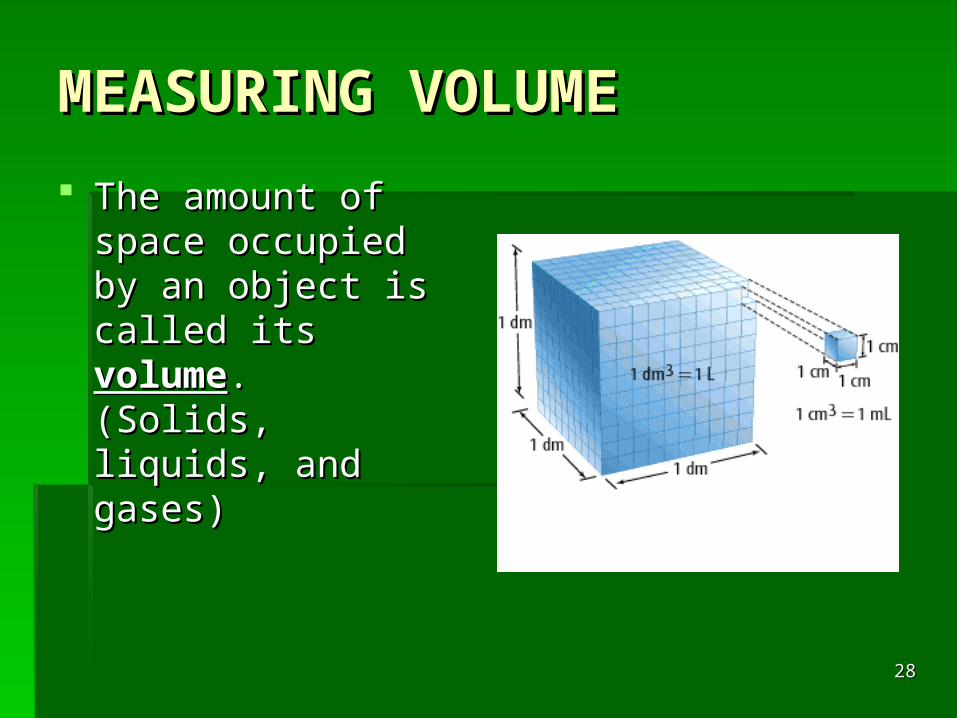
MEASURING VOLUMEMEASURING VOLUME
The amount of space The amount of space occupied by an object occupied by an object is called its is called its volumevolume. . (Solids, liquids, and (Solids, liquids, and gases)gases)
2828

Ex. VOLUME OF A BOXEx. VOLUME OF A BOX
Measure its length, width, height Measure its length, width, height MultiplyMultiply the 3 numbers and the 3 numbers and addadd their their
units togetherunits together V = l x w x hV = l x w x h
V = 13 cm x 5 cm x 3 cmV = 13 cm x 5 cm x 3 cm V = 195 cmV = 195 cm33
2929

3030
Measuring MatterMeasuring MatterMassMass is a measurement of the quantity is a measurement of the quantity of matter in an object.of matter in an object.
A table-tennis (ping pong) ball and a golf A table-tennis (ping pong) ball and a golf ball have about the same ball have about the same
volumevolume..
The golf ball has more The golf ball has more
massmass..

3131
The mass of a golf ball is The mass of a golf ball is almost 18 times the mass of a almost 18 times the mass of a ping pong ball.ping pong ball.
GOLF BALL GOLF BALL
= 45 g= 45 g
PING PONG BALLPING PONG BALL
= 2.5 g= 2.5 g

DENSITYDENSITYCubeCube of Aluminum vs. of Aluminum vs. CubeCube of of CopperCopper
Same Same
SIZESIZE
SameSame
VOLUMEVOLUME
Different Different
MASSMASS
DifferentDifferent
DENSITYDENSITY
WHAT IS DENSITY?WHAT IS DENSITY?
3232

DensityDensity is the mass per unit is the mass per unit volume of a material.volume of a material. Density (D) = Density (D) = mass (m)mass (m)
volume volume (v)(v)
D = D = 10 10 gg 2 cm2 cm33
D = 5 g/cmD = 5 g/cm33
The measurement The measurement unit for density, g/cmunit for density, g/cm33, , is a combination of SI is a combination of SI units.units.
A unit obtained by A unit obtained by combining different SI combining different SI units is called a units is called a derived unitderived unit..
3333

TIMETIME
TimeTime is the interval is the interval between 2 events.between 2 events.
The The SISI unit for time unit for time is the second. is the second.
3434

TEMPERATURETEMPERATURE
For most scientific For most scientific work, temperature is work, temperature is measured on the measured on the Celsius Celsius (C)(C) scale. scale.
The The SISI unit of unit of temperature is the temperature is the kelvinkelvin (K)(K)..
3535

THE 3 TEMPERATURE SCALESTHE 3 TEMPERATURE SCALES
FREEZING POINT FREEZING POINT OF WATEROF WATER00°C, 32°F, or 273K°C, 32°F, or 273K
BOILING POINT BOILING POINT
OF WATEROF WATER100°C, 212°F, or 100°C, 212°F, or
373K373K
3636
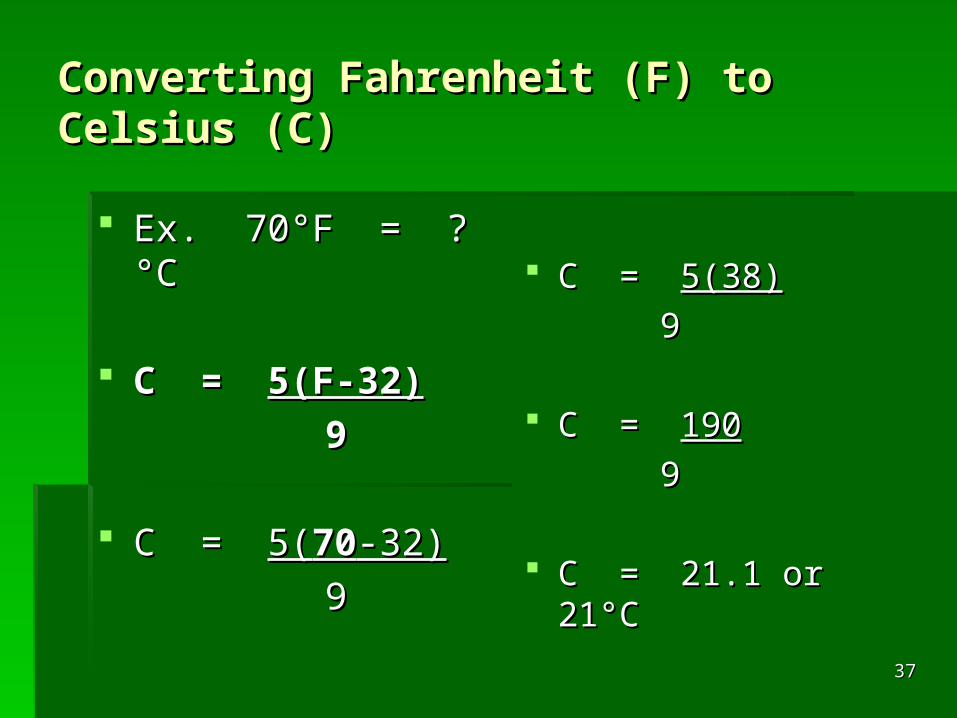
Converting Fahrenheit (F) to Converting Fahrenheit (F) to Celsius (C)Celsius (C)
Ex. 70Ex. 70°F = ? °C°F = ? °C
C = C = 5(F-32)5(F-32)
99
C = C = 5(5(7070-32)-32)
99
C = C = 5(38)5(38)
99
C = C = 190190
99
C = 21.1 or 21C = 21.1 or 21°C°C
3737

CONVERTING CELSIUS (C) TO CONVERTING CELSIUS (C) TO FAHRENHEIT (F)FAHRENHEIT (F)
Ex. 21Ex. 21°C = ? °F°C = ? °F
°F = 32 + °F = 32 + (9x°C)(9x°C)
55
°F = 32 + °F = 32 + (9x21)(9x21)
55
°F = 32 + °F = 32 + 189189
55
°F = 32 + 37.8°F = 32 + 37.8
°F = 69.8 or 70°F°F = 69.8 or 70°F
3838

CHAPTER 1: THE CHAPTER 1: THE NATURE OF SCIENCENATURE OF SCIENCE
Section 3—Communicating with Section 3—Communicating with GraphsGraphs
3939

A VISUAL DISPLAYA VISUAL DISPLAY
Scientists often graph Scientists often graph the results of their the results of their experiments because experiments because they can detect they can detect patternspatterns in the data in the data easier in a graph than easier in a graph than in a table.in a table.
A A graphgraph is a visual is a visual display of information display of information or data.or data.
Why are graphs Why are graphs important?important?
Graphs are a quick Graphs are a quick way to communicate way to communicate a lot of information in a lot of information in a small amount of a small amount of space.space.
4040

There are 3 types of There are 3 types of graphs---line, bar, and circle graphs---line, bar, and circle (pie).(pie).
LineLine graphs graphs show show how a relationship how a relationship between variables between variables changes over changes over time.time.
4141

Bar GraphsBar Graphs
A A barbar graph is useful for graph is useful for comparing comparing information information collected by collected by counting.counting.
4242

Circle GraphsCircle Graphs
A A circlecircle graph or pie graph or pie graph is used to show graph is used to show how some fixed how some fixed quantity is broken quantity is broken down into parts. down into parts.
The circular pie The circular pie represents the represents the totaltotal. .
The slices represent The slices represent the the parts parts (percentages of the (percentages of the total).total).
4343