Embed Size (px)
Citation preview

Journal of
Physical Education and Sport
Management Volume 8 Number 1 January 2017
ISSN 1996-0794

.
ABOUT JPESM
Journal of Physical Education and Sport Management (JPESM) is published once a month (one volume per year) by Academic Journals.
Journal of Physical Education and Sport Management (JPESM) is an open access journal that provides rapid publication (monthly) of articles in all areas of the
subject such as physical fitness ,sports agent laws ,sport organization, health care etc.
The Journal welcomes the submission of manuscripts that meet the general criteria of
significance and scientific excellence. Papers will be published shortly after acceptance. All articles published in JPESM are peer - reviewed.
Contact Us
Editorial Office: [email protected]
Help Desk: [email protected]
Website: http://www.academicjournals.org/journal/JPESM
Submit manuscript online http://ms.academicjournals.me/

Editors
Prof. Chung Pak-kwong
Head, Department of Physical Education Hong Kong Baptist University, Hong Kong.
Prof. Nader Rahnama Department of Nutrition, Food and Exercise Sciences, 424 Sandels Building,
Florida State University, Tallahassee, FL 32306, USA.
Dr. Van Hung College of Education, Vietnam National University, Hanoi
CauGiay Dist, Hanoi, Vietnam.

Editorial Board
Nikolaos Digelidis Assistant Professor
LLP-Erasmus Departmental Co-ordinator Member of the Institutional Committee of International
Affairs University of Thessaly Department of Physical Education and Sport Science
Karies, GR-42100 Trikala Greece
Prof. Zan Gao Department of Health, Exercise and Sport Science Texas Tech University Box 43011, 105 PrinTech Lubbock, TX 79409-3011
Prof. Me. Fabio Scorsolini-Comin
Department Of Developmental Psychology, Education and Labor
Institute Of Education, Humanities, Arts, Humanities And Social Sciences University Of Delta Mining (Uftm) Guaritá Vargas Avenue, 159, Abbey Cep: 38025-440
Uberaba - Mg Brazil
Prof. Maycon de Moura Reboredo Federal University of Juiz de Fora
Brazil
Aldo M. Costa Assistant Professor University of Beira Interior Department of Sport Sciences, Covilhã,Portugal Portugal
Dr. GV Krishnaveni Epidemiology Research Unit
Holdsworth Memorial Hospital Mysore 570021 Ph: 0821 2529347
India. Prof. Sydney Schaefer Program in Physical Therapy Washington University School of Medicine
United States
Dr. Alexandra Lopes University of Porto Via Panorâmica s/n 4150-564 Porto
Portugal.
Prof. Daniel A. Marinho University of Beira Interior/CIDESD, Covilhã.
Portugal Prof. Mª José Martínez Zapata, MD Centro Cochrane Iberoamericano-Servicio de Epidemiologia Clínica
IIB Sant Pau. Sant Antoni Mª Claret, 171. Barcelona 08041.
Prof. Teresa F. Amaral Nutritionist Faculty of Nutrition and Food Sciences, University of Porto & System Integration and Process
Automation UISPA-IDMEC, University of Porto Rua Dr. Roberto Frias 4200-465 Porto, Portugal

ARTICLE
Electrochemical and optical band gaps of bimetallic silver-platinum varying metal ratios nanoparticles 1 Seo H. Lee and Samuel R. Hodge
Journal of Physical Education and Sport Management
Table of Contents: Volume 8 Number 1 January 2017

Vol. 11(1), pp. 1-8, January, 2017
DOI: 10.5897/AJPAC2016.0700
Article Number: D85668762527
ISSN 1996 - 0840 Copyright © 2017
Author(s) retain the copyright of this article
http://www.academicjournals.org/AJPAC
African Journal of Pure and Applied
Chemistry
Full Length Research Paper
Electrochemical and optical band gaps of bimetallic silver-platinum varying metal ratios nanoparticles
Fredrick O. Okumu and Mangaka C. Matoetoe*
Department of Chemistry, Cape Peninsula University of Technology, Tenant Road, P. O. Box 652. Zonnebloem, Cape Town, South Africa.
Received 9 August, 2016; Accepted 3 November, 2016
Simultaneous citrate reduction of various ratios of silver and platinum ions leads to the formation of core-shell nanostructured bimetallics (BM). Transmission electron microscopy (TEM) and X-ray
diffraction XRD data of the BMs depicted crystalline core-shell nanoparticles consisting of Ag core and Pt shell with an average size of 22.2 nm in contrast to the Pt NPs and Ag NPs monometallics average sizes of 2.5 and 60.0 nm respectively. Tauc’s calculated optical band gaps ranged from 3.55 to 4.02 eV
while the electrochemical based on Breda’s equation had a range of 1.45 to 1.80 eV. These band gaps range variation maybe due to inter atomic interaction, morphology and quantum confinement. Generally, bimetallics had higher band gaps relative to monometallics. The Ag: Pt ratio of 3:1 had the
highest optical band gap and the smallest particle size. While the ratio of 1:3 had the highest electrochemical band gap as well as the largest particle size among the BMs. Suggesting band gap dependence on amount of Ag and Pt for optical and electrochemical respectively.
Key words: Optical, electrochemical, band gaps, bimetallic, nanoparticles.
INTRODUCTION
The design and synthesis of bimetallic nanomaterials (BM) have received considerable interest because of their myriad properties and applications in optics,
magnetism, catalysis, and others, due to their high tenability and superior features compared with those of their monometallic counterparts (Chen et al., 2011). BMs
may form core-shell structures, heterostructures, and alloy nanocrystals, this formation diversity increases the mass specific activity (MSA) of the nanoparticles while
also minimizing the cost by using precious metals only on
the surface of the particles (Shi et al., 2013; Khanal et al., 2012). Nanomaterials properties strongly depend on their size, structure and morphology (Camargo et al., 2007;
Fan et al., 2008). Size provides an important control over many of the physical and chemical properties of nanoscale materials including luminescence,
conductivity, and catalytic activity (Chatenet et al., 2003). Past studies have focused on the control of particle´s size and their self-assembly into various dimensional lattice
structure. Lately, effort has been devoted into the
*Corresponding author. E-mail: [email protected].
Author(s) agree that this article remain permanently open access under the terms of the Creative Commons Attribution
License 4.0 International License

2 Afr. J. Pure Appl. Chem.
preparation of bimetallic nanoparticles with controlled composition distribution (Antolini et al., 2008; Hirakawa, 2012). Design and control of the spatial arrangement of
both metals in bimetallic nanoparticles are critical for exploiting their potential applications (Lieber, 1998). The coupling between the particles leads to interface
formation, which can result in changes of electronic and optical properties.
Among the wide range of BM systems, Ag-Pt
compositions has been extensively studied because Ag has the highest optical cross section of any metal but it is easily oxidised while Pt´s catalytic activity for both
methanol oxidation reaction (MOR) and oxygen reduction reaction (ORR) in direct methanol fuel is hampered by CO poisoning (Antolini et al., 2008). Therefore, BM
technology of these metals has concentrated in finding means of countering their problems. Various forms of Ag-Pt such as stellated, heterostructures, core-shell and
alloys have been reported. However, they are limited reports on the detailed causes of their improved properties as well as the effects of metal ratio variations.
Most of the common applications of bimetallization are in catalysis for example, the use of Ag-Pt BM NPs in catalytic decomposition of hydrogen peroxide (Hirakawa,
2012) and as catalysts for oxygen cathodes in chlor-alkali electrolysis (Lieber, 1998). In addition, silver-platinum bimetallics have been studied in recent years as lead-free
soldier materials (Nousiainen et al., 2007; Nousialanen et al., 2005). Other reports are on the catalytic behaviour of the Pt-Ag alloy nanoparticles electrooxidation of formic
acid (Xu et al., 2008). Few studies have reported optical and electrochemical
band gaps (Beaupre and Leclerc, 2002; Johansson et al.,
2003) of nanomaterials. Optical spectroscopy studies of nanoparticles demonstrate their atom like discrete level structure by showing very narrow transition line widths
(Empedocles et al., 1996; Banin et al., 1998). Optical techniques like optical absorption or luminescence spectrum probe the allowed transitions between valence
and conduction band states for nanoparticles which do not have defect or impurity states in the energy gap. However, the interpretation of optical spectra often is not
straightforward and needs correlation with theoretical models (Ekimov et al., 1993; Fu et al., 1998). Cyclic voltammetry (CV) is an effective technique for studying
the electroactivity of nanofilms. In addition, CV is also one of the most useful methods to estimate the band gap energies (Andrade et al., 2005; Al-Ibrahim et al., 2005).
Under CV, the oxidation and reduction peaks can be correlated directly to electron transfer at highest occupied molecular orbital (HOMO) and lowest unoccupied
molecular orbital (LUMO), respectively (Haram et al., 2001). These can be measured by obtaining the redox potentials Ered and Eox and the values used to evaluate
the band gap. Detailed understanding of the electrochemical and optical properties of metal nanoparticles band gaps is important from a fundamental
science point of view and gives a valuable insight into the structural size effects of the new materials potential application as conductors or electrocatalysts. The
knowledge is valuable in selection of suitable materials in solar cell devices and fabrication of light emitting diodes (Liu et al., 2001; Pei et al., 2000). Band gaps can be used
to determine purity of materials as well as in designing fabrication of devices (sensors and photocatalysts). However, direct observation of the band gap variation
from UV-visible and electrochemistry with particle size is relatively rarely discussed.
In this article, a comparative band gap study was made
using both optical absorption and electrochemical measurements based on their theoretical calculations from Tauc and Breda models respectively. The influence
of the nanofilms on the optical and electrochemical band gap properties was investigated in detail using CV. The core-shell structure of the bimetallic Ag-Pt nanoparticles
was depicted by TEM images and XRD. This provides understanding of the Ag-Pt NPs BM size relationship to band gaps.
EXPERIM ENTAL METHODS
Ag NPs, Pt NPs and bimetallic Ag-Pt NPs ratios (1:1, 1:3 and 3:1)
w ere synthesized via chemical reduction of H2PtCl6·6H2O in
aqueous solution w ith trisodium citrate (Na3C6H5O7) as reducing
agent according to described procedures (Okumu and Matoetoe,
2016). A one-pot synthesis approach w as used for the synthesis of
bimetallic Ag-Pt NPs. A Cary 300 dual-beam spectrophotometer
using 1 cm quartz cuvette in the w avelength range of 200 to 800
nm w as used for UV-visible absorption. The nanoparticle w ater
suspensions spectra w ere obtained and Tauc’s model utilised for
optical band gap calculations. While electrochemically,
nanoparticle modif ied electrodes w ere used to study the
electrochemical band gaps. Cyclic voltammograms of modif ied
glassy carbon electrode w ere run using Autolab PGSTAT 101
(Metrohm, South Africa) w ork station. A conventional three-
electrode system consisting of nanomaterials modif ied glassy
carbon electrode (GCE) w as used as the w orking electrode (A =
0.071 cm2), a platinum w ire (3 mm diameter) from Metrohm SA and
Ag/AgCl (3 M KCl) electrodes from BAS w ere used as auxiliary and
reference electrodes respectively. Alumina micropow der and
polishing pads w ere purchased from United Scientif ic (SA) and
used for polishing of the GCE prior to modif ication. All
electrochemical experiments w ere carried out at room temperature
(25°C) in 0.1 M phosphate buffer solution (PBS) pH 7.0, purged
w ith high purity nitrogen gas (Afrox, South Africa) for 5 min and
blanketed w ith nitrogen atmosphere during measurements. All
potentials w ere quoted w ith respect to Ag/AgCl. Nanoparticles
suspensions w ere drop coated on the surface of polished GCE and
their CV carried out in 0.1 M PBS pH 7.0 as a supporting
electrolyte. Deionised w ater purif ied by a milli-QTM system
(Millipore) w as used for aqueous solution preparation. The
corresponding voltammograms w ere analysed using Bredas
equation. X-ray diffraction (XRD) studies of the NPs w as performed
by using a Bruker AXS D8 Advance diffractometer w ith Cu Kα
radiation over the scanning range 2θ = 20° - 90° at a voltage of 40
kV and 40 mA. The particle size distribution studies of the NPs w ere
performed using a high resolution transmission electron microscope
(HRTEM) from Tecnai G2F20 X-Tw in MAT (US). For TEM, samples
w ere prepared by placing a drop of w orking solution on a carbon-

Okumu and Matoetoe 3
Figure 1. XRD patterns of (a) Ag NPs, (b) Pt NPs and (c to e) BM Ag-Pt
NPs (1:1, 1:3 and 3:1) respectively.
coated standard copper grid (300 mesh) operating at 80 kV. RESULTS AND DISCUSSION
X-ray diffraction studies of the prepared BM Ag-Pt NPs
The XRD patterns of Ag NPs, Pt NPs and bimetallic Ag-Pt nanoparticles are shown in Figure 1a to e. XRD
pattern of Ag NPs (Figure 1a) showed clear characteristic peaks of face centred cubic (fcc) planes at 38.08° (111), 44.18° (200), 64.30° (220), 77.23° (311) and 81.59° (222)
as similarly reported (Peng and Yang, 2008) indicating the crystalline nature of silver nanoparticles. The XRD spectrum of Pt NPs contained multiple peaks that are
clearly distinguishable, the peaks with 2θ values of 33.89°, 45.78°, 66.58° and 84.22° correspond to the 111, 200, 220 and 222 crystal planes of fcc structure
respectively as reported (Jingyu et al., 2007; Yang et al., 2008). In the Pt NPs diffraction pattern, the broad peak observed at about 24° belonged to the graphitic carbon
used as the support. In contrast, the XRD patterns of the bimetallic Ag-Pt NPs (Figure 1c to e) are a superimposition of the two components of Ag core and a
relatively crystalline Pt shell. All three bimetallic Ag-Pt nanoparticles showed
common diffraction peaks around 2θ angles 32.85°,
45.77°, 66.58° and 76.85° that could be indexed to 111, 200, 220 and 311 planes of a fcc lattice. This reflected that the resultant crystalline phase of the bimetallic NPs
was intact throughout. Other diffraction peaks observed
were attributed to the support material used during analysis. The diffraction pattern of the three bimetallic Ag-Pt nanoparticles displayed mostly the reflection
characteristics of both Ag and Pt NPs fcc structure. Although all the BM XRD patterns indicated double peaks except for the (111) planes as a result of the close
proximity of the Ag and Pt peaks as well as the core shell morphology. However, the diffraction peaks shifted slightly to higher 2θ values relative to the same
reflections on monometallic factions maybe due to lower d spacing as a result of inter-atomic interactions between the atoms thus altering the d spacing arrangement. The
relative peak intensities increased in the diffraction patterns of BM Ag-Pt nanoparticles. This diffraction peak shift to higher 2θ angles was proportional to increase of
Ag ratio in the BM; hence the molar ratio (3:1) was the most deflected. The BM NPs crystallinity reported in this work corroborates TEM results and previously reported
studies (Okumu and Matoetoe, 2016).
Transmission electron microscopy Typical HR-TEM images with low magnifications for Ag,
Pt and Ag-Pt BM NPs ratios (1:1, 3:1 and 1:3) are depicted in Figure 2. The Ag NPs showed uneven sphere-stacked aggregation (Figure 2a) with average
diameter of 60 nm while Pt NPs were dispersed and smaller in sizes. The BM Ag-Pt NPs various ratios particle sizes were dependent on outer Pt NPs (shell),
this phenomenon has been reported before in Okumu and Matoetoe (2016). The Pt shell nanoparticles are

4 Afr. J. Pure Appl. Chem.
Figure 2. TEM micrographs of (a) Ag NPs; (b) Pt NPs nanoparticles, Ag-Pt nanoparticles in the ratio; (c) 1:1; (d) 1:3,
and (e) 3:1.
Table 1. Comparison of band gaps and TEM sizes of synthesised NPs.
NPs Eoxonset
Eredonset
ELUMO EHOMO EgCV
(eV) Egopt
(eV) Particle size (nm) (TEM)
Ag -0.50 0.95 -3.90 -5.35 1.45 3.96 60.0 ± 9.4
Pt -0.60 0.95 -3.40 -5.35 1.55 3.55 2.5 ± 0.5
Ag-Pt 1:1 -0.60 1.00 -3.40 -5.00 1.60 3.94 20.7 ± 9.0
Ag-Pt 1:3 -0.90 0.90 -3.50 -5.30 1.80 3.97 25.0 ± 5.0
Ag-Pt 3:1 -0.60 0.90 -3.50 -5.30 1.50 4.02 21.7 ± 7.6
denser compared to the Ag core in all BM Ag-Pt nanostructures judging by their distribution (Figure 2).
The reduction on the Pt precursor forming Pt shell around Ag NPs hindered the particle growth of the Ag. This explains the BM Ag-Pt NPs varying ratios size reduction.
The introduction of molar ratios (AgNO3/PtCl62-
) resulted in an average diameter of about 20 nm particles. TEM study reported the average sizes of Ag NPs, Pt NPs and
bimetallic Ag-Pt NPs as in Table 1.
Optical band gap studies Correlation of nanoparticles optical properties of Ag, Pt
and Ag-Pt bimetallic NPs (1:1, 1:3 and 3:1), systematic optical absorption studies were carried out. The fundamental absorption, which corresponds to electron
excitation from the valence band to conduction band, was used to determine the band gaps. The band gap value, Eg in this study was determined using Tauc’s relation
(Tauc et al., 1966),
(1) n
ghv A hv E
(1)
Where α is the absorption coefficient, hν is the photon
energy, A is a fixed constant and exponent n whose value depends upon the type of transition, which
may have the values 1/2, 2, 3/2 and 3 for allowed direct, allowed indirect, forbidden direct, and forbidden indirect
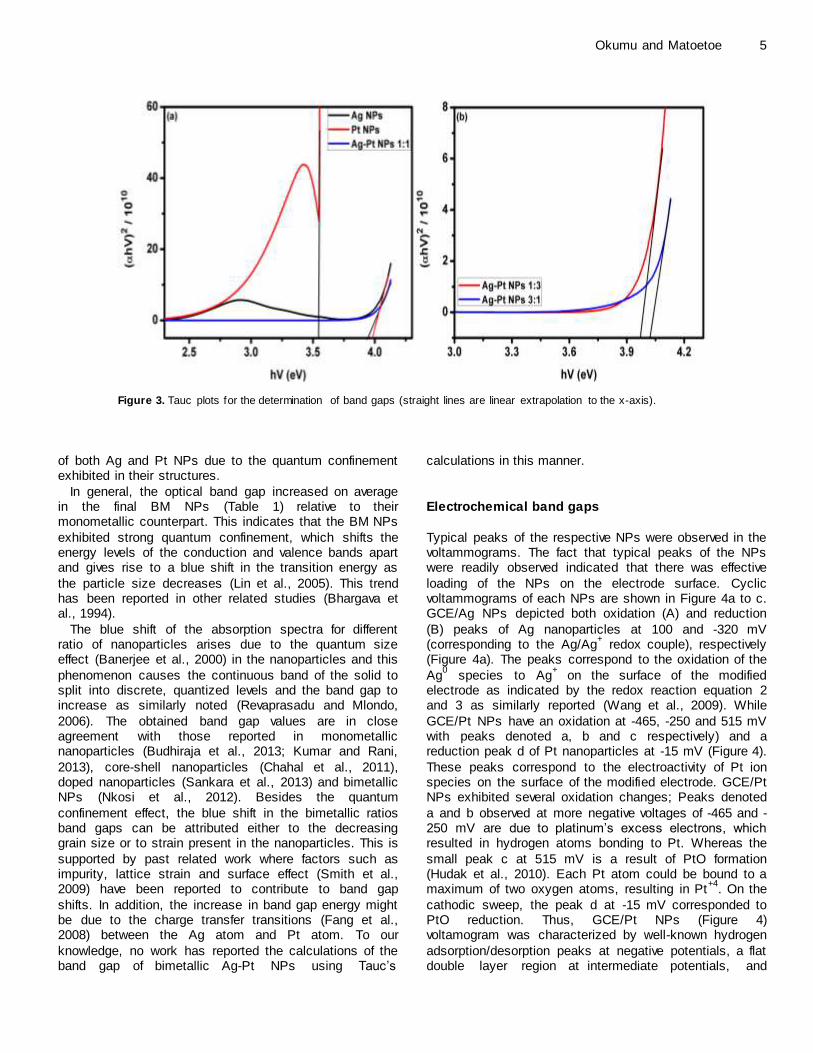
transitions, respectively (Pankove, 1971). Figure 3 depicts Tauc´s plots and band gaps (Eg), at a point where the straight portion of (αhv)
2 versus hv plot is
extrapolated to the x-axis. The optical band gaps increased from 3.96 eV for Ag
NPs, to about 4.02 eV for the BM nanoparticles at higher
concentration of silver (Table 1). These increases in optical band gaps explain the changes in UV-visible spectra and clearly indicate a progressive metallization of
samples caused by the Ag doping. This suggests that the band gap is mainly determined by the lateral confinement. Similarly, Pt NPs band gap of 3.55 eV had a
blue shift in the Pt higher concentrated BM nanoparticles (1:3) at 3.97 eV. From Figure 3, it was observed that an increase in Ag molar concentration resulted in increased
Ag-Pt NPs 3:1 band gap energy. A similar observation was noted by Salem (Salem, 2014) in Ag-doped CdO nanoparticles. The Eg values for BM Ag-Pt 1:1 NPs was
found to be lower than Ag NPs. This decrease in the value of Eg can be attributed to the formation of bonds between Ag and Pt NPs, which form the trap levels
between the HOMO and LUMO energy states, making the lower energy transitions feasible thus resulting in the reduction of optical band gap, which is in line with past-
discussed work (Chahal et al., 2011). In the case of BM Ag-Pt 1:3 and 3:1, their band gaps were larger than that
Okumu and Matoetoe 5
Figure 3. Tauc plots for the determination of band gaps (straight lines are linear extrapolation to the x-axis).
of both Ag and Pt NPs due to the quantum confinement exhibited in their structures.
In general, the optical band gap increased on average in the final BM NPs (Table 1) relative to their monometallic counterpart. This indicates that the BM NPs
exhibited strong quantum confinement, which shifts the energy levels of the conduction and valence bands apart and gives rise to a blue shift in the transition energy as
the particle size decreases (Lin et al., 2005). This trend has been reported in other related studies (Bhargava et al., 1994).
The blue shift of the absorption spectra for different ratio of nanoparticles arises due to the quantum size effect (Banerjee et al., 2000) in the nanoparticles and this
phenomenon causes the continuous band of the solid to split into discrete, quantized levels and the band gap to increase as similarly noted (Revaprasadu and Mlondo,
2006). The obtained band gap values are in close agreement with those reported in monometallic nanoparticles (Budhiraja et al., 2013; Kumar and Rani,
2013), core-shell nanoparticles (Chahal et al., 2011), doped nanoparticles (Sankara et al., 2013) and bimetallic NPs (Nkosi et al., 2012). Besides the quantum
confinement effect, the blue shift in the bimetallic ratios band gaps can be attributed either to the decreasing grain size or to strain present in the nanoparticles. This is
supported by past related work where factors such as impurity, lattice strain and surface effect (Smith et al., 2009) have been reported to contribute to band gap
shifts. In addition, the increase in band gap energy might be due to the charge transfer transitions (Fang et al., 2008) between the Ag atom and Pt atom. To our
knowledge, no work has reported the calculations of the band gap of bimetallic Ag-Pt NPs using Tauc’s
calculations in this manner.
Electrochemical band gaps
Typical peaks of the respective NPs were observed in the voltammograms. The fact that typical peaks of the NPs were readily observed indicated that there was effective
loading of the NPs on the electrode surface. Cyclic voltammograms of each NPs are shown in Figure 4a to c. GCE/Ag NPs depicted both oxidation (A) and reduction
(B) peaks of Ag nanoparticles at 100 and -320 mV (corresponding to the Ag/Ag
+ redox couple), respectively
(Figure 4a). The peaks correspond to the oxidation of the
Ag0 species to Ag
+ on the surface of the modified
electrode as indicated by the redox reaction equation 2 and 3 as similarly reported (Wang et al., 2009). While
GCE/Pt NPs have an oxidation at -465, -250 and 515 mV with peaks denoted a, b and c respectively) and a reduction peak d of Pt nanoparticles at -15 mV (Figure 4).
These peaks correspond to the electroactivity of Pt ion
species on the surface of the modified electrode. GCE/Pt NPs exhibited several oxidation changes; Peaks denoted
a and b observed at more negative voltages of -465 and -250 mV are due to platinum’s excess electrons, which resulted in hydrogen atoms bonding to Pt. Whereas the
small peak c at 515 mV is a result of PtO formation (Hudak et al., 2010). Each Pt atom could be bound to a maximum of two oxygen atoms, resulting in Pt
+4. On the
cathodic sweep, the peak d at -15 mV corresponded to PtO reduction. Thus, GCE/Pt NPs (Figure 4) voltamogram was characterized by well-known hydrogen
adsorption/desorption peaks at negative potentials, a flat double layer region at intermediate potentials, and

6 Afr. J. Pure Appl. Chem.
Figure 4. Cyclic voltammograms of (a) monometallic modif ications, (c) Ag-Pt NPs 1:1 modif ication and (c) bimetallic
modif ication on GCE in 0.1 M PBS pH 7.0. Scan rate: 20 mV/s.
platinum oxide formation and reduction peaks at positive potentials which are expressed by Equation 3 to 6 (Guo et al., 2012).
The BM Voltamograms clearly show presence of both metals as shown from Figure 4b and c. Both GCE/Ag-Pt NPs (1:1 and 1:3) shown in Figure 3b and c have 1
cathodic peak denoted c and C at -54 and -30 mV respectively as well as 2 anodic peaks observed at 70 and 535 mV for 1:1 and at -630 and 710 mV for 1:3. The
Ag NPs redox couple contribution is seen at 54 and 70 mV for 1:1 while only the cathodic peak C was indicative of Ag NPs in 1:3. Other peaks at 535 mV (1:1) and -630
and 710 mV (1:3) are attributed to Pt NPs equations 6
and 7. On the other hand, GCE/Ag-Pt NPs 3:1 showed two peaks (A″ and B″), which are typical of Ag NPs redox couple (equations 2 and 3) suggesting major contribution
by Ag as similarly shown in the molar ratio. It was interesting to note that, for the Ag-Pt bimetallic nanoparticles, only one reduction and one oxidation peak
was observed. This was possibly due to a quantum confinement effect (Yang et al., 1995) which was more in the BM. This suggests that the Ag-Pt bimetallic
nanoparticles were composed of atomically mixed Ag and Pt and not composed of their metal domains. The various reactions taking place for the redox peaks observed were
deduced as follows:
0 (2)Ag Ag e
0 (3)Ag e Ag
(4)adsPt H e Pt H
(5)adsPt H Pt H e
2 2 (6)Pt O e PtO
2 2 (7)PtO Pt O e
(2)
0 (2)Ag Ag e
0 (3)Ag e Ag
(4)adsPt H e Pt H
(5)adsPt H Pt H e
2 2 (6)Pt O e PtO
2 2 (7)PtO Pt O e
(3)
0 (2)Ag Ag e
0 (3)Ag e Ag
(4)adsPt H e Pt H
(5)adsPt H Pt H e
2 2 (6)Pt O e PtO
2 2 (7)PtO Pt O e
(4)
0 (2)Ag Ag e
0 (3)Ag e Ag
(4)adsPt H e Pt H
(5)adsPt H Pt H e
2 2 (6)Pt O e PtO
2 2 (7)PtO Pt O e
(5)
0 (2)Ag Ag e
0 (3)Ag e Ag
(4)adsPt H e Pt H
(5)adsPt H Pt H e
2 2 (6)Pt O e PtO
2 2 (7)PtO Pt O e
(6)
0 (2)Ag Ag e
0 (3)Ag e Ag
(4)adsPt H e Pt H
(5)adsPt H Pt H e
2 2 (6)Pt O e PtO
2 2 (7)PtO Pt O e (7)
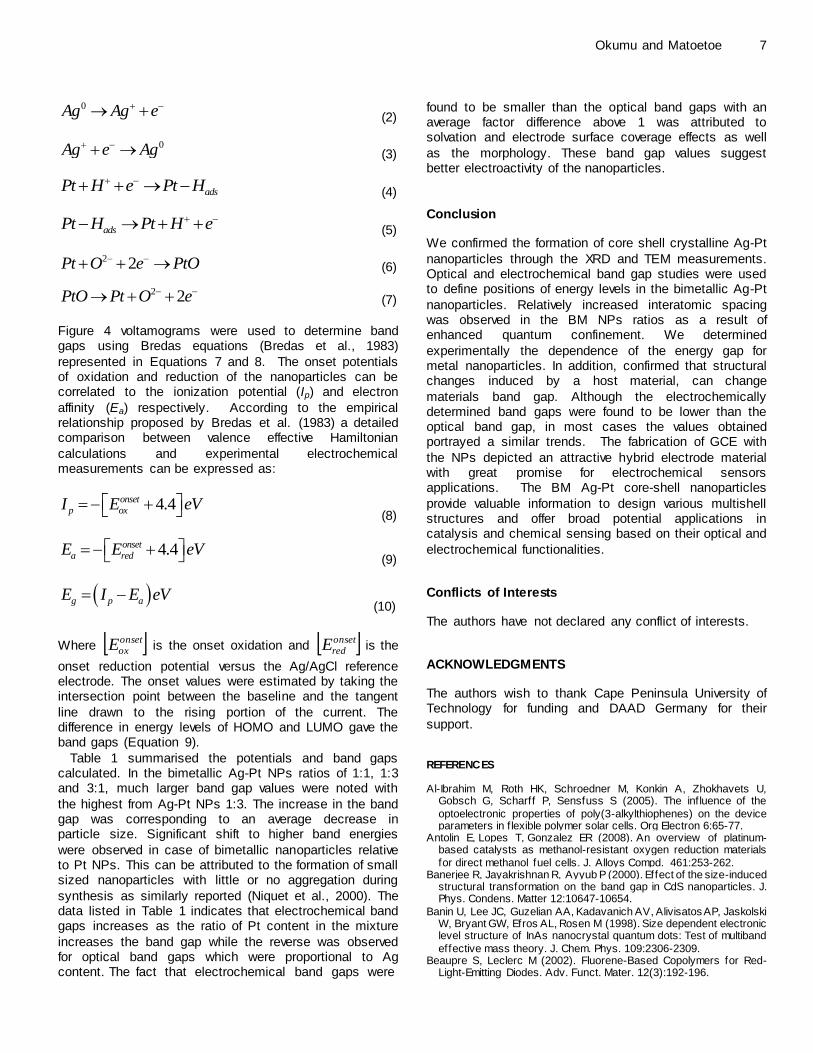
Figure 4 voltamograms were used to determine band gaps using Bredas equations (Bredas et al., 1983)
represented in Equations 7 and 8. The onset potentials of oxidation and reduction of the nanoparticles can be correlated to the ionization potential (Ip) and electron
affinity (Ea) respectively. According to the empirical relationship proposed by Bredas et al. (1983) a detailed comparison between valence effective Hamiltonian
calculations and experimental electrochemical measurements can be expressed as:
4.4 (8)onset
p oxI E eV
4.4 (9)onset
a redE E eV
(9)g p aE I E eV
(8)
4.4 (8)onset
p oxI E eV
4.4 (9)onset
a redE E eV
(9)g p aE I E eV
(9)
4.4 (8)onset
p oxI E eV
4.4 (9)onset
a redE E eV
(9)g p aE I E eV (10)
Where onsetoxE is the onset oxidation and onset
redE is the
onset reduction potential versus the Ag/AgCl reference electrode. The onset values were estimated by taking the intersection point between the baseline and the tangent
line drawn to the rising portion of the current. The difference in energy levels of HOMO and LUMO gave the band gaps (Equation 9).
Table 1 summarised the potentials and band gaps calculated. In the bimetallic Ag-Pt NPs ratios of 1:1, 1:3 and 3:1, much larger band gap values were noted with
the highest from Ag-Pt NPs 1:3. The increase in the band gap was corresponding to an average decrease in particle size. Significant shift to higher band energies
were observed in case of bimetallic nanoparticles relative to Pt NPs. This can be attributed to the formation of small sized nanoparticles with little or no aggregation during
synthesis as similarly reported (Niquet et al., 2000). The data listed in Table 1 indicates that electrochemical band gaps increases as the ratio of Pt content in the mixture
increases the band gap while the reverse was observed for optical band gaps which were proportional to Ag content. The fact that electrochemical band gaps were
Okumu and Matoetoe 7
found to be smaller than the optical band gaps with an average factor difference above 1 was attributed to solvation and electrode surface coverage effects as well
as the morphology. These band gap values suggest better electroactivity of the nanoparticles.
Conclusion
We confirmed the formation of core shell crystalline Ag-Pt
nanoparticles through the XRD and TEM measurements. Optical and electrochemical band gap studies were used to define positions of energy levels in the bimetallic Ag-Pt
nanoparticles. Relatively increased interatomic spacing was observed in the BM NPs ratios as a result of enhanced quantum confinement. We determined
experimentally the dependence of the energy gap for metal nanoparticles. In addition, confirmed that structural changes induced by a host material, can change
materials band gap. Although the electrochemically determined band gaps were found to be lower than the optical band gap, in most cases the values obtained portrayed a similar trends. The fabrication of GCE with
the NPs depicted an attractive hybrid electrode material with great promise for electrochemical sensors applications. The BM Ag-Pt core-shell nanoparticles
provide valuable information to design various multishell structures and offer broad potential applications in catalysis and chemical sensing based on their optical and
electrochemical functionalities.
Conflicts of Interests
The authors have not declared any conflict of interests.
ACKNOWLEDGMENTS
The authors wish to thank Cape Peninsula University of Technology for funding and DAAD Germany for their
support. REFERENCES Al-Ibrahim M, Roth HK, Schroedner M, Konkin A, Zhokhavets U,
Gobsch G, Scharff P, Sensfuss S (2005). The influence of the
optoelectronic properties of poly(3-alkylthiophenes) on the device parameters in f lexible polymer solar cells. Org Electron 6:65-77.
Antolin E, Lopes T, Gonzalez ER (2008). An overview of platinum-based catalysts as methanol-resistant oxygen reduction materials
for direct methanol fuel cells. J. Alloys Compd. 461:253-262. Banerjee R, Jayakrishnan R, Ayyub P (2000). Effect of the size-induced
structural transformation on the band gap in CdS nanoparticles. J. Phys. Condens. Matter 12:10647-10654.
Banin U, Lee JC, Guzelian AA, Kadavanich AV, Alivisatos AP, Jaskolski W, Bryant GW, Efros AL, Rosen M (1998). Size dependent electronic level structure of InAs nanocrystal quantum dots: Test of multiband
effective mass theory. J. Chem. Phys. 109:2306-2309. Beaupre S, Leclerc M (2002). Fluorene-Based Copolymers for Red-
Light-Emitting Diodes. Adv. Funct. Mater. 12(3):192-196.

8 Afr. J. Pure Appl. Chem.
Bhargava RN, Gallagher D, Hong X, Nurmikko A (1994). Optical
properties of manganese-doped nanocrystals of ZnS. Phys. Rev. Lett. 72:416 -419
Bredas JL, Silbey R, oudreux DS, Chance RR (1983). Chain-length dependence of electronic and electrochemical properties of conjugated systems: polyacetylene, polyphenylene, polythiophene, and polypyrrole. J. Am. Chem. Soc. 105(22):6555-6559.
Budhiraja N, Sharma A, Dahiya S, Parmar R, Vidyadharan V (2013). Synthesis and Optical Characteristics of Silver Nanoparticles on Different Substrates. Int. Lett. Chem. Phys. Astron. 14:80-88.
Camargo PHC, Xiong Y, Ji L, Zuo JM , Xia Y (2007). Facile synthesis
of tadpole-like nanostructures consisting of Au heads and Pd tails. J. Am. Chem. Soc. 129:15452-15453.
Chahal RP, Mahendia S, Tomar AK, Kumar S (2011). Effect of ultraviolet irradiation on the optical and structural characteristics of in-
situ prepared PVP-Ag nanocomposite. Digest J. Nanomater. Biostruct. 6(1):299-306.
Chatenet M, Aurousseau M, Durand R, Andolfatto F (2003). Silver-
platinum bimetallic catalysts for oxygen cathodes in chlor-alkali electrolysis: Comparison w ith pure platinum. J Electrochem. Soc.150(3):D47–D55.
Chen GD, Stefano D, Nechache R, Rosei R, Rosei F, Ma DL (2011).
Bifunctional catalytic/magnetic Ni@Ru core-shell nanoparticles. Chem. Commun. 47:6308–6310.
D’Andrade BW, Datta S, Forrest SR, Djurovich P, Polikarpov E, Thompson ME (2005). Relationship betw een the ionization and
oxidation potentials of molecular organic semiconductors. Org. Electron. 6(1):11-20
Ekimov AI, Hache F, Schanne-Klein MC, Ricard D, Flytzanis C, Kudryavtsev IA, Yazeva TV, Rodina AV, Efros AL (1993). Absorption
and intensity-dependent photoluminescence measurements on CdSe quantum dots: assignment of the f irst electronic transitions. J. Opt. Soc. Am. B 10:100-107.
Empedocles SA, Norris DJ, Baw endi MG (1996). Photoluminescence
Spectroscopy of Single CdSe Nanocrystallite Quantum Dots. Phys. Rev. Lett. 77(18):3873-3876.
Fan FR, Liu DY, Wu YF, Duan S, Xie ZX, Jiang ZY, Tian ZQ (2008).
Epitaxial grow th of heterogeneous metal nanocrystals: from gold nano-octahedra to palladium and silver nanocubes. J. Am. Chem. Soc. 130:6949-6951.
Fang MM, Zu XT, Li ZJ, Zhu S, Liu CM, Zhou WL, Wang LM (2008).
Synthesis and characteristics of Fe3+-doped SnO2 nanoparticles via sol–gel-calcination or sol–gel-hydrothermal routeOriginal. J. Alloys Compd. 454:261-267.
Fu H, Wang LW, Zunger A (1998). On the applicability of the k.p
method to the electronic structure of quantum dots. Phys. Rev. B 57:9971-9987.
Guo MQ, Hong HS, Tang XN, Fang HD, Xu XH (2012). Ultrasonic electrodeposition of platinum nanoflow ers and their application in
nonenzymatic glucose sensors. Electrochim. Acta. 63:1-8. Haram SK, Quinn BM, Bard AJ (2001). Electrochemistry of CdS
nanoparticles: a correlation betw een optical and electrochemical
band gaps. J. Am. Chem. Soc. 123:8860-8861. Hirakaw a K (2012). Self organisation of silver –core bimetallic
nanoparticles and their application for catalytic reaction, Chapter 4 of Smart Nanoparticles Technology, edited by Dr Abbas Hashim, ISBN:
978-953-51-0500-B. 67-92. Hudak EM, Mortime JT, Martin HB (2010). Platinum for neural
stimulation: voltammetry considerations. J. Neural Eng. 7(2):026005. Jingyu S, Jianshu H, Yanxia C, Xiaogang Z (2007). Hydrothermal
Synthesis of Pt-Ru/MWCNTs and its Electrocatalytic Properties for Oxidation of Methanol. Int. J. Electrochem. Sci. 2:64-71.
Johansson T, Mammo W, Svensson M, Andersson M R, Inganas O (2003). Electrochemical band gaps of substituted polythiophenes. J.
Mater. Chem. 13:1316-1323. Khanal S, Casillas G, Velazquez-Salazar JJ, Ponce A, Jose-Yacaman
M (2012). Atomic Resolution Imaging of Polyhedral PtPd Core–Shell
Nanoparticles by Cs-Corrected STEM. J. Phys. Chem. C 116:23596-23602.
Kumar H, Rani R (2013). Structural Characterization of Silver
Nanoparticles Synthesized by Micro emulsion Route. Int. J. Eng. Innov. Technol. 3:344-348.
Lieber CM (1998). One-dimensional nanostructures: Chemistry, physics & applications. Solid State Commu.107:607- 616.
Lin KF, Cheng HM, Hsu HC, Lin LJ, Hsieh WF (2005). Band gap variation of size-controlled ZnO quantum dots synthesized by sol–gel
method. Chem. Phys. Lett. 409:208-211. Liu B, Yu WL, Lai YH, Huang W (2001). Blue-Light-Emitting Fluorene-
Based Polymers w ith Tunable Electronic Properties. Chem. Mater. 13(6):1984-1991.
Okumu F, Matoetoe M (2016). Kinetics and Morphological Analysis of Silver Platinum Bimetallic Nanoparticles. Acta Metall. Sin. (Engl. Lett.) 29:320-325.
Pankove JI (1971). Optical process in semiconductors, Prentice-Hall,
Englew ood Cliffs, New York Dover publications Pei J, Yu W-L, Huang W (2000). A novel series of eff icient thiophene-
based light-emitting conjugated polymers and application in polymer
light-emitting diodes. Macromolecules 33:2462-2471. Peng Z, Yang H (2008). Ag-Pt alloy nanoparticles w ith the compositions
in the miscibility gap. J. Solid State Chem. 181(7):1546-1551. Nkosi SS, Mw akikunga BW, Sideras-Haddad E, Forbes A (2012).
Synthesis and characterization of potential iron-platinum drugs and supplements by laser liquid photolysis, Nanotechnol. Sci. Appl. 5:27-36.
Niquet YM, Allan G, Deleue C, Lannoo M (2000). Quantum confinement
in germanium nanocrystals. Appl. Phys. Lett. 77:1182-1184. Nousiainen O, Kangasvieri T, Rönkä K, Rautioaho R and Vahakangas J
(2007). Interfacial reactions betw een Sn-based solders and AgPt thick f ilm metallizations on LTCC. Soldering Surf. Mt. Tech. 19:15-
25. Nousiainen O, Rautioaho R, Kautio K, Jääskeläinen J, Leppävuori
S (2005). Solder joint reliability in AgPt‐metallized LTCC
modules. Soldering Surf. Mt. Tech. 17(3):32‐42. Revaprasadu N, Mlondo SN (2006). Use of metal complexes to
synthesize semiconductor nanoparticles. Pure Appl. Chem. 78(9):1691-1702.
Salem A (2014). Silver-doped cadmium oxide nanoparticles: Synthesis, structural and optical properties. Eur. Phys. J. Plus.129:263 -275.
Sankara RB, Venkatramana RS, Koteesw ara RN, Pramoda K (2013). Synthesis, Structural, Optical Properties and Antibacterial Activity of Co-Doped (Ag, Co) ZnO Nanoparticles. Res. J. Mater. Sci. 1:11-23.
Shi L, Wang A, Zhang T, Zhang B, Su D, Li H, Song Y (2013). One-step
synthesis of Au–Pd alloy nanodendrites and their catalytic activity. J. Phys. Chem. C 117:12526–12536.
Smith MAM, Mohs AM, Nie S (2009). Tuning the optical and electronic properties of colloidal nanocrystals by lattice strain. Nat.
Nanotechnol. 4:56-63. Tauc JR, Grigorovici R, Vancu A (1966). Optical properties and
electronic structure of amorphous germanium, Optical Phys. Status Solidi B 15(2):627-637.
Wang GF, Wang W, Wu JF, Liu HY, Jiao SF, Fang B (2009). Self-assembly of a silver nanoparticles modif ied electrode and its electrocatalysis on neutral red. Microchim. Acta 164(1-2):149-155
Xu JB, Zhao TS, Liang ZX (2008). Synthesis of Active Platinum−Silver Alloy Electrocatalyst tow ard the Formic Acid Oxidation Reaction. J. Phys. Chem. C 112 (44):17362–17367.
Yang P, Meldrum FC, Fendler JH (1995). Epitaxial Grow th of Cadmium
Sulf ide under Arachidic Acid Monolayers. J. Phys. Chem. 99:5500-5504.
Yang S, Peng Z, Yang H (2008). Platinum lead nanostructures: formation, phase behavior and electrocatalytic properties. Adv. Funct.
Mater. 18:2745-2753.

Related Journals Published by Academic Journals
■ Journal of Media and Communication Studies
■ International Journal of English and Literature
■ Philosophical Papers and Reviews
■ Educational Research and Reviews
■ Journal of African Studies and Development
■ Philosophical Papers and Reviews
Journal of Physical Education
and Sport Management