Embed Size (px)
Citation preview

Physical activity patternsof Australian adults

The Australian Institute of Health and Welfare is Australia’s national health and welfarestatistics and information agency. The Institute’s mission is to improve the health and well-being of Australians by informing community discussion and decision making throughnational leadership in developing and providing health and welfare statistics and information.
Physical activity patternsof Australian adults
Results of the 1999 NationalPhysical Activity Survey
Tim Armstrong
Adrian Bauman
Joanne Davies
August 2000
Australian Institute of Health and WelfareCanberra
AIHW cat. no. CVD 10

© Australian Institute of Health and Welfare 2000
This work is copyright. Apart from any use as permitted under the Copyright Act 1968, nopart may be reproduced without prior written permission from the Australian Institute ofHealth and Welfare. Requests and enquiries concerning reproduction and rights should bedirected to the Head, Communication and Public Affairs, Australian Institute of Health andWelfare, GPO Box 570, Canberra ACT 2601.
A complete list of the Institute’s publications is available from the Publications Unit,Australian Institute of Health and Welfare, GPO Box 570, Canberra ACT 2601, or via theInstitute’s web site (http://www.aihw.gov.au).
ISBN 1 74024 066 9
Suggested citation
Armstrong T, Bauman A & Davies J 2000. Physical activity patterns of Australian adults.Results of the 1999 National Physical Activity Survey. Canberra: Australian Institute of Healthand Welfare.
Australian Institute of Health and Welfare
Board ChairProfessor Janice Reid
DirectorDr Richard Madden
Any enquiries about or comments on this publication should be directed to:
Dr Tim ArmstrongCardiovascular Disease and Diabetes Monitoring UnitAustralian Institute of Health and WelfareGPO Box 570Canberra ACT 2601
Phone: (02) 6244 1129Fax: (02) 6244 1166E-mail: [email protected]
Published by the Australian Institute of Health and Welfare
Printed by Panther Publishing and Printing

v
ContentsList of tables .......................................................................................................................vii
List of figures ....................................................................................................................viii
List of boxes ......................................................................................................................viii
List of abbreviations ...........................................................................................................ix
Preface.................................................................................................................................xi
Acknowledgments.............................................................................................................xii
Summary...........................................................................................................................xiii
1. Introduction ........................................................................................................................1
2. Physical activity and health ..............................................................................................3
Physical activity and all-cause mortality............................................................................3
Physical activity and cardiovascular disease .....................................................................4
Physical activity and diabetes.............................................................................................6
Physical activity and cancer ...............................................................................................7
Physical activity and injury prevention and control .........................................................8
Physical activity, mental health and psychosocial benefits...............................................9
3. Physical activity measurement .......................................................................................10
Physical activity concept...................................................................................................11
Physical activity duration .................................................................................................11
Physical activity frequency ...............................................................................................11
Physical activity intensity..................................................................................................11
Physical activity type.........................................................................................................12
Physical activity context....................................................................................................12
Physical activity to confer a health benefit ......................................................................13
4. Survey methodology.........................................................................................................14
Overview............................................................................................................................14
Sample size ........................................................................................................................14
Sample selection ................................................................................................................14
Response rate.....................................................................................................................15
Questionnaire ....................................................................................................................15
Derivation of the physical activity measures ...................................................................16
Weighting...........................................................................................................................18
Predictor variables of participation ..................................................................................18
vi
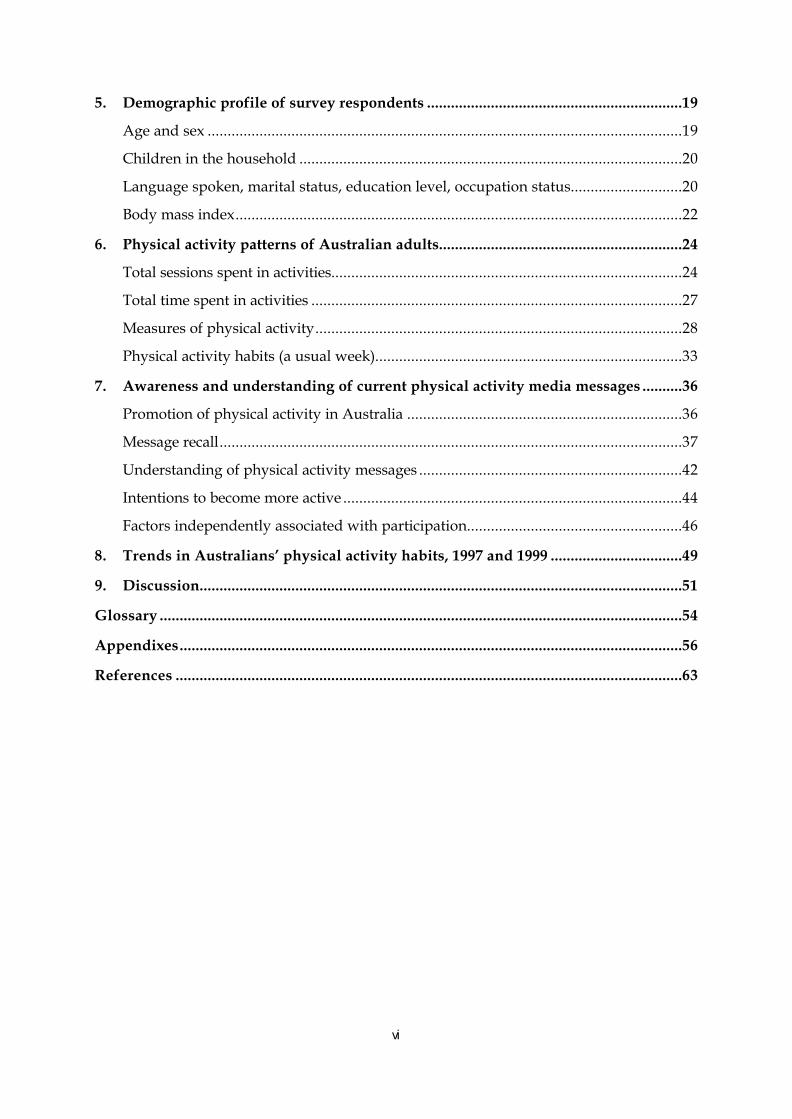
5. Demographic profile of survey respondents ................................................................19
Age and sex .......................................................................................................................19
Children in the household ................................................................................................20
Language spoken, marital status, education level, occupation status............................20
Body mass index................................................................................................................22
6. Physical activity patterns of Australian adults.............................................................24
Total sessions spent in activities........................................................................................24
Total time spent in activities .............................................................................................27
Measures of physical activity............................................................................................28
Physical activity habits (a usual week).............................................................................33
7. Awareness and understanding of current physical activity media messages ..........36
Promotion of physical activity in Australia .....................................................................36
Message recall....................................................................................................................37
Understanding of physical activity messages ..................................................................42
Intentions to become more active .....................................................................................44
Factors independently associated with participation......................................................46
8. Trends in Australians’ physical activity habits, 1997 and 1999 .................................49
9. Discussion.........................................................................................................................51
Glossary ...................................................................................................................................54
Appendixes..............................................................................................................................56
References ...............................................................................................................................63
vii
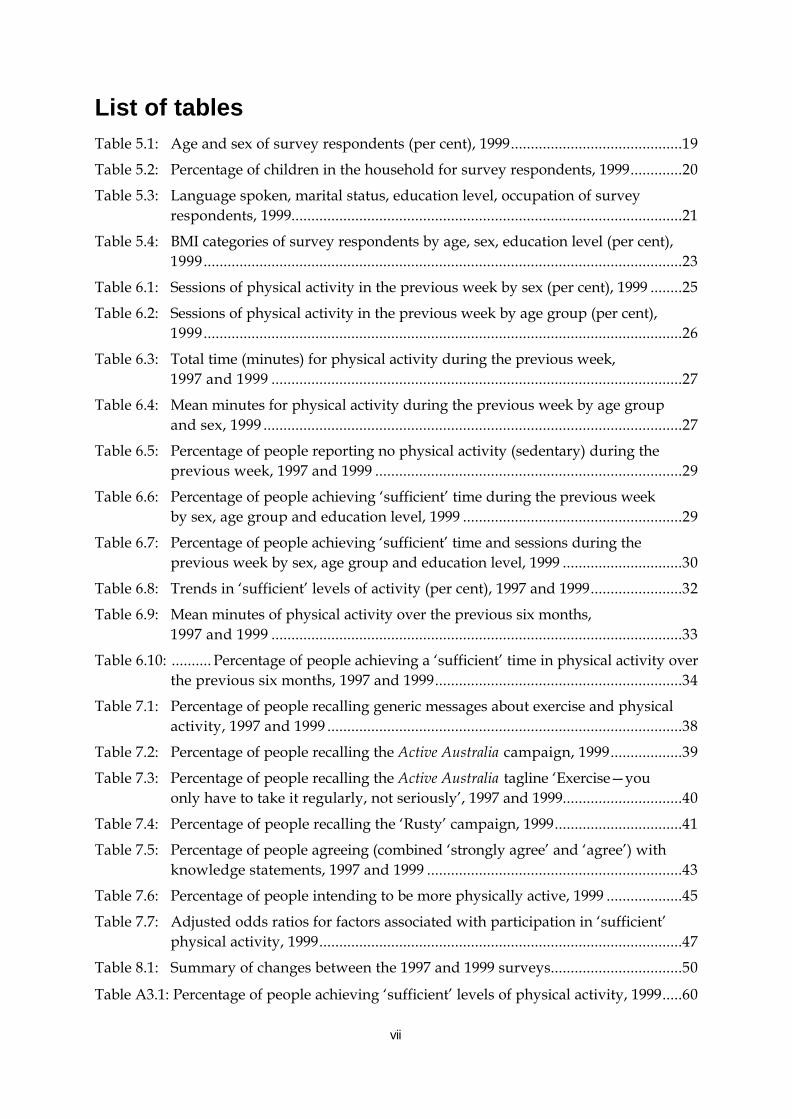
List of tablesTable 5.1: Age and sex of survey respondents (per cent), 1999...........................................19
Table 5.2: Percentage of children in the household for survey respondents, 1999.............20
Table 5.3: Language spoken, marital status, education level, occupation of surveyrespondents, 1999..................................................................................................21
Table 5.4: BMI categories of survey respondents by age, sex, education level (per cent),1999........................................................................................................................23
Table 6.1: Sessions of physical activity in the previous week by sex (per cent), 1999 ........25
Table 6.2: Sessions of physical activity in the previous week by age group (per cent),1999........................................................................................................................26
Table 6.3: Total time (minutes) for physical activity during the previous week,1997 and 1999 .......................................................................................................27
Table 6.4: Mean minutes for physical activity during the previous week by age groupand sex, 1999 .........................................................................................................27
Table 6.5: Percentage of people reporting no physical activity (sedentary) during theprevious week, 1997 and 1999 .............................................................................29
Table 6.6: Percentage of people achieving ‘sufficient’ time during the previous weekby sex, age group and education level, 1999 .......................................................29
Table 6.7: Percentage of people achieving ‘sufficient’ time and sessions during theprevious week by sex, age group and education level, 1999 ..............................30
Table 6.8: Trends in ‘sufficient’ levels of activity (per cent), 1997 and 1999.......................32
Table 6.9: Mean minutes of physical activity over the previous six months,1997 and 1999 .......................................................................................................33
Table 6.10: .......... Percentage of people achieving a ‘sufficient’ time in physical activity overthe previous six months, 1997 and 1999..............................................................34
Table 7.1: Percentage of people recalling generic messages about exercise and physicalactivity, 1997 and 1999 .........................................................................................38
Table 7.2: Percentage of people recalling the Active Australia campaign, 1999..................39
Table 7.3: Percentage of people recalling the Active Australia tagline ‘Exercise—youonly have to take it regularly, not seriously’, 1997 and 1999..............................40
Table 7.4: Percentage of people recalling the ‘Rusty’ campaign, 1999................................41
Table 7.5: Percentage of people agreeing (combined ‘strongly agree’ and ‘agree’) withknowledge statements, 1997 and 1999 ................................................................43
Table 7.6: Percentage of people intending to be more physically active, 1999 ...................45
Table 7.7: Adjusted odds ratios for factors associated with participation in ‘sufficient’physical activity, 1999...........................................................................................47
Table 8.1: Summary of changes between the 1997 and 1999 surveys.................................50
Table A3.1: Percentage of people achieving ‘sufficient’ levels of physical activity, 1999.....60

viii
List of figuresFigure 6.1: Percentage of people achieving a ‘sufficient’ time in physical activities
in the previous week, 1999.............................................................................. 31
Figure 6.2: Percentage of people achieving a ‘sufficient’ time and sessions inphysical activities in the previous week, 1999 ............................................... 31
Figure 6.3: Percentage of people achieving a ‘sufficient’ time in physical activitiesin the previous six months, 1999 .................................................................... 34
Figure 7.1: Any intention to be more active (combined intention in the nextmonth and in the next six months), 1999....................................................... 45
List of boxesBox 2.1: Heart disease in Australia ................................................................................. 4
Box 2.2: Stroke in Australia ............................................................................................. 4
Box 2.3: Cardiovascular risk factors in Australia........................................................... 5
Box 2.4: Diabetes in Australia ......................................................................................... 6
Box 2.5: Cancer in Australia ........................................................................................... 7
Box 2.6: Injury prevention and control in Australia ...................................................... 8
Box 2.7: Mental health in Australia ................................................................................ 9

ix
List of abbreviationsACSM American College of Sports Medicine
AIHW Australian Institute of Health and Welfare
BMI body mass index
CATI Computer-Assisted Telephone Interview
CI confidence interval
CVD cardiovascular disease
DHAC Department of Health and Aged Care
DHFS Department of Health and Family Services
HDL high-density lipoprotein
HSC Higher School Certificate
HVRF Hunter Valley Research Foundation
ICC intra-class correlation
MET metabolic equivalent

x

xi
PrefacePhysical inactivity is recognised as one of the most important population health riskfactors. Its role as a risk factor is at least as significant as hypertension or high cholesterolin contributing to cardiovascular disease, one of Australia’s major killers. In addition,physical activity protects against several cancers, reduces the risk of diabetes, improvesmental health and may reduce the risk of falls and injuries in the elderly.
Overall, physical inactivity ranks second only to tobacco smoking in importance for theburden of disease and disability from all-causes in Australia (Mathers et al. 1999).
Participation in regular physical activity has important health and social benefits. In fact,physical activity can play a part as a preventive factor in five of the six National HealthPriority Areas—cardiovascular disease, cancer control, mental health, diabetes mellitusand injury prevention and control.
Physical Activity Patterns of Australian Adults, released on the eve of the 2000 SydneyOlympics, provides much-needed information on national physical activity levels ofAustralian adults, as well as providing an indication of the impact of the Active Australiainitiative. The Olympics is a time to focus on elite athletes and their performances, but alsoto think about the performance of Australia more broadly as an active nation. This reportdocuments current patterns of physical activity participation among Australian adults in1999 and provides information on trends from 1997.
In order to assess current patterns of physical activity and the impact of the ActiveAustralia campaign, a survey of 3,841 people was conducted during November 1999. Theinformation presented in this report includes the most up-to-date data on physical activitylevels and attitudes among Australians adults.
The 1999 National Physical Activity Survey was jointly funded by the CommonwealthDepartment of Health and Aged Care and the Australian Institute of Health and Welfare.It follows an earlier comparable survey funded under the auspices of Active Australia inNovember 1997. The report is a valuable resource for researchers and those interested inpublic health policy and health promotion.
Dr Richard MaddenDirectorAustralian Institute of Health and Welfare

xii
AcknowledgmentsMr Trent Harlow provided invaluable assistance in the preparation of this report. Valuablecomments were received from Dr Stan Bennett, Dr Paul Magnus and Ms Sushma Mathur.The assistance of Ms Amanda Nobbs was greatly appreciated.
The report was refereed by Professor Wendy Brown (University of Queensland), ProfessorNeville Owen (University of Wollongong) and Mr Mark Williams (Department of HumanServices, South Australia).
The authors gratefully acknowledge Mr Andrew Searles and staff of the Hunter ValleyResearch Foundation for managing the survey data collection.

xiii
SummaryThis report presents results from a national physical activity survey of Australian adultsconducted in November and December 1999. It covers current (1999) activity patterns andrecent national trends. This report represents the most up-to-date information usingrecognised measures and methods to ensure comparable information on trends in physicalactivity.
A large and growing proportion of Australians see the health benefits ofphysical activity
• 88% of people believe that their health could be improved by being generally moreactive.
• 92% of people believe that health could be improved by participation in 30 minutes ofmoderate-intensity physical activity each day.
• There was an increase in overall knowledge of the health benefits of physical activityand awareness of physical activity messages between 1997 and 1999.
• 42% of people recognised the Active Australia tagline ‘Exercise—you only have to takeit regularly, not seriously’.
• Recall of ‘Rusty’, the 1999 International Year of Older People physical activitycampaign, was 24% in those aged 60–75 years.
however, participation is declining…
• The average number of times each week people participated in walking, moderate andvigorous leisure-time physical activity declined between 1997 and 1999.
• The average amount of time people spent each week in physical activity declinedbetween 1997 and 1999.
• This finding held for participation in physical activity done in the ‘previous week’ andover a ‘usual’ week.
the proportion of physically inactive people is increasing…
• The proportion of physically inactive Australians increased between 1997 and 1999(13% to 15% respectively).
• This increase in physical inactivity was greatest for those people aged 30–44 years(12% to 17%), and among those people with tertiary levels of education (6% to 11%).
and the percentage of those achieving ‘sufficient’ levels of physical activity for ahealth benefit is declining.
• Between 1997 and 1999 there was a decline in the proportion of Australiansparticipating in ‘sufficient’ physical activity to provide a health benefit (62% to 57%).
• The decline was seen for both men (63% to 60%) and women (61% to 54%).
• The decline was greatest for people aged 30–44 years (64% to 54%).
• The proportion of people aged 60–75 years participating in ‘sufficient’ levels of activitydid not change between 1997 and 1999.
xiv
Who achieved ‘sufficient’ levels of physical activity in 1999?
• Participation at a ‘sufficient’ activity level for a health benefit was greatest among18–29-year-olds (69%) and lowest among 45–59-year-olds (50%).
• Men (60%) were more likely than women (54%) to participate at ‘sufficient’ levels.
• For men, participation at a ‘sufficient’ activity level was greatest for those aged 18–29years (74%) and lowest among those aged 45–59 years (50%).
• Among women, participation at a ‘sufficient’ activity level decreased with age from64% in those aged 18–29 years to 48% in those 60–75 years of age.
• Participation at a ‘sufficient’ activity level increased with educational attainment.
Who is more likely to participate in physical activity?
• Obese Australian adults were 50% less likely than other Australian adults to reach a‘sufficient’ level of physical activity compared with those of healthy weight.
• Older Australians were less likely to participate in ‘sufficient’ physical activity thanyounger people.
• Women were 20% less likely to achieve ‘sufficient’ physical activity compared withmen.
• People with at least one child at home were 20% less likely to be ‘sufficiently’ activethan those without.
• People who did not recall the Active Australia slogan ‘Exercise—you only have to takeit regularly, not seriously’ were 19% less likely to achieve ‘sufficient’ levels of physicalactivity than people who did recall it.
Do Australians intend to increase their participation?
• In 1999, one-third of Australian adults said that they intended to become morephysically active in the next month and 29% said that they were intending to becomemore physically active in the next six months.
• Intentions to become more physically active were greater for women than for men, anddecreased with age.
1
1. IntroductionPhysical activity—vital for health
Participation in physical activity has important benefits for the physical and mental healthof Australians, and for social and cultural values in our communities.Physical activity is recognised as an important factor in reducing the risk of chronicdisease among Australians. It is important for the reduction of mortality and morbidityfrom cardiovascular disease, type 2 diabetes, some forms of cancer, and morbidity fromsome injuries, and mental health conditions.This report presents details of a national physical activity survey conducted withAustralian adults in November 1999. It covers patterns of participation in physicalactivity, along with knowledge and awareness of public health messages about physicalactivity. Further, the report details changes in participation and knowledge since 1997.
Promoting physical activity
Making people aware of the benefits of participation in physical activity to improve healthis a major challenge for public health policy makers, health care providers andcommunities. Effective interventions are required to fulfil the overall population-healthaim to increase total physical activity in the community. One process in Australia has beenthe development of National Physical Activity Guidelines (DHAC 1999), which serve tobring public attention to the minimum amount of physical activity required to achievehealth benefits. These guidelines operate within a broader physical activity initiative inAustralia, namely the Active Australia campaign. This campaign brings together the majorstakeholders from government and non-government sectors to provide the structures foreffective promotion of, and opportunities to participate in, physical activity in Australia.
The need for good quality data and evaluation
The information presented in this report relates primarily to leisure-time physical activity.Methods to accurately measure occupational and incidental physical activities are yet to bedeveloped. Further, the relationship between health benefits and occupational andincidental physical activities are yet to elucidated.One limitation for the effective promotion of physical activity in Australia is a lack of dataon participation rates and evaluations of effective interventions. This report takes a firststep in remedying the lack of coordinated monitoring of physical activity in Australia.Data on participation in physical activity at recommended levels are presented here, alongwith knowledge and awareness of specific campaign messages.
Monitoring Active Australia
As one of the benchmarks for the Active Australia initiative, a national baseline survey wasconducted in November 1997. This report documents the results of a second survey twoyears after the baseline. It provides population data on the trends in physical activityamong Australian adults over the two-year time-period of the Active Australia initiatives.Monitoring changes in the prevalence of physical activity and demonstrating any changesin the awareness of moderate physical activity are indicators of population changes.

2
Continued monitoring of patterns and trends in physical activity is needed to help assessthe impact of specific interventions and campaigns such as Active Australia. To in partachieve this, another national physical activity survey, using comparable methodology,should be conducted in two to three years’ time. The peak national body providingleadership in physical activity and health in Australia, the Strategic Inter-Governmentalforum on Physical Activity and Health (SIGPAH) endorses replication of the ActiveAustralia baseline survey.
Work to further develop nationally agreed standard methods of measurement appropriatefor population-based observational studies should continue.
Structure of this report
Chapter 2 provides an overview of the relationship between physical activity and health,specifically in the areas of cardiovascular disease, diabetes, cancer, injury prevention andcontrol, and mental health. Chapter 3 summarises the development of questions used tomeasure physical activity and includes a discussion of the key concepts in this area. Thefollowing chapter details the methodology used in the 1999 survey. The demographicprofile of survey respondents is provided in Chapter 5. The results from the 1999 surveyare presented in Chapter 6, specifically, the number of sessions spent in activities, the totaltime spent in activities and the levels of physical activity ‘sufficient’ to confer a healthbenefit. Chapter 7 presents information on the recall of generic messages on physicalactivity, and as they relate to the Active Australia campaign. The respondents’ knowledgeof physical activity is reported, as well as their intentions to become more active in thefuture. Chapter 8 reviews the trends in physical activity participation levels in Australia bycomparing the 1999 survey results with those of a similar survey conducted in 1997.Finally, a discussion is given in Chapter 9.

3
2. Physical activity and healthPhysical activity of moderate intensity has been recommended for health and wellbeingsince the time of Hippocrates (460–370 BC). Despite this long interest in physical activity,its recognition as an important public health issue has lagged behind that for othertraditional risk factors such as tobacco smoking (Bauman & Owen 1999). Only in the lasttwo decades has consistent epidemiological evidence identified that physical activity is amajor modifiable risk factor in the reduction of mortality and morbidity from manychronic diseases. The release in 1996 of the United States Surgeon General’s report onphysical activity and health (USDHHS 1996) gave physical activity an internationallyrecognised legitimacy as an important component of public health and wellbeing.
According to recent estimates, physical inactivity is responsible for about seven per cent ofthe total burden of disease in Australia (Mathers et al. 1999). This places physicalinactivity second, behind tobacco control, in terms of national importance in healthpromotion and disease prevention. Physical inactivity also places an enormous economiccost on Australia (Stephenson et al. 2000).
Data collected from studies using different measurement techniques (i.e. self-reportedphysical activity, fitness assessments, motion sensors) show similar associations betweenphysical inactivity and a range of health outcomes such as coronary heart disease,ischaemic stroke, type 2 diabetes, osteoporosis and some cancers, as well as disease riskfactors such as high blood cholesterol, hypertension and obesity (Bauman & Owen 1999).
The quality of the current evidence showing physical inactivity as a risk factor is similar tothat for tobacco smoking in the 1970s. Most of the evidence has been provided bypopulation-based cohort studies. The more recent and better quality studies adjust forconfounding factors such as high blood cholesterol, hypertension and obesity. Meta-analyses of the evidence show a stronger association between physical activity and healthoutcomes where the research methods are optimal (Ainsworth et al. 1998; Berlin & Colditz1990; Powell et al. 1987).
Physical activity and all-cause mortalityPeople who participate in moderate to vigorous levels of physical activity and/or havehigh levels of cardiorespiratory fitness have a lower mortality rate than those with asedentary lifestyle or low cardiorespiratory fitness. The effects of physical activity onreducing all-cause mortality are strong and consistent across studies and populations(Blair et al. 1996; Lee & Paffenbarger 1997; Villeneuve et al. 1998). Even among diverseelderly populations in studies in Israel and in Holland, relationships between regularphysical activity and reduced risks of death are consistently demonstrated (Bijnen et al.1999; Stessman et al. 2000).Although these associations are generally stronger for measured cardiorespiratory fitnessthan for self-reported participation (Blair et al. 1989), moderate types of self-reportedphysical activity such as climbing at least 20 flights of stairs per week confer a benefit onall-cause mortality (Paffenbarger et al. 1993). Dimensions such as transport-relatedactivity, such as regular bicycling to work, may confer benefits independent of otherleisure-time physical activity (Andersen et al. 2000). Participation in more vigorousphysical activity confers an even greater benefit in terms of overall risk of death (Lee &Paffenbarger 2000). Overweight or obese individuals who are physically active and fit are

4
less likely to suffer early death than normal-weight persons who lead a sedentary lifestyle(Blair & Brodney 1999). Further, among obese men, low cardiovascular fitness has beenshown to be at least as important a predictor of all-cause mortality as type 2 diabetes, highcholesterol, smoking and high blood pressure (Wei et al. 1999).
Physical activity and cardiovascular disease
Heart disease and stroke
The strongest evidence for the benefits of physical activity is in reducing the risk ofmortality and morbidity from cardiovascular disease (CVD). Compared with those thatare at least moderately physically active, people who are sedentary have a one-and-a-halfto twofold increase in the risk of a fatal or non-fatal cardiovascular event such as coronaryheart disease or acute myocardial infarction (Bauman & Owen 1999; Berlin & Colditz1990; USDHHS 1996). These associations are strong and are independent of the definitionof physical activity or cardiorespiratory fitness used. The maximum cardiovascular diseasebenefit occurred when people moved from a sedentary lifestyle or low state ofcardiorespiratory fitness to a moderately active or moderate fitness level (Blair et al. 1995,1996; Lakka et al. 1994). Participation in walking confers a clear benefit for women, butmore vigorous activity confers an even greater reduction in risk (Manson et al. 1999).
It seems that recent participation in physical activity is required for cardioprotectivebenefits (Sherman et al. 1999), suggesting that ongoing participation may be required forongoing health gain.
Existing data are less definitive for the association between physical activity and bothtypes of stroke (i.e. ischaemic and haemorrhagic) (Kohl & McKenzie 1994). Generally, forischaemic stroke, studies show a decrease in the risk of stroke with increasing physicalactivity (Ellekjaer et al. 2000; Hu et al. 2000; Wannemethee & Shaper 1999).
Box 2.1: Heart disease in Australia
Much progress has been made in recent years in improving the cardiovascular health of Australians.Death rates have fallen dramatically, some risk factors have improved, and there have been majoradvances in treatment and care.
However, cardiovascular disease is still Australia’s greatest health problem. In 1995, an estimated2.8 million Australians, or 16% of the population, had a cardiovascular condition (AIHW 1999a). Thedisease kills more people than any other disease (almost 51,000 deaths in 1998) (AIHW 2000) and createsenormous costs for the healthcare system. In 1997–98 there were 434,748 hospitalisations forcardiovascular conditions (AIHW 1999b).
Box 2.2: Stroke in Australia
Stroke is Australia’s second greatest single killer after coronary heart disease, claiming almost 12,000lives in 1998 (AIHW 2000). It is the leading cause of long-term disability in adults and it places greatdemands on family members and caregivers. Death rates from stroke have been falling since the late1960s. Given the rapid ageing of the Australian population, however, and a slowing of the decline instroke death rates in recent years, the number of people dying from stroke and those surviving with apermanent disability is likely to increase in the future (AIHW 1999a).

5
Risk factors for cardiovascular diseasePhysical activity affects CVD independently of other CVD risk factors (Berlin & Colditz1990; Blair et al. 1996; Paffenbarger et al. 1993; Powell et al. 1987). However, physicalactivity and fitness are also associated with other risk factors such as high blood pressure,high body mass index (BMI) and unfavourable high-density lipoprotein (HDL)/bloodcholesterol levels (Bauman & Owen 1991).Vigorous physical activity has been shown to decrease systolic and diastolic blood pressure(Arroll & Beaglehole 1992; Kelley & McClellan 1994; McMurray et al. 1998; Mensink et al.1999). There is some evidence that participation in more moderate physical activity mayachieve similar or even greater effects in lowering blood pressure than vigorous activity(Hagberg et al. 1989; Marceau et al. 1993; Matsusaki et al. 1992).Physical activity and cardiorespiratory fitness are both associated with improved totalblood cholesterol levels (McMurray et al. 1998) and improved HDL subfraction profiles(Moore 1994). Recent research suggests that there may be a threshold for the relationshipbetween physical activity and improvements in the HDL subfraction of cholesterol—moreprolonged or intensive exercise may be more beneficial for HDL to total cholesterol ratios(Kokkinos & Fernhall 1999).Physical activity has also been shown to have a role to play in the prevention,maintenance, and treatment of obesity, although more prolonged activity is required forweight loss (Grundy et al. 1999). Most reviews suggest that at least 2,000 Kcal of energyexpenditure per week is required for maintained weight loss (Rippe & Hess 1998), whichequates to at least one hour of moderate or half-an-hour of vigorous leisure-time physicalactivity every day. Nonetheless, more moderate levels of activity can assist with weightmaintenance, as well as conferring other health benefits.
Box 2.3: Cardiovascular risk factors in Australia
In 1995, around 2.2 million Australian adults (17% of the adult population) had high blood pressure(AIHW 1999a). There have been significant declines in the proportion of people with high bloodpressure and/or receiving treatment since the 1980s.
The last national survey to assess blood cholesterol levels in Australia was conducted in 1989. At thattime it was estimated that over 4.5 million Australians adults (aged 20–69 years) had higher thandesirable cholesterol levels (AIHW 1999a).
In 1995, around 7.4 million Australian adults (around 56% of the adult population) were overweight(BMI = 25) (AIHW 1999a). Almost 2.5 million (or 19% of the adult population) of those were obese(BMI = 30). There have been significant increases in the proportions of overweight and obeseAustralians in the last 15 years (AIHW 2000).
Adult smoking rates have been declining since the 1960s and this trend has continued into the 1990s.National surveys show, however, that the rate of decline has slowed in more recent years. In 1995,almost 3.2 million Australian adults (around 24% of the adult population) were at risk of developingheart disease and other chronic conditions from smoking tobacco products (AIHW 1999a).
6
Physical activity and diabetesA recent review shows that the benefits of physical activity in the prevention andtreatment of type 2 diabetes are strongly supported by current research (Ivy et al. 1999). Ithas been estimated that 30–50% of new cases of type 2 diabetes could be prevented byappropriate levels of physical activity (Manson & Spelsberg 1994). Both moderate andvigorous physical activity reduces the risk of type 2 diabetes in women (Hu et al. 1999).The benefits accrue in diverse populations (Folsom et al. 2000; Okada et al. 2000). Thebenefits of physical activity for preventing and treating diabetes only occur from regularsustained physical activity patterns. The physiological adaptations that are responsible forthe protective effects of physical activity subside within a short period of the cessation ofphysical activity (Arciero et al. 1999; Dela et al. 1993; Rogers et al. 1990).
Box 2.4: Diabetes in Australia
Diabetes has a major impact on quality of life and its long-term complications include a greater risk ofheart attack, stroke, impotence, blindness, kidney problems, lower limb amputations and reduced lifeexpectancy.
In 1995, over 350,000 Australians (2% of the population) reported having type 1 or type 2 diabetes(AIHW 1999a). Self-reported diabetes underestimates the true prevalence of the condition. Studiessuggest that there is one undiagnosed person for each known case of type 2 diabetes (AIHW 1999a).

7
Physical activity and cancerThere is evidence suggesting that participation in physical activity and highcardiorespiratory fitness reduce the risk of developing some forms of cancer. Numerousstudies show the protective effect of physical activity on risk of colon cancer (Colditz et al.1997), and on the prevention of precancerous polyps in the large bowel (Neugut et al.1996; Slattery et al. 1997).
The evidence relating to physical activity and other cancers is less conclusive. Most studiesof physical activity report a reduction in the risk of breast cancer among physically activewomen (Gammon et al. 1998; Latikka et al. 1998; Verloop et al. 2000). There is someevidence for vigorous activity providing a protective effect for prostate cancer in men(Giovannucciet al. 1998), although some researchers do not find such a relationship (Liu et al. 2000).There are too few studies to enable clear statements to be made on the associationsbetween physical activity and uterine and ovarian cancer in women, testicular cancer inmen, and lung cancer. However, a recent study showed a promising reduction in risk oflung cancer in physically active men (Lee & Paffenbarger 2000).
Box 2.5: Cancer in Australia
Cancer has a major impact on the Australian community in terms of morbidity, mortality and costs. Onaverage, one in three men and one in four women are likely to develop cancer before the age of 75 (DHFS& AIHW 1998).
The incidence of cancer continues to increase and, while the overall death rate has begun to fall, thedeath rate from many of the most common cancers is either stable or increasing. The most commoncancer in Australia in both males and females is the non-melanocytic skin cancer. The next mostcommon cancers in males are cancers of the prostate, colon and rectum, lung, melanoma of the skin, andbladder. Common cancers in females are those of the breast, colon and rectum, melanoma of the skin, andlung (DHFS & AIHW 1998).
8
Physical activity and injury prevention and controlParticipation in physical activity throughout the lifespan can increase, maintain or reducethe decline of musculoskeletal health that generally occurs with aging in sedentary people(Brill et al. 2000). Participation by older adults can help maintain strength and flexibility,resulting in an ability to continue to perform daily activities (Brill et al. 2000; Huang et al.1998; Simonsick et al. 1993). Further, participation can reduce the risk of falling and hipfractures in older adults (Grisso et al. 1997; Lord 1995).
The development of osteoporosis and bone fractures are associated with physical inactivity(Drinkwater 1994). Weight-bearing activity is important in the development of peak bonedensity for adolescents (Welten et al. 1994) and for middle-aged women (Zhang et al.1992). Cross-sectional studies show that participation in physical activity, aerobic fitnessand muscular strength are all positively associated with bone density (Gutin & Kasper1992).
The position statement on osteoporosis by the American College of Sports Medicine(ACSM 1995) stated that functional loading through physical activity exerts a positiveinfluence on bone mass, but the types of activity most effecting such change are still notclear. Systematic reviews of the literature have identified the beneficial role of physicalactivity in reducing the risks of falls in the elderly, but often in combination with otherprogram components such as reviewing medications and improving the safety of thedomestic environment (Gillespie et al. 1998).
Physical activity is essential for maintaining the health of joints and appears to bebeneficial for controlling the symptoms of osteoarthritis. There is no evidence that physicalactivity itself causes osteoarthritis although injuries sustained during participation intraining and competition in elite sports may increase risk of osteoarthritis (Kujala et al.1994; Kujala et al. 1995; USDHHS 1996). However, these studies are based on extremelysmall sample sizes and this limits their generalisation to the population. Participation inrecreational running, as opposed to competitive athletics, over a long period has beenshown not to increase risk of osteoarthritis (Lane 1995).
Box 2.6: Injury prevention and control in Australia
Falls account for 15% of deaths from injury in Australia and for 33% of hospitalisations due to injury.The vast majority of falls occur in older people, with 94% of male and 70% of female deaths due to fallsbeing in those aged over 65 years.
Musculoskeletal disorders are a cause of mortality and considerable morbidity and disability inAustralia. Chronic musculoskeletal disorders are reported by 29% of Australians aged 15 years andover, and 56% of Australians aged 60 years and over (Mathers & Penm 1999).
9
Physical activity, mental health and psychosocialbenefitsStudies consistently show that participation in physical activity reduces symptoms ofstress, anxiety and depression (Glenister 1996; Hassmén et al. 2000; Paffenbarger et al.1994; Petruzello et al. 1991). Physical activity is associated with increased mental health inpopulation studies (Simonsick 1991; Stephens 1988) and is recognised as an evidence-based treatment for clinical anxiety and depression (Bauman & Owen 1999).
Participation in physical activity may also confer other psychological and social benefitsthat impact on the health and wellbeing of Australians. Participation by individuals canhelp build self-esteem (Sonstroem 1984), social skills among children (Evans & Roberts1987) and positive self-image among women (Maxwell & Tucker 1992), and improvequality of life among children and adults (Hassmén et al. 2000; Laforge et al. 1999; Morans& Mohai 1991). These benefits are probably due a combination of participation in theactivity itself and from the sociocultural aspects that can accompany physical activity.
Further, participation in physical activity may reduce self-destructive and antisocialbehaviour among young people (Mutrie & Parfitt 1998).
Box 2.7: Mental health in Australia
The progress in physical and material wellbeing for most Australians during the twentieth century hasnot necessarily been matched by gains in mental health and subjective wellbeing. More than one millionAustralians are estimated to suffer from a mental disorder, with almost half of these affected long-term(ABS 1997).
Mental health disorders are responsible for a larger number of hospitalisations than any other NationalHealth Priority Area, including cardiovascular disease, diabetes, asthma and cancer (DHAC & AIHW1999a). Mental health problems also account for much disability, incur high direct and indirect costs,and impose a heavy burden of human suffering.

10
3. Physical activity measurementThe process to develop national standards for the measurement of physical activity wascoordinated by the Australian Institute of Health and Welfare (AIHW). An ExpertWorking Group was established in 1997 to review national physical activity measures anddevelop standard data elements to measure physical activity in population surveys.Membership of the Expert Working Group is provided in Appendix 1.The development of an appropriate tool is a challenging task. Physical activity for healthbenefit comprises several components (e.g. intensity, frequency, duration and type) thatcan be carried out in different settings or contexts (e.g. leisure-time, occupational,incidental and transport). Measurement is further complicated because there are severaldimensions of physical activity related to health (e.g. energy expenditure, fitness, strengthand flexibility). Methods for measuring activity range from self-reported instruments tomore objective assessments of movement, fitness or energy balance.An example of issues surrounding measurement relate to the quantum of activity neededfor different health outcomes. For example, the primary type of physical activity requiredto prevent cardiovascular disease (i.e. moderate-intensity regular physical activity) is notthe same as that required to prevent falls in the elderly (i.e. weight-bearing and strength-training activity). Different intensities and duration of activity are needed for differentpurposes—for example, more vigorous and sustained activity may confer additionalbenefits for disease prevention, but may be required for weight loss or improvements tolipid profiles.Emanating from the work of the Expert Group, a standard instrument for collectingphysical activity information was developed. The instrument questions were derived fromquestions used in the National Heart Foundation Risk Factor Prevalence Survey (RiskFactor Prevalence Management Committee 1990), the Australian Bureau of StatisticsNational Health Surveys 1989–90 and 1995, and the New South Wales State Healthsurveys (Bauman et al. 1996). Information on the utility, reliability and validity of earlierAustralian physical activity survey instruments was of great value in helping the ExpertGroup develop the current proposed instrument (Bauman et al. 1996; Booth et al. 1995,1996; Gore et al. 1999; National Centre for Health Promotion and Health PromotionBranch 1994). This instrument was used in both the 1997 and 1999 national physicalactivity surveys to assess participation in physical activity among Australian adults.A project to assess the reproducibility of this instrument was funded by theCommonwealth Department of Health and Aged Care (DHAC) in late 1999, through theUniversity of Western Australia. Repeatability data for these physical activity questionswere collected by Dr Fiona Bull from the University of Western Australia, in a populationsample of 237 adults in WA (Bull et al. 2000, in press). Data were collected as asupplementary study to the 1999 National Physical Activity Survey. Data were collectedby telephone survey, and again from the same individuals three days later. Recall was ofthe same week. In general, for those individuals reporting activity (walking, gardening,moderate and vigorous activity), the test–retest agreement coefficients were in themoderate to very good range—intra-class correlation coefficients ranged from 0.6 to 0.8.(personal communication, Bull et al. 2000). This suggests that these questions, in apopulation setting, are at least as reproducible as other commonly used physical activityinstruments.
Underpinning the measurement of physical activity is the integration of information onintensity, frequency, duration and type of physical activity. Furthermore, recentdevelopments in the epidemiology of physical activity suggest that components of

11
everyday activity, such as transport-related activity and incidental or unplanned activity,might be considered in broader approaches to measurement. Key concepts used tomeasure physical activity are presented below.
Physical activity conceptPhysical activity is defined as ‘any bodily movement produced by skeletal muscles thatresults in energy expenditure’ (Caspersen et al. 1985). Some examples of physical activityare walking, walking up stairs, gardening, playing sport and work-related activity.Exercise is a subset of physical activity defined as planned, structured and repetitive bodilymovement done to improve or maintain one or more components of physical fitness.Exercise has specific objectives of improving fitness, performance and health, andproviding a means of social interaction. Physical activity comprises duration, frequency,intensity, type and context.
Physical activity durationDuration is defined as the length of time spent participating in physical activity as self-reported by the respondent within a reporting period. This item is generally reported inhours and minutes and may be summed to provide an indication of total timeparticipating in physical activity over the reporting period. Typically, reporting periodshave been lengthy, with recall of activity patterns over the previous one to twelve months.More recent surveys focus on a shorter time period, with one or two weeks often used.This is considered to be less prone to recall bias and hence to provide better populationestimates of activity patterns.
Physical activity frequencyFrequency is defined as the number of times the respondent self-reported participating inphysical activity, within a reporting period.
Physical activity intensityIntensity is the self-perceived and self-reported intensity at which a respondentparticipated in physical activity. Generally, to obtain health benefit, physical activity at amoderate intensity (at least) is required. Brisk walking is an example of a moderate-intensity physical activity. Participation in vigorous-intensity physical activities conferseven greater health benefits than does participation in more moderate activity. Theprimary measurement goal is to provide examples within questions of the kinds of activitythat reach a sufficient energy expenditure threshold to be of health benefit. This is usuallyactivity that results in energy expenditure of at least three times the resting rate (restingmetabolic rate, RMR) or activities which correspond to at least three metabolic equivalents(METs). Brisk walking and other moderate-intensity activities (e.g. gentle swimming, socialtennis) correspond to around 3–5 METs. More vigorous activities such as aerobics, joggingand competitive tennis correspond to around 7–9 METs (USDHHS 1996).
12
Physical activity typeType is defined as the specific physical activities self-reported by respondents, for example,walking, gardening and yardwork.
Walking is the most prevalent physical activity reported in Australian population surveys.Walking is identified as a specific activity as it is carried out in several contexts (e.g.exercise, recreation, transport, at work, etc.). Although some occupations involveconsiderable amounts of walking (e.g. traffic warden), there is currently insufficientevidence to assume that self-reported walking at work will provide health benefit on apopulation basis. A specific question on other walking is therefore included in thequestionnaire to ensure that only information on walking that most likely contributes tohealth benefit is collected.
Gardening and yard work are also commonly reported physical activities. Information onthese specific activities is required because it is unclear whether they contribute toachieving a ‘sufficient’ level of physical activity for health benefit. To ensure that theseactivities are not included with other leisure-time physical activities, a specific question isincluded about gardening and yard work. The wording of these questions and the energyexpenditure associated with these tasks need further validation for their use in populationsurveys. Similarly, other important settings for expending energy, such as domestic oroccupational settings, require validation studies to determine their usefulness in routinephysical activity self-reported surveys.
Physical activity contextThis is the context in which a person participates in physical activity. The term physicalactivity commonly represents sport, active recreation, exercise, fitness, incidental activityand active living. The majority of the data in this report refer to leisure-time physicalactivity, which refers to an individual’s discretionary time that is time left after completionof work, travelling, domestic chores and personal hygiene. The element of personal choiceis inherent to this definition (Bouchard & Shephard 1994).
One of the important aims of population physical activity measurement is to measurephysical activity in as many settings as possible, using reliable and valid self-reportedquestions. Hence the questionnaire used as a basis for this report asked about walking‘continuously for at least 10 minutes, for recreation, exercise or to get to or from places’,thus capturing leisure-time walking and some walking for transport. In this way, walkingthat is most likely to be associated with a health benefit (i.e. moderate or brisk-pacedwalking) is separated from walking at work which is unlikely, in most cases, to be done atan intensity and/or of a duration associated with a health benefit. In this instrument,moderate and vigorous leisure-time activities are illustrated by examples which reflect theappropriate energy expenditures for those pursuits.

13
Physical activity to confer a health benefit‘Sufficient’ leisure-time physical activity for health results from participation in regularphysical activity of ‘sufficient’ duration and intensity. Although there is no clear absolutethreshold for health benefit, recommendations from experts agree that for better health,physical activity should be performed regularly. A landmark document, the United StatesSurgeon General’s report on physical activity and health (USDHHS 1996), provided ascientific basis for health benefits to be achieved from the participation of regular,moderate intensity physical activity. In keeping with this concept, the National PhysicalActivity Guidelines for Australians (DHAC 1999) recommend that the ‘accumulation of 30minutes of moderate physical activity on most days of the week’ is beneficial for health.One interpretation of this is the accrual of 150 minutes of moderate-intensity (at least)leisure-time physical activity over a period of one week. This equates to approximately 30minutes of physical activity on five (most) days of the week. Therefore, the first definitionused in this report for ‘sufficient’ physical activity for health benefit is based on a durationof greater than or equal to 150 minutes of walking and/or moderate-intensity physicalactivity, and/or vigorous-intensity physical activity per week (where vigorous-intensityphysical activity is weighted by a factor of two to reflect its greater intensity). A furtherrefinement to the measure is to take into account the number of sessions and set thecriteria of ‘sufficient’ to include that 150 minutes of moderate-intensity activity (at least) beaccrued over at least five sessions. The rationale for this is that, for most people, eachsession would be undertaken on a separate day.
Physical activity related to gardening and yard work is not accepted as a contributor to‘sufficient’ physical activity because there is currently limited research on the validity ofthe self-reported intensity of these activities. Due to the widespread self-reportedparticipation in gardening and yard work as leisure-time activities, this work, to quantifythe health benefit of those activities is required as a matter of urgency.
‘Sufficient’ physical activity is an important concept because it reflects the amount andtype of physical activity that is likely to have a health benefit. This quantum applies toseveral but not all health benefits—it is chosen as the level where a substantial number ofbenefits might accrue (USDHHS 1996). It also provides an insight into the remainingproportion of the population that is insufficiently active. This group includes people whoare completely inactive or sedentary (i.e. who report no physical activity) as well as thosewho are active but not sufficiently active for good health as defined by the NationalPhysical Activity Guidelines for Australians (DHAC 1999).

14
4. Survey methodology
OverviewThe data presented in this report are from the 1999 National Physical Activity Survey withtrend information from the 1997 Active Australia Baseline Survey (ASC 1998) (referred toin this report as the 1999 survey and 1997 survey, respectively).
The 1999 survey was jointly funded by AIHW and DHAC. Data were collected bytelephone by the Hunter Valley Research Foundation (HVRF) on behalf of the fundingagencies.
Details of the survey methodology are presented in a technical report (HVRF 1999) and abrief outline is provided below.
Sample sizeThe scope of the survey was Australian adults aged 18–75 years. The national sample sizerequired for the 1999 survey was estimated to be at least 2,500 and was distributedproportionally by population across States and Territories. The age range of 18–75 years,rather than the standard 18–74 years, was to ensure data were collected for the entire agerange (18–75 years inclusive) for which public health messages on physical activity weretargeted and to maintain consistency with the 1997 survey.
The NSW Health Department contracted the HVRF to increase the sample size in NewSouth Wales to 2,000 (originally estimated at 846) to allow for within-State comparisons.Also, to assess the impact of a physical activity campaign targeted at an older age groupwithin New South Wales, a further 100 respondents aged between 55 and 75 years wereinterviewed.
The additional interviews for New South Wales were obtained using the existing surveymethodology. To obtain the additional 100 interviews, the wording of the introductionwas changed to ask for the number of people aged 55 to 75 years in the household ratherthan the number of people aged 18 to 75 years.
The final national sample includes the additional interviews from New South Wales,which increased the sample size to 3,841.
Sample selectionThe 1999 survey was conducted by the HVRF using a Computer Assisted TelephoneInterviewing (CATI) system. Respondents were selected using a two-stage samplingprocess. Firstly, households were randomly selected using the electronic White Pagestelephone directory. Then, once contact with the household was established, the personaged between 18 and 75 years who had the most recent birthday was asked to participate.Once identified, the respondent was not substituted with other members of the householdfor any reason.

15
A small pilot test conducted by the HVRF in early November 1999 tested the wording andflow of the survey. More extensive pilot testing was not considered necessary ascomparable questions were tested for the 1997 survey.Interviewers were trained using the CATI system and familiarised with material from theActive Australia campaign using posters, brochures and a videotape of the ‘Rusty’television commercial.The 1999 survey was conducted between 10 November 1999 and 17 December 1999 toensure comparability with the 1997 survey, which was conducted during November–December 1997. Conducting the surveys at the same time of year ensures thatparticipation rates are not affected by seasonal conditions. It was also important toconduct the surveys before the December holiday period (late December) as participationrates may be influenced by increased leisure time.The CATI system directed all wording used by the interviewers for the introduction, andfor all of the survey questions. Survey answers were entered by the interviewers during theinterview and automatically checked for validity by the CATI system. Open-endedresponses were transcribed verbatim by the interviewer.
Response rateA potential respondent was defined as a person currently living in the household agedbetween 18 and 75 years. If there was more than one person in this category, the personwith the most recent birthday was selected.
Several methods were used by HVRF to improve response rates. A minimum of six callattempts were made to establish contact with a survey respondent. A further five attemptswere made once contact had been made, to obtain either a completed interview or arefusal. Respondents were able to make appointments to complete the interview at a moreconvenient time. Interviewers left messages on answering machines as well as providing atoll-free number to potential respondents.
Telephone contact was made with 5,936 households and resulted in 3,841 completedinterviews. This represented a household response rate of 65%. Of the eligible individualscontacted, the individual response rate was 89%.
The response rate in 1999 was higher than in 1997, where household response rate was61% and individual response rate was 81%.
Response rates were similar between States and Territories, although rates in theAustralian Capital Territory, South Australia and Tasmania were slightly higher.
QuestionnaireQuestions asked about respondents’ awareness and understanding of the moderate-intensity physical activity messages, their intentions to become more active in the future,their participation in predominantly leisure-time physical activities (including walking fortransport) during the previous week and their usual physical activity patterns over the lastsix months (i.e. a ‘usual’ week) (Appendix 2).
Information was collected on:
• walking continuously for at least 10 minutes, for recreation, exercise or transport;

16
• other moderate-intensity physical activities, e.g. gentle swimming, social tennis;• vigorous-intensity physical activities, e.g. jogging, cycling, aerobics, competitive tennis;
and• vigorous-intensity gardening or heavy yardwork.Participants were asked to report the frequency and duration for each activity.Prescriptive definitions of the terms ‘vigorous’ and ‘moderate’ were not provided, and thusrespondents interpreted these terms in the context of the questions and examplesprovided. Perceptions of intensity may therefore vary, and are likely to be influenced byfactors such as fitness level and age.Unlike the 1997 survey, the 1999 survey did not include questions on the frequency andduration of participation in vigorous-intensity household and domestic chores and hoursof television watching.
Open-ended questions
Following a response of ‘yes’ to the message recall questions, survey participants gave anopen-ended response. For open-ended questions, two of the authors developed codingframes, and then independently content-analysed the responses into closed codedcategories (Appendix 4). The authors then met and discussed coding frames, andreconciled any differences. These data are shown in the relevant sections.
Derivation of the physical activity measuresThe measures identified below are an informative way of examining population levels ofphysical activity. As well as providing an indication of population prevalence, they canassist in identifying particular population groups that need to be targeted by specificintervention strategies.
Total sessions per week
The number of times a respondent reported participating in a physical activity ispresented. This is of interest because, the majority of participants report fewer than sixsessions per week and it is assumed that the sessions relate to ‘days’ of activity. Hence, thenumber of sessions can be related to the current recommendations, which are toparticipate in activities on most, if not all, days of a week, i.e. five sessions or more in oneweek.
Total time per week
The total time spent participating in physical activity is calculated from the sum of totaltime spent in walking, moderate-intensity physical activity and vigorous-intensity physicalactivity during the previous week.
Physical inactivity (sedentary)
Respondents reporting no participation in physical activity are classified as beingphysically inactive or sedentary.

17
‘Sufficient’ physical activity to confer a health benefit
The level of physical activity that is ‘sufficient’ to confer a health benefit has been subjectto debate. The accrual of 150 minutes of moderate-intensity (at least) physical activity overa period of one week is believed to confer health benefit and reflects the current NationalPhysical Activity Guidelines message (DHAC 1999). Walking is included as a moderate-intensity physical activity.
Health benefits can also be obtained by participating in vigorous-intensity physicalactivity, in approximate proportion to the total amount of activity performed, measured inminutes of physical activity. Participation in vigorous-intensity leisure-time physicalactivity for 60 to 90 minutes over a period of a week will confer health benefits.
The definition of ‘sufficient’ does not include gardening or heavy yardwork (althoughthese activities were self-rated as being of vigorous intensity) because there is limitedresearch regarding the actual energy expenditure of these activities. It is likely that, infuture, these activities will be included as indicators of moderate-intensity physicalactivity.
Insufficient physical activity is defined as some reported physical activity, but not meetingeither of the ‘sufficient’ criteria.
To avoid measurement error due to over-reporting (Bauman 1987), data were truncatedusing the following criteria:
• maximum ‘allowable’ recorded time doing any of the three types of physical activitywas 14 hours per week (any reported time spent greater than 14 hours was recoded to14 hours); and
• maximum ‘allowable’ recorded total hours per week was 28 hours per week (any totalhours greater than 28 were recoded to equal 28 hours).
Fewer than 1% of the data required truncation.
Two working definitions of ‘sufficient’ physical activity are used in this report, derivedfrom the information collected on total time and total sessions.
‘Sufficient’ time
The first definition of ‘sufficient’ physical activity was based on the sum of the totalminutes of walking, moderate-intensity and/or vigorous-intensity physical activity.‘Sufficient’ health benefit is obtained if minutes walking plus minutes moderate plus (twicevigorous minutes) is greater than or equal to 150 minutes. Vigorous-intensity physicalactivity was weighted by a factor of two, to account for its greater intensity.
This definition is used to provide estimates of participation in the previous week and in thepast six months (i.e. ‘usual’ week).
‘Sufficient’ time and sessions
A second definition of ‘sufficient’ activity to confer health used in this report takes intoaccount frequency of participation. For this definition, ‘sufficient’ activity is only achievedwhen 150 minutes of activity (when vigorous-intensity activity is weighted by a factor oftwo) is accrued in at least five separate sessions of activity.
This definition is applied only to participation over the previous week.

18
WeightingThe data collected in the survey were provided with weights which were used to obtainestimates which were representative of the national population. The age groups used forweighting were the standard age groups, except for the age group 70–74 which wasreplaced by 70–75 (see page 14).
To allow for the impact of relatively more interviews in New South Wales compared to thenumber of interviews in other States and Territories, data were down-weighted to aneffective sample size of 3,000. This weighting (WSAMPras) was used when estimating theproportion of people who are physically active and for statistical tests of significance at thenational level.
The formulas used to calculate the weights are:
To estimate numbers for total and regional populations,
ras
rasras n
NWPOP =
where WPOPras is the weight used to estimate numbers applied to each respondent inregion r, age group a, with sex s, Nras is the population in region r, age group a, with sex s,and nras is the sample size (i.e. number of respondents) in region r, age group a, with sex s.
To estimate proportions and to perform statistical tests at the national level,
Nn
WPOPWSAMP rasras ×=
where WSAMPras is the weight used to estimate proportions applied to each respondent inregion r, age group a, with sex s, WPOPras is the weight used to estimate numbers appliedto each respondent in region r, age group a, and with sex s, N is the total nationalpopulation (aged 18 to 75 years), and n is the total national sample size (i.e. number ofrespondents).
Predictor variables of participationLogistic regression was used to summarise associations between the sociodemographicpredictor variables and participation in ‘sufficient’ physical activity.

19
5. Demographic profile of surveyrespondents
This section provides a demographic profile of respondents in the 1999 survey. AustralianBureau of Statistics (ABS) Population Statistics Group (PSG) standards were used for thedemographic categories sex, age and main language spoken at home. For the otherdemographics listed below, definitions used in the 1997 survey were adopted forcomparability.The following demographic characteristics of respondents are provided:• Sex• Age• Number of children under 18 years living in the household• Number of children aged 5 and under living in the household• Main language spoken at home• Marital status• Education level• Occupation status• BMI.
Age and sexTable 5.1 shows the profile of respondents by age group and sex. The mean age ofrespondents in 1999 was 42 years.
The 1999 survey comprised a weighted sample of 3,000 adults, derived from an actualsample of 3,841 telephone survey respondents. In the weighted sample, men comprised49.6% and women comprised 50.4% of the total. The age and sex distribution ofrespondents in the 1999 survey was very similar to that in the 1997 survey (ASC 1998).
The distribution by age and sex of the 1999 survey respondents is comparable with theAustralian population in 1998 (ABS 1999) (Table 5.1).
Table 5.1: Age and sex of survey respondents (per cent), 1999
Men Women Persons
Age group(years)
1999survey
Australianpopulation
1999survey
Australianpopulation
1999survey
Australianpopulation
18–29 26.0 25.8 25.4 25.1 25.7 25.5
30–44 33.1 32.7 33.4 32.8 33.2 32.8
45–59 25.0 25.7 24.1 25.1 24.6 25.4
60–75 15.9 15.8 17.1 16.9 16.5 16.3
Total 100.0 100.0 100.0 100.0 100.0 100.0
Note: Australian population data is for 1998 (ABS 1999).

20
Children in the householdTable 5.2 shows the percentage of children in the household for respondents in 1999. Itshows the percentage of households with children under 18 years and the percentage ofhouseholds with children aged 5 years or under.
Forty-three per cent of households had one or more children under 18 years and less than20% had children aged 5 years or under.
Table 5.2: Percentage of children in the household for survey respondents, 1999
Household composition Percentage of respondents
Children (aged 5 years or under)
Nil 80.9
1 or more 19.1
Total 100.0
Children (less than 18 years)
Nil 56.9
1 or more 43.1
Total 100.0
Note: Components may not add to totals due to rounding.
Language spoken, marital status, education level,occupation statusTable 5.3 shows the main language spoken at home, marital status, education level andoccupation of respondents.
Six per cent of respondents used a main language other than English at home.
Nearly 70% of respondents were married or in a de facto relationship, 28% were single ornever married and 3% were widowed.
Thirty-eight per cent of respondents had attained the Higher School Certificate orequivalent, 37% had less than 12 years’ education and 25% had a tertiary education.
Nearly one-third of respondents were managers or administrators, 25% were in whitecollar professions, 14% did home duties, 12% were retired, 9% in blue collar occupations,5% were students, and 3% were unemployed.

21
Table 5.3: Language spoken, marital status, education level, occupation of surveyrespondents, 1999
Percentage of respondents
Main language spoken at home
English 94.4
Other 5.6
Total 100.0
Marital status
Never married/single 27.8
Married/de facto 69.1
Widowed 3.0
Total 100.0
Education level
Less than 12 years 37.0
HSC or equivalent 38.0
Tertiary 25.0
Total 100.0
Occupation status
Manager/administrator 32.6
White collar 25.0
Home duties 14.1
Retired 11.9
Blue collar 8.5
Student 4.6
Unemployed 3.2
Total 100.0
HSC = Higher School Certificate. White collar = professional, para-professional. Blue collar = tradesperson, clerk,salesperson and personal service worker, plant and machine operator/driver, labourer.
Note: Components may not add to totals due to rounding.

22
Body mass indexBMI is a measure of a person’s weight in relation to their height, calculated as weight inkilograms divided by height in metres squared. Physical measurement of overweight andobesity was beyond the scope of this survey, but data were collected on self-reportedheight and weight for calculation of BMI.
The BMI categories are:
• underweight: BMI less than 18.5
• healthy weight: BMI from 18.5 to less than 25
• overweight: BMI from 25 to less than 30
• obese: BMI greater than or equal to 30.
The mean BMI of respondents in 1999 was 25.1. This was similar to that of respondents in1997 (mean = 24.8) (ASC 1998).
Table 5.4 shows the distribution of the sample according to the BMI categories, based onself-reported height and weight. Forty-four per cent of people were above healthy weight(32% overweight and 12% obese), 53% were within the healthy weight range, and 3%were underweight. The proportion of overweight and obese adults (18–75 years) in 1999was similar to that found for adults 18–74 years from self-reported information collected inthe 1995 National Health Survey (ABS 1997; DHAC & AIHW 1999b).
Table 5.4 shows that women were more likely to have a healthy weight (59%) than weremen (47%). Levels of obesity were similar for men (12%) and women (13%). Underweightwas more common among women (4%) than men (2%). The proportion of people in thehealthy weight category decreased with age and increased with level of education. Theprevalence of obesity generally increased with age and decreased with level of education,from 15% in those with less than 12 years of education to 8% among those with tertiaryeducation.

23
Table 5.4: BMI categories of survey respondents by age, sex, education level (per cent), 1999
Underweight Healthy weight Overweight Obese
Sex
Men 1.7 46.9 39.5 11.9
Women 4.2 59.0 24.0 12.7
Persons 3.0 52.9 31.8 12.3
Age group (years)
18–29 7.5 65.9 19.8 6.8
30–44 1.9 53.1 32.9 12.2
45–59 0.8 46.0 36.9 16.3
60–75 1.5 42.8 40.5 15.2
Education level
Less than 12 years 2.5 46.9 35.5 15.2
HSC or equivalent 3.7 55.6 28.1 12.7
Tertiary 2.9 57.7 31.8 7.7
HSC = Higher School Certificate.

24
6. Physical activity patterns ofAustralian adults
The purpose of this section is to profile the physical activity patterns of Australians adultsaged 18–75 years in 1999 and show trend comparisons with the 1997 survey whererelevant. Statistically significance (at least p<0.05) is reported as a significant change in thefollowing sections.
Total sessions spent in activitiesTable 6.1 shows the percentage of sessions of each category of physical activity thatrespondents participated in during the previous week. Thirty-five per cent of peoplereported that they walked (for recreation/exercise or to get to or from places) on at leastfive occasions during the previous week. Lower rates were noted for regular moderate-intensity or vigorous-intensity activities, with 9% reporting they participated in vigorous-intensity activity at least five times, and only 5% reporting that they participated inmoderate-intensity physical activity on at least five occasions during the week.Participation in regular vigorous-intensity physical activity was more common among men(11%) than women (6%).
Forty per cent of people aged 18–29 years reported walking five or more times during theprevious week, and 33% of people in this age group reported doing vigorous-intensityactivity on at least three occasions during the previous week (Table 6.2).
Thirty-seven per cent of people aged 60–75 years reported walking five or more timesduring the previous week, and 7% of people in this age group reported doing vigorous-intensity activity on at least three occasions during the previous week. Vigorous-intensitygardening and yardwork on at least three occasions was more common among older agegroups.
Between 1997 and 1999, there has been a significant decline in the number of sessions ofphysical activity that people reported during the previous week. Fifty-eight per cent ofrespondents walked at least three times during the week in 1997 compared with 54% in1999. The proportion of people reporting three or more sessions of vigorous-intensityactivity during the week also declined from 24% in 1997 to 19% in 1999. The proportion ofpeople doing moderate-intensity physical activity three or more times per week remainedconstant between 1997 (11%) and 1999 (10%). Similarly, participation in vigorous-intensity gardening or yardwork on at least three occasions per week remained constantbetween 1997 (10%) and 1999 (11%).

25
Table 6.1: Sessions of physical activity in the previous week by sex (per cent), 1999
Physical activity Men Women Persons
Walking
Nil 31.5 24.1 27.8
1–2 17.7 19.3 18.5
3–4 16.6 20.5 18.6
5 or more 34.2 36.0 35.1
Total 100.0 100.0 100.0
Moderate-intensity(a)
Nil 67.2 75.6 71.4
1–2 22.0 14.9 18.4
3–4 6.1 5.2 5.7
5 or more 4.7 4.3 4.5
Total 100.0 100.0 100.0
Vigorous-intensity(b)
Nil 59.1 65.4 62.3
1–2 19.1 19.0 19.1
3–4 10.6 9.2 9.9
5 or more 11.1 6.4 8.7
Total 100.0 100.0 100.0
Vigorous-intensity gardening/yardwork
Nil 54.0 60.5 57.3
1–2 32.8 30.0 31.4
3–4 7.3 5.4 6.3
5 or more 5.9 4.1 5.0
Total 100.0 100.0 100.0
(a) Examples of moderate-intensity activities are gentle swimming, social tennis.
(b) Examples of vigorous-intensity activities are jogging, cycling, aerobics, competitive tennis.
Note: Components may not add to totals due to rounding.

26
Table 6.2: Sessions of physical activity in the previous week by age group (per cent), 1999
Age group (years)
Physical activity 18–29 30–44 45–59 60–75
Walking
Nil 20.0 31.6 29.3 30.2
1–2 20.5 19.8 18.0 13.6
3–4 19.3 17.9 18.4 19.1
5 or more 40.2 30.8 34.4 37.1
Total 100.0 100.0 100.0 100.0
Moderate-intensity(a)
Nil 69.9 72.7 75.4 65.3
1–2 21.3 19.2 15.7 16.6
3–4 4.8 4.8 3.9 11.3
5 or more 4.0 3.3 4.9 6.9
Total 100.0 100.0 100.0 100.0
Vigorous-intensity(b)
Nil 40.9 60.6 72.0 84.4
1–2 26.4 21.7 14.8 8.7
3–4 17.3 9.2 7.3 3.8
5 or more 15.5 8.5 5.8 3.0
Total 100.0 100.0 100.0 100.0
Vigorous-intensity gardening/yardwork
Nil 68.5 52.2 52.1 57.9
1–2 26.7 37.5 33.6 23.3
3–4 2.9 6.3 8.0 9.1
5 or more 1.9 4.0 6.2 9.7
Total 100.0 100.0 100.0 100.0
(a) Examples of moderate-intensity activities are gentle swimming, social tennis.
(b) Examples of vigorous-intensity activities are jogging, cycling, aerobics, competitive tennis.
Note: Components may not add to totals due to rounding.

27
Total time spent in activitiesTable 6.3 shows the total time (in minutes) people reported spending in each category ofphysical activity in the previous week. The inclusion of the 75th percentile and 95thpercentiles in Table 6.3 is necessary because the distribution of activity is skewed,indicating that some caution is needed in interpreting the mean values. However, forillustrative purposes (and because the medians are often zero), mean values are shown foreach category of activity, by each age group and sex (Table 6.4).
Table 6.3 shows that walking was the most common activity, followed by vigorous-intensity gardening and yardwork, other vigorous-intensity activities and moderate-intensity activities other than walking.
Between 1997 and 1999, the total time spent participating in physical activity declinedsignificantly. The mean time spent walking declined (137 to 114 minutes per week, Table6.3) between 1997 and 1999. Similarly, the mean time people spent participating invigorous-intensity activities declined, from 91 to 65 minutes; and moderate-intensityactivities declined, from 62 to 54 minutes. Mean time spent in physical activity declined forall age groups except for those aged 60–75 years (ASC 1998). For this age group the meantime spent in each of walking, other moderate activity, vigorous gardening and yardwork,and other vigorous activities increased between 1997 and 1999.
Table 6.3: Total time (minutes) for physical activity during the previous week, 1997 and 1999
Walking Moderate-intensity Vigorous-intensity Vigorous gardening(a)
1997 1999 1997 1999 1997 1999 1997 1999
Mean 137 114 62 54 91 65 87 77
75th percentile 180 170 30 30 120 60 90 90
95th percentile 487 420 420 360 480 360 480 420
(a) Vigorous-intensity gardening and yardwork.
Mean minutes of total activity by age and sex show some clear patterns (Table 6.4).Walking was common in both sexes, across age groups, and increased in prevalenceamong older men. Older adults of both sexes spent the greatest time in moderate-intensityphysical activities. Men, especially those aged 18–29 years, spent the most time invigorous-intensity activity. Men also spent more time than did women doing vigorous-intensity gardening and yardwork, and this increased with age.
Table 6.4: Mean minutes for physical activity during the previous week by age group and sex, 1999
Walking Moderate-intensity Vigorous-intensity Vigorous gardening(a)
Age group(years) Men Women Men Women Men Women Men Women
18–29 111.3 132.1 59.3 29.5 148.8 91.7 53.7 29.8
30–44 98.1 110.4 58.2 24.2 74.2 49.8 95.7 67.4
45–59 98.0 122.5 59.5 37.0 47.2 36.6 107.2 76.3
60–75 146.1 112.5 132.3 79.6 23.5 16.3 139.0 65.3
All ages 109.2 119.2 70.6 38.1 78.8 51.5 94.5 59.6
(a) Vigorous-intensity gardening and yardwork.
28
Measures of physical activityThis section describes current patterns and trends for the following measures of physicalactivity:
• physical inactivity (sedentary, no minutes of activity); and
• physical activity to confer a health benefit:
− ‘sufficient’ time (150 minutes per week, using the sum of walking, moderateactivity and vigorous activity (weighted by two));
− ‘sufficient’ time and sessions (150 minutes and five sessions of activity per week).
Physical inactivity (sedentary)
In 1999, almost 15% of Australian adults reported no leisure-time physical activity duringthe previous week (Table 6.5). Sedentary behaviour increased with age, from 6% in people18–29 years old to around 18% in those aged 45 years and over. The prevalence ofsedentary behaviour in people with less than 12 years of education (20%) was almosttwice that of people with tertiary education (11%).
The proportion of people reporting no physical activity did not change significantly from1997 to 1999 (13.4% to 14.6%). However, during this period there was a significantincrease in physical inactivity among people aged 30–44 years, from 12% to 17%. Therewere no changes in physical inactivity for other age groups during that period.
Between 1997 and 1999, the proportion of people with tertiary education reporting nophysical activity increased from 6% to 11%, although no significant changes were notedfor other categories of educational attainment.
Physical activity to confer a health benefit
‘Sufficient’ time
The categories of ‘insufficiently active’ and ‘sufficiently active’ were derived usingparticipation in weighted vigorous-intensity activity to reflect its extra health benefits.
In Table 6.6, 29% of people were doing some physical activity, but not enough to becategorised as ‘sufficient’. Participation at this level was more common among women(32%) than men (26%). Participation increased with age (until age 60) and decreased witheducational attainment.
Over half (57%) of the population was undertaking ‘sufficient’ physical activity to obtain ahealth benefit. Participation at this level was more common among men (60%) thanwomen (54%) and decreased with age, until age 60. Participation in ‘sufficient’ activityincreased with education, from 50% in those with less than 12 years of education to 62%in those with tertiary education.

29
Table 6.5: Percentage of people reporting no physical activity(sedentary) during the previous week, 1997 and 1999
1997 1999
Sex
Men 13.7 14.6
Women 13.1 14.7
Persons 13.4 14.6
Age group (years)
18–29 7.3 6.3
30–44 11.7 16.9
45–59 18.1 18.2
60–75 19.2 17.9
Education
Less than 12 years 18.2 19.5
HSC or equivalent 13.1 12.5
Tertiary 6.2 10.9
HSC = Higher School Certificate.
Table 6.6: Percentage of people achieving ‘sufficient’ time during the previous weekby sex, age group and education level, 1999
Sedentary Insufficient ‘Sufficient’(a)
Sex
Men 14.6 25.9 59.6
Women 14.7 31.5 53.8
Persons 14.6 28.7 56.6
Age group (years)
18–29 6.3 25.0 68.7
30–44 16.9 29.6 53.5
45–59 18.2 31.9 50.0
60–75 17.9 28.1 54.1
Education
Less than 12 years 19.5 30.9 49.6
HSC or equivalent 12.5 27.9 59.7
Tertiary 10.9 26.7 62.3
HSC = Higher School Certificate.
(a) ‘Sufficient’ time is defined as 150 minutes per week, using the sum of walking, moderate activity and vigorousactivity (weighted by two).

30
‘Sufficient’ time and sessions
Table 6.7 shows the proportion of people doing insufficient and ‘sufficient’ physicalactivity to obtain a health benefit, when ‘sufficient’ is defined as the accumulation of atleast 150 minutes of physical activity (where vigorous-intensity activity is weighted by afactor of two) in at least five sessions over the week. When defined in this manner, 45% ofpeople participated in physical activity to obtain a health benefit. Participation decreasedwith age until age 60. About 43% of women and 47% of men participated at this level.Participation in ‘sufficient’ physical activity increased with education level. Only 39% ofpeople with less than 12 years of education did ‘sufficient’ physical activity compared with52% of people with tertiary education.
Table 6.7: Percentage of people achieving ‘sufficient’ time and sessions during theprevious week by sex, age group and education level, 1999
Sedentary Insufficient ‘Sufficient’(a)
Sex
Men 14.6 38.3 47.1
Women 14.7 41.9 43.4
Persons 14.6 40.2 45.2
Age group (years)
18–29 6.3 37.5 56.3
30–44 16.9 41.9 41.2
45–59 18.2 41.6 40.2
60–75 17.9 38.5 43.6
Education
Less than 12 years 19.5 41.9 38.6
HSC or equivalent 12.5 40.5 47.0
Tertiary 10.9 36.8 52.3
HSC = Higher School Certificate.
(a) ‘Sufficient’ time and sessions is defined as 150 minutes (using the sum of walking, moderate activity andvigorous activity (weighted by two)) and five sessions of activity per week.
‘Sufficient’ levels by age and sex
Figures 6.1, 6.2, and Table A3.1 show participation levels of men and women in each agegroup. For men, participation decreased with age until age 60 when participationincreased to levels greater than those seen among men in the 30–44 age group. This wasdue to greater participation in moderate-intensity physical activity among older men. Thispattern was not seen for women, where participation declined with age.
These patterns were seen for both measures of ‘sufficient’ activity.

31
0
10
20
30
40
50
60
70
80
90
100
18–29 30–44 45–59 60–75 All ages
Men
Women
Figure 6.1: Percentage of people achieving a ‘sufficient‘ time in physical activities in the previous week, 1999
Per cent
Age group (years)
Note: ‘Sufficient’ time is defined as 150 minutes per week, using the sum of walking, moderate activity and vigorous activity (weighted by two).
0
10
20
30
40
50
60
70
80
90
100
18–29 30–44 45–59 60–75 All ages
Men
Women
Figure 6.2: Percentage of people achieving a ‘sufficient‘ time and sessions in physical activities in the previous week, 1999
Per cent
Age group (years)
Note: ‘Sufficient’ time and sessions is defined as 150 minutes (using the sum of walking, moderate activity and vigorous activity (weighted by two)) and five sessions of activity per week.

32
Trends 1997 and 1999
Participation in physical activity has declined significantly between 1997 and 1999(Table 6.8). This decline was true for both interpretations of the ‘sufficient’ category, forboth men and women, for ages up to 60 years and across levels of educational attainment.The continued participation by those 60 years of age and older is of particular interestgiven the public education campaign to promote physical activity among older peopleduring 1999 (NSW Health 2000).
Data for both definitions of ‘sufficient’ activity (described page 17) are presented below.For the ‘sufficient’ time category (at least 150 minutes of physical activity is accumulated,where vigorous-intensity activity is weighted by two) the decline in participation at‘sufficient’ level dropped from 62% to 57% between 1997 and 1999. The decline wasgreater for women (61% to 54%) than for men (63% to 60%), among those aged 30–44years (64% to 54%), and for those with tertiary education (72% to 62%).
When ‘sufficient’ time and sessions is calculated (the accumulation of at least 150 minutesof physical activity, where vigorous-intensity activity is weighted by a factor of two, in atleast five sessions over the week) the decline in participation was from 51% to 45%between 1997 and 1999, with similar groups showing the most decline, namely women,those aged 30–44 years and the tertiary-educated group.
Table 6.8: Trends in ‘sufficient’ levels of activity (per cent), 1997 and 1999
‘Sufficient’ time(a) ‘Sufficient’ time and sessions (b)
1997 1999 1997 1999
Sex
Men 63.4 59.6 51.7 47.1
Women 61.1 53.8 50.1 43.4
Persons 62.2 56.6 50.9 45.2
Age group (years)
18–29 74.0 68.7 62.9 56.3
30–44 63.6 53.5 51.6 41.2
45–59 53.8 50.0 43.1 40.2
60–75 53.4 54.1 42.7 43.6
Education
Less than 12 years 55.1 49.6 43.9 38.6
HSC or equivalent 63.0 59.7 51.4 47.0
Tertiary 71.9 62.3 61.2 52.3
HSC = Higher School Certificate.
(a) ‘Sufficient’ time is defined as 150 minutes per week, using the sum of walking, moderate activity and vigorous activity (weighted bytwo).
(b) ‘Sufficient’ time and sessions is defined as 150 minutes (using the sum of walking, moderate activity and vigorous activity(weighted by two)) and five sessions of activity per week.

33
Physical activity habits (a usual week)
Time spent in activities over the previous six months
The mean amount of time people reported that they usually spent (i.e. each week over thepast six months) in various physical activities declined significantly from 1997 to 1999(Table 6.9). The average time spent in each activity (walking, moderate, vigorous)decreased between 1997 and 1999. The greatest decline was for participation in vigorousactivity, from a mean of 104 minutes in 1997 to 75 minutes in 1999.
Table 6.9: Mean minutes of physical activity over the previous six months, 1997 and 1999
Walking Moderate-intensity Vigorous-intensity(a)
1997 1999 1997 1999 1997 1999
Mean 158.5 120.7 65.5 57.6 103.8 75.1
75th percentile 210 180 60 60 120 100
95th percentile 600 420 360 300 480 360
(a) Vigorous-intensity activity is unweighted.
Physical activity to confer a health benefit over the previous six months
Questions about the previous six months’ activity were asked to reflect usual physicalactivity patterns. These three questions only asked about usual total weekly time forparticipation in moderate, vigorous and walking activities. Since no information wascollected on the number of sessions done in the previous six months, a ‘sufficient’ time andsessions measure could not be calculated. The following results are produced using onlythe ‘sufficient’ time measure, with the same derivation as reported in the previous section.
Table 6.10 shows that the proportion of people who reported they were usually active (i.e.in a typical week over the previous six months) active at ‘sufficient’ levels to achieve ahealth benefit decreased from 1997 to 1999 (69% to 62%). The pattern of decline wassimilar to that shown in Figures 6.1 and 6.2, and occurred for each age group (except forages 45–59 years), for men and women, and for each level of educational attainment.
Age and sex
Figure 6.3 and Table A3.1 shows that usual participation (i.e. over the past six months) in‘sufficient’ activity declined with age for men until age 60 when it increased to levelsgreater than that seen among men aged 30–44 years. For women, usual weeklyparticipation at ‘sufficient’ levels declined across age groups.

34
Table 6.10: Percentage of people achieving a ‘sufficient’ time inphysical activity over the previous six months, 1997 and 1999
‘Sufficient’ time(a)
1997 1999
Sex
Men 71.6 65.6
Women 67.1 57.4
Persons 69.3 61.5
Age group (years)
18–29 83.1 75.8
30–44 70.7 58.1
45–59 58.9 54.1
60–75 60.5 57.2
Education
Less than 12 years 62.2 52.8
HSC or equivalent 71.5 65.1
Tertiary 77.2 68.6
HSC = Higher School Certificate.
(a) ‘Sufficient’ time is defined as 150 minutes per week, using the sum of walking, moderateactivity and vigorous activity (weighted by two).
0
10
20
30
40
50
60
70
80
90
100
18–29 30–44 45–59 60–75 All ages
Men
Women
Figure 6.3: Percentage of people achieving a ‘sufficient‘ time in physical activities in the previous six months, 1999
Per cent
Age group (years)
Note: ‘Sufficient’ time is defined as 150 minutes per week, using the sum of walking, moderate activity and vigorous activity (weighted by two).

35
Correlation of ‘usual’ week and ‘previous’ week
It is of interest to assess the relationship between the reported average weekly physicalactivity over the previous six months (i.e. a usual week) and the activity reported for theprevious week. Although reporting of the usual week provided higher estimates of activity,the two measures showed broad agreement. In terms of total minutes reported, intra-classcorrelation (ICC) of the two measures was 0.76 (95% confidence interval (CI) 0.74–0.77).In 1997, similar agreement was found (ICC = 0.77, 95% CI = 0.75–0.78).
When categorised as ‘sufficient’ (e.g. 57% in previous week; 62% in usual week), goodagreement was also obtained (kappa = 0.65, 95% CI 0.62–0.67). This result was consistentwith the 1997 survey results (kappa = 0.66, 95% CI 0.63–0.69).
36
7. Awareness and understanding ofcurrent physical activity mediamessages
Promotion of physical activity in AustraliaThe central aim of promoting physical activity is to improve health and wellbeing bypromoting increased levels of moderate-intensity activity in the Australian population.Strategies and approaches for increasing physical activity at the population level includethose which target individuals through health professionals, in settings where they liveand work, and through community-wide campaigns and programs. Obtaining timelyinformation on physical activity habits is essential for monitoring the effectiveness ofcommunity-wide efforts to promote exercise. Regular information on physical activityhabits is important for assessing national trends, identifying sedentary groups for targetedprograms, and for better planning of sport and recreation facilities.
Active Australia
The Active Australia concept was launched in December 1996. It involves a partnership ofthe Australian Sports Commission, DHAC, the National Office of Local Government, andSport and Recreation departments in all States and Territories.
Active Australia is a public health initiative to promote regular moderate-intensity physicalactivity and to increase participation in sports. It is unique in that it is a national initiativepromoting population-wide strategies and public policies to encourage people to becomeand remain physically active at levels ‘sufficient’ to confer a health benefit.
Active Australia’s vision is for ‘all Australians to be actively involved in sport, communityrecreation, fitness, outdoor recreation and other physical activities’ (DHFS 1998). The threemajor goals of Active Australia are to realise and enhance lifelong participation in physicalactivity; to realise the social, health and economic benefits of participation in physicalactivity; and to develop quality infrastructure, opportunities and services to supportparticipation in physical activity.
Mass media campaigns conducted through Active Australia
The first campaign produced through Active Australia was a pilot physical activitycampaign in New South Wales, implemented in February and March 1998. It was fundedby NSW Health, with the support of DHAC and Active Australia. The central theme of thiscampaign was ‘Exercise—you only have to take it regularly, not seriously’. It wasdisseminated through various media, including mainstream television, radio and print.
The ‘Rusty‘ (tin man) campaign was a more specific initiative in the following year whichfocussed on older Australians. This campaign was a Commonwealth, State and Territoryinitiative celebrating the International Year of Older Persons in 1999. It was jointly fundedby Active Australia, the Commonwealth Department of Veterans’ Affairs, NSW Health andNew South Wales Sport and Recreation. In addition, versions of this campaign were
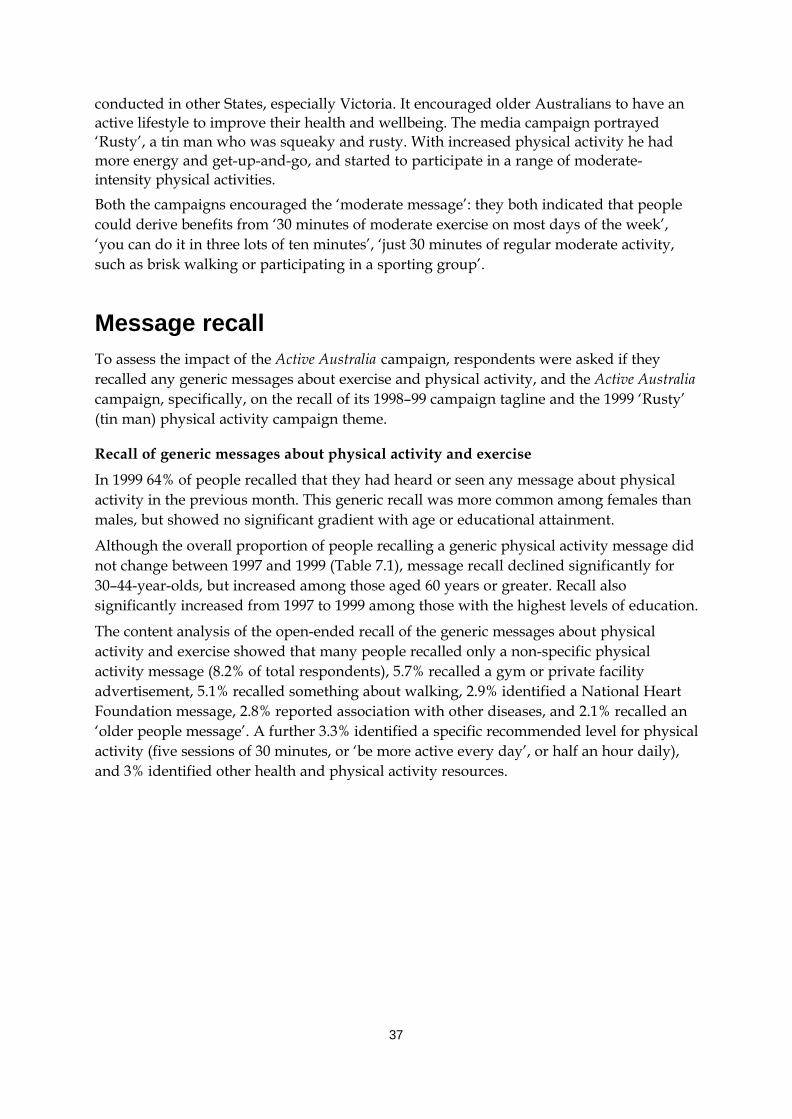
37
conducted in other States, especially Victoria. It encouraged older Australians to have anactive lifestyle to improve their health and wellbeing. The media campaign portrayed‘Rusty’, a tin man who was squeaky and rusty. With increased physical activity he hadmore energy and get-up-and-go, and started to participate in a range of moderate-intensity physical activities.
Both the campaigns encouraged the ‘moderate message’: they both indicated that peoplecould derive benefits from ‘30 minutes of moderate exercise on most days of the week’,‘you can do it in three lots of ten minutes’, ‘just 30 minutes of regular moderate activity,such as brisk walking or participating in a sporting group’.
Message recallTo assess the impact of the Active Australia campaign, respondents were asked if theyrecalled any generic messages about exercise and physical activity, and the Active Australiacampaign, specifically, on the recall of its 1998–99 campaign tagline and the 1999 ‘Rusty’(tin man) physical activity campaign theme.
Recall of generic messages about physical activity and exercise
In 1999 64% of people recalled that they had heard or seen any message about physicalactivity in the previous month. This generic recall was more common among females thanmales, but showed no significant gradient with age or educational attainment.
Although the overall proportion of people recalling a generic physical activity message didnot change between 1997 and 1999 (Table 7.1), message recall declined significantly for30–44-year-olds, but increased among those aged 60 years or greater. Recall alsosignificantly increased from 1997 to 1999 among those with the highest levels of education.
The content analysis of the open-ended recall of the generic messages about physicalactivity and exercise showed that many people recalled only a non-specific physicalactivity message (8.2% of total respondents), 5.7% recalled a gym or private facilityadvertisement, 5.1% recalled something about walking, 2.9% identified a National HeartFoundation message, 2.8% reported association with other diseases, and 2.1% recalled an‘older people message’. A further 3.3% identified a specific recommended level for physicalactivity (five sessions of 30 minutes, or ‘be more active every day’, or half an hour daily),and 3% identified other health and physical activity resources.
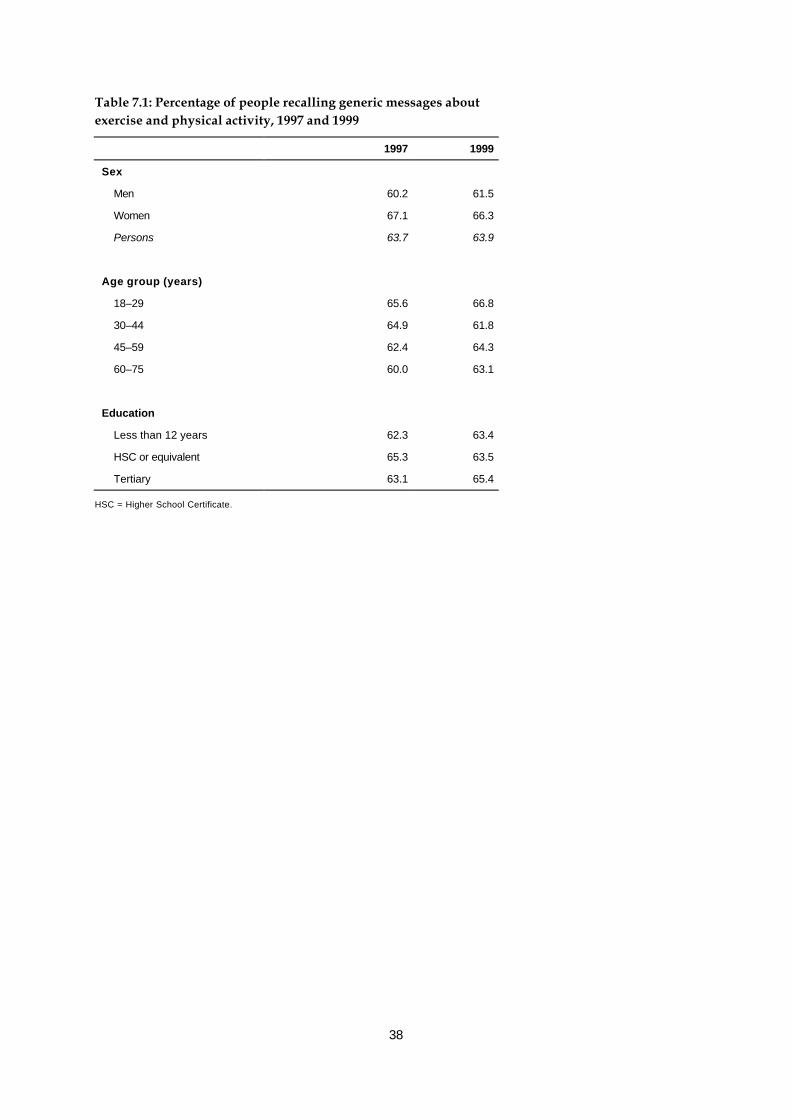
38
Table 7.1: Percentage of people recalling generic messages aboutexercise and physical activity, 1997 and 1999
1997 1999
Sex
Men 60.2 61.5
Women 67.1 66.3
Persons 63.7 63.9
Age group (years)
18–29 65.6 66.8
30–44 64.9 61.8
45–59 62.4 64.3
60–75 60.0 63.1
Education
Less than 12 years 62.3 63.4
HSC or equivalent 65.3 63.5
Tertiary 63.1 65.4
HSC = Higher School Certificate.
39
Recall of the Active Australia campaign
An unprompted question on the recall of the Active Australia campaign was asked for thefirst time in 1999 and the results are presented in Table 7.2.
In 1999 almost 18% of Australian adults had heard of the Active Australia campaign.Knowledge of this campaign was more common among people aged 30–44 years (19%)than among older or younger people. Recall of the Active Australia campaign was betteramong those with tertiary education (21%) than those with the HSC (17%) or less than 12years of education (16%).
The open-ended question about Active Australia was content-analysed and closed-coded(see coding frame in Appendix 4). The most frequent responses were a generic physicalactivity promotional message (reported by 4.3% of total), whereas 1.3% identified anational campaign, 1.8% identified the ‘Rusty’ campaign or older adults message, 0.8%identified walking, and 0.4% specified an ‘Active Australia day in October’.
Table 7.2: Percentage of people recalling the unprompted ActiveAustralia campaign, 1999
Percentage of respondents
Sex
Men 17.0
Women 18.6
Persons 17.8
Age group (years)
18–29 16.2
30–44 19.2
45–59 17.7
60–75 17.9
Education
Less than 12 years 16.4
HSC or equivalent 17.4
Tertiary 20.6
HSC = Higher School Certificate.

40
Recall of the Active Australia tagline
Prompted recall of the Active Australia tagline ‘Exercise—you only have to take it regularly,not seriously’ (Table 7.3) increased markedly from 14% to 42% between 1997 and 1999.Increases in recalling this message occurred for both men and women, all age groups andall levels of education. Note that the pre-campaign levels are a ‘spurious baseline’ as thecampaign had not been conducted yet—this is typical of media campaigns, and this ratewas higher for the least educated group and among older adults.
The increase in recalling this specific campaign occurred across all ages, both sexes andall education groups. This indicates increased awareness of the Active Australia mediacampaign, with awareness maintained at around 40% of the population approximately18 months after the campaign had been conducted.
Content analysis of the open-ended question relating to the Active Australia taglinerevealed that 15.4% repeated the message, 1.6% reported ‘fun’, 2.6% identified the ‘30minutes daily’ theme, 5.6% reported ‘some or any level of even gentle exercise useful’, and3% identified a walking message. Some (1.8%) reported (inappropriately) that activityonce or twice a week was ‘sufficient’.
Table 7.3: Percentage of people recalling the prompted ActiveAustralia tagline ‘Exercise—you only have to take it regularly, notseriously’, 1997 and 1999
1997 1999
Sex
Men 14.5 39.6
Women 14.1 44.0
Persons 14.4 41.8
Age group (years)
18–29 11.4 46.8
30–44 14.1 42.0
45–59 16.6 39.7
60–75 16.3 36.8
Education
Less than 12 years 17.1 40.8
HSC or equivalent 13.9 44.3
Tertiary 10.9 39.5
HSC = Higher School Certificate.

41
Recall of the ‘Rusty’ campaign
Table 7.4 shows that 21% of people recalled ‘Rusty’, the (1999 International Year of OlderPeople) mass media campaign. Recall of this campaign tended to increase with age from19% among those 18–29 years to 24% among those aged 60 years and over. Recall of the‘Rusty’ campaign declined with increasing levels of education.
Content analysis of the open-ended question relating to ‘Rusty’ identified the mostcommon understanding of this message (3.8%) was describing features of theadvertisement in detail, 3.8% reporting ‘use it or lose it’ or ‘get up and go’, 2.6% reportedarthritis, ‘seizing up’ or movement stiffness, 1.7% identified walking daily and 3.7%reported other physical activity messages.
Table 7.4: Percentage of people recalling the ‘Rusty’ campaign, 1999
Percentage of respondents
Sex
Men 20.6
Women 21.7
Persons 21.2
Age group (years)
18–29 19.4
30–44 21.9
45–59 19.9
60–75 24.3
Education
Less than 12 years 22.1
HSC or equivalent 22.0
Tertiary 18.5
HSC = Higher School Certificate.
42
Understanding of physical activity messagesIt is generally accepted that people need to recognise and understand public healthmessages in order for them to change behaviour to comply with such messages.
To assess whether people remember particular messages about physical activity,respondents were asked to rate (on a five-point Likert scale) the extent to which theyagreed with the statements below:
Message 1: Taking the stairs at work or generally being more active for at least30 minutes each day is enough to improve your health.
Message 2: Half an hour of brisk walking on most days is enough to improve yourhealth.
Message 3: To improve your health it is essential for you to do vigorous exercise for atleast 20 minutes each time, three times a week.
Message 4: Exercise doesn’t have to be done all at one time—blocks of 10 minutes areokay.
Message 5: Moderate exercise that increases your heart rate slightly can improve yourhealth.
Table 7.5 shows people’s agreement with these statements, using combined ‘strongly agree’and ‘agree’ categories versus other categories (namely ‘neutral’, ‘disagree’, ‘stronglydisagree’) in 1997 and 1999. In general, the strength of agreement for the three statementsabout moderate activity (messages 1, 2 and 5) increased significantly from 1997 to 1999.The proportion of people agreeing that ‘vigorous activity three times per week for 20minutes each time was essential’ to obtain a health benefit did not change from 1997 to1999. This message (message 3) is the ‘old’ public health message suggesting that onlyparticipation in vigorous physical activity is beneficial for health. The proportion of peopleagreeing that ‘exercise doesn’t have to be done all at one time’ increased from 74% to 79%.
Women more commonly reported agreement with the three statements about moderateactivity (messages 1, 2 and 5) than did men. Men more often reported agreement with thevigorous activity statement than did women (64% and 58%, respectively).
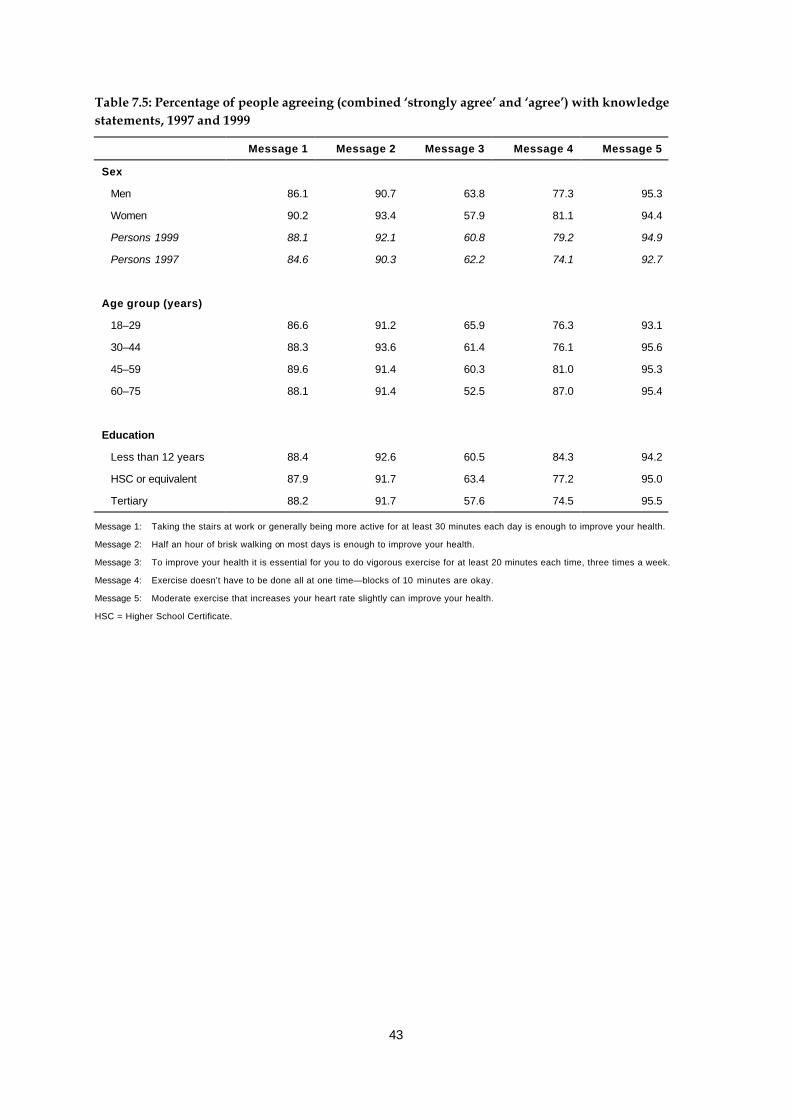
43
Table 7.5: Percentage of people agreeing (combined ‘strongly agree’ and ‘agree’) with knowledgestatements, 1997 and 1999
Message 1 Message 2 Message 3 Message 4 Message 5
Sex
Men 86.1 90.7 63.8 77.3 95.3
Women 90.2 93.4 57.9 81.1 94.4
Persons 1999 88.1 92.1 60.8 79.2 94.9
Persons 1997 84.6 90.3 62.2 74.1 92.7
Age group (years)
18–29 86.6 91.2 65.9 76.3 93.1
30–44 88.3 93.6 61.4 76.1 95.6
45–59 89.6 91.4 60.3 81.0 95.3
60–75 88.1 91.4 52.5 87.0 95.4
Education
Less than 12 years 88.4 92.6 60.5 84.3 94.2
HSC or equivalent 87.9 91.7 63.4 77.2 95.0
Tertiary 88.2 91.7 57.6 74.5 95.5
Message 1: Taking the stairs at work or generally being more active for at least 30 minutes each day is enough to improve your health.
Message 2: Half an hour of brisk walking on most days is enough to improve your health.
Message 3: To improve your health it is essential for you to do vigorous exercise for at least 20 minutes each time, three times a week.
Message 4: Exercise doesn’t have to be done all at one time—blocks of 10 minutes are okay.
Message 5: Moderate exercise that increases your heart rate slightly can improve your health.
HSC = Higher School Certificate.
44
Intentions to become more activeA population’s level of intention to be more active is an intermediate outcome, on the waytowards increasing physical activity levels. An increase in intention is considered aprecursor to trialling active behaviours, and this question was to monitor this intermediatevariable. Survey participants were asked whether they did not intend to increase theiractivity levels, intended to increase them in the short term (over the next month) or in thelonger term (over the next six months). More than one-third of respondents (37%)indicated that they did not intend to become more physically active in 1999 (Table 7.6).This was significantly less than responses in 1997, where 40% did not intend to be moreactive.
Just over one-third of respondents (34%) indicated that they intended to become morephysically active in the next month. This was significantly greater than in 1997, where32% intended to be more active in the next month.
Over the coming six months, 29% of respondents indicated that they intended to becomemore physically active. This was the same as in 1997. Interestingly, more women indicatedthat they intended to be more active over the next six months than men, 30% and 27%respectively.
Figure 7.1 shows any intention to be active (combined intention in the next month andnext six months) by sex and age group. Women (66%) were more likely to report anintention to become more active than were men (60%). This was true for each age category(seeTable A3.1).

45
Table 7.6: Percentage of people intending to be more physically active, 1999
Do not intend Intend next month Intend next 6 month
Sex
Men 40.2 32.8 27.0
Women 34.0 36.1 29.9
Persons 1999 37.1 34.4 28.5
Persons 1997 39.9 31.5 28.5
Age group (years)
18–29 23.6 43.1 33.2
30–44 31.8 36.1 32.2
45–59 45.4 31.1 23.5
60–75 56.6 22.5 20.9
Education
Less than 12 years 41.4 31.3 27.3
HSC or equivalent 34.8 36.3 28.9
Tertiary 34.0 36.3 29.7
HSC = Higher School Certificate.
0
10
20
30
40
50
60
70
80
90
100
18–29 30–44 45–59 60–75 All ages
Men
Women
Figure 7.1: Any intention to be more active (combined intention in the next month and in the next six months), 1999
Per cent
Age group (years)

46
Factors independently associated with participationLogistic regression was used to assess the independent factors associated withparticipation in physical activity in 1999. Forced entry models, which include non-significant variables, are shown in Table 7.7. Forward stepwise models reached almostidentical conclusions, with the variables employment, language spoken at home, andchildren under five not included in the final model.
These analyses are shown in Table 7.7, with adjusted odds ratios and 95% CIs shown.These data indicate that increasing education level is associated with an increasedlikelihood of participation in ‘sufficient’ physical activity. Older age groups are less likely tobe sufficiently active, compared with the youngest age category. Women are 20% lesslikely to achieve this threshold of activity compared to men. The obese are 50% less likelyto reach this sufficiently active threshold than those of healthy weight.
Factors that are positively associated with participation in ‘sufficient’ physical activityinclude being single and not having children at home.
Of particular interest in the assessment of the Active Australia campaign is that people notrecognising the Active Australia tagline ‘Exercise—you only have to take it regularly, notseriously’ were 19% less likely to achieve ‘sufficient’ physical activity than people who didrecall the campaign tagline. This was significant, after adjustment for demographicdifferences between those who recalled the message and those who did not.

47
Table 7.7: Adjusted odds ratios for factors associated with participation in ‘sufficient’ physicalactivity, 1999
‘Sufficient’ time(a) ‘Sufficient’ time and sessions (b)
Adjusted odds
ratio
Confidence interval Adjusted odds
ratio
Confidence
interval
Sex
Men 1.00 — 1.00 —
Women 0.80 (0.68–0.96) 0.80 (0.69–0.96)
Age group (years)
18–29 1.00 — 1.00 —
30–44 0.64 (0.51–0.82) 0.64 (0.51–0.82)
45–59 0.55 (0.42–0.73) 0.50 (0.38–0.67)
60–75 0.63 (0.43–0.94) 0.60 (0.40–0.88)
Education
Less than 12 years 1.00 — 1.00 —
HSC or equivalent 1.27 (1.05–1.53) 1.24 (1.02–1.50)
Tertiary 1.48 (1.18–1.86) 1.42 (1.13–1.79)
Occupation
Manager 1.00 — 1.00 —
White collar 1.04 (0.83–1.29) 0.96 (0.77–1.22)
Blue collar 0.91 (0.66–1.26) 0.81 (0.59–1.12)
Unemployed 0.77 (0.48–1.25) 0.76 (0.47–1.24)
Home duties 1.12 (0.84–1.25) 1.05 (0.79–1.41)
Student 0.76 (0.50–1.15) 0.81 (0.53–1.25)
Retired 1.18 (0.84–1.67) 1.11 (0.78–1.57)
Main language spoken at home
English 1.00 — 1.00 —
Other 0.73 (0.52–1.01) 0.78 (0.56–1.08)
Marital status
Married/de facto 1.00 — 1.00 —
Never married/single 1.14 (1.05–1.53) 1.21 (0.95–1.53)
Widow 0.66 (0.39–1.02) 0.64 (0.39–1.04)
Children (less than 5 years)
Nil 1.00 — 1.00 —
1 or more 0.81 (0.64–1.04) 0.82 (0.64–1.06)
Children (less than 18 years)
Nil 1.00 — 1.00 —
1 or more 0.81 (0.66–0.99) 0.81 (0.66–1.00)
(continued)

48
Table 7.7 (continued): Adjusted odds ratios for factors associated with participation in‘sufficient’ physical activity, 1999
‘Sufficient’ time(a) ‘Sufficient’ time and sessions (b)
Adjusted odds ratio Confidence interval Adjusted odds
ratio
Confidence
interval
BMI categories
Healthy weight 1.00 — 1.00 —
Underweight 0.88 (0.55–1.41) 0.95 (0.60–1.49)
Overweight 0.93 (0.77–1.11) 0.86 (0.72–1.03)
Obese 0.51 (0.40–0.66) 0.55 (0.43–0.72)
Recall of Active Australia tagline
‘Exercise—you only have to take it
regularly, not seriously’
Yes 1.00 — 1.00 —
No 0.81 (0.68–0.96) 0.81 (0.68–0.96)
HSC = Higher School Certificate. White collar = professional, para-professional. Blue collar = tradesperson, clerk, salesperson andpersonal service worker, plant and machine operator/driver, labourer. BMI= body mass index.
BMI categories are: underweight = BMI less than 18.5; healthy weight = BMI from 18.5 to less than 25; overweight = BMI from 25 toless than 30; obese = BMI greater than or equal to 30.
(a) ‘Sufficient’ time is defined as 150 minutes per week, using the sum of walking, moderate activity and vigorous activity(weighted by two).
(b) ‘Sufficient’ time and sessions is defined as 150 minutes (using the sum of walking, moderate activity and vigorous activity(weighted by two)) and five sessions of activity per week.
49
8. Trends in Australians’ physicalactivity habits, 1997 and 1999
Table 8.1 summarises the trends in physical activity from 1997 to 1999. Between 1997 and1999, there was no change in the proportion of Australian adults recalling any genericphysical activity message they may have heard or seen during the previous six months.
In general, there was an increase in the knowledge and awareness of the health benefits ofparticipating in moderate physical activity from 1997 to 1999.
The proportion of people who believed that their health could be improved by being moreactive increased from 85% to 88% between 1997 and 1999. Similarly, the proportion ofpeople agreeing that health could be improved by participation in 30 minutes of activityeach day (the current physical activity guidelines) increased from 90% to 92%. Theproportion of people perceiving that blocks of 10 minutes could accumulate to provide ahealth benefit increased from 74% to 79% between 1997 and 1999. Similarly, theproportion of people with the perception that moderate activity could improve healthincreased from 93% to 95% during that time. There was no change in the proportion ofpeople having the perception that a health benefit required three sessions of 20 minutes ofvigorous activity each week.
Although levels of knowledge of the health benefits of physical activity have increased from1997 to 1999, actual participation in physical activity declined. This decline is apparent interms of the mean amount of time each week people spent walking and in moderate- andvigorous-intensity physical activity. The decline in vigorous-intensity activity wasparticularly marked, from a mean of 91 minutes each week in 1997 to 65 minutes in 1999.
The proportion of people participating in physical activity to obtain a health benefit,(defined as 150 minutes of physical activity per week, with vigorous physical activityweighted by a factor of two to reflect its greater intensity and therefore greater healthbenefits) declined from 62% to 57% between 1997 and 1999. If the advice to undertake thislevel of physical activity over five sessions per week (to reflect the public health message of‘on most if not all days of the week’) were taken into account, then the decline was from51% in 1997 to 45% in 1999.
Estimates of usual participation (assessed by reported participation over the past sixmonths) at a ‘sufficient’ level (defined as 150 minutes of physical activity per week, withvigorous-intensity physical activity weighted by a factor of two) declined from 69% to 62%between 1997 and 1999.
In 1997 14% of adults recalled the Active Australia tagline ‘Exercise—you only have to takeit regularly, not seriously’. This was a ‘spurious’ pre-campaign recall rate, as the campaigntagline had not yet been launched. In 1999, 42% of people recalled the tagline some18 months after the campaign tagline had been introduced.
The proportions of Australian adults that did not intend to become more physically activedeclined from 40% to 37% between 1997 and 1999. The proportion of people saying thatthey intended to become more active next month increased from 32% in 1997 to 34% in1999. However, there was no difference between the two surveys in the proportion ofpeople saying they intended to become more active in the next six months (29%).

50
Table 8.1: Summary of changes between the 1997 and 1999 surveys
1997 1999
Message recall (per cent)
Recall of generic message about exercise or physical activity 63.7 63.9
Recall Active Australia tagline ‘Exercise—you only have to take it regularly, not seriously’ 14.4 41.8
Intention to be active (per cent)
Do not intend 39.9 37.1
Intend next month 31.5 34.4
Intend next 6 months 28.5 28.5
Knowledge of physical activity (per cent agreement)
Message 1 Taking the stairs at work or generally being more active for at least30 minutes each day is enough to improve your health. 85.0 88.1
Message 2 Half an hour of brisk walking on most days is enough to improve yourhealth. 90.3 92.1
Message 3 To improve your health it is essential for you to do vigorous exercise for atleast 20 minutes each time, three times a week. 62.2 60.8
Message 4 Exercise doesn’t have to be done all at one time—blocks of 10 minutes areokay. 74.1 79.2
Message 5 Moderate exercise that increases your heart rate slightly can improve yourhealth. 92.7 94.9
Total minutes (mean) in previous week
Walking 137.0 114.2
Moderate 62.3 54.2
Vigorous 91.3 65.3
Total (WMV) 291.2 233.2
Physical activity categories (per cent)
‘Sufficient’ time (a) 62.2 56.6
‘Sufficient’ time and sessions (b) 50.9 45.2
Physical activity habit (last six months) categories (per cent)
‘Sufficient’ time (a) 69.3 61.5
(a) ‘Sufficient’ time is defined as 150 minutes per week, using the sum of walking, moderate activity and vigorous activity (weighted bytwo).
(b) ‘Sufficient’ time and sessions is defined as 150 minutes (using the sum of walking, moderate activity and vigorous activity (weighted bytwo)) and five sessions of activity per week.

51
9. DiscussionThe information presented in this report reveal the current patterns and trends of physicalactivity of Australian adults.
Surveys to assess the participation in, and awareness of, physical activity were conductedin 1997 and 1999. The surveys were conducted at the same time of year (November–December) and used identical sampling methodology and comparable questions.
The questions used in the surveys represent one of the established methods for collectingphysical activity information in Australian population surveys. Both surveys had goodresponse rates, providing for a representative sample of Australian adults.
Awareness and understanding of physical activity messages
Between 1997 and 1999, several public education activities (including initiatives under theauspices of Active Australia) around physical activity were implemented throughoutAustralia. However, different initiatives occurred in different States and Territories, andthe same initiatives were implemented to different degrees in different areas.Results indicate that there is an increased awareness of physical activity initiatives amongthe Australian public. The Active Australia tagline ‘Exercise—you only have to take itregularly, not seriously’ was recognised by over 40% of adults in the 1999 survey. Further,one predictor of participation in physical activity at levels to achieve a health benefit wasthe recall of this tagline.The understanding of current physical activity messages also increased between the twosurveys. This was particularly evident for the message that the 30 minutes of moderate-intensity physical activity required daily for health benefits can be accumulated in blocksof at least ten minutes. Unlike the understanding of the current messages, the perceptionthat physical activity for health required at least three sessions of vigorous activity perweek (i.e. the ‘old’ public health message) showed no change between the two surveys.The proportion of people agreeing with this message was less in both 1997 and 1999 thanthose agreeing with the current physical activity messages emphasising more moderatephysical activity.
Trends
Despite the increase in awareness and understanding of physical activity, there was noincrease in actual participation. In fact, there was an overall decline in participation inphysical activity between 1997 and 1999 among adults. Australians spent less time eachweek walking, doing other moderate-intensity physical activities such as gentle swimmingand social tennis, vigorous activities such as aerobics and jogging, and more intensegardening and yardwork. People also did these activities on fewer occasions each week in1999 than they did in 1997. However, older Australians (those 60 years and older) did notshow these declines, and in fact spent more time doing physical activity each week in 1999than in 1997.
Information on frequency and duration in physical activity of different activities is used toassess participation in physical activity to achieve health benefits. The decline inparticipation at a level to achieve health benefits between 1997 and 1999 was greatestamong women, people aged 30–44 years, and among those with tertiary levels ofeducation.

52
However, it is of interest that there was no decline in participation among people aged 60years and over. Although participation tends to decline with age, people in this agecategory, and especially men, were more likely to participate in moderate physical activity.It is possible that at retirement (around 60 years of age) people have more time toparticipate in physical activity (Armstrong 1998). Further, older Australians were thetarget of a specific physical activity education program to increase awareness andparticipation in physical activity during the Year of Older Persons (1999). One of thecampaign themes (a rusty ‘tin man’) was well recalled by older Australians. This campaignmay have influenced behaviour among older Australians and helped to slow the decline inphysical activity seen for other age groups.
An area for further research stems from the observation that the largest decline inparticipation occurred among the middle aged and well educated, as it lends weight to thesuggestion that pressures associated with modern living including longer working hoursare influencing the physical activity behaviours of Australian adults. This is supported bythe lack of decline among older Australians who are presumably retired and were thefocus of a specific public health campaign.
Despite declines in actual participation in 1999, most people said that they intended tobecome more physically active in the coming months.
‘At risk’ groups
The findings of this report indicate that the following groups were less likely to participatein physical activity:
• women
• middle aged (45–59 years)
• lower educated
• widowed
• parents
• obese.
Monitoring issues
The information presented in this report relates primarily to leisure-time physical activity.The occupational and incidental physical activities people do each day were not captured.Methods to accurately assess these types of activities and to relate them to health are yet tobe developed.
Further analysis of the 1999 data set is suggested to assess physical activity participationlevels and awareness of physical activity messages among adults in New South Wales andVictoria, where Active Australia campaigns, and specifically the ‘Rusty’ tin man campaignwere implemented to a greater degree than in the others States and Territories (NSWHealth 2000). This information would provide more detailed and accurate evaluation ofother public education campaigns.
Despite any limitations that may exist in the methods used here, monitoring physicalactivity using consistent methods is essential to continue tracking not only the end-pointindicator of physical activity (i.e. participation), but also intermediate indicators such asawareness and intentions to become active.

53
The large differences reported for some trends between 1997 and 1999 need to be treatedwith caution. Although reported differences are statistically significant, further data pointsare required to ascertain whether the observed changes are real phenomena. It is thereforerecommended that a national physical activity survey using comparable methods beconducted during November and December 2001.

54
GlossaryBody mass index (BMI) is a measure of a person’s weight in relation to their height,calculated as weight in kilograms divided by height in metres squared.Context is the context in which a person participates in physical activity, e.g. leisure-time,incidental, and occupational.Duration is the length of time spent participating in physical activity as self-reported bythe adult person.Energy expenditure is an estimate of the energy costs of physical activity derived fromreports, observation or indirect objective assessments of people’s activity levels.Exercise is a subset of physical activity and is defined as planned, structured and repetitivebodily movement done to improve or maintain one or more components of physical fitness.Frequency is the number of times the adult person self-reported participating in physicalactivity, within a reporting period.Health as defined by the World Health Organization is a state of complete physical,mental and social wellbeing, and not merely as the absence of disease or infirmity.Health benefit is participation in leisure-time physical activity of ‘sufficient’ intensity andduration. The accrual of 150 minutes of moderate-intensity physical activity over a periodof one week is thought to confer health benefit. Participation in vigorous-intensity leisure-time physical activity for 60 to 90 minutes over a period of a week will also confer healthbenefit.Incidental physical activity/unplanned physical activity includes the forms of physicalactivity done at work and home, and activity in which people take part as they go abouttheir day-to-day lives, generally using large skeletal muscle groups, for example, usingstairs, domestic tasks.Intensity is the self-perceived and self-reported intensity at which an adult personparticipated in physical activity, e.g. moderate, vigorous.Leisure-time physical activity refers to sport and recreational physical activity, includinga range of activities conducted specifically for enjoyment, social, competitive or fitnesspurposes, performed in leisure or discretionary time.METs (metabolic equivalents) is a unit used to estimate the metabolic cost (oxygenconsumption) of physical activity. One MET is defined as the energy expenditure for sittingquietly, which for the average adult is 1 kilocalorie body weight in kg-1 hr-1 or 3.5 ml ofoxygen body weight in kg-1 min-1. METs are used as an index of the intensity of activities.Moderate-intensity physical activity is physical activity requiring 3–4 times as muchenergy as at rest or intensity of 3–4 METs, e.g. brisk walking.Physical activity is any bodily movement produced by skeletal muscles that results inenergy expenditure.Physical inactivity is conceptualised in population surveys as no reported physicalactivity.Risk factor is an exposure or characteristic that increases the rate of disease relative tothose unexposed or without the characteristic.
Sedentary denotes people who are physically inactive, in this case survey respondents whoreported no participation in walking, moderate-intensity or vigorous-intensity activity
55
during the previous week, resulting in an estimated energy expenditure of less than50 kilocalories per week.
Sufficient (see health benefit)
Type is the specific physical activity self-reported by adults, e.g. walking, gardening oryardwork.
Vigorous-intensity physical activity is physical activity requiring 7–9 times as muchenergy as at rest or intensity of 7–9 METs, e.g. running.
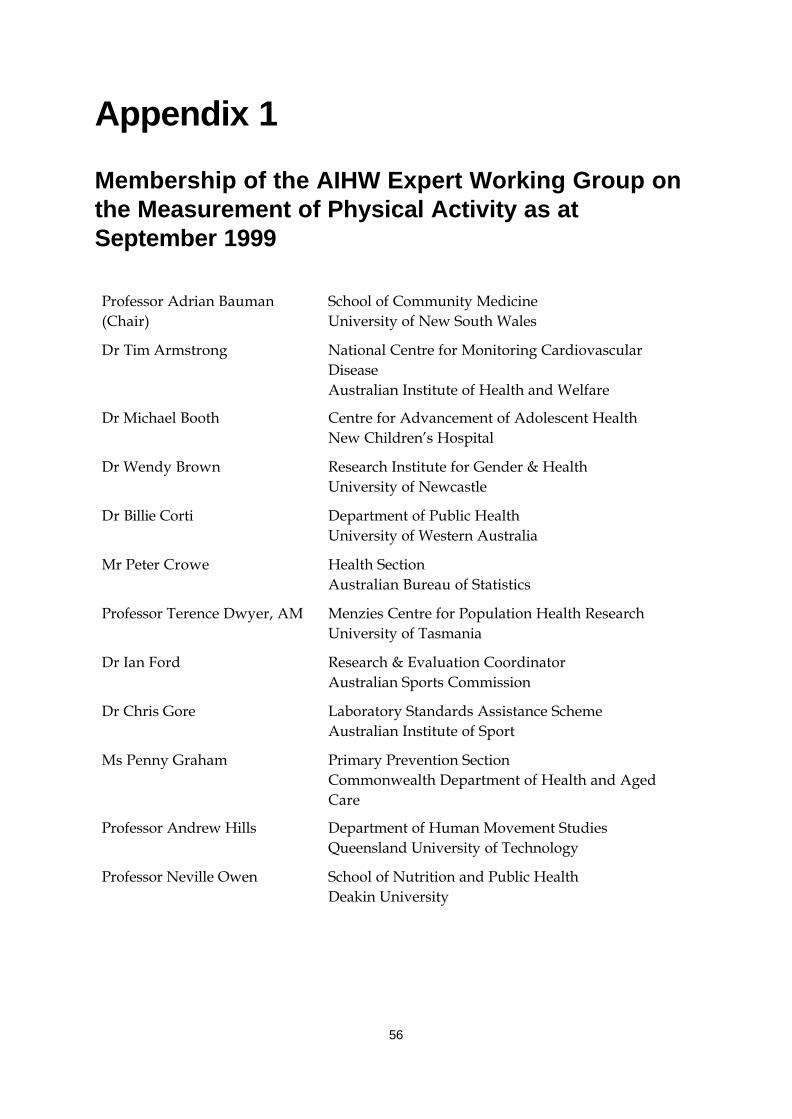
56
Appendix 1
Membership of the AIHW Expert Working Group onthe Measurement of Physical Activity as atSeptember 1999
Professor Adrian Bauman(Chair)
School of Community MedicineUniversity of New South Wales
Dr Tim Armstrong National Centre for Monitoring CardiovascularDiseaseAustralian Institute of Health and Welfare
Dr Michael Booth Centre for Advancement of Adolescent HealthNew Children’s Hospital
Dr Wendy Brown Research Institute for Gender & HealthUniversity of Newcastle
Dr Billie Corti Department of Public HealthUniversity of Western Australia
Mr Peter Crowe Health SectionAustralian Bureau of Statistics
Professor Terence Dwyer, AM Menzies Centre for Population Health ResearchUniversity of Tasmania
Dr Ian Ford Research & Evaluation CoordinatorAustralian Sports Commission
Dr Chris Gore Laboratory Standards Assistance SchemeAustralian Institute of Sport
Ms Penny Graham Primary Prevention SectionCommonwealth Department of Health and AgedCare
Professor Andrew Hills Department of Human Movement StudiesQueensland University of Technology
Professor Neville Owen School of Nutrition and Public HealthDeakin University

57
Appendix 2
1999 National Physical Activity Survey
Introduction
Hello, are you (RESPONDENT’S NAME)? My name is……, I’m calling on behalf of theAustralian Institute of Health and Welfare. We are conducting a national study onphysical activity.
The research results will be important for the planning of future health and exerciseprograms. All that is involved is answering a few questions over the phone. The Act ofParliament setting up the Institute guarantees that your answers will be kept confidential.We don’t need to know your name and no individuals will be identified or described inany reports. (If there are any questions you prefer not to answer just say so).
The survey should take NO MORE THAN 15 minutes. Can you help us with this study?
Questions
• Have you heard or seen any messages about exercise or physical activity IN THE PASTMONTH? What is one message that you remember?
• Have you heard of the Active Australia campaign? What is it?
• Have you heard of the exercise and physical activity campaign ‘Exercise—you onlyhave to take it regularly not seriously’? What messages do you remember?
• In the last month, have you seen a TV advert that shows a tin man character gettingup from a couch and walking around the neighbourhood? What messages do youremember?
We would like to ask you about the physical activity you did IN THE LAST WEEK:
• IN THE LAST WEEK how many times have you walked continuously, for at least10 minutes, for recreation/exercise or to get to or from places?
• What do you estimate was the total time that you spent walking in this way IN THELAST WEEK?
• IN THE LAST WEEK how many times did you do any vigorous gardening or heavywork around the yard which made you breathe harder or puff and pant?
• What do you estimate was the total time that you spent doing vigorous gardening orheavy work around the yard IN THE LAST WEEK?

58
The next question excludes household chores or gardening or yardwork• IN THE LAST WEEK, how many times did you do any vigorous physical activity
which made you breathe harder or puff and pant? (e.g. jogging, cycling, aerobics,competitive tennis, etc.)
• What do you estimate was the total time that you spent doing this vigorous physicalactivity IN THE LAST WEEK?
The next question excludes household chores or gardening or yardwork• IN THE LAST WEEK how many times did you do any other more moderate physical
activity that you haven't already mentioned? (e.g. gentle swimming, social tennis, golf,etc.)
• What do you estimate was the total time that you spent doing these activities IN THELAST WEEK?
The next three questions are about your average WEEKLY level of activity IN THELAST SIX MONTHS• On average, IN THE LAST SIX MONTHS how much time did you spend each week
walking for recreation/exercise or to get to or from places? (THIS IS WALKINGCONTINUOUSLY FOR AT LEAST 10 MINUTES)
The next question excludes household chores or gardening or yardwork• On average, IN THE LAST SIX MONTHS how much time did you spend each week
doing vigorous physical activity which made you breathe harder or puff and pant?(e.g. jogging, cycling, aerobics, competitive tennis, etc.)
The next question excludes household chores or gardening or yardwork• On average, IN THE LAST SIX MONTHS how much time did you spend each week
doing any other more moderate physical activity that you haven’t already mentioned(e.g. gentle swimming, social tennis, golf, etc.)
The following statements are about the amount of exercise you intend to do in the nearfuture• Which one best describes how you feel at present?
− You do NOT intend to be more active than you have been over the last week− You intend to be more active over the NEXT MONTH than you have been over
the last week− You intend to become more active sometime over the NEXT SIX MONTHS than
you have been over the last week• To what extent do you agree or disagree with the following statements about physical
activity and health?− Taking the stairs at work or generally being more active for at least 30 minutes
each day is enough to improve your health− Half an hour of brisk walking on most days is enough to improve your health
− To improve your health it is essential for you to do vigorous exercise for at least20 minutes each time, 3 times a week
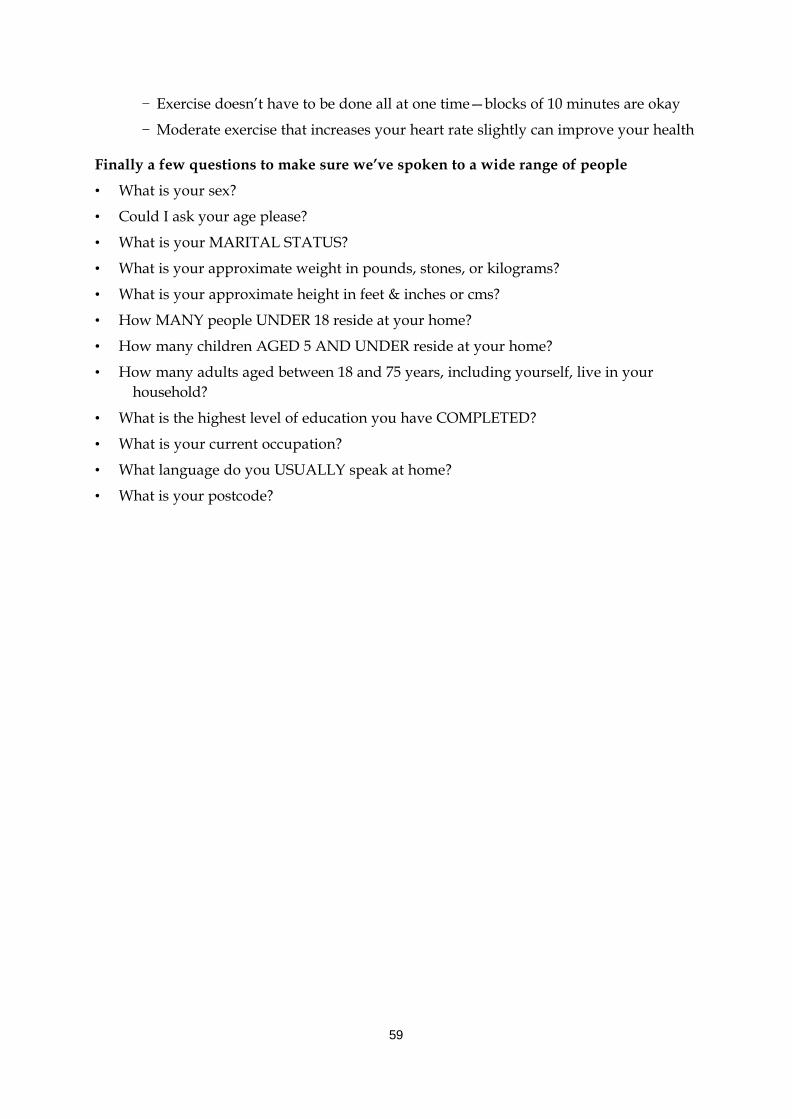
59
− Exercise doesn’t have to be done all at one time—blocks of 10 minutes are okay
− Moderate exercise that increases your heart rate slightly can improve your health
Finally a few questions to make sure we’ve spoken to a wide range of people
• What is your sex?
• Could I ask your age please?
• What is your MARITAL STATUS?
• What is your approximate weight in pounds, stones, or kilograms?
• What is your approximate height in feet & inches or cms?
• How MANY people UNDER 18 reside at your home?
• How many children AGED 5 AND UNDER reside at your home?
• How many adults aged between 18 and 75 years, including yourself, live in yourhousehold?
• What is the highest level of education you have COMPLETED?
• What is your current occupation?
• What language do you USUALLY speak at home?
• What is your postcode?

60
Appendix 3
Table A3.1: Percentage of people achieving ‘sufficient’ levels of physical activity, 1999
18–29 30–44 45–59 60–75 All ages
Over previous week
‘Sufficient’ time
Men 73.6 55.2 49.6 61.1 59.6
Women 63.8 51.8 50.3 47.6 53.8
‘Sufficient’ time and sessions
Men 59.1 41.9 39.0 51.1 47.1
Women 53.5 40.5 41.6 36.6 43.4
Over previous 6months
‘Sufficient’ time
Men 82.2 60.9 55.1 65.1 65.6
Women 69.4 55.3 53.1 49.9 57.4
Any intention to be more active (a)
Men 75.2 65.2 50.3 38.4 59.8
Women 77.6 71.3 59.1 48.0 66.0
(a) Combined intention in the next month and in the next six months.
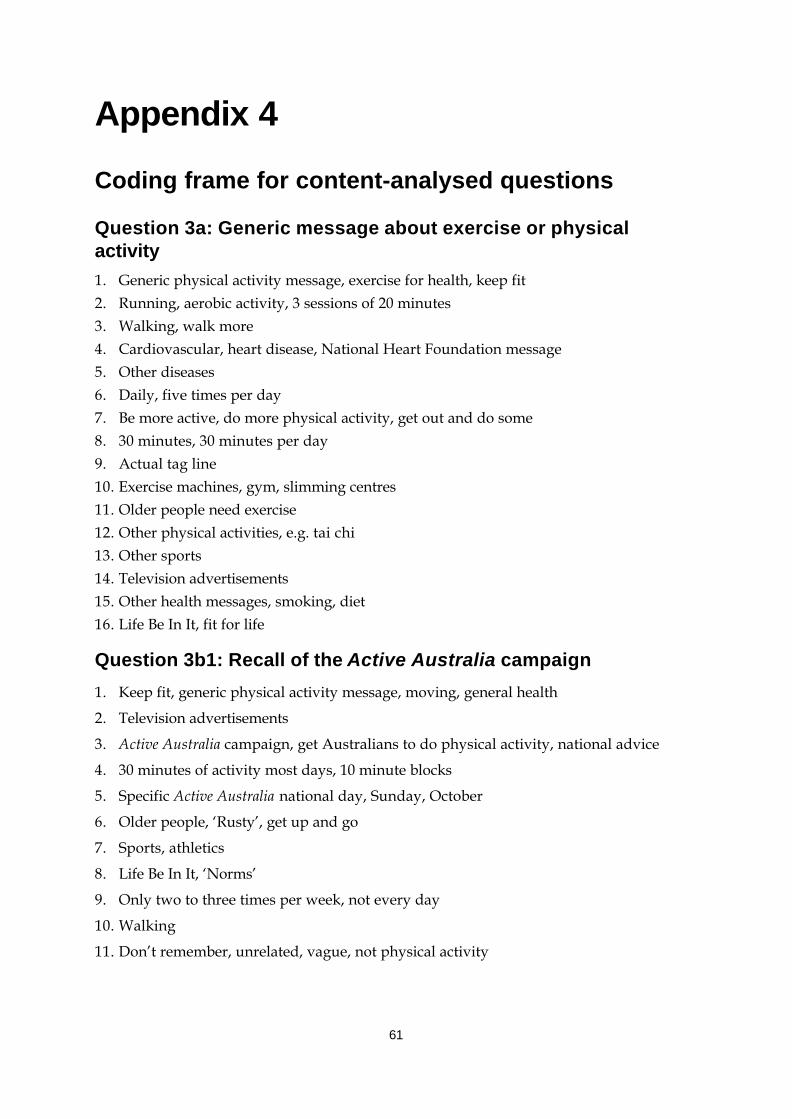
61
Appendix 4
Coding frame for content-analysed questions
Question 3a: Generic message about exercise or physicalactivity1. Generic physical activity message, exercise for health, keep fit2. Running, aerobic activity, 3 sessions of 20 minutes3. Walking, walk more4. Cardiovascular, heart disease, National Heart Foundation message5. Other diseases6. Daily, five times per day7. Be more active, do more physical activity, get out and do some8. 30 minutes, 30 minutes per day9. Actual tag line10. Exercise machines, gym, slimming centres11. Older people need exercise12. Other physical activities, e.g. tai chi13. Other sports14. Television advertisements15. Other health messages, smoking, diet16. Life Be In It, fit for life
Question 3b1: Recall of the Active Australia campaign
1. Keep fit, generic physical activity message, moving, general health
2. Television advertisements
3. Active Australia campaign, get Australians to do physical activity, national advice
4. 30 minutes of activity most days, 10 minute blocks
5. Specific Active Australia national day, Sunday, October
6. Older people, ‘Rusty’, get up and go
7. Sports, athletics
8. Life Be In It, ‘Norms’
9. Only two to three times per week, not every day
10. Walking
11. Don’t remember, unrelated, vague, not physical activity
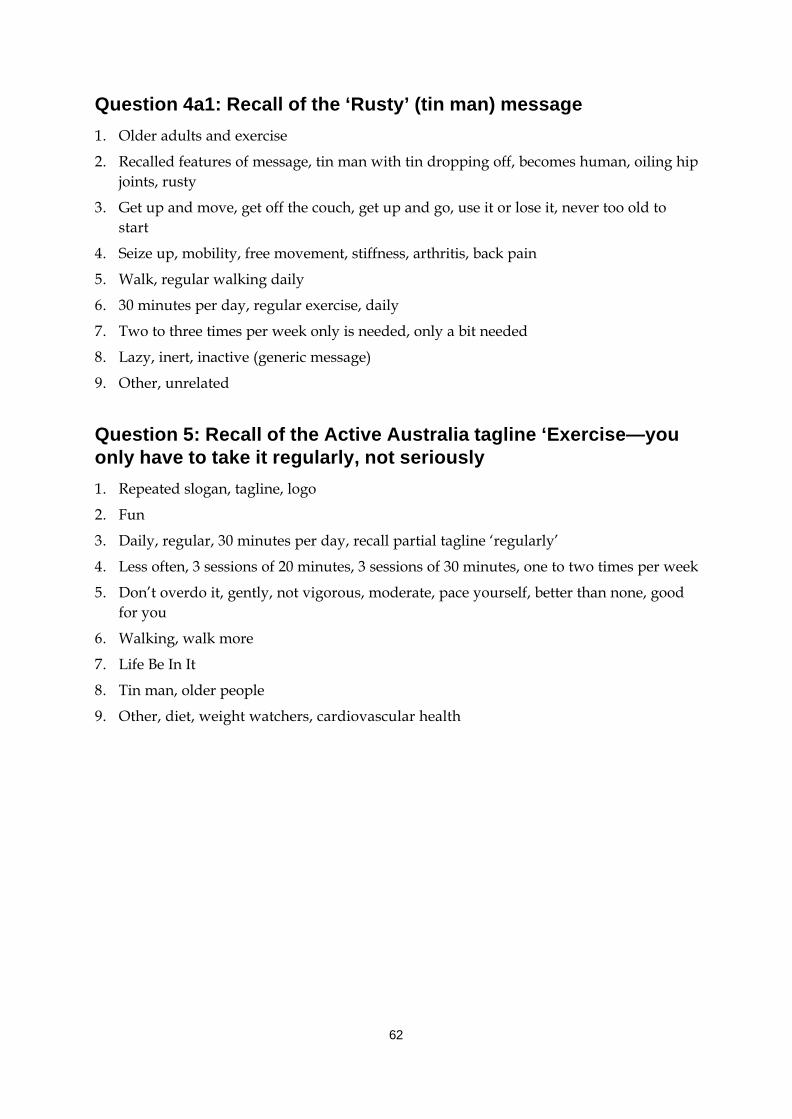
62
Question 4a1: Recall of the ‘Rusty’ (tin man) message
1. Older adults and exercise
2. Recalled features of message, tin man with tin dropping off, becomes human, oiling hipjoints, rusty
3. Get up and move, get off the couch, get up and go, use it or lose it, never too old tostart
4. Seize up, mobility, free movement, stiffness, arthritis, back pain
5. Walk, regular walking daily
6. 30 minutes per day, regular exercise, daily
7. Two to three times per week only is needed, only a bit needed
8. Lazy, inert, inactive (generic message)
9. Other, unrelated
Question 5: Recall of the Active Australia tagline ‘Exercise—youonly have to take it regularly, not seriously
1. Repeated slogan, tagline, logo
2. Fun
3. Daily, regular, 30 minutes per day, recall partial tagline ‘regularly’
4. Less often, 3 sessions of 20 minutes, 3 sessions of 30 minutes, one to two times per week
5. Don’t overdo it, gently, not vigorous, moderate, pace yourself, better than none, goodfor you
6. Walking, walk more
7. Life Be In It
8. Tin man, older people
9. Other, diet, weight watchers, cardiovascular health

63
References
Ainsworth BE, Sternfeld B, Slattery ML, Daguise V & Hoar Zahm S 1998. Physical activityand breast cancer: evaluation of physical activity assessment methods. Cancer83(Supplement): 611–620.American College of Sports Medicine (ACSM) 1995. ACSM position stand on osteoporosisand exercise. Medicine and Science in Sports and Exercise 27: i–vii.Andersen LB, Schnohr P, Schroll M & Hein HO 2000. All cause mortality associated withphysical activity during leisure time, work, sports, and cycling to work. Archives ofInternal Medicine 160: 1621–8.Arciero P, Vukovich M, Holloszy J, Racette S & Kohrt W 1999. Comparison of short-termdiet and exercise on insulin action in individuals with abnormal glucose tolerance. Journalof Applied Physiology 86(6): 1930–1935.Armstrong TP 1998. Monitoring trends in prevalence of physical activity in Australia1989–90–1995. Medicine and Science in Sports and Exercise 30: S202.Arroll B & Beaglehole R 1992. Does physical activity lower blood pressure: a critical reviewof the clinical trials. Journal of Clinical Epidemiology 45(5): 439–447.Australian Bureau of Statistics (ABS) 1999. Population by age and sex: Australian Statesand Territories. ABS Cat. No. 3201.0. Canberra: ABS.Australian Bureau of Statistics (ABS) 1997. 1995 National Health Survey: Summary ofresults, Australia. ABS Cat. No. 4399.0. Canberra: ABS.Australian Institute of Health and Welfare (AIHW) 2000. Australia’s health 2000: theseventh biennial health report of the Australian Institute of Health and Welfare. AIHWCat. No.AUS 19. Canberra: AIHW.Australian Institute of Health and Welfare (AIHW) 1999a. Heart, stroke and vasculardiseases, Australian facts 1999. AIHW Cat. No. CVD 7 (Cardiovascular Disease Series No.10). Canberra: AIHW and the Heart Foundation of Australia.Australian Institute of Health and Welfare (AIHW) 1999b. Australian hospital statistics1997–98. AIHW Cat. No. HSE 6 (Health Services Series). Canberra: AIHW.Australian Sports Commission (ASC) 1998. Active Australia national physical activitysurvey 1997. Canberra: ASC.Bauman A 1987. Trends in exercise prevalence in Australia. Community Health Studies11(3):190–96.Bauman A & Owen N 1999. Physical activity of adult Australians: epidemiologicalevidence and potential strategies for health gain. Journal of Science, Medicine and Sport2(1): 30–41.Bauman A & Owen N 1991. Habitual physical activity and cardiovascular risk factors.Medical Journal of Australia 154: 22–28.Bauman A, Bellew B, Booth M, Hahn A, Stoker L & Thomas M 1996. NSW HealthPromotion Survey 1994. Towards best practice for the promotion of physical activity in theareas of NSW. Sydney: NSW Health.Berlin JA & Colditz GA 1990. The meta-analysis of physical activity in the prevention ofcoronary heart disease. American Journal of Epidemiology 132(4): 612–627.

64
Bijnen FCH, Feskens EJM, Caspersen CJ, Nagelkerke N, Mosterd W & Kromhout D 1999.Baseline and previous physical activity in relation to mortality in elderly men—TheZutphen Elderly Study. American Journal of Epidemiology 150: 1289–96.Blair S & Brodney S 1999. Effects of physical inactivity and obesity on morbidity andmortality: current evidence and research issues. Medicine and Science in Sports andExercise: S646–S662.Blair SN, Kampert JB, Kohl HW, Barlow CE, Macera CA, Paffenbarger RS et al. 1996.Influences of cardiorespiratory fitness and other precursors on cardiovascular disease andall-cause mortality in men and women. The Journal of the American Medical Association276(3): 205–210.Blair SN, Kohl H, Barlow CE, Paffenbarger R, Gibbons LW & Macera CA 1995. Changes inphysical fitness and all-cause mortality: a prospective study of healthy and unhealthy men.The Journal of the American Medical Association 273(14): 1093–1098.Blair SN, Kohl H, Paffenbarger R, Clark DG, Cooper KH & Gibbons LW 1989. Physicalfitness and all-cause mortality: a prospective study of healthy men and women. TheJournal of the American Medical Association 262: 2395–2401.Brill P, Macera C, Davis D, Blair S & Gordon N 2000. Muscular strength and physicalfunction. Medicine and Science in Sports and Exercise: 412–416.Booth ML, Owen N, Bauman A & Gore CJ 1996. Retest reliability of recall measures ofleisure-time physical activity in Australian adults. International Journal of Epidemiology25: 153–9.Booth M, Owen N, Bauman A & Gore CJ 1995. Active and inactive Australians: assessingand understanding levels of physical activity. Canberra: Department of the Environment,Sport and Territories.Bouchard C & Shephard RJ 1994. Physical activity, fitness, and health: the model and keyconcepts. In: Bouchard C, Shephard RJ & Stephens T (eds). Physical activity, fitness andhealth: international proceedings and consensus statement. Champaign, Il.: HumanKinetics.Caspersen CJ, Powell KE & Christenson GM 1985. Physical activity, exercise, and physicalfitness: definitions and distinctions for health-related research. Public Health Report 100:126–131.Colditz G, Cannuscio C & Frazier A 1997. Physical activity and reduced risk of coloncancer: implications for prevention. Cancer Causes and Control 8: 649–667.Commonwealth Department of Health and Aged Care (DHAC) 1999. National physicalactivity guidelines for Australians. DHAC: Canberra.Commonwealth Department of Health and Aged Care and Australian Institute of Healthand Welfare (DHAC & AIHW) 1999a. National health priority areas report: mental health1998. AIHW Cat. No. PHE 13. Canberra: DHAC & AIHW.Commonwealth Department of Health and Aged Care and Australian Institute of Healthand Welfare (DHAC & AIHW) 1999b. National health priority areas report:cardiovascular health 1998. AIHW Cat. No. PHE 9. Canberra: DHAC & AIHW.Commonwealth Department of Health and Family Services (DHFS) 1998. Developing anActive Australia: a framework for action for physical activity and health. DHFS: Canberra.Commonwealth Department of Health and Family Services and Australian Institute ofHealth and Welfare (DHFS & AIHW) 1998. National health priority areas report on cancercontrol 1997. AIHW Cat. No. PHE 4. Canberra: DHFS & AIHW.
65
Dela F, Handberg A, Mikines K, Vinten J & Galbo H 1993. GLUT 4 and insulin receptorbinding and kinase activity in trained human muscle. Journal of Physiology 469: 615–624.Drinkwater B 1994. 1994 CH McCloy research lecture: does physical activity play a role inpreventing osteoporosis? Research Quarterly for Exercise and Sport 65(3): 197–206.Ellekjaer H, Holmen J, Ellekjaer E & Vatten L 2000. Physical activity and stroke mortalityin women—ten year follow up of the Nord-Trondelag Health Survey 1984-86. Stroke 31:14–18.Evans J & Roberts G 1987. Physical competence and the development of children‘s peerrelations. Quest 39: 23–25.Folsom A, Kushi LH & Hong CP 2000. Physical activity and incident diabetes inpostmenopausal women. American Journal of Public Health 90: 134–138.Gammon MD, John EM & Britton JA 1998. Recreational and occupational physicalactivities and risk of breast cancer. Journal of the National Cancer Institute 90(2): 100–117.Gillespie L, Gillespie W, Cumming R Lamb SE & Rowe BH 1998. Interventions to reducethe incidence of falling in the elderly. Cochrane Database Systematic Reviews 3.Giovannucci E, Leitzmann M, Spiegelman D, Rimm E, Colditz G, Stampfer M et al. 1998.A prospective study of physical activity and prostate cancer in male health professionals.Cancer Research 58(22): 5117–5122.Glenister D 1996. Exercise and mental health: a review. Journal of the Royal Society ofHealth 116(1): 7–13.Gore CJ, Booth ML, Bauman A & Owen N 1999. Utility of pwc75% as an estimate ofaerobic power in epidemiological and population-based studies. Medicine and Science inSports and Exercise. 31:348–351.Grisso J, Kelsey J, O‘Brien L, Miles C, Sidney S, Maislin G et al. 1997. Risk factors for hipfracture in men, hip fracture study group. American Journal of Epidemiology 145(9):786–793.Grundy SM, Pasternak R, Greenland P, Smith S & Fuster V 1999. Assessment ofcardiovascular risk by use of multiple-risk-factor assessment equations: a statement forhealth-care professionals from the American Heart Association and the American Collegeof Cardiology. Circulation 100: 1481–1492.Gutin B & Kasper M 1992. Can vigorous exercise play a role in osteoporosis prevention? Areview. Osteoporosis International 2(2): 55–69.Hagberg J, Montain S, Martin W & Ehsani A 1989. Effect of exercise training in 60–69year-old persons with essential hypertension. American Journal of Cardiology 64: 348–353.Hassmén P, Koivula N & Uutela A 2000. Physical exercise and psychological well-being: apopulation study in Finland. Preventive Medicine 30: 17–25.Hu FB, Sigal RJ, Rich-Edwards JW, Colditz GA, Solomon CG, Willett WC et al. 1999.Walking compared with vigorous physical activity and risk of type 2 diabetes in women.The Journal of the American Medical Association 282(15): 1433–1439.Hu FB, Stampfer MJ, Colditz GA, Asherio A, Rexrode KM, Willett WC et al. 2000. Physicalactivity and risk of stroke in women. Journal of American Medical Association 283: 2961–64.Huang Y, Macera C, Blair S, Brill P, Kohl H & Kronenfeld J 1998. Physical fitness, physicalactivity, and functional limitation in adults aged 40 and older. Medicine and Science inSports and Exercise 30(9): 1430–1435.Hunter Valley Research Foundation (HVRF) 1999. 1999 physical activity survey: methodsand coding manual. Maryville: HVRF.
66
Ivy J, Zderic T & Fogt D 1999. Prevention and treatment of non-insulin-dependent diabetesmellitus. In: Holloszy J (ed.) Exercise and sport sciences reviews. Philadelphia: LippincottWilliams & Wilkins. Vol. 17: 1–36.Kelley G & McClellan P 1994. Anti-hypertensive effects of aerobic exercise: a brief meta-analytic review of randomized controlled trials. American Journal of Hypertension7(2): 115–119.Kohl H & McKenzie J 1994. Physical activity, fitness and stroke: physical activity, fitnessand health. International proceedings and consensus statement. Champaign: HumanKinetics Publishers.Kokkinos PF & Fernhall B 1999. Physical activity and high density lipoproteins—what isthe relationship? Sports Medicine 28:307–314.Kujala U, Kaprio J & Sarna S 1994. Osteoarthritis of weight bearing joints of lower limbs informer elite male athletes. British Medical Journal 308: 231–234.Kujala U, Kettunen J, Paananen H, Aalto T, Battie M, Impivaara O et al. 1995. Kneeosteoarthritis in former runners, soccer players, weight lifters, and shooters. Arthritis andRheumatism 38(4): 539–461.Laforge R, Rossi J, Prochaska J, Velicer W, Levesque D & McHorney C 1999. Stage ofregular exercise and health-related quality of life. Preventive Medicine 28(4): 349–360.Lakka TA, Venäläinen JM, Rauramaa R, Salonen R, Tuomilehto J & Salonen JT 1994.Relation of leisure-time physical activity and cardiorespiratory fitness to the risk of acutemyocardial infarction in men. New England Journal of Medicine 330(22): 1549–1554.Lane N 1995. Exercise: a cause of osteoarthritis. Journal of Rheumatology 43(Supplement):3–6.Latikka P, Pukkala E & Vihko V 1998. Relationship between the risk of breast cancer andphysical activity. Sports Medicine 26(3): 133–143.Lee I & Paffenbarger R 2000. Associations of light, moderate, and vigorous intensityphysical activity with longevity. American Journal of Epidemiology 151(3): 293–299.Lee I & Paffenbarger R 1997. Physical activity, fitness and longevity. Ageing 9: 2–11.Liu SM, Lee IM, Linson P, Ajani U, Buring JE & Hennekens CH 2000. A prospective studyof physical activity and risk of prostate cancer in US physicians. International Journal ofEpidemioogy 29: 29–35.Lord S 1995. The effect of a 12-month exercise trial on balance, strength and falls in olderwomen. Journal of American Geriatrics Society 43: 1198–1206.Manson J & Spelsberg A 1994. Primary prevention of non-insulin-dependent diabetesmellitus. American Journal of Preventive Medicine 10(3): 172–184.Manson JE, Hu F, Rich-Edwards JW, Colditz GA, Stampfer MJ, Willett WC et al. 1999. Aprospective study of walking as compared with vigorous exercise in the prevention ofcoronary heart disease in women. New England Journal of Medicine 341(9): 650–658.Marceau M, Douame N, Lacourciere Y & Cleroux J 1993. Effects of different trainingintensities on 24-hour blood pressure in hypertensive subjects. Circulation 88(6): 2803–2811.Mathers C & Penm R 1999. Health system costs of injury, poisoning and musculoskeletaldisorders in Australia 1993–94. AIHW Cat. No. HWE 12 (Health and Welfare ExpenditureSeries No. 6). Canberra: Australian Institute of Health and Welfare.Mathers C, Vos T & Stevenson C 1999. The burden of disease and injury in Australia.AIHW Cat. No. PHE 17. Canberra: AIHW.

67
Matsusaki M, Ikeda M, Tashiro E, Koga M, Miura S, Ideishi M et al. 1992. Influence ofworkload on the anti-hypertensive effect of exercise. Clinical and ExperimentalPharmacology and Physiology 19: 471–479.Maxwell K & Tucker L 1992. Effects of weight training on the emotional well-being andbody image of females: predictors of greatest benefit. American Journal of HealthPromotion 6(5): 338–344.McMurray RG, Ainsworth BE, Harrell JS, Griggs TR & Williams OD 1998. Is physicalactivity or aerobic power more influential on reducing cardiovascular disease risk factors?Medicine and Science in Sports and Exercise 30(10): 1521–1529.Mensink GBM, Ziese T & Kok FJ 1999. Benefits of leisure-time physical activity on thecardiovascular risk profile at older age. International Journal of Epidemiology28(4): 659–666.Moore S 1994. Physical activity, fitness and atherosclerosis. In: Bouchard C, Shepherd R &Stephens T (eds). Physical activity, fitness and health: international proceedings andconsensus statement. Champaign Il: Human Kinetics Publishers.Morans R & Mohai P 1991. Leisure resources, recreation activity and the quality of life. In:Driver B, Brown P & Peterson G (eds). Benefits of leisure. Philadelphia: VenturePublishing.Mutrie N & Parfitt G 1998. Physical activity and its link with mental, social and moralhealth in young people. In: Biddle S, Sallis J & Cavill N (eds). Young and active: youngpeople and health-enhancing physical activity—evidence and implications. London:Health Education Authority.National Centre for Health Promotion and Health Promotion Branch 1994. NSW HealthPromotion Survey 1994. Report No. 1: Technical report. Sydney: NSW Health Department.Neugut A, Terry M, Hocking G, Mosca L, Garbowski G & Forde K 1996. Leisure andoccupational physical activity and risk of colorectal adenomatous polyps. InternationalJournal of Cancer 68: 744–748.NSW Health 2000. The Active Australia/International Year of Older Persons publiceducation campaign to promote physical activity among older people: NSW evaluationreport. Sydney: NSW Health Department.Okada K, Hayashi T, Tsumura K, Suematso C, Endo G & Fujii S 2000. Leisure timephysical activity at weekends and risk of type 2 diabetes in Japanese men—the OsakaHealth Survey. Diabetic Medicine 17: 53–58.Paffenbarger R, Hyde R, Wing A, Lee I, Jung D & Kampert J 1993. The association ofchanges in physical activity level and other lifestyle characteristics with mortality amongmen. New England Journal of Medicine 328: 538–545.Paffenbarger RS, Lee I & Leung R 1994. Physical activity and personal characteristicsassociated with depression and suicide in American college men. Acta PsychiatricaScandinavica Supplementum 377: 16–22.Petruzzello S, Landers D, Hatfield B, Kubitz K & Salazar W 1991. A meta-analysis on theanxiety-reducing effects of acute and chronic exercise. Sports Medicine 11(3): 143–182.Powell KE, Thompson PD, Caspersen CJ & Kendrick JS 1987. Physical activity and theincidence of coronary heart disease. Annual Review of Public Health 8: 253–287.Rippe JM & Hess S 1998. The role of physical activity in the prevention and managementof obesity. Journal of the American Dietetic Association 98(Supp 2): S31–8.

68
Risk Factor Prevalence Management Committee 1990. Risk factor prevalence study: surveyno. 3 1989. Canberra: National Heart Foundation of Australia and Australian Institute ofHealth.Rogers M, King D, Hagber J, Ehsani A & Holloszy J 1990. Effect of 10 days of physicalinactivity on glucose tolerance in master athletes. Journal of Applied Physiology68: 1833–1837.Sherman SE, D’Agostino RB, Silbershatz H & Kannel WB 1999. Comparison of past versusrecent physical activity in the prevention of premature death and coronary artery disease.American Heart Journal 138: 900–7.Simonsick E 1991. Personal health habits and mental health in a national probabilitysample. American Journal of Preventive Medicine 7(6): 425–437.Simonsick EM, Lafferty ME, Phillips CL, Mendes de Leon CF, Kasl SV, Seeman TE et al.1993. Risk due to inactivity in physically capable older adults. American Journal of PublicHealth 83: 1443–1450.Slattery M, Potter J, Caan B, Edwards S, Coate A, Ma K et al. 1997. Energy balance andcolon cancer—beyond physical activity. Cancer Research 57: 75–80.Sonstroem R 1984. Exercise and self-esteem exercise. Sport Science Review 12: 123–155.Stephens T 1988. Physical activity and mental health in the United States and Canada:evidence from four population surveys. Preventive Medicine 17(1): 35–47.Stephenson J, Bauman A, Armstrong T, Smith B & Bellew B 2000. The costs of illnessattributable to physical inactivity in Australia: a preliminary study. CommonwealthDepartment of Health & Aged Care and the Australian Sports Commission: Canberra.Stessman J, Maaravi Y, Hammerman-Rozenberg R & Cohen A 2000. The effects ofphysical activity on mortality in the Jerusalem 70-year-olds longitudinal study. Journal ofthe American Geriatrics Society 48: 499–504.United States Department of Health and Human Services (USDHHS) 1996. Physicalactivity and health: a report of the Surgeon General. Atlanta, GA: U.S. Department ofHealth and Human Services, Centers for Disease Control and Prevention, National Centerfor Chronic Disease Prevention and Health Promotion.Verloop J, Rookus M, van der Kooy D & van Leeuwen F 2000. Physical activity and breastcancer risk in women aged 20–54 years. Journal of the National Cancer Institute92(2): 128–135.Villeneuve PJ, Morrison HI, Craig CL & Schaubel DE 1998. Physical activity, physicalfitness and risk of dying. Epidemiology 9: 626–631.Wannamethee SG & Shaper AG 1999. Physical activity and the prevention of stroke.Journal of Cardiovascular Risk 6: 213–16.Wei M, Gibbons LW, Mitchell TL, Kampert JB, Lee CD & Blair SN 1999. The associationbetween cardiorespiratory fitness and impaired fasting glucose and type 2 diabetesmellitus in men. Annals of Internal Medicine 130(2): 89–96.Welten D, Kemper H, Psot G, Van-Mechelen W, Twisk J, Lips P et al. 1994. Weight-bearingactivity during youth is a more important factor for peak bone mass than calcium intake.Journal of Bone and Mineral Research 9(7): 1089–1096.Zhang J, Feldblum P & Fortney J 1992. Moderate physical activity and bone density amongperimenopausal women. American Journal of Public Health 82(5): 736–738.