Embed Size (px)
Citation preview

National Social Housing Survey
Detailed results 2014
This report provides an overview of the national findings of the 2014 National Social Housing Survey. The report shows that the majority of tenants are satisfied with the services provided by their housing organisation, with community housing tenants the most satisfied. Tenants report a range of benefits from living in social housing and the majority live in dwellings of an acceptable standard.
National Social H
ousing Survey: detailed results 2014A
IHW

Australian Institute of Health and Welfare Canberra
Cat. no. HOU 278
National Social Housing Survey
Detailed results
2014
The Australian Institute of Health and Welfare is a major national agency which provides reliable, regular and relevant information and statistics
on Australia’s health and welfare. The Institute’s mission is authoritative information and statistics to promote better health and wellbeing.
© Australian Institute of Health and Welfare 2015
This product, excluding the AIHW logo, Commonwealth Coat of Arms and any material owned by a third party or protected by a trademark, has been released under a Creative Commons BY 3.0 (CC-BY 3.0) licence. Excluded material owned by third parties may include, for example, design and layout, images obtained under licence from third parties and signatures. We have made all reasonable efforts to identify and label material owned by third parties.
You may distribute, remix and build upon this work. However, you must attribute the AIHW as the copyright holder of the work in compliance with our attribution policy available at <www.aihw.gov.au/copyright/>. The full terms and conditions of this licence are available at <http://creativecommons.org/licenses/by/3.0/au/>.
A complete list of the Institute’s publications is available from the Institute’s website <www.aihw.gov.au>.
ISBN 978-1-74249-784-6 (PDF) ISBN 978-1-74249-785-3 (Print)
Suggested citation Australian Institute of Health and Welfare 2015. National Social Housing Survey: detailed results 2014. Cat. no. HOU 278. Canberra: AIHW.
Australian Institute of Health and Welfare Board Chair Dr Mukesh C Haikerwal AO
Acting Director Ms Kerry Flanagan PSM
Any enquiries about copyright or comments on this publication should be directed to: Digital and Media Communications Unit Australian Institute of Health and Welfare GPO Box 570 Canberra ACT 2601 Tel: (02) 6244 1000 Email: [email protected]
Published by the Australian Institute of Health and Welfare This publication is printed in accordance with ISO 14001 (Environmental Management Systems) and ISO 9001 (Quality Management Systems). The paper is sourced from sustainably managed certified forests.
Please note that there is the potential for minor revisions of data in this report. Please check the online version at <www.aihw.gov.au> for any amendments.

iii
Contents Acknowledgments............................................................................................................................... v
Abbreviations ...................................................................................................................................... vi
Symbols ................................................................................................................................................ vi
Summary ............................................................................................................................................. vii
Introduction ........................................................................................................................................... 1
The social housing sector .............................................................................................................. 2
2014 NSHS methodology .............................................................................................................. 5
Section 1: Overview ............................................................................................................................. 9
1.1 Tenant satisfaction ............................................................................................................... 9
1.2 Satisfaction with amenities .............................................................................................. 13
1.3 Satisfaction with location (proximity to facilities and services) ................................. 16
1.4 Satisfaction with maintenance services .......................................................................... 18
1.5 Perceived benefits of living in social housing ............................................................... 20
1.6 Dwelling condition and utilisation ................................................................................. 23
1.7 Household characteristics ................................................................................................ 30
1.8 Labour force participation ................................................................................................ 35
1.9 Disability and the need for assistance ............................................................................ 40
1.10 Use of support services ..................................................................................................... 43
Section 2: Geographic and demographic breakdowns ................................................................ 46
2.1 Tenant satisfaction ............................................................................................................. 46
2.2 Satisfaction with amenities .............................................................................................. 54
2.3 Satisfaction with location (access to facilities and services) ........................................ 72
2.4 Satisfaction with day-to-day maintenance services ...................................................... 85
2.5 Satisfaction with emergency maintenance services ...................................................... 92
2.6 Benefits of living in social housing ............................................................................... 100
2.7 Dwelling standard ........................................................................................................... 106
2.8 Dwelling utilisation ......................................................................................................... 112
2.9 Use of support services ................................................................................................... 116
Appendix A: Survey and reporting methodology ...................................................................... 124
Scope ............................................................................................................................................ 124
Overview of methodological approach ................................................................................... 124
Survey and interview response rates ...................................................................................... 125
iv
2014 NSHS sample representativeness ................................................................................... 127
Detailed Methodology ............................................................................................................... 130
Respondents versus households .............................................................................................. 134
Weighting .................................................................................................................................... 134
Sampling variability ................................................................................................................... 137
Comparability with the 2012 questionnaire ........................................................................... 138
Appendix B: Profile of 2014 NSHS respondents ........................................................................ 139
Appendix C: 2014 NSHS Questionnaire ...................................................................................... 143
Glossary .............................................................................................................................................. 155
References .......................................................................................................................................... 157
List of tables ...................................................................................................................................... 158
List of figures .................................................................................................................................... 161
Related publications ........................................................................................................................ 163

v
Acknowledgments This report is the product of the collective efforts of staff, both past and present, of the Housing and Specialised Services Group of the Australian Institute of Health and Welfare (AIHW). Their efforts are gratefully acknowledged.
The information contained in this publication is produced from data collected from the 2014 National Social Housing Survey (NSHS). Lonergan Research undertook the fieldwork component of the 2014 NSHS and their efforts are gratefully acknowledged. The authors would also like to thank those social housing tenants who took part in the 2014 National Social Housing Survey. Members of the Housing and Homelessness Data Network (HHDN) are also acknowledged for their contributions.

vi
Abbreviations ABS Australian Bureau of Statistics
AHURI Australian Housing and Urban Research Institute
AIHW Australian Institute of Health and Welfare
ARIA Accessibility/Remoteness Index of Australia
ASGS Australian Statistical Geography Standard
CNOS Canadian National Occupancy Standard
CH community housing
FAQ frequently asked questions
NRAS National Rental Affordability Scheme
NSHS National Social Housing Survey
PH public housing
RSE relative standard error
SOMIH State owned and managed Indigenous housing
VATI Voice activated telephone interviewing
Symbols — nil or rounded to zero
. . not applicable
n.a. not available
n.p. not publishable because of small numbers, confidentiality or other concerns about the quality of the data
* RSEs greater than 25% and less than 50%
# Indicates jurisdictional finding is statistically significantly different at the 95% confidence level from the national finding.

vii
Summary The 2014 National Social Housing Survey (NSHS) is the most recent in a series of surveys of social housing tenants and their experiences. The 2014 NSHS sampled tenants in public housing (PH), in state owned and managed Indigenous housing (SOMIH), and in community housing (CH) between May and August 2014.
How satisfied are tenants? The majority of NSHS respondents (73%) indicated that overall they were satisfied with the services provided by their housing organisation and, for both public housing and community housing tenants, this has increased since 2012.
• Tenant satisfaction with the services provided by their housing organisation was lower amongst tenants who had a disability or who lived in dwellings with structural problems or in dwellings that were overcrowded.
• Consistent with previous surveys, community housing tenants were more satisfied than public housing or SOMIH tenants with the services offered by their housing providers.
What are dwelling conditions and use like? • The majority (82%) of tenants lived in a dwelling of an acceptable standard, with 4 or
more working facilities and no more than 2 major structural problems. • As in 2012, a small proportion (5%) of social housing dwellings were overcrowded, but
this was again considerably more common in SOMIH households (19%). • Underutilisation was more common than overcrowding in public housing and
community housing dwellings. One in 5 public housing households were underutilised (with at least 1 surplus bedroom) as were 1 in 7 community housing households.
What is the labour force status of social housing tenants? • Between half and three-quarters of all social housing tenants aged 15–64 years were not
in the labour force, despite a large proportion being of working age. Almost half of public and community housing tenants (49% PH and 47% CH), were ’unable to work’, while almost two-thirds of SOMIH tenants were full-time parents or carers (62%).
• Of those working part-time, unemployed or not in the labour force, the 3 strongest influences on employment status were the need for more training, education or work experience; the desire/need to stay home and look after children, and financial concerns.
How are tenants with disability faring? • Around one-third of households included at least 1 member who ‘always’ or ‘sometimes’
requires assistance with self-care, body-movement or communication activities. • Across all social housing programs, the majority of households with a person with
disability indicated that ‘modifications for special needs’ were important to them and that this need had been met.
What are the benefits of living in social housing? • Social housing tenants reported many benefits of social housing, with the majority (more
than 90%) feeling more settled and better able to manage rent or money. • The benefit least likely to be reported by tenants was feeling ‘more able to improve job
situation’ (63% reported this benefit).

National Social Housing Survey: detailed results 2014 1
Introduction Access to housing is one of the most basic needs for all individuals and families and it is fundamental to a person’s wellbeing. Governments play a key role in ensuring that all Australians have access to affordable, safe and sustainable housing. Housing assistance encompasses a range of programs targeted to provide support to low-income households in securing and sustaining housing, and a significant component of housing assistance is the provision or funding of social housing. Social housing includes all rental housing owned and managed by government, or by not-for-profit community organisations, which can be let to eligible households (AIHW 2014). Social housing programs across Australia comprise:
• public housing (also referred to as ‘public rental housing’) • state owned and managed Indigenous housing • community housing (also referred to as ‘mainstream community housing’) • Indigenous community housing.
The 2014 National Social Housing Survey (NSHS) was undertaken by Lonergan Research on behalf of the Australian Institute of Health and Welfare (AIHW). The 2014 survey is the most recent in a series of surveys designed to gather information on social housing tenants and their housing experiences.
The NSHS was first conducted in 1996 with tenants of public rental housing (PH). Mainstream community housing (CH) was added to the survey program in 2001. State owned and managed Indigenous housing (SOMIH) was included for the first time in 2005. Details regarding previous iterations of the NSHS, including reports and survey methodology, are available on the AIHW website.
The primary purpose of the NSHS is to collect data on the profile of social housing tenants and record their satisfaction with services provided by their landlords and with the amenity and location of their dwelling.
The 2014 survey sampled tenants of public housing, state owned and managed Indigenous housing and community housing programs (collectively referred to as ‘social housing’ throughout this report). To date, Indigenous community housing, while an important form of social housing for Indigenous Australians, has not been covered in the NSHS. Definitions of ‘public housing’, ‘state owned and managed Indigenous housing’, and ‘community housing’ are provided in Box 1.1.
The NSHS complements other data about social housing in Australia, especially administrative data collected by social housing providers and reported by the Australian Institute of Health and Welfare (AIHW). These administrative data provide valuable information about social housing programs, including the stock of dwellings, the characteristics of tenants and the extent to which people in special needs groups are able to access social housing. The survey adds to the overall picture by surveying tenants about their experiences of living in social housing.

2 National Social Housing Survey: detailed results 2014
Box 1.1: Social housing programs covered by the 2014 NSHS Public housing (PH) Public housing (also referred to as public rental housing) encompasses the publicly owned or leased dwellings administered by state and territory governments. It aims to provide appropriate, affordable and accessible housing mainly for low-income households that have difficulty in obtaining and maintaining housing in the private market.
State owned and managed Indigenous housing (SOMIH) State owned and managed Indigenous housing is administered by state governments and is specifically targeted to households with at least 1 Indigenous member. It aims to provide appropriate, affordable and financially accessible housing for low- to moderate-income Indigenous households. Four jurisdictions currently operate a SOMIH program: New South Wales, Queensland, South Australia and Tasmania.
Community housing (CH) Mainstream community housing is managed by not-for-profit organisations and is covered in the NSHS where those organisations receive capital or recurrent funding from government. Community housing offers short-, medium- or long-term tenure for low-income individuals and families, or those with particular needs not well catered for by the private market. Currently the community housing program is operating in all jurisdictions apart from the Northern Territory.
The social housing sector At 30 June 2014, there were 427,600 social housing dwellings across Australia, 77% of which (323,800) were public rental housing. The second largest stock of social housing dwellings was in mainstream community housing—around 71,000, or 17% of the total stock. Indigenous-specific housing programs such as SOMIH, Indigenous community housing and Northern Territory remote public housing accounted for the remaining social housing dwellings—around 32,800 or 6% of the total stock.
Between 30 June 2006 and 30 June 2014, the overall social housing stock increased by 4.6%, from 408,800 to 427,600 dwellings. The Australian Government’s Social Housing Initiative (see Box 1.2) contributed to maintaining the level of social housing stock, however during this period there was a small decline in the social housing stock relative to the total number of dwellings in Australia, from 4.7% of all dwellings in 2006 to 4.5% in 2011 (AIHW analysis of Australian Bureau of Statistics (ABS) 2006 and 2011 Censuses).

National Social Housing Survey: detailed results 2014 3
Box 1.2: The Social Housing Initiative The Social Housing Initiative was designed as part of the National Partnership Agreement on Nation Building and Jobs Plan to stimulate the building and construction industry, both through funding additional dwellings and through increasing expenditure on repairs and maintenance. It was a schedule to the National Partnership Agreement on the National Building and Jobs Plan which commenced in February 2009 and expired on 31 December 2012. Over 19,700 new social housing dwellings were built under the initiative with the assistance of the not-for-profit sector. Around 80,000 dwellings benefitted from the repairs and maintenance element of the initiative, which included major renovations to over 12,000 social housing dwellings that were vacant or would have become uninhabitable without this work. Work on this initiative has now ceased. Source: DSS 2013.
While overall social housing stock has remained relatively stable in recent years, the distribution of stock across social housing programs has changed. The rising cost of social housing programs managed and run by state housing authorities has seen a gradual but steady shift in the policy focus, towards growing the community housing sector and transferring ownership or management of public rental housing stock to community housing organisations. Public rental housing stock decreased by approximately 21,500 dwellings (from around 345,300 in 2004 to 323,800 in 2014), while the mainstream community housing sector has increased during this period, from around 22,500 dwellings at 30 June 2004 to 71,000 dwellings at 30 June 2014. This increasing contribution of the community sector reflects shifting housing policy directions by Australian, and state and territory governments, partially reflecting the influence of the National Rental Affordability Scheme (NRAS) (see Box 1.3 for information regarding the influence of NRAS).
Box 1.3: National Rental Affordability Scheme The National Rental Affordability Scheme (NRAS) is a long term commitment by the Australian Government in partnership with the states and territories to investors prepared to build affordable rental housing. It aims to: • increase the supply of new affordable rental housing • reduce rental costs for low- to moderate-income households • encourage large-scale investment and innovative management of affordable housing. NRAS provides a substantial annual incentive to build and rent new dwellings to low and moderate-income households at a rate that is at least 20% below the market value rent. The incentive is available to approved participants who successfully apply through an open call for applications. There have been 5 calls for applications to date (the sixth round was cancelled). However, the Government announced in May 2014, that it would not be proceeding with any future calls for applications. NRAS will continue to contribute over $1 billion overall to housing supply and affordability until 30 June 2018. Source: DSS 2014.

4 National Social Housing Survey: detailed results 2014
Housing assistance policy has changed substantially over time with the provision of social housing (and housing assistance more generally) moving away from focusing on low-income working families to targeting the most vulnerable in society (see, for example, FaCS NSW 2014).
The most vulnerable are defined as ‘greatest need’ and are given priority access to social housing. ‘Greatest need’ applies to low-income households if, at the time of allocation, household members were subject to 1 or more of the following circumstances:
• They are homeless • Their lives or safety are at risk in their current accommodation • Their health condition is aggravated by their housing • They are in housing that is inappropriate to their needs • They have very high rental costs relative to their income. In 2013–14, 74% of allocations in public housing and 56% of allocations in SOMIH went to people meeting these criteria. In mainstream community housing, 75% of allocations were to those in ‘greatest need’ (AIHW analysis of National Housing Assistance Data Repository 2013–14).
Households that are in ‘greatest need’ often also have ‘special needs’. These include households with:
• a member with a disability • a main tenant aged 20 or under, or 75 and over • 1 or more Indigenous members. Indigenous households in SOMIH are not considered special needs households as SOMIH is an Indigenous-targeted program. For SOMIH special needs households are those that have:
• a household member with a disability • a main tenant aged 24 or under, or 50 and over. ‘Special needs’ and ‘greatest needs’ categories are not mutually exclusive and tenants may fit into a number of categories within each group or across groups.
In 2013–14, almost two-thirds (65%) of new households assisted in public rental housing were in 1 of these groups, with a similarly high proportion in mainstream community housing (59%) and in SOMIH (57%) (AIHW analysis of National Housing Assistance Data Repository 2013–14).
Tenants’ experiences of social housing assist in informing the extent to which housing policy objectives are being met. The NSHS adds to the work being done in the social housing arena by the Australian Housing and Urban Research Institute (AHURI) and other research bodies. For example, AHURI researchers conducting their own fieldwork have found that security of tenure improves health, education and employment outcomes (AHURI 2009) as well as social inclusion and the social connectedness of tenants (AHURI 2013).

National Social Housing Survey: detailed results 2014 5
2014 NSHS methodology The 2014 NSHS was conducted by Lonergan Research Pty Ltd on behalf of the AIHW. Like previous survey iterations, data for the 2014 NSHS for tenants of public housing and community housing were collected via mail-out self-completion paper questionnaires. In 2014, data for SOMIH tenants were collected using a mixed methodology with 2 jurisdictions (South Australia and Tasmania) collecting data via mail-out self-completion paper questionnaire, and 2 jurisdictions (New South Wales and Queensland) were collecting data via face-to-face interview. Previous surveys of SOMIH tenants were conducted either by face-to-face interview for all jurisdictions (2005 and 2007) or via mail-out self-completion paper questionnaire for all jurisdictions (2012).
The sampling approach has also remained largely consistent throughout survey iterations. It is important to note however that in 2012 there was a change in the sampling methodology. In 2012, top-up sampling was adopted due to limitations on the time available for fieldwork and the need to achieve a minimum required number of completed surveys for each housing program in each jurisdiction. That is, in 2012, additional surveys were sent out to a randomly selected top-up sample until the required number of responses was achieved.
In 2014, as with years prior to 2012, a simple random sample was selected and sent a survey pack containing a questionnaire (including covering letter) and a reply-paid envelope. Non-response within 4 weeks of the initial mailing instigated reminder action, encouraging tenants to complete the survey. Initial survey reminder packs were sent to tenants where completed surveys had not been received within 4 weeks of the first mailing, while second survey reminder packs were sent to tenants where completed surveys had not been received within 2 weeks of the initial reminder packs being mailed. All jurisdictions received 2 reminder mailings, which included a questionnaire (including a reminder letter) and a reply-paid envelope. The approach for tenants in the Australian Capital Territory was slightly different due to the time available for fieldwork. Tenants in the Australian Capital Territory were sent second reminder packs 1 week after the initial reminder mailing. This was necessary due to the requirement for key results being available in time for inclusion in the Australian Capital Territory annual report. A boost sample for New South Wales community housing was confirmed during the fieldwork period. The shorter fieldwork period for this group meant that the majority of New South Wales community housing tenants only received 1 reminder pack.
To maximise engagement and increase overall response rates an additional reminder mechanism was employed in the 2014 survey in those jurisdictions where telephone numbers were available. Lonergan Research used voice-activated telephone interviewing (VATI) to conduct reminder calls to tenants. SOMIH tenants participating in the 2014 NSHS via face-to-face interview also received a cash incentive of $10 upon completion of the interview.
In 2014, where weekly progress reports identified the likelihood that minimum required sample sizes would not be achieved in certain housing programs and jurisdictions, Lonergan Research made the decision to send mailing packs to ‘boost’ sample (that is, to those not included in the initial mailing). Survey packs to boost samples were distributed in batches of 100 with unique tags for each batch.

6 National Social Housing Survey: detailed results 2014
The purpose of batching and creating unique identifying tags was to ensure that only the minimum sample required was actually used. The approach was as follows:
• All completed surveys were sorted in batches. • Where the required minimum sample size in a jurisdiction or area were achieved (or
exceeded) from the original send, responses from boost samples were not used—so as not to compromise the overall response rate.
• Where minimum sample sizes in a particular area or jurisdiction had not been achieved, boost sample batches were added one at a time until minimal sample sizes were achieved. The order in which batches were added was in the order of the batch number as determined by the date responses were received. By doing this, any detrimental impact to the overall response rate was limited.
As with the 2010 and the 2012 NSHS, the 2014 NSHS used the same survey instrument across all social housing programs. For public housing tenants in the Australian Capital Territory, 3 additional questions were added to the questionnaire, measuring satisfaction with call centre staff and maintenance contractors;—these results have been reported separately. Prior to 2010, the survey content differed slightly across the programs, reflecting different areas of interest in relation to each program. The approach taken in 2014 was consistent with that used in 2012 and was adopted in order to maximise data comparability across social housing programs. While some minor changes were made in relation to the survey questions in 2014, the same topics were covered and content for key issues is unchanged.
For this report, discussion of comparisons of national and jurisdictional estimates has focussed on differences that are statistically significant.
Reference is made throughout the report to supplementary tables, these tables (including with demographic tables) can be found on the AIHW website <www.aihw.gov.au>.
Some survey respondents did not answer all questions, either because they were unable or unwilling to provide a response. The survey responses for these people were retained in the sample, and the missing values were recorded as ‘not answered’. Missing data and ‘not applicable’ responses were not included in the denominators when calculating proportions throughout the report.
Further information regarding the approach to the 2014 NSHS is provided in ‘Appendix B: Survey and reporting methodology’, as well as in the 2014 National Social Housing Survey (NSHS)—Methodological Report prepared by Lonergan Research and available on the AIHW website <www.aihw.gov.au>.
Comparison with previous years’ results While the survey methodology has remained largely unchanged, some of the changes described above may impact upon survey comparability, including minor changes to survey questions, the methodology for SOMIH tenants and the obtained response rates.
As already noted, previously SOMIH tenants were all surveyed using the same methodology, either through a face-to-face interview (in 2005 and 2007) or through a mail-out paper questionnaire (2012). In 2014, a mixed methodology was adopted with 2 jurisdictions (New South Wales and Queensland) surveying SOMIH tenants via face-to-face interview. In these jurisdictions, minimum required sample sizes (n=500) were achieved with high levels of engagement and response (an average of 58%). The remaining 2 jurisdictions operating a SOMIH program (South Australia and Tasmania) surveyed SOMIH tenants via

National Social Housing Survey: detailed results 2014 7
mail-out paper questionnaire. In addition, due to the small number of SOMIH dwellings in these jurisdictions and the likelihood that neither would achieve the desired minimum sample size, both South Australia and Tasmania conducted a census of their SOMIH population (that is, all tenants were send a mail-out paper questionnaire). Engagement with the mail-out survey was lower in these jurisdictions, with response rates of 19% and 27% respectively.
Anecdotal evidence from interviewers who conducted the face-to-face research amongst SOMIH tenants in Queensland and New South Wales confirmed that the face-to-face approach was well received by tenants. The majority of tenants considered it to be a more culturally appropriate and engaging method of consultation than mail-out surveys. A face-to-face approach was also considered to yield richer open-ended responses for the open-ended satisfaction question used in the survey.
Overall participation rates were 32% for mail-out/online responses (up from around 16% in 2012) and 58% for face-to-face SOMIH interviews. Detailed information regarding the mixed methodology used for SOMIH tenants and response rates across programs and jurisdictions, are available in the methodological report prepared by Lonergan Research and available on the AIHW website <www.aihw.gov.au>.
Estimates of customer satisfaction between 2012 and 2014 are not fully comparable due to changes in the methodology of the survey and in the levels of estimation variability associated with these figures.
2014 NSHS sample representativeness An analysis was undertaken comparing the demographic characteristics of NSHS respondents from the 2014 survey with the equivalent demographic information in the national administrative data collections, in order to confirm that social housing tenants surveyed as part of the NSHS are representative of the broader social housing population.
The analysis found there were some differences between the demographic profile of NSHS respondents and the profile of tenants reported in the national administrative data collections. These demographic differences between data collections are expected as the 2014 NSHS does not require that a survey respondent be the main tenant of the household (that is, the person who signed or co-signed the lease). The differences between the demographic profile from the survey and the demographic profile in the administrative data for 2014 are consistent with those observed for 2012 and 2010.
Key demographic differences in 2014 are:
• The gender profile in the administrative database (44% male, 56% female for PH; 44% male, 54% female for CH, 43% male, 57% female for SOMIH) across the social housing programs differed from the 2014 NSHS (37% male, 63% female for PH; 40% male, 60% female for CH, 28% male, 72% female for SOMIH).
• The age profile in the administrative database across the social housing programs was generally younger than that observed in the NSHS sample. For example, around 43% of public housing tenants, 41% of community housing tenants, and 15% of SOMIH tenants responding to the NSHS were aged 65 and over compared with 19% of public housing, 15% of community housing, and 6% of SOMIH tenants in each of the respective administrative databases.

8 National Social Housing Survey: detailed results 2014
• There were noticeable differences in the household types in the 2014 NSHS compared with the administrative data. For example: – a higher proportion of public housing tenants responding to the 2014 NSHS lived in
single-adult (56%) and couple-only households (12%) than was observed in the administrative database (53% and 8% respectively)
– A higher proportion of community housing tenants responding to the 2014 NSHS lived in couple-only households (14%) than was observed in the administrative database (7%).
• Tenure length was greater for public housing tenants responding to the NSHS, with a higher proportion (48%) having lived in their current home for more than 10 years, than was observed in the administrative database (41%).
In summary, the 2014 NSHS respondents were more likely to be female, older and with longer tenures in their homes, compared with tenants in the administrative database. For further information regarding the profile of social housing tenants and 2014 NSHS respondents, please refer to Appendix A: Survey and reporting methodology and Appendix B: Profile of 2014 NSHS respondents. These differences need to be considered when interpreting the findings of the 2014 NSHS.

National Social Housing Survey: detailed results 2014 9
Section 1: Overview
1.1 Tenant satisfaction
Key points • Tenant satisfaction with the services received from their housing provider has risen for
both public housing and community housing across all jurisdictions since 2012. • The majority of social housing tenants are satisfied with the services received from their
housing provider (ranging from 58% in SOMIH to 80% for community housing). • Satisfaction increases with age, with more than three-quarters (79%) of those aged 65 and
over satisfied with the services from their social housing provider. • Queensland tenants were the most satisfied across all social housing programs with the
services received from their housing provider. • Indigenous tenants were less likely to be satisfied with their housing provider compared
with non-Indigenous tenants. • The structural standard of a dwelling was a greater determinant of satisfaction among
social housing tenants than was the standard of facilities. • Satisfaction was higher for tenants living in underutilised dwellings (76%) and in
dwellings of an acceptable standard (79%).
Overall satisfaction The majority of NSHS respondents across public housing, SOMIH and community housing, indicated that they were satisfied with the overall services provided by their housing organisation (73% for PH, 58% for SOMIH, and 80% for CH) (Figure 1.1).
This represents an increase from 2012 for both public housing (65% satisfied in 2012) and community housing (74% satisfied in 2012).
Satisfaction rates for SOMIH are in line with those from 2012 (59% in 2012, 58% in 2014) however this needs to be considered in the context of a change in survey methodology (see Appendix A Survey and reporting methodology for further information).
Generally, satisfaction was highest across all social housing programs (Table 1.1) for:
• non-Indigenous tenants—though satisfaction rates for Indigenous tenants has increased since 2012 for public housing (56% to 64%) and community housing (67% to 74%)
• tenants who had not been homeless in the 5 years leading up to the survey • tenants in dwellings with no structural problems • tenants in dwellings classed as ‘adequate’ or ‘underutilised’.

10 National Social Housing Survey: detailed results 2014
Note: Responses to this question relate to the person in the household who completed the survey form.
Source: Supplementary table S1.1.
Figure 1.1: Satisfaction with services provided by the housing organisation, by housing program type, 2014 (%)
Table 1.1: Proportion of tenants satisfied with services provided by housing organisation, by Indigenous status, prior homelessness, number of structural problems, and dwelling utilisation, 2014 (%)
Characteristic
Public housing
(%) SOMIH
(%)
Community housing
(%) All
(%)
Indigenous status
Indigenous 64.2 58.1 74.0 63.2
Non-Indigenous 72.6 59.8 80.3 73.8
Prior homelessness
Homeless in last 5 years 73.2 54.5 71.4 72.5
Have not been homeless in last 5 years 72.7 58.8 81.4 73.6
Structural problems
3 or more structural problems 45.4 36.4 51.2 45.4
1 or 2 structural problems 67.7 57.4 67.3 67.3
No structural problems 87.6 77.6 90.5 88.0
Dwelling utilisation
Overcrowded 59.3 56.9 62.6 59.4
Adequate 72.5 57.2 80.5 73.5
Underutilised 76.2 63.0 78.9 76.1
Notes
1. Responses to this question refer to the person who completed the survey form.
2. 'Satisfied' includes those who reported being 'satisfied' or 'very satisfied'.
Very satisfied Satisfied Neither satisfied nor dissatisfiedDissatisfied Very dissatisfied
Community housing
SOMIH
Public housing
All
Per cent
0 10 20 30 40 50 60 70 80 90 100
Housing type

National Social Housing Survey: detailed results 2014 11
Reasons for tenant satisfaction and dissatisfaction Social housing tenants were also asked to explain why they were satisfied or dissatisfied with the overall services provided by their housing organisation. The most common reason for satisfaction with the housing provider was ‘repairs being done quickly’. This was followed by ‘not having any problems’ (and therefore having no need to contact them) and ‘non-maintenance staff being friendly, helpful and professional’. The most common reasons for dissatisfaction with the services provided by housing providers was ‘the requested repairs not being done at all’ and ‘repairs being done too slowly’.
Box 1.1: Examples of responses: ‘The only problems that [we] have had were seen too promptly and repaired in a good fashion.’
New South Wales, community housing tenant, 2014 NSHS
‘Because they have provided the services when required promptly and politely.’ Queensland, community housing tenant, 2014 NSHS
‘I have not had any problems.’ Victoria, public housing tenant, 2014 NSHS
‘When you ring them they don’t do anything about it.’ Queensland, community housing tenant, 2014 NSHS
‘The house has major problems regarding the structure. I have rung numerous times and am getting nowhere.’
South Australia, public housing tenant, 2014 NSHS
‘The emergency service maintenance takes too long to respond to issues.’ Western Australia, community housing tenant, 2014 NSHS
Satisfaction over time Throughout the life of the survey, the NSHS has asked social housing tenants to rate their satisfaction with the overall services provided by their social housing provider.
The wording of the question tracking this item has changed over time. In addition, there have been changes made to the methodology between the 2007, 2012 and 2014 survey iterations for SOMIH tenants (See Appendix A for details). The change in questionnaire wording as well as the change in methodology for SOMIH tenants may have impacted on satisfaction levels over time, and for this reason results should be interpreted with caution.
Since 2001, two-thirds or more of public housing tenants and three-quarters or more of community housing tenants reported they were satisfied with the overall service provided by their housing provider. In addition, community housing tenants have remained consistently the most satisfied over time (Figure 1.2). The methodology for collecting data about these tenant groups has remained unchanged and these results are likely to be comparable.
Historically, satisfaction for SOMIH tenants has been lower, with around two-thirds or less of this tenant group satisfied with the overall service provided by their housing provider. As described above, it is important to note the change in methodology for SOMIH tenants across survey iterations: in 2005 and 2007 all SOMIH tenants were surveyed via face-to-face

12 National Social Housing Survey: detailed results 2014
while in 2012 all tenants were surveyed via mail-out. In 2014, a mixed methodology was used with 2 jurisdictions surveying face-to-face and 2 jurisdictions surveying via mail-out. For this reason, results are not comparable, and in Figure 1.2 the trend line for SOMIH tenants has been omitted between 2007 and 2012 and between 2012 and 2014.
Overall, since 2010:
• public housing tenants’ satisfaction has remained at 73% (after a decrease to 65% in 2012) • SOMIH tenants’ satisfaction is 58% (63% in 2007, 59% in 2012) • community housing tenants’ satisfaction increased to 80% (after a decrease to 74% in
2012).
Notes
1. Responses to this question relate to the person in the household who completed the survey form.
2. Community housing tenants were surveyed in 2002.
3. SOMIH tenants were not surveyed in 2001, 2003 or 2010.
4. 2012 estimates may not be directly comparable to other estimates in the time series due to the survey methodology employed in that year. 2014 estimates for SOMIH tenants are not directly comparable to 2012 due to the use of face-to-face interviewing in New South Wales and Queensland in 2014.
Source: Supplementary table S1.2.
Figure 1.2: Satisfaction with services provided by the housing organisation over time, by housing program type, 2001–2014 (%)
-
10
20
30
40
50
60
70
80
90
100
2001 2003 2005 2007 2010 2012 2014
Per cent
Year Public housing SOMIH Community housing

National Social Housing Survey: detailed results 2014 13
1.2 Satisfaction with amenities
Key points • The majority of social housing tenants, across all programs, indicated that the listed
amenities were important to their household. • SOMIH tenants rated almost all amenities highest in terms of importance compared with
public housing or community housing tenants. The exception was for ‘modifications for special needs’ which was rated highest by public housing tenants. It is important to note the role that the change in methodology for SOMIH tenants may have played in this result.
• Of those tenants rating amenities as important to their household, the majority also indicated that their household’s needs are met.
Importance of amenities Social housing tenants were provided with a list of amenities and asked whether or not they were important to their household, and whether their household’s needs had been met. Consistent with the findings from 2012, three-quarters or more of social housing tenants surveyed indicated that the selected amenities listed were important to their household; of those who rated these amenities as important, the majority indicated that their households’ needs were met (figures 2.1 and 2.2).
Selected amenities were rated highest in terms of importance for:
• safety and security within the home (98% for PH, 99% for SOMIH and 98% for CH) • energy efficiency (96% for PH, 99% for SOMIH and 96% for CH) • privacy of the home (96% for PH, 98% for SOMIH and 96% for CH) • safety and security outside of the home within the neighbourhood (96% for PH, 99% for
SOMIH and 95% for CH) • thermal comfort (95% for PH, 99% for SOMIH and 94% for CH) • water efficiency (95% for PH, 97% for SOMIH and 94% for CH).
Selected amenities that were rated lower (although still high in terms of importance) were:
• modifications for special needs (76% for PH, 65% for SOMIH and 73% for CH) • size of home (83% for PH, 90% for SOMIH and 82% for CH). The amenities rated as important by households can be partly explained by the age of tenants and their labour force status, the household composition and the presence or absence of dependent children.
14 National Social Housing Survey: detailed results 2014
Note: Responses to this question relate to the person in the household who completed the survey form.
Source: Supplementary table S2.1.
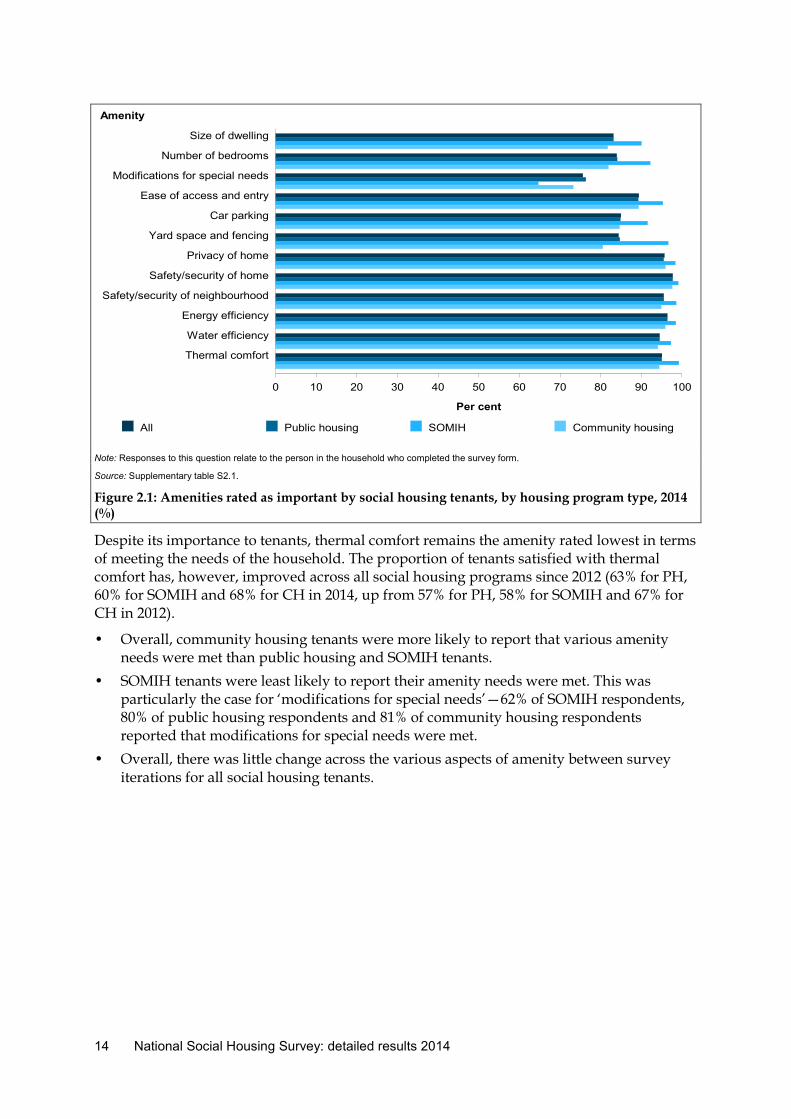
Figure 2.1: Amenities rated as important by social housing tenants, by housing program type, 2014 (%)
Despite its importance to tenants, thermal comfort remains the amenity rated lowest in terms of meeting the needs of the household. The proportion of tenants satisfied with thermal comfort has, however, improved across all social housing programs since 2012 (63% for PH, 60% for SOMIH and 68% for CH in 2014, up from 57% for PH, 58% for SOMIH and 67% for CH in 2012).
• Overall, community housing tenants were more likely to report that various amenity needs were met than public housing and SOMIH tenants.
• SOMIH tenants were least likely to report their amenity needs were met. This was particularly the case for ‘modifications for special needs’—62% of SOMIH respondents, 80% of public housing respondents and 81% of community housing respondents reported that modifications for special needs were met.
• Overall, there was little change across the various aspects of amenity between survey iterations for all social housing tenants.
All Public housing SOMIH Community housing
Thermal comfort
Water efficiency
Energy efficiency
Safety/security of neighbourhood
Safety/security of home
Privacy of home
Yard space and fencing
Car parking
Ease of access and entry
Modifications for special needs
Number of bedrooms
Size of dwelling
Per cent
0 10 20 30 40 50 60 70 80 90 100
Amenity

National Social Housing Survey: detailed results 2014 15
Notes
1. The proportion of households rating amenities as meeting needs of the household is based on the household that indicated the particular amenity was important to the household.
2. Responses to this question relate to the person in the household who completed the survey form.
Source: Supplementary table S2.2.
Figure 2.2: Amenities rated as important and meeting their needs by social housing tenants, by housing program type, 2014 (%)
All Public housing SOMIH Community housing
Thermal comfort
Water efficiency
Energy efficiency
Safety/security of neighbourhood
Safety/security of home
Privacy of home
Yard space and fencing
Car parking
Ease of access and entry
Modifications for special needs
Number of bedrooms
Size of dwelling
Per cent
0 10 20 30 40 50 60 70 80 90 100
Amenity

16 National Social Housing Survey: detailed results 2014
1.3 Satisfaction with location (proximity to facilities and services)
Key points • Consistent with previous survey findings, satisfaction is high across all social housing
programs with the location of dwellings in terms of proximity to services and facilities. • Social housing tenants consistently rated proximity to emergency services, medical
services and hospitals highest in terms of importance, while proximity to child care services was rated lowest in terms of importance.
• As with amenities, social housing tenants rated location of their dwelling highly in terms of meeting the needs of their household.
Importance of location Consistent with the 2010 and 2012 NSHS iterations, the majority of social housing tenants indicated that being located close to a range of facilities and services was important for their household, and that their households’ needs have been met (figures 3.1 and 3.2).
The importance of proximity to facilities or services was rated highest for:
• emergency services, medical services and hospitals (95% for PH, 96% for SOMIH and 95% for CH)
• family and friends (91% for PH, 97% for SOMIH and 92% for CH) • shops and banking facilities (92% for PH, 93% for SOMIH and 91% for CH).
These trends are similar to those reported in 2012.
The importance of proximity to facilities or services was lowest for child care facilities and education and training facilities for both public housing and community housing tenants, yet remained high for SOMIH tenants. Those services rated as important by households can be partly explained by the age of tenants and the presence or absence of dependent children. Proximity to community and support services was rated the lowest in importance for SOMIH tenants, although this was still high (73%).
Being located close to employment or place of work was rated as important to more than two-thirds of tenants in public housing and community housing (both at 67%). This is an interesting finding given the large proportion of tenants who are older than working age, sole parents or those who report that they have a disability. SOMIH tenants were more likely (74%) to rate proximity to employment or place of work as important, and this can be partly explained by the higher proportion of SOMIH tenants of working age.

National Social Housing Survey: detailed results 2014 17
Note: Responses to this question related to the person in the household who completed the survey form.
Source: Supplementary table S3.1.
Figure 3.1: Location (proximity to facilities and services) rated by tenants as important to the household, by housing program type, 2014 (%)
Notes
1. The proportion of households rating location to selected facilities and services as meeting needs of the household is based on the households that indicated that the particular amenity was important to the household.
2. Responses to this question relate to the person in the household who completed the survey form.
Source: Supplementary table S3.2.
Figure 3.2: Location (proximity to facilities and services) rated by tenants as meeting the needs of the household, by housing program type, 2014 (%)
All Public housing SOMIH Community housing
Family and friends
Community and support services
Employment/place of work
Education/training facilities
Child care facilities
Emergency services,medical services and hospitals
Parks and recreational facilities
Public transport
Shops and banking
Per cent
0 10 20 30 40 50 60 70 80 90 100
Location

18 National Social Housing Survey: detailed results 2014
1.4 Satisfaction with maintenance services
Key points • Satisfaction with maintenance services was consistently high across social housing
programs, with satisfaction higher with emergency maintenance services than with day-to-day maintenance services.
• Satisfaction with maintenance services was highest for community housing tenants and lowest for SOMIH tenants.
• For both day-to-day maintenance and emergency maintenance services, satisfaction increased with age, with more than 4 in 5 of those aged 75 years and over satisfied with maintenance services.
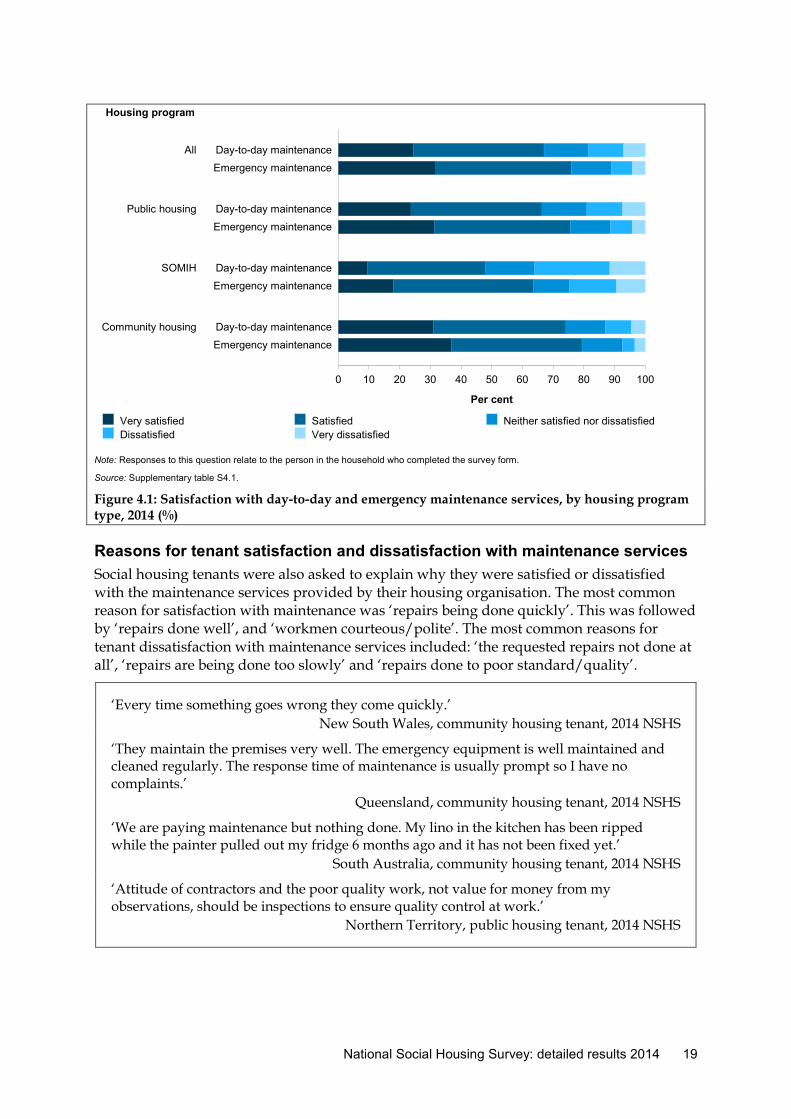
Overall satisfaction Social housing tenants were asked to rate their level of satisfaction with both day-to-day and emergency maintenance services: • Day-to-day maintenance included such services as fixing slow-dripping taps, faulty
internal door locks, or single power points or lights not working. • Emergency maintenance included fixing a blocked or broken toilet system, burst water
service or main, gas leaks, flooding, electrical faults, or storm or fire damage. Nationally, two-thirds of all social housing tenants (67%) were satisfied with the day-to-day maintenance services provided by their housing organisation, though the level of satisfaction varied across the housing programs:
• 66% of public housing tenants were satisfied or very satisfied with day-to-day maintenance services
• 48% of SOMIH tenants were satisfied or very satisfied with day-to-day maintenance services
• 74% of community housing tenants were satisfied or very satisfied with day-to-day maintenance services.
Satisfaction with emergency maintenance services was higher across all social housing programs than satisfaction with day-to-day maintenance services (Figure 4.1). Nationally three-quarters of all social housing tenants (76%) were satisfied with the emergency maintenance services provided by their housing organisation—compared with two-thirds satisfied with day-to-day maintenance—though the level of satisfaction varied across housing programs:
• 76% of public housing tenants were satisfied or very satisfied with emergency maintenance services
• 64% of SOMIH tenants were satisfied or very satisfied with emergency maintenance services
• 79% of community housing tenants were satisfied or very satisfied with emergency maintenance services.
Satisfaction with both day-to-day and emergency maintenance services has fallen across all social housing programs since 2012.
National Social Housing Survey: detailed results 2014 19
Note: Responses to this question relate to the person in the household who completed the survey form.
Source: Supplementary table S4.1.
Figure 4.1: Satisfaction with day-to-day and emergency maintenance services, by housing program type, 2014 (%)
Reasons for tenant satisfaction and dissatisfaction with maintenance services Social housing tenants were also asked to explain why they were satisfied or dissatisfied with the maintenance services provided by their housing organisation. The most common reason for satisfaction with maintenance was ‘repairs being done quickly’. This was followed by ‘repairs done well’, and ‘workmen courteous/polite’. The most common reasons for tenant dissatisfaction with maintenance services included: ‘the requested repairs not done at all’, ‘repairs are being done too slowly’ and ‘repairs done to poor standard/quality’.
‘Every time something goes wrong they come quickly.’ New South Wales, community housing tenant, 2014 NSHS
‘They maintain the premises very well. The emergency equipment is well maintained and cleaned regularly. The response time of maintenance is usually prompt so I have no complaints.’
Queensland, community housing tenant, 2014 NSHS
‘We are paying maintenance but nothing done. My lino in the kitchen has been ripped while the painter pulled out my fridge 6 months ago and it has not been fixed yet.’
South Australia, community housing tenant, 2014 NSHS
‘Attitude of contractors and the poor quality work, not value for money from my observations, should be inspections to ensure quality control at work.’
Northern Territory, public housing tenant, 2014 NSHS
Very satisfied Satisfied Neither satisfied nor dissatisfiedDissatisfied Very dissatisfied
Community housing
SOMIH
Public housing
All
Emergency maintenance
Day-to-day maintenance
Emergency maintenance
Day-to-day maintenance
Emergency maintenance
Day-to-day maintenance
Emergency maintenance
Day-to-day maintenance
Per cent
0 10 20 30 40 50 60 70 80 90 100
Housing program

20 National Social Housing Survey: detailed results 2014
1.5 Perceived benefits of living in social housing
Key points • Social housing tenants reported a range of benefits from living in social housing, with
around 8 out of 10 tenants identifying multiple benefits of living in social housing. • The most common benefit reported was being ‘able to manage rent/money better’ and
‘feeling more settled’ (both at 95%), which this was consistent across social housing programs.
• The least common benefit reported was ‘feel more able to improve job situation’ (63%) and ‘feel more able to start or continue education/training (70%). This was more commonly reported by SOMIH tenants, which may reflect the fact that SOMIH tenants were more likely to be of working age.
It is important to note that the way the question was asked in 2014 differs from that used in 2012. In the 2012 NSHS, respondents were asked to only tick which benefits applied to them from a set list. In 2014, respondents were asked to tick a response option for each of the listed benefits. The result of this is that most benefits in 2014 were listed by a larger proportion of tenants across all social housing programs. For this reason, the 2014 results are not directly comparable to the 2012 results.
Benefits of social housing Social housing tenants surveyed in the NSHS reported a range of benefits from living in social housing (Figure 5.1).
The benefits most commonly reported from living in social housing were:
• ‘feeling more settled in general’ (95% for PH, 92% for SOMIH and 94% for CH) • ‘able to manage rent/money better’ (95% for PH, 92% for SOMIH and 94% for CH) • ‘able to continue living in the area’ (92% for PH, 92% for SOMIH and 93% for CH). The benefits least commonly reported from living in social housing were;
• ‘feeling more able to improve job situation’ (62% for PH, 80% for SOMIH and 67% for CH)
• ‘feeling more able to start or continue education/training’ (68% for PH, 83% for SOMIH and 74% for CH)
• ‘enjoying better health’ (80%) and ‘feeling more able to improve job situation’ (80%) were the benefits of living in social housing least likely to be reported by SOMIH tenants.

National Social Housing Survey: detailed results 2014 21
Notes
1. Responses to this question relate to the individual who completed the survey form.
2. Respondents were allowed to select more than 1 response.
3. Options for responses to questions regarding perceived benefits are different in 2014 NSHS compared with the 2012 NSHS.
Source: Supplementary table S5.1.
Figure 5.1: Self-reported benefits gained by tenants living in social housing, by housing program type, 2014 (%)
All Public housing SOMIH Community housing
Other
Have better access to public transport
Have better access to services
Feel more able to start orcontinue education/training
Feel more able to improve job situation
Be able to manage rent/money better
Be able to continue living in this area
Feel part of the local community
Feel more able to cope with life events
Enjoy better health
Feel more settled
Per cent
0 10 20 30 40 50 60 70 80 90 100
Benefit

22 National Social Housing Survey: detailed results 2014
Box 5.1: Examples of ‘other’ benefits of social housing Around 1 in 10 tenants reported that they received ‘other benefits’ from living in social housing. Some of the other benefits mentioned by tenants include:
‘Feel more secure i.e. more settled and not worried about not having anywhere to live etc.’ New South Wales, community housing tenant, 2014 NSHS
‘Support for other members; sense of community within the co-op; security of tenure; son able to move b/n my place and his father’s independently; affordable.’
Victoria, community housing tenant, 2014 NSHS
‘All of us in the settlement have same problems & have a little happiness.’ Victoria, community housing tenant, 2014 NSHS
‘House my pets who I consider as my children.’ Victoria, public housing tenant, 2014 NSHS
‘A hell of a lot better on my emphysema & disabilities, schizophrenia & bi-polar.’ Victoria, community housing tenant, 2014 NSHS
‘Making friends and serving community.’ Queensland, community housing tenant, 2014 NSHS
‘Secure accommodation has given me a sense of self-worth.’ Western Australia, public housing tenant, 2014 NSHS
‘Feel proud as a public housing tenant that I am looking after my current home that will be a resource for others in the future.’
South Australia, public housing tenant, 2014 NSHS
‘I feel as though my risk of becoming homeless again is lower and that I have genuine hope for a future I previously didn’t.’
Tasmania, community housing tenant, 2014 NSHS

National Social Housing Survey: detailed results 2014 23
1.6 Dwelling condition and utilisation
Key points • Dwelling condition or standard is assessed by the number of working facilities the
dwelling has (regardless of who owns them) as well as by the number of major structural problems present. A dwelling is considered to be of an acceptable standard if the respondent identifies it has 4 or more working facilities and no more than 2 major structural problems.
• The majority of social housing respondents lived in a dwelling of an acceptable standard. This was most common for public housing, SOMIH and community housing tenants in Queensland, and for as community housing tenants in Western Australia.
• Based on the Canadian National Occupancy Standard (CNOS), around three-quarters of social housing dwellings were considered to be adequate in size for the household.
• Only a small proportion of social housing dwellings were overcrowded, which was more common in SOMIH households than in either public housing or community housing households.
• Underutilisation was much more common than overcrowding in social housing households. This was most common in public housing and SOMIH households, with 1 in 5 dwellings underutilised, and 1 in 7 community housing households.
Dwelling condition In order to assess dwelling condition, tenants were asked what facilities their dwelling had and whether or not these facilities were in working order. Tenants were also asked to report the number of structural problems present in their dwelling. As results are based on self-reporting, structural problems may be under-reported, as the tenant may not have been able to accurately identify these.
Box 6.1: Dwelling condition A dwelling is considered to be of an acceptable standard if it has 4 or more working facilities, and if it has no more than 2 major structural problems. In order to assess dwelling condition, tenants were asked to indicate what facilities their dwelling had and whether they were in working order. The facilities listed included: • stove/oven/other cooking facilities • fridge • toilet • bath or shower • washing machine • kitchen sink • laundry tub. Tenants were also asked to report the number of structural problems present in the dwelling. As this is based on self-reporting, structural problems may be under-reported, as the tenant may not be able to accurately identify these.

24 National Social Housing Survey: detailed results 2014
Facilities From the list provided, 90% or more of all social housing tenants reported that their household had the specific facility and that it was currently in working order (see Figure 6.1). It is important to note that the survey did not identify who owned or supplied the facility.
The list of facilities included:
• stove/oven/other cooking facilities • fridge • toilet • bath or shower • washing machine • kitchen sink • laundry tub. The most common facilities that households either did not have or that were not currently in working order included:
• cooking facilities (5%) and washing machine (3%) for public housing tenants • cooking facilities (10%) and bath or shower (4%) for SOMIH tenants • cooking facilities ( 4%) and washing machine (3%) for community housing facilities.
Notes
1. Responses to this question relate to the person in the household who completed the survey form.
2. Respondents were not asked to specify if they provided the facilities or the landlord provided the facilities.
Source: Supplementary table S6.1.
Figure 6.1: Facilities the household has that work, by housing program type, 2014 (%)
All Public housing SOMIH Community housing
Laundry tub
Kitchen sink
Washing machine
Bath or shower
Toilet
Fridge
Stove/oven/other cooking facilities
Per cent
0 10 20 30 40 50 60 70 80 90 100
Facility

National Social Housing Survey: detailed results 2014 25
Structure Major structural problems that could be reported (that is, were listed on the survey questionnaire) by social housing tenants were:
• rising damp • major cracks in walls/floors • sinking/moving foundations • sagging floors • walls/windows out of plumb • wood rot/termite damage • major electrical problems • major plumbing problems • major roof defect • other structural problems.
Compared to the national average (Figure 6.2):
• almost half of public housing tenants (43%) reported that their dwelling had no structural problems while a slightly lower proportion reported that their dwelling had 1 or 2 structural problems (38%). Fewer than 1 in 5 public housing tenants (19%) reported that their dwelling had 3 or more structural problems, which is in line with the national average (18%)
• community housing tenants were significantly more likely to report their dwelling had no structural problems (61%) and significantly less likely to report their dwelling had 1 or 2 (30%) or 3 or more structural problems (9%). This may be a consequence of the fact that community housing stock is newer than that found in public housing or SOMIH
• SOMIH tenants were significantly more likely to report that their dwelling had 3 or more structural problems (29%) and significantly less likely than the national average (18%) to report their dwelling had no structural problems (32%). Around 38% reported that their dwelling had 1 or 2 structural problems.
The most commonly reported structural problems for social housing tenants were major cracks in walls/floors (21% for PH, 33% for SOMIH and 14% for CH) and rising damp (20% for PH, 29% for SOMIH and 11% for CH).

26 National Social Housing Survey: detailed results 2014
Note: Responses to this question relate to the person in the household who completed the survey form.
Source: Supplementary table S6.2.
Figure 6.2: Number of structural problems the household has, by housing program type, 2014 (%)
All Public housing SOMIH Community housing
House with no structural problems
House with 1 or 2 structural problems
House with 3 or more structural problems
Per cent
0 10 20 30 40 50 60 70 80 90 100
Number of structural problems

National Social Housing Survey: detailed results 2014 27
Dwelling standard The majority of social housing tenants were living in homes of an ‘acceptable’ standard, as defined by respondents reporting that they had at least 4 working facilities and no more than 2 major structural problems (79% for PH, 70% for SOMIH and 89% for CH).
It is interesting to note that the proportion of acceptable standard dwellings has increased for all social housing programs since the last survey:
• up from 75% in 2012 to 81% in 2014 for public housing • from 61% in 2012 to 70% in 2014 for SOMIH (noting the change in methodology) • up from 85% in 2012 to 89% in 2014 for community housing.
Notes
1. Responses to this question relate to the person in the household who completed the survey form.
2. Facilities listed include stove/oven/other cooking facilities; fridge; toilet; bath or shower; washing machine; kitchen sink; and laundry tub.
3. Respondents were not asked to specify if they provided the facilities or the landlord provided the facilities.
4. Structural problems listed include rising damp; major cracks in walls/floors; sinking/moving foundations; sagging floors; walls/windows out of plumb; wood rot/termite damage; major electrical problems; major plumbing problems; major roof defect; other structural problems.
Source: Supplementary table S6.3.
Figure 6.3: Dwelling standard, by housing program type, 2014 (%)
All Public housing SOMIH Community housing
3 or more structural problemsand 3 or less working facilities
3 or more structural problemsand 4 or more working facilities
None, 1 or 2 structural problemsand 3 or less working facilities
No more than 2 structural problemsand 4 or more working facilities
Per cent
0 10 20 30 40 50 60 70 80 90 100
Dwelling standard

28 National Social Housing Survey: detailed results 2014
Dwelling utilisation ‘Dwelling utilisation’ refers to the match between the size of a dwelling and the size of the household living in it. Matching the size of a dwelling to the size of the household ensures that existing dwelling stock is used to capacity and that households are housed according to their requirements. The currently accepted standard by which the dwelling size requirements of a household are measured is the Canadian National Occupancy Standard (CNOS) (Box 6.2).
For social housing providers, achieving a match between dwelling size and household composition is not straightforward. Factors to be considered include:
• the availability, state of repair and location of existing dwellings • the availability of options to relocate existing tenants to alternative accommodation • the willingness of tenants to relocate • the cost of rehousing existing tenants. ‘Overcrowded’ or ‘underutilised’ are terms used to describe a dwelling whose size is not well matched to the household occupying it. ‘Overcrowding’ occurs when the dwelling size is too small for the size and composition of the household living in it. Overcrowding increases the stress on kitchens, bathrooms, laundry facilities and sewerage systems, which in turn increases the risk of spreading infectious diseases between residents and places unnecessary strain on interpersonal relationships (AIHW 2012). ‘Underutilisation’ occurs when the dwelling size is larger than that required to adequately house the household.
Box 6.2: Canadian National Occupancy Standard The CNOS measures the bedroom requirements of a household based on the number, sex, age and relationships of household members. For a household not to be considered as overcrowded, it specifies that: • no more than 2 people share a bedroom • parents or couples may share a bedroom • children under 5, either of the same sex or opposite sex, may share a bedroom • children under 18 of the same sex may share a bedroom • a child aged 5–17 should not share a bedroom with a child under 5 of the opposite sex • single adults aged 18 and over and any unpaired children require a separate bedroom. Source: AIHW 2012.
In order to determine whether the size of the dwelling matches the size and needs of the household, tenants were asked 2 questions:
• how many bedrooms their home has • who shares bedrooms in their home, if anyone. A dwelling requiring at least 1 additional bedroom according to the CNOS is considered ‘overcrowded’. A dwelling is considered to be ‘underutilised’ when it consists of 2 or more bedrooms surplus to its needs according to CNOS.
Based on the CNOS standard, the majority of social housing dwellings were considered to be adequate in size for the household (76%), with only a small percentage (5%) considered

National Social Housing Survey: detailed results 2014 29
overcrowded (needing 1 or more bedrooms) down from 6% in 2012. Dwellings that were underutilised with 2 or more surplus bedrooms made up 20%, up from 14% (Figure 6.4).
Notes
1. Responses to this question relate to the person in the household who completed the survey form.
2. Dwelling utilisation has been calculated based on the CNOS.
Source: Supplementary table S6.4.
Figure 6.4: Dwelling utilisation, by housing program type, 2014 (%)
These findings in relation to dwelling utilisation are broadly consistent with findings from the public and community housing administrative data collections. In the public housing collection, 5% of public housing households were overcrowded and 16% underutilised. In the community housing collection, 4% of community housing households were overcrowded and 11% underutilised.
In SOMIH, there was a larger difference between administrative data and NSHS survey data. Overcrowding was found in around 10% of households in administrative data whereas it was found to be 19% when gathered from tenants directly. This difference may reflect the change in survey methodology used in the SOMIH program for the 2014 NSHS. It is also important to note the impact that visitors may have on overcrowding statistics for SOMIH, as the NSHS does not distinguish between permanent residents and visitors to the dwelling.
All Public housing SOMIH Community housing
Overcrowded
Adequate
Underutilised
Per cent
0 10 20 30 40 50 60 70 80 90 100
Dwelling utilisation

30 National Social Housing Survey: detailed results 2014
1.7 Household characteristics
Key points • Public housing and SOMIH tenants have been in their current dwelling for a longer
period of time than community housing tenants. Public housing and SOMIH tenants have also been in social housing longer than community housing tenants. This is partly a reflection of the fact that community housing has been around for a shorter amount of time.
• Around three-quarters of social housing tenants reported that they are not currently in the labour force. The majority of tenants not in the labour force were retired, or unable to work (due to illness or long-term disability).
• For those not in full-time employment, the strongest influences on their current employment situation included the need for more training, education or work experience or a lack of jobs in the area (for those who were unemployed); concern that the rent may increase or the pay would be too low (for part-time workers); or the desire (or need) to stay home and look after children or the need for more training, education or work experience (for those not currently in the labour force).
• Across all social housing programs, around one-third of households included at least 1 person who always or sometimes needs assistance with self-care, body-movement or communication activities. Of these households, almost two-thirds reported ‘disability’ as the main reason that assistance is required.
• Consistent with the findings from 2012, social housing tenants used health and medical services most frequently, followed by mental health services. Social housing tenants were most likely to access services without the assistance of their housing provider.
• In 2014, a larger proportion of social housing tenants accessed community and support services than in 2012, particularly in SOMIH. It is important to note the change in methodology for SOMIH tenants which may have contributed to this change.

National Social Housing Survey: detailed results 2014 31
Housing history
Time in current home Public housing and SOMIH tenants had lived in their current homes longer than community housing tenants, partly reflecting the fact that community housing has been available in Australia for a shorter amount of time and has grown at a faster rate since its introduction (Table 7.1).
• Community housing tenants (30%) were more likely than either public housing (16%) or SOMIH (20%) tenants to have moved into their current homes within the last 2 years.
• Almost half of public housing (48%) and more than one-third of SOMIH tenants (38%) had been in their current homes for 11 years or more, compared with less than one-quarter (21%) of community housing tenants.
Table 7.1: Length of time in current home, by housing program type, 2014 (%)
Length of time Public housing
(%) SOMIH
(%) Community housing
(%)
2 years or less 15.7 19.8 30.0
3–5 years 16.3 21.2 31.9
6–10 years 20.4 21.0 16.7
11–20 years 27.9 20.2 16.9
21+ years 19.6 17.8 4.5
Note: Responses to this question relate to the person in the household who completed the
survey form.
Time in social housing Consistent with the findings for ‘time in current home’, public housing and SOMIH tenants have been in social housing for a longer period of time than community housing tenants (Table 7.2).
• Almost two-thirds of public housing tenants (62%) had been in social housing for more than 10 years, as had 60% of SOMIH tenants.
• Community housing tenants were more likely to be new to social housing, with almost half (48%) living in social housing for 5 years or less.
Table 7.2: Length of time in social housing, by housing program type, 2014 (%)
Length of time Public housing
(%) SOMIH
(%) Community housing
(%)
2 years or less 9.9 10.5 22.0
3–5 years 11.0 11.9 25.5
6–10 years 16.7 18.1 18.2
11–20 years 28.8 25.2 23.3
21+ years 33.5 34.4 11.0
Note: Responses to this question relate to the person in the household who completed the
survey form.

32 National Social Housing Survey: detailed results 2014
Prior homelessness In the 2014 NSHS, being ‘homeless’ refers to times when the respondent had to live in emergency accommodation provided by a homelessness agency, had stayed temporarily with friends or relatives because they had nowhere else to live, had been totally without permanent shelter or had lived in shelter unlawfully such as squatting in derelict buildings. In the 5 years leading up to the 2014 survey:
• 12% of public housing respondents had experienced homelessness (up from 9% in 2012) • 11% of SOMIH respondents had experienced homelessness (12% in 2012) • 18% of community housing respondents had experienced homelessness (down from 19%
in 2012 (Figure 7.1).
Notes
1. Responses to this question relate to the person in the household who completed the survey form.
2. SOMIH tenants were not surveyed in 2010.
Source: Supplementary table S7.1.
Figure 7.1: Proportion of respondents who experienced homelessness in the last 5 years, by housing program type, 2010–2014 (%)
201020122014
0
2
4
6
8
10
12
14
16
18
20
Public housing SOMIH Community housing
Per cent
Housing program

National Social Housing Survey: detailed results 2014 33
Repeated experiences of homelessness were not uncommon. Of those respondents who had experienced homelessness in the 5 years prior to the survey (Figure 7.2):
• around 4 in 10 had experienced more than 1 episode of homelessness in those 5 years (44% for PH, 42% for SOMIH, and 40% for CH)
• around 1 in 10 public housing and community housing respondents experienced homelessness 6 or more times in those 5 years (11% in both cases).
Notes
1. Responses to this question relate to the person in the household who completed the survey form.
2. Base is people who were homeless in the last 5 years.
Source: Supplementary table S7.2.
Figure 7.2: Number of times homeless in the last 5 years, for those respondents who have experienced homelessness in the 5 years prior to the survey, by housing program type, 2014 (%)
Once Twice 3-5 times6-10 times More than 10 times
0
10
20
30
40
50
60
70
80
90
100
Housing program
Public housing SOMIH Community housing
Per cent

34 National Social Housing Survey: detailed results 2014
Prior living situation All social housing tenants were asked to indicate where they were living just prior to moving into their current home. Tenants indicated whether they were:
• homeless (staying with friends/relatives, in a refuge/crisis or other supported accommodation, or sleeping rough)
• living in a private boarding house or caravan park • in an institution (for example, in prison, juvenile detention, hospital or out of home care) • none of the above. Tenants in the latter category would include those living in rental accommodation or owning their own homes before moving into social housing.
Social housing respondents who had experienced homelessness in the 5 years prior to the survey were most likely to describe their prior situation as (Figure 7.3):
• ‘homeless—staying with friends/relatives’ (38% PH, 53% SOMIH, 36% CH) • ‘homeless—staying in a refuge/ crisis or other supported accommodation’ (29% PH, 29%
SOMIH, 32% CH).
Notes
1. Responses to this question relate to the person in the household who completed the survey form.
2. Base is people who were homeless in the 5 years prior to the survey.
Source: Supplementary table S7.3.
Figure 7.3: Tenure prior to moving into social housing, for those respondents who have experienced homelessness in the 5 years prior to the survey, by housing program type, 2014 (%)
In an institution Homeless-sleeping roughHomeless-staying in a refuge Homeless-staying with friends relativesIn a caravan park In a private boarding house
0
10
20
30
40
50
60
70
80
90
100
Housing program
Public housing SOMIH Community housing
Per cent

National Social Housing Survey: detailed results 2014 35
1.8 Labour force participation
Key points • Between one-half and three-quarters of all social housing tenants report that they are
currently not in the labour force—that is, they are neither working nor currently looking for work.
• Of those in the labour force, 7–8% were employed full-time, between 8% and 20% were employed part-time and between 12% and 20% were unemployed but currently looking for work.
• Of those who were: unemployed, working part-time, or currently outside of the labour force, the strongest influences on their current employment status included the need for more training, education or work experience; a lack of jobs either in the area they live or want to work; concern over rent increases or pay being too low to meet needs; and the desire or need to stay home to look after children.
Labour force participation In the 2014 NSHS, between one-half and three-quarters of all social housing respondents reported that they were not currently in the labour force (58% of PH, 74% of SOMIH and 51% of CH respondents)—that is, they were neither working nor looking for work (Table 8.1). This is despite a large proportion of respondents across all social housing programs being of working age (57% of PH, 86% of SOMIH and 59% of CH respondents). The high proportion of respondents outside of the labour force reflects the targeting of social housing to people who are vulnerable and/or disadvantaged and may have difficulty in joining the labour force. For example around one-third of all social housing respondents indicated that they ‘always’ or ‘sometimes’ need assistance with self-care, mobility or communication activities.
Between one-quarter and one-half of social housing respondents between the ages of 15 and 64 years (42% of PH, 27% of SOMIH and 48% of CH respondents) were in the labour force in one of the following categories:
• employed full-time (35 hours or more per week) (8% of PH, 7% of SOMIH and 8% of CH respondents)
• employed part-time (less than 35 hours per week) (16% of PH, 8% of SOMIH and 20% of CH respondents)
• unemployed (not currently employed but actively looking for work) (18% of PH, 12% of SOMIH and 20% of CH respondents).
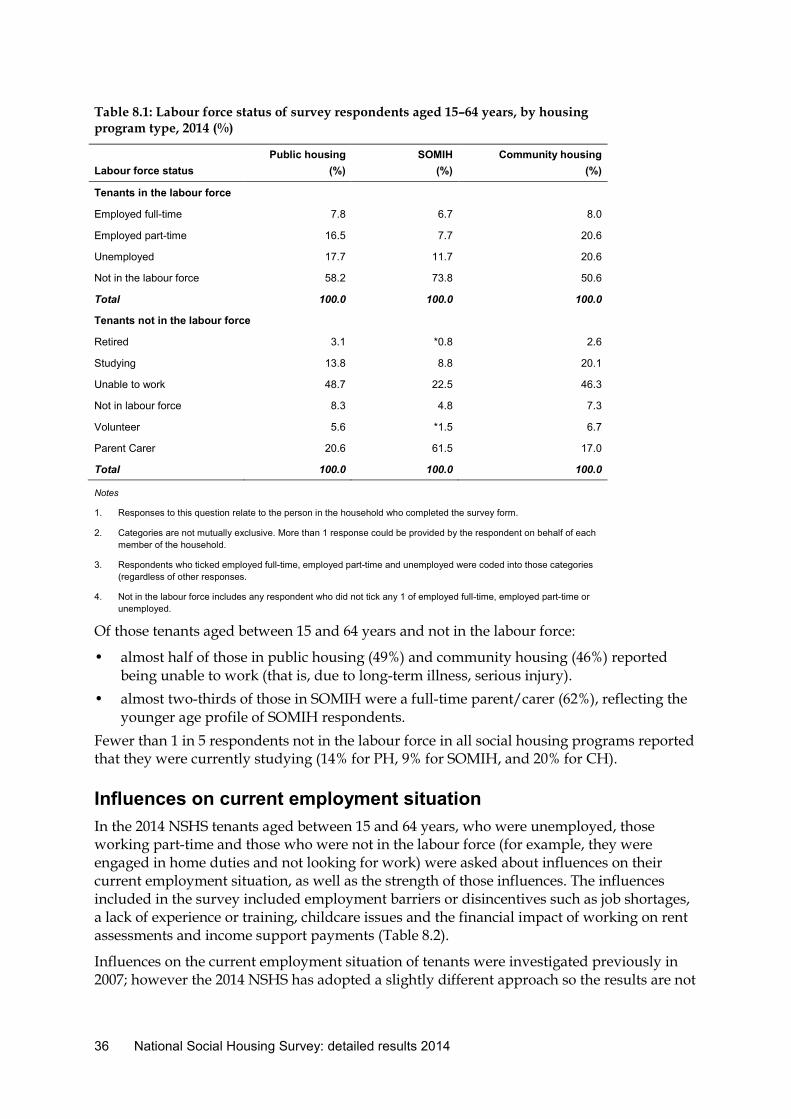
36 National Social Housing Survey: detailed results 2014
Table 8.1: Labour force status of survey respondents aged 15–64 years, by housing program type, 2014 (%)
Labour force status Public housing
(%) SOMIH
(%) Community housing
(%)
Tenants in the labour force
Employed full-time 7.8 6.7 8.0
Employed part-time 16.5 7.7 20.6
Unemployed 17.7 11.7 20.6
Not in the labour force 58.2 73.8 50.6
Total 100.0 100.0 100.0
Tenants not in the labour force
Retired 3.1 *0.8 2.6
Studying 13.8 8.8 20.1
Unable to work 48.7 22.5 46.3
Not in labour force 8.3 4.8 7.3
Volunteer 5.6 *1.5 6.7
Parent Carer 20.6 61.5 17.0
Total 100.0 100.0 100.0
Notes
1. Responses to this question relate to the person in the household who completed the survey form.
2. Categories are not mutually exclusive. More than 1 response could be provided by the respondent on behalf of each member of the household.
3. Respondents who ticked employed full-time, employed part-time and unemployed were coded into those categories (regardless of other responses.
4. Not in the labour force includes any respondent who did not tick any 1 of employed full-time, employed part-time or unemployed.
Of those tenants aged between 15 and 64 years and not in the labour force:
• almost half of those in public housing (49%) and community housing (46%) reported being unable to work (that is, due to long-term illness, serious injury).
• almost two-thirds of those in SOMIH were a full-time parent/carer (62%), reflecting the younger age profile of SOMIH respondents.
Fewer than 1 in 5 respondents not in the labour force in all social housing programs reported that they were currently studying (14% for PH, 9% for SOMIH, and 20% for CH).
Influences on current employment situation In the 2014 NSHS tenants aged between 15 and 64 years, who were unemployed, those working part-time and those who were not in the labour force (for example, they were engaged in home duties and not looking for work) were asked about influences on their current employment situation, as well as the strength of those influences. The influences included in the survey included employment barriers or disincentives such as job shortages, a lack of experience or training, childcare issues and the financial impact of working on rent assessments and income support payments (Table 8.2).
Influences on the current employment situation of tenants were investigated previously in 2007; however the 2014 NSHS has adopted a slightly different approach so the results are not

National Social Housing Survey: detailed results 2014 37
directly comparable. Those who indicated that they were employed full-time, retired, currently studying, unable to work, volunteering or were a full-time parent or carer were not asked about employment barriers or disincentives.
The strongest influences on respondent’s current employment situation across selected labour force categories were:
• for the unemployed: the need for more training, education or work experience (58%), concern that the rent might go up (40%), a lack of jobs where they live or in the type of work they want (39%)
• for part-time workers: the need for more training, education or work experience (40%), rent might go up (37%) or pay might be too low or their pension/benefit might be reduced (36%)
• for those not in the labour force (for example, those engaged in home duties and not looking for work): the desire or need to stay home to take care of children (76%), followed by the need for more training, education or work experience (58%). Just over half (51%) of respondents identified child care being too expensive or unavailable as a strong influence on their current employment situation.
Factors nominated by social housing tenants as having no influence on their current employment situation across the selected employment categories were:
• for the unemployed: child care is too expensive/unavailable (50%), followed by transport to work is too expensive/unavailable (49%)
• for part-time workers: child care is too expensive/unavailable (58%), followed by transport to work is too expensive/unavailable (52%)
• for those not in the labour force: transport to work is too expensive/unavailable (55%), followed by fear of having to leave their current housing (48%).
Concern that the rent charged might go up was listed as a strong influence by more than one-third of tenants across all social housing programs (between 37%–40%). However, almost equal proportions reported that rent going up had no influence on their current employment situation (between 31%–39%).
The results for ‘pay might be too low/benefits might be reduced’ were similar with between 36%–39% reporting that this was a ‘strong influence’ while between 35%–42% reported that this had ‘no influence’ on their current employment situation.
More than half of respondents nominated ‘other’ factors as influences on their current employment situation, however these most commonly aligned with those already listed on the questionnaire, for example, ‘unable to work due to illness’, ‘income would be too low’ or ‘child care difficulties’.
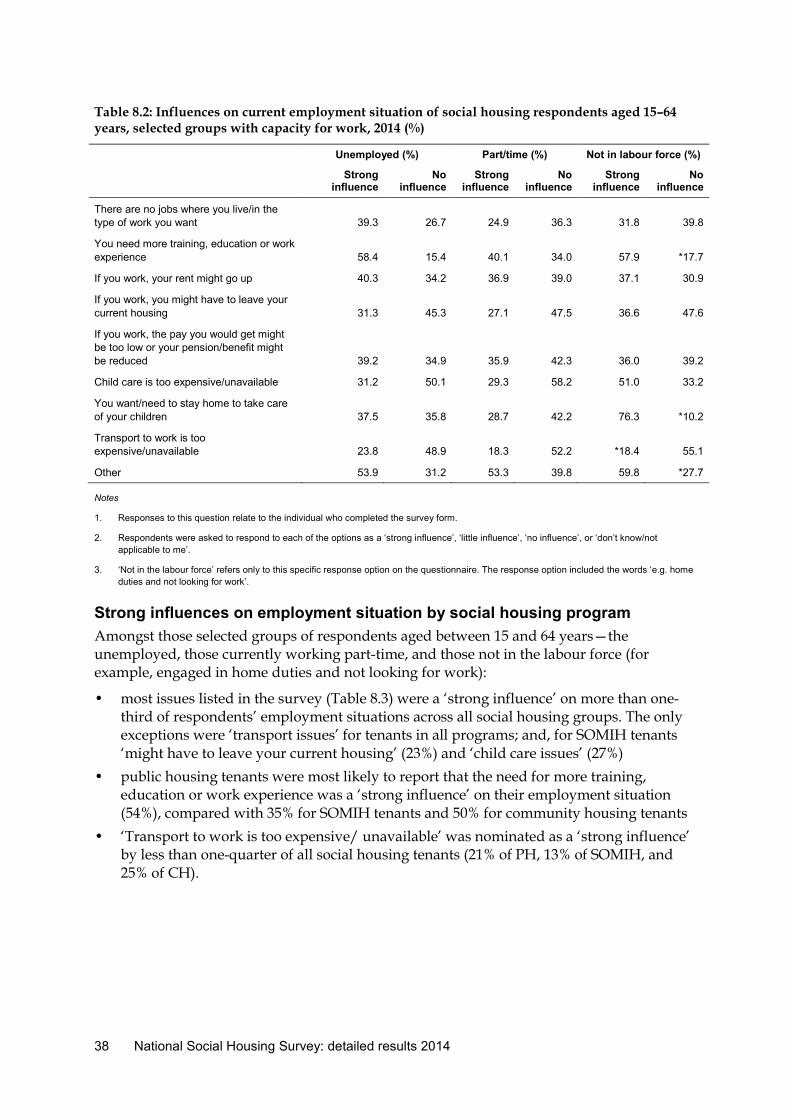
38 National Social Housing Survey: detailed results 2014
Table 8.2: Influences on current employment situation of social housing respondents aged 15–64 years, selected groups with capacity for work, 2014 (%)
Unemployed (%) Part/time (%) Not in labour force (%)
Strong
influence No
influence Strong
influence No
influence Strong
influence No
influence
There are no jobs where you live/in the type of work you want 39.3 26.7 24.9 36.3 31.8 39.8
You need more training, education or work experience 58.4 15.4 40.1 34.0 57.9 *17.7
If you work, your rent might go up 40.3 34.2 36.9 39.0 37.1 30.9
If you work, you might have to leave your current housing 31.3 45.3 27.1 47.5 36.6 47.6
If you work, the pay you would get might be too low or your pension/benefit might be reduced 39.2 34.9 35.9 42.3 36.0 39.2
Child care is too expensive/unavailable 31.2 50.1 29.3 58.2 51.0 33.2
You want/need to stay home to take care of your children 37.5 35.8 28.7 42.2 76.3 *10.2
Transport to work is too expensive/unavailable 23.8 48.9 18.3 52.2 *18.4 55.1
Other 53.9 31.2 53.3 39.8 59.8 *27.7
Notes
1. Responses to this question relate to the individual who completed the survey form.
2. Respondents were asked to respond to each of the options as a ‘strong influence’, ‘little influence’, ‘no influence’, or ‘don’t know/not applicable to me’.
3. ‘Not in the labour force’ refers only to this specific response option on the questionnaire. The response option included the words ‘e.g. home duties and not looking for work’.
Strong influences on employment situation by social housing program Amongst those selected groups of respondents aged between 15 and 64 years—the unemployed, those currently working part-time, and those not in the labour force (for example, engaged in home duties and not looking for work):
• most issues listed in the survey (Table 8.3) were a ‘strong influence’ on more than one-third of respondents’ employment situations across all social housing groups. The only exceptions were ‘transport issues’ for tenants in all programs; and, for SOMIH tenants ‘might have to leave your current housing’ (23%) and ‘child care issues’ (27%)
• public housing tenants were most likely to report that the need for more training, education or work experience was a ‘strong influence’ on their employment situation (54%), compared with 35% for SOMIH tenants and 50% for community housing tenants
• ‘Transport to work is too expensive/ unavailable’ was nominated as a ‘strong influence’ by less than one-quarter of all social housing tenants (21% of PH, 13% of SOMIH, and 25% of CH).

National Social Housing Survey: detailed results 2014 39
Table: 8.3: Strong influences on respondents aged 15–64 years, employment situations— selected groups(a) with capacity to work, by housing program type, 2014 (%)
Reasons
Public housing SOMIH Community housing
% of relevant groups who nominated factor as a strong influence
There are no jobs where you live/in the type of work you want 31.7 38.1 38.6
You need more training, education or work experience 53.5 35.0 50.3
If you work, your rent might go up 38.0 36.6 40.9
If you work, you might have to leave your current housing 30.7 22.6 30.4
If you work, the pay you would get might be too low or your pension/benefit might be reduced 37.8 36.3 36.5
Child care is too expensive/unavailable 35.2 26.9 33.9
You want/need to stay home to take care of your children 43.4 41.2 40.2
Transport to work is too expensive/unavailable 20.5 12.6 24.6
Other 57.2 *32.1 48.0
(a) Groups included are ‘unemployed’, part-time employment’ and ‘not in the labour force (e.g. home duties and not looking for work)’
Notes
1. Responses to this question relate to the individual who completed the survey form.
2. Only those who selected ‘strong influence’ were included.

40 National Social Housing Survey: detailed results 2014
1.9 Disability and the need for assistance
Key points • Across all social housing programs, around one-third of households included at least 1
member who ‘always’ or ‘sometimes’ requires assistance with self-care, body-movement or communication activities.
• Almost two-thirds of social housing households reported ‘disability’ as the reason for this need for assistance (with disability including health conditions lasting 6 months or more). This needs to be considered in the context of the age profile of social housing tenants which a high proportion aged over 65 years.
Need for assistance The 2014 NSHS gathered information about respondents’ and households’ need for assistance with self-care activities, body-movement activities and communication activities. The survey also asked about why this assistance was needed. This is the first time these questions have been included in the NSHS and have been used to derive a measure of the proportion of social housing households where there is a tenant with disability (Box 9.1).
Box 9.1: Measuring households with disability in social housing In order to derive a measure of households where there is a tenant with a disability, respondents were first asked to indicate if they or others in their household (including babies or young children) required assistance with: • self-care activities such as eating, showering, dressing or toileting • body-movement activities such as getting out of bed, moving around at home or at
places away from home • communication activities such as understanding or being understood by others (for
example poor hearing or poor English). Secondly, respondents were asked to indicate why that assistance was needed: • short-term health condition (lasting less than 6 months) • long-term health condition (lasting more than 6 months) • disability (lasting 6 months or more) • old or young age • difficulty with the English language • other reasons. Those households with at least 1 member that required assistance because of a ‘long-term health condition’ or ‘disability’ were defined as a ‘household with disability’.

National Social Housing Survey: detailed results 2014 41
Across all social housing programs around one-third of households included at least 1 person who ‘always’ or ‘sometimes’ needed assistance with self-care activities, body-movement activities or communication activities (Table 9.1):
• Almost one-third (30%) of households had at least 1 member who needed assistance with self-care activities ‘always’ (15%) or ‘sometimes’ (15%).
• A similar proportion of households (31%) had at least 1 member who needed assistance with body movement activities ‘always’ (13%) or ‘sometimes’ (18%).
• Slightly fewer households (28%) had at least 1 member who needed assistance with communication activities ‘always’ (13%) or ‘sometimes’ (15%).
These proportions should be considered in the context of the proportion of respondents who are aged over 65 years (43% for PH, 15% for SOMIH, and 41% for CH) and are likely to have aged-related difficulties with movement and self-care.
Table 9.1: Households with a need for assistance, 2014 (%)
Assistance needed with Always
(%) Sometimes
(%) Never
(%)
Self-care 15.4 15.1 69.5
Body movement activities 13.4 18.2 68.4
Communication activities 13.0 15.2 71.7
Note: Responses to this question were answered by the respondent on behalf of the
household.
Disability Across all social housing programs, almost two-thirds of households reported disability (which includes a long-term health condition lasting 6 months or more) as the main reason for needing assistance (64% for PH, 65% for SOMIH and 61% for CH) (Table 9.2).
Less common reasons for needing assistance reported by households included:
• old or young age (27% of PH, 33% of SOMIH and 22% of CH) • difficulty with the English language (16% of PH, 2% of SOMIH and 15% for CH) • short-term health condition (lasting less than 6 months) (4% for PH, 3% for SOMIH and
6% for CH).

42 National Social Housing Survey: detailed results 2014
Table 9.2: Reasons assistance needed, by housing program type, 2014 (%)
Reason
Public housing
(%) SOMIH
(%)
Community housing
(%)
Disability (including long-term health condition) 64.2 64.5 61.3
Short-term health condition (lasting less than 6 months) 4.3 *3.4 5.5
Old or young age 26.6 32.6 22.1
Difficulty with the English language 15.9 *1.9 14.8
Other cause 6.7 *3.2 7.1
Notes
1. The ‘need for assistance’ is defined as those who responded ‘Yes, always’ or ‘Yes, sometimes’ when asked if members of their household need help with self-care activities, body movement activities, or communication activities.
2. Respondents can choose more than 1 reason.
Importantly, the majority of households across all social housing programs with a disability indicated that ‘modifications for special needs’ were important to them and that this need had generally been met (Table 9.3). • Satisfaction with modifications for special needs was highest in community housing,
regardless of the type of assistance required. • Satisfaction with modifications for special needs was lowest in SOMIH, however more
than half of SOMIH households were satisfied that their needs had been met.
Table 9.3: Households with disability, satisfaction with modifications for special needs, by housing program type, 2014 (%)
Assistance with Needs met for public
housing households (%) Needs met for SOMIH
households (%) Needs met for community
housing households (%)
Self-care 71.1 50.6 76.6
Body movement 70.6 52.6 74.4
Communication 76.5 53.3 79.9
Notes
1. The ‘need for assistance’ is defined as those who responded ‘Yes, always’ or ‘Yes, sometimes’ when asked if members of their household need help with self-care activities, body-movement activities, or communication activities.
2. Only includes households where there was a need for assistance because of ‘disability’ or ‘long-term health condition’ lasting 6 months or more.
3. Includes those households who indicated 'modifications for special needs' was important.

National Social Housing Survey: detailed results 2014 43
1.10 Use of support services
Key points • Tenants across all social housing programs used health and medical services most
frequently, followed by mental health services. • Community housing tenants accessed community or health services most frequently. • Social housing tenants most commonly accessed these services without the assistance of
their housing provider.
Assistance for social housing tenants Social housing and financial housing assistance are not the only types of assistance that governments provide to people facing housing difficulties. A range of other services are offered—where for example, people may be:
• living on very low incomes • experiencing domestic violence or conflict with neighbours • struggling with a health issue. Governments provide a range of health and welfare services that social housing tenants may access, including financial counselling, mental health support workers, domestic violence services, mediation services and alcohol and other drug treatment services. Social housing tenants were asked about their, or anyone in their households, use of various health and community services in the 12 months leading up to the survey. Of primary interest was whether these services were accessed with or without their housing provider’s assistance.
Household need for, and use of, other community and health services Across all social housing programs, the most frequently used services were (Table 10.1):
• health and medical services (65% for PH, 80% for SOMIH and 64% for CH) • mental health services (19% for PH, 13% for SOMIH, and 20% for CH). The large proportion of respondents accessing health and medical services in the past 12 months is not surprising considering that 42% of respondents were over 65, and is also consistent with the high proportion of respondents who indicated limitations in body-movement and self-care.
More than one-quarter of public housing (28%) and community housing (28%) tenants had not used any of the services listed, but this proportion was much lower in SOMIH (14%).
Overall, a larger proportion of social housing tenants accessed support services in 2014 compared with 2012. This increase was largest in SOMIH and particularly notable with respect to the use of health/medical services (54% accessed health/medical services in 2012, increasing to 80% in 2014).
It is important to note that the change to face-to-face methodology for 2 of the SOMIH jurisdictions in 2014 may have contributed to this finding. More responses are likely to be elicited from face-to-face interviews than from those who are filling in a form without the benefit of interpretation and clarification.

44 National Social Housing Survey: detailed results 2014
Table 10.1: Proportion of households accessing community and health services in the past 12 months, by housing program type, 2014 (%)
Public housing
(%) SOMIH (%) Community housing (%) All (%)
Community and health services Access service
Housing provider assisted
Access service
Housing provider assisted
Access service
Housing provider assisted
Access service
Housing provider assisted
Drugs and alcohol counselling 4.2 15.1 4.4 *8.6 5.2 21.5 4.4 16.1
Mental health services 19.0 7.8 13.0 *3.5 20.4 10.3 19.0 8.1
Health/medical services 65.0 5.1 79.6 1.4 64.4 6.1 65.3 5.1
Life skills/ personal development services 5.9 10.4 4.1 *5.6 8.7 15.7 6.3 11.4
Aged care 8.4 15.7 6.0 15.8 8.2 21.6 8.3 16.6
Information, advice and referral services 12.2 15.0 5.6 *8.6 15.2 19.4 12.4 15.7
Day-to-day living support services 10.0 14.2 8.4 *5.1 12.6 19.2 10.4 14.9
Residential care and supported accommodation services
2.7 33.9 2.7 *15.0 7.2 40.2 3.4 35.5
Services that provide support for children, family or carers
6.9 14.2 8.0 *11.0 6.3 20.6 6.8 15.0
Training and employment support services 8.5 6.5 13.0 *3.3 9.4 14.2 8.8 7.6
Financial and material assistance 7.7 16.7 6.3 *7.4 9.3 23.3 7.9 17.7
Other support services 8.3 14.6 7.9 *4.6 9.4 16.8 8.4 14.7
None of the above 27.9 .. 14.2 .. 27.5 .. 27.5 ..
Notes
1. Responses to this question relate to the person in the household who completed the survey form.
2. The category 'mental health services' includes the following services which were listed separately in the 2012 NSHS: 'Psychological services', 'Psychiatric services' and 'Mental health services'.
3. Respondents could select more than 1 option.

National Social Housing Survey: detailed results 2014 45
Housing provider assistance in obtaining services Tenants who had accessed community and health services in the 12 months leading up to the survey were asked if they had accessed this service with assistance from their housing provider.
• Overall, community housing tenants were more likely than either public housing or SOMIH tenants to receive assistance from their housing provider in accessing services (Table 10.1).
• Tenants were most likely to receive assistance from their housing provider to access alternative housing arrangements—residential care and supported accommodation services (34%for PH, 15% for SOMIH and 40% for CH)—but this was 1 of the less frequently accessed services.
• Overall, social housing tenants were most likely to access services ‘without’ the assistance of their housing provider.
46 National Social Housing Survey: detailed results 2014
Section 2: Geographic and demographic breakdowns
2.1 Tenant satisfaction
Satisfaction, by state and territory Nationally around three-quarters of public housing tenants (73%) are satisfied with the overall services received from their housing provider (up from 65% in 2012), as are 80% of community housing tenants (up from 74% in 2012).
Similar to 2012, social housing tenants in Queensland reported amongst the highest levels of satisfaction with the overall services received from their housing provider (Figure 11.1).
Compared to the national average (73% for PH and 80% for CH), satisfaction of respondents was higher for:
• public housing tenants in Queensland (84%), Victoria (76%), South Australia (76%) and the Australian Capital Territory (76%)
• community housing tenants in Queensland (83%), Western Australia (83%) and South Australia (83%).
Compared to the national average, satisfaction was lower for:
• public housing tenants in New South Wales (65%, although this was an increase from 56% in 2012) and the Northern Territory (72%)
• community housing tenants in New South Wales (79%), Victoria (77%), Tasmania (76%) and the Australian Capital Territory (69%).
The national average for SOMIH tenants has remained stable: 59% in 2012 and 58% in 2014. It is important to note the impact that the change in methodology in 2014 for SOMIH tenants may have had on the results.
• In South Australia and Tasmania, where the survey methodology remained consistent, satisfaction rates rose from 59% to 66% in South Australia and from 53% to 62% in Tasmania.
• In New South Wales and Queensland, where the survey methodology changed, satisfaction remained consistent for New South Wales at 49% and decreased for Queensland from 71% to 67%.

National Social Housing Survey: detailed results 2014 47
Notes
1. Responses to this question relate to the person in the household who completed the survey form.
2. ‘Satisfied’ includes those who reported being ‘satisfied’ or ‘very satisfied’.
Source: Supplementary table S11.1.
Figure 11.1: Proportion of tenants satisfied with services provided by their housing organisation, by state and territory, by housing program type, 2014 (%)
Public housing SOMIH Community housing
NT
ACT
Tas
SA
WA
Qld
Vic
NSW
All
Per cent
0 10 20 30 40 50 60 70 80 90 100
Jurisdiction

48 National Social Housing Survey: detailed results 2014
Satisfaction, by location (remoteness) Satisfaction rates increased from 2012 across all remoteness regions, for both public housing and community housing tenants. Satisfaction for SOMIH tenants increased from 2012 in Remote areas, but decreased across other remoteness regions.
Similar to 2012, the 2014 NSHS found that satisfaction with the services offered by a tenant’s housing provider differed across locations for the various social housing programs and increased for both SOMIH and community housing respondents as remoteness levels increased (Figure 11.2). Location of respondents was categorised by remoteness as per the Australian Statistical Geography Standard (ASGS).
Satisfaction was highest for:
• public housing tenants who lived in Outer regional areas (79%) • SOMIH tenants who lived in Remote areas (66%) • community housing tenants who lived in Outer regional (88%) and Remote (91%) areas. Satisfaction was lowest for:
• public housing tenants in Remote areas (68%) • SOMIH tenants in Major cities (54%) • community housing tenants in Inner regional areas (78%).
Notes
1. Responses to this question relate to the person in the household who completed the survey form.
2. ‘Satisfied’ includes those who reported being ‘satisfied’ or ‘very satisfied’.
3. 'Remote' includes 'remote' and 'very remote' classifications.
Source: Supplementary table S11.2.
Figure 11.2: Proportion of tenants satisfied with services provided by their housing organisation, by remoteness category, by housing program type, 2014 (%)
Public housing SOMIH Community housing
Remote
Outer regional
Inner regional
Major cities
All
Per cent
0 10 20 30 40 50 60 70 80 90 100
Remoteness

National Social Housing Survey: detailed results 2014 49
Satisfaction, by previous homelessness The proportion of tenants in 2014 that reported they had experienced homelessness at least once in the 5 years prior to the survey was:
• 12% for public housing tenants (up from 6% in 2010 and 9% in 2012) • 11% for SOMIH tenants (not surveyed in 2010, 12% in 2012) • 18% for community housing tenants (up from 12% in 2010 and down from 19% in 2012) Overall, satisfaction was higher among respondents who had not experienced homelessness in the 5 years prior to the survey compared with those who had, across the 3 social housing program types, although the difference was negligible for public housing (Figure 11.3).
• In 2014, tenants in community housing who have not been homeless in the 5 years prior to the survey were more likely to be satisfied with the services provided by their housing provider (81%) than those who have been homeless in the same period (71%).
• Tenants in SOMIH who have not been homeless in the 5 years prior to the survey were also more likely (59%) to be satisfied compared with those who have been homeless in the same period (55%).
• Regardless of prior experience of homelessness, the NSHS found that overall satisfaction was highest amongst community housing tenants and lowest amongst SOMIH tenants, a pattern which is consistent with that found in 2012.
Notes
1. Responses to this question relate to the person in the household who completed the survey form.
2. ‘Satisfied’ includes those who reported being ‘satisfied’ or ‘very satisfied’.
Source: Supplementary table S11.3.
Figure 11.3: Proportion of tenants satisfied with the services provided, by previous homelessness, by housing program type, 2014 (%)
Homeless in the last 5 years Have not been homeless in the last 5 years
Community housing
SOMIH
Public housing
All
Per cent
0 10 20 30 40 50 60 70 80 90 100
Housing program

50 National Social Housing Survey: detailed results 2014
Satisfaction, by dwelling condition As with 2012, the structural condition of a dwelling was a greater determinant of satisfaction amongst social housing tenants then was the standard of the facilities (See Box 6.1 for an outline of dwelling condition).
The 2014 NSHS results (Figure 11.4) highlight that satisfaction was:
• highest amongst tenants whose dwellings were of ‘an acceptable standard’ (34% very satisfied and 45% satisfied) and whose dwellings ‘were of an acceptable standard but their facilities were not’ (36% very satisfied and 43% satisfied)
• lower as the structural standard decreased, with almost half (46%) of tenants satisfied with the services provided by their housing provider with ‘acceptable facilities but unacceptable structure’ and 39% of tenants satisfied when their ‘dwelling was not of an acceptable standard’.
Note: Responses to this question relate to the person in the household who completed the survey form.
Source: Supplementary table S11.4.
Figure 11.4: Satisfaction with services provided by the housing organisation, by dwelling condition, 2014 (%)
Very satisfied Satisfied Neither satisfied nor dissatisfiedDissatisfied Very dissatisfied
Dwelling is not of anacceptable standard
Structure is of anacceptable standard but
facilities are not
Facilities are of anacceptable standard but
structure is not
Dwelling is ofacceptable standard
Per cent
0 10 20 30 40 50 60 70 80 90 100
Dwelling standard

National Social Housing Survey: detailed results 2014 51
Satisfaction, by dwelling utilisation Consistent with 2012, and across all social housing programs, surveyed tenants living in overcrowded dwellings were less likely to report being satisfied with the overall services provided by their housing provider than their counterparts in adequately occupied or underutilised dwellings (Figure 11.5).
• Tenants living in overcrowded dwellings (59%) are less likely to be satisfied with the services provided by their housing provider compared with tenants in ‘adequately’ (74%) or ‘underutilised’ (76%) dwellings.
• Satisfaction was higher for public housing (76%) and SOMIH (63%) tenants residing in underutilised dwellings as opposed to those occupying dwellings that were adequate in size for the household (73% and 57% respectively), while tenants in community housing were more likely to be satisfied in dwellings adequate in size for the household (80%) than in underutilised dwellings (79%); however the difference is not significant.
Notes
1. Responses to this question relate to the person in the household who completed the survey form.
2. ‘Satisfied’ includes those who reported being ‘satisfied’ or ‘very satisfied’.
Source: Supplementary table S11.5.
Figure 11.5: Proportion of tenants satisfied with services provided, by dwelling utilisation, by housing program type, 2014 (%)
OvercrowdedAdequateUnderutilised
0
10
20
30
40
50
60
70
80
90
100
All Public housing SOMIH Community housing
Per cent
Housing program

52 National Social Housing Survey: detailed results 2014
Satisfaction, by Indigenous status Satisfaction with services provided by the housing provider was higher than that found in 2012 for public housing and community housing for both Indigenous and non-Indigenous respondents. Satisfaction levels for SOMIH tenants were in line with those found in 2012. Consistent with 2012, satisfaction with services was higher among non-Indigenous respondents than Indigenous respondents across all social housing programs.
The 2014 NSHS found that (Figure 11.6):
• satisfaction was highest among community housing tenants regardless of Indigenous status (80% for Indigenous tenants and 74% for non-Indigenous tenants)
• satisfaction was lowest for SOMIH tenants. Indigenous respondents display higher levels of dissatisfaction with the services provided by their housing provider as they may have also experienced:
• a greater likelihood of living in dwellings with 3 or more structural problems • a greater likelihood of living in dwellings that are inappropriate for their households
needs (that is, their dwelling is either overcrowded or underutilised). It is important to use caution when comparing the public housing, SOMIH and community housing results. This is due to the different demographic profile of Aboriginal and Torres Strait Islander tenants (generally younger), and methodology differences in the data collection across housing programs (mail-out for public housing and community housing compared with a mixed methodology for SOMIH tenants).
Notes
1. Responses to this question refer to the person who completed the survey form.
2. ‘Satisfied’ includes those who reported being ‘satisfied’ or ‘very satisfied’.
Source: Supplementary table S11.6.
Figure 11.6: Proportion of tenants satisfied with services provided, by Indigenous status, by housing program type, 2014 (%)
Indigenous Non-Indigenous
Community housing
SOMIH
Public housing
All
Per cent
0 10 20 30 40 50 60 70 80 90 100
Housing program

National Social Housing Survey: detailed results 2014 53
Satisfaction, by need for assistance In the 2014 NSHS, respondents were asked to indicate if they or anyone in their household needed assistance with self-care activities, body movement activities, or communication activities.
Of those households with a need for assistance, satisfaction with the services provided by housing providers was generally high (Table 11.1):
• around two-thirds (66%) of public housing tenants were satisfied with the services provided by their housing providers (27% very satisfied and 40% satisfied)
• just over half (53%) of SOMIH tenants were satisfied with the services provided by their housing providers (16% very satisfied and 37% satisfied)
• three-quarters (75%) of community housing tenants were satisfied with the services provided by their housing providers (33% very satisfied and 41% satisfied).
Table 11.1: Proportion of tenants with a need for assistance satisfied with services provided by their housing organisation, by housing program type, 2014 (%)
Level of satisfaction Public housing
(%) SOMIH
(%)
Community housing
(%)
Very satisfied 26.6 16.2 33.4
Satisfied 39.8 36.8 41.4
Sub-total 66.4 53.0 74.8
Neither satisfied nor dissatisfied 14.7 17.0 10.8
Dissatisfied 10.6 14.2 8.1
Very dissatisfied 8.3 15.8 6.3
Notes
1. ‘Tenants with a need for assistance’ refers to any member of the household.
2. The ‘need for assistance’ is defined as those who responded ‘Yes, always’ or ‘Yes, sometimes’ when asked if members of their household need help with self-care activities, body-movement activities, or communication activities.
Demographic characteristics related to satisfaction with the housing provider • Overall, satisfaction with social housing increased with increasing age. Around 3 in 4
(79%) respondents aged 65 and over were satisfied with the services provided by their housing organisation.
• In general, men and women were equally satisfied with the services provided by their housing providers (72% of women, 75% of men).
• Those who were retired were the most likely to be satisfied with the services provided by their housing organisation (80%) while those engaged in part-time study were the least likely to be satisfied (64%).

54 National Social Housing Survey: detailed results 2014
2.2 Satisfaction with amenities
Satisfaction with amenities, by state and territory Across the states and territories, the majority of public housing tenants indicated that the listed amenities were important to their household (Table 12.1). The amenities rated highest in terms of importance for public housing tenants include:
• safety and security within the home (between 95% in the Northern Territory to 98% in New South Wales, Victoria, Queensland, South Australia, Tasmania and the Australian Capital Territory)
• energy efficiency (between 93% in the Northern Territory, to 97% in Victoria, Queensland, South Australia and the Australian Capital Territory)
• privacy of the home (between 92% in Tasmania and the Northern Territory and 97% in South Australia)
• safety and security outside of the home within the neighbourhood (between 94% in the Northern Territory to 96% for New South Wales, Victoria, Western Australia and the Australian Capital Territory)
• thermal comfort (between 89% in the Northern Territory and 98% in Victoria) • water efficiency (between 90% in the Northern Territory and 97% in South Australia). Selected amenities that were rated lower (although still high in terms of importance) were:
• modifications for special needs (between 73% in Western Australia and 81% in South Australia)
• size of home (between 75% in the Northern Territory and 84% in New South Wales, Victoria, Queensland, South Australia, and the Australian Capital Territory).

National Social Housing Survey: detailed results 2014 55
Table 12.1: Amenities rated as important to the household in public housing, by jurisdiction, 2014 (%)
Amenities NSW
(%) Vic (%)
Qld (%)
WA (%)
SA (%)
Tas (%)
ACT (%)
NT (%)
All (%)
Size of dwelling 83.8 83.6 83.7 #79.5 84.0 82.2 83.5 #75.4 83.2
Number of bedrooms 84.7 82.6 84.9 81.4 85.5 85.1 85.5 80.3 84.1
Modifications for special needs 75.6 78.0 75.9 72.6 #80.9 73.6 74.6 75.4 76.4
Ease of access and entry 89.1 91.3 89.2 #85.6 90.0 87.8 88.3 86.3 89.2
Car parking #80.1 87.0 87.8 86.5 86.9 #88.4 #88.4 82.9 84.8
Yard space and fencing #81.7 86.8 84.7 81.9 #90.2 87.0 86.3 86.2 84.7
Privacy of home 95.3 95.6 96.3 94.4 #97.0 #92.0 96.4 #92.3 95.5
Safety/security of home 97.7 98.0 97.5 96.8 98.3 97.9 98.3 #95.3 97.7
Safety/security outside of the home within the neighbourhood 96.0 95.8 94.9 95.5 95.2 93.5 96.0 94.5 95.6
Energy efficiency 96.1 96.9 96.9 95.7 97.0 95.0 97.4 #93.4 96.4
Water efficiency 94.2 94.4 94.7 94.7 #96.9 93.4 #91.9 #90.3 94.5
Thermal comfort #93.5 #98.2 94.7 93.1 95.9 96.6 #97.2 #88.8 95.1
Note: Responses to this question relate to the person in the household who completed the survey form.
Of those who rated amenities as ‘important’, more than three-quarters indicated that their households’ needs were met (Table 12.2). Compared with the national average:
• Queensland tenants reported higher levels of satisfaction with 6 of the listed amenities, including yard space and fencing; safety and security (inside the home and within the neighbourhood); energy efficiency; water efficiency; and thermal comfort.
• New South Wales and Australian Capital Territory public housing tenants reported lower levels of satisfaction with yard space and fencing and with safety and security of the home.
• Australian Capital Territory tenants in particular gave a lower satisfaction rating to energy efficiency, water efficiency and thermal comfort.

56 National Social Housing Survey: detailed results 2014
Table 12.2: Amenities rated as meeting the needs of the household in public housing, by jurisdiction, 2014 (%)
Amenities NSW
(%) Vic (%)
Qld (%)
WA (%)
SA (%)
Tas (%)
ACT (%)
NT (%)
All (%)
Size of dwelling 86.4 #80.9 87.0 84.9 #88.8 84.3 82.0 84.9 85.3
Number of bedrooms 86.9 #81.8 89.2 86.8 89.2 86.6 82.6 84.1 86.3
Modifications for special needs #74.7 78.2 84.7 #86.2 #85.3 82.7 77.9 74.0 79.8
Ease of access and entry #87.9 90.1 89.9 #94.4 #94.7 #93.3 90.8 91.0 90.4
Car parking 82.0 80.9 82.8 85.1 #90.3 #88.4 81.6 85.6 83.5
Yard space and fencing #79.1 80.4 #89.1 #88.4 85.9 84.3 #75.8 83.9 82.9
Privacy of home 83.6 84.7 86.5 85.6 84.0 85.4 80.9 80.8 84.5
Safety/security of home #78.0 82.3 #90.0 82.2 84.5 81.0 #77.9 81.3 82.1
Safety/security outside of the home within the neighbourhood #75.2 77.2 #86.6 79.0 80.0 81.9 77.3 76.5 78.6
Energy efficiency 77.3 74.3 #80.7 80.1 73.6 74.2 #67.4 79.1 76.6
Water efficiency #83.7 87.4 #93.5 #81.6 84.3 84.9 #79.8 85.6 85.7
Thermal comfort 61.5 60.7 #67.6 #67.2 61.2 60.7 #53.4 #67.9 62.6
Notes
1. The proportion of households rating the particular amenity as meeting the needs of the household is based on the households that indicated
that the particular amenity was important to that household.
2. Responses to this question relate to the person in the household who completed the survey form.

National Social Housing Survey: detailed results 2014 57
In general, SOMIH tenants rated the importance of amenities more highly compared with other social housing tenants (Table 12.3). It is important to note that the 2 jurisdictions whose tenants were surveyed via face-to-face interview (New South Wales and Queensland) gave higher ratings for the importance of all amenities than did tenants in the 2 jurisdictions (South Australia and Tasmania) using a mail-out-survey (apart from modifications for special needs, which was significantly lower in Queensland). It is likely that the difference in methodology has contributed to this finding.
The amenities rated highest in terms of importance for SOMIH tenants include:
• thermal comfort (between 94% in Tasmania and 100% in New South Wales and Queensland)
• safety and security within the home (between 95% in Tasmania and 100% in New South Wales and Queensland)
• safety and security outside of the home within the neighbourhood (between 90% in Tasmania and 100% in New South Wales and Queensland)
• energy efficiency (between 95% in Tasmania and 100% in Queensland) • privacy of the home (between 87% in Tasmania and 100% in New South Wales and
Queensland) • water efficiency (between 94% in Tasmania and 98% in Queensland). Selected amenities that were rated lower (although still high in terms of importance) were:
• size of the dwelling (between 84% in South Australia and Tasmania and 92% in New South Wales)
• modifications for special needs (between 48% in Queensland and 79% in New South Wales).

58 National Social Housing Survey: detailed results 2014
Table 12.3: Amenities rated important to the household in SOMIH, by jurisdiction, 2014 (%)
Amenities NSW (%)
Qld (%)
SA (%)
Tas (%) All (%)
Size of dwelling 91.5 91.3 #84.0 84.2 90.0
Number of bedrooms 91.6 #94.7 88.2 93.3 92.2
Modifications for special needs #78.9 #47.7 68.9 65.9 64.6
Ease of access and entry #98.2 96.6 #85.4 90.7 95.3
Car parking 92.1 #95.1 #83.6 87.2 91.5
Yard space and fencing #98.2 #98.2 #90.7 90.0 96.6
Privacy of home #99.6 #99.6 #94.3 #88.6 98.4
Safety/security of home #99.8 #99.8 #96.5 94.9 99.1
Safety/security outside of the home within the neighbourhood #99.6 #99.8 #94.9 #90.0 98.6
Energy efficiency 98.8 #99.6 #96.1 95.0 98.5
Water efficiency 97.3 97.6 97.3 93.7 97.3
Thermal comfort #100.0 #99.8 #97.0 #93.6 99.2
Note: Responses to this question relate to the person in the household who completed the survey form.

National Social Housing Survey: detailed results 2014 59
Overall, around 70% or more of SOMIH tenants indicated that selected amenities were important to their household and that their households’ needs were met (Table 12.4). Compared with the national average:
• SOMIH tenants in Queensland were more likely to rate safety and security (inside the home and within the neighbourhood) and water efficiency both as important and meeting the needs of their household
• SOMIH tenants in Tasmania were more likely to rate the number of bedrooms as meeting their needs
• thermal comfort was the amenity rated the lowest, with around half or more of tenants rating this feature both as important and as meeting the needs of their household.
Table 12.4: Amenities rated as meeting the needs of the household in SOMIH, by jurisdiction, 2014 (%)
Amenities NSW (%)
Qld (%)
SA (%)
Tas (%)
All (%)
Size of dwelling 78.6 80.6 82.2 87.1 80.0
Number of bedrooms 75.5 80.8 84.4 #89.2 79.1
Modifications for special needs 53.7 69.9 70.2 61.5 61.7
Ease of access and entry 86.0 91.2 89.0 85.9 88.2
Car parking 85.6 90.0 87.1 93.7 87.6
Yard space and fencing 72.6 77.5 78.7 77.9 75.3
Privacy of home 82.5 83.9 80.5 85.0 82.7
Safety/security of home 75.5 #86.7 #72.6 80.0 78.9
Safety/security outside of the home within the neighbourhood 73.1 #83.2 77.9 85.3 77.6
Energy efficiency 72.0 77.2 #66.2 73.2 72.9
Water efficiency 77.6 #86.2 75.1 82.0 80.2
Thermal comfort 59.8 63.5 #50.2 55.1 59.5
Notes
1. The proportion of households rating the particular amenity as meeting the needs of the household is based on
the households that indicated that the particular amenity was important to that household.
2. Responses to this question relate to the person in the household who completed the survey form.

60 National Social Housing Survey: detailed results 2014
In general, across the states and territories, there was more variability in the way community housing tenants rated the importance of amenities, compared with ratings given by both public housing and SOMIH tenants (Table 12.5). Selected amenities were rated highest in terms of importance to the household by community housing tenants for:
• safety and security within the home (98% for PH, 99% for SOMIH and 98% for CH) • energy efficiency (96% for PH, 99% for SOMIH and 96% for CH) • privacy of the home (96% for PH, 98% for SOMIH and 96% for CH) • safety and security outside of the home within the neighbourhood (96% for PH, 99% for
SOMIH and 95% for CH) • thermal comfort (95% for PH, 99% for SOMIH and 94% for CH) • water efficiency (95% for PH, 97% for SOMIH and 94% for CH). Selected amenities that were rated lower (although still high in terms of importance) were:
• size of the dwelling in Western Australia (73%) • modifications for special needs in South Australia (62%).
Table 12.5: Amenities rated as important to the household in community housing, by jurisdiction, 2014 (%)
Amenities NSW (%)
Vic (%)
Qld (%)
WA (%)
SA (%)
Tas (%)
ACT (%)
All (%)
Size of dwelling #85.1 81.4 79.3 #72.9 82.4 #76.3 83.7 81.7
Number of bedrooms #85.3 80.5 #76.0 #76.8 85.6 78.2 83.1 81.9
Modifications for special needs 75.0 67.0 73.6 78.7 #62.2 75.3 74.0 73.2
Ease of access and entry 89.2 92.0 89.9 89.0 #83.8 89.6 90.2 89.3
Car parking 82.1 #88.8 83.9 #90.2 85.8 84.8 82.1 84.7
Yard space and fencing 80.6 84.4 75.5 78.9 84.1 81.2 87.0 80.5
Privacy of home 96.2 96.6 96.1 94.5 95.5 94.2 95.7 95.9
Safety/security of home 97.4 98.3 97.8 96.6 97.6 98.6 99.1 97.6
Safety/security outside of the home within the neighbourhood
95.3 95.3 93.7 93.8 95.5 96.1 96.5 94.9
Energy efficiency 96.1 #98.0 95.2 93.9 95.3 96.7 94.8 95.9
Water efficiency 94.6 94.7 94.0 91.0 96.1 90.6 95.4 94.1
Thermal comfort 95.0 95.8 #91.0 94.8 94.9 95.0 97.4 94.4
Note: Responses to this question relate to the person in the household who completed the survey form.

National Social Housing Survey: detailed results 2014 61
In general, two-thirds or more of community housing tenants rated selected amenities both as important and as meeting the needs of their household (Table 12.6).
• Compared with the national average, community housing tenants in Western Australia reported higher levels of satisfaction with 6 of the listed amenities including car parking; yard space and fencing; privacy of the home; safety and security of the home; energy efficiency; and thermal comfort.
• Community housing tenants in Queensland reported the highest level of satisfaction with thermal comfort, followed by community housing tenants in Western Australia, with ratings being significantly higher than the national average.
Table 12.6: Amenities rated as meeting the needs of the household in community housing, by jurisdiction, 2014 (%)
Amenities NSW (%)
Vic (%)
Qld (%)
WA (%)
SA (%)
Tas (%)
ACT (%)
All (%)
Size of dwelling 88.5 85.7 85.5 86.2 90.5 86.4 88.6 87.5
Number of bedrooms 89.1 85.7 84.8 85.7 #91.6 84.6 89.1 87.7
Modifications for special needs 78.2 83.3 #87.8 84.9 82.1 74.1 75.9 81.3
Ease of access and entry 89.7 #94.5 91.5 93.3 92.8 87.7 87.6 91.2
Car parking 80.0 86.9 79.0 #88.5 #90.6 85.2 78.6 82.9
Yard space and fencing 84.3 84.0 83.0 #89.1 87.7 82.3 83.9 84.8
Privacy of home 87.2 85.4 85.5 #91.0 #91.4 82.4 83.0 87.2
Safety/security of home 85.1 84.7 89.1 #90.3 87.0 83.0 80.8 86.4
Safety/security outside of the home within the neighbourhood 80.2 83.6 #87.1 84.1 83.7 79.0 #70.8 82.4
Energy efficiency 78.8 #72.7 82.5 #84.1 74.1 #70.7 76.3 78.5
Water efficiency 85.8 86.6 #93.6 86.6 85.7 #78.8 84.6 87.1
Thermal comfort 66.5 #62.1 #75.8 #73.5 62.5 64.6 65.2 67.9
Notes
1. The proportion of households rating the particular amenity as meeting the needs of the household is based on the households that
indicated that the particular amenity was important to that household.
2. Responses to this question relate to the person in the household who completed the survey form.

62 National Social Housing Survey: detailed results 2014
Satisfaction with amenities, by location (remoteness) Amenities most commonly rated as important and meeting the needs of the household differed across location (in terms of remoteness) for the various social housing programs (tables 12.7 and 12.8). In most cases, satisfaction with amenities—in terms of needs being met—was the highest in Outer regional areas, with community housing highest in Remote areas.
For public housing tenants:
• the amenities most commonly rated as important to the household were: – safety and security within the home for Major cities, Inner regional areas and Outer
regional areas – safety and security within the home and energy efficiency for Remote areas
• the amenities most commonly rated both as important and as meeting the needs of the household were: – ease of access and entry, number of bedrooms and water efficiency for Major cities – ease of access and entry and number of bedrooms for Inner regional areas – size of dwelling, ease of access and entry and water efficiency for Outer regional areas – ease of access and entry and car parking for Remote areas
• the amenities least likely to be rated both as important and as meeting the needs of the household were: – safety and security outside of the home within the neighbourhood and energy
efficiency for Major cities, Inner regional, Outer regional and Remote areas – modifications for special needs for Remote areas.
For SOMIH tenants:
• the amenities most commonly rated as important to the household were: – safety and security within the home and thermal comfort for Major cities – safety and security within the home, safety and security outside of the home within
the neighbourhood and thermal comfort for Inner regional areas – safety and security within the home, safety and security outside of the home within
the neighbourhood, energy efficiency and thermal comfort for Outer regional areas – thermal comfort for Remote areas
• the amenities most commonly rated both as important and meeting the needs of the household were: – ease of access and entry and car parking for Major cities, Inner regional, outer regional
and Remote areas • the amenities least likely to be rated both as important and as meeting the needs of the
household were: – modifications for special needs and safety and security outside of the home within
the neighbourhood for Major cities – modifications for special needs and energy efficiency for Inner regional and Remote
areas – modifications for special needs and yard space and fencing for Outer regional areas.

National Social Housing Survey: detailed results 2014 63
For community housing tenants:
• the amenities most commonly rated as important to the household were: – safety and security within the home for Major cities and Outer regional areas – safety and security within the home and energy efficiency for Inner regional areas – water efficiency for Remote areas
• the amenities most commonly rated both as important and as meeting the needs of the household were: – ease of access and entry and privacy of home for Major cities – ease of access and entry and number of bedrooms for Inner regional areas – size of dwelling and ease of access and entry for Outer regional areas – privacy of home and size of dwelling for Remote areas
• the amenities least likely to be rated both as important and as meeting the needs of the household were: – energy efficiency and safety and security outside of the home within the
neighbourhood for Major cities – energy efficiency and modifications for special needs for Inner regional and Outer
regional areas – car parking and modifications for special needs for Remote areas.

64 National Social Housing Survey: detailed results 2014
Table 12.7: Amenities rated as important to the household, by location (remoteness), by housing program type, 2014 (%)
Public housing (%) SOMIH (%) Community housing (%)
Amenities Major cities
Inner regional
Outer regional Remote All
Major cities
Inner regional
Outer regional Remote All
Major cities
Inner regional
Outer regional Remote All
Size of dwelling 84.4 81.7 #78.3 #76.1 83.2 87.8 89.9 92.2 91.7 90.0 #84.7 80.9 #74.7 #56.7 81.7
Number of bedrooms 84.6 82.8 83.7 79.6 84.1 92.1 91.9 93.1 91.4 92.2 84.2 80.1 79.9 #62.6 81.9
Modifications for special needs 76.8 76.2 74.9 73.0 76.4 68.0 70.8 64.0 #49.6 64.6 72.7 74.0 74.5 71.0 73.2
Ease of access and entry 89.3 89.8 88.6 85.0 89.2 93.5 96.3 96.8 95.3 95.3 89.6 88.5 92.6 81.2 89.3
Car parking 84.0 #87.7 84.8 83.3 84.8 #86.0 93.3 #95.5 93.9 91.5 83.4 86.3 86.3 85.3 84.7
Yard space and fencing 83.5 86.9 #88.7 84.5 84.7 95.4 96.7 #98.4 96.4 96.6 80.1 82.6 79.0 72.0 80.5
Privacy of home 95.8 95.4 95.1 #88.4 95.5 98.0 97.8 99.0 99.0 98.4 96.6 95.4 95.2 90.3 95.9
Safety/security of home 97.9 97.7 97.7 #93.9 97.7 98.8 99.4 99.6 98.5 99.1 98.1 96.9 98.4 92.1 97.6
Safety/security outside of the home within the neighbourhood
95.8 95.2 95.3 #90.9 95.6 97.7 98.8 #99.6 98.4 98.6 95.4 95.2 94.4 84.8 94.9
Energy efficiency 96.4 96.4 96.8 94.3 96.4 97.9 97.8 #99.7 99.0 98.5 95.9 97.0 95.3 88.0 95.9
Water efficiency 94.2 95.3 95.3 93.4 94.5 98.0 96.2 #99.2 95.0 97.3 94.6 94.1 91.2 94.6 94.1
Thermal comfort 94.8 95.7 95.9 93.0 95.1 98.9 99.2 99.6 99.5 99.2 94.7 94.6 93.0 91.0 94.4
Notes
1. Responses to this question relate to the person in the household who completed the survey form.
2. 'Remote' includes 'remote' and 'very remote' classifications.

National Social Housing Survey: detailed results 2014 65
Table 12.8: Amenities rated as meeting the needs of the household, by location (remoteness), by housing program type, 2014 (%)
Public housing (%) SOMIH (%) Community housing (%)
Amenities Major cities
Inner regional
Outer regional Remote All
Major cities
Inner regional
Outer regional Remote All
Major cities
Inner regional
Outer regional Remote All
Size of dwelling 84.2 86.9 #91.0 84.1 85.3 80.6 81.9 77.9 78.9 80.0 85.5 88.8 #92.9 #98.8 87.5
Number of bedrooms 85.2 #89.0 #89.9 84.0 86.3 77.6 80.6 80.4 77.3 79.1 86.6 89.1 88.7 #94.7 87.7
Modifications for special needs 78.8 81.2 84.7 76.3 79.8 60.7 53.2 69.0 67.3 61.7 80.1 81.3 84.4 #92.7 81.3
Ease of access and entry 90.2 91.1 90.9 89.9 90.4 90.0 87.0 89.0 85.3 88.2 90.3 92.3 92.4 93.5 91.2
Car parking 82.6 84.2 87.5 87.1 83.5 84.0 90.9 90.4 84.2 87.6 80.0 84.7 89.8# 89.8 82.9
Yard space and fencing 82.2 83.3 #86.8 81.3 82.9 77.5 73.1 74.1 76.8 75.3 82.6 86.8 87.9 #94.0 84.8
Privacy of home 83.5 #86.9 87.4 80.2 84.5 80.5 84.1 84.0 83.1 82.7 87.1 86.2 86.9 #99.4 87.2
Safety/security of home 81.4 82.2 #86.9 80.3 82.1 76.6 82.7 78.4 77.8 78.9 84.4 88.0 90.1 #94.8 86.4
Safety/security outside of the home within the neighbourhood
77.9 79.0 #83.7 77.0 78.6 75.4 79.4 75.6 82.0 77.6 #79.6 84.0 #89.7 #95.5 82.4
Energy efficiency 76.6 75.3 79.7 76.8 76.6 75.6 69.2 75.2 70.3 72.9 77.4 77.9 82.7 #93.0 78.5
Water efficiency 85.2 85.5 #90.9 82.8 85.7 81.0 77.6 83.2 78.5 80.2 85.4 88.0 #91.9 #95.0 87.1
Thermal comfort 83.1 85.2 #89.1 82.2 84.1 79.8 76.4 83.1 73.1 78.7 83.1 85.6 #90.6 #93.2 84.9
Notes
1. The proportion of households rating the particular amenity as meeting the needs of the household is based on the households that indicated that the particular amenity was important to that household.
2. Responses to this question relate to the person in the household who completed the survey form.
3. 'Remote' includes 'remote' and 'very remote' classifications.

66 National Social Housing Survey: detailed results 2014
Satisfaction with amenities, by Indigenous status Safety and security within the home was the amenity that the majority of respondents (across most housing programs and irrespective of Indigenous status) rated most highly as important to their household (Table 12.9). In comparison, accessibility to their property, in terms of easy access and entry, was the amenity most likely to be rated as meeting the needs of the household (across all housing programs and by Indigenous status (Table 12.10).
Indigenous tenants surveyed in the NSHS were less likely than non-Indigenous tenants to rate amenities as both important and meeting the needs of the household and this was consistent for most amenities and across both public and community housing. The exception was for SOMIH, where Indigenous tenants were more likely to rate amenities—such as the size of the home and its energy efficiency—as both important and meeting the needs of their household.
For Indigenous public housing tenants:
• the amenities most commonly rated as important to the household were safety/security of the home (95%); energy efficiency (95%); and water efficiency (92%)
• the amenities least commonly rated as important were modifications for special needs (69%); size of dwelling (80%); and car parking (83%)
• the amenities most commonly rated both as important and as meeting the needs of the household were easy access and entry (85%); water efficiency (81%); and car parking (81%)
• the amenities least commonly rated both as important and as meeting the needs of the household were thermal comfort (56%) and modifications for special needs (66%).
For Indigenous SOMIH tenants:
• the amenities most commonly rated as important to the household were thermal comfort (99%); safety/security of the home (99%); safety/security outside of the home within the neighbourhood (99%); and energy efficiency (99%)
• the amenities least commonly rated as important were modifications for special needs (64%); size of dwelling (90%); number of bedrooms (92%); and car parking (92%)
• the amenities most commonly rated both as important and as meeting the needs of the household were easy access and entry (88%); car parking (87%); and privacy of the home (83%)
• the amenities least commonly rated both as important and as meeting the needs of the household were thermal comfort (61%) and modifications for special needs (61%).
For Indigenous tenants of community housing:
• the amenities most commonly rated as important to the household were safety/security of the home (97%); energy efficiency (96%); water efficiency (96%); and safety/security outside of the home within the neighbourhood (96%)
• the amenities least commonly rated as important to the household were modifications for special needs (70%); size of the dwelling (82%); and yard space and fencing (84%)
• the amenities most commonly rated both as important and as meeting the needs of the household were easy access and entry (88%); safety and security of the home (85%); and water efficiency (83%)

National Social Housing Survey: detailed results 2014 67
• the amenities least commonly rated both as important and as meeting the needs of the household were thermal comfort (68%) and yard space and fencing (71%).
Table 12.9: Amenities rated by tenants as important to the household, by Indigenous status, by housing program type, 2014 (%)
Public housing (%) SOMIH (%) Community housing (%)
Amenities Indigenous Non-
Indigenous Indigenous Non-
Indigenous Indigenous Non-
Indigenous
Size of dwelling 79.9 83.2 90.2 89.7 82.4 82.6
Number of bedrooms 84.2 83.8 91.7 96.7 84.7 81.0
Modifications for special needs 68.7 76.3 64.2 68.6 70.3 72.8
Ease of access and entry 83.4 89.5 95.5 92.8 85.7 89.5
Car parking 82.5 85.4 91.7 92.6 86.9 83.7
Yard space and fencing 84.0 84.3 96.4 98.8 84.0 79.4
Privacy of home 90.6 96.2 98.3 99.3 94.3 96.3
Safety/security of home 94.6 98.1 99.1 99.3 97.3 98.0
Safety/security outside of the home within the neighbourhood 90.1 96.2 98.6 98.6 96.0 95.8
Energy efficiency 94.6 97.0 98.5 98.3 96.4 96.4
Water efficiency 91.9 94.9 97.4 97.2 96.2 94.2
Thermal comfort 91.3 96.0 99.2 100.0 95.0 95.0
Note: Responses to this question relate to the person in the household who completed the survey form.
Table 12.10: Amenities rated by tenants as meeting the needs of the household, by Indigenous status, by housing program type, 2014 (%)
Public housing (%) SOMIH (%) Community housing (%)
Amenities Indigenous Non-
Indigenous Indigenous Non-
Indigenous Indigenous Non-
Indigenous
Size of dwelling 76.4 85.7 80.6 76.2 81.5 88.0
Number of bedrooms 79.9 86.7 80.1 70.4 82.7 88.3
Modifications for special needs 65.5 80.7 61.2 69.8 74.6 82.8
Ease of access and entry 84.6 91.0 87.6 93.0 88.0 92.1
Car parking 80.5 84.0 87.3 89.9 76.6 82.6
Yard space and fencing 79.7 83.1 74.8 79.3 70.5 86.2
Privacy of home 78.0 85.1 82.7 82.2 79.3 88.3
Safety/security of home 76.5 82.1 78.9 79.1 85.2 87.1
Safety/security outside of the home within the neighbourhood 75.0 78.6 77.2 79.4 77.3 83.1
Energy efficiency 73.2 75.9 74.0 62.1 76.6 77.9
Water efficiency 81.1 85.4 80.9 75.4 83.3 87.1
Thermal comfort 56.2 61.4 60.5 51.1 67.7 66.7
Notes
1. The proportion of households rating the particular amenity as meeting the needs of the household is based on the households that indicated
that the particular amenity was important to that household.
2. Responses to this question relate to the person in the household who completed the survey form.

68 National Social Housing Survey: detailed results 2014
Satisfaction with amenities, by previous homelessness Tenants who had been homeless at any point in the 5 years prior to the survey were generally less likely to rate amenities as important compared with tenants who had not been homeless in the 5 years prior to the survey (Table 12.11).
There were exceptions to this:
• Public housing tenants who were homeless in the 5 years prior to the survey were more likely to rate car parking and yard space and fencing as important to the household than those who had not been homeless.
• SOMIH tenants who were homeless in the 5 years prior to the survey were more likely to rate safety and security of the home; thermal comfort; and yard space and fencing as important to the household compared with those who had not been homeless.
• Community housing tenants who had been homeless in the 5 years prior to the survey were more likely to rate the size of the dwelling and the number of bedrooms as important to the household compared with those who had not been homeless.
Table 12.11: Amenities rated as important to the household, by prior homelessness, by housing program type, 2014 (%)
Amenities
Public housing (%) SOMIH (%) Community housing (%)
Homeless in the last
5 years
Have not been
homeless in the last 5
years
Homeless in the last
5 years
Have not been
homeless in the last 5
years
Homeless in the last 5
years
Have not been
homeless in the last 5
years
Size of dwelling 82.8 83.2
86.6 90.4
83.7 81.3
Number of bedrooms 83.4 84.1
89.7 92.5
82.7 81.7
Modifications for special needs 68.4 77.6
54.8 65.8
68.7 74.2
Ease of access and entry 83.6 90.0
93.7 95.5
85.9 90.1
Car parking 86.2 84.6
86.8 92.1
84.2 84.8
Yard space and fencing 85.6 84.5
97.9 96.5
80.7 80.5
Privacy of home 94.4 95.7
98.1 98.4
95.7 96.0
Safety/security of home 96.8 97.9
99.6 99.0
97.0 97.7
Safety/security outside of the home within the neighbourhood 94.4 95.7
98.3 98.6
93.0 95.3
Energy efficiency 95.5 96.5
96.6 98.7
96.0 95.9
Water efficiency 93.7 94.6
95.2 97.6
93.9 94.1
Thermal comfort 94.8 95.1 99.6 99.2 93.1 94.7
Note: Responses to this question relate to the person in the household who completed the survey form.

National Social Housing Survey: detailed results 2014 69
Across all social housing programs, tenants who had been homeless in the 5 years prior to the survey were generally less likely to rate amenities both as important and as meeting the needs of the household, compared with those tenants who had not been homeless in the 5 years prior to the survey (Table 12.12).
The following amenities were less likely to meet the needs of the households of those tenants who had been homeless in the 5 years prior to the survey:
• privacy of the home • yard space and fencing • safety and security outside of the home within the neighbourhood • modifications for special needs (particularly evident in SOMIH, where only 40% of
tenants who had been homeless in the 5 years prior to the survey rated this as ‘meeting the needs’ of their households compared with 63% of tenants who had not experienced homelessness).
Table 12.12: Amenities rated as meeting the needs of the household, by prior homelessness, by housing program type, 2014 (%)
Amenities
Public housing (%) SOMIH (%) Community housing (%)
Homeless in the last
5 years
Have not been
homeless in the last 5
years
Homeless in the last
5 years
Have not been
homeless in the last 5
years
Homeless in the last 5
years
Have not been
homeless in the last 5
years
Size of dwelling 72.4 87.1
74.2 80.7
79.4 89.3
Number of bedrooms 75.8 87.8
72.0 79.9
81.3 89.1
Modifications for special needs 76.5 80.2
40.2 63.8
72.2 83.0
Ease of access and entry 85.6 91.1
88.1 88.2
85.8 92.4
Car parking 78.6 84.3
86.1 87.8
74.0 84.7
Yard space and fencing 71.6 84.4
68.5 76.2
71.1 87.7
Privacy of home 71.6 86.3
71.4 84.1
76.7 89.5
Safety/security of home 71.4 83.6
72.9 79.6
80.6 87.6
Safety/security outside of the home within the neighbourhood 69.0 80.0
69.1 78.6
72.4 84.6
Energy efficiency 70.6 77.4
68.4 73.4
74.9 79.3
Water efficiency 79.1 86.7
75.9 80.7
84.1 87.8
Thermal comfort 52.1 64.0 52.3 60.3 59.4 69.8
Notes
1. The proportion of households rating the particular amenity as meeting the needs of the household is based on the households that indicated
that the particular amenity was important to that household.
2. Responses to this question relate to the person in the household who completed the survey form.

70 National Social Housing Survey: detailed results 2014
Satisfaction with amenities, by need for assistance In the vast majority of households where tenants had a need for assistance with self-care, body-movement or communication activities, survey respondents indicated that selected amenity features were important to their household (Table 12.13).
• Public housing and community housing respondents from these households were most likely to rate safety/security of the home as important to the household, and least likely to rate yard space and fencing as important (although the rating is still high).
• SOMIH respondents from households with a need for assistance were most likely to rate water efficiency as important to the household (100% of tenants), and least likely to rate size of the dwelling or modifications for special needs as important to their household (although this was still high at 90% of tenants).
Table 12.13: Amenities rated as important to the household for tenants with a need for assistance, by housing program type, 2014 (%)
Amenity Public housing
(%) SOMIH
(%) Community housing
(%) All (%)
Size of dwelling 86.7 90.0 84.9 86.5
Number of bedrooms 88.0 92.3 85.6 87.7
Modifications for special needs 88.4 90.0 84.6 87.9
Ease of access and entry 93.8 96.6 94.1 93.8
Car parking 87.0 92.7 85.5 86.9
Yard space and fencing 86.2 95.9 84.3 86.1
Privacy of home 96.0 97.4 97.0 96.2
Safety/security of home 98.4 99.2 98.1 98.4
Safety/security outside of the home within the neighbourhood 96.2 97.2 95.6 96.1
Energy efficiency 97.0 98.2 96.1 96.9
Water efficiency 95.1 99.6 93.9 95.0
Thermal comfort 93.9 93.9 93.9 93.9
Notes
1. ‘Tenants with a need for assistance’ refers to any member of the household.
2. The ‘need for assistance’ is defined as those who responded ‘Yes, always’ or ‘Yes, sometimes’ when asked if members of their household need help with self-care activities, body-movement activities, or communication activities.
Similarly, the majority of social housing tenants with a need for assistance indicated both that selected amenities were important to their household and that their households’ needs have been met (Table 12.14).
Satisfaction with the size of the dwelling, modifications for special needs and the ease of access and entry was high across the social housing programs—highest for community housing tenants and lowest for SOMIH tenants. The percentage expressed satisfaction for:
• size of the dwelling—was 83% for tenants in public housing, 80% for SOMIH, and 86% for community housing
• modifications for special needs—was 73% for public housing, 56% for SOMIH, and 77% for community housing
• ease of access and entry—was 86% for public housing, 79% for SOMIH, and 88% for community housing.

National Social Housing Survey: detailed results 2014 71
Table 12.14: Amenities rated as meeting the needs of households in which tenants had a need for assistance, by housing program type, 2014 (%)
Amenity Public housing
(%) SOMIH
(%) Community housing
(%)
Size of dwelling 82.9 79.6 86.2
Number of bedrooms 83.6 79.9 85.4
Modifications for special needs 73.2 55.9 76.9
Ease of access and entry 86.1 79.4 88.2
Car parking 81.8 87.0 82.0
Yard space and fencing 79.9 71.6 82.3
Privacy of home 81.3 76.1 81.9
Safety/security of home 76.9 74.4 81.6
Safety/security outside of the home within the neighbourhood 74.3 70.7 77.2
Energy efficiency 71.6 68.9 71.5
Water efficiency 82.3 74.7 82.9
Thermal comfort 55.2 58.7 62.4
Notes
1. ‘Tenants with a need for assistance’ refers to any member of the household.
2. The ‘need for assistance’ is defined as those who responded ‘Yes, always’ or ‘Yes, sometimes’ when asked if members of their household need help with self-care activities, body movement activities, or communication activities.
3. The proportion is based on households that rated the particular amenity as ‘important’ to their household.
Demographic characteristics of survey respondents related to satisfaction with amenity • Respondents aged 65 and over were the most likely to report that the amenities in their
homes were important to them and met the needs of their households. This ranged from 73% satisfied with thermal comfort to 93% for water efficiency.
• Those who were retired were the most likely to report that the amenities in their homes were both important to them and met the needs of their household, ranging from 73% for thermal comfort to 93% for easy access and entry.

72 National Social Housing Survey: detailed results 2014
2.3 Satisfaction with location (access to facilities and services)
Satisfaction with location, by state and territory The importance of proximity to facilities and services varied across social housing programs. Social housing tenant satisfaction with their dwellings’ location was consistently high across the states and territories for all social housing programs (tables 13.1, 13.2 and 13.3).
Public housing tenants rated proximity to the following facilities and services highest:
• emergency services, medical services and hospitals (95% overall; and between 89% in the Australian Capital Territory to 97% in Victoria)
• shops and banking facilities (92% overall; and between 88% in the Northern Territory to 93% in Victoria)
• family and friends (91% overall; and between 88% in the Northern Territory to 92% in New South Wales, Victoria and Tasmania).
Public housing tenants gave a lower rating to the importance of proximity to the following facilities and services:
• child care facilities (46% overall; and between 38% in South Australia to 51% in Queensland)
• education and training facilities (62% overall; and between 59% in South Australia to 66% in the Northern Territory).
This reflects the age profile of public housing respondents to the NSHS, the number of public housing households with dependent children and the proportion of respondents engaged in the workforce.
Table 13.1: Proximity to facilities and services rated by public housing tenants as important to the household, by state and territory, 2014 (%)
Proximity to NSW
(%) Vic (%)
Qld (%)
WA (%)
SA (%)
Tas (%)
ACT (%)
NT (%)
All (%)
Shops and banking 91.1 93.2 92.8 90.6 91.5 90.1 89.0 88.1 91.6
Public transport 88.8 86.7 82.1 81.9 85.3 79.4 83.4 85.2 85.7
Parks and recreational facilities 68.7 70.6 67.9 69.4 64.5 61.1 66.7 61.6 68.1
Emergency services, medical services and hospitals 95.5 96.5 94.0 93.8 95.0 94.3 88.8 92.6 95.0
Child care facilities 45.5 49.7 51.1 43.4 37.8 42.7 45.8 48.0 46.3
Education/training facilities 61.1 64.7 63.9 61.7 58.9 60.4 61.5 66.2 62.2
Employment/place of work 64.4 71.6 67.5 64.7 65.8 67.9 70.8 66.9 67.0
Community and support services 83.0 84.3 82.8 81.1 80.7 79.5 78.2 79.2 82.5
Family and friends 91.9 92.4 90.7 91.0 89.6 91.7 91.4 87.5 91.4
Note: Responses to this question relate to the person in the household who completed the survey form.

National Social Housing Survey: detailed results 2014 73
SOMIH tenants rated proximity to the following facilities and services highest:
• family and friends (97% overall; and between 89% in both South Australia and Tasmania and 99% in New South Wales)
• emergency services, medical services and hospitals (96% overall; and between 90% in Tasmania and98% in Queensland).
SOMIH tenants rated the importance of proximity to the following facilities and services lower:
• community and support services (73% overall; and between 61% in Queensland and 81% in South Australia)
• employment/place of work (74% overall; and between 61% in Tasmania and 86% in New South Wales).
It is important to bear in mind the different survey methodologies used across the jurisdictions operating the SOMIH program, which may have an impact on the results.
Table 13.2: Proximity to facilities and services rated by SOMIH tenants as important to their households, by state and territory, 2014 (%)
Proximity to NSW
(%) Qld (%)
SA (%)
Tas (%)
All (%)
Shops and banking 93.5 96.0 87.6 91.1 93.3
Public transport 88.2 79.0 79.4 86.3 83.6
Parks and recreational facilities 77.9 78.3 71.1 73.2 76.7
Emergency services, medical services and hospitals 96.9 98.2 92.7 89.6 96.4
Child care facilities 94.8 64.8 57.5 51.2 74.7
Education/training facilities 89.3 64.1 72.8 61.4 75.5
Employment/place of work 86.1 65.5 73.4 60.8 73.9
Community and support services 80.0 60.8 80.5 75.0 73.3
Family and friends 98.6 98.0 89.3 89.3 96.6
Note: Responses to this question relate to the person in the household who completed the survey form.

74 National Social Housing Survey: detailed results 2014
Community housing tenants rated proximity to the following facilities and services highest:
• emergency services, medical services and hospitals (95% overall; and between 90% in South Australia and 96% in Queensland and Western Australia)
• family and friends (92% overall; and between 89% in Tasmania and 93% in Victoria) • shops and banking facilities (91% overall; and between 88% in South Australia and
Tasmania to 91% in New South Wales, Victoria, Queensland, Western Australia and the Australia Capital Territory).
Community housing tenants rated the importance of proximity to the following facilities and services lower:
• child care facilities (42% overall; and between 38% in South Australia and Tasmania and 45% in Victoria)
• education/training facilities (59% overall; and between 54% in Queensland and 69% in the Australian Capital Territory).
Table 13.3: Proximity to facilities and services rated by community housing tenants as important to the household, by state and territory, 2014 (%)
Proximity to NSW
(%) Vic (%)
Qld (%)
WA (%)
SA (%)
Tas (%)
ACT (%)
NT (%)
All (%)
Shops and banking 90.8 91.3 90.8 91.4 87.5 87.6 90.7 —— 90.6
Public transport 85.3 82.9 82.8 85.0 81.7 75.6 85.2 —— 83.9
Parks and recreational facilities 66.5 71.1 64.5 69.6 65.6 65.4 67.3 —— 67.1
Emergency services, medical services and hospitals 94.5 94.6 95.7 95.9 89.6 94.3 91.4 —— 94.5
Child care facilities 41.6 44.6 43.8 43.2 38.4 38.4 44.4 —— 42.2
Education/training facilities 60.2 63.3 53.9 60.4 57.3 56.8 68.9 —— 59.4
Employment/place of work 64.9 73.5 64.9 73.7 65.8 67.9 75.4 —— 67.3
Community and support services 82.9 80.3 84.5 86.5 78.0 84.6 80.7 —— 82.9
Family and friends 92.0 92.9 91.9 89.5 90.9 88.9 90.9 —— 91.6
Note: Responses to this question relate to the person in the household who completed the survey form.

National Social Housing Survey: detailed results 2014 75
Public housing tenants’ agreement that their dwellings location meets the needs of their household (Table 13.4) was higher than the national average for proximity to:
• shops and banking facilities (95%) in the Australian Capital Territory • employment/place of work (89%) and community and support services (92%) in
Western Australia • family and friends (93%) in Tasmania. Public housing tenants’ satisfaction with location was lower than the national average for proximity to:
• public transport (87%) in Western Australia • emergency services, medical services and hospitals (89%) in the Northern Territory.
Table 13.4: Proximity to services and facilities rated by public housing tenants as meeting the needs of the household, by state and territory, 2014 (%)
Proximity to NSW
(%) Vic (%)
Qld (%)
WA (%)
SA (%)
Tas (%)
ACT (%)
NT (%)
All (%)
Shops and banking 91.0 92.0 93.9 90.9 92.9 93.3 #94.7 90.2 92.1
Public transport 91.6 90.0 91.4 #87.2 91.5 88.3 93.0 91.5 90.8
Parks and recreational facilities 90.2 90.5 91.0 93.2 92.7 89.0 92.2 90.0 91.0
Emergency services, medical services and hospitals 92.1 92.8 94.7 91.5 94.0 92.2 92.3
#88.8 92.8
Child care facilities 88.9 82.4 90.6 90.2 89.0 85.5 88.4 82.8 87.6
Education/training facilities 87.7 84.4 84.9 83.8 87.5 84.8 86.1 87.8 86.0
Employment/place of work 84.2 77.9 87.5 #88.7 81.1 84.4 85.0 86.8 83.3
Community and support services 87.3 88.8 90.9 #91.7 84.6 89.2 89.5 85.0 88.4
Family and friends 87.3 86.7 85.9 90.2 89.8 #92.9 88.8 88.6 87.8
Notes
1. The proportion of households rating location to selected facilities and services as meeting the needs of the household is based on the
households that indicated that the particular amenity was important to that household.
2. Responses to this question relate to the person in the household who completed the survey form.

76 National Social Housing Survey: detailed results 2014
SOMIH tenants’ agreement that their dwellings location meets the needs of their household (Table 13.5) was higher than the national average for proximity to:
• parks and recreational facilities (93%) in South Australia • parks and recreation facilities (96%) and education and training facilities (97%) in
Tasmania. SOMIH tenants’ satisfaction with location was lower than the national average for proximity to:
• family and friends (87%) in South Australia.
Table 13.5: Proximity to services and facilities rated by SOMIH tenants as meeting the needs of the household, by state and territory, 2014 (%)
Proximity to NSW
(%) Qld (%)
SA (%)
Tas (%)
All (%)
Shops and banking 88.9 91.6 93.4 94.3 90.7
Public transport 94.0 89.3 90.2 95.0 92.0
Parks and recreational facilities 86.5 88.1 #93.3 #95.9 88.3
Emergency services, medical services and hospitals 89.6 91.8 92.1 92.3 90.8
Child care facilities 89.7 89.5 87.0 94.4 89.3
Education/training facilities 89.0 87.1 87.1 #97.1 88.3
Employment/place of work 84.6 82.6 86.6 89.7 84.4
Community and support services 88.9 90.7 87.6 90.5 89.4
Family and friends 92.9 93.4 #87.3 95.3 92.4
Notes
1. The proportion of households rating location to selected facilities and services as meeting the needs of the
household is based on the households that indicated that the particular amenity was important to that household.
2. Responses to this question relate to the person in the household who completed the survey form.

National Social Housing Survey: detailed results 2014 77
Community housing tenants’ agreement that their dwellings location meets the needs of their household (Table 13.6) was higher than the national average for proximity to:
• parks and recreational facilities (95%) and family and friends (94%) in Western Australia • shops and banking (97%), public transport (91%) and emergency/medical services (95%)
in South Australia • public transport (92%) in Tasmania.
Table 13.6: Proximity to services and facilities rated by community housing tenants as meeting the needs of the household, by state and territory, 2014 (%)
Proximity to NSW
(%) Vic (%)
Qld (%)
WA (%)
SA (%)
Tas (%)
ACT (%)
NT (%)
All (%)
Shops and banking 89.0 91.8 91.5 88.1 #96.5 91.1 93.0 — 90.4
Public transport 86.8 87.8 84.3 86.8 #91.4 #92.1 89.4 — 87.1
Parks and recreational facilities 88.8 92.8 86.8 #95.1 92.7 84.7 91.6 — 90.0
Emergency services, medical services and hospitals 89.9 92.7 90.7 87.6 #95.2 89.3 85.7 — 90.5
Child care facilities 82.5 89.0 81.6 87.4 90.2 85.0 71.4 — 84.4
Education/training facilities 82.8 87.2 78.3 87.7 89.5 91.0 86.1 — 84.1
Employment/place of work 80.3 84.4 81.7 85.4 84.5 83.7 71.8 — 82.1
Community and support services 87.1 88.5 88.4 86.8 88.9 88.8 79.5 — 87.6
Family and friends 86.8 87.4 85.3 #94.0 89.9 89.4 85.6 — 87.7
Notes
1. The proportion of households rating location to selected facilities and services as meeting the needs of the household is based on the
households that indicated that the particular amenity was important to that household.
2. Responses to this question relate to the person in the household who completed the survey form.

78 National Social Housing Survey: detailed results 2014
Satisfaction with location, by remoteness There were differences (in terms of remoteness) in the extent to which the location of tenant’s housing was important across the various social housing programs (Table 13.7). Despite this, 60% or more of tenants living in Major cities, Inner regional and Outer regional areas in all social housing programs were satisfied with their proximity to facilities and services. Those in Remote areas were generally less satisfied with the proximity of their housing to facilities and services.
For public housing tenants, proximity to the following facilities and services was rated highest for:
• emergency services, medical services and hospitals (95%) and shops and banking (93%) for Major cities
• emergency services, medical services and hospitals (95%) and family and friends (91%) for Inner regional areas
• emergency services, medical services and hospitals (92%), shops and banking facilities (89%) and family and friends (89%) for Outer regional areas
• emergency services, medical services and hospitals (93%) and family and friends (88%) for Remote areas.
For SOMIH tenants, the importance of proximity to the following facilities and services was rated highest for:
• emergency services, medical services and hospitals (96%) and shops and banking facilities (96%) for Major cities
• emergency services, medical services and hospitals (97%) and family and friends (96%) for Inner regional areas
• family and friends (98%) and emergency services, medical services and hospitals (96%) for Outer regional areas
• family and friends (98%) and emergency services, medical services and hospitals (97%) for Remote areas.
For community housing tenants, the importance of proximity to the following facilities and services was rated highest for:
• emergency services, medical services and hospitals (94%), shops and banking facilities (92%) and family and friends (92%) for Major cities
• emergency services, medical services and hospitals (95%) and family and friends (92%) for Inner regional areas
• emergency services, medical services and hospitals (95%) and family and friends facilities (93%) for Outer regional areas
• emergency services, medical services and hospitals (98%) and community and support services (91%) for Remote areas.

National Social Housing Survey: detailed results 2014 79
Table 13.7: Proximity to facilities and services rated by tenants as important, by location (remoteness), by housing program type, 2014 (%)
Public housing (%) SOMIH (%) Community housing (%)
Proximity to Major cities
Inner regional
Outer regional Remote All
Major cities
Inner regional
Outer regional Remote All
Major cities
Inner regional
Outer regional Remote All
Shops and banking #92.8 #89.5 89.0 #84.2 91.6 95.5 93.6 91.6 90.4 93.3 91.5 90.3 87.6 85.7 90.6
Public transport #89.0 #81.0 #72.4 #67.6 85.7 #89.0 85.2 85.2 #49.9 83.6 #88.9 #78.5 #71.8 67.7 83.9
Parks and recreational facilities 70.0 65.2 #60.5 66.4 68.1 #81.8 74.4 78.9 #66.5 76.7 #70.3 64.7 #56.0 66.0 67.1
Emergency services, medical services and hospitals
95.4 94.9 92.1 93.2 95.0 96.4 96.6 96.0 96.7 96.4 94.2 94.6 94.6 #98.4 94.5
Child care facilities 46.5 45.2 44.1 54.2 46.3 72.5 79.6 76.8 69.5 74.7 42.4 40.6 44.5 *49.5 42.2
Education/training facilities 61.7 62.1 64.0 69.4 62.2 74.4 77.0 78.6 70.3 75.5 61.4 57.0 54.2 61.3 59.4
Employment/place of work 67.1 68.2 63.2 72.4 67.0 71.9 73.2 74.7 77.5 73.9 68.8 63.2 71.5 67.9 67.3
Community and support services 82.7 83.3 79.1 83.5 82.5 #79.6 76.5 71.7 #56.7 73.3 82.0 82.4 86.8 #91.3 82.9
Family and friends 91.8 91.3 89.3 87.8 91.4 95.3 96.2 98.1 97.6 96.6 91.6 91.5 93.0 88.5 91.6
Notes
1. Responses to this question relate to the person in the household who completed the survey form.
2. 'Remote' includes 'remote' and 'very remote' classifications.

80 National Social Housing Survey: detailed results 2014
There were differences (in terms of remoteness) in the extent to which the location of tenants’ housing met the needs of the household across the various social housing programs (Table 13.8). Despite this, around 80-90% of tenants living in Major cities, Inner regional and Outer regional areas in all social housing programs were satisfied with their proximity to facilities and services. Those in Remote areas were less satisfied with the locational aspects of their housing.
Proximity to facilities and services that meet the needs of the households was rated highest by public housing tenants for:
• emergency services, medical services and hospitals (93%) and public transport (92%) in Major cities
• emergency services, medical services and hospitals (93%) and shops and banking facilities (92%) in Inner regional areas
• shops and banking facilities (95%) and emergency services, medical services and hospitals (94%) in Outer regional areas
• family and friends (92%) and shops and banking facilities (87%) in Remote areas. For SOMIH tenants, proximity to various facilities and services was rated highest in terms of meeting the needs of their household in Major cities and decreased as the level of remoteness increased. One notable exception to this is proximity to family and friends, which is rated highest in Remote regions.
Proximity to the following facilities and services were rated highest for SOMIH tenants for:
• public transport (97%), shops and banking facilities (96%) and emergency services, medical services and hospitals (96%) in Major cities
• public transport (95%) and family and friends (94%) in Inner regional areas • family and friends (92%) and emergency services, medical services and hospitals (91%)
in Outer regional areas • family and friends (94%), emergency services, medical services and hospitals (88%) and
shops and banking (88%) in Remote areas. Notably, only 55% of SOMIH respondents in Remote areas rated proximity to public transport as meeting the needs of their household (down from 63% in 2012).
Proximity to facilities and services that meet the needs of households was rated highest by community housing tenants for:
• emergency services, medical services and hospitals (91%), public transport (90%) and shops and banking facilities (90%) in Major cities
• shops and banking facilities (91%) and parks and recreational facilities (91%) in Inner regional areas
• emergency services, medical services and hospitals (93%) and shops and banking facilities (93%) in Outer regional areas
• family and friends (95%) and parks and recreational facilities (92%) in Remote areas. Only 56% of community housing respondents in Remote areas rated proximity to public transport as meeting the needs of their household.

National Social Housing Survey: detailed results 2014 81
Table 13.8: Proximity to facilities and services rated by tenants as meeting the needs of the household, by location (remoteness), by housing program type, 2014 (%)
Public housing (%) SOMIH (%) Community housing (%)
Proximity to: Major cities
Inner regional
Outer regional Remote All
Major cities
Inner regional
Outer regional Remote All
Major cities
Inner regional
Outer regional Remote All
Shops and banking 91.9 91.5 #95.3 #86.7 92.1 #96.2 89.8 #85.4 87.7 90.7 90.0 91.2 92.5 82.8 90.4
Public transport #92.3 #86.8 87.3 #73.8 90.8 #97.2 94.5 88.3 #54.5 92.0 #90.2 #83.0 80.4 #56.4 87.1
Parks and recreational facilities 91.3 89.9 91.5 87.6 91.0 #94.2 89.4 83.3 #79.1 88.3 89.3 90.8 91.8 92.2 90.0
Emergency services, medical services and hospitals
92.6 93.2 94.4 #86.0 92.8 #95.5 86.8 90.8 87.9 90.8 90.6 90.2 92.9 82.0 90.5
Child care facilities 87.9 85.8 90.9 82.4 87.6 #94.8 92.0 89.6 #74.5 89.3 82.7 90.1 80.9 *65.3 84.4
Education/training facilities 86.0 84.1 90.0 85.3 86.0 #93.2 85.3 87.1 84.2 88.3 87.0 81.1 75.2 68.5 84.1
Employment/place of work 83.8 79.6 87.4 81.4 83.3 #91.6 84.7 83.6 #73.5 84.4 82.5 83.3 79.8 70.7 82.1
Community and support services 88.1 89.1 90.5 82.7 88.4 92.5 90.7 87.7 83.5 89.4 86.9 87.6 91.6 85.3 87.6
Family and friends 87.3 88.5 89.2 #92.0 87.8 90.6 94.3 91.6 93.8 92.4 86.7 88.4 89.5 #94.6 87.7
Notes
1. The proportion of households rating proximity to selected facilities and services as meeting the needs of the household is based on those households which indicated that the particular amenity was
important to the household.
2. Responses to this question relate to the person in the household who completed the survey form.
3. 'Remote' includes 'remote' and 'very remote' classifications.

82 National Social Housing Survey: detailed results 2014
Satisfaction with location, by Indigenous status Regardless of Indigenous status, being located close to a range of facilities and services were consistently rated as important for their household (Table 13.9).
• For public housing tenants, non-Indigenous tenants were more likely than Indigenous households to rate access to 5 of the 9 facilities and services listed as important to their household. Indigenous public housing tenants were more likely to rate: parks and recreational facilities; education and training facilities; employment/place of work; and child care facilities as more important to the household than non-Indigenous tenants.
• In SOMIH, Indigenous tenants were more likely to rate access to the following facilities and services as important: emergency services; medical services and hospitals; family and friends; public transport; and parks and recreational facilities.
• Indigenous tenants in community housing were more likely to rate access to 7 of the 9 facilities and services listed as important to their household: parks and recreation facilities; emergency services, medical services and hospitals; child care facilities; education and training facilities; employment/place of work; community and support services; and family and friends.
Table 13.9: Proximity to facilities and services rated by tenants as important to the household, by Indigenous status, by housing program type, 2014 (%)
Public housing (%) SOMIH (%) Community housing (%)
Proximity to Indigenous Non-
Indigenous Indigenous Non-
Indigenous Indigenous Non-
Indigenous
Shops and banking 86.8 91.7 93.1 94.8 85.9 91.1
Public transport 84.4 84.8 84.3 78.4 83.7 84.3
Parks and recreational facilities 72.7 67.1 77.0 75.0 69.2 65.4
Emergency services, medical services and hospitals 91.5 95.0 96.8 94.1 95.1 94.4
Child care facilities 56.7 43.2 74.7 75.8 56.4 38.2
Education/training facilities 72.6 60.0 75.1 79.2 79.8 58.0
Employment/place of work 69.0 67.0 73.8 74.5 74.4 67.5
Community and support services 82.0 82.0 73.0 75.5 87.1 81.8
Family and friends 89.7 91.6 96.9 94.0 96.7 91.4
Note: Responses to this question relate to the person in the household who completed the survey form.
Proximity to shops and banking facilities was consistently highly rated as meeting the needs of the household regardless of Indigenous status (Table 13.10).
• In public housing, non-Indigenous tenants were more likely to be satisfied across the whole range of location aspects.
• In community housing, Indigenous tenants were more likely to be satisfied with access to shops and banking, public transport and community services than non-Indigenous tenants; but less satisfied with access to parks and recreational facilities, child care facilities, employment/place of work and access to family and friends.
Aside from proximity to shops and banking, employment or place of work and community and support services, there was little difference in the proportion of tenants rating proximity

National Social Housing Survey: detailed results 2014 83
to the facilities and services listed between Indigenous and non-Indigenous tenants in SOMIH.
Table 13.10: Proximity to facilities and services rated by tenants as meeting the needs of the household, by Indigenous status, by housing program type, 2014 (%)
Public housing (%) SOMIH (%) Community housing (%)
Proximity to Indigenous Non-
Indigenous Indigenous Non-
Indigenous Indigenous Non-
Indigenous
Shops and banking 87.6 92.7 90.3 95.6 97.1 90.8
Public transport 90.4 91.6 92.0 93.6 91.6 86.8
Parks and recreational facilities 87.2 91.7 87.9 90.6 84.7 90.0
Emergency services, medical services and hospitals 89.0 93.5 90.7 92.8 89.1 90.9
Child care facilities 84.3 89.2 89.5 91.7 82.0 85.0
Education/training facilities 83.2 86.5 88.2 91.9 83.4 83.2
Employment/place of work 80.9 83.2 83.6 90.0 77.0 81.1
Community and support services 86.2 88.6 88.9 95.9 89.3 87.4
Family and friends 83.2 88.1 92.5 92.0 82.5 87.0
Notes
1. The proportion of households rating proximity to selected facilities and services as meeting the needs of the household is based on those
households which indicated that the particular amenity was important to the household.
2. Responses to this question relate to the person in the household who completed the survey form.
Satisfaction with location, by previous homelessness In general, tenants who had not experienced homelessness in the 5 years prior to the NSHS (fewer than 1 in 10 social housing tenants) were more likely to rate their proximity to certain facilities and services both as important and as meeting the needs of their household compared with those who had experienced homelessness in the preceding 5 years (Table 13.11).
The exceptions to this included SOMIH respondents whose previous experience of homelessness had no impact on their rating of proximity to shops and banking facilities, and community housing respondents, whose previous experience of homelessness had no impact on their rating of proximity to public transport.
Amongst those respondents who had previously experienced homelessness, satisfaction with location was highest with proximity to:
• emergency services, medical services and hospitals (89%) and public transport (89%) for public housing tenants
• shops and banking facilities (90%) and public transport (90%) for SOMIH tenants • shops and banking facilities (89%) and emergency services, medical services and
hospitals (88%) for community housing respondents. Amongst those who had not experienced homelessness in the 5 years prior to the NSHS, satisfaction with location was highest for proximity to emergency services, medical services and hospitals for both public housing tenants (93%) and community housing tenants (91%) while satisfaction with location for SOMIH tenants was highest for proximity to family and friends (93%).

84 National Social Housing Survey: detailed results 2014
Table 13.11: Proximity to facilities and services rated by tenants as meeting the needs of the household, by previous homelessness, by housing program type, 2014 (%)
Public housing (%) SOMIH (%) Community housing
(%)
Amenities
Homeless in the last 5
years
Have not been
homeless in the last
5 years
Homeless in the last
5 years
Have not been
homeless in the last
5 years
Homeless in the last
5 years
Have not been
homeless in the last
5 years
Shops and banking 86.3 92.9 90.2 90.7 88.7 90.7
Public transport 88.5 91.1 90.2 92.2 86.9 87.1
Parks and recreational facilities 87.5 91.6 82.0 89.2 84.2 91.3
Emergency services, medical services and hospitals
88.7 93.3 77.6 92.5 88.1 91.0
Child care facilities 79.7 89.4 80.1 91.1 80.4 85.9
Education/training facilities 80.7 87.2 80.7 89.6 79.4 85.8
Employment/place of work 71.7 85.4 69.6 86.4 74.5 84.5
Community and support services 81.9 89.4 85.1 89.9 85.1 88.2
Family and friends 75.9 89.4 84.1 93.4 81.6 89.0
Notes
1. The proportion of households rating proximity to selected facilities and services as meeting the needs of the household is based on those
households which indicated that the particular amenity was important to the household.
2. Responses to this question relate to the person in the household who completed the survey form.
Demographic characteristics of survey respondents related to satisfaction with location • For young respondents aged 15–19, 4 out of the 9 listed facilities and services were rated
most highly as meeting the needs of their households, ranging from 93% for parks and recreational facilities and for community and support services to 95% for public transport.
• Those aged 65 years and over were most likely to rate their proximity to shops and banking facilities (92%) and emergency services, medical services and hospitals (94%) as meeting their needs.
• Those who were employed either full- or part-time or who were retired were the most likely to report that the location of their dwelling met the needs of their household.
National Social Housing Survey: detailed results 2014 85
2.4 Satisfaction with day-to-day maintenance services
Satisfaction with day-to-day maintenance services, by state and territory Across the different states and territories, community housing tenants were the most likely to be satisfied with the day-to-day maintenance services provided by their housing organisation followed by public housing tenants and SOMIH tenants (Figure 14.1).
• Public housing tenants in Victoria (71%), Queensland (78%) and South Australia (72%) were more likely to be satisfied with day-to-day maintenance services than the national average (66%) while New South Wales tenants were less likely to be satisfied (57%).
• Compared with the national average, SOMIH tenants in Queensland (56%) and South Australia (55%) were more likely to be satisfied (48%) while New South Wales tenants were less likely to be satisfied (39%).
• Compared with the national average, community housing tenants in Queensland (83%) were more likely to be satisfied with day-to-day maintenance services (74%) while Victoria (68%), Tasmania (68%) and the Australian Capital Territory (61%) were less likely to be satisfied.
Satisfaction with day-to-day maintenance services for SOMIH tenants has decreased from 64% in 2012 to 48% in 2014 (although it is important to take into account the change in methodology for 2 of the jurisdictions operating a SOMIH program when considering this change).
• Satisfaction with day-to-day maintenance decreased from 56% in 2012 to 39% in 2014 for New South Wales tenants and from 72% in 2012 to 56% in 2014 for Queensland tenants. (Due to the change in methodology between 2012 and 2014 for these 2 jurisdictions these results are not directly comparable.)
• Satisfaction with day-to-day maintenance services has also decreased from 66% in 2012 to 55% in 2014 for South Australian tenants and from 57% in 2012 to 52% in 2014 for Tasmanian tenants. (As the methodology for these jurisdictions remained consistent, this result is directly comparable.)

86 National Social Housing Survey: detailed results 2014
Notes
1. Responses to this question relate to the person in the household who completed the survey form.
2. ‘Satisfied’ includes those who reported being ‘satisfied’ and ‘very satisfied’.
Source: Supplementary table S14.1.
Figure 14.1: Proportion of tenants satisfied with day-to-day maintenance services, by state and territory, by housing program type, 2014 (%)
Public housing SOMIH Community housing
NT
ACT
Tas
SA
WA
Qld
Vic
NSW
All
Per cent
0 10 20 30 40 50 60 70 80 90 100
Jurisdiction

National Social Housing Survey: detailed results 2014 87
Satisfaction with day-to-day maintenance services, by location (remoteness) Satisfaction with day-to-day maintenance services differed between social housing programs in different remoteness areas. Consistent with 2012, for community housing tenants, satisfaction increased with increasing remoteness (Figure 14.2).
Satisfaction was highest for:
• Public housing tenants (73%) and SOMIH tenants (50%) in Outer regional areas • Community housing tenants in Remote areas (88%). Satisfaction was lowest for:
• Public housing tenants (61%) who lived in Remote areas • SOMIH tenants (46%) and community housing tenants (72%) who lived in Inner regional
areas.
Notes
1. Responses to this question relate to the person in the household who completed the survey form.
2. ‘Satisfied’ includes those who reported being ‘satisfied’ and ‘very satisfied’.
3. ’Remote’ includes both ‘Remote’ and ‘Very remote’ areas.
Source: Supplementary table S14.2.
Figure 14.2: Proportion of tenants satisfied with day-to-day maintenance services, by remoteness category, by housing program type, 2014 (%)
Public housing SOMIH Community housing
Remote
Outer regional
Inner regional
Major cities
All
Per cent
0 10 20 30 40 50 60 70 80 90 100
Remoteness

88 National Social Housing Survey: detailed results 2014
Satisfaction with day-to-day maintenance services, by Indigenous status Satisfaction with day-to-day maintenance services was higher for non-Indigenous tenants for both public and community housing programs, while satisfaction was higher for Indigenous tenants in SOMIH (Figure 14.3).
The rate of satisfaction (those who were satisfied and very satisfied) among Indigenous tenants varied by housing program type:
• 57% for public housing tenants • higher for community housing tenants (70%) • lower for SOMIH tenants (48%).
Note: Responses to this question relate to the person in the household who completed the survey form.
Source: Supplementary table S14.3.
Figure 14.3: Proportion of tenants satisfied with day-to-day maintenance services, by Indigenous status, by housing program type, 2014 (%)
Very satisfied Satisfied Neither satisfied nor dissatisfiedDissatisfied Very dissatisfied
Community housing
SOMIH
Public housing
All
Non-Indigenous
Indigenous
Non-Indigenous
Indigenous
Non-Indigenous
Indigenous
Non-Indigenous
Indigenous
Per cent
0 10 20 30 40 50 60 70 80 90 100
Housing program
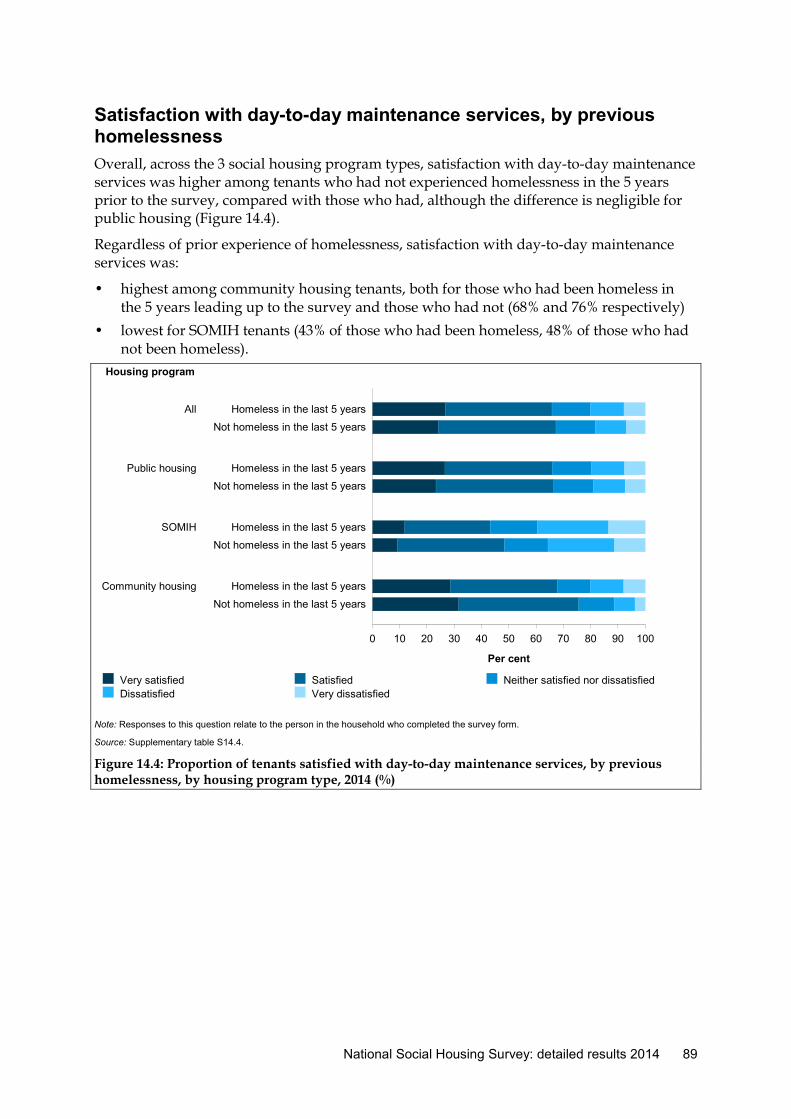
National Social Housing Survey: detailed results 2014 89
Satisfaction with day-to-day maintenance services, by previous homelessness Overall, across the 3 social housing program types, satisfaction with day-to-day maintenance services was higher among tenants who had not experienced homelessness in the 5 years prior to the survey, compared with those who had, although the difference is negligible for public housing (Figure 14.4).
Regardless of prior experience of homelessness, satisfaction with day-to-day maintenance services was:
• highest among community housing tenants, both for those who had been homeless in the 5 years leading up to the survey and those who had not (68% and 76% respectively)
• lowest for SOMIH tenants (43% of those who had been homeless, 48% of those who had not been homeless).
Note: Responses to this question relate to the person in the household who completed the survey form.
Source: Supplementary table S14.4.
Figure 14.4: Proportion of tenants satisfied with day-to-day maintenance services, by previous homelessness, by housing program type, 2014 (%)
Very satisfied Satisfied Neither satisfied nor dissatisfiedDissatisfied Very dissatisfied
Community housing
SOMIH
Public housing
All
Not homeless in the last 5 years
Homeless in the last 5 years
Not homeless in the last 5 years
Homeless in the last 5 years
Not homeless in the last 5 years
Homeless in the last 5 years
Not homeless in the last 5 years
Homeless in the last 5 years
Per cent
0 10 20 30 40 50 60 70 80 90 100
Housing program

90 National Social Housing Survey: detailed results 2014
Satisfaction with day-to-day maintenance services, by dwelling condition Consistent with the findings for 2012, satisfaction with day-to-day maintenance services increased as the dwelling standard increased (Figure 14.5).
• Almost three-quarters (72%) of all social housing tenants living in a dwelling of an ‘acceptable standard’ were satisfied with day-to-day maintenance services.
• Satisfaction was also high among tenants whose dwellings were of an ‘acceptable standard’ but whose facilities were not (69%).
• Tenants living in a dwelling with facilities of an ‘acceptable standard’ but unacceptable dwelling structure were less satisfied with day-to-day maintenance services (40%).
• As with 2012, those whose dwellings were of an ‘unacceptable standard’ had the lowest proportion of tenants who were satisfied (32%).
Note: Responses to this question relate to the person in the household who completed the survey form.
Source: Supplementary table S14.5
Figure 14.5: Proportion of tenants satisfied with day-to-day maintenance services, by dwelling condition, 2014 (%)
Very satisfied Satisfied Neither satisfied nor dissatisfiedDissatisfied Very dissatisfied
Dwelling is not of acceptable standard
Structure is of an acceptable standard but facilities are not
Facilities are of acceptable standard but structure is not
Dwelling is of an acceptable standard
Per cent
0 10 20 30 40 50 60 70 80 90 100
Dwelling standard

National Social Housing Survey: detailed results 2014 91
Satisfaction with day-to-day maintenance services, by dwelling utilisation Satisfaction with day-to-day maintenance services was lowest for tenants living in an overcrowded dwelling and highest for those living in underutilised dwellings (Figure 14.6).
• While satisfaction with day-to-day maintenance services was highest among tenants whose dwellings were underutilised, community housing tenants were similarly satisfied if their dwellings was adequately utilised.
• Across all social housing programs, satisfaction was lowest among tenants living in overcrowded dwellings—possibly due to a higher need for maintenance services due to the additional strain placed on facilities through overcrowding.
Note:
1. Responses to this question relate to the person in the household who completed the survey form.
2. ‘Satisfied’ includes those who reported being ‘satisfied’ or ‘very satisfied’.
Source: Supplementary table S14.6.
Figure 14.6: Proportion of tenants who were satisfied with day-to-day maintenance services, by dwelling utilisation, by housing program type, 2014 (%)
Demographic characteristics of survey respondents related to satisfaction with day-to-day maintenance services • Satisfaction with day-to-day maintenance increased with increasing age. Three-quarters
(75%) of respondents aged 65 and over reported being satisfied with the day-to-day maintenance services provided by their housing organisation compared with 59% of those aged 15-24 years.
OvercrowdedAdequateUnderutilised
0
10
20
30
40
50
60
70
80
90
100
All Public housing SOMIH Community housing
Per cent
Housing program

92 National Social Housing Survey: detailed results 2014
• Three-quarters (75%) of retired respondents were satisfied with the day-to-day maintenance services they received from their housing organisation, compared with only 56% of full-time parents or carers.
2.5 Satisfaction with emergency maintenance services
Satisfaction with emergency maintenance services, by state and territory Across the states and territories, community housing tenants were the most likely to be satisfied with the emergency maintenance services provided by their housing organisation followed by public housing tenants and SOMIH tenants (Figure 15.1).
• Compared with the national average (76%), public housing tenants in Queensland (86%) and South Australia (79%) were more likely to be satisfied with emergency maintenance services, while tenants in New South Wales (69%) and Tasmania (69%) were less likely to be satisfied.
• SOMIH tenants in Queensland (69%) and South Australia (66%) were more likely to be satisfied with emergency maintenance services, while New South Wales (60%) and Tasmanian tenants (59%) were less likely to be satisfied (though the differences were not significant).
• Compared with the national average (79%), community housing tenants in Queensland (83%) and South Australia (83%) were more likely to be satisfied with emergency maintenance services, (although the differences were not significant), while Tasmania (71%) and the Australian Capital Territory (64%) were less satisfied.
Satisfaction with emergency maintenance services for SOMIH tenants has decreased, from 70% across all jurisdictions in 2012 to 64% across all jurisdictions in 2014, although it is important to take into account the change in methodology for 2 of the jurisdictions operating a SOMIH program when considering this change.
• Satisfaction with emergency maintenance services decreased from 63% in 2012 to 60% in 2014 for New South Wales tenants and from 80% in 2012 to 69% in 2014 for Queensland tenants. (Due to the change in methodology for these 2 jurisdictions these results are not directly comparable.)
• Satisfaction with emergency maintenance services also decreased from 68% in 2012 to 66% in 2014 for South Australian tenants and from 73% in 2012 to 59% in 2014 for Tasmanian tenants. (As the methodology for these jurisdictions remained consistent, this result is directly comparable.)

National Social Housing Survey: detailed results 2014 93
Notes 1. Responses to this question relate to the person who completed the survey form.
2. ‘Satisfied’ includes those who reported being ‘satisfied’ or ‘very satisfied’.
Source: Supplementary table S15.1.
Figure 15.1: Satisfaction with emergency maintenance services, by state and territory, by housing program type, 2014 (%)
Public housing SOMIH Community housing
NT
ACT
Tas
SA
WA
Qld
Vic
NSW
All
Per cent
0 10 20 30 40 50 60 70 80 90 100
Jurisdiction

94 National Social Housing Survey: detailed results 2014
Satisfaction with emergency maintenance services, by location (remoteness) Satisfaction with emergency maintenance services differed between social housing programs in different remoteness areas, and as with day-to-day maintenance, satisfaction increased for community housing tenants as remoteness increased (Figure 15.2).
Satisfaction with emergency maintenance services was highest for respondents in:
• public housing (79%) who lived in Outer regional areas • SOMIH (65%) who lived in either Major cities or Outer regional areas • community housing (91%) who lived in Remote areas. Satisfaction with emergency maintenance services was lowest for respondents in:
• public housing (72%) who lived in Remote areas • SOMIH (58%) who lived in Remote areas • community housing (78%) who lived in Inner regional areas.
Notes 1. Responses to this question relate to the person who completed the survey form.
2. ‘Satisfied’ includes those who reported being ‘satisfied’ or ‘very satisfied’.
Source: Supplementary table S15.2.
Figure 15.2: Satisfaction with emergency maintenance services, by remoteness category, by housing program type, 2014 (%)
Public housing SOMIH Community housing
Remote
Outer regional
Inner regional
Major cities
All
Per cent
0 10 20 30 40 50 60 70 80 90 100
Remoteness
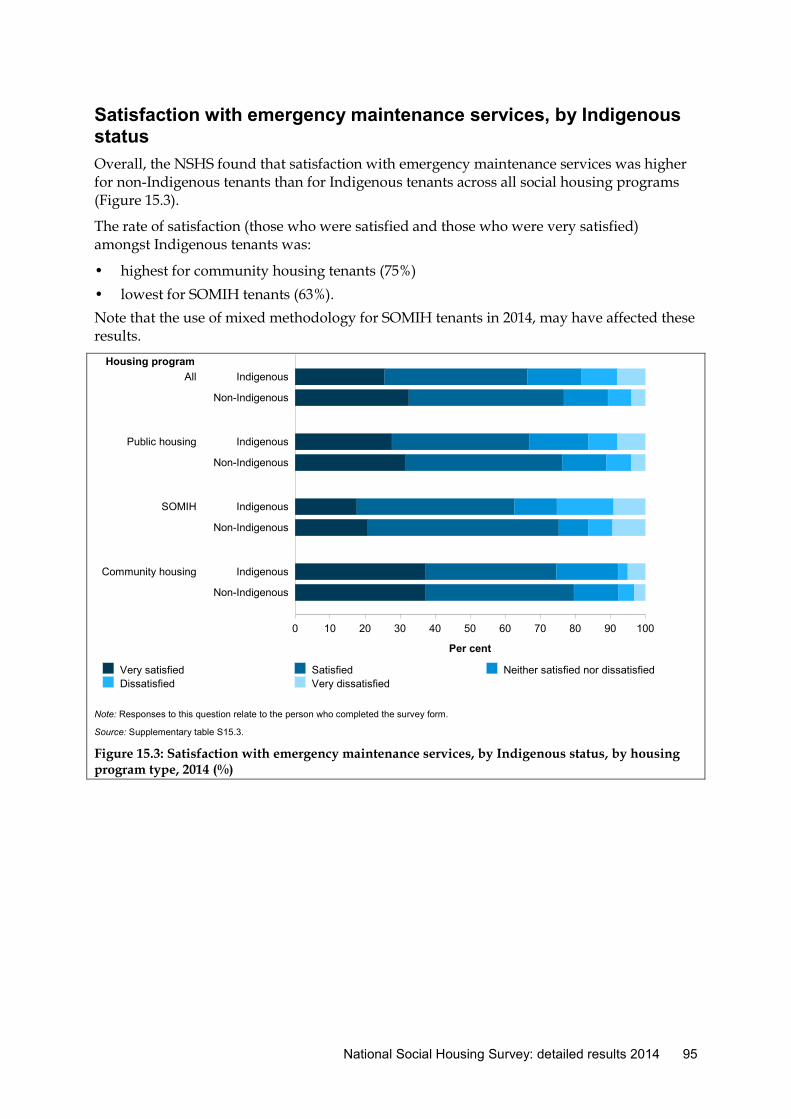
National Social Housing Survey: detailed results 2014 95
Satisfaction with emergency maintenance services, by Indigenous status Overall, the NSHS found that satisfaction with emergency maintenance services was higher for non-Indigenous tenants than for Indigenous tenants across all social housing programs (Figure 15.3).
The rate of satisfaction (those who were satisfied and those who were very satisfied) amongst Indigenous tenants was:
• highest for community housing tenants (75%) • lowest for SOMIH tenants (63%). Note that the use of mixed methodology for SOMIH tenants in 2014, may have affected these results.
Note: Responses to this question relate to the person who completed the survey form.
Source: Supplementary table S15.3.
Figure 15.3: Satisfaction with emergency maintenance services, by Indigenous status, by housing program type, 2014 (%)
Very satisfied Satisfied Neither satisfied nor dissatisfiedDissatisfied Very dissatisfied
Community housing
SOMIH
Public housing
All
Non-Indigenous
Indigenous
Non-Indigenous
Indigenous
Non-Indigenous
Indigenous
Non-Indigenous
Indigenous
Per cent
0 10 20 30 40 50 60 70 80 90 100
Housing program

96 National Social Housing Survey: detailed results 2014
Satisfaction with emergency maintenance services, by previous homelessness Satisfaction with emergency maintenance services was lower among tenants who had experienced homelessness in the 5 years prior to the survey compared with those tenants who had not. This trend is consistent across the 3 social housing programs (Figure 15.4).
Consistent with the 2012 NSHS, the 2014 NSHS found that satisfaction with emergency maintenance services was:
• highest for public housing tenants (77%) and community housing tenants (81%) who had not experienced homelessness in the 5 years prior to the survey
• lowest for SOMIH tenants (56%) who had experienced homelessness in the 5 years prior to the survey.
Note: Responses to this question relate to the person who completed the survey form.
Source: Supplementary table S15.4.
Figure 15.4: Satisfaction with emergency maintenance services, by previous homelessness, by housing program type, 2014 (%)
Very satisfied Satisfied Neither satisfied nor dissatisfiedDissatisfied Very dissatisfied
Community housing
SOMIH
Public housing
All
Not homeless in the last 5 years
Homeless in the last 5 years
Not homeless in the last 5 years
Homeless in the last 5 years
Not homeless in the last 5 years
Homeless in the last 5 years
Not homeless in the last 5 years
Homeless in the last 5 years
Per cent
0 10 20 30 40 50 60 70 80 90 100
Housing program

National Social Housing Survey: detailed results 2014 97
Satisfaction with emergency maintenance services, by dwelling condition Satisfaction with emergency maintenance services increased as the dwelling standard increased (Figure 15.5). This finding may reflect the fact that respondents living in dwellings of an ‘acceptable standard’ are less likely to rely on emergency maintenance services compared with tenants living in a dwelling with structural and/or facilities problems.
• Satisfaction with emergency maintenance services was highest among respondents with dwellings that were of an acceptable standard (34% very satisfied and 45% satisfied).
• Satisfaction was also high among tenants whose dwelling structure was of an acceptable standard but their facilities were not (38% very satisfied and 36% satisfied).
• Where facilities were of an acceptable standard but the structure was not, respondents had lower levels of satisfaction with emergency maintenance services (17% very satisfied and 38% satisfied).
• Respondents whose dwellings were of an unacceptable standard had the lowest proportion of tenants who were satisfied with emergency maintenance services (16% very satisfied and 25% satisfied).
As in 2012, the rates of dissatisfaction in 2014 were lower for emergency maintenance services than for day-to-day maintenance services for all 4 types of dwelling condition.
Note: Responses to this question relate to the person who completed the survey form.
Source: Supplementary table S15.5.
Figure 15.5: Satisfaction with emergency maintenance services, by dwelling condition, 2014 (%)
Very satisfied Satisfied Neither satisfied nor dissatisfiedDissatisfied Very dissatisfied
Dwelling is not of acceptable standard
Structure is of an acceptable standard but facilities are not
Facilities are of acceptable standard but structure is not
Dwelling is of an acceptable standard
Per cent
0 10 20 30 40 50 60 70 80 90 100
Dwelling standard

98 National Social Housing Survey: detailed results 2014
Satisfaction with emergency maintenance services, by dwelling utilisation As for day-to-day maintenance, the proportion of tenants satisfied with emergency maintenance services was highest among those who lived in underutilised dwellings, and was lowest among respondents who lived in overcrowded dwellings (Figure 15.6). This may be explained by less strain on the facilities in underutilised houses, which in turn may require less emergency maintenance.
• Across all social housing programs, three-quarters or more of tenants in dwellings of an appropriate size for their households (76%) and in underutilised (79%) dwellings were satisfied with emergency maintenance services.
• Fewer than two-thirds (61%) of tenants in overcrowded dwellings across all social housing programs were satisfied with emergency maintenance services.
Notes 1. Responses to this question relate to the person who completed the survey form.
2. ‘Satisfied’ includes those who reported being ‘satisfied’ or ‘very satisfied’.
Source: Supplementary table S15.6.
Figure 15.6: Satisfaction with emergency maintenance services, by dwelling utilisation, by housing program type, 2014 (%)
OvercrowdedAdequateUnderutilised
0
10
20
30
40
50
60
70
80
90
100
All Public housing SOMIH Community housing
Per cent
Housing program

National Social Housing Survey: detailed results 2014 99
Demographic characteristics of survey respondents related to satisfaction with emergency maintenance services • As with day-to-day maintenance, satisfaction with emergency maintenance services
increased with increasing age. More than 4 in 5 (82%) respondents aged 65 and over reported being satisfied with the emergency maintenance services provided by their housing organisation compared with 66% of those aged 15–24 years.
• 4 in 5 (82%) retired respondents were satisfied with the emergency maintenance services they received from their housing organisation, compared to only 66% of those engaged in part-time study.
100 National Social Housing Survey: detailed results 2014
2.6 Benefits of living in social housing
Benefits of living in social housing, by state and territory Overall a high proportion of all social housing tenants reported that they had benefitted from living in social housing (Table 16.1). Compared to the national average:
• Public housing: – Queensland tenants were more likely to report they ‘felt more settled’ (97%) – Western Australian tenants were more likely to report they ‘felt more able to cope
with life events’ (91%) and ‘enjoy better health’ (86%). • SOMIH:
– Queensland tenants were more likely to report they ‘enjoy better health’ (85%) and were ‘able to manage rent/money better’ (96%)
– South Australian tenants were more likely to report they ‘enjoy better health’ (89%) and ‘have better access to public transport’ (90%)
– Tasmanian tenants were more likely to report they ‘feel more settled’ (99%), ‘feel more able to cope with life events’ (95%), are able to ‘continue living in the area’ (98%), are ‘able to manage rent/money better’ (100%), and ‘have better access to public transport’ (93%)
– New South Wales tenants were less likely to report that they ‘enjoy better health’ (74%) and ‘are able to manage rent/money better’ (88%).
• Community housing: – Queensland tenants were more likely to report they ‘felt more able to cope with life
events’ (93%) – Tasmania tenants were less likely to report they ‘enjoy better health’ (77%) – Australian Capital Territory tenants were less likely to report they ‘enjoy better
health’ (70%), are able to ‘continue living in the area’ (82%), or ‘feel more able to improve their job situation’ (49%).

National Social Housing Survey: detailed results 2014 101
Table 16.1: Benefits of living in social housing, by state and territory, by housing program type, 2014 (%)
Benefit NSW
(%) Vic (%)
Qld (%)
WA (%)
SA (%) Tas (%)
ACT (%)
NT (%)
All (%)
Public housing
Feel more settled 94.3 94.1 #97.1 95.7 96.1 96.1 92.4 94.5 95.0
Enjoy better health 79.9 80.6 83.7 #86.0 80.2 77.6 80.4 83.0 81.2
Feel more able to cope with life events 86.8 88.8 89.4 #91.4 89.0 86.6 86.8 87.8 88.3
Feel part of the local community 81.5 81.1 82.8 83.8 81.6 81.3 82.1 83.6 81.9
Able to continue living in this area 91.0 92.8 92.7 91.6 90.4 90.1 92.5 92.1 91.7
Able to manage rent/money better 95.7 94.1 96.2 96.1 94.6 95.3 95.1 95.7 95.3
Feel more able to improve job situation 60.2 61.2 65.9 66.3 57.0 65.0 62.9 63.4 61.7
Feel more able to start or continue education/training 66.6 68.7 74.5 69.1 61.4 66.3 69.6 69.7 68.1
Have better access to services 87.3 86.6 88.3 87.4 86.7 85.4 89.2 86.8 87.2
Have better access to public transport 88.4 86.3 86.3 84.1 86.6 84.3 88.2 87.1 86.9
Other 82.6 77.5 87.5 88.0 81.8 75.8 79.5 79.6 82.4
SOMIH
Feel more settled 90.2 — 92.9 — 94.7 #98.5 — — 92.0
Enjoy better health #74.0 — #84.9 — #89.3 81.6 — — 80.2
Feel more able to cope with life events 84.5 — 88.5 — 91.1 #94.5 — — 87.1
Feel part of the local community 84.5 — 87.2 — 86.1 91.6 — — 85.8
Able to continue living in this area 90.6 — 92.2 — 93.5 #98.3 — — 91.8
Able to manage rent/money better #88.4 — #95.6 — 93.1 #100.0 — — 91.9
Feel more able to improve job situation 78.4 — 82.4 — 77.8 76.4 — — 79.6
Feel more able to start or continue education/training 82.7 — 87.4 — 74.6 86.9 — — 83.1
Have better access to services 86.1 — 88.3 — 89.5 91.7 — — 87.5
Have better access to public transport 82.3 — 80.3 — #90.1 #93.0 — — 83.1
Other 82.7 — *#31.9 — #92.9 #100.0 — — 70.8
Community housing
Feel more settled 93.6 95.1 92.6 95.5 95.5 93.7 89.6 — 93.9
Enjoy better health 84.6 81.0 85.2 83.9 81.6 #76.9 #70.4 — 83.5
Feel more able to cope with life events 88.6 86.5 #92.6 86.5 89.4 85.0 87.2 — 88.7
Feel part of the local community 84.2 82.4 85.1 85.5 84.1 82.8 79.2 — 84.1
Able to continue living in this area 92.5 91.9 94.2 93.2 93.4 88.4 #81.6 — 92.6
Able to manage rent/money better 93.4 92.3 95.4 93.1 95.6 92.9 90.5 — 93.7
Feel more able to improve job situation 64.5 65.3 71.9 66.5 69.2 69.7 #48.9 — 66.5
Feel more able to start or continue education/training 75.2 70.9 75.5 67.5 78.3 67.6 64.4 — 73.8
Have better access to services 85.3 84.4 83.9 83.0 84.3 86.7 86.3 — 84.7
Have better access to public transport 83.3 78.6 83.8 80.7 85.4 86.4 81.6 — 82.7
Other 84.8 80.2 84.3 81.0 86.3 83.9 76.5 — 83.6 Notes 1. Responses to this question relate to the individual who completed the survey form. 2. Respondents were allowed to select more than 1 response. 3. Options for responses to questions regarding perceived benefits are different in 2014 NSHS compared with 2012 NSHS.

102 National Social Housing Survey: detailed results 2014
Benefits of living in social housing, by location (remoteness) A high proportion of social housing tenants in all areas of remoteness reported that they had benefitted from living in social housing (Table 16.2). Compared to the national average:
• households in Major cities were significantly more likely to feel that they ‘have better access to services’ (88%) and ‘have better access to public transport’ (89%)
• households in Inner regional areas were less likely than the national average to ‘feel more able to improve their job situation’ (58%), ‘have better access to services’ (84%), and ‘have better access to public transport’ (80%)
• households located in Outer regional areas were more likely than the national average to ‘feel part of the local community’ (86%) and less likely to ‘have better access to public transport’ (79%)
• households in Remote areas were more likely than the national average to ‘enjoy better health’ (88%), ‘feel more able to cope with life events’ (93%) and ‘feel part of the local community (89%), and less likely to ‘have better access to public transport’ (60%).
Table 16.2: Self-reported benefits gained by living in social housing by location (remoteness), 2014 (%)
Benefit
Major cities
(%)
Inner regional
(%)
Outer regional
(%) Remote
(%) All
(%)
Feel more settled 94.6 95.0 95.4 94.1 94.8
Enjoy better health 81.1 82.3 81.6 #87.5 81.5
Feel more able to cope with life events 88.3 87.8 88.7 #92.8 88.3
Feel part of the local community 82.1 80.9 #85.9 #88.8 82.4
Able to continue living in this area 91.9 91.5 92.2 90.5 91.8
Able to manage rent/money better 95.1 95.2 93.8 94.0 95.0
Feel more able to improve job situation 64.3 #58.0 65.0 70.4 63.3
Feel more able to start or continue education/training 70.1 68.8 67.9 68.9 69.6
Have better access to services #88.4 #83.6 83.6 83.8 86.9
Have better access to public transport #89.1 #80.2 #79.3 #60.3 86.2
Other 84.4 79.0 75.2 73.6 82.4
Notes
1. Responses to this question relate to the person in the household who completed the survey form.
2. Respondents were allowed to select more than 1 response.
3. 'Remote' includes 'remote' and 'very remote' classifications.
4. Options for responses to questions regarding perceived benefits are different in 2014 NSHS compared with 2012 NSHS.
Benefits of living in social housing, by Indigenous status The most common benefits of social housing reported by Indigenous tenants were consistent across all social housing programs (Table 16.3).
• Indigenous tenants in public housing consistently rated the benefits of living in social housing lower than non-Indigenous tenants.
• In comparison, Indigenous tenants in community housing rated 6 out of 10 benefits of living in social housing higher than their non-Indigenous counterparts.

National Social Housing Survey: detailed results 2014 103
Table 16.3: Self-reported benefits gained by tenants living in social housing by Indigenous status, by housing program type, 2014 (%)
Public housing (%) SOMIH (%) Community Housing (%) All (%)
Benefit Indigenous Non-
Indigenous Indigenous Non-
Indigenous Indigenous Non-
Indigenous Indigenous Non-
Indigenous
Feel more settled 93.2 95.2 92.3 88.7 93.2 94.3 92.9 95.0
Enjoy better health 77.7 80.2 80.9 72.3 86.9 82.9 79.8 80.6
Feel more able to cope with life events 84.3 88.2 87.5 83.0 86.3 89.3 85.6 88.4
Feel part of the local community 80.8 81.1 86.8 77.8 85.9 83.8 83.5 81.5
Able to continue living in this area 81.4 92.1 92.0 91.0 87.7 93.2 85.7 92.2
Able to manage rent/money better 89.9 95.4 92.3 87.9 91.0 94.1 90.8 95.2
Feel more able to improve job situation 58.0 61.6 80.3 71.7 72.0 66.9 66.9 62.6
Feel more able to start or continue education/training 64.6 67.2 83.0 81.7 78.1 74.7 71.7 68.6
Have better access to services 83.7 87.2 87.7 85.6 87.5 84.1 85.5 86.7
Have better access to public transport 82.6 86.5 84.1 75.3 82.4 81.9 83.1 85.8
Other 71.7 85.6 72.5 **n.p. 80.5 85.7 72.5 85.6
Notes
1. Responses to this question relate to the person in the household who completed the survey form.
2. Respondents were allowed to select more than 1 response.
3. Options for responses to questions regarding perceived benefits are different in 2014 NSHS compared to 2012 NSHS.

104 National Social Housing Survey: detailed results 2014
Benefits of living in social housing, by previous homelessness Across all social housing programs there was little difference between the self-reported benefits of social housing by tenants with previous experiences of homelessness. There were, however, some differences evident across the various social housing programs (Table 16.4).
A larger proportion of public housing tenants who had been homeless in the past 5 years:
• ‘feel more able to improve their job situation’ (69% compared with 60% of those who had not been homeless)
• ‘feel more able to start or continue education/training’ (79% compared with 65%). SOMIH tenants who had been homeless in the past 5 years were more likely to:
• report they ‘enjoy better health’ (84% compared with 80% of those who had not been homeless)
• ‘feel more able to cope with life events’ (90% compared to 87%). Community housing tenants who had been homeless in the past 5 years were more likely to:
• ‘feel more able to improve their job situation’ (70% compared with 65% of those who had not been homeless)
• ‘feel more able to start or continue education/training’ (77% compared with 73%).

National Social Housing Survey: detailed results 2014 105
Table 16.4: Self-reported benefits gained by tenants who have experienced homelessness prior to living in social housing, by housing program type, 2014 (%)
Public housing (%) SOMIH (%) Community housing All (%)
Benefit
Homeless in the last
5 years
Not homeless in the last
5 years
Homeless in the last
5 years
Not homeless in the last
5 years
Homeless in the last
5 years
Not homeless in the last
5 years
Homeless in the last
5 years
Not homeless in the last
5 years
Feel more settled 94.6 95.1 92.3 92.0 91.9 94.4 94.0 94.9
Enjoy better health 83.6 80.8 84.0 79.7 84.0 83.4 83.7 81.1
Feel more able to cope with life events 89.2 88.1 90.2 86.7 88.6 88.8 89.1 88.2
Feel part of the local community 75.3 83.0 78.7 86.7 78.8 85.4 76.1 83.4
Able to continue living in this area 82.5 93.0 86.5 92.4 89.5 93.3 87.0 87.2
Able to manage rent/money better 93.5 95.6 88.5 92.4 92.3 94.1 93.1 95.3
Feel more able to improve job situation 69.3 59.7 80.9 79.4 69.7 65.2 69.7 61.4
Feel more able to start or continue education/training 78.8 65.1 82.5 83.2 76.6 72.7 78.4 67.1
Have better access to services 82.6 87.9 80.7 88.3 84.9 84.6 83.1 87.5
Have better access to public transport 83.1 87.5 78.2 83.7 82.0 82.9 82.8 86.8
Other 79.9 82.9 *54.2 73.3 76.6 85.9 79.1 83.3
Notes
1. Responses to this question relate to the person in the household who completed the survey form.
2. Respondents were allowed to select more than 1 response.
3. Options for responses to questions regarding perceived benefits are different in 2014 NSHS compared with 2012 NSHS.

106 National Social Housing Survey: detailed results 2014
2.7 Dwelling standard
Dwelling standard, by state and territory Community housing, both nationally and across each of the jurisdictions, had the highest proportion of tenants (4 in 5) rating their dwelling as being of an acceptable standard, (Table 17.1).
Compared with the national average (81% for PH, 70% for SOMIH and 89% for CH), the highest proportions of tenants in a dwelling of an acceptable standard were in:
• Queensland public housing (88%)
• Queensland SOMIH (80%)
• Queensland (94%) and Western Australian (94%) community housing.
Compared to the national average, the lowest proportion of tenants living in a dwelling of an acceptable standard were located in:
• New South Wales and the Australian Capital Territory public housing (76%)
• South Australian SOMIH (61%)
• Tasmanian community housing (81%).
It is important to note the different methodology used across SOMIH jurisdictions. SOMIH tenants in both New South Wales and Queensland were surveyed face-to-face while those in South Australia and Tasmania were surveyed via mail-out and this change in methodology may have impacted upon the results.
Overall, social housing tenants were more likely to report that the facilities in their dwelling were of an acceptable standard but that the structure was not, compared to the reverse.
• Public housing tenants from New South Wales (20%) and the Australian Capital Territory (21%) were more likely than the national average to report their dwelling currently had facilities of an acceptable standard yet was of an unacceptable structure while tenants in Queensland were less likely to do so (11%).
• Just over a quarter (28%) of SOMIH tenants were more likely to report their dwelling had facilities of an acceptable standard than the national average yet the structure was not, ranging from 19% in Queensland to 34% in New South Wales.
• Fewer than 1 in 10 (8%) community housing tenants were more likely than the national average to report their dwelling had facilities of an acceptable standard but an unacceptable structure, ranging from 3% in Queensland to 15% in Tasmania.

National Social Housing Survey: detailed results 2014 107
Table 17.1: Dwelling condition in social housing, by state and territory, by housing program type, 2014 (%)
Dwelling condition NSW (%)
Vic (%)
Qld (%)
WA (%)
SA (%)
Tas (%)
ACT (%)
NT (%)
All (%)
Public housing
Dwelling is of an acceptable standard #75.9 83.1 #88.3 81.9 84.0 80.6 #75.7 81.7 81.0
Facilities are of an acceptable standard but structure is not #20.2 13.4 #10.6 15.4 13.0 17.1 #20.6 15.0 15.9
Structure is of an acceptable standard but facilities are not 2.8 *2.1 *#1.1 *2.0 *2.6 *1.7 *2.7 *2.4 2.2
Dwelling is not of an acceptable standard 1.2 *1.3 — *0.7 **n.p. **n.p. *1.0 *0.8 0.8
SOMIH
Dwelling is of an acceptable standard 65.5 — #80.3 — #61.4 75.6 — — 70.1
Facilities are of an acceptable standard but structure is not #33.5 — #18.9 — 33.2 21.8 — — 28.2
Structure is of an acceptable standard but facilities are not *0.8 — *0.8 — *1.7 **n.p. — — *1.0
Dwelling is not of an acceptable standard **n.p. — — — *#3.7 — — — *0.7
Community Housing
Dwelling is of an acceptable standard 87.9 87.7 #93.8 #94.4 86.4 #80.5 87.6 — 89.3
Facilities are of an acceptable standard but structure is not 8.6 8.7 *#3.3 *#3.8 #12.1 #15.4 *9.1 — 7.6
Structure is of an acceptable standard but facilities are not 2.5 *2.4 *2.8 *1.5 *1.5 *3.0 **n.p. — 2.4
Dwelling is not of an acceptable standard *1.0 *1.2 — **n.p. — **n.p. **n.p. — 0.7
Notes
1. Responses to this question relate to the person in the household who completed the survey form.
2. A house is assessed as being of an acceptable standard if it has at least 4 working facilities and not more than 2 major structural problems.
3. Structural problems include: rising damp; major cracks in walls/floors; sinking/moving foundations; sagging floors; walls/windows out of the
plumb; wood rot/termite damage; major electrical problems; major plumbing problems; major roof defects; other structural problems.
4. Facilities listed include: stove/oven/other cooking facilities; fridge; toilet; bath or shower; washing machine; kitchen sink; and laundry tub.

108 National Social Housing Survey: detailed results 2014
Dwelling standard, by location (remoteness) Across all social housing programs and all degrees of remoteness, the 2014 NSHS found that two-thirds or more of tenants rated their dwelling as being of an acceptable standard (Table 17.2). This represents an improvement in all remoteness areas for each program.
• For public housing, a lower proportion (75%) of dwellings in Remote areas were rated as being of an acceptable standard compared with ratings for dwellings in other areas. Remote areas also had the highest proportion of dwellings with facilities that were of an acceptable standard while the structure was unacceptable (21%).
• For SOMIH, Major cities had the lowest proportion of dwellings rated as being of an acceptable standard (66% as compared with 56% in 2012). Remote areas had the highest proportion of acceptable standard dwellings in the program (75%).
• For community housing, dwellings in Remote areas were highly likely to be of an acceptable standard (98%). Other remoteness regions also had high rates (between 88% and 92%) of acceptable standard dwellings. Dwellings in Inner regional areas had the highest proportion of dwellings with facilities rated as being of an acceptable standard while the structure was unacceptable (9%), closely followed by dwellings in Major cities (8%).
Table 17.2: Dwelling condition in social housing, by location (remoteness), by housing program type, 2014 (%)
Dwelling condition
Major cities (%)
Inner regional
(%)
Outer regional
(%) Remote
(%) All (%)
Public housing
Dwelling is of an acceptable standard 80.6 80.7 #86.0 #74.9 81.0
Facilities are of acceptable standard but structure is not 16.2 16.7 #10.9 #21.0 15.9
Structure is of an acceptable standard but facilities are not 2.3 1.8 *2.4 *3.3 2.2
Dwelling is not of acceptable standard 0.9 *0.8 **n.p. **n.p. 0.8
SOMIH
Dwelling is of an acceptable standard 66.2 71.7 70.8 74.6 70.1
Facilities are of acceptable standard but structure is not 31.1 27.3 28.1 23.5 28.2
Structure is of an acceptable standard but facilities are not *1.2 **n.p. **n.p. *1.9 *1.0
Dwelling is not of acceptable standard *1.5 — **n.p. — *0.7
Community Housing
Dwelling is of an acceptable standard 88.4 89.2 91.9 #97.9 89.3
Facilities are of acceptable standard but structure is not 8.0 8.7 *4.7 **n.p. 7.6
Structure is of an acceptable standard but facilities are not 2.8 *1.7 *2.5 **n.p. 2.4
Dwelling is not of acceptable standard *0.9 **n.p. **n.p. — 0.7
Note: Responses to this question relate to the person in the household who completed the survey form.

National Social Housing Survey: detailed results 2014 109
Dwelling standard, by Indigenous status The 2014 NSHS found that Indigenous respondents in all forms of social housing were less likely than non-Indigenous respondents to rate their dwellings as being of an acceptable standard (69% Indigenous tenants compared with 84% non-Indigenous tenants) (Table 17.3).
Two-thirds or more of Indigenous tenants across all social housing programs were living in dwellings of an acceptable standard:
• 66% in public housing • 70% in SOMIH • 84% in community housing.
Table 17.3: Dwelling condition in social housing, by Indigenous status, by housing program type, 2014 (%)
Dwelling condition Indigenous
(%) Non-Indigenous
(%)
Public housing
Dwelling is of an acceptable standard 66.1 82.9
Facilities are of an acceptable standard but structure is not 28.0 15.0
Structure is of an acceptable standard but facilities are not *2.7 1.6
Dwelling is not of acceptable standard *3.2 0.5
SOMIH
Dwelling is of an acceptable standard 70.0 75.4
Facilities are of an acceptable standard but structure is not 28.2 24.6
Structure is of an acceptable standard but facilities are not *1.0 —
Dwelling is not of acceptable standard *0.8 —
Community housing
Dwelling is of an acceptable standard 83.9 91.0
Facilities are of an acceptable standard but structure is not *11.1 6.9
Structure is of an acceptable standard but facilities are not *3.2 1.6
Dwelling is not of acceptable standard **n.p. *0.5
All
Dwelling is of an acceptable standard 69.3 84.1
Facilities are of an acceptable standard but structure is not 26.3 13.8
Structure is of an acceptable standard but facilities are not 2.2 1.6
Dwelling is not of acceptable standard *2.3 0.5
Note: Responses to this question relate to the person in the household who completed the survey form.

110 National Social Housing Survey: detailed results 2014
Dwelling standard, by prior homelessness Overall, the NSHS found little difference in tenants’ perceptions of their dwelling condition, between those who had experienced homelessness in the 5 years prior to the survey and those who had not (Table 17.4). The exception was for community housing tenants, with those experiencing homelessness less likely to report that their dwelling was of an acceptable standard (84% compared with 91%).
• Overall, more than three-quarters (79%) of social housing tenants who had been homeless in the 5 years prior to the survey reported that their current dwelling was of an acceptable standard, compared with 82% of those who had not been homeless.
• Among tenants who experienced homelessness in the 5 years prior to the survey: – those in community housing were the most likely to report their dwelling was of an
acceptable standard (84%) and less likely to report that the facilities were of an acceptable standard while the dwelling structure was not (11%), compared with both public housing and SOMIH tenants
– SOMIH tenants were the least likely to report their dwelling was of an acceptable standard (67%) and most likely to report that the facilities were of an acceptable standard while the dwelling structure was not (31%).
Table 17.4: Dwelling condition in social housing, for those who had been homeless in the last 5 years, by housing program type, 2014 (%)
Dwelling condition Homeless in the last
5 years (%) Have not been homeless
in the last 5 years (%)
Public housing
Dwelling is of an acceptable standard 78.4 81.4
Facilities are of an acceptable standard but structure is not 17.5 15.7
Structure is of an acceptable standard but facilities are not 2.4 2.2
Dwelling is not of acceptable standard *1.6 0.7
SOMIH
Dwelling is of an acceptable standard 66.7 70.5
Facilities are of an acceptable standard but structure is not 30.6 28.0
Structure is of an acceptable standard but facilities are not **n.p. *0.9
Dwelling is not of acceptable standard **n.p. *0.7
Community housing
Dwelling is of an acceptable standard 83.9 90.5
Facilities are of an acceptable standard but structure is not 11.0 6.9
Structure is of an acceptable standard but facilities are not *3.4 2.2
Dwelling is not of acceptable standard *1.7 *0.5
All
Dwelling is of an acceptable standard 79.2 82.3
Facilities are of an acceptable standard but structure is not 16.5 14.8
Structure is of an acceptable standard but facilities are not 2.6 2.2
Dwelling is not of acceptable standard *1.6 0.7
Note: Responses to this question relate to the person in the household who completed the survey form.

National Social Housing Survey: detailed results 2014 111
Demographic characteristics of survey respondents related to dwelling standard • Over four-fifths (83%) of those aged 55–64 and 89% of those aged 65 and over reported
living in dwellings of an acceptable standard, compared with 70% of those aged 35–44 and 71% of those aged 25–34.
• 9 in 10 (90%) of retired respondents reported living in a dwelling of an acceptable standard compared with 7 in 10 (70%) of full-time parents or carers.

112 National Social Housing Survey: detailed results 2014
2.8 Dwelling utilisation
Dwelling utilisation, by state and territory Overall, the vast majority of dwellings, across all social housing programs and all states and territories, were considered to be either of an appropriate size for the household or underutilised (Table 18.1). Social housing dwellings classified as being of an appropriate size for the household were more likely to be in:
• Western Australia (80%) and the Northern Territory (80%) for public housing
• Queensland (89%) for community housing.
Social housing dwellings classified as adequate were less likely to be located in:
• South Australia (68%) and the Australian Capital Territory (70%) for public housing • South Australia (63%) and Tasmania (77%) for community housing. Underutilisation was lower than the national average in:
• Queensland (17%), Western Australia (16%) and the Northern Territory (13%) for public housing
• Queensland (12%) for SOMIH • Queensland (7%) for community housing. Overcrowding was highest in Queensland’s SOMIH program (30%).
Table 18.1: Dwelling utilisation, by state and territory, by housing program type, 2014 (%)
Dwelling utilisation NSW
(%) Vic (%)
Qld (%)
WA (%)
SA (%)
Tas (%)
ACT (%)
NT (%)
All (%)
Public housing
Overcrowded 4.0 6.4 5.6 3.9 *#1.7 4.5 5.2 #7.3 4.5
Adequate 75.2 74.4 77.4 #80.2 #68.4 74.8 #69.9 #79.8 74.9
Underutilised 20.8 19.2 #17.1 #15.9 #29.8 20.7 #24.9 #13.0 20.6
SOMIH
Overcrowded 16.8 — #29.9 — #9.4 **n.p.# — — 19.5
Adequate 63.3 — 58.1 — 57.1 61.6 — — 60.5
Underutilised 19.9 — #12.0 — 33.5# 34.6# — — 20.0
Community housing
Overcrowded 3.1 5.8 *3.4 *1.7 *3.7 *4.8 **n.p — 3.5
Adequate 84.7 79.7 #89.4 84.8 #63.1 #76.8 80.4 — 83.0
Underutilised 12.2 14.5 #7.2 13.5 #33.2 #18.4 18.8 — 13.6
Note: Responses to this question relate to the person in the household who completed the survey form.

National Social Housing Survey: detailed results 2014 113
Dwelling utilisation, by location (remoteness) Dwelling utilisation varied across the remoteness areas with the level of overcrowding increasing as the degree of remoteness increased (Table 18.2).
Across all remoteness categories:
• Public housing dwellings were most likely to be rated as being of an appropriate size for the household (75%), while tenants in Regional (70%) and Remote (68%) areas were less likely than the national average to be in dwellings classed as adequately utilised. Public housing tenants in Remote areas were more likely to be in dwellings rated as overcrowded (8%) than the national average (4%).
• Compared with the national average (19%), SOMIH tenants in Remote areas were more likely to be in dwellings classed as overcrowded (28%).
• Community housing dwellings were more likely to be of an appropriate size for the households in all remoteness areas, compared with the other social housing programs.
Table 18.2: Dwelling utilisation, by location (remoteness), by housing program type, 2014 (%)
Dwelling utilisation Major cities (%) Inner regional (%) Outer regional (%) Remote (%) All (%)
Public housing
Overcrowded 4.5 3.2 3.8 #8.0 4.3
Adequate 76.3 72.9 #69.7 #68.2 74.9
Underutilised #19.1 #23.8 #26.6 23.8 20.8
SOMIH
Overcrowded 16.2 16.2 22.6 #27.6 19.4
Adequate 63.6 63.0 55.6 56.5 60.5
Underutilised 20.2 20.8 21.8 15.9 20.1
Community housing
Overcrowded 4.1 2.5 *2.2 **n.p. 3.4
Adequate 83.5 81.6 81.5 75.4 82.5
Underutilised 12.3 15.9 16.3 *21.2 14.1
Note: Responses to this question relate to the person in the household who completed the survey form.

114 National Social Housing Survey: detailed results 2014
Dwelling utilisation, by Indigenous status Overall, the rate of overcrowding was higher in Indigenous households (14%) than in non-Indigenous households (4%) (Table 18.3).
Across the social housing programs:
• Indigenous tenants in public housing were more likely to be in overcrowded dwellings than non-Indigenous tenants (12% compared with 4%)
• Indigenous tenants in community housing were also more likely to be in overcrowded dwellings than non-Indigenous tenants (6% compared with 3%)
• There was little difference for SOMIH tenants in terms of dwelling utilisation.
Table 18.3: Dwelling utilisation, by Indigenous status, by housing program type, 2014 (%)
Dwelling utilisation Indigenous (%) Non-Indigenous (%)
Public housing
Overcrowded 12.3 3.8
Adequate 67.5 76.8
Underutilised 20.2 19.4
Community housing
Overcrowded *6.3 3.1
Adequate 81.4 84.1
Underutilised *12.3 12.8
SOMIH
Overcrowded 19.3 19.5
Adequate 60.5 61.1
Underutilised 20.2 19.4
All
Overcrowded 14.0 3.7
Adequate 66.6 77.9
Underutilised 19.4 18.4
Note: Responses to this question relate to the person in the household who completed
the survey form.

National Social Housing Survey: detailed results 2014 115
Demographic characteristics of survey respondents related to dwelling utilisation • 79% of respondents aged 65 and over reported living in dwellings of an appropriate size
for the households. Almost one-quarter (24%) of respondents aged 55–64 reported living in underutilised dwellings. Younger respondents were more likely to report living in overcrowded dwellings (19% of those aged 15–19).
• Four in 5 respondents engaged in voluntary work (80%) or retired (79%) reported living in dwellings of an appropriate size for their households. Almost one-third (30%) of respondents employed full-time reported living in underutilised dwellings, while 14% of full-time parents or carers reported living in overcrowded dwellings.
• 82% of respondents who lived in a house composed of a group of unrelated adults reported living in dwellings of an appropriate size for these households. Almost half (49%) of respondents living with extended family, including 1 or more children, reported living in overcrowded dwellings. In comparison, 43% of couples living without children reported living in underutilised dwellings.

116 National Social Housing Survey: detailed results 2014
2.9 Use of support services
Use of support services, by state and territory The most commonly accessed community and health services in the past 12 months, across all social housing programs, were health/medical services and mental health services.
Public housing tenants across all jurisdictions most commonly accessed (Table 19.1):
• health/medical services (65%) • mental health services (19%). More than one-third (36%) of public housing tenants did not access any of the community or health services listed, ranging from 24% in Queensland to 37% in the Australian Capital Territory.
Table 19.1: Proportion of public housing households using community and health services in the past 12 months, by state and territory, 2014 (%)
Service NSW
(%) Vic (%)
Qld (%)
WA (%)
SA (%)
Tas (%)
ACT (%)
NT (%)
All (%)
Drugs and alcohol counselling 4.2 4.7 4.1 4.1 3.8 3.9 4.4 *3.0 4.2
Mental health services 19.9 22.0 20.0 #15.6 #15.2 16.1 #14.9 #12.9 19.0
Health/medical services #62.3 65.9 68.8 66.3 67.2 67.8 #56.9 62.1 65.0
Life skills/ personal development services 5.1 6.7 7.3 6.2 5.4 #3.7 7.1 6.1 5.9
Aged care 8.5 7.4 8.0 #11.8 8.1 8.7 #5.3 #12.0 8.4
Information, advice and referral services #10.7 #15.4 11.7 12.8 11.3 12.0 12.5 10.0 12.2
Day-to-day living support services 9.4 12.4 8.6 12.7 7.8 11.0 7.9 10.1 10.0
Residential care and supported accommodation services 2.9 2.8 *1.5 #4.5 *2.2 *2.1 *2.8 4.5 2.7
Services that provide support for children, family or carers #5.6 6.9 7.8 8.5 7.6 8.3 7.8 7.2 6.9
Training and employment support services #7.2 10.3 10.2 7.5 8.2 8.5 8.2 9.6 8.5
Financial and material assistance #6.6 #10.6 6.1 8.9 6.7 7.7 9.0 5.8 7.7
Other support services 7.9 9.7 8.4 9.3 6.8 6.6 8.1 #5.3 8.3
None of the above #30.4 26.6 #23.9 27.2 26.1 24.8 #36.8 30.1 27.9
Notes
1. Responses to this question relate to the person in the household who completed the survey form.
2. The category 'mental health services 'includes the following services which were listed separately in the 2012 NSHS: 'Psychological
services', 'Psychiatric services' and 'mental health services'.
3. Respondents could select more than 1 option.

National Social Housing Survey: detailed results 2014 117
SOMIH tenants across all states and territories most commonly accessed (Table 19.2):
• health/medical services (80%) • training and employment services (13%) • mental health services (13%). Compared with the national average (80%), SOMIH tenants surveyed via face-to-face methodology were more likely to report accessing health/medical services (85% in New South Wales and 86% Queensland), while those participating through a mail-out survey were less likely to access health/medical services (60% in South Australia and 49% in Tasmania). This may be a result of face-to-face interviews eliciting more comprehensive responses from respondents compared with those who are filling in a form without the benefit of interpretation and clarification.
There was also a large variation, associated with the methodology used, in the proportion of SOMIH tenants who did not access any of the services listed—with those surveyed via face-to-face interview significantly less likely than the national average (14%) to report that they did not access any of the services listed (11% in New South Wales and 10% in Queensland) compared with those approached via mail-out survey (28% in South Australia and 37% in Tasmania).
Table 19.2: Proportion of SOMIH households using community and health services in the past 12 months, by state and territory, 2014 (%)
Service NSW
(%) Qld (%)
SA (%)
Tas (%)
All (%)
Drugs and alcohol counselling 4.4 3.2 6.5 *6.3 4.4
Mental health services 13.5 #9.0 #18.7 *15.2 13.0
Health/medical services #84.5 #85.9
#60.1 #49.3 79.6
Life skills/ personal development services 5.0 *#1.2 #7.6 **n.p. 4.1
Aged care 4.0 *#2.8 #16.1 *11.4 6.0
Information, advice and referral services 4.0 *#2.0 #15.8 *10.1 5.6
Day-to-day living support services 9.7 #5.6 11.0 **n.p. 8.4
Residential care and supported accommodation services *1.8 *#2.8 *5.0 **2.5 2.7
Services that provide support for children, family or carers 8.6 #4.0 #14.9 **n.p. 8.0
Training and employment support services 9.9 14.0 #20.3 *#6.3 13.0
Financial and material assistance 6.1 #3.8 #11.6 *5.0 6.3
Other support services 7.0 6.8 #13.2 **n.p. 7.9
None of the above #10.5 #9.9 #28.2 #36.7 14.2
Notes
1. Responses to this question relate to the person in the household who completed the survey form.
2. The category 'mental health services 'includes the following services which were listed separately in the 2014 NSHS: 'Psychological
services', 'Psychiatric services' and 'Mental health services'.
3. Respondents could select more than 1 option.

118 National Social Housing Survey: detailed results 2014
Consistent with both public housing and SOMIH tenants, community housing tenants across all states and territories most commonly accessed (Table 19.3):
• health/medical services (64%) • mental health services (20%) • information, advice and referral services (15%). Around 27% of community housing tenants did not access any services, ranging from 22% in Tasmania to 32% in the Australian Capital Territory.
Table 19.3: Proportion of community housing households using community and health services in the past 12 months, by state and territory, 2014 (%)
Service NSW
(%) Vic (%)
Qld (%)
WA (%) SA (%)
Tas (%)
ACT (%) All (%)
Drugs and alcohol counselling 5.5 5.0 4.7 6.3 *4.0 *3.5 *7.9 5.2
Mental health services 19.2 22.9 21.3 16.6 23.0 #26.2 24.1 20.4
Health/medical services 62.5 66.6 66.0 63.0 69.5 66.8 57.9 64.4
Life skills/ personal development services 7.1 10.3 9.1 8.7 10.1 #16.8 13.8 8.7
Aged care 6.8 #5.3 #14.1 10.2 5.8 6.3 *8.1 8.2
Information, advice and referral services 13.5 18.3 16.8 11.8 18.1 #20.3 18.6 15.2
Day-to-day living support services #10.0 13.5 #17.6 14.0 #8.6 #19.9 #21.7 12.6
Residential care and supported accommodation services #4.9 7.8 8.5 8.8 5.5 #22.0 #20.1 7.2
Services that provide support for children, family or carers 5.9 5.8 6.0 6.9 8.6 9.4 *5.7 6.3
Training and employment support services 8.1 #14.7 8.9 7.2 10.6 10.8 13.8 9.4
Financial and material assistance 7.4 #13.6 9.2 10.6 10.9 11.5 *10.5 9.3
Other support services 7.9 9.2 11.7 8.9 11.5 #15.4 15.2 9.4
None of the above 30.8 23.9 24.0 27.6 23.4 #22.1 31.6 27.5
Notes
1. Responses to this question relate to the person in the household who completed the survey form.
2. The category 'mental health services' includes the following services which were listed separately in the 2014 NSHS: 'Psychological
services', 'Psychiatric services' and 'Mental health services'.
3. Respondents could select more than 1 option.

National Social Housing Survey: detailed results 2014 119
Use of support services, by location (remoteness) Access to community and health services was similar in public housing across all remoteness categories, but differed in the other 2 social housing programs.
The proportion of tenants not accessing any community or health services increased with increasing remoteness (tables 19.4, 19.5 and 19.6).
The most commonly accessed community or health services were:
• health/medical services—all locations for all social housing tenants • mental health services—all locations for all social housing tenants. While a substantial proportion of social housing tenants did not access any of the community or health services listed in 2014, the proportion not accessing any services has decreased since 2012 (when these services were accessed by around one-third of all social housing tenants). The proportion of tenants not accessing any of the listed community and health services in 2014 ranged from:
• 25% of public housing tenants in Outer regional areas to 30% in Remote areas • 10% of SOMIH tenants in Outer regional areas to 20% in Remote areas • 25% of community housing tenants in Inner Regional to 31% in Remote areas.
Table 19.4: Community and health services accessed by public housing tenants in the past 12 months, by location (remoteness), 2014 (%)
Services Major cities
(%)
Inner regional
(%)
Outer regional
(%) Remote
(%) All (%)
Drugs and alcohol counselling 4.1 4.4 4.2 6.8 4.2
Mental health services 19.6 18.1 17.2 #13.2 19.0
Health/medical services 64.4 66.3 67.4 58.9 65.0
Life skills/personal development services 6.1 5.7 5.3 4.4 5.9
Aged care 7.9 9.1 9.6 11.6 8.4
Information, advice and referral services 12.3 12.0 11.3 12.5 12.2
Day-to-day living support services 9.9 10.5 9.0 12.3 10.0
Services that provide support for children, family or carers 6.7 7.4 6.9 8.4 6.9
Training and employment support services 8.3 9.7 8.0 9.3 8.5
Financial and material assistance 7.8 7.7 6.2 8.8 7.7
Other support services 8.6 8.5 #5.5 7.1 8.3
None of the above 28.6 26.4 25.2 30.2 27.9
Notes
1. Responses to this question relate to the person in the household who completed the survey form.
2. The category 'mental health services' includes the following services which were listed separately in the 2012 NSHS: 'Psychological
services', 'Psychiatric services' and 'Mental health services'.
3. Respondents could select more than 1 option.

120 National Social Housing Survey: detailed results 2014
Table 19.5: Community and health services accessed by SOMIH tenants in the past 12 months, by location (remoteness), 2014 (%)
Services Major cities
(%) Inner
regional (%) Outer
regional (%) Remote (%) All (%)
Drugs and alcohol counselling *3.4 5.3 *3.8 *6.4 4.4
Mental health services #17.0 14.3 9.6 *#6.7 13.0
Health/medical services 79.8 77.9 #86.8 #70.7 79.6
Life skills/personal development services 5.2 5.3 *2.9 **n.p. 4.1
Aged care 5.1 6.1 7.9 *4.5 6.0
Information, advice and referral services 7.4 5.6 4.8 *#2.7 5.6
Day-to day living support services 11.4 7.0 9.6 *#1.9 8.4
Services that provide support for children, family or carers 10.2 8.1 5.3 *7.2 8.0
Training and employment support services 14.1 10.4 14.7 12.7 13.0
Financial and material assistance #10.0 4.6 5.7 **n.p. 6.3
Other support services 10.4 8.5 7.6 **n.p. 7.9
None of the above 13.8 15.7 #9.5 20.2 14.2
Notes
1. Responses to this question relate to the person in the household who completed the survey form.
2. The category 'mental health services' includes the following services which were listed separately in the 2012 NSHS: 'Psychological
services', 'Psychiatric services' and 'Mental health services'.
3. Respondents could select more than 1 option.

National Social Housing Survey: detailed results 2014 121
Table 19.6: Community and health services accessed by community housing tenants in the past 12 months, by location (remoteness), 2014 (%)
Services Major cities
(%) Inner regional
(%) Outer regional
(%) Remote
(%) All
(%)
Drugs and alcohol counselling 5.3 5.1 *5.1 **n.p. 5.2
Mental health services 22.8 19.3 #14.3 *#7.1 20.4
Health/medical services 64.4 66.4 62.4 51.2 64.4
Life skills/personal development services 8.4 9.1 9.6 *7.6 8.7
Aged care 7.2 6.9 12.7 *#22.2 8.2
Information, advice and referral services 16.2 14.9 #10.2 *16.0 15.2
Day-to-day living support services 11.7 13.1 16.1 *14.1 12.6
Services that provide support for children, family or carers 6.8 6.2 *5.1 **n.p. 6.3
Training and employment support services 10.3 9.3 *7.3 — 9.4
Financial and material assistance 10.0 9.5 *6.8 **n.p. 9.3
Other support services 9.9 8.9 9.5 **n.p. 9.4
None of the above 28.0 24.9 30.2 31.4 27.4
Notes
1. Responses to this question relate to the person in the household who completed the survey form.
2. The category 'mental health services' includes the following services which were listed separately in the 2012 NSHS: 'Psychological
services', 'Psychiatric services' and 'Mental health services'.
3. Respondents could select more than 1 option.
Use of support services, by Indigenous status The 2 most commonly accessed community and health services were consistent across both Indigenous and non-Indigenous tenants for all 3 social housing programs (Table 19.7):
• health/medical services • mental health services. Around one-fifth of Indigenous tenants (21%) and one-quarter of non-Indigenous tenants (25%), across all social housing programs did not access any of the services listed. This represents a drop in the proportion of both Indigenous and non-Indigenous tenants who did not access services since 2012.

122 National Social Housing Survey: detailed results 2014
Table 19.7: Community and health services accessed in the past 12 months, by Indigenous status, by housing program type, 2014 (%)
Public housing (%) SOMIH (%) Community housing (%) All (%)
Services Indigenous Non-
Indigenous Indigenous Non-
Indigenous Indigenous Non-
Indigenous Indigenous Non-
Indigenous
Drugs and alcohol counselling 9.5 3.7 4.2 *6.7 17.5 4.6 8.6 3.9
Mental health services 29.2 19.0 12.3 17.1 25.2 20.1 23.2 19.2
Health/medical services 63.5 68.7 79.5 81.6 62.9 67.1 68.7 68.5
Life skills/personal development services 10.3 5.5 3.8 *6.0 *7.0 8.5 7.8 6.0
Aged care 9.6 7.7 5.8 *6.0 *7.0 8.4 8.1 7.8
Information, advice and referral services 18.3 12.2 4.9 *11.1 23.0 15.5 14.4 12.7
Day-to-day living support services 14.1 9.8 8.5 *6.7 16.0 12.6 12.5 10.2
Residential care and supported accommodation services 4.4 2.3 2.7 **n.p. *5.6 6.1 3.9 2.9
Services that provide support for children, family or carers 13.2 6.7 7.4 12.3 13.6 5.4 11.3 6.5
Training and employment support services 16.7 8.5 12.6 13.6 *11.5 9.8 14.8 8.8
Financial and material assistance 13.5 7.7 6.4 *4.5 15.8 9.6 11.4 8.0
Other support services 10.4 8.0 8.1 *5.7 15.4 9.1 10.2 8.2
None of the above 24.0 25.1 14.0 15.2 27.3 25.1 21.0 25.1
Notes
1. Responses to this question relate to the person in the household who completed the survey form.
2. The category 'mental health services' includes the following services which were listed separately in the 2012 NSHS: 'Psychological services', 'Psychiatric services' and 'Mental health services'.
3. Respondents could select more than 1 option.

National Social Housing Survey: detailed results 2014 123
Use of support services, by prior homelessness Of those social housing tenants who experienced homelessness in the 5 years prior to the survey, the most commonly accessed community or health services was consistent across all social housing programs —health/medical services (72%) (Table 19.8).
Those who had been homeless were much more likely to access mental health services (37% compared with 19% of all households) and financial and material aid (21% compared with 8% of all households).
Generally, SOMIH respondents which had previously experienced homelessness were less likely to access services compared with those in the other housing programs. This may reflect the remoteness of SOMIH dwellings and difficulties associated with accessing services in remote areas.
Table 19.8: Community and health services accessed by respondents who have been homeless in the last 5 years, by housing program type, 2014 (%)
Services Public
housing (%) SOMIH (%) Community
housing (%) All (%)
Drugs and alcohol counselling 13.7 *7.4 12.7 13.3
Mental health services 36.7 24.1 37.5 36.6
Health/medical services 71.7 80.7 74.5 72.4
Life skills/personal development services 15.0 *7.3 14.7 14.7
Aged care 5.3 **n.p. 7.0 5.5
Information, advice and referral services 26.3 10.0 26.1 25.9
Day-to-day living support services 14.7 *7.8 17.4 15.1
Residential care and supported accommodation services 5.2 *3.9 13.9 6.9
Services that provide support for children, family or carers 14.6 *10.1 12.1 14.0
Training and employment support services 16.4 18.6 19.2 17.0
Financial and material assistance 21.1 17.3 21.1 21.0
Other support services 14.5 11.9 18.0 15.2
None of the above 15.9 *8.3 15.5 15.7
Notes
1. Responses to this question relate to the person in the household who completed the survey form.
2. The category 'mental health services' includes the following services which were listed separately in the 2012 NSHS: 'Psychological
services', 'Psychiatric services' and 'Mental health services'.
3. Respondents could select more than 1 option.

124 National Social Housing Survey: detailed results 2014
Appendix A: Survey and reporting methodology
Scope The NSHS is a national survey encompassing a range of tenancies by geography and remoteness. In 2014, the NSHS was conducted across 3 social housing programs: public housing, community housing and SOMIH. Indigenous community housing was out of scope for the 2014 survey.
All tenants were eligible to participate in the survey, and participation was voluntary. In all cases, census databases were provided to Lonergan Research via the AIHW. Each jurisdiction was asked to provide the following information for each tenancy:
• address (including post code) • program type • remoteness category (by ARIA code). Where an ARIA code was not supplied on the database it was appended by Lonergan Research prior to selecting the sample. As Housing NSW and the Department of Housing Western Australia required a minimum sample size for each area they were also required to provide area information for each tenancy.
Overview of methodological approach The approach for the 2014 survey replicated that used in previous years for both public housing and community housing programs, with tenants surveyed via self-completion mail-out questionnaire. The main change that occurred in 2014 was the change to face-to-face interviewing for 2 of the 4 SOMIH jurisdictions, while the remaining 2 SOMIH jurisdictions replicated the methodology used for public housing and community housing tenants.
In terms of the mail-out self-completion questionnaire, an initial random sample was drawn from the administrative databases supplied by jurisdictions, and households in this sample were sent a pre-approach letter. The pre-approach letter was followed up shortly thereafter by a survey pack. The survey pack contained a questionnaire (including a covering letter) and a reply-paid envelope. A total of 33,797 initial survey packs were lodged in batches between 6 May and 17 June 2014.
Non-response within 4 weeks of these initial survey mailings was followed up with a second mailing, reminding tenants about the survey and encouraging its completion. The reminder mail-out included a questionnaire (including reminder letter) and a reply-paid envelope. Reminder pack mailings were split into 2 reminder mailings—first reminder and second reminder packs. First reminder packs were sent to a total of 26,657 households and second reminder packs were sent to a total of 28,132 households. The number of second reminder packs exceeds that of the first due to late confirmation of New South Wales community housing boost requirements. As a significant majority of New South Wales CH tenants received initial survey packs late in the project cycle, they were only eligible (due to fieldwork timeframes) to receive 1 reminder pack and this was distributed as part of the second reminder pack mailing. A further reminder mechanism was adopted in 2014—

National Social Housing Survey: detailed results 2014 125
voice-activated telephone interviewing (VATI)—for social housing tenants with valid telephone numbers. The purpose of these calls was to remind people about the survey and to encourage their co-operation. A total of 27,072 VATI reminder calls were made between 10 June and 29 July 2014.
Fieldwork progress was monitored on a daily basis. Where weekly progress reports identified a likelihood that minimum required sample sizes would not be achieved in certain housing programs and jurisdictions, Lonergan Research responded by sending mailing packs to ‘boost’ sample (that is, those not included in the initial mailing). A total of 4,518 survey packs were mailed to boost samples from 7 July to 11 August in batches of 100. Where boost sample mailings were undertaken, reminder packs were not sent due to time constraints. Boost sample responses were only included in the final data set if their inclusion assisted with minimum required sample sizes without adversely affecting response rates.
In terms of the face-to-face interviews, Lonergan Research prepared route schedules that would allow the minimum sample to be achieved without compromising budget or available time frames. Pre-approach letters were sent to all tenants living within local government areas or housing service centres where Lonergan Research was scheduled to visit. Pre-approach letters were sent to 5,600 SOMIH households in New South Wales and Queensland where face-to-face research was scheduled to take place.
The 2014 survey weighting was calculated as the number of households divided by the number of responses for each housing program type by the Accessibility/remoteness index of Australia (ARIA) and jurisdiction. All population counts were provided to the AIHW by the jurisdictions, and those ARIA areas without completed surveys were excluded from weighting calculations. This approach is in line with that used for the 2012 NSHS.
As with the 2010 and 2012 NSHS, the 2014 NSHS used the same survey instrument across all social housing programs. Prior to 2010 the content differed slightly across the programs, reflecting the different areas of interest in relation to each program. The more consistent approach used for the 2014 survey was designed to maximise data comparability across all social housing programs. Further, while there was some change to the survey questions between the 2012 and 2014 survey waves, the same topics were covered and content for key issues remained essentially the same.
A copy of the final questionnaire is attached at Appendix C and further information regarding the 2014 NSHS methodology can be found in the Methodological Report prepared by Lonergan Research which can be found on the AIHW website <www.aihw.gov.au>.
Survey and interview response rates The questionnaire was mailed to a randomly selected sample of 27,810 public housing, 12,990 community housing, and 2,026 SOMIH households. A total of 12,559 completed questionnaires were received (9,232 for public housing, 2,937 for community housing and 390 for SOMIH). In addition a further 1,001 face-to-face interviews were completed with SOMIH tenants (501 in New South Wales and 500 in Queensland).
The overall response rate for the 2014 NSHS was 32% for the mail-out surveys and 58% for the face-to-face interviews. Response rates for mail-out surveys ranged from a low of 24% for Australian Capital Territory community housing tenants to a high of 46% for South Australian public housing tenants. Program specific response rates for mail-out surveys were 35% for public housing, 32% for community housing and 38% for SOMIH tenants. This

126 National Social Housing Survey: detailed results 2014
represents an increase in the overall response compared with the 2012 NSHS (reported as 16% for PH, 17% for CH and 14% for SOMIH). Response rates for the face-to-face interviews were 53% for New South Wales and 64% for Queensland.
Table A.1: 2014 NSHS response rates, by housing program type and jurisdiction
Component Public housing Community housing SOMIH
Number of surveys
completed Response
rate (%)
Number of surveys
completed Response
rate (%)
Number of surveys
completed Response
rate (%)
Total number of surveys 9,232 2,937 1,391
NSW 4,991 40.0 1,061 26.3 501 53.0
Vic 585 36.2 367 40.8 . . . .
Qld 564 43.3 370 35.9 500 64.3
SA 619 45.5 354 32.8 307 18.7
ACT 504 24.7 124 24.0 . . . .
WA 954 27.3 361 37.1 . . . .
Tas 506 34.9 300 29.2 83 26.9
NT 509 27.3 . . . . . . . .
Notes
1. SOMIH program currently operates in 4 jurisdictions: New South Wales, Queensland, South Australia, Tasmania.
2. SOMIH tenants were surveyed via face-to-face interviews in New South Wales and Queensland and via mail-out in South Australia and Tasmania.
3. Community housing program operates in all jurisdictions except for the Northern Territory.

National Social Housing Survey: detailed results 2014 127
2014 NSHS sample representativeness Analysis was conducted comparing demographic characteristics of NSHS respondents from the 2014 survey with equivalent demographic information contained in the national administrative data collections for public housing, community housing and SOMIH. This provides some indication as to whether social housing tenants surveyed as part of the NSHS are representative of the broader social housing population. The results of this analysis are contained in the following tables.
A summary of the demographic profile of the 2014 NSHS survey participants is presented in Chapter 1.
Table A.2: Demographic characteristics of public housing tenants—2014 administrative database
NSW
(%) Vic (%) Qld (%) WA (%)
SA (%)
Tas (%)
ACT (%)
NT (%)
Total (%)
Number 199,967 125,834 104,767 68,177 62,744 15,348 22,571 11,010 610,418
Gender Male 45.4 43.3 43.6 42.7 46.1 44.1 44.5 44.5 44.3
Female 54.6 56.7 56.4 57.3 53.9 55.9 55.6 55.5 55.7
Age 14 and under 17.9 23.0 26.5 28.7 14.4 23.9 26.5 34.4 22.0
(years) 15–19 8.1 8.6 9.0 8.4 6.4 8.2 9.4 8.5 8.3
20–24 5.7 5.5 4.9 4.3 4.2 4.8 6.0 3.6 5.2
25–34 7.8 8.7 7.8 8.3 7.3 9.0 9.9 8.7 8.1
35–44 9.9 10.8 10.6 10.3 10.5 11.0 11.5 10.7 10.4
45–54 14.4 12.9 12.4 10.6 16.3 14.2 12.3 9.2 13.4
55–64 14.9 12.5 12.1 11.0 16.2 12.7 10.0 9.5 13.3
65–74 11.6 9.7 9.9 9.9 12.9 9.8 7.8 9.6 10.6
75 and over 9.6 8.2 6.8 8.6 11.7 6.4 6.6 5.8 8.7
Tenancy composition Single adult 52.7 52.2 49.7 50.2 61.1 60.2 47.5 41.6 52.7
Couple only 9.0 6.7 7.1 7.8 10.5 5.0 2.0 7.4 8.0
Sole parent with kids 15.9 16.4 24.8 25.8 8.2 18.1 19.8 27.4 17.8
Couple with kids 5.4 3.3 7.3 7.4 3.2 3.2 1.1 8.7 5.1
Group and mixed composition 17.0 21.5 11.1 8.8 17.0 13.5 29.6 14.9 16.4
Tenure Length 6 months or less 4.9 4.4 5.5 6.2 3.9 7.6 3.8 6.5 5.0
Over 6 months to 2 years 12.0 13.9 14.6 14.3 10.9 14.9 11.6 16.7 13.0
Over 2 years to 5 years 17.7 18.3 19.0 23.1 16.8 18.7 18.8 24.3 18.6
Over 5 years to 10 years 21.2 22.8 23.6 25.0 22.2 19.6 20.5 21.9 22.4
Over 10 years 44.1 40.6 37.4 31.3 46.3 39.2 45.4 30.6 41.0
Source: AIHW National Housing Assistance Data Repository 2013–14.

128 National Social Housing Survey: detailed results 2014
Table A.3: Demographic characteristics of community housing tenants—2014 administrative database
NSW
(%) Vic (%)
Qld (%)
WA (%)
SA (%)
Tas (%)
ACT (%)
NT (%)
Total (%)
Gender Male 42.3 46.8 n.a. 48.0 41.4 43.0 68.7 n.a. 44.2
Female 57.5 52.0 n.a. 47.5 53.6 51.6 31.4 n.a. 53.9
Not stated 0.3 1.2 n.a. 4.5 5.0 5.4 — n.a. 1.9
Age 14 and under 20.5 16.1 n.a. 17.5 22.0 22.0 6.1 n.a. 19.3
(years) 15–19 8.5 6.5 n.a. 5.5 7.2 7.4 3.2 n.a. 7.4
20–24 6.1 5.8 n.a. 5.1 5.9 6.1 9.9 n.a. 5.9
25–34 8.4 11.7 n.a. 13.2 12.4 11.2 20.3 n.a. 10.5
35–44 11.8 14.4 n.a. 14.3 13.7 11.5 20.3 n.a. 12.9
45–54 14.1 15.7 n.a. 13.7 13.1 11.5 15.6 n.a. 14.1
55–64 12.8 12.3 n.a. 11.3 10.4 9.5 10.0 n.a. 11.9
65–74 9.8 7.8 n.a. 10.1 7.6 6.6 6.9 n.a. 8.8
75 and over 7.7 5.2 n.a. 5.9 5.2 2.9 4.2 n.a. 6.2
Not stated 0.5 4.6 n.a. 3.5 2.5 11.5 3.6 n.a. 3.0
Tenancy composition Single person, living alone 58.9 67.1 n.a. 68.0 61.7 42.6 89.7 n.a. 61.4
Sole parent, living with 1 or more children 11.3 12.4 n.a. 7.8 12.7 9.3 3.0 n.a. 11.0
Couple, living without children 6.6 7.1 n.a. 7.2 9.0 5.0 3.2 n.a. 6.9
Couple, living with 1 or more children 2.6 4.0 n.a. 2.4 4.0 1.9 1.2 n.a. 3.0
Extended family, living without children n.a. n.a. n.a. n.a. n.a. n.a. n.a. n.a. n.a.
Extended family, living with 1 or more children 4.4 5.4 n.a. 8.5 10.8 5.7 2.4 n.a. 6.0
Extended family, living with other non-related members present 5.0 0.3 n.a. 0.1 0.2 0.1 0.1 n.a. 2.2
Group of unrelated adults 10.5 0.5 n.a. 0.9 1.2 0.8 0.1 n.a. 4.8
Not stated 0.7 3.2 n.a. 5.1 0.4 34.6 0.3 n.a. 4.7
n.a. Not available
Source: AIHW National Housing Assistance Data Repository 2013–14.

National Social Housing Survey: detailed results 2014 129
Table A.4: Demographic characteristics of SOMIH tenants—2014 administrative database
NSW Qld SA Tas Total
Number per state 12,636 10,783 4,578 640 28,637
Gender Male 42.5 43.3 44.3 43.8 43.1
Female 57.5 56.7 55.7 56.3 56.9
Age (years) 14 and under 37.7 41.5 34.0 35.5 38.5
15–19 12.3 11.0 11.1 10.0 11.6
20–24 5.9 5.2 5.3 5.2 5.5
25–34 10.2 9.5 9.5 11.7 9.8
35–44 11.0 10.6 12.2 10.8 11.1
45–54 11.2 9.4 13.1 12.0 10.9
55–64 7.0 6.6 8.9 7.5 7.1
65–74 3.5 4.0 4.0 5.0 3.8
75 and over 1.2 2.3 1.8 2.3 1.7
Tenancy composition Single adult 25.2 19.9 30.2 39.2 24.7
Couple only 4.0 4.5 5.0 4.9 4.4
Sole parent with children 41.6 39.8 24.9 32.1 37.8
Couple with children 8.7 14.0 6.4 7.1 10.0
Group and mixed composition 20.5 21.9 33.4 16.8 23.1
Tenure length 6 months or less 7.0 6.5 5.3 6.9 6.5
Over 6 months to 2 years 17.3 17.9 13.2 17.1 16.8
Over 2 years to 5 years 23.1 23.7 20.5 21.1 22.8
Over 5 years to 10 years 20.1 25.4 26.3 22.9 23.0
Over 10 years 32.5 26.6 34.8 32.0 30.9
Source: AIHW National Housing Assistance Data Repository 2013–14.

130 National Social Housing Survey: detailed results 2014
Detailed Methodology The 2014 NSHS consisted of 3 key stages: pre-fieldwork, fieldwork and post-fieldwork. Each of these stages is briefly outlined below. For full details of each of these stages, please refer to the 2014 National Social Housing Survey (NSHS)—Methodological report (also referred to as the ‘technical report’) prepared by Lonergan Research and available on the AIHW website <www.aihw.gov.au>.
Pre-fieldwork The pre-fieldwork stage consisted of the evaluation and testing of the existing questionnaire, as well as evaluating the proposed approach to surveying SOMIH tenants.
• AIHW and jurisdictional representatives agreed there were to be minimal changes to the NSHS in 2014 to ensure the integrity and comparability of trend data. – It was confirmed with Lonergan Research that the only changes required to the
existing 2012 questionnaire were minor—representing either tweaks to question wording and/or pre-codes OR the introduction of questions used either in previous iterations of the NSHS (specifically 2007 and 2010) or in the ABS census survey.
• Because only minor changes were to be made to the questionnaire, it was agreed that cognitive testing would be more beneficial than pilot testing—especially as the NSHS was to be conducted using a face-to-face methodology in New South Wales and Queensland. – Cognitive testing was undertaken between 7 April and 13 of May, with a total of 20
interviews conducted. Participants were recruited by senior Lonergan Research consultants from tenant lists supplied by the Queensland Department of Housing and Works, Housing NSW, the Aboriginal Housing Office in New South Wales and Housing SA. Participants were paid $50 to cover expenses incurred as a result of taking part in cognitive interviews.
– The cognitive testing process identified 1 or 2 areas where comprehension problems existed, typically relating to questionnaire wording, instructions or sign-posting. Minor changes to the questionnaire were recommended and agreed. (For detailed information regarding the findings from the cognitive testing please see the technical report prepared by Lonergan Research and available on the AIHW website.)
Fieldwork—mail-out survey For the 2014 NSHS, a common approach to fieldwork was adopted for all public housing and community housing tenants, as well as for 2 of the jurisdictions operating a SOMIH program. That is, an initial survey was mailed to the selected sample and followed up with reminder survey packs if the household had not responded to the survey in the time-frame allowed.

National Social Housing Survey: detailed results 2014 131
Pre-approach letter To maximise engagement and increase overall response rates, pre-approach letters were mailed to 33,797 tenants who had been randomly selected to take part in the 2014 NSHS.
The purpose of the pre-approach letter was to:
• inform tenants of the 2014 NSHS and their selection to participate • confirm survey packs would be arriving in the next few weeks, and that tenants had the
option to complete them online or in hard copy • confirm the voluntary nature of the survey while still encouraging participation • notify tenants that they could enter a prize draw for an Apple iPad once they completed
the survey. The majority of jurisdictions elected to prepare their own pre-approach letter, while some chose to use a letter prepared by Lonergan Research.
Note: where boost sample mailings were conducted, pre-approach letters were not mailed to selected households due to time constraints.
Survey packs Each survey pack contained a questionnaire and a reply paid envelope.
• Questionnaires were printed as A3-folded booklets with the front page containing a covering letter with a series of FAQs on the reverse.
• The front page of the booklet was perforated so that tenants could detach the covering letter and FAQs to keep for reference purposes if they wished.
• While a consistent core questionnaire was used for all social housing tenants, the covering letter and FAQs were tailored according to social housing type and jurisdiction.
A total of 33,797 initial survey packs were lodged in batches between 6 May and 17 June (excluding boost sample mailings). Lodgement date varied by geographical location, and priority was given to remote areas and those under quota at that point in time.
Reminder packs Two reminder mailings were undertaken in each jurisdiction to tenants where completed surveys had not been received—with the exception of boost sample tenants in NSW community housing who received one reminder mailing.
The difference between the initial covering letter and the reminder covering letter was that tenants were advised in the reminder covering letter that their completed survey had yet to be received and encouraged them to take part and return the survey by a new due date.
First reminder packs were sent to a total of 26,657 tenants, while second reminder packs were sent to a total of 28,132 (this number is boosted due to the late confirmation of NSW community housing boost requirements and the sending of first reminder packs to these households).
Note: In 2014 to further increase engagement and maximise response rates, black and white logos for each jurisdictional housing authority were printed on the front of all envelopes (pre-approach letters, initial survey packs and reminder mailings), where this was agreed to by the jurisdictional housing authority. Where the jurisdictional housing authority did not agree, the AIHW logo was used as the default.

132 National Social Housing Survey: detailed results 2014
VATI reminder calls VATI (voice automated telephone interviewing) was used in the 2014 NSHS as an additional reminder mechanism to those jurisdictions where telephone numbers were available. A phone call was made, reminding people about the due date for the survey and requesting their co-operation when the next reminder pack arrives. A total of 27,072 VATI reminder calls were made between the 10 June and 29 July.
Boost sample A total of 4,518 survey packs were mailed to boost samples from 7 July to 11 August in batches of 100. Where boost sample mailings were undertaken, due to time constraints, reminder packs were not sent.
Fieldwork—face-to-face interviews A mixed methodology approach was adopted for SOMIH tenants with 2 jurisdictions (New South Wales and Queensland) opting for face-to-face interviewing while 2 jurisdictions (South Australia and Tasmania) chose to replicate the mail-out survey approach used for public housing and community housing tenants.
Primary approach packs To maximise engagement and increase overall response rates prior to the initial mailing packs being distributed, pre-approach letters were sent to all tenants living within local government areas (LGA’s) or housing service centres where Lonergan Research was scheduled to visit and conduct face-to-face interviews.
The purpose of the pre-approach letter was to:
• Inform tenants that an interviewer would be door-knocking in their area within a particular time period.
• Confirm that households would be randomly selected. • Confirm that participation is voluntary but strongly encouraged. • Notify tenants of the monetary incentive for participating ($10 cash). • Notify tenants that they could enter a prize draw for an Apple iPad once they completed
the survey. NSW Aboriginal Housing requested that an additional information sheet was included in the initial mailing.
Pre-approach letters were sent to a total of 5,600 SOMIH households in New South Wales and Queensland where face-to-face research was scheduled to take place.
Fieldwork processes The approach that was taken to the face-to-face interviewing is briefly outlined below:
• Pre-fieldwork briefing meeting—a full day briefing session conducted by Lonergan Research for all staff conducting face-to-face interviews.
• Two interview teams operational in each state, consisting of 1 Indigenous interviewer and 1 non-Indigenous interviewer. As a contingency, 2 additional senior interviewers were trained and briefed with regards to project requirements.

National Social Housing Survey: detailed results 2014 133
• A daily route planner was provided to each team, pre-approved by AIHW and the relevant jurisdiction.
• Interviewers door-knocked in their selected location and asked to speak to someone who lived at the address aged 18 or over.
Post-fieldwork Following completion of the fieldwork, a client workshop was held at the AIHW with Lonergan Research. The purpose of the workshop was to discuss specific aspects of each of the stages of the project, including:
• cognitive testing • the primary approach letter • sampling selection • address files • 1800 number • response rates, including the use of the reminder mechanisms • weighting • returns of completed surveys since the final reporting date • data storage, retention and disposal, including the disposal of physical questionnaires
and delivery of electronic data securely • recommendations for the 2016 survey.
Recommendations for 2016 The recommendations coming out of this meeting in relation to future iterations of the NSHS, particularly 2016 were:
• continue with the additional reminder mechanisms adopted in the 2014 NSHS • encourage jurisdictions to provide telephone numbers for tenants (where a mail-out
approach is implemented) to facilitate VATI reminder calls to maximise engagement and response
• continue with a face-to-face methodology for SOMIH tenants, across all 4 SOMIH jurisdictions
• ensure jurisdictions confirm their requirements in the earliest instance to avoid compromise to overall response rate and sample size
• engage in dialogue with Jurisdictions and Housing Providers to explore the possibility of personalising the envelope and covering letter as opposed to addressing all correspondence to ‘The Tenant’.

134 National Social Housing Survey: detailed results 2014
Respondents versus households Responses to the NSHS can report either:
• information about the social housing tenant completing the survey (the respondent), such as age and gender
• information provided by the respondent that is: – about individuals in the social housing household, such as whether there are any
adults in the household currently working full-time – on behalf of all members of their household, such as whether the location of their
dwellings meet the needs of the household. In each instance, this is noted under the relevant chart or table throughout the report.
It is important to distinguish household-level responses from those questions that are specifically targeting the individual who completed the survey. When considering those questions relating to the individual completing the survey, the responses provided may not apply to other members of the household.
It should also be noted that where survey respondents have provided information on behalf of other household members, they have not been asked whether they had consulted with other household members in formulating these responses.
Weighting
2014 weighting strategy: mail-out survey This report does not present raw survey data. The estimates presented here have been derived by applying ‘weights’ to the raw data (survey responses) to ensure that the estimates presented represent the total population, to the extent possible. The weighting for the 2014 NSHS survey was calculated as the number of households in each jurisdiction (population) divided by the number of surveys (responses) with calculations performed at the jurisdiction level by housing program type (public housing, community housing, SOMIH), by ARIA level.
The 2014 weighting strategy is in line with that used for 2012 with the only difference being the inclusion of ARIA in the calculation of weights for the Australian Capital Territory. In 2012, weights for the Australian Capital Territory were calculated excluding ARIA.

National Social Housing Survey: detailed results 2014 135
Table A.5: 2014 NSHS weights—mail-out survey
Housing type Jurisdiction ARIA Population Responses Weight
Public housing NSW 0 85,163 2,902 29.34631
1 20,827 1,763 11.81339
2 2,920 282 10.35461
3 431 40 10.77500
4 40 4 10.00000
Vic 0 44,243 384 115.21615
1 15,566 170 91.56471
2 3,158 31 101.87097
Qld 0 28,752 389 73.91260
1 8,638 99 87.25253
2 9,126 71 128.53521
3 331 5 66.20000
SA 0 28,686 482 59.51452
1 2,681 46 58.28261
2 4,962 79 62.81013
3 631 12 52.58333
ACT 0 9,630 457 21.07221
1 774 47 16.46808
WA 0 18,947 329 57.58967
1 3,409 168 20.29167
2 3,051 252 12.10714
3 2,662 143 18.61538
4 1,212 62 19.54839
Tas 1 7,802 381 20.47769
2 2,594 124 20.91935
3 19 1 19.00000
NT 2 2,972 415 7.161446
3 871 94 9.265957
(continued)

136 National Social Housing Survey: detailed results 2014
Table A.5: 2014 NSHS weights—mail-out survey (continued)
Housing type Jurisdiction ARIA Population Responses Weight
Community housing NSW 0 15,924 622 25.60129
1 8,526 377 22.61538
2 1,689 60 28.15000
3 54 2 27.00000
Vic 0 4,690 227 20.66079
1 2,772 130 21.32308
2 330 9 36.66667
3 9 1 9.0000
Qld 0 4,300 194 22.16495
1 2,172 80 27.15000
2 2,723 78 34.91026
3 280 9 31.11111
4 536 9 59.55556
SA 0 3,441 299 11.50836
1 371 33 11.24242
2 205 18 11.38889
3 34 4 8.50000
ACT 0 509 121 4.20661
1 10 3 3.33333
WA 0 3,448 193 17.86528
1 1,330 94 14.14894
2 709 34 20.85294
3 692 37 18.70270
4 131 3 43.66667
Tas 1 1,608 235 6.84255
2 433 62 6.98387
3 14 2 7.00000
4 1 1 1.00000
SOMIH SA 0 1,069 216 4.949074
1 139 24 5.791666
2 285 46 6.195652
3 104 14 7.428571
4 118 7 16.85714
Tas 1 259 69 3.75362
2 52 14 3.71428

National Social Housing Survey: detailed results 2014 137
2014 weighting calculation: face-to-face survey The weighting for the 2014 survey was calculated as the number of households in each jurisdiction (population) divided by the number of usable surveys (responses).
Table A.6: 2014 NSHS weights—face-to-face survey
Housing Type Jurisdiction ARIA Population Responses Weight
SOMIH NSW 0 1,761 202 8.7178
1 1,681 182 9.2363
2 713 80 8.9125
3 290 31 9.3548
4 43 6 7.1667
Qld 0 439 66 6.6515
1 614 99 6.2020
2 1,241 195 6.3641
3 277 44 6.2955
4 600 96 6.2500
Sampling variability The aim of sampling is to achieve ‘representation’ so that the results are the same as if the whole population had been included. The 2014 NSHS is based on a sample of the social housing tenant population. When estimates are based on data from a sample selected from a population rather than a full count of that population, they are subject to sampling variability. This means the estimates may differ from the figures that would have been produced if the data had been obtained from the complete population.
The measure of sampling error that has been used in the 2014 NSHS is relative standard error (RSE), which is obtained by expressing the standard error as a percentage of the estimate. The Australian Bureau of Statistics (ABS) considers that only estimates with relative standard errors of less than 25%, and percentages based on such estimates, are sufficiently reliable for most purposes. Throughout this report, a * has been placed against estimates with relative standard errors between 25% and 50% to indicate they have high standard errors and should be used with caution. Estimates with relative standard errors greater than 50% are not published (n.p.) as they are considered too unreliable for general use.
Throughout this report, national estimates and jurisdictional estimates have been compared, to see if the differences are statistically significant. Statistical significance has been calculated using a z-test, which tests the difference between 2 proportions. Confidence levels computed provide the probability that a difference at least as large as noted would have occurred by chance if the 2 population proportions were in fact equal. The results are calculated using 95% confidence levels, using 2-tailed tests. Statistically significant differences have been illustrated using #.

138 National Social Housing Survey: detailed results 2014
Comparability with the 2012 questionnaire The sampling approach for the 2014 survey remained largely consistent with that used in survey iterations prior to 2012. In 2014, a single sample was selected and sent a survey pack containing a questionnaire (including covering letter) and a reply-paid envelope. In addition, follow-up mailings were sent to those households which did not respond to the initial mail-out in the time allowed. This approach was supplemented in 2014 with the introduction of VATI reminder calls to those programs for which telephone numbers were available. In 2012, additional survey forms were sent to randomly selected top-up sample households until the required number of responses was achieved across housing programs and jurisdictions. While a ‘boost’ sample was adopted in 2014 for a small number of programs/jurisdictions, these surveys were only included if they had a positive impact on minimum sample size and did not negatively affect the response rate achieved.
As with 2010 and 2012, the 2014 NSHS used the same survey instrument across all social housing programs. Prior to 2010 the content differed across the programs, reflecting the different areas of interest in relation to each program. The approach used for 2014 was undertaken in order to maximise data comparability across all social housing programs. Further, while there was some minor change to the survey questions between the 2 survey waves, the same topics were covered and content for key issues remained essentially the same.
Caution should be used if comparing 2014 results to 2012 due to changes in the survey methodology, particularly for SOMIH. These changes may have affected comparability in survey responses compared with previous surveys.
Despite the changes in methodology between the 2012 and 2014 NSHS, the tenant profiles of respondents remained similar across all social housing programs.

National Social Housing Survey: detailed results 2014 139
Appendix B: Profile of 2014 NSHS respondents Demographic characteristics are routinely collected in surveys to provide the opportunity when analysing the data to better understand the population surveyed—for example, questions about age, sex, education and employment which help researchers understand whether those surveyed are similar to other populations.
The tables presented below provide details of the demographic characteristics across each of the programs for the 2014 NSHS respondents.

140 National Social Housing Survey: detailed results 2014
Table B.1: Demographic profile of public housing respondents
Base: All public housing respondents (n=9,232) %
Household composition
Single person, living alone 56.3
Single person, living with 1 or more children 17.7
Couple, living without children 12.1
Couple, living with 1 or more children 6.8
Extended family, living without children 1.0
Extended family, living with 1 or more children 2.0
Group of unrelated adults 1.3
Other 2.8
Age of respondent
14 years and under n.p.
15–19 years *0.3
20–24 years 1.1
25–34 years 4.3
35–44 years 10.1
45–54 years 17.5
55–64 years 23.5
65–74 years 23.8
75 years and over 19.4
Indigenous status
Neither Aboriginal or Torres Strait Islander origin 69.0
Aboriginal but not Torres Strait Islander origin 4.3
Torres Strait Islander but not Aboriginal origin *0.3
Both Aboriginal and Torres Strait Islander origin 0.3
Don’t know 26.1
Gender
Male 36.9
Female 63.1
Highest level of education achieved
No formal education 2.4
Primary school 6.1
Junior secondary education (completed Year 10 or equivalent) 48.9
Senior secondary education (completed Year 12 or equivalent) 20.3
Certificate, Diploma or Advanced Diploma 17.3
Bachelor degree or above 5.0
Country of birth
Australia 66.2
Other 33.8
Language spoken at home
English 84.6
Other 15.4
Main tenant
Yes 96.8
No 3.2

National Social Housing Survey: detailed results 2014 141
Table B.2: Demographic profile of SOMIH respondents
Base: All SOMIH respondents (n=1,383) %
Household composition
Single person, living alone 29.1
Single person, living with 1 or more children 38.7
Couple, living without children 3.8
Couple, living with 1 or more children 9.9
Extended family, living without children 6.0
Extended family, living with 1 or more children 11.4
Group of unrelated adults 0.6
Other 0.6
Age of respondent
14 years and under
15–19 years 1.9
20–24 years 5.9
25–34 years 17.8
35–44 years 18.9
45–54 years 22.9
55–64 years 18.2
65–74 years 10.6
75 years and over 3.9
Indigenous status
Neither Aboriginal or Torres Strait Islander origin 10.0
Aboriginal but not Torres Strait Islander origin 78.2
Torres Strait Islander but not Aboriginal origin 6.3
Both Aboriginal and Torres Strait Islander origin 4.4
Don’t know *1.1
Gender
Male 27.9
Female 72.1
Highest level of education achieved
No formal education *0.4
Primary school 6.5
Junior secondary education (completed Year 10 or equivalent) 60.6
Senior secondary education (completed Year 12 or equivalent) 21.0
Certificate, Diploma or Advanced Diploma 9.5
Bachelor degree or above 2.1
Country of birth
Australia 98.0
Other 2.0
Language spoken at home
English 95.6
Other 4.4
Main tenant
Yes 90.0
No 10.0

142 National Social Housing Survey: detailed results 2014
Table B.3: Demographic profile of community housing respondents
Base: All community housing respondents (n=2,899) %
Household composition
Single person, living alone 58.1
Single person, living with 1 or more children 14.8
Couple, living without children 14.4
Couple, living with 1 or more children 5.5
Extended family, living without children 0.8
Extended family, living with 1 or more children 1.6
Group of unrelated adults 2.4
Other 2.5
Age of respondent
14 years and under **<0.1
15–19 years 0.4
20–24 years 1.6
25–34 years 5.5
35–44 years 11.3
45–54 years 18.4
55–64 years 22.0
65–74 years 22.9
75 years and over 17.8
Indigenous status
Neither Aboriginal or Torres Strait Islander origin 70.5
Aboriginal but not Torres Strait Islander origin 3.7
Torres Strait Islander but not Aboriginal origin *0.3
Both Aboriginal and Torres Strait Islander origin 0.8
Don’t know 24.8
Gender
Male 40.2
Female 59.8
Highest level of education achieved
No formal education 2.0
Primary school 6.8
Junior secondary education (completed Year 10 or equivalent) 42.6
Senior secondary education (completed Year 12 or equivalent) 18.2
Certificate, Diploma or Advanced Diploma 21.4
Bachelor degree or above 9.0
Country of birth
Australia 64.7
Other 35.3
Language spoken at home
English 84.0
Other 16.0
Main tenant
Yes 96.7
No 3.3

National Social Housing Survey: detailed results 2014 143
Appendix C: 2014 NSHS Questionnaire Note: The covering letter illustrated below is consistent with those used for all programs—the only difference being the housing program name referred to throughout the front and reverse pages.

144 National Social Housing Survey: detailed results 2014

National Social Housing Survey: detailed results 2014 145

146 National Social Housing Survey: detailed results 2014

National Social Housing Survey: detailed results 2014 147

148 National Social Housing Survey: detailed results 2014

National Social Housing Survey: detailed results 2014 149

150 National Social Housing Survey: detailed results 2014

National Social Housing Survey: detailed results 2014 151

152 National Social Housing Survey: detailed results 2014

National Social Housing Survey: detailed results 2014 153

154 National Social Housing Survey: detailed results 2014

National Social Housing Survey: detailed results 2014 155
Glossary Australian Statistical Geography Standard: The ASGS divides Australia into regions for comparison purposes. One of the concepts commonly used for comparison is remoteness. Remoteness areas divide Australia into broad geographical regions that share common characteristics of remoteness for statistical purposes. There are 6 classes of remoteness areas: Major cities, Inner regional, Outer regional, Remote, Very remote, and Migratory.
Canadian National Occupancy Standard: A measure of the appropriateness of housing that is sensitive to both household size and composition. The CNOS specifies that: • no more than 2 people shall share a bedroom • parents or couples may share a bedroom • children under 5, either of the same sex or opposite sex, may share a bedroom • children under 18 of the same sex may share a bedroom • a child aged 5–17 should not share a bedroom with a child under 5 of the opposite sex • single adults 18 and over and any unpaired children require a separate bedroom.
cognitive testing: Cognitive testing is a tool used to understand how respondents interpret questions and instructions provided in a questionnaire. This type of testing can also be used to evaluate survey techniques to increase response or cooperation and to assist in interpreting the meaning of survey responses.
community housing (mainstream): Mainstream community housing is managed by not-for-profit organisations and is covered in the NSHS where those organisations receive capital or recurrent funding from government. Community housing offers short-, medium- or long-term tenure for low-income individuals and families, or those with particular needs not well catered for by the private market. Currently the community housing program is operating in all jurisdictions apart from the Northern Territory.
demographic profile: A term used in marketing and research to describe a demographic grouping or segment of the population. This typically involves age bands, gender, educational attainment and labour force status.
facilities: An amenity or piece of equipment provided for a particular purpose, for example a stove for cooking. See also, working facilities.
homelessness: In the 2014 NSHS, being homeless refers to times when the respondent had to live in emergency accommodation provided by a homelessness agency, had stayed temporarily with friends or relatives because they had nowhere to live, had been totally without permanent shelter or had lived in shelter unlawfully such as squatting in derelict buildings. Note: ‘Homelessness’ can be defined in different ways for different purposes.

156 National Social Housing Survey: detailed results 2014
household: A group of two or more related or unrelated people who usually reside in the same dwelling, and who make common provision for food or other essentials for living. A household can also be a single person living in a dwelling who makes provision for his or her own food and other essentials for living, without combining with any other person.
household composition: The grouping of people living in a dwelling. Household composition is based on couple and parent–child relationships. A single-family household contains a main tenant only, or a main tenant residing with a partner and/or the main tenant’s children. Group households consist of 2 or more tenants aged 16 or over who are not in a couple or parent–child relationship. ‘Mixed households’ are households not described by the other 2 types—for example, multiple single-family households.
Indigenous household: A household as defined above which contains 1 or more people who identify as being of Aboriginal and/or Torres Strait Islander origin.
overcrowding: A situation in a dwelling when 1 or more additional bedrooms are required to meet the Canadian National Occupancy Standard (CNOS).
public housing: Public housing (also referred to as public rental housing) encompasses the publicly owned or leased dwellings administered by state and territory governments. It aims to provide appropriate, affordable and accessible housing mainly for low-income households that have difficulty in obtaining and maintaining housing in the private market.
social housing: Rental housing that is funded or partly funded by government, and that is owned or managed by the government or a community organisation and let to eligible persons. This includes public rental housing, state owned and managed Indigenous housing, mainstream and Indigenous community housing and housing provided under the Crisis Accommodation Program.
social inclusion: Social inclusion describes the ability of individuals to participate in the formal structures and institutions of the economy, society and state, and to enjoy the benefits of the goods and services produced by mainstream society.
state owned and managed Indigenous housing (SOMIH): State owned and managed Indigenous housing is administered by state governments and is specifically targeted to households with at least 1 Indigenous member. It aims to provide appropriate, affordable and financially accessible housing for low- to moderate-income Indigenous households. Four jurisdictions currently operate a SOMIH program: New South Wales, Queensland, South Australia and Tasmania.
underutilisation: A situation where a dwelling contains one or more bedrooms surplus to the needs of the household occupying it, according to the Canadian National Occupancy Standard.
unemployed person: A person aged 15 years or more who was not employed during the reference week but had actively looked for work and was currently available for work.
working facilities: An amenity or piece of equipment provided for a particular purpose, in correct working order.

National Social Housing Survey: detailed results 2014 157
References AHURI (Australian Housing and Urban Research Institute) 2009. What can be done to improve employment outcomes among people receiving housing assistance? AHURI research and policy bulletin. Issue 114. Melbourne: AHURI.
AHURI 2013. What effect does housing assistance have on social inclusion for people with disabilities? AHURI research and policy bulletin. Issue 159. Melbourne: AHURI.
AIHW (Australian Institute of Health and Welfare) 2014. Housing assistance in Australia 2014. Cat. no. HOU 275. Canberra: AIHW.
DSS (Department of Social Services) 2013. Social Housing Initiative. Canberra: DSS.
DSS 2014. National rental affordability scheme. Frequently asked questions. <www.dss.gov.au/our-responsibilities/housing-support/programs-services/national-rental-affordability-scheme/national-rental-affordability-scheme-frequently-asked-questions-1>.
FaCS (Department of Families and Community Services) 2014. Social Housing in NSW: A discussion paper for input and comment. Sydney: FaCS.
National Social Housing Survey: Methodological Report. Available at <http://www.aihw.gov.au/housing-assistance-publications/>.
SCRGSP (Steering Committee for the Review of Government Service Provision) 2014. Report on government services 2014. Melbourne: Productivity Commission.

158 National Social Housing Survey: detailed results 2014
List of tables Table 1.1: Proportion of tenants satisfied with services provided by housing organisation,
by Indigenous status, prior homelessness, number of structural problems, and dwelling utilisation, 2014 (%) ...................................................................................................... 10
Table 7.1: Length of time in current home, by housing program type, 2014 (%) .................................. 31
Table 7.2: Length of time in social housing, by housing program type, 2014 (%) ................................. 31
Table 8.1: Labour force status of survey respondents aged 15–64 years, by housing program type, 2014 (%) ................................................................................................................................ 36
Table 8.2: Influences on current employment situation of social housing respondents aged 15–64 years, selected groups with capacity for work, 2014 (%) ............................................. 38
Table: 8.3: Strong influences on respondents aged 15–64 years, employment situations—selected groups with capacity to work, by housing program type, 2014 (%) ....................... 39
Table 9.1: Households with a need for assistance, 2014 (%) ..................................................................... 41
Table 9.2: Reasons assistance needed, by housing program type, 2014 (%) ........................................... 42
Table 9.3: Households with disability, satisfaction with modifications for special needs, by housing program type, 2014 (%) ................................................................................................. 42
Table 10.1: Proportion of households accessing community and health services in the past 12 months, by housing program type, 2014 (%) ............................................................................ 44
Table 11.1: Proportion of tenants with a need for assistance satisfied with services provided by their housing organisation, by housing program type, 2014 (%) ..................................... 53
Table 12.1: Amenities rated as important to the household in public housing, by jurisdiction, 2014 (%) .......................................................................................................................................... 55
Table 12.2: Amenities rated as meeting the needs of the household in public housing, by jurisdiction, 2014 (%) .................................................................................................................... 56
Table 12.3: Amenities rated important to the household in SOMIH, by jurisdiction, 2014 (%) ............ 58
Table 12.4: Amenities rated as meeting the needs of the household in SOMIH, by jurisdiction, 2014 (%) .................................................................................................................... 59
Table 12.5: Amenities rated as important to the household in community housing, by jurisdiction, 2014 (%) .................................................................................................................... 60
Table 12.6: Amenities rated as meeting the needs of the household in community housing, by jurisdiction, 2014 (%) ............................................................................................................... 61
Table 12.7: Amenities rated as important to the household, by location (remoteness), by housing program type, 2014 (%) ................................................................................................. 64
Table 12.8: Amenities rated as meeting the needs of the household, by location (remoteness), by housing program type, 2014 (%) ........................................................................................... 65
Table 12.9: Amenities rated by tenants as important to the household, by Indigenous status, by housing program type, 2014 (%) ........................................................................................... 67
Table 12.10: Amenities rated by tenants as meeting the needs of the household, by Indigenous status, by housing program type, 2014 (%) ............................................................................... 67
Table 12.11: Amenities rated as important to the household, by prior homelessness, by housing program type, 2014 (%) ................................................................................................. 68

National Social Housing Survey: detailed results 2014 159
Table 12.12: Amenities rated as meeting the needs of the household, by prior homelessness, by housing program type, 2014 (%) ........................................................................................... 69
Table 12.13: Amenities rated as important to the household for tenants with a need for assistance, by housing program type, 2014 (%) ........................................................................ 70
Table 12.14: Amenities rated as meeting the needs of households in which tenants had a need for assistance, by housing program type, 2014 (%) .................................................................. 71
Table 13.1: Proximity to facilities and services rated by public housing tenants as important to the household, by state and territory, 2014 (%) .................................................................... 72
Table 13.2: Proximity to facilities and services rated by SOMIH tenants as important to their households, by state and territory, 2014 (%) ............................................................................. 73
Table 13.3: Proximity to facilities and services rated by community housing tenants as important to the household, by state and territory, 2014 (%) ................................................. 74
Table 13.4: Proximity to services and facilities rated by public housing tenants as meeting the needs of the household, by state and territory, 2014 (%) ........................................................ 75
Table 13.5: Proximity to services and facilities rated by SOMIH tenants as meeting the needs of the household, by state and territory, 2014 (%) .................................................................... 76
Table 13.6: Proximity to services and facilities rated by community housing tenants as meeting the needs of the household, by state and territory, 2014 (%) ................................... 77
Table 13.7: Proximity to facilities and services rated by tenants as important, by location (remoteness), by housing program type, 2014 (%) ................................................................... 79
Table 13.8: Proximity to facilities and services rated by tenants as meeting the needs of the household, by location (remoteness), by housing program type, 2014 (%) .......................... 81
Table 13.9: Proximity to facilities and services rated by tenants as important to the household, by Indigenous status, by housing program type, 2014 (%) ................................ 82
Table 13.10: Proximity to facilities and services rated by tenants as meeting the needs of the household, by Indigenous status, by housing program type, 2014 (%) ................................ 83
Table 13.11: Proximity to facilities and services rated by tenants as meeting the needs of the household, by previous homelessness, by housing program type, 2014 (%) ....................... 84
Table 16.1: Benefits of living in social housing, by state and territory, by housing program type, 2014 (%) .............................................................................................................................. 101
Table 16.2: Self-reported benefits gained by living in social housing by location (remoteness), 2014 (%) ........................................................................................................................................ 102
Table 16.3: Self-reported benefits gained by tenants living in social housing by Indigenous status, by housing program type, 2014 (%) ............................................................................. 103
Table 16.4: Self-reported benefits gained by tenants who have experienced homelessness prior to living in social housing, by housing program type, 2014 (%) ................................ 105
Table 17.1: Dwelling condition in social housing, by state and territory, by housing program type, 2014 (%) .............................................................................................................................. 107
Table 17.2: Dwelling condition in social housing, by location (remoteness), by housing program type, 2014 (%) .............................................................................................................. 108
Table 17.3: Dwelling condition in social housing, by Indigenous status, by housing program type, 2014 (%) .............................................................................................................................. 109
Table 17.4: Dwelling condition in social housing, for those who had been homeless in the last 5 years, by housing program type, 2014 (%) ........................................................................... 110

160 National Social Housing Survey: detailed results 2014
Table 18.1: Dwelling utilisation, by state and territory, by housing program type, 2014 (%) ............. 112
Table 18.2: Dwelling utilisation, by location (remoteness), by housing program type, 2014 (%) ................................................................................................................................................. 113
Table 18.3: Dwelling utilisation, by Indigenous status, by housing program type, 2014 (%) .............. 114
Table 19.1: Proportion of public housing households using community and health services in the past 12 months, by state and territory, 2014 (%) .............................................................. 116
Table 19.2: Proportion of SOMIH households using community and health services in the past 12 months, by state and territory, 2014 (%) .................................................................... 117
Table 19.3: Proportion of community housing households using community and health services in the past 12 months, by state and territory, 2014 (%) ........................................... 118
Table 19.4: Community and health services accessed by public housing tenants in the past 12 months, by location (remoteness), 2014 (%) ....................................................................... 119
Table 19.5: Community and health services accessed by SOMIH tenants in the past 12 months, by location (remoteness), 2014 (%) ............................................................................ 120
Table 19.6: Community and health services accessed by community housing tenants in the past 12 months, by location (remoteness), 2014 (%)............................................................... 121
Table 19.7: Community and health services accessed in the past 12 months, by Indigenous status, by housing program type, 2014 (%) ............................................................................. 122
Table 19.8: Community and health services accessed by respondents who have been homeless in the last 5 years, by housing program type, 2014 (%) ........................................ 123
Table A.1: 2014 NSHS response rates, by housing program type and jurisdiction .............................. 126
Table A.2: Demographic characteristics of public housing tenants—2014 administrative database ....................................................................................................................................... 127
Table A.3: Demographic characteristics of community housing tenants—2014 administrative database ....................................................................................................................................... 128
Table A.4: Demographic characteristics of SOMIH tenants—2014 administrative database ............. 129
Table A.5: 2014 NSHS weights—mail-out survey .................................................................................... 135
Table A.5: 2014 NSHS weights—mail-out survey (continued) ............................................................... 136
Table A.6: 2014 NSHS weights—face-to-face survey ............................................................................... 137
Table B.1: Demographic profile of public housing respondents ............................................................ 140
Table B.2: Demographic profile of SOMIH respondents TTttf ............................................................... 141
Table B.3: Demographic profile of community housing respondents ................................................... 142

National Social Housing Survey: detailed results 2014 161
List of figures Figure 1.1: Satisfaction with services provided by the housing organisation, by housing
program type, 2014 (%) ................................................................................................................ 10
Figure 1.2: Satisfaction with services provided by the housing organisation over time, by housing program type, 2001–2014 (%) ....................................................................................... 12
Figure 2.1: Amenities rated as important by social housing tenants, by housing program type, 2014 (%) ................................................................................................................................ 14
Figure 2.2: Amenities rated as important and meeting their needs by social housing tenants, by housing program type, 2014 (%) ........................................................................................... 15
Figure 3.1: Location (proximity to facilities and services) rated by tenants as important to the household, by housing program type, 2014 (%) ....................................................................... 17
Figure 3.2: Location (proximity to facilities and services) rated by tenants as meeting the needs of the household, by housing program type, 2014 (%)................................................. 17
Figure 4.1: Satisfaction with day-to-day and emergency maintenance services, by housing program type, 2014 (%) ................................................................................................................ 19
Figure 5.1: Self-reported benefits gained by tenants living in social housing, by housing program type, 2014 (%) ................................................................................................................ 21
Figure 6.1: Facilities the household has that work, by housing program type, 2014 (%) ....................... 24
Figure 6.2: Number of structural problems the household has, by housing program type, 2014 (%) .......................................................................................................................................... 26
Figure 6.3: Dwelling standard, by housing program type, 2014 (%) ........................................................ 27
Figure 6.4: Dwelling utilisation, by housing program type, 2014 (%) ...................................................... 29
Figure 7.1: Proportion of respondents who experienced homelessness in the last 5 years, by housing program type, 2010–2014 (%) ....................................................................................... 32
Figure 7.2: Number of times homeless in the last 5 years, for those respondents who have experienced homelessness in the 5 years prior to the survey, by housing program type, 2014 (%) ................................................................................................................................ 33
Figure 7.3: Tenure prior to moving into social housing, for those respondents who have experienced homelessness in the 5 years prior to the survey, by housing program type, 2014 (%) ................................................................................................................................ 34
Figure 11.1: Proportion of tenants satisfied with services provided by their housing organisation, by state and territory, by housing program type, 2014 (%) ............................ 47
Figure 11.2: Proportion of tenants satisfied with services provided by their housing organisation, by remoteness category, by housing program type, 2014 (%) ........................ 48
Figure 11.3: Proportion of tenants satisfied with the services provided, by previous homelessness, by housing program type, 2014 (%) ................................................................. 49
Figure 11.4: Satisfaction with services provided by the housing organisation, by dwelling condition, 2014 (%) ....................................................................................................................... 50
Figure 11.5: Proportion of tenants satisfied with services provided, by dwelling utilisation, by housing program type, 2014 (%) ................................................................................................. 51
Figure 11.6: Proportion of tenants satisfied with services provided, by Indigenous status, by housing program type, 2014 (%) ................................................................................................. 52

162 National Social Housing Survey: detailed results 2014
Figure 14.1: Proportion of tenants satisfied with day-to-day maintenance services, by state and territory, by housing program type, 2014 (%) ................................................................... 86
Figure 14.2: Proportion of tenants satisfied with day-to-day maintenance services, by remoteness category, by housing program type, 2014 (%) ..................................................... 87
Figure 14.3: Proportion of tenants satisfied with day-to-day maintenance services, by Indigenous status, by housing program type, 2014 (%) .......................................................... 88
Figure 14.4: Proportion of tenants satisfied with day-to-day maintenance services, by previous homelessness, by housing program type, 2014 (%) ................................................. 89
Figure 14.5: Proportion of tenants satisfied with day-to-day maintenance services, by dwelling condition, 2014 (%) ....................................................................................................... 90
Figure 14.6: Proportion of tenants who were satisfied with day-to-day maintenance services, by dwelling utilisation, by housing program type, 2014 (%) ................................................. 91
Figure 15.1: Satisfaction with emergency maintenance services, by state and territory, by housing program type, 2014 (%) ................................................................................................. 93
Figure 15.2: Satisfaction with emergency maintenance services, by remoteness category, by housing program type, 2014 (%) ................................................................................................. 94
Figure 15.3: Satisfaction with emergency maintenance services, by Indigenous status, by housing program type, 2014 (%) ................................................................................................. 95
Figure 15.4: Satisfaction with emergency maintenance services, by previous homelessness, by housing program type, 2014 (%) ................................................................................................. 96
Figure 15.5: Satisfaction with emergency maintenance services, by dwelling condition, 2014 (%) ................................................................................................................................................... 97
Figure 15.6: Satisfaction with emergency maintenance services, by dwelling utilisation, by housing program type, 2014 (%) ................................................................................................. 98

National Social Housing Survey: detailed results 2014 163
Related publications This report, National Social Housing Survey: Detailed results 2014, is the latest in a series of publications presenting results from biennial surveys of social housing tenants. The earlier reports can be downloaded for free from the AIHW website: <www.aihw.gov.au>. The website also includes information on ordering printed copies.
The following AIHW publications relating to housing and homelessness may also be of interest:
• Australian Institute of Health and Welfare 2013. Specialist homelessness services: 2012–2013. Cat. no. HOU 27. Canberra: AIHW.
• Australian Institute of Health and Welfare 2014. Housing assistance for Indigenous Australians. Cat. no. IHW 131. Canberra: AIHW.
• Australian Institute of Health and Welfare 2014. Housing assistance in Australia 2014. Cat. no. HOU 275. Canberra: AIHW.

National Social Housing Survey
Detailed results 2014
This report provides an overview of the national findings of the 2014 National Social Housing Survey. The report shows that the majority of tenants are satisfied with the services provided by their housing organisation, with community housing tenants the most satisfied. Tenants report a range of benefits from living in social housing and the majority live in dwellings of an acceptable standard.
National Social H
ousing Survey: detailed results 2014A
IHW