Embed Size (px)
Citation preview

Sun et al. BMC Public Health 2013, 13:449http://www.biomedcentral.com/1471-2458/13/449
RESEARCH ARTICLE Open Access
Physical activity in older people: a systematicreviewFei Sun1, Ian J Norman2 and Alison E While2*
Abstract
Background: Physical activity (PA) in older people is critically important in the prevention of disease, maintenanceof independence and improvement of quality of life. Little is known about the physical activity of the older adultsor their compliance with current physical activity guidelines.
Methods: A systematic literature search of the published literature was conducted. Included were published reportsof original research that independently reported: the PA level of non-institutional older adults (aged 60 years andover); and the proportion of older adults in the different samples who met PA recommendations or guidelines. Thereview was restricted to studies published since 2000 to provide a current picture of older adults’ PA levels.
Results: Fifty three papers were included in the review. The percentage of older adults meeting recommendedphysical activity ranged from 2.4 – 83.0% across the studies. Definitions of “recommended” physical activity in olderadults varied across the studies as did approaches to measurement which posed methodological challenges todata analysis. Older age groups were less likely than the reference group to be regularly active, and women wereless likely than men to achieve regular physical activity, especially leisure time physical activity, when measured byboth subjective and objective criteria.
Conclusion: The review highlights the need for studies which recruit representative random samples of communitybased older people and employ validated measurement methods consistently to enable comparison of PA levelsover time and between countries.
Keywords: Physical activity, Exercise, Older people, Older adults
BackgroundRegular physical activity (PA) can bring significant healthbenefits to people of all ages and the need for PA doesnot end in later life with evidence increasingly indicatingthat PA can extend years of active independent living,reduce disability and improve the quality of life for olderpeople [1]. Indeed a large scale longitudinal 8 year studyfound that every additional 15 minutes of daily PA up to100 minutes per day resulted in a further 4% decrease inmortality from any cause [2]. Increasing PA will helpminimise the burden on health and social care throughenabling healthy ageing [3,4].There is no known review of PA among older people
and it is not known whether active older people complywith recommended PA levels. Understanding the extent
* Correspondence: [email protected]’s College London, Florence Nightingale School of Nursing & Midwifery,57 Waterloo Road, London SE1 8WA, UKFull list of author information is available at the end of the article
© 2013 Sun et al.; licensee BioMed Central LtdCommons Attribution License (http://creativecreproduction in any medium, provided the or
of PA will provide a global perspective of PA amongolder people within the context of an increasing desireto promote PA goals across all age groups. The aim ofthis review was to establish global levels of PA amongolder people as reported in the published literature.Establishing PA prevalence in older community dwellingpeople provides a baseline against which changes in PAcan be measured, international comparisons drawn andthe success or otherwise of public health interventionsto increase PA evaluated.
MethodsSearch strategyThe following methods were used to locate relevant pub-lished studies from January 2000 – 11 April 2011. Elec-tronic searches of computerized databases were carriedout on English language databases (The Cochrane Library,PubMed, MEDLINE, EMBASE, CINAHL, PsycINFO,
. This is an Open Access article distributed under the terms of the Creativeommons.org/licenses/by/2.0), which permits unrestricted use, distribution, andiginal work is properly cited.

Sun et al. BMC Public Health 2013, 13:449 Page 2 of 17http://www.biomedcentral.com/1471-2458/13/449
British Nursing Index (BNI) and Scopus) and Chinese da-tabases: Chinese Biomedical, VIP Chinese Science Journalsand WANFANG DATA. Keyword combinations for elec-tronic database searches are listed in Table 1. The searchwas limited to the English and Chinese languages.
Selection criteriaPapers were reviewed if they met the following criteria:(1) original research; (2) independently reported the PAlevel of non-institutional older people (adults aged 60years and over); (3) reported the proportion of any of PArecommendation or guidelines achieved by the sample.No attempt was made to access unpublished studies or
other ‘grey’ literature. The study selection process is setout in Figure 1.
Data extraction and appraisalAll authors devised the research strategy. Initial screen-ing was undertaken by one researcher (FS) and thenchecked by another (AEW). Disagreements about inclu-sion were discussed until agreement was reached. Oneresearcher (FS) extracted the following data from the se-lected studies: country of study, study sample, measure-ments, recommendations and main results. Anotherresearcher (AEW) verified the extracted data and madecorrections where necessary. Disagreements were re-solved by reference to the third researcher (IJN). Allthree researchers contributed to the synthesis of thedata.
PA recommendations or guidelinesDefinitions of “recommended” PA in older adults variedacross the studies with some studies employing two ormore guidelines. These guidelines are summarized inTable 2. The minimum recommended PA level in theguidelines in most studies was 150 minutes of moderateor vigorous PA per week and we adopted this standardas the desired PA level for the purpose of this review.We categorised the selected studies according to theirunderpinning PA guidelines, and identified studies asfalling into one of two groups according to the detailprovided by the study authors on the guidelinesfollowed. Twenty six studies which stated only the totalamount of PA per week were classified within the ‘lessdetailed guideline group’. Studies which stated theweekly frequency and daily dosage towards the totalamount of weekly PA were classified as being in the
Table 1 Search terms
Facets Search terms
PA Exercise/s; physical activity/activities
Old people Aged, old people, elderly, elders, aging adult, ageing adult, ol
Research Prevalence, health survey/surveys, survey/surveys, surveillance
‘detailed guideline group’. According to the Physical Ac-tivity Guideline Advisory Committee’s report [5], de-tailed guidelines, such as 1995 CDC/ACSM guideline istoo specific. In other words, the existing scientific evi-dence cannot distinguish the health benefits of 30 mi-nutes of PA on 5 days a week from those gained through50 minutes of PA on 3 days a week.
Results and discussionAn overview of selected papersA total of 53 papers met the inclusion criteria. The mainfindings of the selected studies are reported in Tables 3and 4.Most of the studies were conducted in the United
States and Australia (USA n=19; Australia n=10; UKn=5; Brazil n=4; China n=4; Canada n=4; New Zealandn=1; Colombia n=1; South Africa n=1; Greece andCyprus n=1; Cyprus n=1; Sweden n=1; Switzerland n=1).Forty nine papers reported cross-sectional studies andfour reported longitudinal studies. The sample sizesranged from 54 – 43,259. The number of studiesconducted each year over the search period was not con-stant (1990–1994, n=2; 1995–1999, n=12; 2000–2004,n=32; 2005–2009, n=18; 2010–2011, n=2) with morethan half being conducted between 2000 and 2004.Forty seven studies measured PA intensity, duration,
and frequency using subjective measures (interview orself-reported questionnaires) and six reported objectivedata gathered using an accelerometer. Two studies com-pared subjective and objective data measurements.While 39 studies recorded PA taken in periods of 10 mi-nutes or more, other studies recorded all PA.Physical activity comprises leisure-time PA, occupa-
tional PA, household PA and transportation PA. Leisure-time PA (LTPA) was most often measured andcompared to the criterion for meeting PA recommenda-tions. However, occupational, household and transporta-tion PA were gathered in some studies. PA volume wascalculated differently across the studies including: totalmetabolic equivalents (METs), minutes of weekly PA;minutes of participation in and frequency of PA duringthe week; kilocalories expended per kilogram of weightper day; and time in moderate to vigorous PA from ac-celerometers. To calculate minutes of weekly moderateto vigorous PA, some authors summed the duration ofmoderate and vigorous PA (MPA+VPA) while othersdoubled the time of vigorous PA because of its higher
d men, old women, older people, older men, older women, older person
, statistics, epidemiologic

Figure 1 Literature identification process.
Sun et al. BMC Public Health 2013, 13:449 Page 3 of 17http://www.biomedcentral.com/1471-2458/13/449
intensity (MPA+2VPA). The definition of moderate andvigorous PA also varied across the studies. For instance,the minimum cut off of moderate PA varied from 3MET, 3.3 MET to 4 MET across the studies. Given thevariety of methods of data collection and calculation ofPA level, a meta-analysis was not attempted.
Levels of PA within recommendations or guidelinesThirty two studies adopted the more detailed PA guide-lines while 26 studies were in the less detailed groupwith some studies employing two or more guidelines.Although most of the PA guidelines stated the total PAamount which should be accumulated in bouts of at
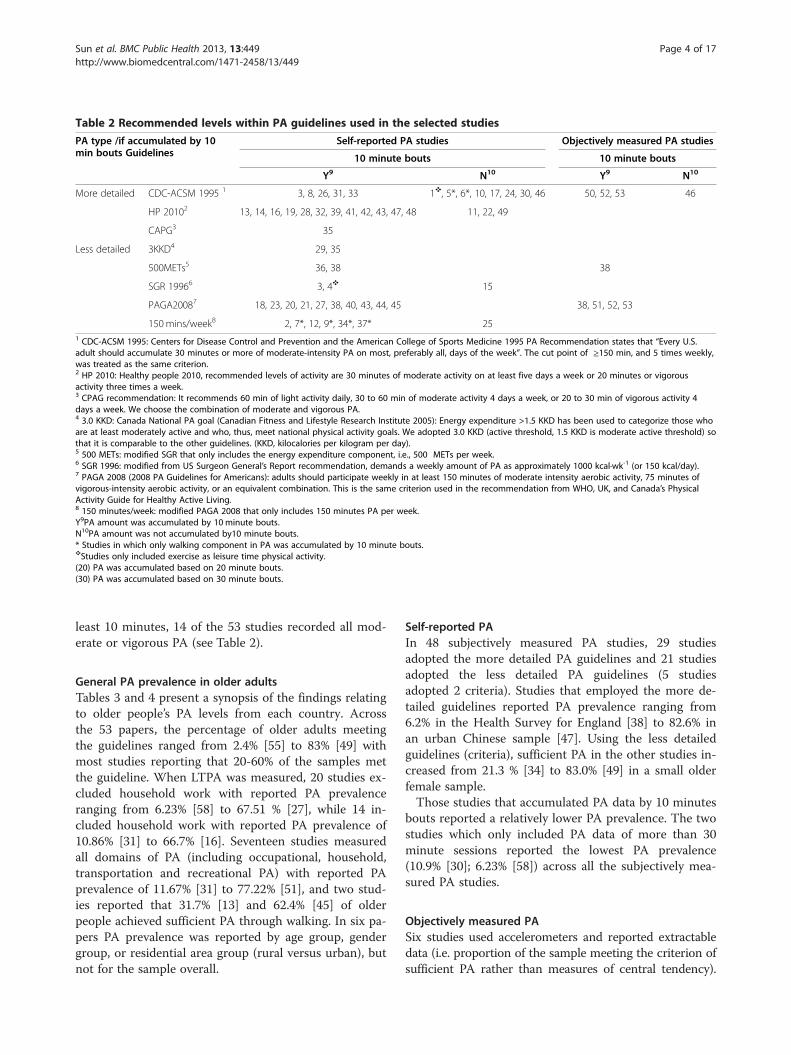
Table 2 Recommended levels within PA guidelines used in the selected studies
PA type /if accumulated by 10min bouts Guidelines
Self-reported PA studies Objectively measured PA studies
10 minute bouts 10 minute bouts
Y9 N10 Y9 N10
More detailed CDC-ACSM 1995 1 3, 8, 26, 31, 33 1❖, 5*, 6*, 10, 17, 24, 30, 46 50, 52, 53 46
HP 20102 13, 14, 16, 19, 28, 32, 39, 41, 42, 43, 47, 48 11, 22, 49
CAPG3 35
Less detailed 3KKD4 29, 35
500METs5 36, 38 38
SGR 19966 3, 4❖ 15
PAGA20087 18, 23, 20, 21, 27, 38, 40, 43, 44, 45 38, 51, 52, 53
150 mins/week8 2, 7*, 12, 9*, 34*, 37* 251 CDC-ACSM 1995: Centers for Disease Control and Prevention and the American College of Sports Medicine 1995 PA Recommendation states that “Every U.S.adult should accumulate 30 minutes or more of moderate-intensity PA on most, preferably all, days of the week”. The cut point of ≥150 min, and 5 times weekly,was treated as the same criterion.2 HP 2010: Healthy people 2010, recommended levels of activity are 30 minutes of moderate activity on at least five days a week or 20 minutes or vigorousactivity three times a week.3 CPAG recommendation: It recommends 60 min of light activity daily, 30 to 60 min of moderate activity 4 days a week, or 20 to 30 min of vigorous activity 4days a week. We choose the combination of moderate and vigorous PA.4 3.0 KKD: Canada National PA goal (Canadian Fitness and Lifestyle Research Institute 2005): Energy expenditure >1.5 KKD has been used to categorize those whoare at least moderately active and who, thus, meet national physical activity goals. We adopted 3.0 KKD (active threshold, 1.5 KKD is moderate active threshold) sothat it is comparable to the other guidelines. (KKD, kilocalories per kilogram per day).5 500 METs: modified SGR that only includes the energy expenditure component, i.e., 500 METs per week.6 SGR 1996: modified from US Surgeon General’s Report recommendation, demands a weekly amount of PA as approximately 1000 kcal·wk-1 (or 150 kcal/day).7 PAGA 2008 (2008 PA Guidelines for Americans): adults should participate weekly in at least 150 minutes of moderate intensity aerobic activity, 75 minutes ofvigorous-intensity aerobic activity, or an equivalent combination. This is the same criterion used in the recommendation from WHO, UK, and Canada’s PhysicalActivity Guide for Healthy Active Living.8 150 minutes/week: modified PAGA 2008 that only includes 150 minutes PA per week.Y9PA amount was accumulated by 10 minute bouts.N10PA amount was not accumulated by10 minute bouts.* Studies in which only walking component in PA was accumulated by 10 minute bouts.❖Studies only included exercise as leisure time physical activity.(20) PA was accumulated based on 20 minute bouts.(30) PA was accumulated based on 30 minute bouts.
Sun et al. BMC Public Health 2013, 13:449 Page 4 of 17http://www.biomedcentral.com/1471-2458/13/449
least 10 minutes, 14 of the 53 studies recorded all mod-erate or vigorous PA (see Table 2).
General PA prevalence in older adultsTables 3 and 4 present a synopsis of the findings relatingto older people’s PA levels from each country. Acrossthe 53 papers, the percentage of older adults meetingthe guidelines ranged from 2.4% [55] to 83% [49] withmost studies reporting that 20-60% of the samples metthe guideline. When LTPA was measured, 20 studies ex-cluded household work with reported PA prevalenceranging from 6.23% [58] to 67.51 % [27], while 14 in-cluded household work with reported PA prevalence of10.86% [31] to 66.7% [16]. Seventeen studies measuredall domains of PA (including occupational, household,transportation and recreational PA) with reported PAprevalence of 11.67% [31] to 77.22% [51], and two stud-ies reported that 31.7% [13] and 62.4% [45] of olderpeople achieved sufficient PA through walking. In six pa-pers PA prevalence was reported by age group, gendergroup, or residential area group (rural versus urban), butnot for the sample overall.
Self-reported PAIn 48 subjectively measured PA studies, 29 studiesadopted the more detailed PA guidelines and 21 studiesadopted the less detailed PA guidelines (5 studiesadopted 2 criteria). Studies that employed the more de-tailed guidelines reported PA prevalence ranging from6.2% in the Health Survey for England [38] to 82.6% inan urban Chinese sample [47]. Using the less detailedguidelines (criteria), sufficient PA in the other studies in-creased from 21.3 % [34] to 83.0% [49] in a small olderfemale sample.Those studies that accumulated PA data by 10 minutes
bouts reported a relatively lower PA prevalence. The twostudies which only included PA data of more than 30minute sessions reported the lowest PA prevalence(10.9% [30]; 6.23% [58]) across all the subjectively mea-sured PA studies.
Objectively measured PASix studies used accelerometers and reported extractabledata (i.e. proportion of the sample meeting the criterion ofsufficient PA rather than measures of central tendency).

Table 3 Physical activity studies which used subjective measures
NO. Author, year ofpublication, country
Data collectionperiod
Sample size△ Data source N and %of sufficientlyactive old people
Comment
1 Merom et al. [6]2006, Australia
1989-1990 8160, (60+yr) National health survey 2285, 28% High quality, National representativesample, Validated questionnaire
1995-1996 7620, (60+yr) National health survey 2027, 26.6%
2000 4359, (60+yr) National health survey 1125, 25.8%
2 Jerome et al. [7]2006, USA
1991(I) and 1994 (II) 243 F (70-79yr)without functionaldeficit
Women’s Health andAging Studies I and II
53, 22% High quality, Regional representativesample, Validated questionnaire
3 Brownson et al. [8]2000, USA
1996 24406, 14307 (65-74yr),and 10099 (75+yr)
Behavioural Risk FactorSurveillance System(BRFSS)
CDC-ACSM 1995 High quality National representativesample Validated questionnaire
5696, 23.34%
65-74: 25.7 % 75 +: 20.0%
SGR 1996
6480, 26.55%
65-74: 30.4 % 75 +: 21.1%
4 Brach et al. [9]2004, USA
1998 3075 (70–79), 1584 F Health ABC study 750, 24.4% Men: 33.07%Women: 16.22%
High quality Regional representativesample Standardized questionnaire
5 Phongsavan et al.[10] 2004, Australia
1998 4321, 1675 M NSW State healthsurvey
Domestic PA excluded 1634,37.82% Men: 46.7% Women: 32.2%Domestic PA included 2184,50.55% Men: 59.8% Women: 44.7%
High quality Regional representativesample Validated questionnaire
6 Chau et al. [11],2008, Australia
1998 2068, (65+yr) NSW Population healthsurvey
748, 36.15% High quality Regional representativesample Validated questionnaire
65-74: 1357,40.1%
75 +: 711,28.6%
2002 3420, (65+yr) NSW Population healthsurvey
1295, 37.88%
65-74: 2038,41.8%
75 +:1382, 32.1%
2003 3577, (65+yr) NSW Population healthsurvey
1217, 34.02%
65-74: 2022,39.8%
75-:1555,26.5%
2004 2706, (65+yr) NSW Population healthsurvey
1073, 39.66%
65-74:1552, 45.5%
75-:1154, 31.8%
2005 3391, (65+yr) NSW Population healthsurvey
1350, 39.82%
65-74: 1921, 45.5%
75-:1470, 32.4 %
Sunet
al.BMCPublic
Health
2013,13:449Page
5of
17http://w
ww.biom
edcentral.com/1471-2458/13/449

Table 3 Physical activity studies which used subjective measures (Continued)
7 Hamdorf et al. [12]2002, Australia
1998 773, (60+yr) Social EnvironmentalRisk ContextInformation System(SERCIS)
Didn’t report the prevalence ofwhole sample 60–64: 181, 50.8%,85+:26, 15.4% Figure 2 showed thetrend of declining
High quality Regional representativesample Validated questionnaire
8 Merom et al. [13]2009, Australia
1998 2068, (65+yr) The NSW Populationhealth survey
532, 25.73% High quality Regional representativesample Validated questionnaire
65-74: 1357,28.0
75+: 711, 21.4
2002 3420, (65+yr) The NSW Populationhealth survey
970, 28.35%
65-74: 2038,30.9%
75+: 1382, 24.6%
2003 3577, (65+yr) The NSW Populationhealth survey
899, 25.13%
65-74: 2022,29.3%
75+:1555,19.7%
2004 2706, (65+yr) The NSW Populationhealth survey
781, 28.85%
65-74:1552, 32.3%
75+: 1154, 24.2%
2005 3391, (65+yr) The NSW Populationhealth survey
985, 29.04%
65-74:1921, 32.9%
75+: 1470, 24.0%
2006 2388, (65+yr) The NSW Populationhealth survey
744, 31.17%
65-74: 1318,35.7%
75+: 1070, 25.6%
9 Heesch & Brown [14]2008, Australia
1999 3613 F, 75.28 (73–78 yr) Australian LongitudinalStudy onWomen’s Health
1572, 43.5% High quality National representativesample Validated questionnaire
10 Lim & Taylor [15] 2005,Australia
1999 8881, 5045 F, 73.8(95%CI 73.6–74.0yr)
NSW Older People’sHealthSurvey (OPHS)
4343, 48.9% Women, 39.7%,Men, 61.1%
High quality Regional representativesample Validated questionnaire
11 Lawlor et al. [16]2002, UK
1999-2000 2341 F (60-79yr) British Women’s HeartandHealth Study
Domestic PA included 1561, 66.7%Domestic PA excluded 492, 21%Domestic activity (heavy housework and heavy gardening/DIY)
High quality National representativesample Validated questionnaire
12 Hillsdon et al. [17]2008, UK
1999-2001 4103 F, (60-79yr) British Women’s HeartandHealth Study
926, 22.57% High quality National representativesample Validated questionnaire
Sunet
al.BMCPublic
Health
2013,13:449Page
6of
17http://w
ww.biom
edcentral.com/1471-2458/13/449

Table 3 Physical activity studies which used subjective measures (Continued)
13 Brown et al. [18]2003, USA
2001 30146 (65+yr), 17081 F BRFSS 11305, 37.5%, Men:42.03%
Women: 31.90% High quality National representativesample, Validated questionnaire
14 Brown et al. [19]2005, USA
2001 22174 (65+yr), 13834 F BRFSS 9202, 41.50%, Men:47.38%, 65–74:5369,49.3%75+ :2971,43.9%
Women: 37.96%65–74: 8059,41.3% 75+: 5775, 33.3%
High quality National representativesample, Validated questionnaire
15 Ashe et al. [20]2009, Canada
2000-2001 24233 (65+yr), 60%F(76% reported havingone or more chronicdiseases)
Canadian CommunityHealth Survey Cycle 1.1
No chronic disease One or more chronic disease High quality National representativesample Validated questionnaire
Total 7318, 30.2% 5622, 23.2%
Women
65-74 26.7% 21.9%
75-84 18.1% 12.7%
85+ 14.5% 7.4%
Men
65-74 40.6% 38.0%
75-84 35.9% 27.3%
85+ 26.9% 20.8%
16 US CDC [21]2007, USA
2001 (65+yr), ( whole sample205,140)
BRFSS Men 43.1% women 32.2% High quality National representativesample Validated questionnaire
2005 (65+yr), ( whole sample356,112)
BRFSS Men 44.5% women 36.3%
17 Muntner et al [22]2005, China
2000-2001 1824 (65-79yr), 939 M InterASIA study 821, 45% High quality National representativesample Validated questionnaire
Rural 52.7%
Urban 9.8%
18 Benedetti et al. [23]2008, Brazil
2002 875, 71.6 ± 7.9(65-101yr), 437M
A representative survey:Profileof Old Persons in theMunicipalityof Florianópolis
519, 59.3% Men 63.6% Women 55% High quality Regional representativesample Validated questionnaire
19 Ding et al. [24]2009, China
2002 799 (60+yr) 2002 Beijing NutritionandHealth Survey
254, 31.79% 60–74: 673,33% 75+: 126, 25.3%
High quality Regional representativesample Validated questionnaire
20 Hallal et al. [25]2003, Brazil
2002 583 (60+yr), 360F Cross-sectional surveyPelotas, Brazil
270, 46.3% 60–69:307,56.2% 70+:276,35.3% Men 60–69:124,55.4% 70+:99,43%
Women 60–69:183,56.8% 70+: 177,30.3%
High quality Regional representativesample Validated questionnaire
21 2007 60-69: 42.7% 70+: 23.7%
Sunet
al.BMCPublic
Health
2013,13:449Page
7of
17http://w
ww.biom
edcentral.com/1471-2458/13/449

Table 3 Physical activity studies which used subjective measures (Continued)
Knuth et al. [26]2010 Brazil
(65+yr), (whole sample2969)
Cross-sectional surveyPelotas, Brazil
High quality Regional representativesample Validated questionnaire
22 Meyer [27]2005 Switzerland
2002 4057 (65+yr) Swiss Health Survey* Total: 2739, 67.51% High quality National representativesample Validated questionnaire
65-79: 3257, 80.9%
80+: 800, 58.1%
Sports/exercise
Total: 515, 12.7%
65-79: 25.5%
80+: 24.77%
Habitual
Total: 2314, 57.04%
80+: 51.7%
65-79: 45.4%
23 Frank et al. [28]2010, USA
2001-2002 1970 (65+yr) Strategies forMetropolitanAtlanta’s RegionalTransportationand Air Quality(SMARTRAQ study,Atlanta region)
Total: 791, 40.16% 65–74:1198,42.7% 75–84: 622, 38.0%85+:150, 28.8%
High quality Regional representativesample Validated questionnaire
24 Guinn et al. [29]2002, USA
Unclear,earlier than2002
244 (60-81yr),162 or 170 F
Cross-sectional surveyin aretirement area, Texas
136, 55.74% men: (82) 74,66.57% women: (162)170, 50.59%
Weak quality Sample bias likely duetorecruitment procedure Testing ofinstrument not reported. % of maleor female was inconsistent in thepaper
25 Taylor-Piliae et al.[30] 2006, USA
2001-2004 1010, 65.8 ±2.8(60–69yr), 631 M
Healthy control ofAtheroscleroticdisease vascularfunction andgenetic epidemiology(ADVANCE) Study
All domain PA measured byStanford Seven-Day PA Recall646, 64%
High quality Sample was selectedfroma medical insurance programmeValidated questionnaire
On-the-job activity and leisure-timeactivities measured by StanfordBrief Activity Survey 616, 61%,Men 61.5% women 60.7%
26 Allender et al, [31]2008, UK
2003 1181 (65+yr) Health Survey forEngland (HsfE)
OccupationalPA included
OccupationalPA excluded
High quality National representativesample Validated questionnaire
138, 11.67% 128, 10.86%
Men:14.68% Men: 13.3%
65-74: 740, 18% 65-74: 740,16.4
Sunet
al.BMCPublic
Health
2013,13:449Page
8of
17http://w
ww.biom
edcentral.com/1471-2458/13/449

Table 3 Physical activity studies which used subjective measures (Continued)
75+: 441, 9.1% 75+: 441, 8.7%
Women: 9.41% Women: 9.03%
65-74: 853, 13.7% 65-74: 853, 13.0%
75+: 717, 4.3% 75+: 717, 4.3%
27 Florindo et al. [32]2009, Brazil
2003 (60-65yr), the wholesample was 1318
Health Survey of theMunicipalityof Sao Paulo
Total PA 899, 68.2% High quality Regional representativesample Validated questionnaire
LTPA 232, 17.6%
Transportation 83, 6.3%
Occupational 250, 19%
Household 585, 44.4%
28 Joubert et al. [33]2007, South Africa
2003 (60+yr) World Health Survey2003
Men Women High quality National representativesample Method of samplerecruitmentnot reported Validated questionnaire
60-69: 21.2% 60-69: 18.4%
70+: 22.3% 70+: 10%
29 Meisner et al. [34]2010, Canada
2003 12042 (60+yr), 6823F Part of CanadianCommunityHealth Survey (CCHS;Cycle 2.1)
2565, 21.3% High quality National representativesample Validated questionnaire
30 Mummery et al. [35]2007, New Zealand
2003 1894 (60+yr), 1009 F Obstacles to ActionSurvey
974, 51.4% High quality National representativesample Validated questionnaire
Men 55.2% Women 47.4%
60-64:603, 56.5 65-69: 445, 52.8%
70-74: 363, 51.1% 75-79: 270, 47.7%
80+: 213, 32.3%
31 McGuire et al. [36]2006, USA
2003 36,010 F (65+yr) BFRSS 6986, 19.4% High quality National representativesample Validated questionnaire
65-69:10071, 23.0% 70-74: 9150, 21.3%
75-79: 7909, 18.5% 80-84: 5580, 15.6%
85+: 3300, 13.6%
32 Pronk et al. [37]2004, USA
not reported, 2002-2004
685,74.5± 6.7yr Stratified randomsample ofHealthPartnersmembership,used questions fromthe BRFSS
279, 40.7% High quality Stratified randomsampleValidated questionnaire
33 Stamatakis et al.[38] 2007, UK
2003 2763 (65+yr), 1187 M Health Survey forEngland (HsfE)
Domestic excluded Domestic included High quality National representativesample Validated questionnaire
Total 172, 6.23% 306, 11.09%
Men 7.6% 13.6%
Women 5.2% 9.2%
Sunet
al.BMCPublic
Health
2013,13:449Page
9of
17http://w
ww.biom
edcentral.com/1471-2458/13/449

Table 3 Physical activity studies which used subjective measures (Continued)
34 DiSipio et al. [39]2006, Australia
2004 1588 (60-75yr) Queensland Cancer RiskStudy(Active Australia Survey)
891, 56.1% High quality Regional representativesample Validated questionnaire
35 Ready et al. [40]2009, Canada
2005 889 (65+yr) Cross-sectional surveyof randomsample, Winnipeg,Canada
CPAG High quality Regional representativesample Validated questionnaire
Men Women
65-79: 46.9% 65-79: 54.4%
80+: 24.4% 80+: 40%
3KKD
Men Women
65-79: 63.4% 65-79: 63.7%
80+: 42.2% 80+: 48.2%
36 Panagiotakos et al.[41] 2007, Cyprus
2004-2005 117 (65+yr) Health and nutritionsurveyof elderly people inCyprus(group withoutdiabetes)
67, 57.26% High quality Random sample frommulti-geographical area Validatedquestionnaire
37 Sims et al. [42]2007, Australia
not reported 2005-2006
330 (65+yr), 190F Cross-sectional surveyusingAAS questions Victoria,Australia
187, 56.7% High quality Regional representativesample Validated questionnaire
Men:61% Women:54.2%
65-69: 63, 54%70–74: 63, 50.8%
75-79: 49, 70%80–85:23, 56.5%
85+: 9, 44.4%*
38 Tucker et al. [43]2011, USA
2005–2006 1018 (60+yr) NHANES 2005–2006,self-reported data
PAGA 2008(MPA+VPA) High quality National representativesample Validated questionnaire
534, 52.44%
60-69: 441, 59.7% 70+: 577, 46.9%
PAGA 2008(MPA+2VPA)
538, 52.89%
60-69: 441, 60.6% 70+: 577, 47.0%
≥500 MET-min•wk-1
572, 56.22%
60-69: 441, 63.6% 70+: 577, 50.8%
39 Tyrovolas et al. [44]2009, MediterraneanIslands from Greeceand Cyprus
2005-2007 930 non-diabetic74±7.1yr
MEDIS (MEDiterraneanIslands)study but theMeasurement andcriteria changed slightly
353, 38% High quality Random sample frommulti-geographical area Validatedquestionnaire
Sunet
al.BMCPublic
Health
2013,13:449Page
10of
17http://w
ww.biom
edcentral.com/1471-2458/13/449

Table 3 Physical activity studies which used subjective measures (Continued)
betweenother Cyprus study
40 Gómez et al. [45]2010, Colombia
2007 1966, 70.7±7.7yr Multilevel cross-sectional study,Bogotá
1227, 62.4% High quality Random sample frommulti neighbourhood in one cityValidate questionnaire
41 McGuire et al. [46]2010, USA
2007 6138 (65+yr) BRFSS 2007 of Hawaii,Kansas &Washington
2671, 43.51% High quality Regional representativesample Validated questionnaire
42 Xu et al. [47]2009, China
2007 407 (65-69yr) Cross- sectional survey,GuangdongProvince using GPAQ
Rural 60.9% High quality Regional representativesample Validated questionnaire
Unban 82.6%
43 US CDC, [48]2008, USA
2007 (65+yr), (wholesample 399,107)
BRFSS HP 2010 High quality National representativesample Validated questionnaire
39.3%
PAGA 2008
51.2%
44 Bird et al. [49]2008, Australia
not reported 2006-2008
66F (69.3 ± 6.7yr) Cross-sectional surveyWesternRegion of Melbourne
55, 83%, Small sample Moderate quality Non-random smallsample Validated measurement
45 Carlson et al. [50]2010, USA
2008 2008 (65+yr), (wholesample 21,781)
National HealthInterview Surveyemployed light-moderate tosubstitute moderate
PAGA 2008 High quality National representativesample Validated questionnaire
30.4%
HP 2010
22.6%
46 Hurtig-Wennlofet al. [51] 2010,Sweden
not reported before2009
54 (66-85yr), 31F Direct validity studyusingaccelerometer-measured PA
39, 72.22% Moderate quality Small conveniencesample Modified version of validatedinstrument and Testing ofinstrumentreported.
47 Shores et al. [52]2009, USA
not reported Before2009
448 (65+yr),238 M Cross-sectional surveyWesternNorth Carolina used 7-day recall
134, 29.9% Moderate quality Random sampleLowresponse rate Testing of instrumentnotreported.
48 Xue [53]2010, China
2010 2015 (60-75yr),910M Coss-sectional surveyNanjing,Jiangsu province
956, 47.44%, Men:44.2%Women: 50.1%
Moderate quality Non-randomsample,Validated questionnaire
49 Fleming et al. [54]2007, USA
1997–2003 43,259 , 74.9± 6.9 yr,16198M
National HealthInterviewSurvey (NHIS)
8695, 20.1% (age adjusted21.1%), Men: 25.6%,(25.8% adjusted), Women:16.8%, (17.6% adjusted)
High quality National representativesample, Validated questionnaire
Sunet
al.BMCPublic
Health
2013,13:449Page
11of
17http://w
ww.biom
edcentral.com/1471-2458/13/449

Table 4 Physical activity studies which used objective measures
No. Author, Year ofpublication, Country
Sample size/Data source Data collectionperiod
Accelerometer Main variable(cut point)
Epoch/ 10 minbouts
Guidelines Number and percentageof sufficiently active oldpeople
50 Troiano et al. [55]2003–2004, USA
1260, 624 M/ National Healthand Nutritional ExaminationSurvey, NHANES
2003–2004 Actigraph model 7164 MPA (2020–5998counts/min) VPA(5999 counts/min)
1min /Y CDC 1995 30, 2.4% men 2.5%women 2.3%
38 Tucker et al [43]2011, USA
1018 (60+yr)/ NHANES,accerlerometry recorded data
2005–2006 Actigraph model 7164 MPA (2020–5998counts/min) VPA(5999 counts/min)
1min /Y PAGA 2008 74, 7.25% 60–69: 441,8.5% 70+: 577, 6.3%
METPA MPA (2020–5998counts/min) +VPA (5999counts/min)
1min /Y ≥500 MET-min·wk-1
176,17.24% 60–69: 441,26.2% 70+: 577, 10.4%
51 Harris et al. [56]2009, UK
238 (65+yr)/ Cross-sectionalsurvey from Oxfordshire, UK
2006 Actigraph model GT1M MPA (2000–3999count/min) VPA(≥4000 count/min)
1min /Y PAGA 2008 6, 2.5%
46 Hurtig-Wennlofet al. [51] 2010,Sweden
54 (66 -85yr), 23M/ directvalidity study by accelerometer
not reported,Before 2009
Actigraph, model GT1M MPA (mixed lifestyleactivities: 760–2019counts/min; ambulatoryactivities: 2020–4944counts/min) VPA:≥4944 counts/min
15S /N CDC 1995 47, 87.04%
52 Colley et al. [57]2011, Canada
901 (60-79yr), 452 M/CanadianHealth Measures Survey (CHMS)
2007-2009 Actical accelerometer(Phillips – Respironics,Oregon, USA)
MPA(1, 535–3,962counts/min) VPA(≥3,962 counts/min)
1min /Y CDC 1995 40, 4.5% men: 5.3%women: 3.8%
1min /Y PAGA 2008 21, 13.1% men: 13.7%women: 12.6%
53 Davis & Fox [3]2007 UK, France& Italy
163 (76.1±4.0 yr), 70 M/healthyvolunteers recruited to the BetterAgeing Project at four Europeansites based in the UK, Franceand Italy.
not reported2004-2006
Actigraph model 7164 MVPA (≥1952 counts/min) 1min /Y CDC 1995 0, 0
MVPA (≥1952 counts/min) 1min /Y PAGA 2008 3, 1.84%
Sunet
al.BMCPublic
Health
2013,13:449Page
12of
17http://w
ww.biom
edcentral.com/1471-2458/13/449

Sun et al. BMC Public Health 2013, 13:449 Page 13 of 17http://www.biomedcentral.com/1471-2458/13/449
The actigraph accelerometer was used in five studies andActical in one study. When measured against the less de-tailed guidelines, the lowest prevalence (1.84%) wasreported by Davis and Fox [3] based on an European sam-ple and the highest was 17.2% from a US national survey,NHANES 2005–2006 [43]. Applying the more detailedguidelines, Davis and Fox [3] found nobody achieved suffi-cient PA and Colley [57] reported the highest proportionof 4.5% in this group with the exception of Hurtig-Wennlof et al.’s [51] exceptional finding of 87.04%.However, there was a difference between the studies
using self-report compared to the objective measure-ment of PA. In our review, two studies compared thesubjective and objective data. Tucker et al.’s [43] analysisof the NHANES 2005–2006 data found that the suffi-ciently active group proportion defined by accelerometermeasurement was 7.25% and 17.24% (using differentguidelines); this increased to 54.2% when measured byquestionnaire. Hurtig-Wennlof et al.’s Swedish study[51] reported a 87.04% objectively measured PA preva-lence which was higher than the self-reported IPAQ dataof 72.2%.
Gender differences in PATwenty two studies reported the recommended PAprevalence in males and females separately. In general,men’s PA levels were higher than women’s. In the self-reported data, gender differences of PA ranged from0.8% [30] to 21.4% [15], while the differences measuredby accerlerometer were significantly lower (0.2% and1.5%). However, we noticed that in the self-reported totalPA, increased participation in PA by women exceededthat of men in three studies [40,53].
Residential differences in PATwo Chinese papers reported the PA prevalence by placeof residence and reported different results. Muntner et al.[22] reported sufficient all domain PA prevalence among52.7% of their rural and 9.8% of their urban older peoplesamples using the US CDC 1995 criterion from theInterASIAN Study. However, Xu et al. [47] reported thatGuangdong province urban residents were more activethan rural residents, with 82.6% of the urban and 60.9% ofthe rural samples attaining the HP 2010 goals measuredby GPAQ.
PA prevalence across age groupsEighteen studies measured PA subjectively and two stud-ies measured PA objectively across different age groups,however, the majority divided the samples into two agegroups and reported that the older old were more seden-tary than the younger old. Only five studies divided thegroup by relatively narrow age bands. Patterns of partici-pation in PA decreased progressively with age for both
men and women although there was variation across thestudies. In McGuire et al.’s study [36] PA declined from23.0% in the 65–69 year group to 13.6% in 85+ yeargroup but in Mummery et al.’s study [35], the differencebetween the 60–64 year group and 80+ year group was24.2%. There was an unexpected rise in the 70–74 yearage group in the Sims et al.’s [42] study although thegeneral trends decreased with age. Although Hamdorfet al. [12] did not report the detailed percentage for eachage group, we can see the same gradually declining trendfrom 50.8% in the 60–64 year age group to 15.4% in 85+year age group in Figure 2.
PA prevalence trends over timeA crucial aspect of investigating trends over time is thecomparability of methods. Differences in instruments,cut-off points, PA definitions and domains of activity in-vestigated posed significant challenges to our review. Al-though nine studies reported the results of the BRFSS,not all the studies included national representative sam-ples making it difficult to assess trends. Therefore, weonly included the results of longitudinal studies or thefindings from the same surveillance evaluated by thesame criterion to establish the trend from seven studies.In Australia between 1990–2000 the proportion LTPA ofolder people aged 60 years and over meeting the PAguideline decreased from 28% to 25.8% in Merom et al.’sreport [13] while the NSW Population Health Survey[11] detected a small rise in the 65 + year age groupfrom 36.2% in 1998 to 39.8% in 2005 with a dip to 34.0%in 2003. The trend of regular walking [13] was similar toChau et al.’s [11] report. The USCDC compared theBRFSS data in 2001 and 2005 and reported that the US’older population was more active, with a rising preva-lence of 43.1% to 44.5% in men and 32.2% to 36.3% inwomen [21]. Another paper using the BRFSS 2001 andBRFSS 2007 reported the same overall trend from 37.5%to 39.3% [48]. Conversely, Knuth et al. [26] reported aclear drop in PA prevalence between 2002 and 2007 inBrazil. In 2002, the proportions of older people reachingthe PAGA 2008 guideline were 56.2% and 35.3% in the60–69 year and 70+ year age groups respectively and de-creased to 42.7% and 23.7% in 2007.
DiscussionDemographic differences in PA prevalenceOne of the challenges facing the development of diseaseprevention programmes is the lack of reliable data forPA levels and trends [59] and the data for PA levels inolder people is no exception. Generally within the in-cluded studies, the older old age groups were less likelythan those of younger age to be regularly active, andwomen were less likely than men to achieve regular PA,especially in LTPA across both the subjectively and

Mummery et al 2007
McGuire et al 2006
Sims et al 2007
Ashe et all 2009
Ashe et al 2009
Frank et al 2010
Figure 2 Physical activity prevalence across age groups.
Sun et al. BMC Public Health 2013, 13:449 Page 14 of 17http://www.biomedcentral.com/1471-2458/13/449
objectively measured PA studies regardless of the PAguidelines adopted. The decline in PA with age may bethe most consistent finding in PA epidemiology [60,61]with the higher PA prevalence among males echoing thefindings of previous studies [62] which may reflect in-creasing disability with age and cultural norms acrossthe genders. However, one Australian study [42] foundthat the decline of LTPA across the age groups was notconsistent with LTPA peaking in the 70–74 year group.Additionally three studies reported that women weremore active than men in relation to total PA [25,40,53].This pattern also appeared in other studies [63] whichmay reflect the inclusion of household activities andother non-leisure, non-sport activities [53] in the totalPA, which, in many cases, are largely specific to women.However, this was not a consistent finding across theincluded studies regardless of the guidelines category, in-dicating the need to quantify household activities accur-ately to enable comparisons across genders.
PA trends by country and over timeIn our review, there was a slightly increasing trend to-wards recommended PA levels in older people in Australiaand the US over the last 10 years but a decrease in Brazil.Studies of time trends in PA have been conducted mostlyin developed countries and their results indicate thatLTPA levels appear to be increasing [31,34,64,65]. Never-theless, the data indicate that substantial numbers of olderadults do not engage in sufficient PA to promote theirhealth and there is considerable variation in the levels ofPA reported across countries. Further, we found little dataon time trends in PA in developing countries which wasechoed in a recent systematic review [66]. However, thedecline in PA in Brazil [26] is perhaps indicative ofchanges in occupational PA with the emergence of in-creasing sedentary work in developing countries whichwill present a future public health challenge especiallywhen combined with dietary changes. Similarly Hallal
et al. have also highlighted the lower proportions of adultswho are physically active in south east Asia [59].
The difference between objectively and subjectivelymeasured PA prevalenceThe only two studies comparing self-reported PA to ac-celerometer measured PA in our review yielded contra-dictory results [43,51] with Tucker et al.’s [43] findingsbeing consistent with the majority of other similar stud-ies [67]. It is likely that the subjective PA studies reflectsocial desirability, recall bias and that there is underesti-mation of PA using objective measurement; PA monitorsare worn typically on the hip which means that they donot accurately assess upper body activities or accountfor movements that require extra effort, such as walkinguphill or carrying loads. Hurtig-Wennlof et al.’s [51]contradictory findings were probably caused by thelower cut-off point of MPA at 760 counts per minute(contrasting with about 2000 counts/min in the otherstudies) and the inclusion of PA under 10 minute bouts.This highlights the need for well designed studies usingobjectively measured PA to generate the evidence basefor public health initiatives.
Review limitationsLimitations of this review arise from the discrepanciesand inconsistencies in instrumentation, PA type mea-sured, guidelines or recommendations adopted by differ-ent researchers, algorithms, sample frames and otherconfounding factors. These made it difficult to make fulluse of the extracted data and impossible to compare thePA prevalence between different regions/countries or as-sess PA trends with certainty.
ConclusionDramatic global population ageing has brought new de-mands to improve older people’s health by adding “quality”to their extended lives [68]. The review was undertaken

Sun et al. BMC Public Health 2013, 13:449 Page 15 of 17http://www.biomedcentral.com/1471-2458/13/449
against the background of the WHO recommendations onPA for adults aged 65 years and older [69]. Despite theserecommendations physical inactivity is an increasing globalhealth burden [70] with PA surveillance emerging asone of the priorities of global public health for the develop-ment of effective non-communicable disease preventionprogrammes [59]. International efforts to increase PA havebeen reported within the adult or youth populations[38,66,71-73]. However, PA levels of older adults haveattracted less interest so there are limited data regardingthe prevalence of various types of PA in older adults andthe proportion of older people whose PA meets PA guide-lines. This review is the first of its kind and revealed manymethodological challenges to data analysis across the se-lected studies. Robust studies which recruit representativerandom samples and consistently employ validated meas-urement instruments are needed to enable comparisons inPA levels to be drawn over time and between countries.More evidence of PA levels amongst older people is neededto inform public health strategies which could extend thehealth and quality of life of people into old age.
AbbreviationsAAS: Active Australia Survey; BRFSS: Behavioural Risk Factor SurveillanceSystem; CDC-ACSM: Centers for Disease Control and Prevention and theAmerican College of Sports Medicine; CHMS: Canadian Health MeasuresSurvey; CCHS: Canadian Community Health Survey; GPAQ: Global PhysicalActivity Questionnaire; IPAQ: International Physical Activity Questionnaire;LTPA: Leisure-time physical activity; MET: Total metabolic equivalents;MPA: Moderate physical activity; NHANES: National Health and NutritionalExamination Survey; NHIS: National Health Interview Survey; PA: Physicalactivity; PAGA: Physical Activity Guidelines for Americans; SGR: US SurgeonGeneral’s Report; VPA: Vigorous physical activity.
Competing interestsNone declared by the authors. This review was unfunded.
Authors’ contributionsAll authors devised the research strategy; initial screening was undertaken byFS and then checked by AEW. FS extracted the data which was checked byAEW. Disagreements were resolved by reference to IJN. All authorscontributed to the data synthesis and production of the paper. All authorsread and approved the final manuscript.
Authors’ informationFS is a doctoral student. AEW and IJN are established health serviceresearchers. This review was conducted to understand the prevalence andmeasurement of physical activity in older people.
Author details1Second Military Medical University, School of Nursing, 800 Xiangyin Road,Shanghai 200433, PR China. 2King’s College London, Florence NightingaleSchool of Nursing & Midwifery, 57 Waterloo Road, London SE1 8WA, UK.
Received: 28 March 2012 Accepted: 26 April 2013Published: 6 May 2013
References1. Division of Ageing and Seniors: Physical activity and older adults from
Canada; 2011. Available at: [http://www.phac-aspc.gc.ca/seniors-aines/index-eng.php] Accessed Aug 1, 2011.
2. Wen CP, Wai JP, Tsai MK, Yang YC, Cheng TY, Lee MC, Chan HT, Tsao CK,Tsai SP, Wu X: Minimum amount of physical activity for reducedmortality and extended life expectancy: a prospective cohort study.Lancet 2011, 378:1244–1253.
3. Davis MG, Fox KR: Physical activity patterns assessed by accelerometry inolder people. Eur J Appl Physiol 2007, 100:581–589.
4. Chodzko-zajko WJ, Proctor DN, Fiatarone Singh MA, Minson CT, Nigg CR,Salem GJ, Sinner JS: American College of Sports Medicine position stand.Exercise and physical activity for older adults. Med Sci Sports Exer 2009,41:1510–1530.
5. U.S. Department of Health and Human Services: Physical Activity Guidelinesfor Americans; 2008. Available at: [www.health.gov/paguidelines/] AccessedSep 11, 2011.
6. Merom D, Phongsavan P, Chey T, Bauman A: Australian Bureau ofStatistics.Long-term changes in leisure time walking, moderate andvigorous exercise: Were they influenced by the national physical activityguidelines. J Sci Med Sport 2006, 9:199–208.
7. Jerome GJ, Glass TA, Mielke M, Xue QL, Andersen RE, Fried LP: Physicalactivity participation by presence and type of functional deficits inolderwomen: the Women's Health and Ageing Studies. J Gerontol A Biol SciMed Sci 2006, 61A:1171–6.
8. Brownson RC, Jones DA, Pratt M, Blanton C, Heath GW: Measuring physicalactivity with the behavioral risk factor surveillance system. Med Sci SportsExerc 2000, 32(11):1913–8.
9. Brach JS, Simonsick EM, Kritchevsky S, Yaffe K, Newman AB: Health gencyand Body Composition Study Research Group. The association betweenphysical function and lifestyle activity and exercise in the health, ageingand body composition study. J Am Geriatr Soc 2004, 52:502–509.
10. Phongsavan P, Merom D, Marshall A, Bauman A: Estimating physicalactivity level: the role of domestic activities. J Epidemiol Community Health2004, 58:466–467.
11. Chau J, Smith BJ, Bauman A, Merom D, Eyeson-Annan M, Chey T, Farrell L:Recent trends in physical activity in New South Wales. Is the tide ofinactivity turning? Aust New Zealand Health 2008, 32:82–85.
12. Hammdorf P, Starr G, Williams MA: A survey of physical-activity levels andfunctional capacity in older adults in South Australia. J Aging Phys Act2002, 10:281–289.
13. Merom D, Chey T, Chau J, Smith BJ, Barr M, Bauman AE: Are messagesabout lifestyle walking being heard? Trends in walking for all purposesin New South Wales (NSW), Australia. Prev Med 2009,48:341–344.
14. Heesch KC, Brown WJ: Do walking and leisure-time physical activityprotect against arthritis in older women. J Epidemiol Community Health2008, 62:1086–1091.
15. Lim K, Taylor L: Factors associated with physical activity among olderpeople - a population-based study. Prev Med 2005, 40:33–40.
16. Lawlor DA, Taylor M, Bedford C, Ebrahim S: Is housework good for health?Levels of physical activity and factors associated with activity in elderlywomen. Results from the British Women's Heart and Health Study.J Epidemiol Community Health 2002, 56:473–78.
17. Hillsdon M, Lawlor DA, Ebrahim S, Morris JN: Physical activity in olderwomen: Associations with area deprivation and with socioeconomicposition over the life course: Observations in the British Women's Heartand Health Study. J Epidemiol Community Health 2008, 62:344–350.
18. Brown DW, Balluz LS, Heath GW, Moriarty DG, Ford ES, Giles WH, MokdadAH: Associations between recommended levels of physical activity andhealth-related quality of life. Findings from the 2001 Behavioral RiskFactor Surveillance System (BRFSS) survey. Prev Med 2003,37:520–528.
19. Brown DR, Yore MM, Ham SA, Macera CA: Physical activity amongadults ≥50 yr with and without disabilities, BRFSS 2001. Med Sci SportsExerc 2005, 37:620–629.
20. Ashe MC, Miller WC, Eng JJ, Noreau L: Older adults, chronic disease andleisure-time physical activity. Gerontology 2009, 55:64–72.
21. CDC, USA: Prevalence of regular physical activity among adults - UnitedStates, 2001 and 2005. Morb Mortal Wkly Rep 2007, 56:1209–1212.
22. Muntner P, Gu D, Wildman RP, Chen J, Qan W, Whelton PK, He J:Prevalence of physical activity among Chinese adults: results from theInternational Collaborative Study of Cardiovascular Disease in Asia.Am J Public Health 2005, 95:1631–1636.
23. Benedetti T, Borges L, Petroski E, Gonçalves LH: Physical activity andmental health status among elderly people. Rev Saude Publica 2008,42:302–307.
24. Ding CC, Chen XR, Zhang Z, Li KJ: Exercise and walking intensity and levelof Beijing adult residents. Chi J Sports Med 2009, 28:362–364.

Sun et al. BMC Public Health 2013, 13:449 Page 16 of 17http://www.biomedcentral.com/1471-2458/13/449
25. Hallal PC, Victora CG, Wells JC, Lima RC: Physical Inactivity: prevalence andassociated variables in Brazilian adults. Med Sci Sports Exerc 2003,35:1894–1900.
26. Knuth AG, Bacchieri G, Victora CG, Hallal PC: Changes in physical activityamong Brazilian adults over a 5-year period. J Epidemiol CommunityHealth 2010, 64:591–595.
27. Meyer K, Rezny L, Breuer C, Lamprecht M, Stamm HP: Physical activity ofadults aged 50 years and older in Switzerland. Soz Praventivmed 2005,50:218–229.
28. Frank L, Kerr J, Rosenberg D, King A: Healthy ageing and where you live:Community design relationships with physical activity and body weightin older Americans. J Phys Act Health 2010, 7(1):S82–S90.
29. Guinn B, Vincent V: Select physical activity determinants in independent-living elderly. Activ. Adapt. Aging 2002, 26:17–26.
30. Taylor-Piliae RE, Norton LC, Haskell WL, Mahbouda MH, Fair JM, Iribarren C,Hlatky MA, Go AS, Fortmann SP: Validation of a new brief physical activitysurvey among men and women aged 60–69 years. Am J Epidemiol 2006,164(6):598–606.
31. Allender S, Foster C, Boxer A: Occupational and non-occupational physicalactivity and the social determinants of physical activity: results from theHealth Survey for England. J Phys Act Health 2008, 5:104–16.
32. Florindo AA, Guimães VV, Cesar CL, Barros MB, Alves MC, Goldblaum M:Epidemiology of leisure, transportation, occupational, and householdphysical activity: prevalence and associated factors. J Phys Act Health2009, 6:625–632.
33. Joubert J, Norman R, Lambert EV, Groenewald P, Schneider M, Bwi F,Bradshaw D, South African Comparative Risk Assessment CollaboratingGroup: Estimating the burden of disease attributable to physicalinactivity in South Africa in 2000. SA Med J 2007, 97(8):725–731.
34. Meisner BA, Dogra S, Logan AJ, Baker J, Weir PL: Do or decline? Comparingthe effects of physical inactivity on biopsychosocial components ofsuccessful ageing. J Health Psychol 2010, 15:688–696.
35. Mummery WK, Kolt G, Schofield G, McLean F: Associations betweenphysical activity and other lifestyle behaviors in older New Zealanders.J Phys Act Health 2007, 4:411–422.
36. McGuire LC, Ahluwalia IB, Strine TW: Report from the CDC. Chronicdisease-related behaviors in U.S. older women: Behavioral Risk FactorSurveillance System, 2003. J Womens Health (Larchmt) 2006, 15:3–7.
37. Pronk NP, Anderson LH, Crain AL, Martinson BC, O'Connor PJ, Sherwood NE,Whitebird RR: Meeting recommendations for multiple healthy lifestylefactors: Prevalence, clustering, and predictors among adolescent, adult,and senior health plan members. Am J Prev Med 2004, 27(2):25–33.
38. Stamatakis E, Ekelund U, Wareham N: Temporal trends in physical activityin England: The Health Survey for England 1991 to 2004. Prev Med 2007,45:416–423.
39. DiSipio T, Rogers C, Newman B, Whiteman D, Eakin E, Fritschi L, Aitken J:The Queensland Cancer Risk Study: behavioural risk factor results. Aust NZ J Public Health 2006, 30:375–382.
40. Ready AE, Butcher JE, Dear JB, Fieldhouse P, Harlos S, Katz A, Moffatt M,Rodriguez M, Schmalenberg J, Gardiner PF: Canada's physical activityguide recommendations are a low benchmark for Manitoba adults.Appl Physiol Nutr Metab 2009, 34:172–181.
41. Panagiotakos DB, Polystipioti A, Polychronopoulos E: Prevalence of type 2diabetes and physical activity status in elderly men and women fromCyprus (the MEDIS Study). Asia Pac J Public Health 2007, 19:22–28.
42. Sims J, Hill K, Davidson S, Gunn J, Huang N: A snapshot of the prevalenceof physical activity amongst older, community dwelling people inVictoria, Australia: patterns across the ‘young-old’ and ‘old-old’. BMCGeriatr 2007, 7:4.
43. Tucker JM, Welk GJ, Beyler NK: Adults: compliance with the physicalactivity guidelines for Americans. Am J Prev Med 2011, 40:454–461.
44. Tyrovolas S, Zeimbekis A, Bountziouka V, Voutsa K, Pounis G, Papoutson S,Matallinos G, Ladsukaki E, Polychronopoulos E, Lionis C, Panagiotakos DB:Factors associated with the prevalence of diabetes mellitus amongelderly men and women living in Mediterranean Islands: The MEDISstudy. Rev Diabet Stud 2009, 6:54–63.
45. Gómez LF, Parra DC, Buchner D, Sarmiento OL, Pinzón JD, Ardila M, MorenoJ, Serrato M, Lobelo F: Built environment attributes and walking patternsamong the elderly population in Bogotá. Am J Prev Med 2010, 38:592–599.
46. McGuire L, Bouldin EL, Andresen EM, Anderson LA: Examining modifiablehealth behaviours, body weight, and use of preventive health services
among caregivers and non-caregivers age 65 years and older in Hawaii,Kansas and Washington using 2007 BRFSS. J Health Aging 2010,14(5):373–379.
47. Xu YJ, Mao WJ, Xu XJ, Cai QM, Song XL, Nie SP, Xu HF, Xia L: Patterns andinfluencing factors of physical activity among residents in guangdongprovince. South China. J Prev Med 2009, 35:5.
48. CDC USA: Prevalence of self-reported physically active adults--UnitedStates, 2007. MMWR Morb Mortal Wkly Rep 2008, 57:1297–300.
49. Bird S, Kurowski W, Feldman S, Browning C, Lau R, Radermacher H, ThomasS, Sims J: The influence of the built environment and other factors onthe physical activity of older women from different ethnic communities.J Women Ageing 2009, 21:33–47.
50. Carlson SA, Fulton JE, Schoenborn CA, Loustalot F: Trend and prevalenceestimates based on the 2008 Physical Activity Guidelines for Americans.Am J Prev Med 2010, 39:305–313.
51. Hurtig-Wennlof A, Hagstromer M, Olsson LA: The International PhysicalActivity Questionnaire modified for the elderly: aspects of validity andfeasibility. Public Health Nutr 2010, 13:1847–1854.
52. Shores KA, West ST, Theriault DS, Davison EA: Extra-individual correlates ofphysical activity attainment in rural older adults. J Rural Health 2009, 25:8.
53. Xue MY: Effects of daily physical activities on physical health and qualityof life in elderly community residents in Jiangsu Province. J ClinRehabilitative Tissue Eng Res 2010, 14:6.
54. Fleming LE, Lee DJ, Martinez AJC, Leblanc WG, McCollister KE, Bridges KC,Christ SL, Arheart KL, Pitman T: The health behaviors of the older USworker. Am J Ind Med 2007, 50:427–437.
55. Troiano RP, Berrigan D, Dodd KW, Masse LC, Tilert T, McDowell M: Physicalactivity in the United States measured by accelerometer. Med Sci SportsExerc 2007, 40:181–188.
56. Harris TJ, Owen CG, Victor CR, Adams R, Crook DG: What factors areassociated with physical activity in older people, assessed objectively byaccelerometry? Br J Sports Med 2009, 43:442–450.
57. Colley R, Garriguet D, Janssen I, Craig CL, Clarke J, Tremblay MS: Physicalactivity of Canadian children and youth: accelerometer results from the2007 to 2009 Canadian Health Measures Survey. Health Rep 2011, 22:1–9.
58. Stamatakis E, Hillsdon M, Primatesta M: Domestic physical activity inrelationship to multiple CVD risk factors. Am J Prev Med 2007, 32:320–327.
59. Hallal PC, Andersen LB, Bull FC, Guthold R, Haskell W, Ekelund U: Globalphysical activity levels: surveillance progress, pitfalls, and prospects.Lancet 2012, 380:247–257.
60. Craig CL, Russel CJ, Cameron C, Bauman A: Twenty-year trends in physicalactivity among Canadian adults. C J Public Health 2004, 95(1):59–63.
61. Caspersen CJ, Pereira MA, Curran KM: Changes in physical activity patternsin the United States, by sex and cross-sectional age. Med Sci Sports Exerc2000, 32:1601–1609.
62. Curtis J, White P, McPherson B: Age and physical activity among Canadianwomen and men: findings from longitudinal national survey data.J Ageing Phys Act 2000, 8:1–19.
63. Weller I, Corey P: The impact of excluding non-leisure energyexpenditure on the relation between physical activity and mortality inwomen. Epidemiology 1998, 9:632–635.
64. Helkapori S, Uutela A, Prattala R: Health Behaviour and Health amongFinnishPopulation, Spring 2000. Helsinki, Finland: National Public HealthInstitute; 2000.
65. Sport and Recreation New Zealand: Results from the New Zealand Sport andPhysicalActivity Surveys (1997–2001); 2001. Available at: [http://www.activenzsurvey.org.nz/Results/SPARC-Trends-in-Participation-in-Sport-and-Active-Leisure-1997-2001/Trends-Participation/] Accessed Sep 11, 2011.
66. Knuth AG, Hallal PC: Temporal trends in physical activity: a systematicreview. J Phys Act Health 2009, 6:548–559.
67. Prince SA, Adamo KB, Hamel ME, Hardt J, Gorber SC, Tremblay M: Acomparison of direct versus self-report measures for assessing physicalactivity in adults: a systematic review. Int J Behav Nutr Phys Act 2008,6:5–56.
68. Bowling A: The psychometric properties of the older people’s quality oflife questionnaire, compared with the CASP-19 and the WHOQOL-OLD.Curr Gerontol Geriatr Res 2009. doi:10.1155/2009/298950.
69. World Health Organisation: Global Recommendations on Physical Activity forHealth. Geneva: World Health Organisation; 2010.
70. Lee I-M, Shiroma EJ, Lobelo F, Puska P, Blair SN, Katzmarzk PT: Effect ofphysical inactivity on major non-communicable diseases worldwide: an

Sun et al. BMC Public Health 2013, 13:449 Page 17 of 17http://www.biomedcentral.com/1471-2458/13/449
analysis of burden of disease and life expectancy. Lancet 2012,380:219–229.
71. Sisson SB, Katzmarzyk PT: International prevalence of physical activity inyouth and adults. Obes Rev 2008, 9:606–614.
72. Vandelanotte C, Duncan MJ, Caperchione C, Hanley C, Mummery WK:Physical activity trends in Queensland (2002 to 2008): are womenbecoming more active than men? Aust N Z J Public Health 2010,34:248–254.
73. Macera CA, Pratt M: Public health surveillance of physical activity.Res Q Exerc Sport 2000, 71(2):S97–103.
doi:10.1186/1471-2458-13-449Cite this article as: Sun et al.: Physical activity in older people: asystematic review. BMC Public Health 2013 13:449.
Submit your next manuscript to BioMed Centraland take full advantage of:
• Convenient online submission
• Thorough peer review
• No space constraints or color figure charges
• Immediate publication on acceptance
• Inclusion in PubMed, CAS, Scopus and Google Scholar
• Research which is freely available for redistribution
Submit your manuscript at www.biomedcentral.com/submit