Embed Size (px)
Citation preview

ACTA
UNIVERSITATIS
UPSALIENSIS
UPPSALA
2007
Digital Comprehensive Summaries of Uppsala Dissertationsfrom the Faculty of Science and Technology 342
Phthalocyanines on Surfaces
Monolayers, Films and Alkali Modified Structures
KATHARINA NILSON
ISSN 1651-6214ISBN 978-91-554-6966-5urn:nbn:se:uu:diva-8209

���������� �������� �� ������ �������� � �� �������� ������� � ���������������������������� �������������� �� ������� ������� ����� �!� !""# �� �"$�% &� ��������� & ���� & ��������' (�� �������� )��� �� ������� � *�����'
��������
+���� ,' !""#' ������������ -��&����' .������� ����� �� /�0��� .��&���-���������' /��� ����������� ���������' ������� ��� � ���� ����� � � ����������� ������� �� �� ������� � ��� �� ��� � ������ 12!' 3� ��' ������'4-5+ 6#786�8%%2836338%'
(�� ������������ 9��:�; ��� � ���� & ����8������ ��������� )����� ����������� ��� ���� ���������� � ��� ���� � � ������� & ����������' *������� �� ���������� �������������������� & �������� ���� ������� & ��:� ������� ���&���� ��� ������� &� ������� ���������� & ��� &��������� & ��&&���� ��8����� �������'<���� ��:� ������� �� &����� �������� ��&&���� ���&����� )��� ����������� ��
=8��� ��������� -��������� 9=�-;� =8��� /������ -��������� 9=/-; ��-���� (����� .������� 9-(.;' 4 ������ ������ ������� (���� 9��(;��������� )��� ���&����'�� �������� &���� & .����8&��� 9<
!��; �� 4� 9����; ��:�� ���&����� �� �� &�� ����
��� ������������ �������� �� )��0 �� ��� �������� ������ )��� ����� �������� ��������� ������������ � ��� ���&���'-������ ������ ������� )��� ����������>��� ����� <
!�� �� ���� �������
?�������� @�� 4-�9""�;8�97�!;� <!�� /�9��"; �� /�9���;' �� ��� ��� �������
������� �� )�� &�� ���� ��� �������� ��� ������ )��� ����� �������� ���� �������� ���� ���&���' (�� �������� ��������� & ��� �������� �� ��&&������ �&������ �� ��������)��� ��� ���&����' �� <
!�� ������� ?������� ��� ����� ��������� �&&��� & ��� ���&���
��� �������� �������� ��������� ���)�� -(. ����������>��� & ��&&���� ���������������' / ���� �������� �� ������ &�� � ��� ���� & <
!�� /�9��"; �������� �
�������� ������ �������� �� ������ ����������'.��&������ & ��� �������� �� ���������� ��������� ������ �� ��0��� ���� & <
!��
&���� �� ������� )��� ����������>��' 4� �� &�� ��� &� ��� <!�� &��� /�9��"; ��
������ ������� /�9���;� ���� ��� �������� ��������� �� ������ �� ���� ���������� �� A�������� ������������'�������� ���� & ��� <
!�� &���� ������� � � &����� & ��������� ����� ��������
������� �� � ������ ����&�� &�� ��� ��0��� � ��� �������� )��� ����&���� ���&����� &��� �������� �������� ���������'
� ������ ������������� -��&��� -������ =8��� ��������� -��������� 9=�-;�=8��� /������ -��������� 9=/-;� -���� (����� .������� 9-(.;� ������������� (���� 9��(;� .����8&��� ������������ 4� ������������ @�������������� ?��� ?�������� /�������� 4���� /����� .������� ��������.������ ����� /�0���� ?��������� ���������� *������� ���������� ����
��������� ������ � ���� �� � ������� !" #$%� ������� ���� ������ �&'(#)*) ���������� � �
B ,������� +��� !""#
4--+ �3%�83!�24-5+ 6#786�8%%2836338%��$�$��$��$����87!"6 9����$CC��'0�'��C������D��E��$�$��$��$����87!"6;

List of Papers
This thesis is based on the following papers, which are referred to in the text
by their Roman numbers.
I Electronic structure of vapor-deposited metal-freephthalocyanine thin filmY. Alfredsson, B. Brena, K. Nilson, J. Åhlund, L. Kjeldgaard,
M. Nyberg, Y. Luo, N. Mårtensson, A. Sandell, C. Puglia and
H. Siegbahn
Journal of Chemical Physics 122, 214723, (2005)
II Equivalent core-hole time-dependent density functionaltheory calculations of carbon 1s shake-up states ofphthalocyanineB. Brena, Y. Luo, M. Nyberg, S. Carniato, K. Nilson, Y. Alfreds-
son, J. Åhlund, N. Mårtensson, H. Siegbahn and C. Puglia
Physical Review B, 70, 195214, (2004)
III The electronic structure of iron phthalocyanine probedby photoelectron and x-ray absorption spectroscopies anddensity functional theory calculationsJ. Åhlund, K. Nilson, J. Schiessling, L. Kjeldgaard, S. Berner,
N. Mårtensson, C. Puglia, B. Brena, M. Nyberg and Y. Luo
Journal of Chemical Physics 125, 34709, (2006)
IV A STM study of Metal-free Phthalocyanine monolayerstructures on GraphiteK. Nilson, J. Åhlund, B. Brena, E. Göthelid, J. Schiessling, N.
Mårtensson and C. Puglia
Accepted for publication in Journal of Chemical Physics
V The adsorption of iron phthalocyanine on graphite: Ascanning tunnelling microscopy studyJ. Åhlund, J. Schnadt, K. Nilson, E. Göthelid, J. Schiessling, F.
Besenbacher, N. Mårtensson and C. Puglia
Surface Science 601, 3661, (2007)
3

VI STM and XPS characterization of Zinc Phthalocyanine onInSb(001)K. Nilson, P. Palmgren, J. Åhlund, J. Schiessling, E. Göthelid,
N. Mårtensson, C. Puglia and M. Göthelid
Submitted to Surface Science
VII Characterization of Metal-free Phthalocyanine adsorbed onAl(110)K. Nilson, P. Palmgren, J. Åhlund, J. Schiessling, E. Göthelid,
F. Hennies, M. Göthelid, N. Mårtensson, C. Puglia
In manuscript
VIII Potassium doped H2Pc films: alkali induced electronic andgeometrical modificationsK. Nilson, J. Åhlund, J. Schiessling, P. Palmgren, B. Brena, E.
Göthelid, F. Hennies, P. Rudolf, M. Göthelid, N. Mårtensson, C.
Puglia
In manuscript
IX Rubidium doped Metal-free Phthalocyanine monolayerstructures on Au(111)K. Nilson, J. Åhlund, E. Göthelid, P. Palmgren, J. Schiessling,
S. Berner, N. Mårtensson, C. Puglia
In manuscript
Reprints were made with permission from the publishers.
The following is a list of papers which I have contributed to but that are not
included in this Thesis.
Excited-state charge transfer dynamics in systems of aromaticadsorbates on TiO2 studied with resonant core techniquesJ. Schnadt, J. N. O’Shea, L. Patthey, L. Kjeldgaard, J. Åhlund, K. Nilson,
J. Schiessling, J. Krempasky, M. Shi, O. Karis, C. Glover, H. Siegbahn,
N. Mårtensson and P. A. Brühwiler
Journal of Chemical Physics 119, 12462, (2003)
4

Molecular ordering in isonicotinic acid on rutile TiO2(110) investigatedwith valence band photoemissionJ. N. O’Shea, J. C. Swarbrick, K. Nilson, C. Puglia, B. Brena, Y. Luo,
V. R. Dhanak
Journal of Chemical Physics 121, 10203, (2004)
Phase and molecular orientation in metal-free phthalocyanine films onconducting glass: Characterization of two deposition methodsY. Alfredsson, J. Åhlund, K. Nilson, L. Kjeldgaard, J. N. O’Shea, J.
Theobald, Z. Bao, N. Mårtensson, A. Sandell, C. Puglia and H. Siegbahn
Thin Solid Films, 493, 13, (2005)
Electronic and structural studies of immobilized thiol-derivatizedcobalt porphyrins on gold surfacesS. Berner, H. Lidbaum, G. Ledung, J. Åhlund, K. Nilson, J. Schiessling,
U. Gelius, J. E. Bäckvall, C. Puglia and S. Oscarsson
Applied Surface Science 253, 7540, (2007)
Comments on my own participation
The work presented here is the result of efforts made by a team of
co-workers. The extent of my contribution to the papers has been different
but in all cases I have participated in the experimental work and in the
discussions regarding the studies. Paper II is mainly the result of a theoretical
study, I contributed with the experimental work and data analysis. For paper
IV, VI, VII, VIII and IX, I have been the main responsible person for the
experiments, the data analysis and the preparation of the papers. However the
STM work presented in paper VI has been performed by our collaborators
Pål Palmgren and Mats Göthelid at Materials Physics, Royal Institute of
Technology (KTH), Stockholm. The theoretical simulations have been
performed by Barbara Brena, Mats Nyberg and Yi Luo at the Department of
Physics, Uppsala University and Theoretical Chemistry, KTH, Stockholm.
5


Contents
1 Populärvetenskaplig sammanfattning . . . . . . . . . . . . . . . . . . . . . . . 9
1.1 Våra byggklossar: ytor, atomer och ftalocyaniner . . . . . . . . . . . 9
1.1.1 Molekyl och yta: studier av modellsystem . . . . . . . . . . . . 9
1.2 Undersökningsmetoder . . . . . . . . . . . . . . . . . . . . . . . . . . . . . . 10
1.2.1 Vakuum . . . . . . . . . . . . . . . . . . . . . . . . . . . . . . . . . . . . . . 10
1.2.2 Spektroskopi . . . . . . . . . . . . . . . . . . . . . . . . . . . . . . . . . . 10
1.2.3 Mikroskopi . . . . . . . . . . . . . . . . . . . . . . . . . . . . . . . . . . . 11
1.2.4 Beräkningar . . . . . . . . . . . . . . . . . . . . . . . . . . . . . . . . . . . 12
1.3 Resultat . . . . . . . . . . . . . . . . . . . . . . . . . . . . . . . . . . . . . . . . . . 12
2 Introduction . . . . . . . . . . . . . . . . . . . . . . . . . . . . . . . . . . . . . . . . . . 15
2.1 Molecular phthalocyanine films . . . . . . . . . . . . . . . . . . . . . . . . 16
2.2 Monolayer studies . . . . . . . . . . . . . . . . . . . . . . . . . . . . . . . . . . 16
2.3 Alkali doping of phthalocyanines . . . . . . . . . . . . . . . . . . . . . . . 16
3 Techniques . . . . . . . . . . . . . . . . . . . . . . . . . . . . . . . . . . . . . . . . . . . 17
3.1 Photoelectron Spectroscopy . . . . . . . . . . . . . . . . . . . . . . . . . . . 17
3.1.1 X-ray Photoelectron Spectroscopy (XPS) . . . . . . . . . . . . . 18
3.1.2 Satellites . . . . . . . . . . . . . . . . . . . . . . . . . . . . . . . . . . . . . 19
3.1.3 Koopmans’ theorem and the sudden approximation . . . . . 19
3.1.4 Electron escape depth . . . . . . . . . . . . . . . . . . . . . . . . . . . 21
3.1.5 Ultraviolet Photoelectron Spectroscopy (UPS) . . . . . . . . . 21
3.2 X-ray Absorption Spectroscopy (XAS) . . . . . . . . . . . . . . . . . . 22
3.3 Scanning Tunneling Microscopy (STM) . . . . . . . . . . . . . . . . . 23
3.3.1 Quantum Mechanical Tunneling . . . . . . . . . . . . . . . . . . . 23
3.3.2 Imaging modes . . . . . . . . . . . . . . . . . . . . . . . . . . . . . . . . 24
3.3.3 Principles of STM instruments . . . . . . . . . . . . . . . . . . . . . 25
4 Density Functional Theory . . . . . . . . . . . . . . . . . . . . . . . . . . . . . . . 27
5 Experimental . . . . . . . . . . . . . . . . . . . . . . . . . . . . . . . . . . . . . . . . . 29
5.1 Sample preparation and Ultra High Vacuum . . . . . . . . . . . . . . 29
5.2 Synchrotron radiation . . . . . . . . . . . . . . . . . . . . . . . . . . . . . . . 30
5.2.1 Beamline I511, MAX-lab, Lund . . . . . . . . . . . . . . . . . . . 31
5.3 Home laboratories . . . . . . . . . . . . . . . . . . . . . . . . . . . . . . . . . . 31
5.3.1 X-ray Photoelectron Spectroscopy . . . . . . . . . . . . . . . . . . 31
5.3.2 Scanning Tunneling Microscopy . . . . . . . . . . . . . . . . . . . 31
5.3.3 Calibration of XPS, XAS and STM measurements . . . . . . 32
6 Substrates and adsorbates . . . . . . . . . . . . . . . . . . . . . . . . . . . . . . . . 33
6.1 Substrates . . . . . . . . . . . . . . . . . . . . . . . . . . . . . . . . . . . . . . . . 33

6.2 Adsorbates - Phthalocyanines . . . . . . . . . . . . . . . . . . . . . . . . . 36
6.3 Adsorbate-adsorbate and adsorbate-substrate interactions . . . . 37
7 Summary of papers . . . . . . . . . . . . . . . . . . . . . . . . . . . . . . . . . . . . 39
7.1 Molecular phthalocyanine films . . . . . . . . . . . . . . . . . . . . . . . . 39
7.1.1 Electronic structure of metal-free phthalocyanine films . . 39
7.1.2 H2Pc and FePc films: Geometrical structure . . . . . . . . . . . 40
7.2 Monolayer Studies . . . . . . . . . . . . . . . . . . . . . . . . . . . . . . . . . 42
7.2.1 Phthalocyanines on Graphite . . . . . . . . . . . . . . . . . . . . . . 43
7.2.2 Zinc phthalocyanine on InSb . . . . . . . . . . . . . . . . . . . . . . 45
7.2.3 Metal-free phthalocyanine on Al(110) . . . . . . . . . . . . . . . 46
7.2.4 Metal-free phthalocyanine on Au(111) . . . . . . . . . . . . . . . 47
7.3 Alkali doping of phthalocyanines . . . . . . . . . . . . . . . . . . . . . . . 48
7.3.1 Rubidium doping of H2Pc monolayer on Au(111) . . . . . . 48
7.3.2 Potassium doping of H2Pc films . . . . . . . . . . . . . . . . . . . . 49
7.4 Conclusions . . . . . . . . . . . . . . . . . . . . . . . . . . . . . . . . . . . . . . . 52
8 Acknowledgments . . . . . . . . . . . . . . . . . . . . . . . . . . . . . . . . . . . . . 55
Bibliography . . . . . . . . . . . . . . . . . . . . . . . . . . . . . . . . . . . . . . . . . . . . 57
8

1. Populärvetenskaplig sammanfattning
Allt som finns runt omkring oss består av atomer. De består i sin tur av mindre
enheter: den positiva kärnan och de negativt laddade elektronerna som omger
kärnan.
Atomer kan sammanlänkas till större enheter såsom molekyler och fasta
kroppar, vilka alla har en yta. Den här avhandlingen handlar om molekyler
som placerats på ytor av fasta material. Systemen, molekylerna på ytor, har
studerats med olika experimentella metoder, detta bland annat för att förstå
hur molekylerna och ytan påverkar varandra. En yta är i det här fallet precis
vad det låter som, men ytorna som har studerats är extremt plana, rena och
alla ytans atomer sitter regelbundet placerade.
De fysikaliska egenskaperna hos ett system bestäms framförallt av atomer-
nas inbördes placering och av utbredningen och energin hos elektronerna i
systemet. Det är därför den elektroniska strukturen (energiutbredningen) som
undersökts här, vilken ger information om systemen.
1.1 Våra byggklossar: ytor, atomer och ftalocyaniner
Molekylerna som studerats i den här avhandlingen är ftalocyaniner (Pc) som
består av kol, kväve och väte (metall-fri ftalocyanin). Molekylen kan även
innhålla en metallatom (metall-ftalocyanin). Den här avhandlingen innehåller
studier av både metall-fri (H2Pc) och av två metall-ftalocyaniner, zink (ZnPc)
och järn (FePc). Dessa molekyler är intressanta bland annat för att de kan an-
vändas i en rad tillämpningar såsom solceller och molekylära elektronikkom-
ponenter, dessutom användas de i katalysprocesser. Som katalysatorer påskyn-
dar eller möjliggör de kemiska processer, något som är av stort intresse inte
minst i industriella sammanhang.
Förutom att studera ftalocyaniner på olika ytor har alkaliatomer (kalium-
och rubidiumatomer) placerats på den molekyltäckta ytan. Båda atomslagen
är välkända för att lätt lämna ifrån sig en av sina elektroner. Målet här är att
se om ftalocyaninen plockar upp en elektron och hur det påverkar systemtets
elektroniska och geometriska struktur.
1.1.1 Molekyl och yta: studier av modellsystem
Ftalocyaniner har placerats (eller adsorberats, som man brukar säga) på oli-
ka ytor, bland annat på grafit, aluminium och indium-antimonid, vilka alla tre
9

har olika egenskaper. Genom att studera elektronstrukturen hos molekylerna
och ytan går det att få viktig information om systemet som studeras. Det finns
många frågor som kan besvaras genom sådana studier, till exempel: binder
molekylerna olika starkt till olika ytor? Påverkas växelverkan mellan mole-
kylerna av vilken yta de placerats på? Kan katalytiska egenskaper förändras
när molekylen adsorberas på olika ytor? Men i första hand är detta grund-
forskning, med inriktning på att undersöka molekylära modellsystem, d.v.s.
ett isolerat och förenklat system som undersöks eftersom det besitter vissa
betydelsefulla egenskaper hos ett mer komplicerat men för tillämpningar re-
levant system.
1.2 Undersökningsmetoder
Två olika experimentella tekniker har använts för att uppnå resultaten i den
här avhandlingen, nämligen spektroskopi och mikroskopi. Alla experiment
som finns beskrivna i den här avhandlingen är gjorda i vakuum.
1.2.1 Vakuum
Det finns flera anledningar till att experimenten görs i vakuum, en av anled-
ningarna är att då undviks föroreningar på provet, som bara ska innehålla de
molekyler som undersöks. Ytorna som undersöks rengörs i vakuum, sedan
adsorberas ftalocyaninerna på ytan, även detta i vakuum. Om mätningarna
gjordes i luft (atmosfärstryck) skulle även annat fastna på ytan, i vakuum är
det möjligt att studera just de modellsystem som intresserar oss.
1.2.2 Spektroskopi
Fotoelektronspektroskopi har använts för att förstå molekylernas växelverkan
med ytan de är placerade på. Elektronerna hos en atom kan inte befinna sig var
som helst runt atomkärnan, elektronerna finns i specifika orbitaler som visas
schematiskt i Fig. 1.1. Detta betyder att elektronerna bara kan ha vissa specifi-
ka energier. I varje atomslag binds elektroner olika hårt, ju större atomkärnan
är desto närmare kärnan finns (de starkast bundna) elektronerna. Närheten till
kärnan bestämmer vilken energi en elektron har och därmed också hur svårt
det är att ta bort en elektron från atomen. Det går därför att bestämma av vil-
ket slags grundämne en atom är genom att undersöka hur mycket energi man
behöver tillföra atomen för att stjäla en elektron från den.
Små förändringar i energin bestämmer hur påverkade elektronerna i atomen
eller molekylen är av sin omgivning (s.k. kemiskt skift), detta illustreras sche-
matiskt i Fig. 1.2. Det går alltså att bestämma både provets kemiska samman-
sättning och hur olika delar av provet samspelar genom att mäta elektronernas
energi.
10
Energi
Tom orbital
Orbital med elektroner
} Inga elektroner medden här energin
Energi
Tidigare tom orbitalElektron som exciteras, den byter orbital
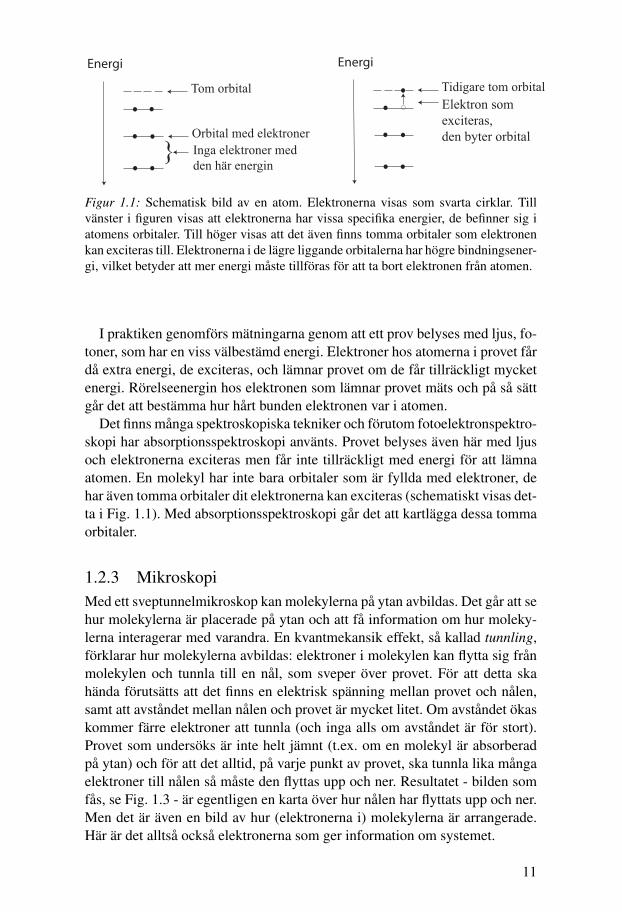
Figur 1.1: Schematisk bild av en atom. Elektronerna visas som svarta cirklar. Till
vänster i figuren visas att elektronerna har vissa specifika energier, de befinner sig i
atomens orbitaler. Till höger visas att det även finns tomma orbitaler som elektronen
kan exciteras till. Elektronerna i de lägre liggande orbitalerna har högre bindningsener-
gi, vilket betyder att mer energi måste tillföras för att ta bort elektronen från atomen.
I praktiken genomförs mätningarna genom att ett prov belyses med ljus, fo-
toner, som har en viss välbestämd energi. Elektroner hos atomerna i provet får
då extra energi, de exciteras, och lämnar provet om de får tillräckligt mycket
energi. Rörelseenergin hos elektronen som lämnar provet mäts och på så sätt
går det att bestämma hur hårt bunden elektronen var i atomen.
Det finns många spektroskopiska tekniker och förutom fotoelektronspektro-
skopi har absorptionsspektroskopi använts. Provet belyses även här med ljus
och elektronerna exciteras men får inte tillräckligt med energi för att lämna
atomen. En molekyl har inte bara orbitaler som är fyllda med elektroner, de
har även tomma orbitaler dit elektronerna kan exciteras (schematiskt visas det-
ta i Fig. 1.1). Med absorptionsspektroskopi går det att kartlägga dessa tomma
orbitaler.
1.2.3 Mikroskopi
Med ett sveptunnelmikroskop kan molekylerna på ytan avbildas. Det går att se
hur molekylerna är placerade på ytan och att få information om hur moleky-
lerna interagerar med varandra. En kvantmekansik effekt, så kallad tunnling,förklarar hur molekylerna avbildas: elektroner i molekylen kan flytta sig från
molekylen och tunnla till en nål, som sveper över provet. För att detta ska
hända förutsätts att det finns en elektrisk spänning mellan provet och nålen,
samt att avståndet mellan nålen och provet är mycket litet. Om avståndet ökas
kommer färre elektroner att tunnla (och inga alls om avståndet är för stort).
Provet som undersöks är inte helt jämnt (t.ex. om en molekyl är absorberad
på ytan) och för att det alltid, på varje punkt av provet, ska tunnla lika många
elektroner till nålen så måste den flyttas upp och ner. Resultatet - bilden som
fås, se Fig. 1.3 - är egentligen en karta över hur nålen har flyttats upp och ner.
Men det är även en bild av hur (elektronerna i) molekylerna är arrangerade.
Här är det alltså också elektronerna som ger information om systemet.
11

Atom 1:Kväve med väte och kolatomer som grannar
Atom 2: Kväve med bara kol-atomer som grannar
Elektonernas bindningsenengi ändras något beroende på vilka atomer som finns i närheten
Energi
Intensitet (Antal elektroner)
Energi (”bindningsenergi”= energi som måste tillföras för att stjäla en elektron från atomen)
Fotoelektronspektroskopi:spektrum som visar elektronernas energiutbredning
Väteatom
KväveatomKolatom
Ftalocyanin
Atom 1:Kväve med väte- och kolatomer som grannar
Atom 2: Kväve med bara kolatomersom grannar
Figur 1.2: Högst upp visas en ftalocyanin. I molekylen är två kväveatomer marke-rade (atom 1 och 2), de har olika atomer som grannar. Nedanför visas schematiskt
att energin hos elektronerna är olika beroende på vilka atomer som finns i närheten,
elektronernas energi i atom 1 och 2 är därför inte densamma. Detta bestäms med en
fotoelektronspektroskopimätning och till höger i figuren visas resultatet av mätningen,
de båda topparna indikerar att elektronerna inte har samma energi i de olika kvävea-
tomerna atomerna i molekylen, s.k. kemiskt skift.
1.2.4 Beräkningar
Med hjälp av teoretiska beräkningar som simulerar systemen och experimen-
ten går det att få extra information. I flera av artiklarna som presenteras i
den här avhandlingen beskrivs även resultat från beräkningar, och jämförelser
mellan experiment och simuleringar - sådana jämförelser ökar förståelsen för
de experimentella resultaten.
1.3 Resultat
Experimenten som är grunden för den här avhandlingen har lett fram till en
rad resultat. Några av resultaten fås från bilder som den i Fig. 1.3. Där kan
man se att H2Pc-molekyler ligger plant på en grafityta, med molekylplanet
parallellt med ytan. Dessutom går det att se hur molekylerna interagerar med
varandra, vilka atomer i en molekyl som placerar sig mot atomerna i grannmo-
lekylen. I det här fallet är ytans påverkan på molekylen mycket liten - det går
att avbilda olika molekylära elektronorbitaler i experimenten som sedan har
12

kunnat jämföras med teoretiska beräkningar för en fri, opåverkad molekyl,
och överensstämmelsen är mycket bra.
20 nm = 0.000000020 m
Väte atom
Kväve atomKol atom
MikroskopibildFtalocyanin
Figur 1.3: Till vänster i figuren visas en modell av en metall-fri ftalocyaninmolekyl.Till höger finns en bild från ett sveptunnelmikroskop, där ses ett lager av metall-fria
ftalocyaniner på en yta, dessutom är sex stycken molekyler placerade ovanpå det förs-
ta lagret. Molekylens ’kryss-struktur’ från modellen syns även i den experimentella
bilden.
Mikroskopimätningarna har även visat hur ett monolager FePc (ett lager av
molekyler) interagerar med en grafityta. I den studien visas att placeringen av
grafitytans atomer påverkar molekyllagrets formering, även om växelverkan
med ytan är svag.
ZnPc har placerats på en indium-antimonidyta och mätningarna har visat att
molekylerna ligger plant på ytan och växelverkar svagt med den. Spektrosko-
piska mätningar visar dock att ytan påverkar ZnPc molekylerna elektroniska
struktur något.
Spektroskopimätningarna har gett information om hur den elektroniska
strukturen hos H2Pc påverkas av att kaliumatomer placeras på den molekylära
filmen. Som nämnts ovan har en molekyl inte bara orbitaler som är fyllda
med elektroner, de har även tomma orbitaler dit elektronerna kan exciteras.
Här visas att en kaliumatom ger en av sina elektroner till ftalocyaninen,
elektronen placeras i en av de tidigare tomma orbitalerna och molekylens
elektronstruktur förändras. Dessutom har kaliumatomernas påverkan på
molekylernas geometriska struktur bestämts med absorptionsspektroskopi.
Vidare har rubidiumatomers inverkan på molekylära H2Pc filmer undersökts.
13


2. Introduction
Highly organized molecular systems using organic building blocks introduces
a new way to design novel functional materials. The attention towards these
systems has therefore been massive in recent years and knowledge about or-
dered structures on the nano-scale have been sought. The electronic struc-
ture is a key to understand the physical properties and the functionality of
molecular materials. In this thesis, X-ray Spectroscopy and Scanning Tun-
neling Microscopy techniques have been used to investigate Phthalocyanine
(Pc) molecules adsorbed on different surfaces. With these techniques the elec-
tronic structure, the ordering of molecules within a monolayer, and to some
extent, the ordering of molecules within molecular films have been character-
ized. Furthermore, structural changes of a Pc monolayer and a film, by alkali
doping, have been investigated.
Phthalocyanine molecules are macro-cyclic compounds, extensively stud-
ied during many years. The large interest in Pc’s is due to several reasons, both
the number of possible applications of Pc’s (for example solar cells [1], mole-
cular electronics [2] and cancer therapy [3]) and due to the interest in molecu-
lar model systems. The phthalocyanines and the resembling porphyrins, with
a chemical structure similar to the active sites of chlorophyll, hemoglobin
and different enzymes, are very interesting in biomimetic applications such
as catalyst for oxidation reactions [4, 5]. As a catalytic unit, the molecules ad-
sorbed on surfaces, would enable or speed up a chemical reaction. Moreover,
macro-cycles like metal phthalocyanines and metal pophyrins are also known
to enable cathodic oxygen dissociation in fuel cells [6].
The functionality of such applications, as mentioned above, is dependent on
the molecular film properties, which can be characterized by different tech-
niques, among which those used in this thesis. In physics, models are often
introduced to gain fundamental knowledge about certain aspects of more com-
plex systems. The molecule-surface systems presented here, are regarded as
being model systems for studying the interactions between molecular Pc films
and different surfaces. A deeper understanding of such systems may possibly
lead to an increased application range.
This work can be divided in three sections, which will be shortly presented
here. These are molecular phthalocyanine films, monolayer studies and alkali
doping of phthalocyanines.
15

2.1 Molecular phthalocyanine films
If a molecular film, consisting of several molecular layers, is characterized by
weak intermolecular interactions, the film retains molecular properties. For
phthalocyanines, it is known that the molecules interacts only weakly, mainly
by van der Waals forces. In this thesis, films of metal-free phthalocyanine
(H2Pc) and Iron phthalocyanine (FePc) have been examined. By X-ray spec-
troscopic techniques, both the occupied and unoccupied electronic structure
have been mapped, which also have been compared to single molecule Den-
sity Functional Theory (DFT) calculations. Complementary to that, the order-
ing of molecules within the film can be investigated by the X-ray Absorp-
tion Spectroscopy measurements, showing organized growth of molecular Pc
films.
2.2 Monolayer studies
For a molecular monolayer, the balance between intermolecular forces and
molecule-substrate interactions is fundamental for the properties of the sys-
tem. The effect of the substrate on the molecules and the intermolecular in-
teractions have here been investigated. The aim has been to characterize the
interactions present in the molecules-surface system, and to understand how
the properties of the molecular overlayer are altered by different surfaces. Pre-
sented here are monolayer studies of H2Pc, FePc and ZnPc on different sub-
strates, namely Graphite (H2Pc, FePc), Indium-Antimony (ZnPc), Aluminum
(H2Pc) and Gold (H2Pc).
2.3 Alkali doping of phthalocyanines
By alkali doping the properties of the molecular films are modified, due to
charge donation by the alkali. An important result from an earlier study was
that a former insulating CuPc molecular film became metallic for a range of
potassium doping levels [7]. Consequently alkali doping was proposed as a
route for tuning of the physical properties of Pc films. Numerous studies have
examined the influence of alkali doping on the molecular electronic and geo-
metrical structure of different phthalocyanines [8, 9, 10, 11, 12, 13, 14]. Here
H2Pc have been doped by Potassium (H2Pc film) and Rubidium (monolayer
of H2Pc) and changes of the electronic and geometrical structure have been
characterized.
16

3. Techniques
To study material properties a range of experimental techniques may be used.
Information about the electronic and geometrical structure is gained with the
spectroscopy and microscopy techniques presented in the following sections.
3.1 Photoelectron Spectroscopy
The photoelectric effect, theoretically formulated by Einstein in 1905 [15], is
the basis for photoelectron spectroscopy. In the experimental set-up a sample
is irradiated by photons of well-defined energy and, photoelectrons are ejected
from the sample. Since the energy of the system is conserved, the binding
energy of the electrons in the sample (EB) is obtained by measuring the kinetic
energy (Ekin) of the ejected photoelectron, provided that the photon energy
(hν) and the work-function (ϕ , the energy difference between the Fermi leveland the vacuum level) of the sample are known [15]:
EB = hν−Ekin−ϕ (3.1)
The binding energy of electrons in different elements is unique and guarantees
a chemical analysis of examined samples [16]. The photoelectron technique
is therefore also known as ESCA, short for Electron Spectroscopy for Chem-
ical Analysis. Nevertheless, slight changes of the electron orbitals as result of
interactions among atoms or the presence of different chemical states can be
detected as shifted spectral features, an effect also called chemical shift.
The information given by the intensity of different spectral features reflects
to some extent the density of occupied states. The transition rate between the
initial and final state is given by the Fermi Golden rule [17]
ω =2πh̄|< f |Hint | i> |2δ (Ef −Ei−hν) (3.2)
The initial and final states are denoted with i and f. Hint describes the in-
teraction with the incoming photon, the delta function gives the energy con-
servation. The electron orbital symmetry in relationship to the polarization of
the E vector will influence the < f |Hint | i > term, resulting in an angular
dependence of the emission intensity.
17

CCD-camera
Lens System
MCP
entrance slit
Principle Set Up of Photoelectron Spectrometer
photons
sample
phosphorscreen
Vret
trajectories
V+ V-
Figure 3.1: A schematic picture of the photoelectron spectrometer. From the samplephotoelectrons are emitted, and focused before they enter the hemispherical analyzer.
Only electrons of a certain energy are detected at the phosphor screen.
3.1.1 X-ray Photoelectron Spectroscopy (XPS)
With X-ray Photoelectron Spectroscopy (XPS) the atomic core-levels may be
examined. To probe the atomic core-levels X-rays are needed as excitation
source. In this work the X-rays have been provided by a synchrotron facility
or by a rotating anode in the home laboratory. For measuring the photoelec-
tron kinetic energies a Scienta spectrometer has been used, consisting of an
electron lens and a hemispherical analyzer. A schematic picture of the photo-
electron spectrometer is shown in Fig. 3.1. The lens system focuses, retards
or accelerates the electrons to the chosen pass energy before they enter the
analyser hemisphere. An applied electric field between the two walls in the
hemisphere affects the electron orbit, so that the electrons with a kinetic en-
ergy within a certain energy range hits the detector. The resolution of the
spectrometer depends on a series of factors, the most important are the set
pass-energy and the entrance slit of the spectrometer.
From the equation EB=hν−Ekin-ϕ (5.1) it is seen that the binding energy(EB) can be obtained when the kinetic energy and the work-function are
known. The energy position of the main feature in the spectrum is decided by
the energy difference between the initial and final states. The main line often
corresponds to the final state with the lowest energy, the most relaxed and/or
best screened state. In addition satellite structures may be present, more about
these in section 3.1.2. In Fig. 3.2 a schematic sketch of the photoelectron
process is shown, together with the other processes described below.
18

XPS UPS XASShake-up
photoelectron
Ground state
photon (hν)
Core electrons
Valence electrons
Figure 3.2: A schematic picture describing the processes examined with the differenttechniques. In the XPS process, a core electron is emitted, excited by the incoming
photon. With UPS the valence levels are examined. When a shake-up feature is seen
in a XP spectrum, an additional excitation has occured in the valence band during
the photoemission process. In XAS the unoccupied states are mapped, by resonant
excitation of a core-electron to unoccupied valence levels.
3.1.2 Satellites
Often at higher EB than the main line in the XP spectrum, additional features
called satellites can be seen. They can be regarded as different final states of
a photoemission event. They are observed if, at the same time as the photo-
electron is ejected, an excitation takes place in the molecular valence levels.
Shake-up and shake-off satellites are due to excitations of valence electrons to
bound and continuum states, respectively.
These valence level excitations require energy, whereby the ejected elec-
trons will have decreased kinetic energy. Therefore satellites are seen as fea-
ture at higher binding energy than the main line in the XP spectrum. The exci-
tations between the valence levels are monopole transitions between occupied
and unoccupied states. This is theoretically further described in the following
section.
3.1.3 Koopmans’ theorem and the sudden approximation
Koopmans’ theorem states that the ionization potential (IP) can be calculated
for an occupied electronic orbital and that the absolute value of the IP is equal
to the orbital energy [17].
This is based upon the assumption that the electrons remaining in the ion-
ized system are not affected by the change in the potential when the core-hole
is created, i.e. they are in a "frozen state". Within this assumption there would
be only one final state and only one peak would be seen in the photoelectron
spectrum, situated at the so called Koopmans’ energy.
However, for a more accurate description of the photoelectron spectrum,
one has to introduce a relaxation term in the expression for the binding energy:
19

EB = EKoopman +Erelaxation (3.3)
The relaxation term takes into account the response of the system to the
new core-hole potential. The suddenly created core-hole leads to contraction
of the electronic orbitals. Moreover, for molecular or solid systems screening
of the created core-hole (by charge transfer to the core-hole site or by polar-
ization) can occur to minimize the energy of the system. The relaxation of the
remaining electrons leads to new excitations of valence electrons to bonded or
continuum states seen as additional features in the XP spectrum.
The fact that additional excitations occur can be shown theoretically within
the sudden approximation [18] which describes a fast (sudden) ionization pro-
cess that occurs when the excitation energy is high enough. The system that is
ionized is in the initial state, a N-electron system with wave function Ψ0(N),described by the Schrödinger equation
H(N)Ψ0(N) = EN0 Ψ0(N) (3.4)
After the ionization event, a (N-1)-electron system persists:
H(N−1)Ψi(N−1) = EN−1i Ψi(N−1) (3.5)
Ψi(N−1) describes a final state, a fully relaxed state that may have under-gone additional excitations.
However, within the sudden approximation the (N-1)-electron system does
not have time to fully relax and is therefore not in an eigenstate of the fi-
nal ionic Hamiltonian, H(N-1). The remaining electron system is instead in aΨR(N−1) state, a mixture of states that may be written as a linear combina-tion of eigenstates of the ionic Hamiltonian H(N-1) [18]
ΨR(N−1) =∞
∑i=0
< Ψi|ΨR > Ψi(N−1) (3.6)
The ionization therefore leads to several states, each with the probability
Pi = |< Ψi|ΨR > |2 (3.7)
which corresponds to the intensity of a certain satellite feature related to
the ionization process. The energy positions of the satellites are instead de-
termined by the eigenvalues Ei(N-1). Then, a XP spectrum shows a peak at
lowest binding energy (often the main line) corresponding to the most relaxed
final state accompanied by several of these satellite features at higher binding
energies. Since the relaxation minimises the energy of the ionized system, the
main line will be situated at lower binding energy than the Koopman energy.
20

1
10
50
1 10 100 1000
Electron Energy (eV)
Mea
n fr
ee p
ath
(Å)
Figure 3.3: A sketch of the so called universal curve for elements, the relationshipbetween electron energy and the inelastic mean free path of the electron [19].
3.1.4 Electron escape depth
The photoelectrons emitted from a sample have a finite escape depth due to
inelastic scattering. Only the electrons that are scattered elastically or not scat-
tered at all are detected with their original kinetic energy. The inelastically
scattered electrons loose some of their kinetic energy in the process and are
therefore seen in the spectra at a higher binding energy, resulting in the con-
tinuous background in the spectra. The depth that electrons may escape with-
out being inelastically scattered is dependent on their kinetic energy. This is
shown by the universal curve, Fig. 3.3 [17]. Since the escape depth is 2-50Å for kinetic energies between 1 and 1000 eV, photoelectron spectroscopy is
a surface sensitive technique used to study the outermost atomic layers of a
sample. In the case of adsorbed films, this fact might be used to secure that
only the signal from the molecular film is studied.
3.1.5 Ultraviolet Photoelectron Spectroscopy (UPS)
In the case of XPS the core levels are examined, since the energy of the in-
coming radiation is high enough to probe these states. The core electrons are
slightly affected by the interatomic interaction, even if they do not take part in
the molecular bonding (core-level chemical shift). The shallow valence lev-
els are responsible for the bonding, both with other surrounding molecules
and in the case of adsorbate with the substrate. These states can be studied
by ultraviolet radiation, used as excitation source in Ultraviolet Photoelectron
Spectroscopy (UPS) measurements.
21

3.2 X-ray Absorption Spectroscopy (XAS)
The unoccupied electronic structure of materials can be probed with X-ray
Absorption Spectroscopy (XAS). The samples are irradiated by a tuneable
photon source (synchrotron radiation) that excites core electrons to unoccu-
pied valence states. These core-hole states can decay either by emission of
photons or by emitting Auger electrons. For elements with low atomic num-
ber Z, the Auger-like decay is dominating.
The cross-section for a transition between the initial ground state and the
final excited state is described (in the dipole approximation regime) by [20]
σXAS ∝|< f |e•p | i> |2ρ(Ef )δ (Ef −Ei−hν) (3.8)
where i denotes the initial state, f the final state, p linear momentum oper-ator of electron, e the unit vector (parallel to the polarization of the light) andρ(Ef ) the energy density of the final states. The delta-function assures that theenergy is conserved during the excitation.
The atom specific excitation into unoccupied states makes XAS a local
technique. The intensity in the spectrum is proportional to the density of un-
occupied states at the core-hole site, but this does not strictly correspond to
the density of states (DOS) for the ground state since the unoccupied states
are measured in presence of a core-hole.
However, the intensity of a feature also varies depending on how the mole-
cules are oriented on a surface, i.e it is dependent on the polarization direction
of the light. The dipole selection rule governs the absorption process and the
intensity is dependent on the overlap between the electrical field of the light, e,and the linear momentum operator, p. This overlap changes with the polariza-tion direction, directly leading to a intensity change. According to the dipole
selection rule, electrons excited from a 1s state (which is the case in these
studies) can only be transferred to states with a component of p-character (Δ l= ± 1) and the spatial distribution of those can be theoretically simulated. Bymeasuring the change in relative intensity for different π- and σ -features asa function of the incidence angle of the polarized light, the orientation of the
molecules on a surface may be determined.
The absorption spectra can be measured by collecting Auger electrons that
are emitted when the excited atom decays. The number of ejected Auger-
electrons as a function of the incoming photon energy gives the absorption
spectrum and it is measured by a multi-channel plate or by a Scienta spec-
trometer.
The XA spectra can be recorded in three modes: partial, total or Auger
electron yield. By the multi-channel plate detector in total yield mode all the
electrons emitted from the samples are collected. In partial yield instead a
bias voltage is set in order to collect only the electrons from a chosen Auger
transition, filtering out electrons with too low kinetic energy. With a Scienta
22

spectrometer in Auger electron yield mode, spectra are recorded in a fixed
kinetic energy window selected according to the Auger transition of interest.
Since electrons originating from deeper lying layers in the samples have
a larger possibility to be scattered, loosing energy, a filtration of low kinetic
energy electrons enhances the surface sensitivity of the technique.
3.3 Scanning Tunneling Microscopy (STM)
Scanning Tunneling Microscopy was invented 1982 by Gerd Binning and
Heinrich Rohrer [21, 22], who were rewarded the Nobel Prize for the inven-
tion in 1986. The technique uses the concept of quantummechanical tunneling
to obtain real-space images of surface structures, such as reconstructions and
substrate adsorbates. An extremely sharp tip (in the best case monoatomic)
is scanned over the examined surface at a distance of a few Ångstöm so that
electronic tunneling between the tip and the surface can take place, enabling
measurement of the distribution of electronic states at the surface.
3.3.1 Quantum Mechanical Tunneling
Electron tunneling is a quantum mechanical effect forbidden in classical me-
chanics. A particle with energy E can tunnel through a potential barrier φ inthe quantum mechanical regime, even if E<φ .For tunneling through a one-dimensional barrier, the tunneling current can
be described by
Itunneling ∝ e−2√2mφh̄ d (3.9)
where d is the barrier width, in the STM case the distance between tip and
surface, φ the local barrier height and m the free-electron mass [23].In STM, the wave functions of the tip and the surface overlap since their
mutual distance is just a few Å, allowing electron tunneling from the one to
the other. A bias voltage is thereafter applied between the tip and the surface,
resulting in a misalignment of the respective Fermi levels as illustrated in Fig.
3.4. Depending on the sign of the applied bias, a tunneling current from the
sample to the tip or vice versa is induced. Occupied and unoccupied electronic
states near the Fermi level can be probed. As seen in equation 3.9, the tunnel-
ing probability exponentially decays with the surface-tip distance giving the
high resolution of the technique, in fact even atoms can be resolved.
A detailed theoretical description of the tunneling process is troublesome,
since it requires accurate descriptions of the substrate and tip wave functions
as well as the interaction between tip and sample. Furthermore, the shape
of the tip is most often unknown and likely to change under the experiment
course. To describe the scanning tunneling process with higher accuracy than
just considering two planar metal electrodes, Tersoff and Haman developed a
model where the tip wave function is described as s-shaped, that is with spher-
23

dEF, metal 1
EF, metal 2
Metal 2Metal 1
eU
φ1
φ2
Z
E
Figure 3.4: The figure illustrates the tunneling event between twometals (e.g. substrateand tip) separated by the distance d. Filled areas are occupied density of states. Apositive bias (eU) is here applied to metal 1, resulting in tunneling of electrons from
occupied states in metal 2 to unoccupied states in metal 1. The electron wave function
overlap between the metals is indicated.
ical symmetry. This approximation makes it possible to evaluate the tunneling
matrix element [24]. It can then be shown that
Itunneling ∝ ∑S|ψS(�r0)|2δ (ES−EFT ) (3.10)
where ψS(�r0) is the substrate density of states, at the position of the centerof curvature of the tip, and ES the energy of the ψS state. Hence, the tunneling
current measured at a given position of the tip is proportional to the surface
local density of states at the tip Fermi level (EFT ), and the obtained image in
constant current mode (see below) represents the contours of constant surface
density of states. The Tersoff-Haman method is however only applicable for
low bias voltages (in the order of 10 meV), for the sample-tip interaction to
be sufficiently small to be neglected. Note that this condition is not fulfilled in
the studies presented in this thesis.
As mentioned earlier, the image is a representation of the local density of
states (see Fig. 3.5), at the position of the tip. For adsorbate systems, a con-
volution of the density of states of the adsorbates and the surface is observed
as the microscope probes the adsorbate and the substrate both perturbed by
their mutual interaction. Therefore, the adsorption site may influence the im-
age of adsorbed molecules [25, 26, 27]. This effect can be as strong as to result
in counterintuitive contrast. For example, an adsorbate such as Oxygen on a
metal surface is imaged as a depression rather than a protrusion [28, 29].
3.3.2 Imaging modes
The STM can be used in different imaging modes, constant current and con-
stant height mode [23, 30]. In the constant current mode, the tunneling current
24

dEFS
EFTeU
φS
φT
E
ρTρS
TipSample
z=0 z=d
Figure 3.5: This schematically illustrates tunneling between a metallic tip and a metal-lic surface, separated by a distance d. A positive voltage U is applied to the sample,resulting in tunneling from the tip to the surface. Filled areas indicate occupied states,
unfilled areas unoccupied states. The tip electronic density of states near the Fermi
level is nearly constant, and the density of states of the sample in the region (EFT - eU)
is probed, indicated by the arrows.
is set to a specific value and held fixed by a feedback loop. At each probed
point the tunneling current is kept constant, resulting in a measured height
variation of the tip as compared to the surface when scanned over the sub-
strate (see Fig. 3.6). The constant current mode is the most common used and
all images presented in this thesis have been obtained in this mode.
In the constant height mode instead, the distance of the tip above the sub-
strate is set, resulting in a measurement of the tunneling current variation at the
specific tip height, illustrated in Fig. 3.6. The constant height mode measure-
ment can be performed with a faster scanning speed compared to the constant
current mode.
3.3.3 Principles of STM instruments
The resolution on the atomic scale and the local probing possibility are highly
rated advantages of the STM technique. Crucial components of the STM in-
strument are the tip, the motors used for scanning and vibration isolation of
the instrument. The tip is commonly fabricated from a thin wire of W or Ir/Pt
alloy and is, as stated above, in the best case mono-atomically sharp [31].
Since the electronic density of states of the tip should be nearly constant close
to the Fermi level, the choice of the tip material is important. The tunneling
process between the tip and the sample is dependent of the metallic character
of both the substrates and the tip. The three dimensional positioning of the tip
relative to the sample is obtained by the use of piezoelectric scanner motors.
25

Tip
Tip movement
Zd
X
Scan direction Surface atoms
Electron tunneling
Tip
Z
Constant current imaging X
Tip
Tip movement
Z
Constant height imaging X
Y
Figure 3.6: The principle of constant current and constant height mode. The tip isscanned in the x-direction, in the constant current mode the change of the tip-surface
distance (z- direction) is measured while the tunneling current is fixed. In constant
height imaging the tunneling current is measured while the tip height is kept constant.
The tip is scanned in the x (or y) direction by the motors, while measuring the
change in the distance d or the tunneling current Itunneling, depending on thescanning mode. An inconvenience connected to the STM is the high vibration
sensitivity of the instrumentation. To obtain resolution on the atomic scale, the
tip-to-surface distance has to be stable on the sub-Å scale, and vibrations of
the surrounding have to be compensated for by different vibration insulating
components [23, 31].
By cooling the sample to low temperatures (in the studies presented in this
thesis to about 70 K) vibrations and the mobility of adsorbates are minimized.
Due to reasons as an un-sharp tip or vibrations, image artefacts can be ob-
served and most often revealed by changing different measuring parameters
such as scanning speed, scanning angle or bias voltage.
26

4. Density Functional Theory
Theoretical calculations have been used in several of the papers included in
this thesis for interpretation of the experimental results. The theoretical results
have been obtained with Density Functional Theory (DFT) [32, 33]. The cal-
culations have been performed on a single, isolated H2Pc molecule. XP and
XA spectra have been obtained using DeMon [34] program. The valence band
density of states (DOS) has been computed using the Gaussian 03 code [35].
For the XP spectra the binding energy is calculated according to the ΔKohn-Sham (ΔKS) procedure, as the difference in total energy between thecore-ionized state (E f ) and the ground state (Ei):
EB = Ei−Ef (4.1)
where both states (E f and Ei) are energy optimized. Since the calculations
have been performed on an isolated molecule, the theoretical binding energy
is referred to the vacuum level and the spectra do usually need to be shifted in
energy for the comparison with experimental data in order to account for the
work function.
The XAS spectra have been calculated following the transition potential
(TP) approach, where the electronic structure is calculated with a core hole
of fractional occupancy on the excited atom. This simulates the relaxation of
the valence levels. The absorption spectrum (i.e. the oscillator strengths) is
calculated for the set of electronic levels obtained in the TP configuration.
Equivalent core-hole time-dependent density functional theory (ECH-TD-
DFT) has been used to simulate the shake-up structure of the C1s XP spec-
trum. This method combines the equivalent core-hole (ECH) or Z+1 approxi-
mation to describe the core ionized atom, with TDDFT to calculate the energy
positions of the shake-up excitations. The Z+1 approximation simulates the
core-hole state by adding an extra positive charge to the nucleus. The valence
levels respond to this extra charge in the same way as if a core-hole is present.
The TDDFT is widely used to study optical excitations in molecules. In our
application, the excitation energy of the shake-up states are related to the op-
tical excitation of a core ionized system.
The intensities of the shake-up transitions have been calculated on the basis
of the sudden approximation, which states that the molecular orbitals do not
have time to readjust during the photoemission process since the ejection of
the electron is a fast event compared to the relaxation. In this framework, the
intensity of the shake-up features is equal to the square of the overlap between
27

the initially occupied (Ψi) and the final excited (Ψ f ) valence states [18]
Ishake−up =|< Ψi |Ψ f > |2 (4.2)
28

5. Experimental
This section includes a description of sample preparations and the experimen-
tal instruments used in the experimental work.
5.1 Sample preparation and Ultra High Vacuum
Surface science investigations are usually performed in a Ultra High Vacuum
(UHV) environment, this is a necessity for obtaining clean surfaces and for
keeping samples clean during the measurements. In normal atmospheric pres-
sure a clean surface would immediately be covered by contaminants, while in
UHV it can still be clean after few hours. The pressure in the different systems
used for the studies presented here have typically been in the low 10−10 Torrrange. To reach UHV, pumps of different kind (as ion, titanium sublimation,
mechanical and turbo pumps), together with the so called bake-out1 of the
experimental system have been used.
In the studies presented here, several different substrates have been used,
and different cleaning procedures have been performed.
The conducting glass substrates, used in papers I and II, have been cleaned
ex situ in a ultrasonic bath with ethanol, thereafter dry blown in Ar gas andinserted in the load-lock system connected to the UHV chamber.
In the case of Si(100), used in paper III, the substrates have been cleaned
by direct heating to about 1070 K for several hours. Thereafter the Si has been
flashed several times to about 1370 K while not exceeding a pressure of 4
x 10−10 Torr in the preparation chamber. The native oxide layer is removedin the heating procedure and the surface atoms are rearranged in an ordered
structure (surface reconstruction).
The Highly Oriented Pyrrolytic Graphite (HOPG) surfaces, used in papers
IV and V, have been cleaved in air before insertion in the vacuum chamber.
Annealing of the substrates to about 1170 K resulted in that adsorbates were
heated off and large, flat, clean areas have been observed in the STM.
The InSb(001) (paper VI), Al(110) (papers VII and VIII) and Au(111) (pa-
per IX) surfaces have been cleaned by repeated sputtering and annealing cy-
cles. During sputtering, the surfaces are bombarded with high energetic argon
ions, accelerated from an ion gun towards the sample. This results in a clean
1The instrument chambers are heated up to temperatures above 120◦C to release and pump outmolecules adsorbed on the chamber walls.
29

surface, free from contaminants, but corrugated due to the ion bombardment.
The samples are annealed, whereby the surface atoms rearranges and flat sur-
face areas are recovered.
The molecular depositions have in all cases been performed in situ, eitherfrom a resistively heated tantalum pocket (FePc, H2Pc) with a small hole (ap-
proximately 1 mm in diameter), warmed to a temperature of about 670 K or
from an evaporator consisting of a quartz glass tube (with a hole of 3.5 mm di-
ameter) with a tungsten wire winded around for heating (H2Pc, ZnPc). In both
cases the evaporation rate has been controlled by careful adjustment of the
heating current. For the monolayers (ML) characterized by STM, the molec-
ular films have been heated to about 670 K after deposition. But, this has not
been the case for the monolayer studies of ZnPc/InSb(001) and H2Pc/Al(110)
(paper VI and VII, respectively) where the deposition rate of the evaporators
have been carefully calibrated, before the presented data have been recorded.
The doping of alkali metals have been done from a SEAS getter source,
activated in the UHV chamber.
5.2 Synchrotron radiation
Synchrotron radiation is generated when charged particles are accelerated in a
magnetic field, i.e. the particle linear trajectory is changed. If the particles havea speed close to the speed of light, the emitted radiation is strongly focused in
the forward direction. Furthermore the radiation is intense, with a continuous
energy spectrum, i.e. the synchrotron radiation is a tuneable photon source.Historically synchrotron radiation was only seen as an energy loss in par-
ticle storage rings [36]. However, the possibility of using the radiation for
scientific investigations has resulted in facilities designed for generation of
synchrotron radiation.
The synchrotron radiation facilities consists of a storage ring in which high
energy electrons (or in principle positrons) are injected. The storage ring is
under UHV to prevent the electrons from colliding with atoms or molecules.
Synchrotron radiation is generated when the electrons pass the bending mag-
nets or insertion devices (undulator or wiggler) [36].
In the studies presented here, synchrotron radiation has been used for spec-
troscopic investigations. The tuneable photon source is used for the X-ray Ab-
sorption measurements. In addition the possibility to choose a specific photon
energy for the X-ray Photoelectron Spectroscopy measurement is used for sur-
face sensitive measurements (see section 3.1.4).
The synchrotron radiation studies presented in this thesis have been carried
out at the Swedish national laboratory MAX-lab in Lund. The measurements
have been performed at MAX II, a 1.5 GeV third generation electron storage
ring.
30

5.2.1 Beamline I511, MAX-lab, Lund
At MAX-lab the experiments have been carried out at the surface branch
of beamline I511 [37] where linearly polarized light in the energy range of
100 to 1500 eV is provided. The beamline is equipped with a Zeiss SX-
700 monochromator. The experimental end-station consists of two chambers;
a preparation chamber and an analysis chamber. On the latter, a Scienta2
analyzer for X-ray Photoelectron Spectroscopy (XPS), an X-ray Emission
Spectrometer for XES measurements, and an X-ray Absorption Spectroscopy
(XAS) detector are mounted. The analysis chamber can be rotated around the
light beam axis, implying that spectra can be measured at different emission
angles with respect to the E vector of the light. Also the sample can be rotated,
thereby the angle between the polarisation E vector of the light and the surfacecan be varied. The end-station construction results in that the incoming light is
always shining on the surface at grazing incidence, thus the normal emission
data is truly 7 degrees off normal. Measurements presented in paper I, III, VII
and VIII have been performed at this beamline.
5.3 Home laboratories
5.3.1 X-ray Photoelectron Spectroscopy
In the ESCA 200 and 300 home laboratories [38, 39], photoelectron spec-
troscopy (XPS) measurements are performed. In both cases Al Kα radiation
with the energy 1486.7 eV is produced by electron bombardment of a water
cooled aluminium coated rotating anode. The monochromator focuses the X-
ray beam onto the sample and the emitted photoelectrons are analysed with
a Scienta SES-200 or SES-300 spectrometer, respectively. In both systems a
separate evaporation chamber connected to the system has been used for insitu film depositions. The ESCA 200 system is equipped with a sputter gun
and a sample heating stage for annealing of the samples. The XPS measure-
ments presented in papers I and II have been performed with the ESCA 300,
the data presented in paper VI have been obtained with the ESCA 200.
5.3.2 Scanning Tunneling Microscopy
The STM measurements presented in this thesis are, with two exceptions,
obtained with a Omicron variable temperature, UHV instrument in Uppsala,
Sweden. The STM data presented in paper V has partly been performed using
a home-built STM [31] in Aarhus, Denmark and the presented STM images
in paper VI have been obtained with a Omicron STM at Royal Institute of
Technology (KTH), Stockholm, Sweden.
2A Scienta SES-200 exchanged in 2005 to a Scienta R 4000 analyzer.
31

The Uppsala instrument consists of a chamber with the STM stage and a
preparation chamber. The latter is used for sputtering and annealing of the
samples and is also equipped with LEED/Auger facilities. The molecular de-
positions on the substrates have been performed in an evaporation chamber
connected to the preparation chamber. All STM measurements presented here
have been performed in the constant current mode. Positive bias voltage has
been used for probing unoccupied states, negative bias for probing occupied
states. The STM stage can be cooled down using liquid helium, reaching sam-
ple temperatures of about 70 K.
5.3.3 Calibration of XPS, XAS and STM measurements
In XPS surface science investigations, the energy scale is most often referred
to the Fermi level defined to be at zero binding energy. This is however only
applicable for a metallic sample, in other cases the binding energy is referred
to the vacuum level, or alternatively, to a XPS core-level with known binding
energy. In the studies presented here the calibration has been done in different
ways. In papers I and II the energy scale has been calibrated to the Fermi level
of a Ag sample. For paper III the calibration has been done by referring to the
Si2p feature at 99.7 eV. The XPS measurements presented in paper VI have
been referenced to the In3d5/2 feature, at binding energy of 444.5 eV. For
the measurements in paper VII, the Fermi energy of the Al(110) have been
used for calibration. In the case of the doped films (paper VIII), the core-level
spectra have been recorded using first and second order light to obtain the true
value of the photon energy. The Fermi level of the clean sample has thereafter
been measured, calibrating the kinetic energy scale of the spectrometer with
chosen experimental settings (for example spectrometer slit and pass energy).
In the same paper (VIII) the valence band spectra have been measured in a
series during which all adjustable settings have been kept constant, thereafter
the sample has been cleaned and the Fermi level, to which the binding energy
scale of the spectra has been calibrated, recorded.
The energy scales of XAS spectra shown in this thesis have been calibrated
by measuring the C1s photoemission peak with first and second order light.
The Uppsala STM instrument has been calibrated in the x and y direction
using a HOPG substrate with a lattice constant of 2.46 Å as a standard. The
STM used for measurements in paper VI has been calibrated by setting the
distance of adjacent In rows to 18.3 Å.
32

6. Substrates and adsorbates
6.1 Substrates
Substrates with different physical properties, both metallic, semimetallic and
semiconducting, have been used in the studies. In papers III, IV, V, VI, VII,
VIII and IXmolecules have been deposited onto highly ordered surfaces, char-
acterized by a well defined atomic periodicity.
Conducting glass (FTO)In the first two papers conducting glass, commonly used in displays and as
back contact in view-through solar cells, has been used. This material is made
of ordinary window glass, coated by a thin transparent conducting layer of tin
oxide doped with fluorine, and is also known as FTO. In contradiction to the
other substrates used in the experimental work presented in this thesis, these
are cleaned ex situ. Moreover, the FTO is characterized by a large corrugation,as compared to other surfaces used in our experimental work.
Al(110)The metal Al(110) surface structure is modified by a surface oscillatory relax-ation [40] which results in a variation of the spacing between the outermost
surface layers. Contraction and expansion of the interlayer distance is found
for several layers, as compared to the distance between neighbouring layers in
the bulk.
Si(100)Silicon is a semiconductor, characterized by a band gap between the occupied
and unoccupied levels, with the Fermi level situated in the band gap. The un-
reconstructed surface would have two broken bonds at the site of each surface
atom and the Si(100) surface reconstructs in a (2x1) structure [41, 42]. Rows
of dimers are thereby formed, lowering the number of broken bonds and the
surface free energy.
HOPGHighly Oriented Pyrolytic Graphite (HOPG) has been the substrate in the stud-
ies presented in papers IV and V. Graphite is a semimetal, i.e. it has a low den-sity of states near the Fermi level [43]. The HOPG (0001) surface sheet has
a hexagonal symmetry and consists of sp2-hybridized carbon atoms, whereas
between parallel graphite sheets weaker π bonds are present [43]. The carbon
33

atoms are situated at two inequivalent sites, the α and β , illustrated in Fig.6.1. The α has neighbouring atoms situated directly below in the deeper lyinggraphite sheet. This is not the case for the β carbon atoms that, as seen inFig. 6.1, do not have an atom directly below [44]. In STM images, only the βatoms are observed, due to the fact that the STM measures a convolution of
different electronic states [45] and the density of states close to EF is higher
at the β atom sites.
αβ
Lines indicating that α atoms are placed on top of each other
Top view Side view
β−β distance 2.46 Å
β (top layer)
α β atom
α atom
β (second layer)
Figure 6.1: Schematic illustration of the HOPG surface with the so called α and βatoms. To the left the graphite sheets are seen from the side, to the right from the top.
The α atoms in neighbouring graphite sheets are placed directly above each other.
InSb(001)The surface of the semiconductor InSb(001) can reconstruct in different ways,
depending on the surface preparations [46]. The atoms in the bulk are arranged
in a zinc-blende structure. The Sb atoms are placed on one fcc lattice, and the
In atoms on another fcc lattice, but shifted compared to each other as seen
in Fig. 6.2. The ideal (001) surface would consist of only one element, but
the surface rearrange instead and this can result in a number of surface re-
costructions, with different In and Sb surface concentrations. The most stable
reconstruction is the c(8x2) which has a In-rich surface [46]. A model of the
c(8x2) reconstruction, illustrated to the left in Fig. 6.2, has been proposed by
Kumpf et al. [47]. As also observed by STM [48], In rows, about 18 Å apart,
are formed along the [110] direction. Sub-surface dimers (not seen in the il-
lustration) produces the (8x2) symmetry of the reconstruction in contrast to
the (4x1) symmetry observed in the surface layer (and in Fig. 6.2) [47]. The
InSb(001)-c(8x2) substrate has been used in paper VI.
Au(111)An Au(111) surface reconstructs in a so called herringbone structure, also
denoted (√3x22), with periodically distributed stress domains. The recon-
struction has earlier been characterized by STM [49, 50], see for example the
34

Surface layer, top view
In atom
Sb atomSurface layer, side view
Bulk structure
[110]
[110]
[110]
[001]
Figure 6.2: To the left, schematic illustration of the surface layer of the InSb(001)-c(8x2) surface reconstruction, seen from the top and the side, according to the model
by Kumpf et al. [47]. To the right the bulk structure of InSb is displayed.
study by Barth et al. [49]. In the surface plane 4% more Au atoms are found
compared to a plane in the bulk. The surface can be described with a stacking-
fault-domain model, which includes periodic sequences of areas with fcc-type
and hcp-type stacking. These regions are separated by so called soliton walls
where the Au atoms occupy bridging sites that appear brighter in the STM
measurements, see Fig. 6.3. The fcc areas, having lower surface energy, are
slightly bigger than the hcp- regions [50]. The soliton walls form a zig-zag
structure to further minimize the surface free energy. At the so called elbow
sites [50] the soliton walls change direction, the angle between two walls are
about 120◦ [49]. In paper IX, Au(111) has been used as substrate.
Soliton wall
Fcc region
Hcp region
Figure 6.3: STM picture of an Au(111) herringbone reconstructed surface. The soliton
walls are seen as brighter lines, forming a zig-zag structure. Indicated are also the fcc
and hcp regions. Bias = -3.9 V, I = 0.041 nA, 44.2 nm x 43.3 nm.
35

z
N1
N3
C1b
x
y
N2
C2b
Cbp
Cp Cp2
Cbp' C2b'
C1b' H H
z
x y
(a) (b) C(2)
C(3)
C(1)
N(2)C(4)
N(1)
H
N
C
Fe
Figure 6.4: (a) Metal-free and (b) iron phthalocyanine, geometry optimized in singlemolecule calculations, see paper I and III respectively. Next to the H2Pc the so called
pyrrole carbons (Cp), and benzene carbons (C1b, C2b, Cbp) are marked.
6.2 Adsorbates - Phthalocyanines
Phthalocyanines, the molecular adsorbates studied in this thesis, are macro-
cyclic compounds, extensively studied during many years due to different
reasons, mostly for the possibility to use them in many different technolog-
ical applications. Phthalocyanines can have chemical formulas MeC32N8H16or H2C32N8H16, that is metal-phthalocyanine (MePc, where Me stands for a
metal atom) and metal-free phtalocyanine (H2Pc) respectively. In this thesis
H2Pc, FePc and ZnPc have been characterized. The H2Pc and FePc molecular
structures are displayed in Fig. 6.4.
In films, these molecules are known to form molecular stacks which in-
teract via van der Waals forces [51]. The interactions between neighbouring
molecules within a stack are weak and mainly restricted to the first neighbours
[52]. It is known that the Pc molecules self-organize into different phases, the
two most well known are the α and β phases [53], even though many othersexist. Both the α and β phases are formed by molecules with the molecularplane parallel to each other, but with the stacking direction tilted from the
normal to the molecular plane with 26◦ and 45◦, respectively, see Fig. 6.5.Different phases are known to form by different deposition methods, for
example sublimation [54], heat treatment [55] or solvent deposition [56]. For
each phase the electron orbital overlap between neighbouring molecules is de-
cided by the stacking direction and hence the electronic structure of the over-
layers is distinct for each phase. The optical and photovoltaic properties are
therefore different [57], and a tuning of specific properties might be obtained
by controlling the film growth.
For monolayer formation of phtalocyanines on different substrates, it is in
many cases found that the molecules are arranged with the molecular plane
36

26˚ 45˚
α-phase β-phase
Figure 6.5: Schematic illustration of the α and β phases of phthalocyanine.
parallel to the surface [58, 59, 60, 61, 62]. The characteristics of the adsorbate-
substrate interaction, together with the adsorbate-adsorbate interaction, affect
the molecular adsorption growth mode.
6.3 Adsorbate-adsorbate and adsorbate-substrate interactions
The adsorbate-substrate interaction can be of different strength, molecules can
either be physisorbed or chemisorbed on the surface. There is however no
strict distinction between physisorption and chemisorption.
In physisorption the overlap between the valence electronic levels of the
adsorbates and the substrate is small and the molecule-surface interaction is
weak. Often the interaction is mediated by van der Waals forces, which even
if weak, are long range interactions [63] and the adsorbate-substrate distance
can be relativly large. The bonding energy is small (in the order of about 0.1
eV [64]) and the adsorbate and substrate electronic structures are only weakly
perturbed in case of physisorption.
In chemisorption on the other hand, the electronical states are significantly
distorted and a chemical bond is formed between the adsorbate and the sub-
strate [63]. Often the bonding is of covalent type [63] and electrons are shared
by the two constituents. The bond distance is short and the bonding energy
in the order of 1 eV [64]. In the case of chemisorption, a core-hole created
by ionization of an atom in the adsorbate can typically be well screened by
the substrate, since a charge transfer from the substrate to the adsorbate may
occur.
Adsorbates can also interact via ionic bonding. In this case, an electron is
transferred from one species to the other, resulting in a positive and a negative
ion, attracting each other. In the periodic table of elements the group I, i.e.hydrogen and alkali metals, are known to easily donate their outer electron
and to form ionic bonds with other substances.
Depending on the adsorbate-adsorbate and adsorbate-substrate interactions
molecular growth can occur in different arrangements on the substrate. The
growth are distinguished in three different modes, known as Frank-Van der
37

Merwe, Stranski-Kastranov and Volmer-Weber growth [19], illustrated in Fig.
6.6. In Frank-Van der Merwe growth the adsorbates are arranged in a layer-by-
layer formation. In the case of Stranski-Kastranov growth a few monolayers
are formed on the substrates before three-dimensional islands are formed [19].
Volmer-Weber growth are characterized by the growth of three-dimensional
islands, and the surface may not be completely covered until a large deposition
has been made.
Frank-Van der Merwe growth Stranski-Krastanov growth Volmer-Veber growth
Figure 6.6: Illustration of the different adsorbate growth modes: Frank-Van derMerwe, Stranski-Kastranov and Volmer-Weber growth.
The balance between molecule-substrate and molecule-molecule interac-
tions also affects the formation of the molecular monolayer [65]. The adsor-
bate structure on the surface may coincide with the underlying substrate lat-
tice. If every overlayer lattice point, i.e. adsorption site, overlap with a under-lying substrate lattice point the adsorbed overlayer is commensurate with the
substrate. Due to different interactions between the surface and the adsorbate,
several different adsorption sites of the molecules may exist resulting in a co-
incidence or incommensurate adsorption. In the case of coincidence, a super-
cell (unit cell) for both the substrate and adsorbate can be defined. This is not
the case for an incommensurate adsorption, where no unit cell for the whole
system can be found. The formation of non-commensurate (coincidence and
incommensurate) structures can be observed by the appearance of a Moiré
pattern in STM pictures [65], due to the imaging of superimposed density of
states of the substrate and adsorbates. The three different adsorption structures
are the result of different adsorbate-adsorbate and adsorbate-substrate interac-
tions. In the case of a commensurate adsorption the adsorbate-substrate inter-
action has a dominant role for the formation of the monolayer (ML), whereas
for coincidence and incommensurate adsorption the adsorbate-adsorbate in-
teraction plays a more significant role [65].
The spectroscopic and microscopy techniques used in this thesis provide
detailed information regarding the molecule-molecule and molecule-surface
interactions, as well as about the growth mode of adsorbates on surfaces.
By XPS investigations modifications of the electronic structure, as well as
the strength of the interactions can be characterized, whereas the microscopy
studies can apply direct images of the adsorption geometry of adsorbates.
38

7. Summary of papers
Here follows a summary of the results that are included in the papers of this
thesis.
7.1 Molecular phthalocyanine films
7.1.1 Electronic structure of metal-free phthalocyanine films
In papers I and II the electronic structure of metal-free phthalocyanine has
been studied. Multilayer films of H2Pc have been evaporated onto conduct-
ing glass (FTO) and characterized by core and valence photoelectron spec-
troscopy. The experimental data have also been compared with theoretical
calculations.
C1s with shake-up structureThe shake-up structure of the C1s XP spectrum of phthalocyanines has been
under debate for at long time [52, 66, 67, 68], since the relative intensity of
the two peaks originating from the pyrrole and benzene carbons (see Fig.
6.4) does not correspond to the stoichiometry of the molecule. Instead, the
pyrrole contribution to the C1s signal seems to be too large as reported in
previous studies [52, 67], possibly explained by a shake-up feature, related
to the benzene carbons, at the same binding energy as the pyrrole carbons
[66]. To establish the existence, the energy position and the intensity of such
satellite features a joint theoretical and experimental study has been done,
presented in paper II. Equivalent core-hole time-dependent density functional
theory (ECH-TDDFT) has been used to simulate the shake-up structure of the
C1s XP spectrum. The positions of the shake-up features, relative to the main
peaks, have been calculated for both states of π and σ symmetry and the va-lence transitions related to the photoemission of the benzene and pyrrole like
C could be determined.
The C1s spectrum of a H2Pc film is shown Fig. 7.1 (a). This is characterized
by three major features due to the chemically non-equivalent C atoms, pyrrole
and benzene. The ionization potentials of the non-equivalent carbon atoms and
the energy positions of the shake-up features, as found by the calculations,
are indicated as bars in Fig. 7.1. The shake-up structure is rather complex,
but, to show their spectral contribution, these structures may be included as
two additional features in the fit. The four-peak fit, seen in Fig. 7.1, leads to a
39

Inte
nsit
y (a
rb. u
nits
)
298 296 294 292 290 288 286 284 282Binding Energy (eV)
total fit
C 1s
experimental
H2 Pc /FTO
hν =1486.7 eV
experimentFWHM 0.80 eVFWHM 0.70 eVFWHM 0.90 eVtheoretical intensity
Binding Energy (eV)
Inte
nsit
y (a
rb. u
nits
)
292 290 288 286 284
(a) (b)
Figure 7.1: (a) A four-peak fit of the experimental C1s spectrum of H2Pc. The differ-ent curves used in the fitting procedure to simulate the main lines and the shake-up
features are illustrated, together with the total fit and the experimental data (dotted
curve). In addition the theoretical values (bar graph) are compared to the peak po-
sitions of the four-peak fit. (b) Convolution of the calculated intensities of the main
lines and the shake-up features with gaussians of different FWHM (Full width at half
maximum) in comparison with the experimental data (dotted curve).
pyrrole contribution of 24% of the total intensity, in very good agreement with
the expected value from the molecule stoichiometry. The agreement between
the theoretical and experimental spectra is found to be excellent, as shown in
Fig. 7.1 (b).
N1sThe N1s spectra of H2Pc, displayed in Fig. 7.2 (a), consists of two strong
features (at about 398.9 and 400.4 eV), steaming from non-equivalent nitrogen
atoms as resolved by the DFT calculations presented in paper I. It is shown
that the main peak is due to excitations of the N2 and N3 atoms (see Fig. 6.4),
the feature at about is 400 eV due to N1 atoms.
Valence levelsThe valence level spectrum is displayed in Fig. 7.2 (b). The peaks, labeled
by numbers between 1 and 8, are all present in the calculated spectra. In Fig.
7.2 (inset) the calculated components of the density of states (DOS) from all
carbon and all nitrogen atoms are shown. The highest occupied molecular
orbital (HOMO, peak 1) at about 1.7 eV, is a π orbital formed by the C2porbitals, the other orbitals are generally of mixed origin as shown by the C
and N resolved simulations.
7.1.2 H2Pc and FePc films: Geometrical structure
As described in section 3.2, angle resolved XAS measurements can be used
for investigating the molecular orientation with respect to the surface [20].
40

25 20 15 10 5 0
Binding Energy (eV)
Inte
nsit
y (a
rb. u
nits
)
ExperimentDOS, FWHM 1.0 eV
20 15 10 5Binding Energy (eV)
Inte
nsity
(ar
b. u
nits
)
CarbonNitrogen
Calculated C and N DOS
Simulation of Al K excited VB
1
2
3
4
5
6
7
8
α
410 408 406 404 402 400 398 396 394N
1 N2
N3
experimentaltheoretical
(b)
Binding Energy (eV)
Inte
nsit
y (a
rb. u
nits
) N 1s
H2 Pc /FTO
hν =1486.7 eV
(a)
Figure 7.2: (a) N1s spectra of H2Pc. Bars indicating the DFT calculated ionizationpotentials of the non-equivalent nitrogen atoms. (b) Experimental data (dotted curve)
and theoretical simulation (solid line) of the valence levels of H2Pc. In the inset, the C
and N contributions of the simulated spectrum are shown.
For H2Pc experimental N1s XAS measurements have been performed with
three different incidence angles of the radiation with respect to the surface
plane, shown in Fig. 7.3 (a). In addition, the N1s XA spectra have been calcu-
lated for a single H2Pc molecule, both resolving the spectral intensity along
the x-,y- and z-axis (see Fig. 6.4) and resolving the contributions from the
chemically non-equivalent nitrogen atoms, as seen in Fig. 7.3. The atom re-
solved spectra, Fig. 7.3 (c), shows that the second peak at 400.0 eV in the XA
spectra contains contributions from all of the non-equivalent nitrogen atoms
in the molecule, implying that the two features at low photon energy in the
XA spectra are not only the result of the chemical shifted features seen in the
XP spectrum.
The spatial resolved spectra of H2Pc (Fig. 7.3 (b)) are used to determine an
existing overall geometrical orientation of the molecule. In the experimental
data the two π-states (at about 398.4 and 400.0 eV) are clearly dominatingwhen the E vector is parallel to the sample surface, as compared to the geom-etry with the E vector perpendicular to the plane where the σ features (around410 eV) have the highest intensity, indicating that the molecules are predomi-
nantly oriented with the molecular plane perpendicular (or highly tilted) with
respect to the surface.
In analogy, angle resolved XAS measurements of FePc films, presented in
Fig. 7.4 (a), have shown that the FePc are mainly standing up on the Si(100)
surface. This by comparing the XA spectra, showing that the intensity of the
π∗ and σ∗ features dominate in different experimental geometries, with DFTcalculations resolving the spatial distribution of the molecular orbitals. In Fig.
7.4 (a) the theoretical spectrum, simulating a molecule with tilt angle 60◦ withrespect to the surface, is displayed together with the experimental data.
41

395 400 405 410 415 420
Photon Energy (eV)
Inte
nsit
y (a
rb. u
nits
)
Experiment
Total
X
Y
Z
E
n
395 400 405 410 415 420
Photon Energy (eV)
Inte
nsit
y (a
rb. u
nits
)
Experiment
Total
N1
N2
N3
E
n
Inte
nsi
ty (
arb
. un
its)
425420415410405400395
Photon Energy (eV)
N 1s XAS H2Pc /FTO
E
E
n
n
n
(a) (b) (c)
E
Figure 7.3: (a) The XA spectra of H2Pc measured with the E-vector of the light par-allel to the surface (top spectrum), with 45◦ between the E-vector and the surface(middle spectrum) and with the E-vector perpendicular to the surface (spectrum at the
bottom). (b) Calculated XA spectra for a single H2Pc molecule along the x, y and z di-
rections, compared to the experimental data. (c) The calculated XA spectra resolving
the spectral contribution from the chemically non-equivalent nitrogen atoms.
In the case of FePc, the molecular orientation within the film has also
been found by combining DFT calculations with valence level measurements,
recorded in different experimental geometries. The symmetry of different va-
lence orbitals, also previously reported in ref. [69], has been deduced by our
calculations. By investigating the variation of the intensity of π- and σ - typeorbital features as the angle between the E-vector of the light and the sample
is changed, it has been found that the molecules are mainly standing up on the
surface. In Fig. 7.4 (b) the experimental spectra taken in two geometries are
displayed, along with DFT simulated spectra where the angular dependence
of the photoemission intensity of the C and N derived orbitals have been taken
into account.
7.2 Monolayer Studies
For the formation of molecular monolayers, the balance between intermolec-
ular forces and molecule-substrate interactions is fundamental, and the prop-
erties of the surface is of crucial importance. ML structures of different Pc’s
on both metallic and semiconductor surfaces have been studied to characterize
the present interactions.
42

400 404 408 412
Energy (eV)
Inte
nsity
(ar
b. u
nits
)Y+Z
X+0.5*(Y+Z)
n
E
n
E
n
E
15 10 5 0
Inte
nsity
(ar
b.un
its)
B3LYP(C and N)
Experiment
polarization parallel to surface, σ+πpolarization normal to surface, σ
FePc/Si(100)Valencehν= 130 eV
Binding Energy (eV)
(a) (b)
Figure 7.4: (a) XA spectra measured in three experimental geometries, together withthe simulated spectra of a molecule with the tilt angle of 60◦ with respect to the surface(bottom part). (b) The valence band of FePc. In the upper part are the experimental
spectra recorded in two geometries, in the lower part are theoretical spectra where
the angular dependence of the photoemission intensity of C and N derived σ and πorbitals, oriented parallel and normal to the molecular plane, have been taken into
account.
7.2.1 Phthalocyanines on Graphite
Monolayer structures of H2Pc and FePc have been investigated at low tem-
perature with STM, as reported in paper IV and V. For the two systems, a
post-deposition annealing of the sampes to about 670 K resulted in islands of
ordered, densly-packed structures of molecules oriented with the molecular
plane parallel to the surface.
The similarities between the two systems are several. A weak molecule-
substrate interaction is found for both molecules, and the intermolecular inter-
actions are characterized as weak, of van der Waals type. As can be observed
in Fig. 7.5 (H2Pc) and Fig. 7.6 (b) (FePc) the molecules are arranged in unit
cells of square symmetry, as also observed for PdPc on HOPG [70]. A Moiré
contrast, see Fig. 7.5 (a) and 7.6 (d), is observed in a large number of images,
indicating that the adsorption unit cells of the two molecules are not commen-
surate with the graphite lattice [65].
H2Pc/GraphiteFor H2Pc molecular orbitals of a single molecule in the ground state have
been simulated by DFT calculations. By bias dependent measurements, prob-
ing different electronic levels, images of different states have been obtained. In
Fig. 7.5, STM images of two observed states are displayed along with simula-
tions presenting the HOMO-2 and HOMO-4 orbitals. The observed state with
a nodal line through the molecule (Fig. 7.5 (a)) have clear similarities with the
HOMO-2 orbital, and the experimentally imaged state depicted in (d) have
43

HOMO-2 HOMO-4
(a) (b) (e)
(d)(c)
Figure 7.5: H2Pc/HOPG. The molecules are found to be adsorbed in a square unitcell. (a) A Moiré contrast is observed, ascribed to that the adsorption unit cell is not
commensurate with the underlying graphite lattice. The STM image is obtained with
bias = -1.93 V (0.067 nA, 14.2 nm x 9.7 nm). (b) HOMO-2 according to ground state
single molecule calculation. (c) Experimental image measured with bias = -2.27 V
(0.020 nA, 14.1 nm x 4.6 nm). (d) Image (c) with different contrast settings. (e) The
HOMO-4 orbital. Clear resemblances between the state imaged in (a) and the orbital
in (b) are seen, and the state observed in (e) have similarities with the HOMO-4 orbital
(d). (All STM pictures can be seen in colour online.)
resemblances with the HOMO-4 orbital. The good agreement between the or-
bitals obtained in single molecule simulations and the STM images suggests
a weak molecule-substrate interaction, only slightly perturbing the molecular
orbitals.
FePc/GraphiteFor FePc it have been found that upon deposition on samples keept at
room temperature, molecules adsorb in three-dimensional islands. This is
interpreted as a significant molecule-molecule interaction, dominating over
the molecule-substate interaction.
As described above, annealing of the samples results in islands of ordered
ML structures. As indicated in Fig. 7.6 (a) the molecular islands are oriented
with an angle of 30 degrees compared to each other. This indicates that the
six-fold symmetry of the HOPG surface results in a preferential adsorption
direction of the molecules, suggesting that the molecule-substrate interaction
can not be neglected for the ML formation.
In addition to the square adsorption unit cell, presented in Fig. 7.6 (b), an
adsorption unit cell of hexagonal symmetry is observed for FePc, as can be
seen Fig.7.6 (c). This is however found only for a minor percentage of the
cases (about 5 %).
44

Figure 7.6: FePc/HOPG. (a) Islands with densely-packed molecules are formed on thesubstrate. The islands are oriented at an angle of 30 degrees compared to each other.
Hence, even if the interaction of the substrate is weak, the influence of the substrate
on the ML formation is not negligible. Streaks due to highly mobile molecules are
seen in the image. (1.9 V, 0.04 nA, 95 nm x 95 nm) (b) Molecules in the square unit
cell. A molecular model from a single molecule calculation (paper III) is used to fit
the STM image. As seen, the metal centre has a large contribution to the molecular
electronic structure. (2.22V, 0.19 nA, 4.8 nm x 4.8 nm) (c) In a few cases (about 5 %)
the molecules are found to be adsorbed in a hexagonal unit cell. (2.27 V, 0.42 nA, 9.5
nm x 9.5 nm) (d) Molecules in the quadratic phase, with the directions of the observed
Moiré pattern indicated. (-0.38 V, 0.132 nA, 33nm x 33nm)
7.2.2 Zinc phthalocyanine on InSb
In paper VI, ZnPc is adsorbed on InSb(001)-c(8x2) have been studied by
STM, LEED (Low energy electron diffraction) and XPS. As described in sec-
tion 6.1, the c(8x2) reconstruction is characterized by In rows, about 18 Å
apart, formed along the [110] direction. STM measurements, see Fig. 7.7,
have shown that ZnPc adsorb with the molecular plane parallel to the sur-
face, on top of the In rows as also found for H2Pc [61] and several MePc’s
[60, 71, 62, 72] adsorbed on InSb(001)-c(8x2). The molecules are imaged as
four protrusions around a dark centre, indicating contributions to the highest
occupied orbitals exclusively from the molecular ring. In contrast to the other
ML systems investigated by STM in this thesis, neighbouring Pc molecules
are here found to interact with the benzene groups towards each other.
45

Inte
nsity
(ar
b. u
nits
)
289 288 287 286 285 284 283Binding energy (eV)
ZnPc/InSb(100)C1s
hv = 1486.7 eV
Multilayer
1 ML
Sub-ML annealed to 640K
Sub-ML
[110]
[110]
(b)(a)
Figure 7.7: ZnPc/InSb(001). (a) In the STM images the ZnPc are observed to ad-
sorb on the In rows, interacting with neighbouring molecules via the benzene groups.
(-1.5 V, 0.37 A, 35.9 nm x 35.9 nm) (b) C1s spectra for sub-ML, ML and multilayer
coverages. The spectra are normalized at the benzene highest spectral intensity. A
broadened line-shape is observed for the sub-ML and ML coverages as compared to
the multilayer.
The geometrical match between parallel In rows and the molecular size
(about 15 Å) result in a ordered overlayer after annealing, as observed by
LEED. Molecules are adsorbed along the [110] direction, and a x3 LEED pat-
tern (superimposed on the surface diffraction pattern) indicates a displacement
of Pc’s with respect to neighbouring molecules on parallel rows.
XPS reveals that the molecular electronic structure is slightly influenced
by the surface interaction, spectral features are broadened in the ML case as
compared to the thicker film. As seen in Fig. 7.7, annealing to 640 K results
in further spectral broadening, possibly due to an increased molecule-surface
interaction.
7.2.3 Metal-free phthalocyanine on Al(110)
The H2Pc adsorption on Al(110) has been investigated by spectrocopic tech-
niques, the study is presented in paper VII. The multilayer data are in agree-
ment with the results presented in paper I. In the case of ML coverage, sub-
stantial modifications induced by the substrate is observed both by the XP and
XA measurements. For the ML, N1s XA angle resolved spectra reveal that
molecules are found to be adsorbed with the molecular plane parallel to the
surface, as compared to a standing or highly tilted orientation in the multilayer.
46

Inte
nsity
(ar
b. u
nits
)420410400
Photon Energy (eV)
H2Pc/Al(110)XAS N1s
9 ML
1 ML
Inte
nsity
(ar
b. u
nits
)
420410400Photon Energy (eV)
9 ML
1 ML
H2Pc/Al(110)XAS N1s
E E
406 404 402 400 398 396 394
N1shv = 530 eV
3.5 ML
3 ML
1 ML
400 394406 404 396398402
5 ML
9 ML
Inte
nsity
(ar
b. u
nits
)
Binding Energy (eV)
(a) (b) (c)
Figure 7.8: H2Pc/Al(110). (a) N1s XP spectra for different molecular coverages, hv= 530 eV. (b) N1s XAS measured with the E-vector parallel to the surface. (c) N1s
XAS recorded with the E-vector perpendicular to the surface. The σ and π intensityratio is significantly change between the ML and the coverage of 9 ML, for both
geometries. In both (a) and (b) the energy position of 396.6 eV (XP binding energy
and XA threshold edge, respectively) has been indicated.
For this system, a strong molecule-surface interaction is found, evidenced
by a significant perturbation of the molecular electronic structure upon surface
adsorption. The ML N1s XP spectrum, Fig. 7.8 (a), suggests a dissociation of
the central hydrogen atoms, indicated by the absence of a feature at about 400
eV (see section 7.1.1). The additional feature at low BE (about 396.6 eV) [73]
is proposed due to a strong bond between N atoms and the Al substrate.
In the XA data, the broad low intensity shoulder in the photon energy region
396-399 eV, with respect to the multilayer results, is a clear evidence of a
strong modification of the molecular empty levels due to the strong bonding to
the surface. A charge redistribution, resulting from the creation of new states
close to the threshold, can be identified by the modification of intensity of the
π∗ features at low photon energy. Moreover, for the ML, the N1s XP bindingenergy is found on the threshold edge of the N1s XA spectrum (Fig. 7.8), as
expected for molecules chemisorbed on metallic surfaces [74, 75, 20].
7.2.4 Metal-free phthalocyanine on Au(111)
ML formations of H2Pc on herringbone reconstructed Au(111) have been
studied by STM at low temperature, the data are presented in paper IX. The
ML has been formed by post-deposition annealing of the substrate, and as
in previously reported studies of MePc′s on Au(111) (SnPc [58], NiPc [76],CoPc [59], FePc [76, 77], CuPc [78]), the molecules are found to be adsorbed
47

(a) (b)
Figure 7.9: H2Pc/Au(111). (a) The adsorption is characterized by a unit cell of squaresymmetry. (-1.45 V, 0.17 nA, 10.4 nm x 10.4 nm). (b) The surface reconstruction is
seen as bright lines in the image, and the molecular adsorption direction is clearly
changed at the substrate elbow sites. (-1.78 V, 0.03 nA, 54.8 x 54.8 nm).
with the molecular plane parallel to the surface. The molecular unit cell is of
square symmetry, as indicated in Fig. 7.9 (a), and molecules are placed with
the benzene group of one molecule close to the N3 atom (see Fig. 6.4) in the
neighbouring molecule, as observed on HOPG (see section 7.2.1).
The molecule-surface interaction has a significant influence on the ML
formation, evidenced by the change in adsorption direction at the elbow
sites of the surface reconstruction, as observed in Fig. 7.9 (b). This, together
with the stable molecular adsorption and the less well-resolved imaging of
the molecules as compared to the graphite substrate, indicates a significant
molecule-surface interaction, stronger than in the case of H2Pc/HOPG.
7.3 Alkali doping of phthalocyanines
7.3.1 Rubidium doping of H2Pc monolayer on Au(111)
The structure of H2Pc monolayer adsorbed on Au(111) has been discussed in
section 7.2.4. The STM data for this system is presented in paper IX, where
also modifications induced by Rb doping is described.
Upon Rb doping, the molecular adsorption is significantly changed, and
Rb-induced protrusions are observed on top of the molecular layer, as can
be seen in Fig. 7.10. Doping results in a drastic alteration of the molecular
adsorption unit cell. The undoped system is characterized by a unit cell of
square symmetry, whereas an unit cell of hexagonal symmetry is observed
for the co-adsorbed system, as indicated in Fig. 7.10 (a) and (b) respectively.
Even though the molecule-surface interaction appears to be significant (as dis-
cussed in previous section), the intermolecular distances and interactions are
considerably modified upon doping. In Fig. 7.10 schematic molecular models
are added, displaying that the former arrangement, in which molecules in-
48

(a) (b)
Figure 7.10: (a) ML of H2Pc on Au(111). The molecules are adsorbed in a squareunit cell with the molecular plane parallel to the surface. A molecular model from
a single molecule calculation (paper I) is used to fit the STM image and white lines
indicate the molecular adsorption unit cell. (-1.45 V, 0.17 nA, 10.4 nm x 10.4 nm). (b)
Rb doped H2Pc/Au(111). On top of the molecular layer Rb-induced bright protrusions
are observed and the molecular adsorption unit cell is significantly altered, indicated
by the schematic molecular models. (-2.62 V, 0.14 nA, 10.4 nm x 10.4 nm).
teracted with benzene groups close to the aza-nitrogen atoms (N3, Fig. 6.4)
in the neighbouring molecules, is altered and the benzene groups of adjacent
molecules are closer to each other after doping. The Rb-induced bright protru-
sions are found to be aligned with the substrate reconstructed rows, indicating
that the coupling to the underlying substrate is still significant.
7.3.2 Potassium doping of H2Pc films
Multilayer films of H2Pc, adsorbed on Al(110), have been doped with Potas-
sium in increasing amount, up to 3.6 K atoms per molecule. The characteris-
tics (i.e. electronic and geometrical structure) of the undoped film have already
been described (see section 7.1/paper I and 7.2.3/paper VII). Upon K doping,
significant changes are observed in both the XP and XA spectra, revealing
modifications in the electronic and geometrical structure of the molecular film.
In previously reported studies of K doped Pc’s [9, 13, 14], the core-level
spectra have been seen to be broadened and shifted upon doping. This is in-
deed the result also for K/H2Pc, see Fig. 7.11. The spectral broadening may
be ascribed to different effects. Our data are in-line with the observations by
Giovanelli et al. [9] regarding K doped ZnPc, where different phases, due toadsorption of K atoms in different positions and stoichiometric ratio with re-
spect to the molecules, have been found. In analogy with the study of ZnPc, we
propose the presence of molecules with different additional charge, but also
structural changes of the ordered molecular films, observed by XAS mea-
49

Inte
nsity
(ar
b. u
nits
)
300 295 290 285Binding Energy (eV)
x = 3.6
x = 3.0
x = 1.1
x = 0.6
x ≈ 0
404 402 400 398Binding Energy (eV)
KXH2Pc/Al(110)N1s
hv = 530 eV
x = 3.6
x = 3.0
x = 1.1
x = 0.6
x ≈ 0
H2Pc
(b)(a)
Inte
nsity
(ar
b. u
nits
)
KXH2Pc/Al(110)C1s
hv = 530 eV
H2Pc
Figure 7.11: K/H2Pc/Al(110) Spectra of the H2Pc film, and for increasing K dopingdoses. (a) C1s and K2p, hv = 530 eV. (b) N1s , hv = 530 eV.
surements (see below), may contribute to the spectral broadening. A charge
transfer from the alkali to the molecule, evidenced by both valence and XA
measurements, causes modifications of the core and valence levels. By a filling
of initially empty states, the Fermi position is shifted in the density of states,
resulting in observed binding energy shifts. For no doping level has intensity
at the Fermi level been observed, demonstrating that there is no metallic phase
for the K doses investigated here.
A filling of the previously empty LUMO level, by the alkali, is evident from
the observation of a new feature in the valence spectra, see Fig. 7.12 (a). The
filling of unoccupied levels by a charge donation results in a decreased inten-
sity of the N1s XA threshold, as can be observed in Fig. 7.12. Modifications
of other unoccupied levels are also observed. For the H2Pc film, the thresh-
old feature (Fig. 7.12 (b)) has an asymmetric contribution at the low photon
energy side, attributed to excitations from the N2 atoms (Fig. 6.4) as showed
in Fig. 7.3 (c). After K doping, the asymmetry of the peak at threshold is no
longer seen, indicating that the K doping affects significantly the N2 atoms.
The N1s XA spectra recorded in two experimental geometries (with the E-
vector of the light parallel and perpendicular to the surface, respectively) are
displayed in Fig. 7.12 (c) and (d). As previously stated, the charge donation
results in a decrease of the π∗ features, at the threshold, seen in Fig. 7.12(c). However, in the other experimental geometry, an intensity increase of the
π∗ features relative to the σ∗ features is observed, indicating a change in theoverall tilt angle of the molecules. This leads us to the conclusion that, upon
K doping, the tilt angle of the molecular plane with respect to the the surface
normal is increased.
50

3 2 1 0 -1Binding energy (eV)
x = 3.6
x =1.1
x = 0.4
x ≈ 0
H2Pc1.5 eV
1.72 eV
1.94 eV
2.36 eV
401400399398397
H2Pc
x = 0.4
x = 1.1
x = 3.0
E
425420415410405400
x = 0.4
x ≈ 0
H2Pc
x = 1.1
x = 3.0
KX/H2Pc/Al(110)N1s XAS
425420415410405400
x = 3.0
x = 1.1
x = 0.4
x ≈ 0
H2Pc
KX/H2Pc/Al(110)N1s XAS
E E
(a) (b)
(c) (d)
Inte
nsity
(ar
b. u
nits
)
KX/H2Pc/Al(110)N1s XAS
KX/H2Pc/Al(110)Valence, hv = 130 eV
Inte
nsity
(ar
b. u
nits
)In
tens
ity (
arb.
uni
ts)
Inte
nsity
(ar
b. u
nits
)
Photon energy (eV)
Photon energy (eV) Photon energy (eV)
Figure 7.12: K/H2Pc/Al(110), with different K doses. (a) The low binding energy
region of the valence band spectra, hv = 130 eV. The HOMO orbital are seen to be
shifted upon doping, and an additional feature is observed at lower BE, due to a charge
donation to the formerly unoccupied LUMO orbital. (b) N1s XAS recorded with the
E vector of the light parallel to the surface, displaying the K induced changes to the
π∗ features at threshold. (c) and (d) N1s XAS spectra measured with the E-vector ofthe light parallel and perpendicular to the surface, respectively.
51

7.4 Conclusions
The electronic and geometrical structure of the molecular H2Pc and FePc films
have been mapped. For both the FePc and H2Pc, the excellent agreement be-
tween the experimental data and the calculations of a single molecule shows
that molecules within the film interacts weakly, not disturbing the electronic
states of the neighbouring molecules. In multilayers, H2Pc and FePc are found
to be oriented in a standing up or tilted orientation with respect to the surface.
However, in monolayer coverage, the phthalocyanines studied here are found
to be adsorbed with the molecular plane parallel to the surface, even though
the adsorbate-substrate interactions are of different strength for the investi-
gated systems. On the reactive Al(110) substrate, a strong, dissociative ad-
sorption of H2Pc is observed. The molecules are found to be oriented with the
molecular plane parallel to the surface, but the molecular electronic structure
(occupied and unoccupied levels) are strongly perturbed by the interaction
with the substrate.
Although weaker molecule-surface interactions are found for the
ZnPc/InSb(001), H2Pc/Au(111) and Pc’s/HOPG systems, the substrate
structure is clearly influencing the ML formation. In the case of Au(111),
the molecular adsorption direction is found to change at the elbow sites of
the substrate reconstruction (Fig. 7.9), evidencing how the surface plays a
significant role for the formation of the ordered molecular arrangement.
Different molecular states have been resolved for H2Pc/HOPG by bias de-
pendent STM measurements and, due to the low perturbation of the substrate
on the molecular orbitals, a good agreement between the experimental data
and single molecule calculation is observed (see Fig. 7.5). For H2Pc/Au(111),
it has not been possible to resolve different states in the same way, most likely
due to the stronger molecule-surface interaction. Even though the adsorbate-
surface interaction is found to be weak for the Pc’s/HOPG, as suggested by
the high molecular mobility and the possibility to image different molecular
states, it is clear that the orientation of the densely-packed FePc islands are
influenced by the substrate (Fig. 7.6). So, even if the molecule-surface inter-
action is found to be weak, the underlying surface structure is not negligible
for the ML formation. For FePc/HOPG, the adsorbate-adsorbate interaction is
found to be dominant over the adsorbate-substrate interaction and, as observed
for several other systems [65], the dominating molecule-molecule interaction
results in a molecular adsorption unit cell of FePc which is not commensurate
with the underlying graphite lattice. This is observed in the STM measure-
ments as a Moiré pattern, i.e. contrast modulation, very similar to the previ-
ously reported Moiré contrast for PdPc on HOPG [70]. The directions of the
observed Moiré contrast modulation for FePc (see Fig. 7.6 (d)) and PdPc are
however different. By comparing the two systems, it is clear that the central
metal atom affects the molecular adsorption, since the molecular dimension
are the same. The balance between the intermolecular and molecule-substrate
52

interactions is apparently influenced by the difference in metal ion, resulting
in different adsorption parameters, and hence, Moiré patterns.
The effect of the metal centre on the molecular electronic structure of the
FePc, PdPc, and H2Pc, is also evident by studying a single molecule in the
STM image. For H2Pc, without central metal atom, a depression is observed in
the molecular centre. For FePc, the contribution from the Fe3d orbitals of the
metal center to the highest occupied and lowest unoccupied molecular levels
is dominating, while for PdPc the depression observed in the molecular centre
indicates that there is no contribution from the metal atom to the HOMO and
LUMO orbitals [70]. Also for ZnPc it is observed that the metal centre does
not contribute to the HOMO, confirming the previously reported data by Liao
et al. [79]. As stated above, the studied surfaces clearly influences the Pc MLformation, this is also the case for ZnPc/InSb(001), since it is observed that
ZnPc adsorb exclusively on the In substrate rows.
In the presented studies, for molecules inML or in films, a weak intermolec-
ular interaction, of van derWaals type, is suggested. However, as a result of the
delicate balance between intermolecular and molecule-substrate interactions
in the various systems, neighbouring molecules are found to be arranged dif-
ferently as compared to each other on different surfaces. For ZnPc/InSb(001),
it is found that the benzene groups of neighbouring molecules are close to-
gether, as also observed for other Pc’s on the InSb(001) surface [60, 61, 62,
71, 72]. On HOPG and Au(111) an arrangement with benzene groups close
to the aza-bridging nitrogen (see Fig. 6.4) in the neighbouring molecule is
observed, as also reported for other Pc’s on the same substrates [59, 70, 77].
But, as observed for the Rb/H2Pc/Au(111) system, the intermolecular inter-
action and molecular arrangement are found to be significantly perturbed by
the alkali doping. In fact, for the co-adsorbed system the balance between
adsorbate-substrate and inter-adsorbate interactions result in a new molecular
configuration, with an intermolecular arrangement somewhat resembling the
one observed for Pc/InSb(001).
A geometrical rearrangement of the molecules is also the result of K doping
of H2Pc films. It is observed that the previously (almost) standing molecules
are tilted, decreasing their tilt angle with respect to the surface by the K dos-
ing. But, not only the geometrical molecular structure is modified by the al-
kali, also the electronic structure is strongly altered. As a result of the doping,
previously empty molecular orbitals are filled by a charge donation from the
alkali, displaying a charge acceptance of the H2Pc. The filling of previously
empty orbitals is observed both in the valence and XA spectra of K/H2Pc, but
is also evident from the decreased C1s shake-up intensity, which significantly
contributes instead to the intensity of the undoped H2Pc C1s spectrum.
53


8. Acknowledgments
This thesis is the result of a team-work, and I would not have been able to
do this on my own. My thanks go especially to my supervisor Carla Puglia,
who from the first to the last day of my PhD studies has guided me encoura-
gingly and been very engaged in my work. I would also like to express my
special gratitude to my co-supervisors Joachim Schiessling and Emmanuelle
Göthelid, who both have been a great help and who have taught me a lot
about experimental work. I would also like to thank my co-supervisor Nils
Mårtensson for giving me the opportunity to do my PhD in the Physics V
group, and for his support. My PhD colleague John Åhlund is thanked for
great teamwork and friendship.
Svante Svensson and the rest of the Physics V group, your help and nice
company have been most appreciated. The (former and present) PhD col-
leagues and project workers are thanked for making this a pleasant place to
work at. Henrik Bergersen and Anders Olsson are specially acknowledged
for helping me with all kinds of problems. I also would like to thank Leif
Karlsson, Tommy Andersson in the electrical workshop, Erland Falk at the
cryogenic centre and the Ångstöm workshop.
I have collaborated with an excellent group of people. Barbara Brena, Luo
Yi and Mats Nyberg along with Pål Palmgren and Mats Göthelid are all most
gratefully acknowledged.
The help from the MAX-lab staff, especially from the beamline managers
Lisbeth Kjeldgaard and Franz Hennies, is also gratefully acknowledged. Ulrik
Gelius are especially thanked for giving me the possibility to measure in his
lab. During this time I have also worked with Simon Berner, James O’Shea
and the group of Hans Siegbahn, who are all acknowledged.
Moreover, Mamma - especially thanked for her great support, Achim, Ce-
cilia, Cissi, Emma, Eva, Johan, Karin, Karolina, Lisa, Per, Pontus and Rebecca
are all very much thanked for occasionally helping me with problems related
to my work, but more importantly for their excellent friendship and for pro-
viding great company in my spare time.
Uppsala, August 30, 2007
Katharina Nilson
55


Bibliography
[1] M. Thelakkat, C. Schmitz, and H. W. Schmidt, Adv. Mat. 14, 577 (2002).
[2] G. Guillaud, M. Al Sadoun, M. Maitrot, J. Simon, and M. Bouvet, Chem. Phys.
Lett. 167, 503 (1990).
[3] A. A. Kuznetsov, V. I. Filippov, R. N. Alyautdin, N. L. Torshina, and O.
A. Kuznetsov, J. Magn. Magn. Mater. 225, 95 (2001).
[4] H. Grennberg and J.-E. Bäckwall, Acta. Chem. Scand. 47, 506 (1993).
[5] S. Berner, S. Biela, G. Ledung, A. Gogoll, J.-E. Bäckwall, C. Puglia, and S.
Oscarsson, J. Catalysis 244, 86 (2006).
[6] K. Wiesener, D. Ohms, V. Neumann, and R. Franke, Mater. Chem. Phys. 22,457 (1989).
[7] M. F. Craciun, S. Rogge, M.-J. L. den Boer, S. Margadonna, K. Prassides, Y.
Iwasa, and A. F. Morpurgo, Adv. Mater. 18, 320 (2006).
[8] M. F. Craciun, S. Rogge, and A. F. Morpurgo, J. Am. Chem. Soc. 127, 12210(2005).
[9] L. Giovanelli, P. Vilmercati, C. Castellarin-Cudia, J.-. M. Themlin, L. Porte, and
A. Goldoni, J. Chem. Phys. 126, 44709 (2007).
[10] T. Schwieger, W. Knupfer, M. Gao, and A. Kahn, Applied Phys. Lett. 83, 500(2003).
[11] Y. Gao and L. Yan, Chem. Phys. Lett. 380, 451 (2003).
[12] W. Gao and A. Kahn, Org. Electr. 3, 53 (2002).
[13] O. V. Molodtsova, V. M. Zhilin, D. V. Vyalikh, V. Yu. Aristov, and M. Knupfer,
J. Appl. Phys. 98, 093702 (2005).
[14] T. Schwieger, H. Peisert, M. S. Golden, M. Knupfer, and J. Fink, Phys. Rev. B
66, 155207 (2002).
[15] A. Einstein, Ann. Physik 17, 132 (1905).
57

[16] K. Siegbahn, C. Nordling, A. Fahlman, R. Nordberg, K. Hamrin, J. Hedman, G.
Johansson, T. Bergmark, S. E. Karlsson, I. Lindgren, and B. Lindberg, ESCAAtomic, Molecular and Solid State Structure Studied by means of ElectronSpectroscopy (Almqvist och Wiksells Boktryckeri AB, Uppsala, 1967).
[17] S. Hüfner, Photoelectron spectroscopy, 2nd ed. (Springer-Verlag, Berlin Hei-delberg New York, 1995).
[18] R. Manne and T. Åberg, Chem. Phys. Lett. 7, 282 (1970).
[19] A. Zangwill, Physics at surfaces (Cambridge University Press, Cambridge,1990).
[20] J. Stöhr, NEXAFS Spectroscopy (Springer-Verlag, Berlin, 1992).
[21] G. Binning and H. Rohrer, Helv. Phys. Acta 55, 726 (1982).
[22] G. Binning, H. Rohrer, C. Gerber, and E. Weibel, Phys. Rev. Lett. 49, 57 (1982).
[23] R. Wiesendanger, Scanning Probe Microscopy and Spectroscopy, Methodsand Applications (Cambridge University Press, Cambridge, 1994).
[24] J. Tersoff and D. R. Hamann, Phys. Rev. B 31, 805 (1985).
[25] P. S. Weiss and D. M. Eigler, Phys. Rev. Lett. 71, 3139 (1993).
[26] J. A. Stroscio and D. M. Eigler, Science 254, 1319 (1991).
[27] M. L. Bocquet and P. Sautet, Surf. Sci. 360, 128 (1996).
[28] H. Brune, J. Wintterlin, R. J. Behm, and G. Ertl, Phys. Rev. Lett. 68, 624 (1992).
[29] S. Esch, M. Hohage, T. Michely, and G. Comsa, Phys. Rev. Lett. 72, 518 (1994).
[30] C. Bai, Scanning Tunneling Microscopy and its Application, 1st ed.(Springer-Verlag, Shanghai, 1995).
[31] F. Besenbacher, Rep. Prog. Phys. 59, 1737 (1996).
[32] P. Hohnberg and W. Kohn, Phys. Rev. 136, B864 (1964).
[33] W. Kohn and L. J. Sham, Phys. Rev. 140, A1133 (1965).
[34] M. E. Casida, et.al. DEMON-KS Version 4.0, demon Software (1997).
[35] M. J. Frisch, et. al. Gaussian03, Revision C.02, Gaussian, Inc., Wallingford CT,
(2004).
[36] D. Attwood, Soft X-rays and extreme ultraviolet radiation, 1st ed. (Cam-bridge university press, Cambridge, 1999).
58

[37] R. Denecke, P. Väterlein, M. Bässler, N. Wassdahl, S. Butorin, A. Nilsson, J.-E.
Rubensson, J. Nordgren, N. Mårtensson, and R. Nyholm, J. Electr. Spectr. Rel.
Phen. 101-103, 971 (1999).
[38] N. Mårtensson, P. Baltzer, P. Brühwiler, J.-. O. Forsell, A. Nilsson, A. Stenborg,
and B. Wannberg, J. Electr. Spectr. Rel. Phen. 70, 117 (1994).
[39] U. Gelius, B. Wannberg, P. Baltzer, H. Fellner-Feldegg, G. Carlsson, C.-G. Jo-
hansson, J. Larsson, P. Münger, and G. Vegerfors, J. Electr. Spectr. Rel. Phen.
52, 745 (1990).
[40] J. N. Andersen, H. B. Nielsen, L. Petersen, and D. L. Adams, J. Phys. C: Solid
State Phys. 17, 173 (1984).
[41] R. M. Tromp, R. J. Hamers, and J. E. Demuth, Phys. Rev. Lett. 55, 1303 (1985).
[42] M. Johansson, Scanning Tunnelling Microscopy and Spectroscopy of Ad-sorbates on Aluminium and Silicon (Ph. D. Thesis, Lund University, 1997).
[43] P. Bennich, C. Puglia, P. A. Brühwiler, A. Nilsson, A. J. Maxwell, A. Sandell,
N. Mårtensson, and P. Rudolf, Phys. Rev. B 59, 8292 (1999).
[44] J. Kibsgaard, J. V. Lauritsen, E. Lægsgaard, B. S.Clausen, H. Topsøe, and F.
Besenbacher, J. Am. Chem. Soc. 128, 13950 (2006).
[45] I. P. Batra, N. Garcia, H. Rohrer, H. Salemink, E. Stoll, and S. Ciraci, Surf. Sci.
181, 126 (1987).
[46] C. F. McConville, T. S. Jones, F. M. Leibsle, S. M. Driver, T. C.Q. Noakes, M.
O. Schweitzer, and N. V. Richardson, Phys. Rev. B 50, 14965 (1994).
[47] C. Kumpf, L. D. Marks, D. Ellis, D. Smilgies, E. Landemark, M. Nielsen, R.
Fiedenhans’l, J. Zegenhagen, O. Bunk, J. H. Zeysing, Y. Su, and R. L. Johnson,
Phys. Rev. B 86, 3586 (2001).
[48] P. R. Varekamp, M. Björkqvist, M. Göthelid, and U. O. Karlsson, Surf. Sci. 350,L221 (1996).
[49] J. V. Bath, H. Brune, G. Ertl, and R. J. Behm, Phys. Rev. B 42, 9307 (1990).
[50] B. K. Min, A. R. Alemozafar, M. M. Biener, J. Biener, and C. M. Friend, Topics
in Catalysis 36, 77 (2005).
[51] E. Orti and J. L. Brédas, J. Chem. Phys. 89, 1009 (1988).
[52] L. Ottaviano, S. Di Nardo, L. Lozzi, M. Passacantando, P. Picozzi, and S. San-
tucci, Surf. Sci. 373, 318 (1997).
[53] R. Hiegen, M. Räbisch, H. Böttcher, and D. Meissner, Solar Energy Materials
and Solar Cells 61, 78 (2000).
59

[54] J. H. Sharp and M. Lardon, J. Chem. Phys. 72, 3230 (1968).
[55] O. Berger, W.-J. Fischer, B. Adolphi, S. Tierbach, V. Melev, and S. J, Journal of
Materials Science: Materials in electronics 11, 331 (2000).
[56] M. Brinkmann, J. C. Wittmann, C. Chaumont, and J. J. André, Thin Solid Films
292, 192 (1997).
[57] J. Mizuguchi and S. Matsumoto, J. Phys. Chem. A 103, 614 (1999).
[58] K. Walzer and M. Hietschold, Surf. Sci. 471, 1 (2001).
[59] M. Takada and T. H., Chem. Phys. Lett. 392, 265 (2004).
[60] E. Salomon, T. Angot, N. Papagergiou, and J.-M. Layet, Surf. Sci. 596, 74(2005).
[61] P. Palmgren, B. R. Priya, N. P.P. Niraj, and M. Göthelid, J. Phys. Cond. Mater.
18, 10707 (2006).
[62] N. Papageorgiou, E. Salomon, T. Angot, J.-M. Layet, L. Giovanelli, and G.
Le Lay, Progress Surf. Sci 77, 139 (2004).
[63] P. W. Atkins, Physical Chemistry, sixth ed. (Oxford University Press, GreatClarendon Street, Oxford, 1998).
[64] A. Sandell, Autoionization Studies of Adsorbates (Ph. D. Thesis, UppsalaUniversity, 1993).
[65] D. E. Hooks, T. Fritz, and M. D. Ward, Adv. Mat. 13, 227 (2001).
[66] H. Niwa, Y. Kobayashi and T. Tsuchiya, J. Chem. Phys. 60, 799 (1974).
[67] M. Peisert, H. Knupfer and J. Fink, Surf. Sci. 515, 491 (2002).
[68] H. Schwieger, H. Knupfer, M. S. Golden, M. Knupfer, and J. Fink, Phys. Rev. B
66, 155207 (2002).
[69] B. Kessler, Appl. Phys. A.: Mater Sci. Process. 67, 125 (1998).
[70] T. G. Gopakumar, M. Lackinger, and M. Hietschold, Jap. J. Appl. Phys. 45,2268 (2006).
[71] T. Angot, E. Salomon, N. Papageorgiou, and J.-M. Layet, Surf. Sci. 572, 59(2004).
[72] N. Papageorgiou, Y. Ferro, J. M. Layet, L. Giovanelli, A. J. Mayne, G. Dujardin,
H. Oughaddou, and G. Le Lay, Applied Phys. Lett. 82, 2518 (2003).
[73] A. Pashutski and M. Folman, Surf. Sci. 216, 395 (1989).
60

[74] O. Björneholm, A. Nilsson, E. O. F. Zdansky, A. Sandell, B. Hernnäs, H. Till-
borg, J. N. Andersen, and N. Mårtensson, Phys. Rev. B 46, 10353 (1992).
[75] A. Nilsson, O. Björneholm, E. O. F. Zdansky, H. Tillborg, N. Mårtensson, J.
N. Andersen, and R. Nyholm, Chem. Phys. Lett. 197, 12 (1992).
[76] X. Lu and K. W. Hipps, J. Phys. Chem. B 101, 5391 (1997).
[77] Z. H. Cheng, L. Gao, Z. T. Deng, N. Jiang, D. Liu, Q. X. Shi, S. X. Du, and H.
M. Guo, J. Gao, J. Phys. Chem. C 111, 9240 (2007).
[78] M. Stöhr, T. Wagner, M. Gabriel, B. Weyers, and R. Möller, Adv. Funct. Mat.
11, 175 (2001).
[79] M.-S. Liao and S. Scheiner, J. Comp. Chem. 23, 1391 (2002).
61

Acta Universitatis UpsaliensisDigital Comprehensive Summaries of Uppsala Dissertationsfrom the Faculty of Science and Technology 342
Editor: The Dean of the Faculty of Science and Technology
A doctoral dissertation from the Faculty of Science andTechnology, Uppsala University, is usually a summary of anumber of papers. A few copies of the complete dissertationare kept at major Swedish research libraries, while thesummary alone is distributed internationally through theseries Digital Comprehensive Summaries of UppsalaDissertations from the Faculty of Science and Technology.(Prior to January, 2005, the series was published under thetitle “Comprehensive Summaries of Uppsala Dissertationsfrom the Faculty of Science and Technology”.)
Distribution: publications.uu.seurn:nbn:se:uu:diva-8209
ACTA
UNIVERSITATIS
UPSALIENSIS
UPPSALA
2007