Embed Size (px)
Citation preview

CONTENTS
Journal of Porphyrins and PhthalocyaninesJ. Porphyrins Phthalocyanines 2013; 17: 1–164
See Thanh-Tuan Bui, Aude Escande, Christian Philouze, Gianluca Cioci, Sudip Ghosh, Eric Saint-Aman, Jong Min Lim, Jean-Claude Moutet, Jonathan L. Sessler*, Dongho Kim* and Christophe Bucher* pp. 27–35
The cover picture displays the structure of a cyclo[6]pyrrole[3]thiophene derivative, which is a new member of the cyclo[n]pyrrole class of expanded porphyrins. It was produced in solution at an electrode interface and characterized by inter alia X-ray diffraction analysis. This electrode-based synthesis is represented schematically via a massive metallic disk surrounded by oligopyrrole building blocks, which are dis-solved in the electrolyte. The background picture was taken by one of the corres-ponding authors (C.B.) at Crozet Lake in the “Belledone” mountains (French Alps) overlooking Grenoble.
About the Cover
Reviews
pp. 1–15Extending the limits of natural photosynthesis and implications for technical light harvestingMin Chen* and Hugo Scheer*
The solar spectrum reaching the surface of the earth (blue line) contains the finger-prints of absorption by water, oxygen and ozone. Under a cover of vegetation, most of the visible light is removed by the absorption of chlorophyll a (Chl a) and other pigments (blue shaded area). Under these conditions, organisms that are capable of performing photosynthesis with near-infrared light by the use of specialized chlo-rophylls with red-shifted absorption maxima have evolved. The cyanobacterium, Acaryochloris marina, contains chlorophyll d (Chl d); it absorbs light down to ~725 nm (green shaded area). Two recently discovered organisms contain the even more red-shifted chlorophyll f (Chl f) that allows oxygenic photosynthesis at even lon-ger wavelengths. Dedicated searching for such organisms suggests that ecological niches for such organisms are quite abundant on earth, and that such specialized light-harvesting techniques contribute substantially to photosynthesis.
pp. 16–26Nanotechnology-based photodynamic therapyHee-Jae Yoon and Woo-Dong Jang*
The combination of nanotechnology with photodynamic therapy may provide effective platform for the selective delivery and excitation of photosensitizers, combination therapy, and multifunctional treatment of malignant tumors.

CONTENTS
J. Porphyrins Phthalocyanines 2013; 17: 1–164
pp. 56–62
ethoxy-phosphorus(V)porphyrinKazutaka Hirakawa*, Keito Azumi, Yoshinobu Nishimura, Tatsuo Arai, Yoshio Nosaka and Segetoshi Okazaki
DiethoxyP(V)porphyrin and its axial fluorinated derivative induce protein photo-oxidation via singlet oxygen generation and the electron transfer. The estimated contributions of the electron transfer mechanism are 0.57 and 0.44 for the fluori-nated and non-fluorinated P(V)porphyrins, respectively. The total quantum yield of the protein photo-oxidation was slightly enhanced by this axial fluorination.
pp. 44–55Shape-persistent poly-porphyrins assembled by a cen-tral truxene: synthesis, structure, and singlet energy transfer behaviorsHai-Jun Xu, Bin Du, Claude P. Gros*, Philippe Richard, Jean-Michel Barbe and Pierre D. Harvey*
-methyl groups preventing conjugation are used to design shape-persistent mono- and trisporphyrin-truxenes for the study of S1 energy transfers truxene
porphyrin units. The rates are temperature independent and compare to other parent dyads exhibiting rotational flexibility about the truxene-porphyrin C–C bond but are also sterically hindered by the hexyl chains.
pp. 36–43Cancer cells uptake porphyrins via heme carrier protein 1Kazuhiro Hiyama, Hirofumi Matsui*, Masato Tamura, Osamu Shimokawa, Mariko Hiyama, Tsuyoshi Kaneko, Yumiko Nagano, Ichinosuke Hyodo, Junko Tanaka, Yoshihiro Miwa, Tetsuo Ogawa, Takeo Nakanishi and Ikumi Tamai
Increasing a newly reported transporter, heme carrier protein 1 (HCP1), ex-pression increased porphyrin accumulation and the efficacy of photodynamic therapy. Several kinds of cancer cell-lines highly expressed HCP1 and decreas-ing HCP1 expression decreased porphyrin accumulation in these cancer cells. We conclude that HCP1 is a transporter of porphyrins in cancer cells. We also demonstrated that the expression of HCP1 causes the cytotoxic effect of photo-dynamic therapy.
Articles
pp. 27–35X-ray structure and properties of a cyclo[6]pyrrole[3]thio pheneThanh-Tuan Bui, Aude Escande, Christian Philouze, Gianluca Cioci, Sudip Ghosh, Eric Saint-Aman, Jong Min Lim, Jean-Claude Moutet, Jonathan L. Sessler*, Dongho Kim* and Christophe Bucher*
A cyclo[6]pyrrole[3]thiophene derivative could be prepared from a thiophene-contai ning terpyrrole precursor through use of a mild electrochemical oxidative procedure. A definitive proof of structure of this new member of the cyclo[n]pyrrole class featuring nine hetero-cyclic subunits directly connected through their , -positions was obtained via a single crystal X-ray diffraction analysis carried out using synchrotron radiation. Four individual macrocycles are found within the unit cell. These appear as two distinct self-assembled sandwich-like structures held together through a variety of apparent noncovalent interac-tions, including van der Waals, electrostatic forces, and a network of hydrogen bonds.

CONTENTS
J. Porphyrins Phthalocyanines 2013; 17: 1–164
pp. 63–72Reaction of ferric Caldariomyces fumago chloro peroxi-dase with meta-chloroperoxybenzoic acid: sequential formation of compound I, compound II and regeneration of the ferric state using one reactantDaniel P. Collins, Issa S. Isaac, Eric D. Coulter, Paul W. Hager, David P. Ballou* and John H. Dawson*
In the present study, both CCPO Fe(IV)-oxo intermediates Compound I and II formed, but unlike most CCPO reactions, they are formed using the same reactant, mCPBA. Thus, the peracid is used as an oxo donor to produce Cpd I and then as a reductant to reduce Cpd I to Cpd II and finally to the ferric state. The observation of saturation kinetics with respect to mCPBA concentration for each step is consistent with the formation of CCPO-mCPBA complexes in each phase of the reaction.
pp. 73–85Synthesis and evaluation of cationic bacteriochlorin amphi philes with effective in vitro photodynamic acti vity against cancer cells at low nanomolar concentrationSulbha K. Sharma, Michael Krayer, Felipe F. Sperandio, Liyi Huang, Ying-Ying Huang, Dewey Holten, Jonathan S. Lindsey* and Michael R. Hamblin*
Three new bacteriochlorins, each bearing a single side-chain containing one or two positive char-ges, exhibited a high level of in vitro PDT activity against HeLa human cancer cells upon activata-tion with NIR light. The bacteriochlorins localized in mitochondria, lysosomes and endoplasmic reticulum as shown by organelle specific fluorescent probes. Cell death was via apoptosis as shown by cell morphology and nuclear condensation. Taken together, the results show the im-portance of appropriate peripheral groups about a photosensitizer for effective PDT applications.
N HN
NNH
NI
pp. 92–98Electrochemistry and spectroelectrochemistry of car-boxy-phenylethynyl porphyrinsPei-Shang Chao, Ming-Yu Kuo, Chen-Fu Lo, Min-Hsu Hsieh, Yu-Hsiang Cheng, Chin-Li Wang, Hsiu-Yu Lu, Hshin-Hui Kuo, Yen-Ni Hsiao, Chieh-Ming Wang and Ching-Yao Lin*
Electrochemical studies suggest that the first reduction of PE1 porphyrins are the reduction reaction of the anchoring group proton. In addition, we demonstrate that the positions of long alkyl chains at the phenyl substituents greatly affect the potentials and the reversibilities of the redox reactions of the PE1 porphyrins.
pp. 86–91Meso–meso directly linked dipyrrolyl ligand dimer that shows the formation of metal-coordination polymersHiromitsu Maeda*, Hiroaki Kobayashi and Ryo Akuta
A novel dipyrrolyl metal-coordination ligand dimer directly connected at the meso positions showed the formation of a ZnII-bridged coordina-tion polymer and the spontaneous transformation to a meso–meso- and singly β–β-fused tetra pyrrolyl molecule in solution by C–C bond forma-tion and concomitant proton migration.
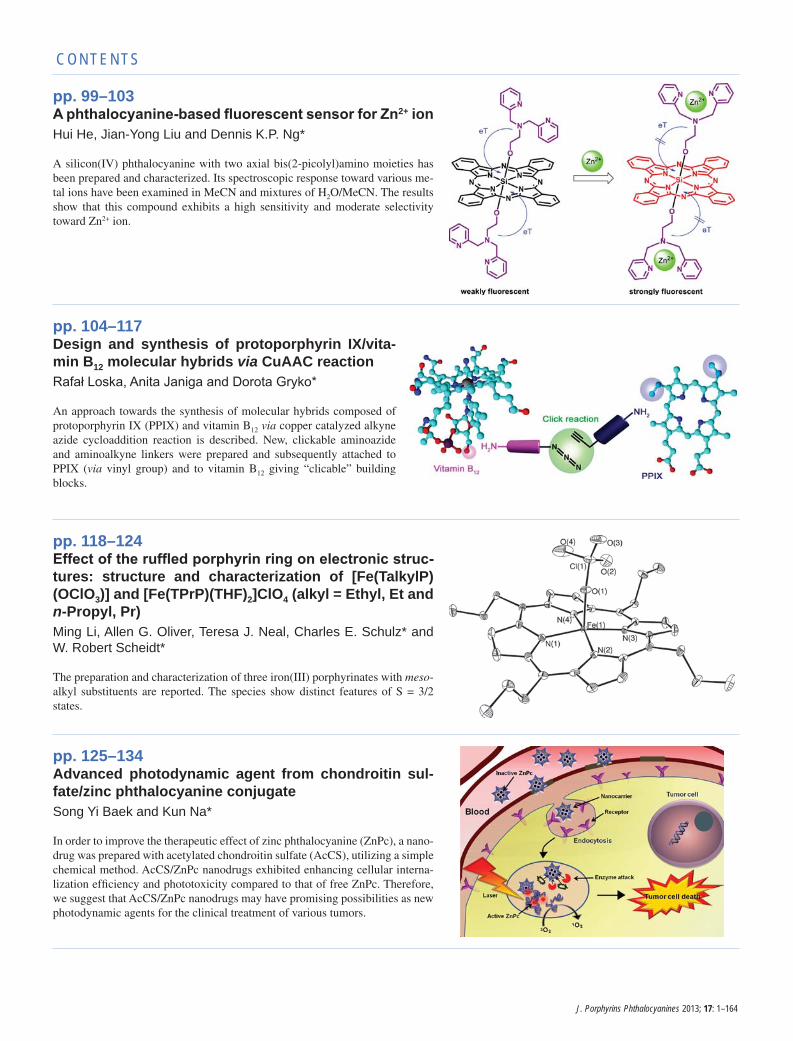
pp. 99–1032+ ion
Hui He, Jian-Yong Liu and Dennis K.P. Ng*
A silicon(IV) phthalocyanine with two axial bis(2-picolyl)amino moieties has been prepared and characterized. Its spectroscopic response toward various me-tal ions have been examined in MeCN and mixtures of H2O/MeCN. The results show that this compound exhibits a high sensitivity and moderate selectivity toward Zn2+ ion.
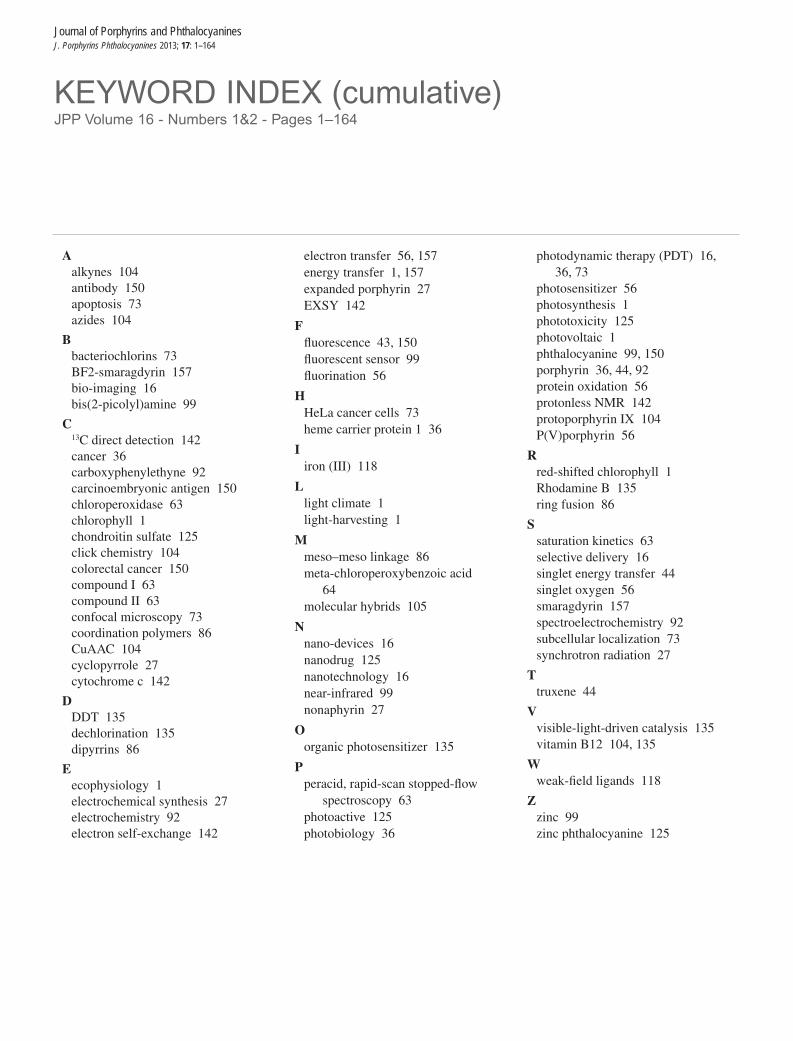
pp. 104–117Design and synthesis of protoporphyrin IX/vita-min B12 molecular hybrids via CuAAC reaction
An approach towards the synthesis of molecular hybrids composed of protoporphyrin IX (PPIX) and vitamin B12 via copper catalyzed alkyne azide cycloaddition reaction is described. New, clickable aminoazide and aminoalkyne linkers were prepared and subsequently attached to PPIX (via vinyl group) and to vitamin B12 giving “clicable” building blocks.
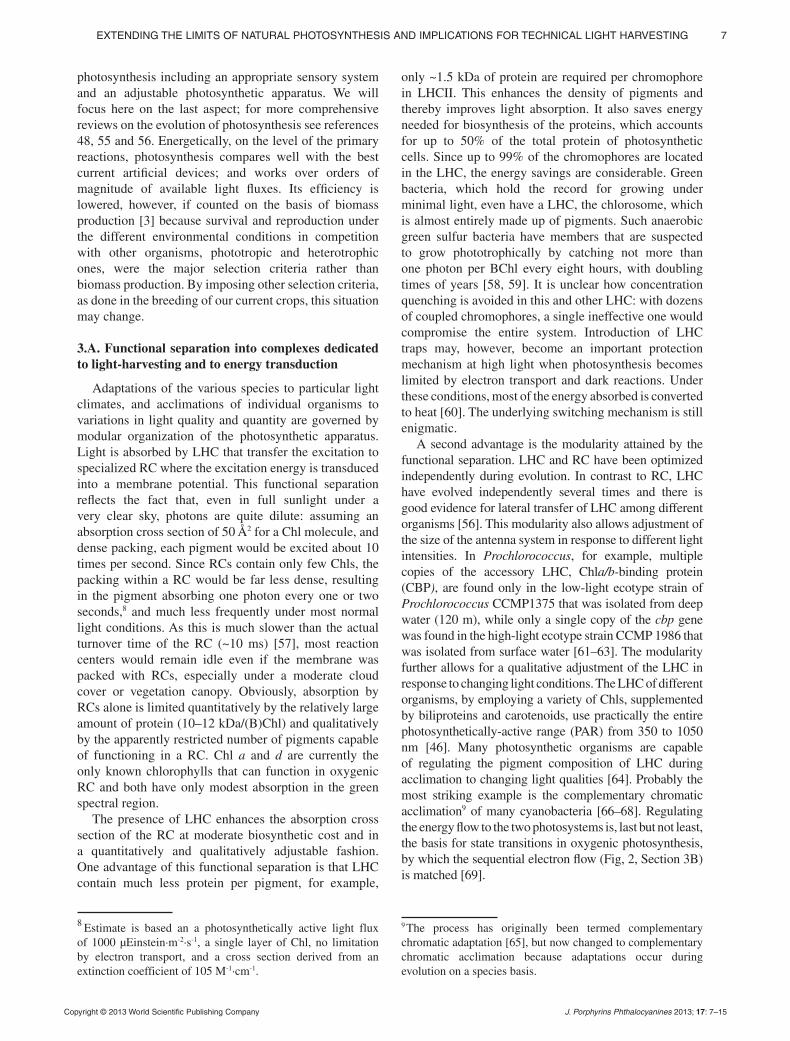
pp. 118–124
tures: structure and characterization of [Fe(TalkylP)(OClO3)] and [Fe(TPrP)(THF)2]ClO4 (alkyl = Ethyl, Et and n-Propyl, Pr)Ming Li, Allen G. Oliver, Teresa J. Neal, Charles E. Schulz* and W. Robert Scheidt*
The preparation and characterization of three iron(III) porphyrinates with meso-alkyl substituents are reported. The species show distinct features of S = 3/2 states.
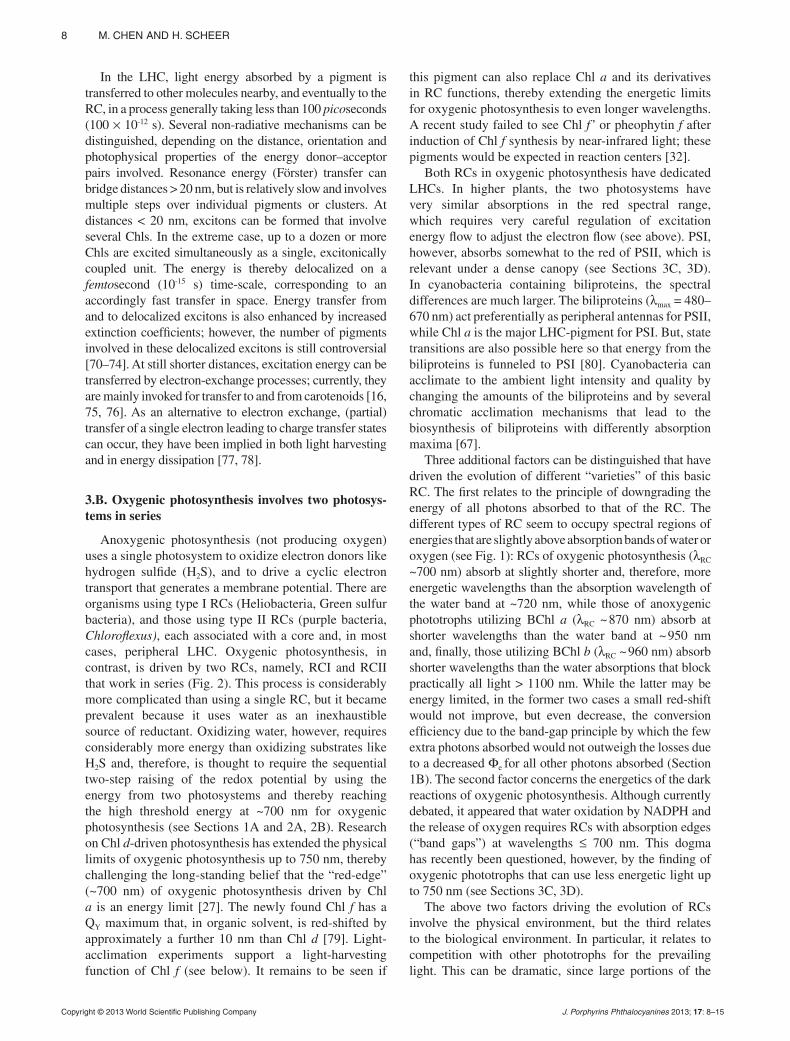
pp. 125–134Advanced photodynamic agent from chondroitin sul-fate/zinc phthalocyanine conjugateSong Yi Baek and Kun Na*
In order to improve the therapeutic effect of zinc phthalocyanine (ZnPc), a nano-drug was prepared with acetylated chondroitin sulfate (AcCS), utilizing a simple chemical method. AcCS/ZnPc nanodrugs exhibited enhancing cellular interna-lization efficiency and phototoxicity compared to that of free ZnPc. Therefore, we suggest that AcCS/ZnPc nanodrugs may have promising possibilities as new photodynamic agents for the clinical treatment of various tumors.
CONTENTS
J. Porphyrins Phthalocyanines 2013; 17: 1–164

CONTENTS
J. Porphyrins Phthalocyanines 2013; 17: 1–164
pp. 135–141Dechlorination of DDT catalyzed by visible-light-driven system composed of vitamin B12 derivative and Rhodamine BKeishiro Tahara, Kumiko Mikuriya, Takahiro Masuko, Jun-ichi Kikuchi and Yoshio Hisaeda*
A new catalytic system composed of a vitamin B12 derivative and Rhodamine B dechlorinated 1,1-bis(4-chlorophenyl)-2,2,2-trichlo-roethane (DDT) and 1,1-bis(4-chlorophenyl)-2,2-dichloroethane (DDD) via a noble-metal-free and visible-light-driven process.
pp. 142–149Electron self-exchange of cytochrome c measu-red via 13C detected protonless NMRStefano Cacciatore, Mario Piccioli and Paola Turano*
Exchange peaks measured in the new 13C-EXSY experiment (COCO-EXSY) are stronger than those observed in conventional 1H- and 15N-based EXSY experiments. The use of 13C directed detection may be essential for all those cases where T2 relaxation is detrimental. The experiment has been tested by measu ring electron self-exchage rates between diamagnetic reduced and paramagnetic oxidized human cyto-chrome c.
pp. 150–156
antiCEA bioconjugate for imaging of colorectal cancerInder Sehgal, Hairong Li, Benson Ongarora, Daniel Devillier and M. Graça H. Vicente*
The conjugation of two zinc(II) phthalocyanines with a monoclonal antibody directed against carcinoembryonic antigen (CEA) is reported. Studies in human colorectal HT-29 cells show 37-fold increase in the immunoconjugate targeting compared with unconjugated ZnPc.
N
N
N
NN
N
N
N
Zn
NH
OO
antiCEA
O O
pp. 157–164Synthesis and studies of covalently linked BF2-oxas-maragdyrin-BODIPY and BF2-oxasmaragdyrin-ferro cene dyadsYogita Pareek and Mangalampalli Ravikanth*
Synthesis, spectral, electrochemical and photophysical properties of BF2-oxasmaragdyrin-BODIPY and BF2-oxasmaragdyrin-ferrocene dyads are des-cribed.

AUTHOR INDEX (cumulative)
AAkuta, Ryo 86Arai, Tatsuo 56Azumi, Keito 56
BBaek, Song Yi 125Ballou, David P. 63Barbe, Jean-Michel 44Bucher, Christophe 28Bui, Thanh-Tuan 28
CCacciatore, Stefano 142Chao, Pei-Shang 92Cheng, Yu-Hsiang 92Chen, Min 1Cioci, Gianluca 27Collins, Daniel P. 63Coulter, Eric D. 63
DDawson, John H. 63Devillier, Daniel 150Du, Bin 44
EEscande, Aude 27
GGhosh, Sudip 27Gros, Claude P. 44Gryko, Dorota 104
HHager, Paul W. 63Hamblin, Michael R. 73Harvey, Pierre D. 44He, Hui 99Hirakawa, Kazutaka 56Hisaeda, Yoshio 135Hiyama, Kazuhiro 36Hiyama, Mariko 36Holten, Dewey 73Hsiao, Yen-Ni 92Hsieh, Min-Hsu 92
Huang, Liyi 73Huang, Ying-Ying 73Hyodo, Ichinosuke 36
IIsaac, Issa S. 63
JJang, Woo-Dong 16Janiga, Anita 104
KKaneko, Tsuyoshi 36Kikuchi, Jun-ichi 135Kim, Dongho 27Kobayashi, Hiroaki 86Krayer, Michael 73Kuo, Hshin-Hui 92Kuo, Ming-Yu 92
LLi, Hairong 150Li, Ming 118Lim, Jong Min 27Lindsey, Jonathan S. 73Lin, Ching-Yao 92Liu, Jian-Yong 99Lo, Chen-Fu 92Loska, Rafał 104Lu, Hsiu-Yu 92
MMaeda, Hiromitsu 86Masuko, Takahiro 135Matsui, Hirofumi 36Mikuriya, Kumiko 135Miwa, Yoshihiro 36Moutet, Jean-Claude 27
NNa, Kun 125Nagano, Yumiko 36Nakanishi, Takeo 36Neal, Teresa J. 118Ng, Dennis K.P. 99Nishimura, Yoshinobu 56
Nosaka, Yoshio 56
OOgawa, Tetsuo 36Okazaki, Segetoshi 56Oliver, Allen G. 118Ongarora, Benson 150
PPareek, Yogita 157Philouze, Christian 27Piccioli, Mario 142
RRavikanth, Mangalampalli
157Richard, Philippe 44
SSaint-Aman, Eric 27Scheer, Hugo 1Scheidt W. Robert 118Schulz, Charles E. 118Sehgal, Inder 150Sessler, Jonathan L. 27Sharma, Sulbha K. 73Shimokawa, Osamu 36Sperandio, Felipe F. 73
TTahara, Keishiro 135Tamai, Ikumi 36Tamura, Masato 36Tanaka, Junko 36Turano, Paola 142
VVicente, M. Graça H. 150
WWang, Chieh-Ming 93Wang, Chin-Li 93
XXu, Hai-Jun 44
YYoon, Hee-Jae 16
Journal of Porphyrins and PhthalocyaninesJ. Porphyrins Phthalocyanines 2013; 17: 1–164
JPP Volume 17 - Numbers 1&2 - Pages 1–164
Aalkynes 104antibody 150apoptosis 73azides 104
Bbacteriochlorins 73BF2-smaragdyrin 157bio-imaging 16bis(2-picolyl)amine 99
C13C direct detection 142cancer 36carboxyphenylethyne 92carcinoembryonic antigen 150chloroperoxidase 63chlorophyll 1chondroitin sulfate 125click chemistry 104colorectal cancer 150compound I 63compound II 63confocal microscopy 73coordination polymers 86CuAAC 104cyclopyrrole 27cytochrome c 142
DDDT 135dechlorination 135dipyrrins 86
Eecophysiology 1electrochemical synthesis 27electrochemistry 92electron self-exchange 142
electron transfer 56, 157energy transfer 1, 157expanded porphyrin 27EXSY 142
Ffluorescence 43, 150fluorescent sensor 99fluorination 56
HHeLa cancer cells 73heme carrier protein 1 36
Iiron (III) 118
Llight climate 1light-harvesting 1
Mmeso–meso linkage 86meta-chloroperoxybenzoic acid
64molecular hybrids 105
Nnano-devices 16nanodrug 125nanotechnology 16near-infrared 99nonaphyrin 27
Oorganic photosensitizer 135
Pperacid, rapid-scan stopped-flow
spectroscopy 63photoactive 125photobiology 36
photodynamic therapy (PDT) 16, 36, 73
photosensitizer 56photosynthesis 1phototoxicity 125photovoltaic 1phthalocyanine 99, 150porphyrin 36, 44, 92protein oxidation 56protonless NMR 142protoporphyrin IX 104P(V)porphyrin 56
Rred-shifted chlorophyll 1Rhodamine B 135ring fusion 86
Ssaturation kinetics 63selective delivery 16singlet energy transfer 44singlet oxygen 56smaragdyrin 157spectroelectrochemistry 92subcellular localization 73synchrotron radiation 27
Ttruxene 44
Vvisible-light-driven catalysis 135vitamin B12 104, 135
Wweak-field ligands 118
Zzinc 99zinc phthalocyanine 125
KEYWORD INDEX (cumulative)
Journal of Porphyrins and PhthalocyaninesJ. Porphyrins Phthalocyanines 2013; 17: 1–164
JPP Volume 16 - Numbers 1&2 - Pages 1–164

Journal of Porphyrins and PhthalocyaninesJ. Porphyrins Phthalocyanines 2013; 17: 1–15
DOI: 10.1142/S1088424612300108
Published at http://www.worldscinet.com/jpp/
Copyright © 2013 World Scientific Publishing Company
INTRODUCTION
Sunlight has proved inexhaustible over geological time and the amount impinging on the earth’s surface vastly surpasses the biological energy needs of all life forms on earth, including man. Photosynthesis is the biological process by which light energy is harvested and transduced into energy-rich molecules, ATP and NADPH, the latter then reducing CO2 to form carbohydrates. Oxygenic photosynthetic organisms evolved 2.7–3.5 × 10⁹ years ago providing the energy for most life forms on earth while generating the oxygen we breathe. Harvesting the sun is also, increasingly, becoming an option for sustainable energy for mankind’s needs: directly by improving biomass production of photosynthetic organisms, indirectly, by coupling it to the production of hydrogen fuel or, conceptually, by using photosynthetic
strategies for technological solutions based on non-biological or hybrid materials. We discuss the light-harvesting process of photosynthesis and its implications for technology, arising from the discovery of novel chlorophyll (Chl) pigments that extend the spectrum of oxygenic photosynthesis into the near-infrared (NIR) spectral region.
1. PHYSICAL CONSIDERATIONS
1.A. Light quality and quantity reaching a photosynthetic organism vary in time and space
The solar spectrum at the top of the atmosphere is, largely, that of a black body at a temperature of ~5800 K, with an intensity maximum in the green spectral region (λ ~ 550 nm) (Fig. 1). If the sun is in the zenith, the integrated intensity amounts to ~1.4 kW.m-2. The light quality and quantity reaching the earth’s surface are both changed and modified by lower solar altitudes,
Extending the limits of natural photosynthesis
and implica tions for technical light harvesting
Min Chen*a and Hugo Scheer*b
a School of Biological Sciences, University of Sydney, Sydney NSW 2006, Australia b Dept-Biologie 1, Botanik, Universität München, 80638 München, Germany
Received 16 July 2012Accepted 24 August 2012
ABSTRACT: Photosynthetic organisms provide, directly or indirectly, the energy that sustains life on earth by harvesting light from the sun. The amount of light impinging on the surface of the earth vastly surpasses the energy needs of life including man. Harvesting the sun is, therefore, an option for a sustainable energy source: directly by improving biomass production, indirectly by coupling it to the production of hydrogen for fuel or, conceptually, by using photosynthetic strategies for technological solutions based on non-biological or hybrid materials. In this review, we summarize the various light climates on earth, the primary reactions responsible for light harvesting and transduction to chemical energy in photosynthesis, and the mechanisms of competitively adapting the photosynthetic apparatus to the ever-changing light conditions. The focus is on oxygenic photosynthesis, its adaptation to the various light-climates by specialized pigments and on the extension of its limits by the evolution of red-shifted chlorophylls. The implications for potential technical solutions are briefly discussed.
KEYWORDS: photosynthesis, chlorophyll, ecophysiology, red-shifted chlorophyll, photovoltaic, energy transfer, light-harvesting, light climate.
SPP full member in good standing
*Correspondence to: Hugo Scheer, email: [email protected] and Min Chen, email: [email protected]

2 M. CHEN AND H. SCHEER
Copyright © 2013 World Scientific Publishing Company J. Porphyrins Phthalocyanines 2013; 17: 2–15
and by absorption and scattering of the atmosphere through clouds and overlaying vegetation (Fig. 1). With clear skies and at latitudes around 45°, the maximum integrated intensity reaching the surface is ~0.5–1 kW.m-2. On cloudy days under a canopy of vegetation the photon flux can, however, be reduced by 3–4 orders of magnitude and its spectral composition changed. Oxygenic photosynthetic organisms can only use light in the spectral region of 300–750 nm, corresponding to photon energies of 400–160 kJ.mol-1. The physical limits of oxygenic photosynthesis are set by the absorption of their light-harvesting pigments and the energetics of water oxidation. The maximum integrated intensity in this spectral region (200–400 W.m-2 depending on the latitude) corresponds to a photon flux of ~1,000–2,000 μmol.m-2.s-1
. The temporal and spatial variations of the light flux and its spectral composition pose considerable problems to photosynthetic organisms, especially if they occur on short time scales when, for example, the sun breaks through clouds or a forest canopy. Photosynthetic organisms have to compete for light but, at the same time, must avoid damage by excess light. The energy of visible photons is high compared with that of typical “high energy” bio-molecules and any overload of the photosynthetic apparatus is, therefore, potentially deleterious (see Section 2A). This balance between starvation and being scorched is maintained by a modular composition of the photosynthetic apparatus and a regulatory network. The most important aspect in the scope of this short review is the functional division between the primary processes of light-harvesting complexes (LHC) in the photosynthetic antennas, and the energy transduction occurring in the reaction centers (RC).
Light intensity and quality are even more strongly modified in aqueous (marine) environments where ~50% of global photosynthesis occurs [1]. The increased
absorption and scattering by water quickly reduces the light intensity and narrows the spectral distribution as the depth increases. In clear oceanic waters, the maximal spectral transmission occurs around ~475 nm, but the bandwidth is drastically reduced: shorter (blue, UV) wavelengths are removed by scattering and longer (yellow to IR) wavelengths by absorption. At 200 m depth, the intensity of ~0.05 μmol.m-2.s-1 is only < 0.005% when compared with that at the surface: this defines the lower limit where specialized photosynthetic organisms like Prochlorococcus CCMP1375 are still found [2]. In coastal or sediment-rich water, the light intensity is more quickly reduced with depth and the spectral maximum shifted to the red with scattering by particulate matter and gas bubbles and, also, with absorption by brown pigments arising mainly from decaying vegetation. Turbid coastal waters have a maximal transmission around 570 nm and, in heavily silt-loaded waters, it can be even further red-shifted into the NIR. Aquatic photosynthesizing organisms have adapted to these conditions by developing specialized pigments with appropriate absorption properties (see Sections 2B and 3), which at the same time modify, in a more complex fashion, the light quality and quantity available to organisms in deeper marine layers than on the terrestrial surface. Particularly extreme light gradients occur inside the microbial mats sometimes encountered in symbiotic systems (see Section 3D).
1.B. Photosynthesis has maximized quantum effici-ency at the cost of energetic efficiency
The overall efficiency of photosynthesis, measured in biomass production, is quite low (~1%) [3]. The efficiency of the primary reactions is, by contrast, near the theoretical limits. It relies firstly on the efficiency
Fig. 1. Solar spectrum at the top of the atmosphere and on the earth surface, and spectra of several photosynthetic pigments in solution. The visible spectrum is indicated on the bottom, absorption bands of atmospheric gases by arrows. Intensities on the y-axis refer to photon flux densities on a clear day and with the sun vertically overhead. Adapted from Kiang et al. [121]; we thank N. Kiang for providing the data files for this figure

EXTENDING THE LIMITS OF NATURAL PHOTOSYNTHESIS AND IMPLICA TIONS FOR TECHNICAL LIGHT HARVESTING 3
Copyright © 2013 World Scientific Publishing Company J. Porphyrins Phthalocyanines 2013; 17: 3–15
of solar light collection by the LHCs [4] and, secondly, on the efficiency of the primary energy transduction into a membrane potential in the RC [5]. The quantum efficiencies of both are near 100% at a stable light flux and a stable spectral composition in the laboratory. Such optimum conditions are rarely met in natural environments, but comparable efficiencies can be reached if the temporal changes are not too rapid.
Two terms need to be distinguished when judging the efficiency of light harvesting: the quantum yield (Φq) and the energetic yield (Φe). Φq is defined by the numbers of excitons reaching the RC per photons absorbed and, as discussed above, it can be as high as 100%. Φe is defined by the energy of the excitons reaching the RC relative to that of the absorbed photons. The RCs of most oxygenic phototrophs absorb near the red-edge (λRC ~ 700 nm) of the absorbance of the LHC: any excess energy of light absorbed at shorter wavelengths is converted to heat. Assuming no other losses, this reduces the energetic efficiency of an individual photon, Φe, by a factor of λabs/λRC. Φe amounts, for example, to 64% if a blue photon is absorbed (λabs = 450 nm). The total Φe is given by the integrated energetic yield of excitation energy reaching these RCs. Using the solar spectrum on the earth’s surface (Fig. 1) as basis, Φe is ~77% for green plants with λRC = 700 nm. It decreases with increasing wavelengths of the absorption edge of the RC, and for the most red-shifted RCs, encountered in bacteriochlorophyll (BChl) b-containing bacteria (λRC ~ 980 nm), it is only ~65%. Φe strongly depends, of course, on the local light climate.
1.C. Absorption bands in the light spectrum present natural barriers
For the unmodified solar spectrum, any red-shift of the absorption edge (e.g. by mutational events) would result in an increase of the total energy collected, although the energetic efficiency (Φe) is decreased (see Section 1B). For the spectrum, modified by atmospheric or aquatic constituents, however, a red-shift into one of their absorption bands can reduce the total energy accessible to the RC. Therefore, any additional numbers of photons absorbed would no longer compensate for the losses due to a decreased Φe for the other photons absorbed. The natural barriers to further red-shifting the absorption edge are mainly defined by the absorptions of oxygen and, in particular, water vapor in the visible (VIS) to NIR spectral region (Fig. 1). Quantitatively, the losses increase with the width and the intensity of the atmospheric or aquatic absorption bands. Those of atmospheric oxygen (688 and 761 nm) and water vapor (~720, ~840, ~960 and ~1200 nm) under clear skies are sharp and these barriers of low light intensities can be traversed by red-shifts of the absorbing pigments by only a few nm. The situation is different with liquid water in clouds and in aqueous environments where the bands become much broader [6]. They can be circumvented or avoided by red-shifting
the absorption limit by >>10 nm. These absorption losses increase with increasing path-length of the overlaying column of water: at depths of only a few meters even the low extinction coefficient (ε ~0.4 × 10⁻³ M-1.cm-1) of the water band at ~720 nm becomes nearly insurmountable.
1.D. Light has to provide sufficient energy to drive photosynthesis
The energy of light is higher than the energies of most biological molecules.1 A single photon is, therefore, of sufficient energy to drive most biological reactions, including the reactions that generate oxygen from water. In oxygenic photosynthesis, NADP (nicotinamide-adenine-dinucleotide phosphate) oxidizes water with the help of light energy. The redox potential difference of 1.15 eV corresponds to an energy gap of 111 kJ.mol-1. Under standard biological conditions, a single photon of λ = 700 nm with the energy of 170 kJ.mol-1 would then suffice to drive one electron “uphill” across this gap.2 However, the reactions do not proceed under standard conditions: the concentrations of the reactants are far from equilibrium; and there are entropic contributions related to the size of LHC. The exact amount of extra energy required is still currently debated. As judged from current oxygenic photosynthesis, it seems that in practice two photons are required for the process [3]. As discussed below, this requirement has been met by a serial tandem system comprising two photosystems that can only work well if a matched electron flow can be maintained over the two systems (Fig. 2).
1.E. Light energy can be supplemented by thermal energy
Since photosynthesis occurs at ambient temperature, it can be assisted, in principle, by thermal energy. Its quantity is so small compared to the light energy that it might seem negligible: for oxygenic photosynthesis (λRC ~ 700 nm) it amounts to only ~2%.1 There are, however, conditions where thermal contributions may become relevant. This is most pronounced in situations where photosynthetic organisms with similar pigmentation compete for light; for example, under a dense canopy of green vegetation. In a dense conifer forest, light of ≤ 700 nm is nearly absent, so that organisms capable of using the residual light > 700 nm have a clear advantage [7]. One way to use this light while maintaining λRC at 700 nm is by thermal up-conversion [8, 9] from LHC
1 According to E = h c/ RC, the energy of 700 nm light amounts to 171 kJ per mole of photons, where h is Planck’s constant, and c the speed of light. The thermal energy, E = k·T amounts to 3 kJ, where k is Boltzmann’s constant, and T the absolute temperature, assumed as 300 K.2 There is an alternative type of photosynthesis using bacteriorhodopsins that probably contributes only a minute fraction of global carbon fixation and is not considered here [10].

4 M. CHEN AND H. SCHEER
Copyright © 2013 World Scientific Publishing Company J. Porphyrins Phthalocyanines 2013; 17: 4–15
absorbing at wavelengths >700 nm. This principle can be combined with red-shifting the absorption of the RC: both strategies are used in photosynthesis (see Sections 2A, 2B and 3).
2. CHEMICAL CONSIDERATIONS
2.A. The pigments
The pigment composition of photosynthetic organisms, from anoxygenic bacteria to higher plants, reflects the solar spectral properties across the land surface and the sun-lit upper water columns of oceans and lakes. Three types of pigments are encountered in photosynthetic systems: Chlorophylls (Chls), carotenoids and biliproteins. We will focus this perspective on Chls as the key pigments, but the same arguments may also be used when discussing the roles of the other two pigments classes in the light harvesting process.
Photosynthetic pigments should absorb strongly in the VIS and NIR spectral range that is provided by the sun and possess long-lived excited states to achieve high quantum efficiency of excitation energy transfer and energy transduction: both processes have to compete with non-radiative losses (internal conversion) resulting in heat that is unusable for photosynthesis. The natural pigments meeting these requirements are the Chls [11]. Chemically, they are fully unsaturated or partly-reduced Mg- containing porphyrins, similar to the Fe-containing
porphyrins (hemes) of our blood (Fig. 3), with which they also share a large part of their biosynthetic pathway [12]. The photophysical properties of chlorophylls and hemes are, nonetheless, vastly different due to the replacement of the central metal of Fe2+ by Mg2+ which minimizes non-radiative losses of the excited state by increasing its lifetime by 3–4 orders of magnitude. Formation of the isocyclic ring in Chls increases the long-wavelength absorption (QY) at the expense of the Soret band3 in the blue spectral region and induces a red shift of the QY-band from ~550 nm (heme) to ~630 nm (Chl c). Both effects are further intensified in Chl a by reduction of the 17–18 double bond which further red-shifts the QY-band to ~670 nm where the extinction coefficient, ε, is increased by one order of magnitude compared with that of heme.
While these modifications ensure the high efficiency of the primary reactions, they also pose problems. Firstly, their absorption bands are shifted away from the maximum of the solar spectrum; for example, in Chl a the two intense Qy and Soret absorption bands at ~670 and ~430 nm, respectively, are outside the maximum of the solar spectrum, thus leaving a “green window” with reduced absorption.4 A number of pigments, including other Chls,
3 Fully unsaturated porphyrins have four bands, two minor ones (QX, QY) in the visible spectral region, and two intense ones (Soret or BX, BY) at the edge of the UV. [13, 14]4 This is sometimes referred to as the “green gap,” which ne-glects that Chl a absorption is moderately strong over the entire region between the two major absorption bands.
Fig. 2. Z-scheme of photosynthesis. Red errors represent downhill flow of electrons over various redox intermediates. Green arrows represent the light-induced rise in reduction potential in the reaction centers of photosystems I and II, RC I and RC II, respectively, by exciting specialized Chl a or d into the 1S state. Black arrows denote proton transport across the photosynthetic membrane that is driven by electron transport (red arrows); the resulting electrochemical potential is used to generate ATP. Two photons are absorbed for each electron driven from water to NADP
Fig. 3. Structures of Chl a (complete structure) and of Chls b, d and f represented by the positions of formyl groups replacing the respective Chl a substituents (as indicated), with IUPAC numbering of carbon atoms, and approximate directions of the molecular X-and Y-axes

EXTENDING THE LIMITS OF NATURAL PHOTOSYNTHESIS AND IMPLICA TIONS FOR TECHNICAL LIGHT HARVESTING 5
Copyright © 2013 World Scientific Publishing Company J. Porphyrins Phthalocyanines 2013; 17: 5–15
carotenoids and biliproteins, have evolved that fill this “window” and act as light-harvesting pigments in the 450–650 nm region.5 Secondly, the photophysical properties of Chls pose a serious threat because they favor phototoxic side reactions. Long excited state lifetimes increase the chance of triplet formation and these much longer-lived reactive species can damage the photosynthetic apparatus. Further, in the presence of oxygen these triplets can create an even more serious indirect threat, by generating reactive oxygen species (ROS) including singlet oxygen. ROS are among the most aggressive molecules known and, being small and diffusible, the range of damage is much larger than that of Chl triplets, and they can attack almost all cellular components. When photosynthesis operates optimally, the speed of charge separation is so rapid that triplet formation is minor [15]. However, under changing light regimes that are frequently encountered, a sudden increase in intensity would be highly deleterious unless compensated by efficient detoxification mechanisms which, by necessity, have co-evolved with photosynthesis and comprise a considerable fraction of the photosynthetic apparatus. Carotenoids, the second class of pigments required universally for photosynthesis, are essential in this detoxification process but will not be further discussed here [16]. Animals lack such effective protection against ROS and actively excrete derivatives of ingested Chl that have crossed the intestinal blood barrier [17]. The phototoxicity of porphyrins including chlorohyll derivatives is, on the other hand, exploited in photodynamic therapy of cancer [18–21] and also with herbicides of the diphenyether class that lead to deregulation of porphyrin biosynthesis [22].
Until recently, Chl a appeared to be the only Chl capable of providing all the functional requirements of oxygenic photosynthesis, namely: efficient light absorption, transfer of excitation energy with high quantum efficiency to RCs and, finally, the primary charge separation in RCs. Chl a was found in all oxygenic photosynthetic organisms and, in some, it was the only major chlorophyll.6 Since Chl a absorbs at the longest wavelengths among the aforementioned Chls, it suggested that the energetic limit for splitting water and oxygen production was set by the red-band position of Chl a around 700 nm.
This situation has changed recently with the discovery of pigments that have replaced Chl a in most, if not all, of its functions. The first such pigment, found already more than 20 years ago, is [8-vinyl]-Chl a of the abundant Prochlorococcus species [2]. Compared with Chl a, the
5 In bacteriochlorophylls, this band is even shifted into the in-frared region (800–1020 nm), but these pigments are only used in anoxygenic photosynthesis that is not discussed here; their excitation energy seems insufficient energy for water splitting.6 All photosynthetic organisms contain small amounts of spe-cial chlorophylls, mainly in the RC, that are not considered here [23].
additional vinyl group changes the red absorption only very little, its main advantage in oceanic waters at depths down to almost 200 m, is probably the ~10 nm red-shifted Soret band (see Section 3D). The next pigment capable of replacing Chl a in most functions was Chl d that differs from Chl a by possessing a formyl rather than a vinyl group at C-3 (Fig. 3). Although Chl d was discovered more than half a century ago [24], the total reliance for photosynthesis on Chl d by the cyanobacterium, Acaryochloris marina, was only discovered much later [25]. Chl d absorbs in solution and in photosynthetic complexes ~30 nm to the red of Chl a (Fig. 1) and, the Chl d protein complex in the RC red-shifts λRC by 40 nm, which also shifts the apparent energetic limits for oxygenic photosynthesis by the same amount, to ~715–740 nm [26–28] (sse below). More recently, yet another Chl, namely Chl f, has been identified [29]; like Chl d, it is similar to Chl a but possesses a formyl rather than a methyl group at C-2 (Fig. 3) and absorbs even further to the red than Chl d (Fig. 1). The parent organism containing Chl f has recently been isolated and cultivated [30], and a second organism has been described that contains this pigment when grown under near-infrared light [31, 32].
2.B. Means to generate chlorophyll spectral shifts
The most common Chl after Chl a is Chl b; it is found in all green land plants, in green algae, and, in its 8-vinyl form, in some cyanobacteria. Chl b is distinguished from Chl a by a formyl instead of a methyl group on ring B at C-7 position (Fig.2). This results in a blue-shift of the longest Qy red wavelength band from 665 to 652 nm (see Section 2A) and a comparable red-shift of the Soret band in the blue spectral region, thereby narrowing the gap between the two main absorption bands (Fig. 4). Concomitantly the intensity of the QY absorption band is decreased by ~45% and that of the Soret band increased [33, 34]. Organisms containing both Chl a and b, including green algae and all terrestrial plants, therefore,
Fig. 4. Spectral comparison of isolated chlorophylls recorded online with an HPLC detector in 100% methanol

6 M. CHEN AND H. SCHEER
Copyright © 2013 World Scientific Publishing Company J. Porphyrins Phthalocyanines 2013; 17: 6–15
are much better matched to the solar spectrum (Fig. 1) than those containing only Chl a.
Chl d and Chl f are distinguished from Chl a by replacement of a peripheral substituent on ring A by a formyl group at C-3 and C-2, respectively, (Fig. 3). The consequences of introducing a formyl group at ring A differ considerably from those discussed above for introduction of a formyl group at ring B: while the latter induces a blue-shift of the QY-band compared to Chl a, substitution at ring A results in a red-shift to 696 nm (Chl d ) and even further to 706 nm (Chl f), while the intensity of this band is roughly retained (Fig. 3). The Soret band of Chl d is also red-shifted while it is blue-shifted in Chl f; this results in a gap (~300 nm) to the QY band that is larger than in any other chlorin-type Chl and almost as large as in the bacteriochlorin-type chlorophylls.7 Clearly, therefore, Chl f absorbs at both ends of the spectrum outside the range where Chls a, b and d are absorbing. The positional effects of formyl groups on chlorophyll spectra and redox potentials has been treated theoretically [29, 35, 36].
In vivo spectra of Chls are generally modified, usually red-shifted, compared with monomeric solutions of the same pigment. One factor for the unusually large shift are Chl-Chl interactions, but additional contributions are likely, both from the pigment [37] and the binding protein [38]. Particularly well-studied examples are bacterial light-harvesting complexes. Red-shifts ≤ 50 nm, caused by pigment-protein interactions, are found in the B800 pigment complement of LH2 [39] and also in synthetic oligopeptides binding monomeric Chls [40–42]. Even larger shifts can result from Chl-Chl (or Chl-carotenoid [43, 44]) interactions. Chl proteins contain up to 40% Chls by weight, and the pigments often contact each other. Due to their geometries, Chl aggregates have generally red-shifted QY bands: the partly overlapping macrocycles with roughly aligned orientations of their Y-axes (see Fig. 3) result in excitonic interactions where the longer-wavelength band of the system carries most of the absorption intensity [45]. The current limit for red-shifting Chl a in situ is to ~738 nm in the red-components of PSI in Spirulina: this corresponds to a shift of 78 nm (1.600 cm-1) compared with the pigment in diethylether [8]. Even larger shifts are found in bacterial LHC; that for BChl b in the light-harvesting complex of Blastochloris viridis amounts to ~230 nm (2800 cm-1) [46]. It is currently unknown if similarly red-shifted components exist in organisms containing Chls d or f that have already red-shifted QY-bands (compared with Chl a) inherent to their structures [47].
7 Chlorin type Chls are reduced at ring D. Bacteriochlorin type Chls, namely, BChls a, b and g are reduced at rings B and D. Note that BChls c, d, and e are of the chlorin type. Only the c-type Chls contain the fully unsaturated porphyrin macrocycle.
2.C. Biosynthetic pathways to modified chlorophylls
All Chls share a common biosynthetic pathway in which eight molecules of 5-aminolevulinic acid (ALA) are condensed to the metal-free porphyrin, protoporphyrin IX. After metalation with Mg2+ and generation of the isocyclic ring, a pathway branches off to the c-type Chls that are little further modified.7 It is unclear if the c-type Chls were the first of the photosynthetic pigments still used today, or if they branched off as antenna pigments after the current RC Chls with reduced rings had evolved and competition for light became a driving force in evolution [48]. Today, the Chls c are only used for light harvesting: there is no RC known that contains them. All other Chls are reduced at ring D (chlorin-type Chls with λmax ≤ 710 nm in solution) or, subsequently, also at ring B (bacteriochlorin-type BChls, λmax 750–800 nm), and modified at the periphery. Although many of the initial steps involved are common to all (B)Chls, the enzymes that carry out this chemistry may not be the same in anaerobic and aerobic environments [49, 50]. Based on the known biosynthetic pathways of Chl a and BChl a, these modifications occur during the last steps in the biosynthetic pathway.
Chlorophyll b, Chl d and Chl f result from formyl group substitution at different positions of Chl a (see Fig. 3). Chl b is synthesized from Chl a (or chlorophyllide a) by a single enzyme, chlorophyll a oxygenase (CAO), that oxygenates the 7-methyl to a formyl group [51] (see Larkum, 2006 [48] for a discussion of the evolution of Chl b). CAO is also capable of introducing second formyl group into Chl d at C-7 [52]; most Chl proteins and enzymes seem to be tolerant to substrate modifications at C-3 [46]. The enzyme(s) generating Chl f by oxygenation of the 2-methyl group is not identified; it may be related to CAO because it involves the same chemistry [29]. Different site-selective reactions in a family of very similar enzymes are known in tetrapyrrole biochemistry [53]. Chl d is also derived from Chl a, but by a different reaction that involves oxidation of the 3-vinyl group with the concomitant loss of one C-atom. The single enzyme catalyzing this step has been identified [54].
3. BIOLOGICAL CONSIDERATIONS
During evolution, photosynthetic organisms have first “learnt” to use light as their primary energy source. At a second stage, they “learnt” to use water molecules as their unlimited source of reductant and, probably in parallel, to cope with the toxic by-product, molecular oxygen and its reactive species. With an increasing number of photosynthetic organisms, the main evolutionary driving force was then to maintain a balance between the competition with other photosynthetic organisms for light and the protection from damage by an excess of light (and oxygen). Due to the variations of light in space and time, this required a careful optimization of
EXTENDING THE LIMITS OF NATURAL PHOTOSYNTHESIS AND IMPLICA TIONS FOR TECHNICAL LIGHT HARVESTING 7
Copyright © 2013 World Scientific Publishing Company J. Porphyrins Phthalocyanines 2013; 17: 7–15
photosynthesis including an appropriate sensory system and an adjustable photosynthetic apparatus. We will focus here on the last aspect; for more comprehensive reviews on the evolution of photosynthesis see references 48, 55 and 56. Energetically, on the level of the primary reactions, photosynthesis compares well with the best current artificial devices; and works over orders of magnitude of available light fluxes. Its efficiency is lowered, however, if counted on the basis of biomass production [3] because survival and reproduction under the different environmental conditions in competition with other organisms, phototropic and heterotrophic ones, were the major selection criteria rather than biomass production. By imposing other selection criteria, as done in the breeding of our current crops, this situation may change.
3.A. Functional separation into complexes dedicated to light-harvesting and to energy transduction
Adaptations of the various species to particular light climates, and acclimations of individual organisms to variations in light quality and quantity are governed by modular organization of the photosynthetic apparatus. Light is absorbed by LHC that transfer the excitation to specialized RC where the excitation energy is transduced into a membrane potential. This functional separation reflects the fact that, even in full sunlight under a very clear sky, photons are quite dilute: assuming an absorption cross section of 50 Å2 for a Chl molecule, and dense packing, each pigment would be excited about 10 times per second. Since RCs contain only few Chls, the packing within a RC would be far less dense, resulting in the pigment absorbing one photon every one or two seconds,8 and much less frequently under most normal light conditions. As this is much slower than the actual turnover time of the RC (~10 ms) [57], most reaction centers would remain idle even if the membrane was packed with RCs, especially under a moderate cloud cover or vegetation canopy. Obviously, absorption by RCs alone is limited quantitatively by the relatively large amount of protein (10–12 kDa/(B)Chl) and qualitatively by the apparently restricted number of pigments capable of functioning in a RC. Chl a and d are currently the only known chlorophylls that can function in oxygenic RC and both have only modest absorption in the green spectral region.
The presence of LHC enhances the absorption cross section of the RC at moderate biosynthetic cost and in a quantitatively and qualitatively adjustable fashion. One advantage of this functional separation is that LHC contain much less protein per pigment, for example,
8 Estimate is based an a photosynthetically active light flux of 1000 μEinstein·m-2·s-1, a single layer of Chl, no limitation by electron transport, and a cross section derived from an extinction coefficient of 105 M-1·cm-1.
only ~1.5 kDa of protein are required per chromophore in LHCII. This enhances the density of pigments and thereby improves light absorption. It also saves energy needed for biosynthesis of the proteins, which accounts for up to 50% of the total protein of photosynthetic cells. Since up to 99% of the chromophores are located in the LHC, the energy savings are considerable. Green bacteria, which hold the record for growing under minimal light, even have a LHC, the chlorosome, which is almost entirely made up of pigments. Such anaerobic green sulfur bacteria have members that are suspected to grow phototrophically by catching not more than one photon per BChl every eight hours, with doubling times of years [58, 59]. It is unclear how concentration quenching is avoided in this and other LHC: with dozens of coupled chromophores, a single ineffective one would compromise the entire system. Introduction of LHC traps may, however, become an important protection mechanism at high light when photosynthesis becomes limited by electron transport and dark reactions. Under these conditions, most of the energy absorbed is converted to heat [60]. The underlying switching mechanism is still enigmatic.
A second advantage is the modularity attained by the functional separation. LHC and RC have been optimized independently during evolution. In contrast to RC, LHC have evolved independently several times and there is good evidence for lateral transfer of LHC among different organisms [56]. This modularity also allows adjustment of the size of the antenna system in response to different light intensities. In Prochlorococcus, for example, multiple copies of the accessory LHC, Chla/b-binding protein (CBP), are found only in the low-light ecotype strain of Prochlorococcus CCMP1375 that was isolated from deep water (120 m), while only a single copy of the cbp gene was found in the high-light ecotype strain CCMP 1986 that was isolated from surface water [61–63]. The modularity further allows for a qualitative adjustment of the LHC in response to changing light conditions. The LHC of different organisms, by employing a variety of Chls, supplemented by biliproteins and carotenoids, use practically the entire photosynthetically-active range (PAR) from 350 to 1050 nm [46]. Many photosynthetic organisms are capable of regulating the pigment composition of LHC during acclimation to changing light qualities [64]. Probably the most striking example is the complementary chromatic acclimation9 of many cyanobacteria [66–68]. Regulating the energy flow to the two photosystems is, last but not least, the basis for state transitions in oxygenic photosynthesis, by which the sequential electron flow (Fig, 2, Section 3B) is matched [69].
9 The process has originally been termed complementary chromatic adaptation [65], but now changed to complementary chromatic acclimation because adaptations occur during evolution on a species basis.
8 M. CHEN AND H. SCHEER
Copyright © 2013 World Scientific Publishing Company J. Porphyrins Phthalocyanines 2013; 17: 8–15
In the LHC, light energy absorbed by a pigment is transferred to other molecules nearby, and eventually to the RC, in a process generally taking less than 100 picoseconds (100 × 10-12 s). Several non-radiative mechanisms can be distinguished, depending on the distance, orientation and photophysical properties of the energy donor–acceptor pairs involved. Resonance energy (Förster) transfer can bridge distances > 20 nm, but is relatively slow and involves multiple steps over individual pigments or clusters. At distances < 20 nm, excitons can be formed that involve several Chls. In the extreme case, up to a dozen or more Chls are excited simultaneously as a single, excitonically coupled unit. The energy is thereby delocalized on a femtosecond (10-15 s) time-scale, corresponding to an accordingly fast transfer in space. Energy transfer from and to delocalized excitons is also enhanced by increased extinction coefficients; however, the number of pigments involved in these delocalized excitons is still controversial [70–74]. At still shorter distances, excitation energy can be transferred by electron-exchange processes; currently, they are mainly invoked for transfer to and from carotenoids [16, 75, 76]. As an alternative to electron exchange, (partial) transfer of a single electron leading to charge transfer states can occur, they have been implied in both light harvesting and in energy dissipation [77, 78].
3.B. Oxygenic photosynthesis involves two photosys-tems in series
Anoxygenic photosynthesis (not producing oxygen) uses a single photosystem to oxidize electron donors like hydrogen sulfide (H2S), and to drive a cyclic electron transport that generates a membrane potential. There are organisms using type I RCs (Heliobacteria, Green sulfur bacteria), and those using type II RCs (purple bacteria, Chloroflexus), each associated with a core and, in most cases, peripheral LHC. Oxygenic photosynthesis, in contrast, is driven by two RCs, namely, RCI and RCII that work in series (Fig. 2). This process is considerably more complicated than using a single RC, but it became prevalent because it uses water as an inexhaustible source of reductant. Oxidizing water, however, requires considerably more energy than oxidizing substrates like H2S and, therefore, is thought to require the sequential two-step raising of the redox potential by using the energy from two photosystems and thereby reaching the high threshold energy at ~700 nm for oxygenic photosynthesis (see Sections 1A and 2A, 2B). Research on Chl d-driven photosynthesis has extended the physical limits of oxygenic photosynthesis up to 750 nm, thereby challenging the long-standing belief that the “red-edge” (~700 nm) of oxygenic photosynthesis driven by Chl a is an energy limit [27]. The newly found Chl f has a QY maximum that, in organic solvent, is red-shifted by approximately a further 10 nm than Chl d [79]. Light-acclimation experiments support a light-harvesting function of Chl f (see below). It remains to be seen if
this pigment can also replace Chl a and its derivatives in RC functions, thereby extending the energetic limits for oxygenic photosynthesis to even longer wavelengths. A recent study failed to see Chl f ’ or pheophytin f after induction of Chl f synthesis by near-infrared light; these pigments would be expected in reaction centers [32].
Both RCs in oxygenic photosynthesis have dedicated LHCs. In higher plants, the two photosystems have very similar absorptions in the red spectral range, which requires very careful regulation of excitation energy flow to adjust the electron flow (see above). PSI, however, absorbs somewhat to the red of PSII, which is relevant under a dense canopy (see Sections 3C, 3D). In cyanobacteria containing biliproteins, the spectral differences are much larger. The biliproteins (λmax = 480–670 nm) act preferentially as peripheral antennas for PSII, while Chl a is the major LHC-pigment for PSI. But, state transitions are also possible here so that energy from the biliproteins is funneled to PSI [80]. Cyanobacteria can acclimate to the ambient light intensity and quality by changing the amounts of the biliproteins and by several chromatic acclimation mechanisms that lead to the biosynthesis of biliproteins with differently absorption maxima [67].
Three additional factors can be distinguished that have driven the evolution of different “varieties” of this basic RC. The first relates to the principle of downgrading the energy of all photons absorbed to that of the RC. The different types of RC seem to occupy spectral regions of energies that are slightly above absorption bands of water or oxygen (see Fig. 1): RCs of oxygenic photosynthesis (λRC ~700 nm) absorb at slightly shorter and, therefore, more energetic wavelengths than the absorption wavelength of the water band at ~720 nm, while those of anoxygenic phototrophs utilizing BChl a (λRC ~ 870 nm) absorb at shorter wavelengths than the water band at ~ 950 nm and, finally, those utilizing BChl b (λRC ~ 960 nm) absorb shorter wavelengths than the water absorptions that block practically all light > 1100 nm. While the latter may be energy limited, in the former two cases a small red-shift would not improve, but even decrease, the conversion efficiency due to the band-gap principle by which the few extra photons absorbed would not outweigh the losses due to a decreased Φe for all other photons absorbed (Section 1B). The second factor concerns the energetics of the dark reactions of oxygenic photosynthesis. Although currently debated, it appeared that water oxidation by NADPH and the release of oxygen requires RCs with absorption edges (“band gaps”) at wavelengths ≤ 700 nm. This dogma has recently been questioned, however, by the finding of oxygenic phototrophs that can use less energetic light up to 750 nm (see Sections 3C, 3D).
The above two factors driving the evolution of RCs involve the physical environment, but the third relates to the biological environment. In particular, it relates to competition with other phototrophs for the prevailing light. This can be dramatic, since large portions of the

EXTENDING THE LIMITS OF NATURAL PHOTOSYNTHESIS AND IMPLICA TIONS FOR TECHNICAL LIGHT HARVESTING 9
Copyright © 2013 World Scientific Publishing Company J. Porphyrins Phthalocyanines 2013; 17: 9–15
photosynthetically active spectrum may be completely absorbed by overlaying phototrophic competitor(s). As shown in Fig. 5, the edges of these biological filters are quite steep and, as long as there are significant photon fluxes above the absorption edge, the transmitted light may be enriched in wavelengths that are poorly absorbed by the more common photosynthetic pigments. There are phototrophs that exploit such ecological niches; this can be used as a rationale for searching for novel phototrophs using unusual Chls (see section 3D).
3.C. Competition for light harvesting
LHCs have diversified enormously during evolution. During very early evolutionary times the capacity for photosynthesis provided per se an enormous advantage, but later evolution was probably driven by the competition among different phototrophs for light. There are three different types of photo-pigments in antenna systems: Chls, bilins, and carotenoids. The Chls are omnipresent in core LHCs but absorb relatively little in the region of 450–630 nm where light-harvesting biliproteins and carotenoids, found mainly in aquatic systems, absorb very strongly. Biliproteins are peripheral LHC components in cyanobacteria, red and cryptophyte algae. In coastal waters, where the prevailing maximum light intensity is around 570 nm, species contain biliproteins that absorb in the region of 560–630 nm. In the open ocean, however, where the maximum light intensity occurs around 470 nm, species abound with phycobiliproteins containing phycoerythrobilin and, in particular, phycourobilin chromophores, which absorb maximally in this spectral region [81, 82]. Marine algae are rich in highly modified carotenoids like fucoxanthin and peridinin that have
unusually long excited state lifetimes and are, therefore, better suited for light-harvesting than most other carotenoids that otherwise function mainly in light protection. A third group of pigments, with very high absorption in the blue spectral region, are the c-type Chls which, again, are abundant in seaweeds and diatoms [83].
Adaptations to absorb wavelengths in the “green window,” where Chl a absorbs only moderately, have long been extensively studied; by contrast, similar adaptations in oxygenic phototrophs to spectral regions outside the absorption spectrum of Chl a have only more recently been investigated. For example, the red-shift of certain Chl a molecules found in Spirulina, which can extend up to 738 nm, has been attributed to excitonic coupling. [8] The ecological significance of LHC with such red-shifted absorptions > 700 nm has been advanced by Trissl [84]. They are particular pronounced in organisms growing in shaded locations, or in strongly light-scattering environments [9]. These pigment pools were originally thought to increase the probability of exciton localization near the RC, mainly in PSI, to which they feed excitation energy with the help of thermal up-conversion. They are, however, particularly prominent in situations where light < 700 nm is strongly reduced [9, 85, 86], pointing to a light-harvesting advantage in strongly scattering environments or under overlaying Chl a-containing organisms [35].
More recently, organisms have been found with Chls possessing red-shifted absorption spectra due to conjugated substituents. The cyanobacterium, Acaryochloris, has an in vivo absorption maximum of 710–720 nm due to presence of Chl d (Fig 4) which not only replaces Chl a in the LHC but also in the RC, thereby red-shifting the absorption spectrum of the entire photosynthetic apparatus [26–28, 87, 88]. Acaryochloris is, therefore, the first organism discovered with a modified chlorophyll, Chl d, driving oxygenic photosynthesis with RC absorbing above 700 nm. This provides Acaryochloris the selective advantage of using far-red light (690–750 nm), which is not absorbed by the more common photosynthetic organisms with RCs absorbing at or below 700 nm (Fig. 5). Acaryochloris and other Chl d-containing organisms are found widely distributed in ambient light environments enriched with far-red wavelengths and at locations overlaid by dense Chl a-containing vegetation which removes almost all light below 700 nm [35, 89–98]. Red-shifted Chl a pools are likely to extend photosynthesis into these regions, and even further red-shifts can be anticipated in Chl d-containing organisms from pigment-pigment or pigment-protein interactions. Presently, it is unclear if such minor pigment pools exist in Acaryochloris (see Section 2C).
A newly-isolated cyanobacterium, Halomicronema hongdechloris gen., sp. nov., contains Chl a as its main chlorophyll; the in vivo spectrum, however, shows an absorption shoulder at 730–760 nm due to the presence
Fig. 5. Absorption spectra of Acaryochloris marina containing mainly Chl d (red), and of Halomicronema hongdechloris gen., sp. nov. containing Chls a and f (black). The gray shaded area shows the light absorbed by Synechocystis sp. PCC6803 containing Chl a as the only chlorophyll; its contour defines the transmission spectrum. The wavelength of 50% transmission at the steep increase of transmitted light > 700 nm shifts by only few nm when the concentration is changed

10 M. CHEN AND H. SCHEER
Copyright © 2013 World Scientific Publishing Company J. Porphyrins Phthalocyanines 2013; 17: 10–15
of Chl f (Fig. 5) [30]. It has been estimated that Chl f could increase the absorption of solar radiation by the photosynthetic systems by more than 19% if it were to replace Chl a [79], this will be tested in the near future in this organism. The advantage can be much larger in light-filtering situations in layered systems, which are characteristic for stromatolites from which the first Chl f-containing organism has been isolated [29, 30]. The light-harvesting function of Chl f under such extreme conditions is emphasized by light acclimation experiments with this and a second Chl f-producing strain, KC1: it is absent under white light, and induced only when the cyanobacteria are subjected exclusively to NIR (740 nm) light [30, 32].
3.D. Emerging strategies for localizing organisms adapted to extreme light conditions
Knowledge, of both the extreme limits of the distribution of photosynthetic organisms and the mechanisms that permit such limits to be achieved, has recently been considerably advanced. On the low energy side, anoxygenic phototrophic organisms are found at 100–140 m depth in the Black Sea where they receive only 0.75–2.2 × 10⁻³ μmol.photons.m-2.s-1 and where the spectral quality is very different from that at the surface [59]. A green sulfur bacterium found in such an extreme light environment uses BChl e for anoxygenic photosynthesis: this pigment is densely packed in the almost protein-free chlorosomes. Another anoxygenic photosynthetic anaerobe is found in an even more extreme environment, namely, near deep-sea (2400 m) hydrothermal vents [58]. No sunlight reaches these depths and it is thought that the faint thermal and chemoluminescence emanating from the vents suffices to supply, via photosynthesis, at least part of the energy required by this organism. The light intensity in the NIR resembles that in the Black Sea at a depth of 80 m. Yet another source of “light” at these depths might be the high-energy fraction of thermal radiation. The radiation of a black-body of 300°C peaks in the IR at ~5200 nm, but light above 900 nm is absorbed strongly by water (see Section 1A), so the maximum light intensity is, dependent on the distance from the black smoker, expected at 750–850 nm. The cultivated bacterium absorbs at ambient pressure around 750 nm [58]; the peak may be red-shifted at the 240 bar pressure experienced in its natural habitat [99].
Many oxygenic marine phototrophs living at depths still reached by residual sunlight are adapted to the narrow spectral band of the prevailing blue or teal light: Chls c are fully unsaturated Mg-porphyrins possessing an intense Soret band [48] which absorbs strongly in this region. Another adaptation, found in low-light adapted species of Prochlorococcus (like CCMP1375) occurring in the ocean at depths down to 200 m, is the possession of the 8-vinyl derivatives of Chls a and b [2, 100]: these
“divinyl” Chls have almost identical red absorption maxima as Chls a and b, respectively, but have red-shifted Soret-bands that better match the available blue-light and they are probably more efficient light-harvesters than carotenoids.
Photosynthetic microbial mats are complex ecosystems found in a wide range of biological ecosystems. They function as a complex food web, in which individual organisms depend on and support other members of the community. The phototrophic organisms present use an amazing array of light harvesting strategies which, currently, are only partly explored. In layered stromatolite mats, the top layer contains cyanobacteria using Chl a absorbing at or below 700 nm. Below this layer is Acaryochloris containing Chl d as its major pigment and absorbing far-red light down to 750 nm (Fig. 5) [29, 47]. It is uncertain whether Chl f-containing organisms are naturally located in the even lower layers below the Chl d-containing species.
In addition to the aforementioned adaptations to permanent low-light conditions, there are also advantageous adaptations for organisms in transient environmental conditions. Some examples include aerobic purple bacteria which, unlike the more common species, synthesize their BChls under aerobic conditions, but photosynthesize under anaerobic or microaerophilic conditions [101, 102]. At rapidly declining oxygen concentrations, their already-synthesized photosynthetic apparatus provides a transient advantage over organisms where photosynthesis is performed only under anaerobic or microaerophilic conditions. Another example occurs in the recently-discovered Acidobacteria which contain highly efficient chlorosomes as LHCs but, surprisingly, were found in bacterial mats in Yellowstone that experience extremely high light fluxes: the light flux at noon can reach 1000–2000 μmol photons.m-2.s-1 and, additionally, is rich in UV light. Klatt el al. [103] have provided evidence, however, that this is actually an adaptation to low light since the chlorosomes allow Acidobacteria to harvest light at dawn and dusk while the high concentrations of menaquinone in this organism protect the photosynthetic apparatus very efficiently from excess light during most of the day: at high light intensity, menaquinone is oxidized and thought to act as an efficient quencher. It remains to be proved, however, whether this provides sufficient protection, or if additional mechanisms are required.
4. PHOTOSYNTHESIS AND PHOTO-VOLTAIC
With the limited amounts of fossil fuels and socio-economic problems related to the use of atomic energy and bio-fuels, the use of the sun as a source of primary energy assumes increasing importance. The first steps of photosynthesis are photovoltaic; that is, the conversion of light energy into a membrane potential. It is, therefore,

EXTENDING THE LIMITS OF NATURAL PHOTOSYNTHESIS AND IMPLICA TIONS FOR TECHNICAL LIGHT HARVESTING 11
Copyright © 2013 World Scientific Publishing Company J. Porphyrins Phthalocyanines 2013; 17: 11–15
interesting to compare the natural photosynthetic machinery with technical (artificial) photovoltaic systems [104].
Currently, these technical systems are of two major types: dye-sensitized solar cells (DSSC) [105], and semiconductor solar cells (SCSC). The first are cheap and simple to prepare but have lower yields and are also limited by the stability of the sensitizer dye and the electrolyte used [106, 107]: they are usually based on titanium dioxide (TiO2) and work well at low light intensities. Inorganic silicon based SCSC have high yields but rely on relatively costly and technically more-demanding semiconductors: their price reflects the large energy input needed for their production. Importantly, both types require storage capacities of the electricity generated for periods of hours or days when light is reduced or unavailable.
In photosynthesis terms, both types of technical cells are generally reaction-center-only systems: in DSSC, electrons photo-ejected from the dyes are transferred, for example, to amorphous TiO2 while, in SCSC, electrons are excited into the semiconductor’s conduction band. Also, similar to photosynthesis, both technical systems use only part of the solar spectrum and downgrade the energy of the collected photons of the sampled spectral range to that of a cut-off frequency. In DSSC, this cut-off point is the lowest-energy absorption band of the dyes which, currently, are often heteroleptic Ru-complexes that absorb up to ~700 nm. It can be extended into the NIR by other sensitizers, or up-converting phosphors [108–110]. In SCSC, the photon energy is downgraded to the energy of the semiconductor band-gap. In the silicon-based solar cells, currently and almost exclusively used for large-scale solar light harvesting due to the abundance of quartz-sand and established large-scale production lines, the spectral absorption is broad. With a band-gap over 1000 nm, they cover the visible and NIR region up to the first strong water absorption band (see Section 1B). Organic SCSC have narrower absorption bands.
Photovoltaic cells, based on silicon, have electric efficiencies of ~17%, averaged over a year, and the energy-repayment-time for the installation is about six years; both values are expected to improve. If the electric energy is stored as chemical energy, by electrolysis of water, the yield is 10–14%. Although single junction organic SCSC and DSCC have yields below 5%, even this is considerably larger than the yield of photosynthetic organisms [3].
The situation in organic SCSC and DSSC can be further improved by combining several dyes or semiconducting polymers. In DSSC, for instance, several layers containing different dyes can be combined together to utilize a larger part of the solar spectrum [111]. In multi-junction semiconductor cells, various materials with different band gaps can be employed; for example, one in the visible- and another in the NIR-range [112, 113]. Both approaches usually use the two cells in series, which requires balancing of the current
thus resembling the sequential photoreactions of PSI and PSII in oxygenic photosynthesis, but lacking the flexibility to react to variations of light quality and quantity. Incidentally, the methods for measuring the quantum efficiencies in these tandem cells resemble those that were substantial in defining the presence of two photosynthetic photosystems acting in series [114, 115]. Since the middle layer of the macroscopic dual-junction cell is accessible only for monitoring [116], an imbalance reduces power generation. To circumvent current matching, a technical solution is to use parallel tandem cells, but now voltage matching is required [112].
A modified tandem approach has also been proposed to engineer improved photosynthetic systems [3]. The largest disadvantage of oxygenic photosynthesis, namely, the relatively high-energy absorption edge of both photosystems, might be overcome by combining a conventional oxygenic photosystem (λedge ≈ 700 nm) with one based on BChls ((λedge ≈ 850–1000 nm). The finding of oxygenic organisms absorbing above 700 nm suggests that the energetic limit for oxygen evolution has not yet been reached by natural systems. Placing the second RC (plus LHC) in the NIR region would allow for tapping its energy simultaneously to that of the visible region and for less downgrading losses; furthermore, since the energy of the two photosystems can be tapped individually, it would be simpler to match and regulate current. Due to the absorption of NIR by water (see Section 1A), this approach would be useful on the terrestrial surface, or in shallow waters.
One of the major characteristics of photosynthesis that is still rarely used in photovolataics, is the separation of light-harvesting and energy-transduction functions. Silicon is expensive and other semiconductors are toxic: it would be advantageous to reduce the amounts needed. Whereas photosynthesis is based on microscopic modules, current technical light-harvesting systems are macroscopic.10 Most of them are based on mirrors requiring both cleaning and a mechanism to track the sun, at least over the seasons; they are mainly used in solar-thermal devices. An alternative system is based on internal reflection in a dye-doped acrylic glass: here the stability of the fluorescing dye is critical [118]. Microscopic light-harvesting has been studied for improving DSSC, where only the first layer of adsorbed dye-molecules is efficient in charge transfer [104, 110, 119]
At the research level, microscopic hybrid systems for enhancing light-harvesting have recently been demonstrated [120]. The fluorescence of an algal light-harvesting complex, the peridinin-chlorophyll protein, PCP), is increased up to 18-fold when placed in the vicinity of silver nano-particles. This enhancement
10 We do not discuss here systems that improve light-harvesting by back-mirrors or surface roughening in order to increase the light path within the cell; they are equivalent to morphological features of leaves [117].

12 M. CHEN AND H. SCHEER
Copyright © 2013 World Scientific Publishing Company J. Porphyrins Phthalocyanines 2013; 17: 12–15
depends on the distance between the two particles: at short distances, the fluorescence is quenched, which is the basis of surface-enhanced Raman spectroscopy, but at longer distances, the observed enhancement is dominant. Any technical usage of such a hybrid device would, therefore, require control of the distance. The enhancement also depends on the orientation of the PCP, and on the spectrum of the metallic nano-particles relative to that of PCP.
CONCLUDING REMARKS
Considering that natural photosynthesis and technical systems rely on the same physics, it is surprising that little overlap occurs between the two research communities. This brief overview shows that many concepts are shared and, thus, closer interaction between the two groups could be mutually beneficial and highly productive.
The recent energetic comparison of photosynthesis and artificial solar cells clearly favors the latter [3]. This calculation neglects, however, the energetic costs for fabrication, maintenance and disposal: all critically depend on the particular local conditions. The cost may be less with biomass production, where factors like the availability of water and ethical considerations (competition with food production) are of more concern. Photosynthesis also compares more favorably if based on a CO2 fixation basis, rather than on biomass production, and even more energetic efficiency may be provided by coupling the photosystems to hydrogenase for H2 fuel production. Biomass seems a less-important selection criterion for plants and algae than survival and reproduction under different environmental conditions and in competition with other organisms, including photo- and heterotrophs. By imposing other selection criteria, as in the breeding programs that generated our current crops, this situation may be changed. As with photosynthetic organisms adapted to different habitats, it may then, on engineering grounds, become a local matter whether natural, artificial or hybrid systems, and which type of them, are best suited for harvesting the energy of the sun.
REFERENCES
1. Falkowski P and Chen YB. In Light-harvesting Antennas in Photosynthesis, Green B and Parson W. (Eds.) Kluwer: Dordrecht, 2003; pp 423–447.
2. Chisholm SW, Frankel SL, Goericke R, Olson RJ, Palenik B, Waterbury JB, West-Johnsrud L and Zettler ER. Arch. Microbiol. 1992; 157: 297–300.
3. Blankenship RE, Tiede DM, Barber J, Brudvig GW, Fleming G, Ghirardi M, Gunner MR, Junge W, Kramer DM, Melis A, et al. Science 2011; 332: 805–809.
4. Light-harvesting Antennas in Photosynthesis, Green B and Parson W. (Eds.) Kluwer: Dordrecht, 2003.
5. The Photosynthetic Reaction Center, Deisenhofer J and Norris JR. (Eds.) Academic Press: New York, 1993.
6. Braun CL and Smirnow SN. J. Chem. Edu. 1993; 70: 612–614.
7. Björn LO, Papageorgiou GC, Blankenship RE and Govindjee. Photosynth. Res. 2009; 99: 85–98.
8. Koehne B and Trissl HW. Biochemistry 1998; 37: 5494–5500.
9. Wilhelm C and Jakob T. Photosynth. Res. 2006; 87: 323–329.
10. Oren A. Limnol. Oceanogr. 1983; 28: 33–41. 11. Chlorophylls and Bacteriochlorophylls: Biochem-
istry, Biophysics, Functions and Applications, Grimm B, Porra R, Rüdiger W and Scheer H. (Eds.) Springer: Dordrecht, 2006.
12. Porra RJ, Oster U and Scheer H. In Phytoplankton Pigments: Characterization, Chemotaxonomy and Applications in Oceanography, Roy S, Skarstad Ege-land E, Johnsen G and Llewellyn CA. (Eds.) Cam-bridge University Press: Cambridge, 2011; pp 79–113.
13. Gouterman M, Wagnière G and Snyder LC. J. Mol. Spectr. 1963; 11: 108–127.
14. Weiss C. In The Porphyrins, Vol. III. Dolphin D. (Ed.) Academic Press: New York, 1978; pp 211–224.
15. Sundström V. Annu. Rev. Phys. Chem. 2008; 59: 53–77.
16. The Photochemistry of Carotenoids, Frank HA, Young AJ, Britton G and Cogdell RJ. (Eds.) Klu-wer: Dordrecht, 1999.
17. Vlaming MLH, Lagas JS and Schinkel AH. Adv. Drug Delivery Rev. 2009; 61: 14–25.
18. Tappeiner Hv and Jodlbauer A. Dtsch. Arch. Klin. Med. 1904; 80: 427–487.
19. Sternberg ED, Dolphin D and Bruckner C. Tetrahe-dron 1998; 54: 4151–4202.
20. Brandis A, Salomon Y and Scherz A. In Chloro-phylls and Bacteriochlorophylls: Biochemistry, Biophysics, Functions and Applications, Grimm B, Porra R, Rüdiger W and Scheer H. (Eds.) Springer: Dordrecht, 2006; pp 461–483 (Advances in Photo-synthesis and Respiration).
21. Brandis A, Salomon Y and Scherz A. In Chloro-phylls and Bacteriochlorophylls: Biochemistry, Biophysics, Functions and Applications, Grimm B, Porra R, Rüdiger W and Scheer H. (Eds.) Springer: Dordrecht, 2006; pp 485–494 (Advances in Photo-synthesis and Respiration).
22. Lermontova I and Grimm B. Plant J. 2006; 48: 499–510.
23. Kobayashi M, Akiyama M, Kise H and Watanabe T. In Chlorophylls and Bacteriochlorophylls: Bio-chemistry, Biophysics, Functions and Applica-tions, Grimm B, Porra R, Rüdiger W and Scheer H. Springer: Dordrecht, 2006; pp 55–66 (Advances in Photosynthesis and Respiration).

EXTENDING THE LIMITS OF NATURAL PHOTOSYNTHESIS AND IMPLICA TIONS FOR TECHNICAL LIGHT HARVESTING 13
Copyright © 2013 World Scientific Publishing Company J. Porphyrins Phthalocyanines 2013; 17: 13–15
24. Manning WM and Strain HH. J. Biol. Chem. 1943; 151: 1–19.
25. Schiller H, Senger H, Miyashita H, Miyachi S and Dau H. FEBS Lett. 1997; 410: 433–436.
26. Chen M, Telfer A, Lin S, Pascal A, Larkum AWD and Blankenship RE. Photochem. Photobiol. Sci 2005; 4: 1060–1064.
27. Tomo T, Okubo T, Akimoto S, Yokono M, Miyas-hita H, Tsuchiya T, Noguchi T and Mimuro M. Proc. Natl. Acad. Sci. USA 2007; 104: 7283–7288.
28. Hu Q, Miyashita H, Iwasaki I, Kurano N, Miyachi S, Iwaki M and Itoh S. Proc. Natl. Acad. Sci. USA 1998; 95: 13319–13323.
29. Chen M, Schliep M, Willows RD, Cai Z-L, Neilan BA and Scheer H. Science 2010; 329: 1318–1319.
30. Chen M, Li Y, Birch D and Willows RD. FEBS Lett 2012; 586: 3249–3254.
31. Ohkubo S, Usui H and Miyashita H. Jpn. J. Phycol. (Sorui) 2011; 59: 52.
32. Akutsu S, Fujinuma D, Furukawa H, Watanabe T, Ohnishi-Kameyama M, Ono H, Ohkubo S, Miyas-hita H and Kobayashi M. Photomed. Photobiol. 2011; 33: 35–40.
33. Hoober JK, Eggink LL and Chen M. Photosyn. Res. 2007; 94: 387–400.
34. Knox RS and Spring BQ. Photochem. Photobiol. 2003; 77: 497–501.
35. Schliep M, Cavigliasso G, Quinnell RG, Stranger R and Larkum AWD. Plant Cell Env 2012: DOI: 10.1111/pce.12000.
36. Yamijala SS, Periyasamy G and Pati SK. J. Phys. Chem. A 2011; 115: 12298–12306.
37. Permentier HP, Neerken S, Overmann J and Amesz J. Biochemistry 2001; 40: 5573–5578.
38. Melkozernov AN and Blankenship RE. J. Biol. Chem. 2003; 278: 44542–44551.
39. Freer A, Prince S, Sauer K, Papiz M, Hawthorn-thwaite-Lawless A, McDermott G, Cogdell R and Isaacs NW. Structure 1996; 4: 449–462.
40. Chen M, Eggink LL, Hoober JK and Larkum AW. J Am Chem Soc 2005; 127: 2052–2053.
41. Noy D, Moser CC and Dutton PL. In Chlorophylls and Bacteriochlorophylls: Biochemistry, Biophys-ics, Functions and Applications, Grimm B, Porra R, Rüdiger W and Scheer H. Springer: Dordrecht, 2006; pp 349–363 (Advances in Photosynthesis and Respiration).
42. Haehnel W, Noy D and Scheer H. In The Purple Phototrophic Bacteria, Hunter CN, Daldal F, Thur-nauer MC and Beatty JT. (Eds.) Springer: Dor-drecht, 2008; pp 895–912.
43. Kleima FJ, Wendling M, Hofmann E, Peterman EJ, van Grondelle R and van Amerongen H. Biochem-istry 2000; 39: 5184–5195.
44. Hofmann E, Wrench PM, Sharples FP, Hiller RG, Welte W and Diederichs K. Science 1996; 272: 1788–1791.
45. Biophysical Chemistry Part II: Techniques for the Study of Biological Structure and Function, Cantor CR and Schimmel PR. (Eds.) W. H. Freeman: New York; 1980.
46. Scheer H. In Light-harvesting Antennas in Photo-synthesis, Green B and Parson W. (Eds.) Kluwer: Dordrecht, 2003; pp 29–81.
47. Chen M, Quinnell RG and Larkum AW. J. Porphy-rins Phthalocyanines 2002; 6: 763–773.
48. Larkum AWD. In Chlorophylls and Bacteriochloro-phylls: Biochemistry, Biophysics, Functions and Appli-cations, Grimm B, Porra R, Rüdiger W and Scheer H. (Eds.) Springer: Dordrecht, 2006; pp 261–282 (Advances in Photosynthesis and Respiration).
49. Porra RJ and Scheer H. Photosynth. Res. 2000; 66: 159–175.
50. Raymond J and Blankenship RE. Geobiology 2004; 2: 199–203.
51. Tanaka A, Ito H, Tanaka R, Tanaka NK, Yoshida K and Okada K. Proc. Natl. Acad. Sci. USA 1998; 95: 12719–12723.
52. Tsuchiya T, Mizoguchi T, Akimoto S, Tomo T, Tamiaki H and Mimuro M. Plant Cell Physiol. 2012; 53: 518–527.
53. Dammeyer T and Frankenberg-Dinkel N. Photo-chem. Photobiol. Sci. 2008; 7: 1121–1130.
54. Schliep M, Crossett B, Willows RD and Chen M. J. Biol. Chem. 2010; 286: 28450–28456.
55. Green BR. Proc. Natl. Acad. Sci. USA 2001; 98: 2119–2121.
56. Hohmann-Marriott MF and Blankenship RE. Annu. Rev. Plant Biol. 2011; 62: 515–548.
57. Falkowski PG. In Primary Productivity and Bio-geochemical Cycles in the Sea, Falkowski PG and Woodhead AD. (Eds.) Plenum Press: New York, 1992; pp 47–67.
58. Beatty JT, Overmann J, Lince MT, Manske AK, Lang AS, Blankenship RE, Van Dover CL, Martin-son TA and Plumley FG. Proc. Natl. Acad. Sci. USA 2005; 102: 9306–9310.
59. Manske AK, Glaeser J, Kuypers MM and Overmann J. Appl. Env. Microbiol. 2005; 71: 8049–8060.
60. Ort DR, Zhu Z and Melis A. Plant Physiol. 2011; 155: 79–85.
61. Garczarek L, Hess WR, Holtzendorff J, van der Staay GWM and Partensky F. Proc. Natl. Acad. Sci. USA 2000; 97: 4098–4101.
62. Moore LR and Chisholm SW. Limnol. Oceanogr. 1999; 44: 628–638.
63. Chen M, Zhang Y and Blankenship RE. Photosyn. Res. 2008; 95: 147–154.
64. Duxbury Z, Schliep M, Ritchie RJ, Larkum AWD and Chen M. Photosynth. Res. 2009; 101: 69–75.
65. Bogorad L. Ann. Rev. Plant. Physiol. 1975; 26: 369–401. 66. Grossman AR. In Discoveries in Photosynthesis,
Vol. 20, Govindjee, Beatty JT, Gest H and Allen JF. (Eds.) Kluwer: Dordrecht, 2005; pp 959–967.
14 M. CHEN AND H. SCHEER
Copyright © 2013 World Scientific Publishing Company J. Porphyrins Phthalocyanines 2013; 17: 14–15
67. Montgomery BL. Cent. Eur. J. Biol. 2008; 3: 351–358.
68. Kehoe DM. Proc. Natl. Acad. Sci. USA 2010; 107: 9029–9030.
69. Lemeille S and Rochaix JD. Photosynth Res 2010; 106: 33–46.
70. Fiedor L, Leupold D, Teuchner K, Voigt B, Hunter CN, Scherz A and Scheer H. Biochemistry 2001; 40: 3737–3747.
71. Scholes GD and Fleming GR. Adv. Chem. Phys. 2006; 132: 57–129.
72. Van Grondelle R and Novoderezhkin VI. Phys. Chem. Chem. Phys. 2006; 8: 793–807.
73. Trinkunas G, Herek JL, Polivka T, Sundstrom V and Pullerits T. Phys. Rev. Lett. 2001; 86: 4167–4170.
74. Köhler J. In The Purple Phototrophic Bacteria, Hunter CN, Daldal F, Thurnauer MC and Beatty JT. Springer: Dordrecht, 2008; pp 877–894.
75. Laible PD, Knox RS and Owens TG. J. Phys. Chem. B 1998; 102: 1641–1648.
76. Ritz T, Damjanovic A, Schulten K, Zhang JP and Koyama Y. Photosynth. Res. 2000; 66: 125–144.
77. Vaswani HM, Holt NE and Fleming GR. Pure Appl. Chem. 2005; 77: 925–945.
78. Polivka T, Pascher T, Sundstrom V and Hiller RG. Photosynth. Res. 2005; 86: 217–227.
79. Chen M and Blankenship RE. Trends Plant Sci. 2011; 16: 427–431.
80. Cardona T and Magnuson A. Biochim. Biophys. Acta 2010; 1797: 425–433.
81. Six C, Thomas JC, Garczarek L, Ostrowski M, Dufresne A, Blot N, Scanlan DJ and Partensky F. Genome Biol 2007; 8: R259.
82. Bibby TS, Zhang YN and Chen M. PLoS ONE 2009; 4: 4601.
83. Zapata M, Garrido JL and Jeffrey SW. In Chloro-phylls and Bacteriochlorophylls: Biochemistry, Biophysics, Functions and Applications, Grimm B, Porra R, Rüdiger W and Scheer H. Springer: Dor-drecht, 2006; pp 39–53 (Advances in Photosynthe-sis and Respiration).
84. Trissl HW. Photosynth. Res. 1993; 35: 247–263. 85. Fork DC and Larkum AWD. Marine Biol. 1989;
103: 381–385. 86. Koehne B, Elli G, Jennings RC, Wilhelm C and
Trissl H. Biochim Biophys Acta 1999; 1412: 94–107.
87. Struck A, Snigula H, Rau H-K, Hörth P, Winkler D, Scheer H and Haehnel W. Budapest: Adadémiai Kiadó; 1999.
88. Chen M, Quinnell RG and Larkum AW. FEBS Lett. 2002; 514: 149–152.
89. Murakami A, Miyashita H, Iseki M, Adachi K and Mimuro M. Science 2004; 303: 1633.
90. Kühl M, Chen M, Ralph P, Schreiber U and Larkum AWD. Nature 2005; 433: 820.
91. Behrendt L, Trampe E, Larkum AWD, Norman A, Qvortrup K, Chen M, Ralph P, Sørensen SJ and Kühl M. ISME J. 2011; 5: 1072–1076.
92. Kashiyama Y, Miyashita H, Ohkubo S, Ogawa NO, Chikaraishi Y, Takano Y, Suga H, Toyofuku T, Nomaki H, Kitazato H, et al. Science 2008; 321: 658.
93. Mohr R, Voss B, Schliep M, Kurz T, Maldener I, Adams DG, Larkum AD, Chen M and Hess WR. ISME J 2010; 4: 1456–1469.
94. Miller SR, Augustine S, Olson TL, Blankenship RE, Selker J and Wood AM. Proc. Natl. Acad. Sci. USA 2005; 102: 850–855.
95. Lopez-Legentil S, Song B, Bosch M, Pawlik JR and Turon X. PLoS One 2011; 6: e23938.
96. Ohkubo S, Miyashita H, Murakami A, Takeyama H, Tsuchiya T and Mimuro M. Appl. Env. Microbiol. 2006; 72: 7912–7915.
97. De Los Ríos A, Grube M, Sancho LG and Ascaso C. FEMS Microbiol. Ecol. 2007; 59: 386–395.
98. Larkum AWD, Chen M, Li Y, Schliep M, Trampe E, West J, Salih A and Kühl M. J. Phycol. 2012: DOI:10.1111/j.1529-8817.2012.01233.x.
99. Mizoguchi T, Kim T-Y, Sawamura S and Tamiaki H. J. Phys. Chem. B 2008; 112: 16759–16765.
100. Partensky F, Blanchot J and Vaulot D. In Marine Cyanobacteria, Charpy L and Larkum A. (Eds.) Musée Océanographique: Monaco, 1999; pp 457–475.
101. Shimada K. In Anoxygenic Photosynthetic Bacte-ria, Blankenship R, Madigan MT and Bauer CE. (Eds.) Kluwer: Dordrecht, 1995; pp 105–122.
102. Yurkov V and Csotonyi JT. In The Purple Photo-trophic Bacteria, Hunter CN, Daldal F, Thurnauer MC and Beatty JT. Springer: Dordrecht, 2008; pp 31–55.
103. Klatt CG, Wood JM, Rusch DB, Bateson MM, Hamamura N, Heidelberg JF, Grossman AR, Bhaya D, Cohan FM, Kuehl M, et al. ISME J. 2011; 5: 1262–1278, S1262/1261-S1262/1266.
104. Kalyanasundaram K and Graetzel M. Curr. Op. Biotech. 2010; 21: 298–310.
105. Grätzel M. Nature 2001; 414: 338–344. 106. Shaheen SE, Ginley DS and Jabbour GE. MSR Bull.
2005; 30: 10–19. 107. Liang Y and Yu L. Polym. Rev. 2010; 50: 454–473. 108. Badescu V and Badescu AM. Renewable Energy
2009; 34: 1538–1544. 109. Shan G-B and Demopoulos GP. Adv. Mater. 2010;
22: 4373–4377. 110. Radivojevic I, Varotto A, Farley C and Drain CM.
En. Envir. Sci. 2010; 3: 1897–1909. 111. Ameri T, Dennler G, Lungenschmied C and Brabec
CJ. En. Envir. Sci. 2009; 2: 347–363. 112. Sista S, Hong Z, Park M-H, Xu Z and Yang Y. Adv.
Mater. 2009; 21: E1-E4.

EXTENDING THE LIMITS OF NATURAL PHOTOSYNTHESIS AND IMPLICA TIONS FOR TECHNICAL LIGHT HARVESTING 15
Copyright © 2013 World Scientific Publishing Company J. Porphyrins Phthalocyanines 2013; 17: 15–15
113. Janssen RAJ, Gilot J and Wienk MM. Adv. Mater. 2010; 22: E67-E71.
114. Emerson R. Ann. Rev. Plant Physiol. 1958; 9: 1–24. 115. Schreiber U. In Fluorescence: A Signature of Pho-
tosynthesis, Papageorgiou CC and Govindjee (Eds.) Springer: Dordrecht, 2004; pp 279–319.
116. Gilot J, Wienk MM and Janssen RAJ. Org. Electr. 2011; 12: 660–665.
117. Richter T and Fukshansky L. Photochem. Photo-biol. 1998; 68: 337–352.
118. Goldschmidt JC and Peters M. Prax. Naturwiss., Chem. Sch. 2010; 59: 23–25.
119. Martinez-Diáz MV, de la Torre G and Torres T. Chem. Comm. 2010; 46: 7090–7108.
120. Mackowski S, Wörmke S, Maier AJ, Brotosudarmo THP, Harutyunyan H, Hartschuh A, Gogorov AO, Scheer H and Bräuchle C. Nano Lett. 2008; 8: 558–564.
121. Kiang NY, Siefert J, Govindjee and Blankenship RE. Astrobiology 2007; 7: 222–251.

Journal of Porphyrins and PhthalocyaninesJ. Porphyrins Phthalocyanines 2013; 17: 16–26
DOI: 10.1142/S108842461230011X
Published at http://www.worldscinet.com/jpp/
Copyright © 2013 World Scientific Publishing Company
INTRODUCTION
The utilization of light energy has provided many promising applications in medical field because lights can penetrate biological tissues with or without damaging bio-organism depends on its power and wavelength. Because light with high power and appropriate wavelength can effectively and selectively damage target tissue, several less-invasive phototherapies have been developed for the treatment of malignant tumor tissue. Photodynamic therapy (PDT) is one of the promising technologies for the treatment of malignant tumor tissue due to the less-invasiveness [1–9]. PDT involves photochemical reactions of photosensitizers (PS) which are administrated by systemic delivery prior to laser irradiation [4]. Unlike other phototherapies, PDT utilizes low energy photon to induce selective excitation of PSs without photothermal damages onto the pathway of light [3, 4]. The excited PS transfers its excitation energy or electron to oxygen molecules to generate highly toxic reactive oxygen species (ROS), which eventually destroys the target tumor tissue [1, 2, 10–12]. Therefore, the selective accumulation of
PSs onto the target tissue is greatly important for the successful PDT. The target specific drug delivery is one of the major goals of nanotechnology in biomedical field [13]. In this context, various nanotechnology-based PDT have been investigated for the site selective PS delivery. And also, the combination of PDT with nanotechnology would provide multifunctional platforms for cancer therapy. Herein, we are going to briefly review recent advances in nanotechnology-based PDT, which include the combination of PSs with platform of organic, inorganic, and organic-inorganic hybrid nanoparticles.
NANOTECHNOLOGY-BASED DELIVERY OF PHOTOSENSITIZERS
Most of conventional PSs have minimum cytotoxicity under dark condition, thus selective light irradiation to target tissue provides less-invasive ways to treat solid tumors. However, non-selective distribution of PSs often produces serious problems to patients by means of hypersensitivity against daily light exposure [3, 14]. As afore mentioned, the selective delivery of PSs onto the target tissue is one of the major goals of nanotechnology-based PDT. For the selective delivery of PSs, several kinds of nano-sized drug delivery vehicles, such as polymeric micelles [15–30], liposomes [31–37], and nanoparticles
Nanotechnology-based photodynamic therapy
Hee-Jae Yoon and Woo-Dong Jang*
Department of Chemistry, Yonsei University, 50 Yonsei-ro, Seodaemun-gu, Seoul 120-749, Korea
Received 5 October 2012Accepted 21 November 2012
ABSTRACT: According to recent advances in nanotechnology, various nano-sized formulations have been designed for the application in biomedical fields, including diagnosis, drug delivery, and therapeutics. The nanotechnology-based formulations have a great merit in the design of multifunctional platform for the biomedical applications. Therefore, recent trends in nanotechnology are moving onto the combination of nanotechnology and conventional therapeutic. Typically, photodynamic therapy (PDT) is one of promising techniques for the combination with nanotechnology owing to its less invasiveness. In this paper, we are going to briefly review recent advances in nanotechnology-based PDT, including selective delivery and excitation of photosensitizers, combination therapy, and multifunctional PDT.
KEYWORDS: nanotechnology, nano-devices, photodynamic therapy (PDT), bio-imaging, selective delivery.
SPP full and student member in good standing
*Correspondence to: Woo-Dong Jang, email: [email protected], tel: +82 2-2123-5636, fax: +82 2-364-7050

NANOTECHNOLOGY-BASED PHOTODYNAMIC THERAPY 17
Copyright © 2013 World Scientific Publishing Company J. Porphyrins Phthalocyanines 2013; 17: 17–26
[38–42], have been utilized. Those nano-carrier systems have a great advantage in the tumor specific delivery by means of enhanced permeation and retention (EPR) effect [43–45]. Moreover, the introduction of targeting ligands onto the surface of the nano-carrier systems would provide active targeting to the specific tissue [37]. Because a great diversity of nano-carrier systems has
been utilized for PS delivery, it is unable to introduce all of them. Therefore, we are going to briefly introduce here only limited examples.
Liposomes would be the most popular nano-carrier systems for the delivery of PSs due to its high loading capacity and flexibility for modification [31, 45]. For instance, the photofrin modulated in liposome exhibited significantly high photodynamic efficacy against a human glioma implanted in rat brain compared to photofrin only. As a commercial product of liposomal PSs, Visudyne® containing verteporfin, benzoporphyrin derivative monoacid ring, has been approved for the treatment of age-related macular degeneration (AMD), which caused by abnormal choroidal neovascularization [47]. Although the liposomal formulation has several advantages, the high stability of liposomal formulation deters tumor-selectivity. Hence, recent studies are focused on the long-circulating and specifically tumor-targeted liposomes. Oku’s group have been studied several types of PSs-encapsulated liposomes, especially polycation liposomes (PCLs) for antiangiogenic PDT [33–36]. Antiangiogenic PDT represents treatment of neovascular tubes to cut-off of oxygen and nutrients to the malignant tissue for the inducement of tumor cell necrosis [33, 48–49]. For the effective angiogenic tissue targeting, the liposomes were modified with angiogenic tumor site targeting oligopeptide [36]. By the modification of PCLs, the significantly improved vascular damages were observed after modified PCLs (0.5 mg/kg in terms of PSs) were injected to dorsal air sac-model mice. This result would be a good example for the improvement of disadvantages in liposomal formulations.
Polymeric micelles have attracted great attention for the effective delivery of hydrophobic drugs to malignant tumor tissues. Because most of PSs have hydrophobic nature, polymeric micelles would be one of the best candidates for PS delivery. However, PSs easily form aggregates in aqueous media to result in
collisional quenching at high concentration typically in micellar core [28, 50–52]. This would be a drawback for the utilization of polymeric micelle in PSs delivery. As a solution for the collisional quenching, ionic dendrimer PSs have been utilized to form polyion complex (PIC) micelles via electrostatic interaction with appositely charged hydrophilic block copolymers, such as poly(ethylene glycol)-block-(L-lysine) copolymer
Type I reaction
Type II reaction
Electron Transfer
Intersystemcrossing
Ph
osp
ho
resc
ence
En
erg
y T
ran
sfer
Ab
sorp
tio
n
Flu
ore
scec
ne
O2
O2-
1O2
3O2
τ = ~ 10-6 s
τ = ~ 10-2 s
S1
S0
T1
Fig. 1. Photodynamic process
Fig. 2. Schematic mechanism of antiangiogenic PDT (reproduced with permission from Ref. 48)

18 H.-J. YOON AND W.-D. JANG
Copyright © 2013 World Scientific Publishing Company J. Porphyrins Phthalocyanines 2013; 17: 18–26
(PEG-b-PLL) [25–30, 53]. Because the large dendritic wedges can effectively prevent the aggregation of core PS units, the dendritic PS-loaded PIC micelles do not exhibit decrease of photodynamic efficacy compare to free dendritic PSs. The toxicities of dendrimer PSs and dendrimer PSs-loaded micelles were negligible under dark condition. However, dendrimer PS-loaded micelles exhibited hundred times higher photocytotoxicity than free dendrimer PS. The remarkably enhanced photocytotoxicity of micellar system can be merits for biological application. From the result of in vivo experiments, dendrimer PS-loaded PIC micelles (1.5 mg/mL in terms of dendritic PSs) exhibited successful PDT effect against several model animals, including AMD, corneal neovascularization, and tumors [26, 29, 53]. Furthermore, the dendrimer PS-loaded PIC micelles exhibited minimum skin toxicity compare to
other conventional PSs under white light irradiation due to the decrease of non-selective accumulation onto the skin tissue [29].
Nanoparticles such as organic, inorganic, organic–inorganic hybrid nanoparticles also have been utilized as the multifunctional platform for selective PS delivery [38, 39]. The nanoparticles can be tailored in their composition to avoid enzymatic degradation, thus effectively protecting the encapsulated PSs. They can also be designed to be resistant to microbial attack. And the surface of nanoparticles can be functionalized to attach targeting groups to vascular compartments or to cellular sites
expressing appropriate receptors. Especially, the high stability of inorganic nanoparticles against temperature and pH changes would be the most advantageous point for the immobilization of PSs. Furthermore, recent advances in the synthetic chemistry enabled us the control of size, shape, porosity, and size-distribution of the inorganic nanoparticles. Owing to the large surface area, a great number of PSs can be immobilized onto the surface as well as the inner space of porous structure [38, 41]. The large numbers of PSs would generate high concentration of singlet oxygen, which can be rapidly diffused through the porous structure. In fact, nanoparticles for PDT or imaging are still in its infancy and much remains to be modified. However, recent studies of a target-specific multifunctional nanoparticle for imaging and PDT showed a significantly improved therapeutic efficacy when compared with a nonspecific nanoparticle in an animal model. Furthermore, a contrast agent can be incorporated into the core of the
Fig. 3. Formation of polyion complex (PIC) micelle
Fig. 4. Design of inorganic magnetic nanoparticle for biological applications (reproduced with permission from Ref. 39)

NANOTECHNOLOGY-BASED PHOTODYNAMIC THERAPY 19
Copyright © 2013 World Scientific Publishing Company J. Porphyrins Phthalocyanines 2013; 17: 19–26
nanoparticles for application in bio-imaging. Because the nanoparticles can have higher extinction coefficients than organic dyes, the light activation and optical probing can readily be accomplished. And they are more photostable than organic dyes for in vivo applications. As a typical example, Lai et al. designed a core-shell type inorganic nanoparticle that composed of Fe3O4 core and SiO2 shell with Ir(III) complex functionalization [54]. This core-shell type nanoparticle can be utilized as the probe for magnetic resonance imaging (MRI) using Fe3O4 core [39]. Furthermore, the SiO2 shell can be utilized for the phosphorescence imaging and singlet oxygen generation, because the Ir(III) complex functions as phosphorescent probe as well as PS for singlet oxygen generation. It was confirmed that almost cells were viable even after incubation with 100 mg/mL of Fe3O4/SiO2 (Ir). Through the MRI, the bio-imaging has been carried out to confirm the cellular uptake of nanoparticles even at the lowest concentration (6.25 mg/mL). Also, the photoinduced apoptosis of HeLa cells were observed by
PDT using 366 nm light irradiation after treatment with the nanoparticles. However, the main drawback of this system would be the low light penetration into the tissue due to the strong absorption of melanine dyes in skin tissues and bloods. For the effective light delivery, long wavelength absorption of PSs would be greatly important issue. It would be discussed in the next section about the long wavelength light absorption and selective excitation of PSs. Although the effective delivery of PSs to the target tissue is significantly important issue, current researches on this field are moving on the design of not only the effective carrier for PS delivery but also multi-functional nano-devices.
SELECTIVE EXCITATION OF PHOTO-SENSITIZERS
The nanotechnology-based approaches provided great advantages for the selective delivery of PSs.
Fig. 6. Targeting specific cellular function-sensitive linkages. An inactive PS prodrug is taken up in all cells but only activated by certain enzymes expressed in target cells. The target cells containing the active PS are killed upon light irradiation (reproduced with permission from Ref. 55)
Fig. 5. TEM images of (a) Fe3O4 and (b) Fe3O4/SiO2(Ir) nanoparticles; insets: histograms of particle diameters (reproduced with permission from Ref. 54)

20 H.-J. YOON AND W.-D. JANG
Copyright © 2013 World Scientific Publishing Company J. Porphyrins Phthalocyanines 2013; 17: 20–26
In addition to the advantages of selective delivery, nanotechnology-based approaches provide us much effective possibility for the selective excitation of PSs under specific conditions [55]. As already mentioned above, the incorporation of PSs into nano-carriers induces collisional quenching of excited state of PSs. To overcome this drawback, dendritic PSs have been utilized [29, 56]. Alternatively, the collisional quenching can be actively utilized for the selective excitation. Polymeric PS prodrugs have been designed by the conjugation of PS to poly-L-Lysine via epsilon-amide links for the application in cancer treatment as well as diagnosis [57]. The high concentration of PSs onto the polymer chain causes collisional quenching of the excitation state [58]. However, the fragmentation of polymer backbone by trypsin digestion induces the fluorescence enhancement and effective generation of ROSs upon light irradiation. The enzymatic activation of fluorescence enhancement and photoinduced cytotoxicity were evaluated through in vitro and ex vivo studies. This strategy was further developed to protease specific activation system using protease specific oligopeptide sequences as the tethering groups of the PSs to the polymer backbone. For the application of this strategy, the finding of cancer specific protease would be very important.
Recently, Lee et al. developed a polymeric system for selective excitation of PSs in tumor tissue [59–61]. To a glycol chitosan polymer, 3-diethylaminopropyl isothiocyanate (DEAP), chlorine e6 (Ce6), and poly(ethylene glycol) were introduced as pH-sensitive, photosensitizing, and biocompatible parts, respectively [59]. Because the pKb value of glycol chitosan polymer with DEAP units is about 6.8, the polymer self-assembled into micellar structure at pH = 7.4, where the hydrophilic PEG chains form corona, and DEAP and Ce6 forms hydrophobic inner core. In this condition, the PS units Ce6 cannot generate ROS due to the collisional quenching. However, when the pH was lower than 6.8, the DEAP units change to hydrophilic state due to their protonation. Thus, the polymer backbone become soluble in aqueous media, thereby the Ce6 can generate ROS under light irradiation. Because the extracellular pH value in most clinical tumors is more acidic (pH = 6.5–7.0) than in normal tissues (ca. pH = 7.4), the Ce6 bounded in polymer can generate ROS only in tumor sites. The higher levels of apoptosis for HeLa cells was occurred at pH = 6.8 and 6.4 than at pH = 7.4, while no cytotoxic effects was exhibited when the polymer conjugates treated to HeLa cells up to 200 mg/mL over 24 h. And in vivo fluorescent images of nude mice were clearly obtained after the polymer conjugates (equivalent Ce6 0.1 mg/kg body) were administered. More recently, they developed tumor-homing polypeptides bearing charge convertible functional groups and Ce6 to target acidic tumor sites [60]. The high-resolution fluorescent images were obtained of the in vivo tumor site, even when a small quantity of polypeptides (equivalent Ce6
0.12 mg/kg body) were injected to the nude mice. In the physiological pH condition, the polypeptide bearing nanoparticles maintain its original negative surface charge, but the negative surface charge readily changes to positive charge under mild acidic condition. After the changes of surface charge, the positively charged polymers can strongly be associated with cellular membrane through the electrostatic interaction. Therefore, the nanopaticles can be selectively accumulated onto the mild acidic tumor sites.
In relation to the PDT mechanism, many efforts have been paid for the improvement of physical and chemical properties of PSs. Ideal PSs should have long wavelength absorption for the effective light penetration to tissue. Also, the improvement of singlet oxygen quantum yield has been tried through the nanotechnology-based approach.
Two-photon absorption (TPA) induced excitation of PSs is promising method to increase the light penetration into solid tissue [62–64]. The treatment of deep tumor lesions with enhanced spatial resolution would theoretically be possible by the utilization of TPA excitation. Gao et al. demonstrated the development of polyacrylamide-based nanoparticles encapsulating porphyrin derivative, and the photocytoxicity of nanoparticles induced by infrared light irradiation was confirmed through in vitro evaluation [65]. However, TPA-based PDT is limited because most PSs have low efficiencies of two-photon light absorption. To increase the efficiency of TPA-based PDT, Frechet et al. have developed dendrimers having focal porphyrin with large numbers of peripheral dyes having large TPA cross-section [66]. The peripheral dyes efficiently absorb near-infrared light and emit visible fluorescence, which excite focal porphyrin units to generate ROS. Kim et al. have designed several PS-integrated organic or organic/inorganic hybrid nano-devices for enhancing the photosensitization-related photophysical properties like two-photon light absorptivity [40, 67, 68]. Through the co-encapsulation of PSs and dyes having large TPA cross-section into modified silica nanoparticles, the excitation energy transfer taken place from dyes to PSs [40].
As another approach, Zhang et al. have designed a new type of nanoparticles based on so-called “photon upconverting nanoparticles” [69]. The photon upconverting property is a kind of nonlinear optics which produces the emission at a shorter wavelength through multistep excitation. Because some nanoparticles can emit visible light through upconversion process, it allows the excitation of PSs after the near-infrared light absorption through the energy transfer process. NaYF4:Yb3+, Eu3+ nanoparticles can be utilized for this application due to their efficient photon upconverting abilities.
COMBINATION CANCER THERAPY
Combination of PDT with other therapeutics also provides great opportunities to overcome malignant
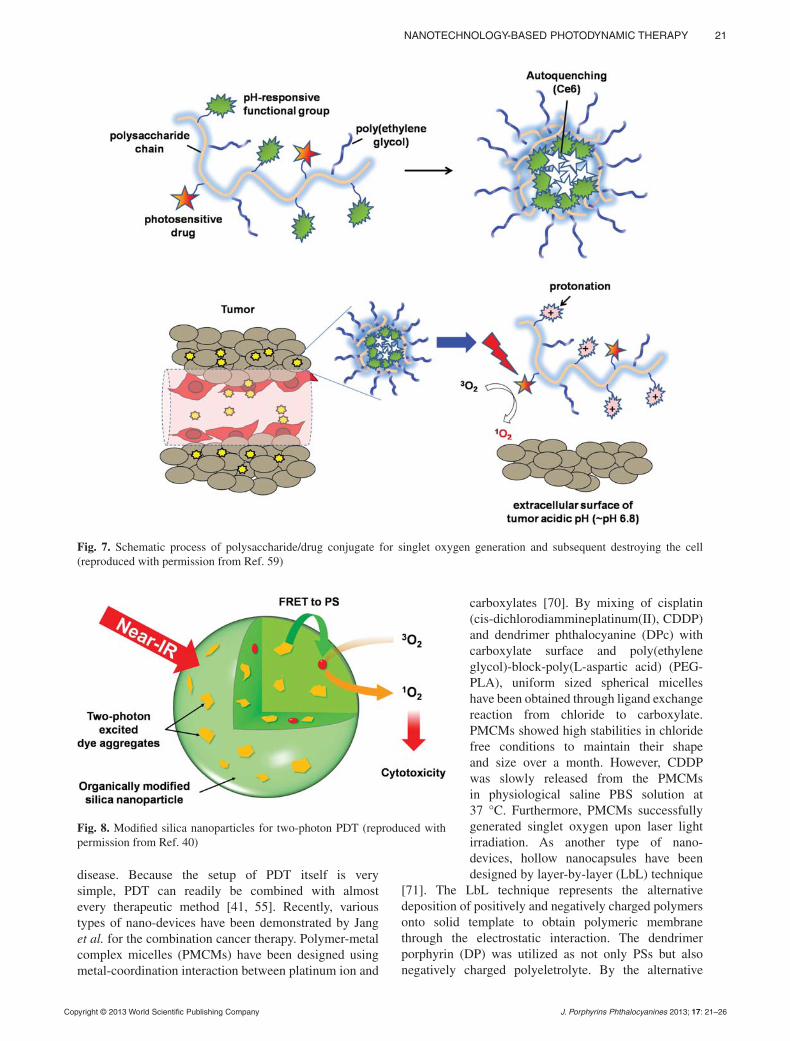
NANOTECHNOLOGY-BASED PHOTODYNAMIC THERAPY 21
Copyright © 2013 World Scientific Publishing Company J. Porphyrins Phthalocyanines 2013; 17: 21–26
disease. Because the setup of PDT itself is very simple, PDT can readily be combined with almost every therapeutic method [41, 55]. Recently, various types of nano-devices have been demonstrated by Jang et al. for the combination cancer therapy. Polymer-metal complex micelles (PMCMs) have been designed using metal-coordination interaction between platinum ion and
carboxylates [70]. By mixing of cisplatin (cis-dichlorodiammineplatinum(II), CDDP) and dendrimer phthalocyanine (DPc) with carboxylate surface and poly(ethylene glycol)-block-poly(L-aspartic acid) (PEG-PLA), uniform sized spherical micelles have been obtained through ligand exchange reaction from chloride to carboxylate. PMCMs showed high stabilities in chloride free conditions to maintain their shape and size over a month. However, CDDP was slowly released from the PMCMs in physiological saline PBS solution at 37 °C. Furthermore, PMCMs successfully generated singlet oxygen upon laser light irradiation. As another type of nano-devices, hollow nanocapsules have been designed by layer-by-layer (LbL) technique
[71]. The LbL technique represents the alternative deposition of positively and negatively charged polymers onto solid template to obtain polymeric membrane through the electrostatic interaction. The dendrimer porphyrin (DP) was utilized as not only PSs but also negatively charged polyeletrolyte. By the alternative
Fig. 7. Schematic process of polysaccharide/drug conjugate for singlet oxygen generation and subsequent destroying the cell (reproduced with permission from Ref. 59)
Fig. 8. Modified silica nanoparticles for two-photon PDT (reproduced with permission from Ref. 40)

22 H.-J. YOON AND W.-D. JANG
Copyright © 2013 World Scientific Publishing Company J. Porphyrins Phthalocyanines 2013; 17: 22–26
deposition of poly(allylaminehydrochloride) (PAH) and DP onto negatively charged polystyrene (PS) nanoparticles with subsequent removal of template core, stable hollow nanocapsules were successfully obtained. The stepwise formation of multi-layer shell was monitored by -potential changes of particles after each deposition step. Because the hollow nanocapsules exhibited very high stability with large inner cavity, doxorubicin hydrochloride (DOX) has been introduced into the inner cavity of nanocapsules by diffusion method and successive crosslinking reaction. The cell viability studies revealed that combined treatment exerted higher toxicity than either chemotherapy or PDT alone.
Another interesting nanoparticle system for combination cancer therapy has been designed by Chen et al. [72] They have utilized scintillation luminescent nanoparticles as a substrate for the PS immobilization. PSs can be immobilized onto various doped scintillation nanoparticles (LaF3:Ce3+, LuF3:Ce3+, CaF2:Mn2+, CaF2:Eu2+, BaFBr:Eu2+, BaFBr:Mn2+, and CaPO4:Mn2+), as well as semiconductor nanoparticles (ZnO, ZnS, TiO2). Upon the ionizing radiation, the scintillation nanoparticles can illuminate visible light, which can be absorbed by PSs to generate ROS. The utilization of scintillation nanoparticles has several advantages compared to applying radiation therapy or PDT alone; simple and less expensive method because radiotherapy and PDT are activated by a single light source. Furthermore, the high energy radiation can be utilized for deeper tissue, and radiation doses can be reduced. Combination with hyperthermia also has tried by the combination of PSs with magnetic nanoparticles [73].
FUNCTIONAL PHOTODYNAMIC THE-RAPY
As a promising application of PSs, photodynamic diagnosis (PDD) often utilized to detect cancerous
tissue [41, 74–77]. Typically, in vivo generation of protoporphyrin IX by 5-aminolevulinic (ALA) administration is currently utilizing as the marker for cancerous tissue in brain surgery [78, 79]. The combination of diagnosis and PDT will give synergetic effects for the successful and selective treatment of malignant tumors. Radio-labeled photosensitizers and MRI contrast agent-conjugated photosensitizers have been demonstrated as multifunctional probes, which can be utilized as the probes for fluorescence imaging, positron emission tomography (PET), and MRI for the effective PDT [41, 74, 75]. Zheng and coworkers have designed a novel fibroblast activation protein (FAP)-triggered photodynamic molecular beacon (FAB-PPB) as therapeutic probe with dual function [80]. FAB-PPB was synthesized by combining pyropheo phorbide a acid, a fluorescent PS, with a peptide sequence (TSGPNQEQK) specific to FAP. FAP-PPB has high specificity to human FAP and mFAP both, but not other proteases, because FAP is overexpressed on cancer-associated fibroblasts of human epithelial carcinomas but not on normal fibroblasts, normal tissues, and cancer cells. The activation of FAP-PPB was observed in FAP-transfected cancer cells and in vivo (25 nmol FAP-PPB was injected to mice) using HEK-mFAP and HEK-vector xenografts, which indicate that FAB-PPB is highly specific to FAP and can serve as an excellent fluorescent probe for the detection of FAP, both in vitro and in vivo. Moreover, the photocytotoxicity of FAB-PPB in HEK-mFAP cells was confirmed. Therefore, the probe can utilized as both a tumor specific diagnostic agent and a directed PDT agent.
Photochemical internalization (PCI) is a novel technology for specific delivery of various therapeutic molecules, such as drugs, proteins, and genes into the cytosol of target cells [81–89]. The mechanism of PCI is based on the light activation of photosensitizer specifically localized in the membrane of endocytic vesicles, and subsequent breakdown of the endosomal/lysosomal
Fig. 9. Fabrication of multilayered hollow nanocapsules for combination cancer therapy (reproduced with permission from Ref. 71)
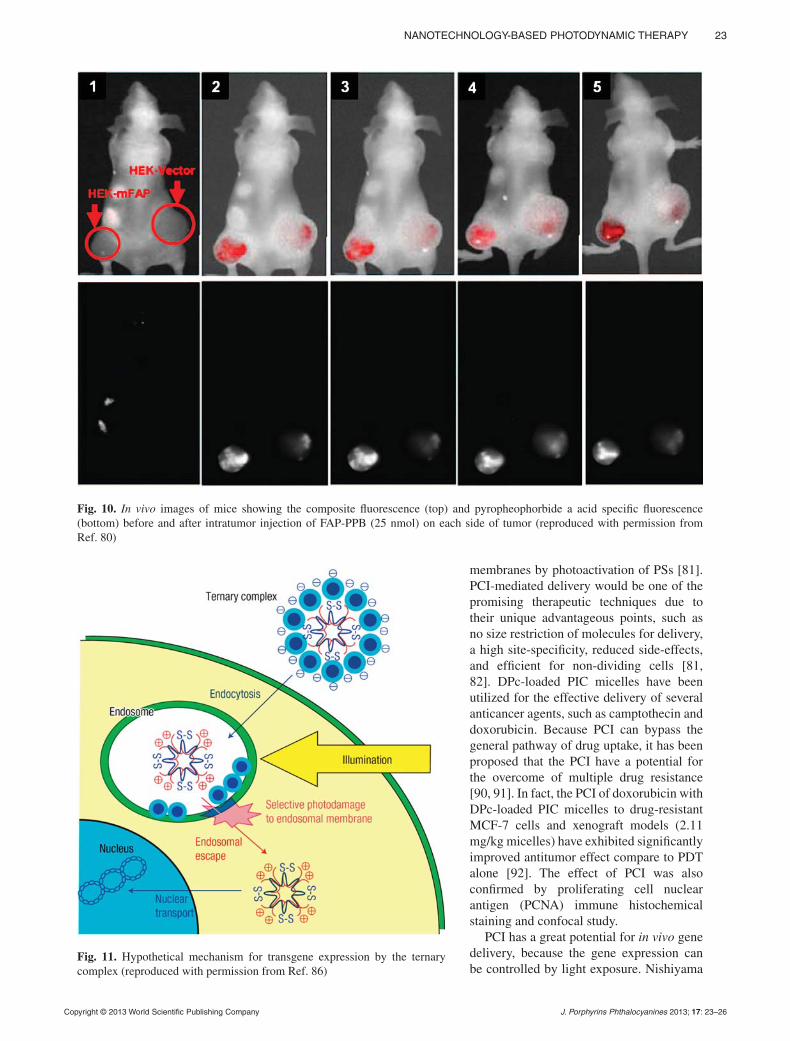
NANOTECHNOLOGY-BASED PHOTODYNAMIC THERAPY 23
Copyright © 2013 World Scientific Publishing Company J. Porphyrins Phthalocyanines 2013; 17: 23–26
membranes by photoactivation of PSs [81]. PCI-mediated delivery would be one of the promising therapeutic techniques due to their unique advantageous points, such as no size restriction of molecules for delivery, a high site-specificity, reduced side-effects, and efficient for non-dividing cells [81, 82]. DPc-loaded PIC micelles have been utilized for the effective delivery of several anticancer agents, such as camptothecin and doxorubicin. Because PCI can bypass the general pathway of drug uptake, it has been proposed that the PCI have a potential for the overcome of multiple drug resistance [90, 91]. In fact, the PCI of doxorubicin with DPc-loaded PIC micelles to drug-resistant MCF-7 cells and xenograft models (2.11 mg/kg micelles) have exhibited significantly improved antitumor effect compare to PDT alone [92]. The effect of PCI was also confirmed by proliferating cell nuclear antigen (PCNA) immune histochemical staining and confocal study.
PCI has a great potential for in vivo gene delivery, because the gene expression can be controlled by light exposure. Nishiyama
Fig. 10. In vivo images of mice showing the composite fluorescence (top) and pyropheophorbide a acid specific fluorescence (bottom) before and after intratumor injection of FAP-PPB (25 nmol) on each side of tumor (reproduced with permission from Ref. 80)
Fig. 11. Hypothetical mechanism for transgene expression by the ternary complex (reproduced with permission from Ref. 86)

24 H.-J. YOON AND W.-D. JANG
Copyright © 2013 World Scientific Publishing Company J. Porphyrins Phthalocyanines 2013; 17: 24–26
et al. have demonstrated the ternary complex system composed of plasmid DNA, quadruple cationic Tat peptide (CP4), and DPc for gene delivery [86]. This ternary complex enhanced transgene expression in vitro more than 100-fold after light irradiation, with minimum photocytotoxicity. In the animal study, the ternary complex was injected to subconjunctival area in rats, and semiconductor laser (689 nm) was irradiated. As a result, the selective gene expression onto the light exposed area has been confirmed by means of yellow fluoresce protein expression.
CONCLUSION
In this paper, we have briefly reviewed recent approaches for nanotechnology-based photodynamic therapy. Although the PDT have been developed as an alternative way to surgery for the treatment of malignant tumors, recent nanotechnology-based development provide us wide ranges of applications as well as a promising multifunctional platform for cancer treatment. Although the clinical application of PDT is still very limited compare to other therapeutic ways, recent advances in PDT technologies may enable the substitution of traditional therapeutic ways to less invasive nanotechnology-based PDT because modern society is emphasizing on the quality of life.
Acknowledgements
This work was supported by the Defense Acquisition Program Administration (DAPA), the Agency for Defense Development (ADD) through the Defense Nano Technology Application Center (DN43) and the National Research Foundation (NRF) Grant (No. 2012005565) funded by Korea Government (MEST).
REFERENCES
1. Dolmans DEJGJ, Fukumura D and Jain RK. Nat. Rev. Cancer 2003; 3: 380.
2. Dougherty TJ, Gomer CJ, Henderson BW, Jori G, Kessel D, Korbelik M, Moan J and Peng Q. J. Natl. Cancer Inst. 1998; 90: 889.
3. Macdonald IJ and Dougherty TJ. J. Porphyrins Phthalocyanines 2001; 5: 105.
4. Fisher AMR, Mulphree AL and Gomer CJ. Lasers Surg. Med. 1996; 17: 2.
5. Palumbo G. ExpertOpin. Drug Deliv. 2007; 4: 131. 6. Juarranz A, P. Sanz-Rodríguez JF, Cusvas J and
González S. Clin. Transl. Oncol. 2008; 10: 148. 7. Sharman WM, Allen CM and Lier JE. Drug Discov.
Today 1999; 4: 507. 8. McCaughan JM Jr. Drug Aging 1999; 15: 49. 9. Veenhuizen RB, Ruevekamp MC, Oppelaar H,
Helmerhorst TJM, Kenemans P and Stewart FA. Int. J. Cancer 1997; 73: 230.
10. Castano AP, Mroz P and Hamblin MR. Nat. Rev. Cancer 2006; 6: 535.
11. Saji H, Song W, Furumoto K, Kato H and Engleman EG. Clin. Cancer Res. 2006; 12: 2568.
12. Castano AP, Mroz P, Wu MX and Hamblin MR. Proc. Natl. Acad. Sci. USA 2008; 105: 5495.
13. Ferrari M. Nat. Rev. Cancer 2005; 5: 161. 14. Orenstein A, Kostenich G, Roitman L, Shechtman
Y, Kopolovic Y, Ehrenberg B and Malik Z. Br. J. Cancer 1996; 73: 937.
15. Hofman J, Carstens MG, Zeeland F, Helwig C, Flesch FM, Hennink WE and Nostrum CF. Pharm. Res. 2008; 25: 2065.
16. Peng C, Shieh M, Tsai M, Chang C and Lai P. Bio-materials 2008; 29: 3599.
17. Skidan I, Dholakia P and Torchilin V. J. Drug Tar-get. 2008; 16: 486.
18. Li B, Moriyama EH, Li F, Jarvi MT, Allen C and Wilson BC. Photochem. Photobiol. 2007; 83: 1505.
19. Iyer AK, Greish K, Seki T, Okazaki S, Fang J, Takeshita K and Maeda H.J. Drug Target. 2007; 15: 496.
20. Van Nostrum CF. Adv. Drug Deliv. Rev. 2004; 56: 9. 21. Le Garrec D, Taillefer J, Van Lier JE, Lenaerts V
and Leroux L. J. Drug Target. 2002; 10: 429. 22. Stapert HR, Nishiyama N, Jiang D, Aida T and
Kataoka K. Langmuir 2000; 16: 8182. 23. Zhang G, Harada A, Nishiyama N, Jiang D, Koyama
H, Aida T and Kataoka K. J. Control. Release 2003; 93: 141.
24. Zhang G, Nishiyama N, Harada A, Jiang D, Aida T and Kataoka K. Macromolecules 2003; 36: 1304.
25. Jang W, Nishiyama N, Zhang G, Harada A, Jiang D, Kawauci S, Morimoto Y, Kikuchi M, Koyama H, Aida T and Kataoka K. Angew. Chem. Int. Ed. 2005; 44: 419.
26. Ideta R, Tasaka F, Jang W, Nishiyama N, Zhang G, Harada A, Yanagi Y, Tamaki Y, Aida T and Kataoka K. Nano Lett. 2005; 5: 2426.
27. Jang W, Nakagishi Y, Nishiyama N, Kawauchi S, Morimoto Y, Kikuchi M and Kataoka K. J. Control. Release 2006; 113: 73.
28. Li Y, Jang W, Nishiyama N, Kishimura A, Kawauchi S, Morimoto Y, Miake S, Yamashita T, Kikuchi M, Aida T and Kataoka K. Chem. Mater. 2007; 19: 5557.
29. Nishiyama N, Nakagishi Y, Morimoto Y, Lai P, Miyazaki K, Urano K, Horie S, Kumagai M, Fuku-shima S, Cheng Y, Jang W, Kikuchi M and Kataoka K. J. Control. Release 2009; 133: 245.
30. Herlambang S, Kumagai M, Nomoto T, Horie S, Fukushima S, Oba M, Miyazaki K, Morimoto Y, Nishiyama N and Kataoka K. J. Control. Release 2011; 155: 449.
31. Derycke ASL and de Whitte PAM. Adv. Drug Deliv. Rev. 2004; 56: 17.
32. Gijsens A, Derycke A, Missiaen L, Vos DD, Huwy-ler J, Eberle A and de Witte P. Int. J. Cancer 2002; 101: 78.

NANOTECHNOLOGY-BASED PHOTODYNAMIC THERAPY 25
Copyright © 2013 World Scientific Publishing Company J. Porphyrins Phthalocyanines 2013; 17: 25–26
33. Oku N, Saito N, Namba Y, Tsukada H, Dolphin D and Okada S. Biol. Pharm. Bull. 1997; 20: 670.
34. Maeda N, Takeuchi Y, Takada M, Sadzuka Y, Namba Y and Oku N. J. Control. Release 2004; 100: 41.
35. Takeuchi Y, Ichikawa K, Yonezawa S, Kurohane K, Koishi T, Nango M, Namba Y and Oku N. J. Con-trol. Release 2004; 97: 231.
36. Ichikawa K, Hikita T, Maeda N, Yonezawa S, Takeuchi Y, Asai T, Namba Y and Oku N. Biochim. Biophys. Acta 2005; 1669: 69.
37. Zeballos NCL, Vior MCG, Awruch G and Dicelio LE. J. Photoch. Photobiol. A 2012; 235: 7.
38. Ryu JH, Koo H, Sun I, Yuk SH, Choi K, Kim K and Kwon IC. Adv. Drug Deliv. Rev. 2012; 64: 1447.
39. Sun C, Lee JSH and Zhang M. Adv. Drug Deliv. Rev. 2008; 60: 1252.
40. Kim S, Ohulchanskyy TY, Pudavar HE, Pandey RK and Prasad PN. J. Am. Chem. Soc. 2007; 129: 2669.
41. Allison RR, Mota HC, Bagnato VS and Sibata CH. Photodiagn. Photodyn. 2008; 5: 19.
42. Bechet D, Couleaud P, Frochot C, Viriot M, Guil-lemin F and Barberi-Heyob M. Trends Biotechnol. 2008; 26: 612.
43. Matsumura Y and Maeda H. Cancer Res. 1986; 46: 6387.
44. Maeda M and Matsumura Y. Crit. Rev. Ther. Drug Carr. Syst. 1989; 6: 193.
45. Maeda H, Sawa T and Konno T. J. Control. Release 2001; 74: 47.
46. Schroeder A, Heller DA, Winslow MM, Dahlman JE, Pratt GW, Langer R, Jacks T and Anderson DG. Nat. Rev. Cancer 2012; 12: 39.
47. Zacks DN, Ezra E, Terada Y, Micband N, Connolly E, Gragoudas ES and Miller JW. Invest. Ophthal. Vis. Sci. 2002; 43: 2384.
48. Olivo M, Bhuvaneswari R, Lucky SS, Dendukuri S and Thong PS. Pharmaceuticals 2010; 3: 1507.
49. Weiss A, Van den Bergh H. Griffioen AW and Nowak-Sliwinska P. Biochim. Biophys. Acta 2012; 1826: 53.
50. Smith GJ. Photochem. Photobiol. 1985; 41: 123. 51. Bennet LE, Chiggino KP and Henderson RW. J.
Photochem. Photobiol. B 1988; 3: 81. 52. Cauchon H, Tian H, Langlois R, Madeleine CL,
Martin S, Ali H, Hunting D and van Lier JE. Bio-conjugate Chem. 2005; 16: 80.
53. Sugisaki K, Usui T, Nishiyama N, Jang W, Yanagi Y, Yamagami S, Amano S and Kataoka K. Invest. Ophth. Vis. Sci. 2008; 49: 894.
54. Lai C, Wang Y, Lai C, Yang M, Chen Y, Chou P, Chan C, Chi Y, Chen Y and Hsiao J. Small 2008; 4: 218.
55. Verma S, Watt GM, Mai Z and Hasan T. Photochem. Photobiol. 2007; 83: 996.
56. Nishiyama N, Stapert HR, Zhang G, Takasu D, Jiang D, Nagano T, Aida T and Kataoka K. Biocon-jugate Chem. 2003; 14: 58.
57. Choi Y, Weissleder R and Tung C. Chem. Med. Chem. 2006; 1: 698.
58. Campo MA, Gabriel D, Kucera P, Gurny R and Lange N. Photochem. Photobiol. 2007; 83: 958.
59. Park SY, Baik HJ, Oh YT, Oh KT, Youn YS and Lee ES. Angew. Chem. Int. Ed. 2011; 50: 1644.
60. Oh NM, Kwag DS, Oh KT, Youn YS and Lee ES. Biomaterials 2012; 33: 1884.
61. Kwaga DS, Oh NM, Oh YT, Oh KT, Youn YS and Lee ES. Int. J. Pharm. 2012; 431: 204.
62. Fisher WG, Partridge WP, Jr., Dees C and Wachter EA. Photochem. Photobiol. 1997; 66: 141.
63. Karotki A, Kruk M, Drobizhev M, Rebane A, Nickel E and Spangler CW. IEEE J. Sel. Top. Quan-tum Electron. 2001; 7: 971.
64. Frederiksen PK, Mcllroy SP, Nielsen CB, Nikola-jsenL, Skovsen E, Jørgensen M, Mikkelsen KV and Ogilby PR. J. Am. Chem. Soc. 2005; 127: 255.
65. Gao D, Agayan RR, Xu H, Philbert MA and Kopel-man R. Nano Lett. 2006; 6: 2383.
66. Oar MA, Serin JM, Dichtel WR and Fréchet JMJ. Chem. Mater. 2005; 17: 2267.
67. Lim C, Shin J, Kwon IC, Jeong SY and Kim S. Bio-conjugate Chem. 2012; 23: 1022.
68. Kim S, Ohulchanskyy TY, Bharali D, Chen Y, Pan-dey RK and Prasad PN. J. Phys. Chem. C 2009; 113: 12641.
69. Zhang P, Steelant W, Kumar M and Scholfield M. J. Am. Chem. Soc. 2007; 129: 4526.
70. Kim J, Yoon H, Kim S, Wang K, Ishii T, Kim Y and Jang W. J. Mater. Chem. 2009; 19: 4627.
71. Son KJ, Yoon H, Kim J, Jang W, Lee Y and Koh W. Angew. Chem. Int. Ed. 2011; 50: 11968.
72. Chen W and Zhang J. J. Nanosci. Nanotechnol. 2006; 6: 1159.
73. Gu H, Xu K, Yang Z, Chang CK and Xu B. Chem. Commun. 2005; 34: 4270.
74. Wang Xu, Yang L, Chen Z and Shin DM. CA Cancer J. Clin. 2008; 58: 97.
75. Lovell JF, Liu TWB, Chen J and Zheng G. Chem. Rev. 2010; 110: 2839.
76. Jocham D, Stepp H and Waidelich R. Eur. Urol. 2008; 53: 1138.
77. Kausch I, Sommerauer M, Montorsi F, Stenzl A, Jacqmin D, Jichlinski P, Jocham D, Ziegler A and Vonthein R. Eur. Urol. 2010; 57: 595.
78. Stummer W, Pichlmeier U, Meinel T, Wiestler OD, Zanella F and Reulen F. Lancet Oncol. 2006; 7: 392.
79. Kaneko S. J. Jpn. Soc. Laser Surg. Med. 2008; 29: 135.
80. Lo P, Chen J, Stefflova K, Warren MS, Navab R, Bandarchi B, Mullins S, Tsao M, Cheng JD and Zheng G. J. Med. Chem. 2009; 52: 358.
81. Berg K, Selbo PK, Prasmickaite L, Tejelle TE, Sandvig K, Moan J, Gaudernak G, Fodstad O, Kjol-srud S, Anholt H, Rodal GH, Rodal SK and Høgset A. Cancer Res. 1999; 59: 1180.

26 H.-J. YOON AND W.-D. JANG
Copyright © 2013 World Scientific Publishing Company J. Porphyrins Phthalocyanines 2013; 17: 26–26
82. Høgset A, Prasmickaite L, Selbo PK, Hellum M, Engesæter BÆ, Bondted A and Berg K. Adv. Drug Deliv. Rev. 2004; 56: 95.
83. Høgset A, Prasmickaite L, Tjelle TE and Berg K. Hum. Gene Ther. 2000; 11: 869.
84. Prasmickaite L, Høgset A and Berg K. Photochem. Photobiol. 2001; 73: 388.
85. Høgset A, Prasmickaite L, Hellum M, Engesæter BÆ, Olsen VM, Tjelle T, Wheeler CJ and Berg K. Somat. Cell Mol. Genet. 2002; 27: 97.
86. Nishiyama N, Iriyama A, Jang W, Miyata K, Itaka K, Inoue Y, Takahashi H, Yanagi Y, Tamaki Y, Koyama H and Kataoka K. Nat. Mater. 2005; 4: 934.
87. Arnida, Nishiyama N, Kanayama N, Jang W, Yamasaki Y and Kataoka K. J. Control. Release 2006; 115: 208.
88. Oliveira S, Fretz MM, Hogset A, Storm G and Schiffelers RM. Biochim. Biophys. Acta. Biomem-branes 2007; 1768: 1211.
89. Lai P, Lou P, Peng C, Pai C, Yen W, Huang M, Young T and Shieh M. J. Control. Release 2007; 122: 36.
90. Adigbli DK, Wilson DGG, Farooqui N, Sousi E, Risley R, Taylor I, MacRobert AJ and Loizidou M. Br. J. Cancer 2007; 97: 502.
91. Lu J, Choi E, Tamanoi F and Zink JI. Small 2008; 4: 421.
92. Lu H, Syu W, Nishiyama N, Kataoka K and Lai P. J. Control. Release 2011; 155: 458.

Journal of Porphyrins and PhthalocyaninesJ. Porphyrins Phthalocyanines 2013; 17: 27–35
DOI: 10.1142/S1088424612501325
Published at http://www.worldscinet.com/jpp/
Copyright © 2013 World Scientific Publishing Company
INTRODUCTION
In recent years, cyclo[n]pyrroles featuring 6, 7 or 8 pyrrole rings directly connected through their - and
'-positions (e.g., [1H6]2+, [2H7]
2+ and [3H8]2+ in Fig.
1) [1, 2] have been the subject of extensive study. This work has served not only to reveal their unique structure, but also to unveil their potential utility in a variety of application areas, including separations [3], optics [4], material science [5] and molecular electronics [6]. Unfortunately, further developments in the area of cyclo[n]pyrrole chemistry appear limited by a synthetic bottleneck, which limits the number and type of directly
tethered, -, '-linked heterocyclic systems available for study.
The first synthesis of a cyclo[8]pyrrole derivative was achieved by subjecting a bipyrrole building block to an iron cation-mediated coupling process carried out in the presence of a mineral acid [7, 8]. This successful strategy was then slightly modified to produce smaller derivatives containing either 6 or 7 pyrrolic subunits (Fig. 1). The need for selective oxidation procedures, the potential for using less-forcing conditions than traditional approaches, as well as the prospect of using less expensive and toxic reagents, have recently led us to begin exploring the use of electrochemical oxidative coupling methods as an alternative to classic chemical reagent-based approaches. The use of electrochemical oxidative approaches is further attractive because they could allow for a subtle tuning of the reactivity of the “reagent” via the choice of anodic voltage. This prospect is of particular interest in oligopyrrole chemistry where
X-ray structure and properties of a cyclo[6]pyrrole[3]
thiophene
Thanh-Tuan Buia, Aude Escandea, Christian Philouzea, Gianluca Ciocid,
Sudip Ghoshc , Eric Saint-Amana, Jong Min Limc , Jean-Claude Mouteta,
Jonathan L. Sessler*b,c , Dongho Kim*c and Christophe Bucher*a,e
a Département de Chimie Moléculaire, CNRS-UMR 5250, Université Joseph Fourier, BP 53, 38041 Grenoble Cedex 9, France b Department of Chemistry and Biochemistry, University of Texas, 1 University Station-A5300, Austin, Texas 78712-0165, USA c Department of Chemistry, Yonsei University, Seoul 120-749, Korea d European Synchrotron Radiation Facility (ESRF), 6 rue Jules Horowitz , 38043 Grenoble Cedex 9, France e Laboratoire de Chimie, CNRS-UMR 5182, École Normale Supérieure de Lyon, 69364 Lyon, France
Received 13 September 2012Accepted 2 October 2012
ABSTRACT: A new member of the cyclo[n]pyrrole class of expanded porphyrins was prepared from the corresponding thiophene-containing terpyrrole precursor through use of a mild electrochemical oxidative procedure. The isolated macrocycle, featuring nine heterocyclic subunits directly connected through their , -positions, is the largest cyclo[n]pyrrole derivative reported to date. The structure obtained via synchrotron radiation-based studies revealed a dimeric arrangement involving individual macrocyclic subunits.
KEYWORDS: expanded porphyrin, nonaphyrin, electrochemical synthesis, cyclopyrrole, synchrotron radiation.
SPP full and student member in good standing
*Correspondence to: Christophe Bucher, email: [email protected], tel: +33 472-728-000; Jonathan L. Sessler, tel: +1 512-471-5009, email: [email protected]; Dongho Kim, email: [email protected], tel: +82 2-2123-2436

28 T.-T. BUI ET AL.
Copyright © 2013 World Scientific Publishing Company J. Porphyrins Phthalocyanines 2013; 17: 28–35
various coupling reactions and the conversion to a final aromatic form could benefit from the application of precise oxidation potentials [9].
Following this approach, we have developed a straightforward intramolecular oxidative cyclization of an acyclic hexapyrrolic precursor resulting in an hexaphyrin in high yield [10]. We have also produced cyclo[8]pyrrole [3H8]
2+ by simple electrolysis of a bipyrrolic precursor [11, 12]. It was even found that the cyclo[n]pyrroles [2H7]
2+ and [3H8]2+ could be obtained directly
from 3,4-disubstituted pyrroles, albeit in low yield [12].Recently, we have reported a new member of the
cyclo[n]pyrrole class featuring nine heterocyclic subunits directly connected through their '-positions ([4H6]
2+). This product, the largest cyclo[n]pyrrole derivative reported to date, could not be obtained in our hands using standard chemical oxidative coupling procedures [13]. However, it could be prepared from the corresponding thiophene-containing terpyrrole precursor 5H2 (Fig. 2) through use of a mild electrochemical oxidative procedure. On the basis of HRMS and 1H NMR spectroscopic measurements, this species was considered to be a 34 -electron aromatic cyclo[6]pyrrole[3]thiophene [4H6]
2+. However, this assignment was not supported with solid state structural data. Here, we wish to report a detailed description of the solid state structure of [4H6]
2+ obtained via the use of synchrotron radiation, as well as experimental evidence supporting the absence of appreciable aggregation in organic solution.
EXPERIMENTAL
X-ray analysis
An rhomboidal-shaped datum crystal of [4H6]·Cl2 was mounted on a nylon loop using paraffin oil (Molecular Dimensions) and transferred to the goniometer head of beamline ID23-1 at the European Synchrotron Radiation Facility (ESRF) in Grenoble–France. Diffraction data were collected at 100 °K on a Q315 detector (ADSC) using synchrotron radiation with wavelength = 0.63582 Å. Two data sets (180°) were collected with a different crystal orientation (kappa angle 0° and 60°) and then integrated and merged using the XDS package.
An initial structure was determined using charge flipping method known as Superflip [14]; it was then refined using Shelx [15]. The software packages were run using Olex2 [16]. All heavy atoms (C, N, O, S, Cl) were refined anisotropically. Hydrogen atoms were set geometrically and constrained to ride on their associated atoms. Table 1 summarizes the salient crystallographic data.
The crystal structure has been deposited at the Cambridge Crystallographic Data Centre (CCDC) under number CCDC-900922. Copies can be obtained on request, free of charge, via www.ccdc.cam.ac.uk/data_request/cif or from the Cambridge Crystallographic Data Centre, 12 Union Road, Cambridge CB2 1EZ, UK (fax: +44 1223-336-033 or email: [email protected]).
HN
HN
SHN
HN
S
SNH
NH
R
R
RRR
R
R
R
R
R R
R
N N
HNNH
NH HN
N N
RR R
R
R
R
R
R
RRR
R
R
R
R
R
HH
H
H
H
[30 π] [34 π]
[1H6]2+ [2H7]2+
NH
HN
NH
NH
HN
HN
R
R
R
R R
R
R
RNHNH
NH
NH HN
HN
HN
RR
R
RR
R
R
R
R
RRR
R
R
R R
R R
[22 π] [26 π]
[3H8]2+ [4H6]2+
(R = Et)
Fig. 1. cyclo[n]pyrroles featuring 6, 7, 8 or 9 heterocyclic units directly connected through their , -positions

X-RAY STRUCTURE AND PROPERTIES OF A CYCLO[6]PYRROLE[3]THIOPHENE 29
Copyright © 2013 World Scientific Publishing Company J. Porphyrins Phthalocyanines 2013; 17: 29–35
Electrochemistry
CH2Cl2 (SDS, anhydrous analytical grade) was used as received. Electrolytes were purchased and used without further purification (minimum purity 99%): tetra-n-butylammonium perchlorate (TBAP, Fluka), tetra-n-butylammonium hydrogensulfate (TBAHSO4, Aldrich), silver nitrate (AgNO3, Prolabo). Cyclic voltammetry (CV) and voltammetry at rotating disc electrodes (RDE) were recorded in a standard one-compartment, three-electrodes electrochemical cell under an argon stream using a “SP300 BioLogic” potentiostat. An automatic ohmic drop compensation procedure was systematically performed when using cyclic voltammetry. Vitreous carbon (Ø = 3 mm) and platinum (Ø = 2 mm) working electrodes (CH Instruments) were polished with 1 mm diamond paste before each recording. Spectroelectrochemical measurements were carried out at room temperature under an argon stream using a standard one-compartment, three-electrodes cell, an all quartz immersion probe (l = 1 mm) and a BioLogic SP300 potentiostat coupled to a Leo Zeiss GX Perkin Elmer spectrometer. Electrolyses were conducted at room temperature using a cylinder-shaped platinum gauze (55 cm2) working electrode and a large piece of carbon felt as a counter-electrode isolated from the electrolytic solution through an ionic bridge. A home-made AgNO3 (0.01 M + 0.1 M TBAP in CH3CN) / Ag electrode was used as the reference electrode.
To test for aggregation effects, concentration-dependent UV-vis/NIR spectroscopic studies of [4H6]·2TFA were carried out in dichloromethane solution with the spectra being recorded on a Varian Cary 5000 UV-vis-NIR spectrophotometer. Plots of absorbance changes at = 546 and 1200 nm against concentration were then constructed. The individual data points were obtained by starting with a concentrated solution (3.5 × 10⁻⁵ M) and subjecting to serial dilution to a final concentration of 5 × 10⁻⁶ M.
RESULT AND DISCUSSION
Synthesis and characterization of [4H9]2+ in solution
The tetraethyl 2,5-bispyrrolylthiophene (5H2) used as a building block in the electrochemical synthesis of [4H6]
2+ contains a central thiophene ring that is bridged by two directly linked -alkylated pyrroles. Preparation of this key precursor has been described in a previous article [13].
In our initial report, we noted that the bulk electrochemical oxidation of 5H2 carried out in dichloromethane electrolytic solution at a platinum electrode produces a complex mixture from which a purple compound, identified as the cyclo[6]pyrrole[3]thiophene derivative [4H6]
2+, could be isolated. Further details regarding this process and the properties of both the starting material and product are provided in the present paper.
The cyclic voltammogram of the starting material 5H2 recorded in dichloromethane (Fig. 3) exhibits a first irreversible oxidation wave at the peak potential EP = 80 mV vs Ag/Ag+ 10 mM , which is attributed to the formation of [5H2]
+ , a species that undergoes coupling reactions to produce a range of linear and/or cyclic products. A second oxidation wave was observed above 0.4 V. This feature is attributed to the oxidation of the intermediate species [6H4]
2+, which accumulates at the electrode interface during the forward scan. Two reduction waves are observed on the reverse scan, a finding that is taken as a clear indication that coupling products are being formed at the electrode interface [17].
In mechanistic terms, the formation of [4H6]2+ from
5H2 involves a wide range of coupled electrochemical and chemical steps. While the exact nature of many of these coupling processes and the associated intermediate species remains to be elucidated, some insights
HN
S
HN NH
S
NH
HN
S
HN
HH
Eap
(X2)-e[5H2]+
Kdim
[6H4]2+
KH
[4H6]2+
EnCn
5H2
NH
S
NH
HN
S
HN
7H4
-2H+
Fig. 2. Synthesis of [4H6]2+ from [5H2]

30 T.-T. BUI ET AL.
Copyright © 2013 World Scientific Publishing Company J. Porphyrins Phthalocyanines 2013; 17: 30–35
have been obtained from analyses of the underlying electrochemistry. Savéant, Nadjo and co-workers [18] have demonstrated, on theoretical grounds, that key insights regarding dimerization reactions that follow an initial electron transfer event can often be obtained from simple CV measurements. They have established simple diagnostic criteria that can be used to discriminate between various possible mechanisms involving either radical-radical or radical-substrate-coupling processes. Specifically, it has been proposed that the slope of the linear variation of the peak potential : Ep vs. monomer concentration (�Ep/�logC) or vs. scan rate (�Ep/�log ) should allow the chemical step coupled to the electron transfer event to be identified. To the extent this is true, it establishes a framework whereby key insights into the kinetics of electrochemical and chemical reactions can be gained.
Ep corresponding to the oxidation of 5H2 was found constant over the accessible concentration range, i.e. from 2 mM to 0.5 mM (Fig. 3B). The peak current also increases linearly with the square root of the sweep rate, as expected for a charge transfer controlled by mass transport, ( in Fig. 3D In agreement with Savéant’s theoretical suggestions for EC2 mechanisms that involve
a dimerization reaction following a charge transfer step, Ep was also found to shift linearly with the logarithm of the sweep rate. However, the slope of the linear regression (39 mV, see insert to Fig. 3C did not match the theoretical values of 19.7 or 29.6 mV expected for radical-radical or radical-substrate couplings, respectively, taking place under purely kinetically controlled conditions. In this so-called KP region, the electrochemical response is predicted to be controlled by the rate at which the coupling reaction proceeds [18].
As the result of the above disparity, no definitive conclusions can be drawn about the specifics of the mechanism in the present instance. Nevertheless, the collected experimental data (Fig. 3), particularly the invariance of Ep as a function of C and the slope of 39 mV found for (�Ep /�log ), lead us to suggest that the reaction is controlled in kinetic terms by the rate of charge transfer associated with the forward reaction, rather than by kinetics of a particular chemical reaction, such as an individual carbon–carbon bond-forming coupling step.
A diluted solution of 5H2 in TBAHSO4/CH2Cl2 was subjected to controlled potential electrolysis in situ spectroscopically monitoring using an all quartz UV-vis immersion probe. Setting the potential of the working
Fig. 3. (a, c and d) [5H2] = 1 × 10⁻³ M, CH2Cl2, 0.1 M TBAP, WE: Pt (Ø = 2 mm), E vs. Ag/AgNO3 (10-2 M in CH3CN/TBAP 0.1 M), (b) CH2Cl2, 0.1 M TBAP, WE: Pt (Ø = 2 mm), E vs. Ag/AgNO3 10-2 M in CH3CN
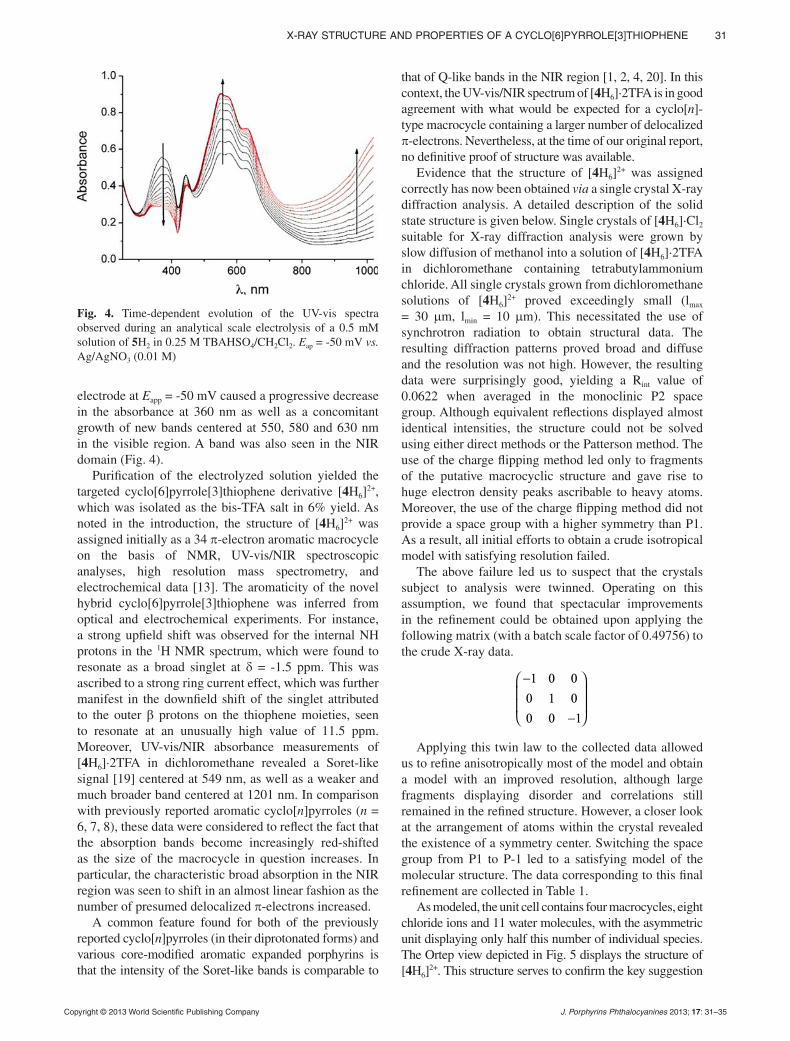
X-RAY STRUCTURE AND PROPERTIES OF A CYCLO[6]PYRROLE[3]THIOPHENE 31
Copyright © 2013 World Scientific Publishing Company J. Porphyrins Phthalocyanines 2013; 17: 31–35
electrode at Eapp = -50 mV caused a progressive decrease in the absorbance at 360 nm as well as a concomitant growth of new bands centered at 550, 580 and 630 nm in the visible region. A band was also seen in the NIR domain (Fig. 4).
Purification of the electrolyzed solution yielded the targeted cyclo[6]pyrrole[3]thiophene derivative [4H6]
2+, which was isolated as the bis-TFA salt in 6% yield. As noted in the introduction, the structure of [4H6]
2+ was assigned initially as a 34 -electron aromatic macrocycle on the basis of NMR, UV-vis/NIR spectroscopic analyses, high resolution mass spectrometry, and electrochemical data [13]. The aromaticity of the novel hybrid cyclo[6]pyrrole[3]thiophene was inferred from optical and electrochemical experiments. For instance, a strong upfield shift was observed for the internal NH protons in the 1H NMR spectrum, which were found to resonate as a broad singlet at = -1.5 ppm. This was ascribed to a strong ring current effect, which was further manifest in the downfield shift of the singlet attributed to the outer protons on the thiophene moieties, seen to resonate at an unusually high value of 11.5 ppm. Moreover, UV-vis/NIR absorbance measurements of [4H6]·2TFA in dichloromethane revealed a Soret-like signal [19] centered at 549 nm, as well as a weaker and much broader band centered at 1201 nm. In comparison with previously reported aromatic cyclo[n]pyrroles (n = 6, 7, 8), these data were considered to reflect the fact that the absorption bands become increasingly red-shifted as the size of the macrocycle in question increases. In particular, the characteristic broad absorption in the NIR region was seen to shift in an almost linear fashion as the number of presumed delocalized -electrons increased.
A common feature found for both of the previously reported cyclo[n]pyrroles (in their diprotonated forms) and various core-modified aromatic expanded porphyrins is that the intensity of the Soret-like bands is comparable to
that of Q-like bands in the NIR region [1, 2, 4, 20]. In this context, the UV-vis/NIR spectrum of [4H6]·2TFA is in good agreement with what would be expected for a cyclo[n]-type macrocycle containing a larger number of delocalized
-electrons. Nevertheless, at the time of our original report, no definitive proof of structure was available.
Evidence that the structure of [4H6]2+ was assigned
correctly has now been obtained via a single crystal X-ray diffraction analysis. A detailed description of the solid state structure is given below. Single crystals of [4H6]·Cl2 suitable for X-ray diffraction analysis were grown by slow diffusion of methanol into a solution of [4H6]·2TFA in dichloromethane containing tetrabutylammonium chloride. All single crystals grown from dichloromethane solutions of [4H6]
2+ proved exceedingly small (lmax = 30 m, lmin = 10 m). This necessitated the use of synchrotron radiation to obtain structural data. The resulting diffraction patterns proved broad and diffuse and the resolution was not high. However, the resulting data were surprisingly good, yielding a Rint value of 0.0622 when averaged in the monoclinic P2 space group. Although equivalent reflections displayed almost identical intensities, the structure could not be solved using either direct methods or the Patterson method. The use of the charge flipping method led only to fragments of the putative macrocyclic structure and gave rise to huge electron density peaks ascribable to heavy atoms. Moreover, the use of the charge flipping method did not provide a space group with a higher symmetry than P1. As a result, all initial efforts to obtain a crude isotropical model with satisfying resolution failed.
The above failure led us to suspect that the crystals subject to analysis were twinned. Operating on this assumption, we found that spectacular improvements in the refinement could be obtained upon applying the following matrix (with a batch scale factor of 0.49756) to the crude X-ray data.
1 0 0
0 1 0
0 0 1
−⎛ ⎞⎜ ⎟⎜ ⎟
−⎝ ⎠
Applying this twin law to the collected data allowed us to refine anisotropically most of the model and obtain a model with an improved resolution, although large fragments displaying disorder and correlations still remained in the refined structure. However, a closer look at the arrangement of atoms within the crystal revealed the existence of a symmetry center. Switching the space group from P1 to P-1 led to a satisfying model of the molecular structure. The data corresponding to this final refinement are collected in Table 1.
As modeled, the unit cell contains four macrocycles, eight chloride ions and 11 water molecules, with the asymmetric unit displaying only half this number of individual species. The Ortep view depicted in Fig. 5 displays the structure of [4H6]
2+. This structure serves to confirm the key suggestion
Fig. 4. Time-dependent evolution of the UV-vis spectra observed during an analytical scale electrolysis of a 0.5 mM solution of 5H2 in 0.25 M TBAHSO4/CH2Cl2. Eap = -50 mV vs. Ag/AgNO3 (0.01 M)

32 T.-T. BUI ET AL.
Copyright © 2013 World Scientific Publishing Company J. Porphyrins Phthalocyanines 2013; 17: 32–35
advanced previously, namely that the core contains six pyrrole and three thiophene units directly linked in a sequential fashion. The presence of two chloride counter anions per macrocycle also provides support for the suggestion that it is the dicationic form of the molecule that is isolated after the electrochemical synthesis. As expected from preliminary studies involving simple molecular models, all the pyrrole NHs point in towards the center of the cavity; likewise, the aromatic skeleton is relatively flat.
As a general rule, the size of the macrocyclic cavity is a key parameter that is known to define many of the properties of expanded porphyrins, including applications involving coordination chemistry or anion binding. This parameter is difficult to assign in the absence of detailed structural information. On the basis of the present analysis, we suggest that the inner cavity of [4H6]
2+ can be defined in terms of two distinct radii that involve either the nitrogen (r6N in Fig. 5) or the sulfur atoms (r3S in Fig. 5). These two radii are defined from the positions of the six nitrogen atoms or those of the three sulfur atoms, respectively, relative to the virtual center of the macrocycle calculated from the central heteroatoms. The largest radius r6N = 4.6 Å is roughly 1 Å larger than r3S (3.8 Å). These two radii can be compared to those inferred from the solid state structures of smaller cyclo[n]pyrroles (n = 6, 7 and 8). These data are collected in Table 2 and reveal that, in accord with design expectations, the new macrocycle of this report is indeed larger than its previously reported congeners. Specifically, we find that the macrocyclic cavity radius rnX evolves linearly with the number of pyrrole units (n) involved in the ring from 2.6 Å, calculated for the shortest cyclo[6]pyrrole, up to 3.8 Å, measured for cyclo[8]pyrrole. The fact that the r6N value calculated for [4H6]
2+ deviates slightly from this linear trend most probably reflects the presence of the three thiophene subunits in the macrocycle.
Table 1. Summary of crystallographic data for 2[4H2]·4Cl·5.5H2O
CCDC deposit no. or code CCDC 900922
Color/shape violet/rhombohedral
Chemical formula 2(C60 H72 N6 S3), 4(Cl), 5.5(H2O)
Formula weight, g.mol-1 2187.72
Temperature, K 100
Crystal system triclinic
Space group P-1
Unit-cell dimensions a =15.090(2)
b = 20.120(3)
c = 19.1100(10)
= 100.85(4)
= 89.98(4)
Unit-cell volume, Å3
5698.3(14)
Z 2
Density (calculated), g/cm3 1.275
Absorption coefficient, mm-1 0.274
Diffractometer/scans ESRF beamline ID23-1/ omega scans (180°) with kappa 0° and kappa 60°
Wavelength, Å 0.63582
range for data collection, ° 1.42 – 20.80
Reflections measured 15776
Independent observed reflections
12186 [I > 2 (I)]
Data/ restraints/ parameters 12186/86/1416
Goodness of fit on F2 1.067
Final R indices [I > 2 (I)] R1 = 0.0704, wR2 = 0.1740
R indices (all data) R1 = 0.0957, wR2 = 0.1929
Fig. 5. Left: ortep view of [4H6]2+ showing the heteroatom labeling scheme. Thermal ellipsoids are scaled to the 50% probability level.
Hydrogen atoms associated with the aryl and alkyl substituents have been omitted for clarity. Right: ball and stick representation of [4H6]
2+ showing the minimum (r3S) and maximum (r6N) radii that define the macrocyclic cavity. See text for details

X-RAY STRUCTURE AND PROPERTIES OF A CYCLO[6]PYRROLE[3]THIOPHENE 33
Copyright © 2013 World Scientific Publishing Company J. Porphyrins Phthalocyanines 2013; 17: 33–35
Four individual macrocycles are found within the unit cell. These appear as two distinct self-assembled sandwich-like structures (A and B, Fig. 6 and Fig. 7). Each of these dimers is held together through a variety of apparent noncovalent interactions, including van der Waals, electrostatic forces, and a network of hydrogen bonds. The distance between the mean macrocycle planes (defined by the sulfur and nitrogen heteroatoms within each of the individual cyclopyrroles) in each of the two pair of dimers present in the unit cell was estimated at 3.80 Å and 3.34 Å, respectively. In both cases, the macrocycles adopt an offset -dimeric arrangement with center-to-center distances of 4.21 and 4.11 Å, respectively. The interplanar separation is thus shorter in
structure B; however, the offset between the constituent macrocycles is larger than in dimer A.
In planar -conjugated structures, interactions are known to be driven to a large extent by intramolecular polarization processes. To the extent this is true, it might be expected that [4H6]
2+ would display a greater propensity to adopt cofacial arrangements or to aggregate in solution or in the solid state than porphyrins [21] due to the presumed greater bond polarizations induced by the presence of two positive charges within the individual macrocyclic cores. Although not expected to be operative in solution, the drive towards aggregation in the solid state could be further enhanced by the presence of a well-defined hydrogen bond network involving the surrounding
Table 2. Left: macrocyclic cavity radii calculated for various cyclo[n]pyrroles. Right: plot of the radius, rnN, vs. the number of pyrroles in the ring (n). Note the linear relationship
rnX, Å* Δrmax, Å** Reference
[1H6]2+ r6N = 2.644 0.025 [8]
[2H7]2+ r7N = 3.209 0.201 [8]
[3H8]2+ r8N = 3.811 0.323 [11]
[4H6]2+ r6N = 4.624
( 0.0119)0.161 this work
r3S = 3.860 ( 0.0119)
0.186 this work
(∗) n: number of heterocycles, X: heteroatom involved in the ring. (∗∗) Δrmax = rmax-rmin
Fig. 6. Side and top views of the face-to-face arrangement present in dimer A
Fig. 7. Side and top views of the face-to-face arrangement present in dimer B

34 T.-T. BUI ET AL.
Copyright © 2013 World Scientific Publishing Company J. Porphyrins Phthalocyanines 2013; 17: 34–35
solvents and anions. Specifically, as revealed by the present structural analysis, four chloride anions are found within each dimer; these counter anions are hydrogen bonded to the inner NHs and to various water molecules. In the case of both dimers A and B, the chloride atoms adopt a zigzag arrangement and are defined by interatomic distances that range from 3.98 to 5.65 Å, with the shortest distance being found in structure B where the chloride anions are located almost directly between the constituent macrocycles.
The compact arrangement of molecules in the crystal, i.e. observation of -stacked dimers, led us to consider aggregation processes in solution as a possible explanation for the unusually high two-photon absorption (TPA) cross section value of 23000 GM reported previously for [4H6]
2+ in dichloromethane. To test this possibility, the aggregation properties of [4H6]·2TFA were analyzed in dichloromethane using UV-vis absorption spectroscopy to check for the linearity of Beer’s Law plots. Such plots, involving correlations between the absorbance intensity at = 546 and 1200 nm and the concentration of [4H6]·2TFA in dichloromethane were found to be fully linear across the full range of accessible concentration values (10-5 ~ 10-3 M) as can be seen from an inspection of Fig. 8. This observation is consistent with the presence of a fully dissociated species, i.e. an absence of appreciable aggregation under these solution phase conditions.
In summary, we have provided structural evidence that serves to confirm the molecular connectivity for a new cyclo[9]pyrrole analog that is consistent with the structure originally inferred from spectroscopic measurements. The structure obtained via synchrotron radiation-based analyses revealed a dimeric arrangement involving individual macrocyclic subunits. However, no evidence of appreciable aggregation was seen in solution.
Acknowledgements
The present work was supported by the “Agence National de la Recherche” (ANR-09-JCJC-0083-01 to C. B.), the US National Science Foundation (Grant No. CHE 1057904 to J.L.S.), the Robert A. Welch Foundation (Grant No. F-1018 to J.L.S.) and the Korean WCU program (Grant No. R32-2010-000-10217-0). The authors would also like to thank Benoît Baptiste for his help in the refinement process, and the CECIC for providing access to computing facilities. CB wishes to thank D. Jouvenot for his valuable help in designing the cover picture.
REFERENCES
1. a) Sessler JL and Seidel D. Angew. Chem. Int. Ed. 2003; 42: 5134–5175. b) Jasat A and Dolphin D. Chem. Rev. 1997; 97: 2267–2340. c) Stępień M, Sprutta N and Latos-Grażyński L. Angew. Chem. Int. Ed. 2011; 50: 4288–4340. d) Saito S and Osuka A. Angew. Chem. Int. Ed. 2011; 50: 4342–4373. e) Okujima T, Jin G, Matsumoto N, Mack J, Mori S, Ohara K, Kuzuhara D, Ando C, Ono N, Yamada H, Uno H and Kobayashi N. Angew. Chem. Int. Ed. 2011; 50: 5699–5703. f) Sarma T and Panda PK. Chem. Eur. J. 2011; 17: 13987–13991. g) Roznya-tovskiy VV, Lim JM, Lynch VM, Lee BS, Kim D and Sessler JL. Org. Lett. 2011; 13: 5620–5623
2. a) Köhler T, Ou Z, Lee JT, Seidel D, Lynch V, Kadish KM and Sessler JL. Angew. Chem. Int. Ed. 2005; 44: 83–87. b) Melfi PJ, Kim SK, Lee JT, Bolze F, Seidel D, Lynch VM, Veauthier JM, Gaunt AJ, Neu MP, Ou Z, Kadish KM, Fukuzumi S, Ohkubo K and Sessler JL. Inorg. Chem. 2007; 46: 5143–5145. c) Sessler JL, Leea JT, Ou Z, Kohler T, Hargrove AE, Cho W-S, Lynch V and Kadish KM. J. Porphyrins Phthalocyanines 2006; 10: 1329–1336. d) Lim JM, Yoon ZS, Shin J-Y, Kim KS, Yoon M-C and Kim D. Chem. Commun. 2009: 261–273. e) Gorski A, Köhler T, Seidel D, Lee JT, Orzanowska G, Sessler JL and Waluk J. Chem. Eur. J. 2005; 11: 4179–4184. f) Alkorta I, Blanco F and Elguero J. Cent. Eur. J. Chem. 2009; 7: 683–689.
3. a) Eller LR, Stepien M, Fowler CJ, Lee JT, Sessler JL and Moyer BA. J. Am. Chem. Soc. 2007; 129: 11020–11021. b) Baker ES, Lee JT, Sessler JL and Bowers MT. J. Am. Chem. Soc. 2006; 128: 2641–2648.
4. Yoon ZS, Kwon JH, Yoon M-C, Koh MK, Noh SB, Sessler JL, Lee JT, Seidel D, Aguilar A, Shimizu S, Suzuki M, Osuka A and Kim D. J. Am. Chem. Soc. 2006; 128: 14128–14134.
5. Stepien M, Donnio B and Sessler J. Angew. Chem. Int. Ed. 2007; 46: 1431–1435.
6. a) Xu H, Yu G, Xu W, Xu Y, Cui G, Zhang D, Liu Y and Zhu D. Langmuir. 2005; 21: 5391–5395. b) Xu H, Wang Y, Yu G, Xu W, Song Y, Zhang D, Liu Y and Zhu D. Chem. Phys. Lett. 2005; 414: 369–373.
Fig. 8. Concentration-dependent UV-vis/NIR spectrum of [4H6]·2TFA recorded in dichloromethane solution. Inset: plot of absorbances at = 546 and 1200 nm against concentrations. Samples were prepared as detailed in the experimental section.

X-RAY STRUCTURE AND PROPERTIES OF A CYCLO[6]PYRROLE[3]THIOPHENE 35
Copyright © 2013 World Scientific Publishing Company J. Porphyrins Phthalocyanines 2013; 17: 35–35
7. Seidel D, Lynch V and Sessler JL. Angew. Chem. Int. Ed. 2002; 41: 1422–1425.
8. Köhler T, Seidel D, Lynch V, Arp FO, Ou Z, Kadish KM and Sessler JL. J. Am. Chem. Soc. 2003; 125: 6872–6873.
9. Bucher C and Buda M. In Electrochemistry of Pyrroles and Oligopyrroles: Analytic and Syn-thetic Aspects, Handbook of Porphyrin Science, Vol. 17, Kadish KM, Smith KM and Guilard R. (Eds.) World Scientific Publishing Co.: 2012; pp 240.
10. Iordache A, Melfi P, Bucher C, Buda M, Moutet J-C and Sessler JL. Org. Lett. 2008; 10: 425–428.
11. Bucher C, Devillers CH, Moutet J-C, Pecaut J and Sessler JL. Chem. Commun. 2006: 3891–3893.
12. Buda M, Iordache A, Bucher C, Moutet J-C, Royal G, Saint-Aman E and Sessler JL. Chem. Eur. J. 2010; 16: 6810–6819.
13. Bui T-T, Iordache A, Chen Z, Roznyatovskiy VV, Saint-Aman E, Lim JM, Lee BS, Ghosh S, Moutet J-C, Sessler JL, Kim D and Bucher C. Chem. Eur. J. 2012; 18: 5853–5859.
14. Palatinus L and Chapuis G. J. Appl. Crystallogr. 2007; 40: 786–790.
15. Sheldrick G. Acta Crystallogr., Sect. A. 2008; 64: 112–122.
16. Dolomanov OV, Bourhis LJ, Gildea RJ, Howard JAK and Puschmann H. J. Appl. Crystallogr. 2009; 42: 339–341.
17. a) Andrieux CP, Hapiot P, Audebert P, Guyard L, Nguyen Dinh An M, Groenendaal L and Meijer EW. Chem. Mater. 1997; 9: 723–729. b) Audebert P, Catel J-M, Duchenet V, Guyard L, Hapiot P and Coustumer GL. Synth. Met. 1999; 101: 642–645. c) Guyard L, Hapiot P and Neta P. J. Phys. Chem. B. 1997; 101: 5698–5706. d) Zotti G, Mar-tina S, Wegner G and Schluter A-D. Adv. Mater. 1992; 4: 798–801. e) Andrieux CP, Audebert P, Hapiot P and Savéant JM. Synth. Met. 1991; 43: 2877–2880.
18. a) Andrieux CP, Nadjo L and Savéant JM. J. Elec-troanal. Chem. Interfacial Electrochem. 1973; 42: 223–242. b) Andrieux CP, Nadjo L and Savéant JM. J. Electroanal. Chem. Interfacial Electrochem. 1970; 26: 147–186.
19. Wang X-F and Tamiaki H. Energy Environ. Sci. 2010; 3: 94–106.
20. Yoon M-C, Misra R, Yoon ZS, Kim KS, Lim JM, Chandrashekar TK and Kim D. J. Phys. Chem. B. 2008; 112: 6900–6905.
21. Hunter CA and Sanders JKM. J. Am. Chem. Soc. 1990; 112: 5525–5534.

Journal of Porphyrins and PhthalocyaninesJ. Porphyrins Phthalocyanines 2013; 17: 36–43
DOI: 10.1142/S1088424612501192
Published at http://www.worldscinet.com/jpp/
Copyright © 2013 World Scientific Publishing Company
INTRODUCTION
Photodynamic therapy (PDT) is a cancer treatment using the combination of a low powered laser beam and photo-sensitizers. This therapy is mainly performed for lung, gastroesophageal and cervical cancers [1–3]. In PDT, porphyrins as well as 5-aminolevurinic acid are administrated to cancer patients. Thereafter, a low power excimer dye laser beam is irradiated on the cancer lesions. Since irradiation itself by the laser beam used
in PDT without exogenous porphyrin treatment is not harmful, intracellular accumulation of porphyrins is essential to cause apoptosis induced by reactive oxygen species (ROS) production generated by the laser beam [4–6]. Therefore; tumor tissue-specific accumulation of porphyrins determines the efficacy of PDT, keeping the surrounding normal tissues from being damaged [7, 8].
In developed countries, the number of the patients with cardiovascular problems is increasing [9]. They are a high risk group for strong invasive therapies because the risk of thrombosis or heart failure is higher in such radical treatments [10]. Furthermore, most of them receive anti-platelet therapy for thrombosis prevention; this therapy often causes bleeding tendencies in them. For these
Cancer cells uptake porphyrins via heme carrier protein 1
Kazuhiro Hiyamaa, Hirofumi Matsui*a , Masato Tamuraa, Osamu Shimokawaa, Mariko
Hiyamaa, Tsuyoshi Kanekoa , Yumiko Naganoa, Ichinosuke Hyodoa, Junko Tanakab,
Yoshihiro Miwab, Tetsuo Ogawac, Takeo Nakanishic and Ikumi Tamaic
a Division of Gastroenterology, Graduate School of Comprehensive Human Sciences, University of Tsukuba, Tennodai 1-1-1, Tsukuba 305-8575, Japan b Department of Molecular Pharmacology, Graduate School of Comprehensive Human Sciences, University of Tsukuba, Tennodai 1-1-1, Tsukuba 305-8575, Japan c Department of Membrane Transport and Biopharmaceutics, School of Pharmaceutical Sciences, College of Medical, Pharmaceutical and Health Sciences, Kanazawa University, Kakuma, Kanazawa 920-1192, Japan
Received 26 May 2012Accepted 5 July 2012
ABSTRACT: Although exogenous porphyrin accumulation in cancer cells is important for the success of photodynamic therapies, the mechanism is not clear. We hypothesized that a newly reported transporter, heme carrier protein 1 (HCP1), is highly expressed in cancer cells, and transports porphyrins into the cells. We investigated the following three unknowns: whether cancer cells take up hematoporphyrin derivative via HCP1, whether HCP1 is involved in photodynamic therapies, and whether cancer cells highly express HCP1. First, when HCP1-overexpressed cells were treated with hematoporphyrin derivative and then exposed to an eximer laser beam, they emitted a significantly higher intensity of hematoporphyrin derivative fluorescence and became more susceptible to the laser beam than control. Second, when three other types of cancer cells with silenced HCP1 were treated with hematoporphyrin derivative and then exposed to the laser beam, they emitted a significantly lower intensity of hematoporphyrin derivative fluorescence. Third, non-cancer cells slightly expressed HCP1; on the other hand, the three other types of cancer cells clearly expressed HCP1. These results indicated that cancer cells uptake hematoporphyrin derivative via HCP1 and over-expression of HCP1 increases the efficacy of photodynamic therapies by increasing porphyrin accumulation in the cells. This is the first report about a transporter of porphyrin in cancer cells.
KEYWORDS: cancer, photodynamic therapy, photobiology, heme carrier protein 1, porphyrin.
SPP full member in good standing
*Correspondence to: Hirofumi Matsui, email: [email protected], tel: +81 29-853-3466, fax: +81 29-853-3218

CANCER CELLS UPTAKE PORPHYRINS VIA HEME CARRIER PROTEIN 1 37
Copyright © 2013 World Scientific Publishing Company J. Porphyrins Phthalocyanines 2013; 17: 37–43
reasons, it is preferable for these patients not to have surgical operations; therefore, there is increasing demand for minimally (or non-) invasive treatment for these patients. PDT can be an ideal treatment to meet these requirements because it has few complications such as hemorrhage and perforation in comparison with surgical procedures and/or common ablation therapies using a high frequency current or a high power laser beam.
Although the therapeutic efficacy is likely dependent on tumor-specific accumulation of porphyrins [11], the precise mechanism underlying porphyrin accumulation in cancer cells is not yet fully understood. Clarification of the porphyrin accumulation mechanism can be a clue to establishing more effective and safer therapy.
In 2005, a transmembrane transporter, Heme carrier protein 1 (HCP1, Database ID: NM_080669.4, AAH10691.1), was reported as a human duodenum heme transporter [12]. Heme, Fe-protoporphyrin IX, is one of the porphyrins essential for maintaining the life of organisms, and heme is biologically synthesized from 5-aminolevulinic acid. In addition, dietary heme is usually taken up via HCP1 expressed in duodenal epithelial cells [13–15]. Since the structure of porphyrins is virtually the same as heme, HCP1 may transport porphyrins as well as heme. There are several reports that cancer cells express HCP1 [14, 16]. Therefore, the efficacy of PDT may be determined by the expression of functional HCP1 if exogenous porphyrins are taken up by HCP1 expressed in cancer cells, which PDT targets.
In this study, we aimed to elucidate whether HCP1 is involved in tumor-specific porphyrin accumulation as a major molecular entity in the efficacy of PDT. To prove our hypothesis that it is a major factor, we carried out the following series of experiments: First, increase in porphyrin accumulation was studied in HCP1 cDNA-transfected HeLa cells; Second, the efficacy of PDT was also studied in the transfected HeLa cells, compared with untransfected HeLa cells; Third, since we found expression of HCP1 in gastric cancer cells and lung cancer cells express HCP1, porphyrin accumulation was examined in those cancer cells with HCP1 silenced. Our results demonstrated that expression of functional HCP1 is a clinically important determinant in PDT.
MATERIALS AND METHODS
Cell culture
Rat normal gastric mucosa-derived cell line, RGM1, and its chemically transformed cell line, RGK36, were established in our laboratory [17, 18]. Human gastric cancer cell line, AGS, human lung cancer cell line, A549, and human uterine cervical carcinoma cell line, HeLa, were obtained from RIKEN Cell Bank (Tsukuba, Japan). RGM1 cells, RGK36 cells and AGS cells were cultured in DMEM/HamF12 medium with glutamate
(GIBCO, United States), DMEM/HamF12 medium without glutamate (Sigma-Aldrich, United States) and HamF12 medium (GIBCO), respectively. A549 cells and HeLa cells were cultured in DMEM medium (GIBCO). All mediums were supplemented with 10% fetal calf serum (Sigma-Aldrich) and with 1% antibiotic mixture (100 U/mL of penicillin and 100 mg/mL streptomycin: Sigma-Aldrich, United States) and additionally with G418 antibiotics (Sigma-Aldrich) for cells with the following gene vector. Cells were maintained at 37 °C in a humidified incubator containing 95% air/ 5% CO2.
HCP1 gene vector
pEB6CAG-hHCP1 was constructed using EBV-based episomal vector, pEB6CAGMCS carrying Epstein–Barr virus replication origin, oriP [19], a replication initiation factor (EBNA-1) that was sufficient for autonomous replication in human cells and Geneticin resistance. Human HCP1 cDNA covering the entire coding sequence was isolated using PCR with KOD+ DNA polymerarase (Toyobo INC. Osaka, Japan) from the cDNA library of human gastric cancer MKN45 cells. To produce the pEB6CAG-hHCP1, the vector was digested with BglII/NotI and then inserted into the HCP1 cDNA. pEB6CAGMCS, an empty control vector, was also used for the in vitro study. The nucleotide sequences were confirmed using an Applied Biosystems 3130 Genetic Analyzer (APPlied Biosystems, Foster City, CA) with a BigDye terminator cycle sequencing kit. Plasmid DNA for transfection was purified with a Qiagen plasmid kit (Hiden, Germany).
HCP1 gene vector transfection in HeLa cells
Two*105 HeLa cells were cultured in each well of a 3 cm cell culture plate 24 h prior to transfection. Transfection was performed by Lipo Trust Gene (Hokkaido System Science Co., Ltd., Sapporo, Japan) for 18 h according to the manufacturer’s instruction. Transfected HeLa cells were selected with 1.0 ng/mL G418 antibiotics (Sigma-Aldrich).
Quantitative PCR of HCP1 mRNA
Cells were lysed by CellAmp Direct RNA Prep Kit for One Step RT-PCR (Real Time) (Takara Bio Inc.), and real time PCR was conducted with HCP1 and beta-actin primer (designed by Cosmo-bio Co., Ltd., Tokyo, Japan) with One Step SYBR PrimeScript RT-PCR Kit II (Perfect Real Time) (Takara Bio Inc.) according to the manufacturers’ instructions. The sequence of the primer in this experiment was as follows; rat HCP1 primer: forward: agaactgtggcaaccagagc, reverse: cagaagagtcccaccaggaa, human HCP1 primer: forward: ctggaccctctacatgaacg, reverse: ggtagagtgagttgaagatg, beta-actin primer (same sequence in human and rat): forward: acaacggctccggcatgtgc, reverse: gtccgcctagaagcatttgc.

38 K. HIYAMA ET AL.
Copyright © 2013 World Scientific Publishing Company J. Porphyrins Phthalocyanines 2013; 17: 38–43
Porphyrin uptake analysis
For the exogenous porphyrin uptake experiment, RGK, AGS, A549 and HeLa cells were grown to confluency in 4-well multi-chamber plates (Nunc, Thermo Fisher Scientific Inc.). HeLa cells were transfected with HCP1 or the control vector by the previously mentioned protocol. RGK, AGS and A549 cells were transfected with HCP1 or control siRNA by the following protocol. 6.73 mg of hematoporphyrin dihydrochloride (HP, Wako, Osaka, Japan) was dissolved in 100 μl dimethyl-sulfoxide (Wako); this solution was diluted in DMEM/HamF12 medium (GIBCO) to 0.005 and 0.01 mM HP and was added to each cell well for 2 h. Experiments were terminated by removing the HP incubation medium and washing cells twice with ice-cold phosphate buffer saline (PBS, Wako) and replacement fresh DMEM medium was added for 2 h. The fluorescent intensities of the HP were examined with a fluorescence microscope (Axiovert 135M and Axiocam, Zeiss, German) at an excitation wavelength of 415 nm and an emission wavelength of 625 nm. The fluorescence intensity of each picture was calculated with imaging analysis software, Image J 1.42q.
HPLC analysis for HP
Cells treated with HP were lysed with an ultrasonic homogenizer. The resultant lysates were applied to a liquid chromatography system (JASCO, Tokyo, Japan) and separation was achieved with an analytical column (Mightysil® RP-18; 4.6 × 150 mm, Kanto Chemical, Tokyo, Japan) and mobile phase consisting of acetone, methanol, H2O, and formic acid (560:240:200:2; v/v) at a flow rate of 1.0 mL/min. HP was detected as a peak with a retention time of 2.3 min and quantified with fluorescence detector FP-2020 Plus (JASCO) at an excitation wavelength of 415 nm and emission wavelength of 625 nm. The cellular protein content was determined using a protein assay kit (Bio-Rad, United Stated).
Photodynamic therapy
The HP solution was prepared according to the previously mentioned protocol. Two*104 HCP1-overexpressed or control HeLa cells were cultured in each well of 96-well plates for 24 h. HP solution with concentration of 0, 5, 10 μM HP was added in each cell well and incubated for 4 h. HP was washed with PBS twice, and DMEM/HamF12 medium (GIBCO) was added and incubatedfor 2 h. Cells were washed with PBS twice. One J/cm2 laser with a wavelength of 630 nm was irradiated on the cells. The excimer dye laser light, PDT EDL-1, was provided by Hamamatsu Photonics (Hamamatsu, Japan) for photodynamic therapy.
Cellular injury was examined with a Tetra Color One assay kit (Seikagaku Biobusiness Corporation, Tokyo, Japan) according to the manufacturer’s instruction. After laser irradiation, the cell medium was washed with PBS,
and DMEM/HamF12 medium was added. After 24 h incubation, it was washed with PBS and treated with serum-free media containing 10 μL Tetra Color One for 1 h. The absorbance of each well at 450 nm was measured with a multimode plate reader (DTX 880, Beckman Coulter, United States).
Immunohistochemistry of HCP1
We purchased anti-HCP1 rabbit polyclonal antibody from Abcam Inc. (United States). RGM1, RGK36, AGS and A549 cells were plated in 10 cm dishes for immunoblotting. Immunohistochemistry was carried out with Can Get Signal Immunostain A (Toyobo), VECTASTAIN ABC-AP Rabbit IgG kit (Vector Inc., United States) and Vector Red (Vector Inc.) according to the manufacturers’ instructions. Briefly, cells were removed from the growth medium, fixed by ice-cold methanol and washed with PBS. Blocking was carried out with the following blocking buffer: 10 mL PBS buffer with 3 drops of goat serum. The cells were washed 3 times with PBS. Anti-HCP1 antibody was diluted to 1:100 by Can Get Signal Immunostain A and reacted with the cells for 1 h at room temperature. The cells were washed with PBS 3 times. Biotinylated anti rabbit IgG antibody was diluted by Can Get Signal Immunostain A and reacted with the cells for 1 h at room temperature. The cells were washed 3 times with PBS. The cells were reacted with strept-avidin and washed 3 times with PBS. Vector Red was diluted with Tris-HCl (pH8.0) and reacted with the cells. All fluorescence images were obtained by observation of 400 nm excitation and 635 nm emission with a fluorescence microscope (Axiovert 135M and Axiocam, Zeiss) The fluorescence intensity of each picture was calculated with the imaging analysis software, Image J 1.42q.
siRNA treatment
Transfection of cells was carried out using the LIPO TRUST Oligo EX transfection protocol (Hokkaido System Science Co., Ltd., Sapporo, Japan) according to the manufacturer’s instruction. Briefly, 2 × 10⁴ HeLa cells/well were cultured in DMEM/HamF12 medium (GIBCO) 24 h before siRNA transfection. Ten μL LIPO TRUST Oligo EX was added to 2.5 mL DMEM/HamF12 medium (GIBCO) at room temperature. The siRNA oligo mixture of three HCP1-siRNAs or negative control scrambled oligo mixture (Cosmo-bio Co., Ltd.) was added to this solution to give a final quantity of 400 ng/L for a further 15 min incubation at room temperature. The mixture (50 μL) was placed in each well of a 4-well multi-chamber plate. Porphyrin uptake assays were carried out after the 48 h transfection according to the previously mentioned method. The sequence of siRNA in this experiment was as follows: rat HCP1 siRNA: sense1:ccaaaguccacgaggcuuuTT, antisense1:aaagccucguggacuuuggTT, sense2:ggguacuggagaagguuaaTT, antisense2:uuaaccuucuccaguacccTT, sense3:

CANCER CELLS UPTAKE PORPHYRINS VIA HEME CARRIER PROTEIN 1 39
Copyright © 2013 World Scientific Publishing Company J. Porphyrins Phthalocyanines 2013; 17: 39–43
gaguaaaggagauggcauuTT, antisense3:aaugccaucuccuuuacucTT, human HCP1 siRNA mixture:sense1:cgguagagccgcuggucuuTT, antisense1:aagaccagcggcucuaccgTT, sense2:cccugaagcuccugcaguaTT, antisense2:uacugcaggagcuucagggTT, sense3:ggacaacaguggaggguauTT, antisense3:auacccuccacuguuguccTT, control siRNA: sense1:auccgcgcgauaguacguaTT, antisense1:uacguacyaucgcgcggauTT, sense2:uuacgcguagcguaauacgTT, antisense2:cguauuacgcuacgcguaaTT, sense3: uauucgcgcguauagcgguTT, antisense3:accgcuauacgcgcgaauaTT.
Statistical analysis
Data are presented as means ± SD where indicated. Groups were compared using Student’s t test. Statistical significance was accepted at a level of *p < 0.05, **p < 0.01 or ***p < 0.001.
RESULTS
Increase of porphyrin accumulation and cell damage caused by PDT in HCP1-overexpressed HeLa cells
We confirmed exogenous expression of the HCP1 gene by immunohistochemistry and quantitative PCR. Transfection of pEB6CAG-HCP1 vector significantly increased HCP1 mRNA in the quantitative PCR (Fig. 1a) and clearly increased HCP1 protein in the graphic analysis of pictures of anti-HCP1 immunohistochemistry (Fig. 1b).
Next, we assessed the activity of HP uptake. After the treatment with 0.1 mM HP, a higher intensity of HP
fluorescence was detected by fluorescent microscopy in transfected cells under excitation with 415 nm light (Fig. 2a). The fluorescence HPLC analysis confirmed that HP accumulation was significantly increased in HCP1-overexpressed HeLa cells (Fig. 2b). These data clearly indicated that the increased expression of HCP1 resulted in significantly excessive porphyrin accumulation.
Then, we assessed the susceptibility to PDT. We examined the effect of the HCP1 gene transfection on the efficacy of photodynamic therapy. After exposure to light, the absorption of the HCP1-overexpressed HeLa cells was significantly lower than the control HeLa cells (Fig. 3). HCP1 expression significantly increased the phototoxity of PDT.
HCP1 protein expression in gastric cancer cells and lung cancer cells
To determine whether gastric cancer cells and lung cancer cells express HCP1, we carried out immunohistochemistry of these cells. The results indicated that gastric cancer AGS cells and lung cancer A549 cells express HCP1 proteins (Figs 4a and 4b). Interestingly rat gastric mucosa-derived RGM1 cells slightly expressed HCP1 proteins, whereas RGK36 cells, a chemically transformed mutant of RGM1, highly expressed HCP1 proteins.
Decrease in porphyrin accumulation due to silencing of HCP1
To confirm the contribution to HCP1 on HP accu-mulation, we silenced HCP1 mRNA by HCP1-siRNA
Fig. 1. Transfection of pEB6CAG-HCP1 vector increased HCP1 expression. (a) The result of quantitative PCR of HCP1 in the HeLa cells. N = 6, **p < 0.01 (b) The fluorescence immunostaining imaging of HCP1 in the cells. N = 6, **p < 0.01

40 K. HIYAMA ET AL.
Copyright © 2013 World Scientific Publishing Company J. Porphyrins Phthalocyanines 2013; 17: 40–43
Fig. 2. HCP1 overexpressed cells (HCP1 OE) increased HP accumulation. (a) HP fluorescence microscopy analysis. N = 100, ***p < 0.001. The fluorescence intensities of individual cells (n = 100) in fluorescence microscopy study were the following; fluorescence intensity of control HeLa cells was 19.050 ± 2.770 and that of HCP1-overexpressed HeLa cells was 42.155 ± 6.983. (b) HP HPLC analysis. The result of fluorescence intensity was calculated based on the standard curve oh HP. N = 3, *p < 0.05. The HPLC fluorescence spectrum was the same as the standard HP spectrum. Fluorescence intensities were calculated by the HP standard curve
Fig. 3. Phototoxicity of PDT on HCP1-overexpressed HeLa cells and control HeLa cells. The absorption was divided by that of each non-HP administrated cell. In 5 and 10 μM HP, cell viabilities of HCP1-overexpressed HeLa that were treated with PDT were significantly lower than control PDT-treated HeLa cells. The statics was calculated between laser irradiated HCP1-overexpressed cells (HCP1 OE laser (+)) and laser irradiated control cells (control laser (+)), N = 16, **p < 0.01, and between unirradiated HCP1-overexpressed cells (HCP1 OE laser (-)) and unirradiated control cells (control laser (-)), N = 16, not significant. It is also notable that the efficacy of PDT was dependent on the HP dose

CANCER CELLS UPTAKE PORPHYRINS VIA HEME CARRIER PROTEIN 1 41
Copyright © 2013 World Scientific Publishing Company J. Porphyrins Phthalocyanines 2013; 17: 41–43
Fig. 4. Fluorescence immunostaining of RGM1, RGK36, AGS and A549 cells with anti-HCP1 antibody. (a) Pictures of anti-HCP1 immunostaining. (b) The result of fluorescence intensity in individual cells. This indicated that fluorescence intensities of cancer cells (AGS and A549) and mutant cells (RGK36) significantly increased compared to gastric mucosal RGM cells, suggesting that HCP1 protein expression was increased in these cancer cells. N = 20, **p < 0.01
Fig. 5. HCP1 was silenced in RGK36, AGS and A549 cells (HCP1 KD) and the HP accumulation was examined after giving 0.1 mM HP. (a) Pictures of HP fluorescence imaging. (b) The result of fluorescence intensity in individual cells. N = 100, ***p < 0.001. Silencing HCP1 significantly decreased HP accumulation in all cancer cells. This indicates that silencing HCP1 significantly decreased HP uptake

42 K. HIYAMA ET AL.
Copyright © 2013 World Scientific Publishing Company J. Porphyrins Phthalocyanines 2013; 17: 42–43
in RGK36 cells, AGS cells and A549 cells, and assessed the accumulation of HP. After addition of 0.1 mM HP, these cells were analyzed with a fluorescence microscope under exposure to a laser with 415 nm excitation. The fluorescence microscopy analysis confirmed that the fluorescence intensities of HP in these HCP1-silenced cells were significantly lower than those of control cells (Figs 5a and 5b).
DISCUSSION
In this study, we demonstrated that HCP1-over-expression was involved in a larger amount of porphyrin-accumulation than that of control cells: the fluorescence intensity of uptaken porphyrins was twice or more that of control cells. We also demonstrated that the cytotoxicity of the HCP1-overexpressed cells after PDT was significantly higher than that of the control cells, while there was no significant difference in cytotoxicity between the control cells and the HCP1-overexpressed cells without laser beam irradiation. In addition, we demonstrated that HCP1-silenced cancer cells decreased HP uptake up to about a half or less than that of control cells. We concluded that cancer cells express HCP1 and the altered expression of HCP1 affected the amount of exogenous porphyrin uptake and the efficacy of PDT. HCP1 is most likely a novel transporter from which exogenous porphyrins are indeed imported.
We found that the HCP1 expression was high in RGK36 cells, while slight in RGM1 cells. We also demonstrated that AGS, a human gastric carcinoma cell line, A549, a human lung carcinoma cell line and HeLa, a cervical carcinoma cell line, all highly expressed HCP1. Since RGK36 is a neoplastic mutant cell line established from RGM1, an immortalized rat gastric mucosa-derived cell line, neoplastic mutation seems to be involved in HCP1 expression.
There have been several reports on porphyrin uptake into cancer cells or the correlation between a certain protein and PDT efficacy. Naito et al. reported that cancer cells imported porphyrins via the hemopexin receptor as a complex of hemopexin and porphyrins [20]. Laura et al. reported that cancer cells imported porphyrins via the low-density-lipoprotein (LDL) receptor as a complex of LDL and porphyrins [21]. These theses mean that the hemopexin receptor or the LDL receptor incidentally transported porphyrins as the result of transportation of hemopexin or LDL conjugated substances. As described before, we first demonstrated a mechanism of cancer cell-unique porphyrin transportation via HCP1 in this study. HCP1 is most likely to directly transport porphyrins including heme, Fe- protoporphyrin IX. Misawa et al. reported that the expression of lipoprotein receptors affected PDT efficacy [22]. Luna et al. also reported that the expression of the alpha-macroglobulin receptor affected PDT efficacy [23]. Both of these reports examined
the relationships between the amount of expression of these receptors and PDT efficacy; however, there was no examination of porphyrin uptake itself. Therefore, it was not clear whether the PDT efficacy differed according to the amount of porphyrins accumulated through these receptors. Additionally, Krishnamurthy et al. reported that accumulation of porphyrin is caused by a mutation in an efflux transporter, ATP binding cassette G2 (ABCG2) [24]. However, most cancer cells which are treated by PDT begin to over-express ABCG2, which in turns renders them drug resistant to various antineoplastic agents by actively pumping them out [25]. Although the mutation of ABCG2 may involve porphyrin accumulation, it is a fact that ABCG2 does not transport extracellular porphyrins, only excrete intracellular porphyrins. Therefore, there was no report until now demonstrating a superficial direct transporter by which porphyrins are transported. HCP1 expression in carcinoma cells probably plays a very important role in porphyrins transportation.
HCP1 has been reported to be the same protein as a solute carrier 46A1 (SLC46A1) which was reported as a heme and folic acid transporter in the human duodenum [12, 26]. Heme and its precursor, porphyrins, are necessary for redox enzymes, and folic acid is necessary for both DNA and amino acids synthesis. In carcinoma cells, a requirement for vital proteins for cellular proliferations probably increases. Moreover, since the concentrations of reactive oxygen species are higher in carcinoma cells, the need for redox enzymes also probably increases [27, 28]. These requirements may lead to the high level of the cancer cellular expression of HCP1.
CONCLUSION
We propose for the first time that HCP1 is one of the major transporters of porphyrins as well as heme in cancer cells because several cancer cells express HCP1 and the overexpression or silence of this protein resulted in an increase or a decrease in porphyrin accumulation. The cancer cell specific apoptosis in PDT must be induced by this phenomenon. We also propose that the assessment of the HCP1 expression in cancer tissue, which we can easily gain by biopsy for example, can be a clue to predict the effect of PDT and the likely response to this therapy.
Acknowledgements
We thank Brian K. Purdue for copy editing this article. This study was supported in part by Grant-in-Aid for Exploratory Research (#23659576).
Supporting information
HCP1 western blotting is given in the supplementary material (Fig. S1). This material is available free of charge via the Internet at http://www.worldscinet.com/jpp/jpp.shtml.

CANCER CELLS UPTAKE PORPHYRINS VIA HEME CARRIER PROTEIN 1 43
Copyright © 2013 World Scientific Publishing Company J. Porphyrins Phthalocyanines 2013; 17: 43–43
Abbreviations
HCP1: heme carrier protein 1, HP: hematoporphyrin derivatives, FCS: fetal calf serum, LASER: light amplification by stimulated emission of radiation, PDT: photodynamic therapy, ROS: reactive oxygen species, siRNA: single interfering ribonucleic acid, SLC46A1: solution carrier 46A1.
REFERENCES
1. Dougherty TJ, Kaufman JE, Goldfarb A, Weishaupt KR, Boyle D and Mittleman A. Cancer Res. 1978; 38: 2628–2635.
2. Collins AS and Garner M. Crit. Care Nurse 2007; 27: 53–60.
3. Chen M, Pennathur A and Luketich JD. Lasers Surg. Med. 2006; 38: 396–402.
4. Takahira K, Sano M, Arai H and Hanai H. Lasers Med. Sci. 2004; 19: 89–94.
5. Zawacka Pankau J, Krachulec J, Grulkowski I, Bielawski KP and Selivanova G. Toxicol. Appl. Pharmacol. 2008; 232: 487–497.
6. Gomer CJ, Ferrario A, Luna M, Rucker N and Wong S. Lasers Surg. Med. 2006; 38: 516–521.
7. Ell C, Gossner L, May A, Schneider HT, Hahn EG, Stolte M and Sroka R. Gut 1998; 43: 345–349.
8. Dougherty TJ, Gomer CJ, Henderson BW, Jori G, Kessel D, Korbelik M, Moan J and Peng Q. J. Natl. Cancer Inst. 1998; 90: 889–905.
9. Kim AS and Johnston SC. Circulation 2011; 124: 314–323.
10. Biccard BM and Rodseth RN. Br. J. Anaesth. 2011; 107: 133–143.
11. Diamond I, Granelli SG, McDonagh AF, Nielsen S, Wilson CB and Jaenicke R. Lancet 1972; 2: 1175–1177.
12. Shayeghi M, Latunde Dada GO, Oakhill JS, Laftah AH, Takeuchi K, Halliday N, Khan Y, Warley A, McCann FE, Hider RC, Frazer DM, Anderson GJ, Vulpe CD, Simpson RJ and McKie AT. Cell 2005; 122: 789–801.
13. Diatchenko L, Lau YF, Campbell AP, Chenchik A, Moqadam F, Huang B, Lukyanov S, Lukyanov K,
Gurskaya N, Sverdlov ED and Siebert PD. Proc. Natl. Acad. Sci. USA 1996; 93: 6025–6030.
14. Oates PS and West AR. World J. Gastroenterol. 2006; 12: 4281–4295.
15. Krishnamurthy P, Xie T and Schuetz JD. Pharmacol. Ther. 2007; 114: 345–358.
16. Latunde Dada GO, Takeuchi K, Simpson RJ and McKie AT. FEBS Lett. 2006; 580: 6865–6870.
17. Kobayashi I, Kawano S, Tsuji S, Matsui H, Nakama A, Sawaoka H, Masuda E, Takei Y, Nagano K, Fusamoto H, Ohno T, Fukutomi H and Kamada T. In Vitro Cell Dev. Biol. Anim. 1996; 32: 259–261.
18. Shimokawa O, Matsui H, Nagano Y, Kaneko T, Shibahara T, Nakahara A, Hyodo I, Yanaka A, Majima HJ, Nakamura Y and Matsuzaki Y. In Vitro Cell Dev. Biol. Anim. 2008; 44: 26–30.
19. Tanaka J, Miwa Y, Miyoshi K, Ueno A and Inoue H. Biochem. Biophys. Res. Commun. 1999; 264: 938–943.
20. Naitoh Y, Taketani S, Tokunaga R and Sameshima Y. J. Biochem. 1988; 103: 973–978.
21. Polo L, Valduga G, Jori G and Reddi E. Int. J. Biochem. Cell Biol. 2002; 34:10–23.
22. Misawa J, Moriwaki S, Kohno E, Hirano T, Tokura Y and Takigawa M. J. Dermatol. Sci. 2005; 40: 59–61.
23. Luna MC, Ferrario A, Rucker N and Gomer CJ. Cancer Res. 1995; 55: 1820–1823.
24. Krishnamurthy P, Ross DD, Nakanishi T, Bailey Dell K, Zhou S, Mercer KE, Sarkadi B, Sorrentino BP and Schuetz JD. J. Biol. Chem. 2004; 279: 24218–24225.
25. Ejendal KF and Hrycyna CA. Curr. Protein Pept. Sci. 2002; 3: 503–511.
26. Qiu A, Jansen M, Sakaris A, Min SH, Chattopadhyay S, Tsai E, Sandoval C, Zhao R, Akabas MH and Goldman ID. Cell 2006; 127: 917–928.
27. Rondoni P and Cudkowicz G. Experientia 1953; 9: 348–349.
28. Irani K, Xia Y, Zweier JL, Sollott SJ, Der CJ, Fearon ER, Sundaresan M, Finkel T and Goldschmidt Clermont PJ. Science 1997; 275: 1649–1652.

Journal of Porphyrins and PhthalocyaninesJ. Porphyrins Phthalocyanines 2013; 17: 44–55
DOI: 10.1142/S1088424612501271
Published at http://www.worldscinet.com/jpp/
Copyright © 2013 World Scientific Publishing Company
INTRODUCTION
10,15-dihydro-5H-diindeno[1,2-a;1′,2′-c]fluorene (Truxene), a C3h symmetric polycyclic hydrocarbon, has intensively been considered as a promising building block to construct active materials in liquid crystals, supramolecular organizations and molecular energy donors [1]. Moreover, the truxene unit can also easily be functionalized in three directions at the C-2, C-7 and C-12 positions to serve as an excellent platform for the design of large star-shaped architectures [2–7]. In addition, recently synthesized truxene derivatives including a
variety of star-shaped oligomers and dendritic structures with extended π-conjugations of the polyaromatic core, as well as truxene-based donor–acceptor systems, have shown some potential applications such as in two-photon absorption [8], organic light-emitting diodes (OLED) [9], NLO chromophores [10, 11] and organic fluorescent probes [12].
To the best of our knowledge, there is only one report in which the truxene unit is covalently linked to a porphyrin core (through a benzene bridge) [13] where evidence for energy transfer has qualitatively been demonstrated. Recently, one of us has reported a series of four dyads systems where the porphyrin central cores are flanked by four truxene and tritruxene units (see TetraTruP, TetraTruZnP, DodecaTruP and DodecaTruZnP in Chart 1) [14]. Efficient quenching of the truxene fluorescence and phosphorescence was
Shape-persistent poly-porphyrins assembled by a central
truxene: synthesis, structure, and singlet energy transfer
behaviors
Hai-Jun Xua, Bin Dub, Claude P. Gros*a , Philippe Richarda, Jean-Michel Barbea
and Pierre D. Harvey*b
a Université de Bourgogne, ICMUB (UMR 6302), 9, Avenue Alain Savary, BP 47870, 21078 Dijon Cedex, France b Département de Chimie, Université de Sherbrooke, Sherbrooke, Québec J1K 2R1, Canada
Received 3 June 2012Accepted 20 July 2012
ABSTRACT: Four dyad systems composed of a central truxene and either one or three -substituted zinc(II) porphyrins (ZnP: TruZnP (7) and TruTriZnP (9)) or free-bases (H2P: TruP (6) and TruTriP (8)) have been prepared. The presence of β-methyl groups minimizes π-conjugation through the quasi right angle made by the porphyrin and the truxene planes, and renders these dyads relatively rigid. The position of the absorption and emission 0–0 peaks confirms the role of the truxene and porphyrin as the energy donor and acceptor, respectively. Selective excitation of the truxene results in an efficient singlet energy transfer (S1 ET) from the truxene to the porphyrin unit. The rates for S1 ET (kET) are extracted from the change in the fluorescence lifetime of truxene in the presence and absence of the acceptor, and are temperature independent, (TruP (6), TruTriP (8), TruZnP (7) and TruTriZnP (9) are 5.0, 1.4, 1.0 and 1.4 at 298 K and 5.9, 1.3, 2.6, and 0.86 (ns)-1 at 77 K, respectively), consistent with their relative rigidity. These kET’s are similar to other related but more flexible systems reported by one of us (Inorg. Chem. 2011, 50, 11493–11505). The kET’s time scale was assumed, based on modeling, to be related with hindered rotations about the truxene-porphyrin C–C bonds due to steric hexyl–hexyl interactions. This work confirms this earlier conclusion was correct.
KEYWORDS: truxene, porphyrin, fluorescence, singlet energy transfer.
SPP full member in good standing
*Correspondence to: Pierre D. Harvey, email: [email protected] and Claude P. Gros, email: Claude.Gros@ u-bourgogne.fr

SHAPE-PERSISTENT POLY-PORPHYRINS ASSEMBLED BY A CENTRAL TRUXENE 45
Copyright © 2013 World Scientific Publishing Company J. Porphyrins Phthalocyanines 2013; 17: 45–55
noted and the rate for energy transfers (singlet and triplet) was found somewhat placed mid-range with respect to the closely related porphyrin-containing dyads [15]. It was argued that the dihedral angle between the truxene and the porphyrin planes was large due to steric hindrance between the hexyl chains (based on computer modeling) and consequently, the poor π-orbital overlap and unfavorable relative orientation of the transition moments of the donor and acceptor
chromophores, led to slower rates despite the direct C–C bond linking both. In the absence of convincing argument about this dihedral angle, such explanation remains tentative. We now wish to report a new series of truxene-porphyrin series where methyl groups are introduced at the β-positions of the porphyrin unit forcing the dihedral angle to be right (90°), hence allowing to deduce the correct conclusion regarding the energy transfer.
6 (TruP): M = 2H
7 (TruZnP): M = Zn
8 (TruTriP): M = 2H, R= n-hexyl
9 (TruTriZnP): M = Zn,R= n-hexyl
R1
R1
R1
R1
R1R1
R2
R2
N
N
N
N
R1
R1
R1R1
R1
R1
R2
R2
R1
R1
R1
R1
R1 R1
R2
R2
R1
R1
R1R1
R1
R1
R2
R2
M
N
N N
N
R
R
RR
RR
M
N
N N
N
R
R
RR
RR
M
N
N
N
NM
N
N
N
N
M
Et4Me4PZn
N
N N
N
M
(TetraTruP): M = 2H,R1= n-hexyl, R2 = H
(TetraTruZnP): M = Zn,R1= n-hexyl, R2 = H
(DodecaTruP): M = 2H, R1= n-hexyl, R2 = Truxene
(DodecaTruZnP): M = Zn, R1= n-hexyl, R2 = Truxene
25
7
10
12
15
Chart 1. Structures of the currently (up) and previously (down) studied dyads
46 H.-J. XU ET AL.
Copyright © 2013 World Scientific Publishing Company J. Porphyrins Phthalocyanines 2013; 17: 46–55
EXPERIMENTAL
Instruments1H NMR spectra were recorded with a Bruker DRX-
300 AVANCE transform spectrometer at the “Pôle Chimie Moléculaire (Welience, UB-Filiale)”; chemical shifts are expressed in ppm relative to chloroform. UV-vis spectra were recorded with a Varian Cary 1 spectrophotometer. Mass spectra were obtained with a Bruker Daltonics Ultraflex II spectrometer in the MALDI-TOF reflectron mode using dithranol as a matrix. The measurements were made at the “Pôle Chimie Moléculaire (Welience, UB-Filiale).” UV-vis spectra were recorded on a Hewlett-Packard diode array model 8452A. Emission and excitation spectra were obtained using a double monochromator Fluorolog 2 instrument from Spex. Fluorescence and phosphorescence lifetimes were measured on a Timemaster Model TM-3/2003 apparatus from PTI, incorporating a nitrogen laser as the source and a high-resolution dye laser (fwhm = 1.4 ns). Fluorescence lifetimes were obtained from high-quality decays and deconvolution or distribution lifetime analysis. The uncertainties ranged from 20 to 40 ps on the basis of multiple measurements. Phosphorescence lifetimes were determined using a PTI LS-100 incorporating a 1 μs tungsten flash lamp (fwhm 1 μs).
Quantum yield measurements
For measurements at 298 K, all samples were prepared in a glovebox, under argon (O2 < 12 ppm), by dissolution of the compounds in 2MeTHF, using 1 cm3 quartz cells with a septum. Three different measurements (i.e. different solutions) were performed for each set of photophysical data (quantum yield). The sample concentrations were chosen to correspond to an absorbance of 0.05 at the excitation wavelength. Each absorbance value was measured five times for better accuracy in the measurements of emission quantum yield. The references were tetraphenylporphyrin free-base (0.10 in THF) [16] or tetraphenylporphyrin zinc(II) (0.033 in THF) [17, 18].
Chemicals and reagents
Unless otherwise stated, all chemicals and solvents were of analytical reagent grade and used as received. Absolute dichloromethane (CH2Cl2) was obtained from Carlo Erba. Silica gel (Merck; 70–120 mm) was used for column chromatography. Analytical thin-layer chromatography was performed with Merck 60 F254 silica gel (precoated sheets, 0.2 mm thick). Reactions were monitored by thin-layer chromatography, UV-vis spectroscopy and MALDI/TOF mass spectrometry. Truxene [19], hexahexyltruxene (3) [4, 12], tribromohexahexyltruxene (4b) [4, 12], and tricarbaldehyde hexahexyltruxene (5b) [20] were synthe-sized as previously reported in the literature.
5,5′,10,10′,15,15′-Hexahexyl-2-bromotruxene (4a). To a stirred solution of 3 (6.63 g, 7.82 mmol) in CH2Cl2 (50 mL) was added bromine (2.0 mL) over an hour period at 0 °C in the dark. The solution was heated to room temperature and stirred overnight. The reaction was monitored by 1H NMR. After the reaction was finished, excess bromine was removed by washing the reaction mixture with a sodium dithionite solution. The residue was extracted with CH2Cl2, and the solution was washed with an aqueous solution of sodium carbonate and dried over magnesium sulfate. The solvent was removed under reduced pressure. The pure product was obtained after purification by column chromatography on silica gel (heptane) and recrystallization from ethanol. Yield: 7.06 g (83.2%) of a yellow crystalline compound was obtained, mp 225–226 °C. 1H NMR (CDCl3): δ, ppm 8.21 (1H, d, J = 8.4 Hz), 8.01 (1H, s, Ar-H), 7.90 (2H, m, H-truxene), 7.61 (1H, d, J
= 6.9 Hz), 7.56 (6H, dd, J = 8.4 Hz, J = 6.9 Hz), 3.00–2.78 (6H, m, -CH2-), 2.15–1.95 (6H, m, -CH2-), 1.06–0.80 (36H, m, -(CH2)3-), 0.60–0.56 (12H, m, -CH2-), 0.46 (18H, t, J = 7.0 Hz, -CH3). MS (MALDI-TOF): m/z 924.57 [M] , 924.61 calcd. for C63H89Br. UV-vis (CH2Cl2): λmax, nm (ε × 10-3 M-1.cm-1) 280.1 (41.2), 296.2 (41.8), 307.0 (67.0).
5,5′,10,10′,15,15′-Hexahexyltruxene-2-carbalde-hyde (5a). To a stirred solution of 4a (2.44 g, 2.25 mmol) in anhydrous ethyl ether (120 mL) was added n-BuLi (8.20 mL, 2.5 M in hexane, 20.3 mmol) at -78 °C under nitrogen. The mixture was first stirred for 0.5 h at this temperature, then allowed to warm to room temperature and stirred for 0.5 h, cooled again to -78 °C, and DMF (1.60 g, 22.0 mmol) was then added. The solution was stirred overnight while returning to room temperature gradually. HCl (2 M, 100 mL) was added and the mixture was stirred for 2 h. The organic layer was separated, the aqueous layer extracted with ethyl ether. The combined organic extracts were dried over MgSO4. After removal of the solvents under vacuum, the residue was purified by chromatography on silica gel eluting first with petroleum ether then increasing to petroleum ether/EtOAc (8:1 v/v) to give the desired title product as a pale white solid (yield: 1.45 g, 74%). 1H NMR (CDCl3, 300 MHz): δ, ppm 10.16 (1H, s, -CHO), 8.56 (1H, d, J = 9.0 Hz, H-truxene), 8.40 (2H, m, H-truxene), 8.01 (1H, s, Ar-H), 7.94 (1H, d, J = 6.0 Hz, H-truxene), 7.51–7.40 (6 H, m, H-truxene), 3.08–2.88 (6H, m, -CH2-), 2.23–2.13 (6H, m, -CH2-), 0.94–0.88 (36H, m, -(CH2)3-), 0.62–0.59 (12H, m, -CH2-), 0.51 (18H, t, J = 6.0 Hz, -CH3). MS (MALDI-TOF): m/z 874.68 [M] , 874.69 calcd. for C64H90O1. UV-vis (CH2Cl2): λmax, nm (ε × 10-3 M-1.cm-1) 280.9 (41.5), 295.9 (42.3), 308.0 (66.0).
2-(13,17-Diethyl-2,3,7,8,12,18-hexamethylpor-phyrin-5-yl)-5,5′,10,10′,15,15′-hexahexyltruxene TruP (6). A solution of 5a (175 mg, 0.20 mmol) and 1,19-dideoxy-8,12-diethyl-2,3,7,13,17,18-hexamethyl-a,c-biladien 2 (120 mg, 0.20 mmol) in ethanol (100 mL) was refluxed, and nitrogen was bubbled through the

SHAPE-PERSISTENT POLY-PORPHYRINS ASSEMBLED BY A CENTRAL TRUXENE 47
Copyright © 2013 World Scientific Publishing Company J. Porphyrins Phthalocyanines 2013; 17: 47–55
system. Then, 10.0 mL of a solution of para-toluene sulfonic acid (PTSA, 1.50 g) in ethanol was slowly added during 18 h. The deep red solution was refluxed for 48 h under N2. The organic solvent was removed under reduced pressure. The residue was dissolved in CHCl2, washed with saturated NaHCO3 aqueous solution. The organic solution was separated by use of a separatory funnel. A saturated methanolic solution of Zn(OAc)2·2H2O (10.0 mL) was added, and the solution was stirred for 4 h at room temperature. The solvent was removed under vacuum and the remaining residue was purified by repeated column chromatography on silica gel with 60% CH2Cl2-heptane as eluents. The bright red band eluted was collected, dried, and redissolved in CHCl3 (100 mL). The solution was vigorously stirred with 10% HCl (10.0 mL) for 0.5 h. The solution was neutralized with a saturated aqueous sodium carbonate solution, and the reaction mixture was stirred for an additional 15 min. The organic phase was separated, washed with water (3 × 50 mL), and dried over MgSO4. The organic solvent was removed. The remaining residue was purified by repeated column chromatography on silica gel with CH2Cl2. The pure title compound 6 was obtained as a purple solid after recrystallization from CH2Cl2/methanol. Yield: 75 mg, 29%. 1H NMR (CDCl3): δ, ppm 10.21 (s, 2H, H-meso), 9.99 (s, 1H, H-meso), 8.75 (d, 1H, J = 8.7 Hz, H-truxene), 8.50–8.43 (m, 2H, H-truxene), 8.26 (d, 1H, J = 1.8 Hz, H-truxene), 8.08–8.04 (m, 1H, H-truxene), 7.55–7.42 (m, 6H, H-truxene), 4.11 (q, 4H, -CH2-CH3), 3.68 (s, 6H, -CH3), 3.56 (s, 6H, -CH3), 3.25 (m, 2H, -CH2-(CH2)5CH3), 3.08 (m, 4H, -CH2-(CH2)5CH3), 2.60 (s, 6H, -CH3), 2.22 (m, 6H, -CH2-(CH2)5CH3), 1.92 (t, 6H, J = 7.5 Hz, -CH2CH3), 1.17–0.94 (m, 36H, -CH2(CH2)3CH2CH3), 0.84–0.68 (m, 30H, -(CH2)4CH2CH3), -3.04 (s, 1H, NH), -3.20 (s, 1H, NH). HR-MS (MALDI-TOF): m/z 1294.9615 [M] , 1294.9664 calcd. for C93H122N4. UV-vis (CH2Cl2): λmax, nm (ε × 10-3 M-1.cm-1) 281.1 (40.5), 296.0 (42.3), 308.1 (65.5), 404.0 (201.9), 501.0 (15.7), 535.0 (6.1), 570.0 (6.6).
Zn-2-(13,17-diethyl-2,3,7,8,12,18-hexamethyl-porphyrin-5-yl)-5,5′,10,10′,15,15′- hexahexyltruxene TruZnP (7). A saturated methanolic solution of Zn(OAc)2·2H2O (5.0 mL) was added to a solution of 6 (30 mg, 0.023 mmol) in CHCl3 (30 mL). The reaction mixture was stirred overnight and the solvent was removed. The solid residue was purified by flash column chromatography on silica gel with a 60% CH2Cl2-heptane mixture followed by recrystallization from CH2Cl2/methanol to afford pure 7, as bright red crystals, in quantitative yield. 1H NMR (CDCl3): δ, ppm 10.02 (s, 2H, H-meso), 9.83 (s, 1H, H-meso), 8.66 (d, 1H, J = 7.8 Hz, H-truxene), 8.40–8.33 (m, 2 H, H-truxene), 8.17 (d, 1H, J = 1.8 Hz, H-truxene), 8.02–7.99 (m, 1H, H-truxene), 7.49–7.30 (m, 6H, H-truxene), 3.97 (q, 4H, -CH2CH3), 3.53 (s, 6H, -CH3), 3.46 (s, 6H, -CH3), 3.18 (m, 2H, -CH2(CH2)4CH3), 2.98 (m, 4H, -CH2(CH2)4CH3),
2.51 (s, 6H, -CH3), 2.21–2.09 (m, 6H, -CH2(CH2)4CH3), 1.79 (t, 6H, J = 7.8 Hz, -CH2CH3), 1.11–0.87 (m, 36H, -CH2(CH2)4CH3), 0.76–0.58 (m, 30H, -(CH2)4CH2CH3). HR-MS (MALDI-TOF): m/z 1356.8793 [M] , 1356.8804 calcd. for C93H120N4Zn. UV-vis (CH2Cl2): λmax, nm (ε × 10-3 M-1.cm-1) 280.0 (47.7), 308.1 (76.0), 406.0 (263.8), 534.0 (14.3), 570 (11.3).
2,7,12-Tri-(13,17-diethyl-2,3,7,8,12,18-hexamethy-lporphyrin-5-yl)-5,5′,10,10′,15,15′-hexahexyltruxene TruTriP (8). A solution of 5b (373 mg, 0.40 mmol) and 1,19-dideoxy-8,12-diethyl-2,3,7,13,17,18-hexamethyl-a,c-biladien 2 (723 mg, 1.20 mmol) in ethanol (100 mL) was heated to reflux, and nitrogen was bubbled through the system. Then, 10.0 mL of a solution of PTSA (1.50 g) in ethanol was added slowly during 18 h. The deep red solution was refluxed for 48 h under N2. The organic solvent was removed under reduced pressure. The residues were dissolved in CH2Cl2, washed with saturated NaHCO3 aqueous solution. The organic solution was separated. A saturated methanolic solution of Zn(OAc)2·2H2O (10.0 mL) was added, and the solution was stirred for 4 h at room temperature. The solvent was removed and the remaining residue was purified by repeated column chromatography on silica gel with 70% CHCl3-heptane as eluents. The bright red band that eluted was collected, dried, and redissolved in CHCl3 (100 mL). The solution was vigorously stirred with 10% HCl (10.0 mL) for 0.5 h. The solution was neutralized with a saturated aqueous sodium carbonate solution, and the reaction mixture was stirred for an additional 15 min. The organic phase was then separated, washed with water (3 × 50 mL), dried over MgSO4. The organic solvent was removed under vacuum. The remaining residue was purified by repeated column chromatography on silica gel with CH2Cl2, and CHCl3. The pure title compound 8 was obtained as a purple solid (57 mg, 13%) by recrystallization from CH2Cl2/methanol. 1H NMR (CDCl3): δ, ppm 10.13 (s, 6H, H-meso), 9.89 (s, 3H, H-meso), 8.79 (d, 3H, J = 8.4 Hz, H-truxene), 8.31 (s, 3H, H-truxene), 8.03 (d, 3H, J = 8.4 Hz, H-truxene), 4.01 (q, 12H, -CH2CH3), 3.59 (s, 18H, -CH3), 3.52 (s, 18H, -CH3), 3.36 (m, 6H, -CH2(CH2)4CH3), 2.62 (s, 18H, -CH3), 2.41 (m, 6H, -CH2(CH2)4CH3), 1.82 (t, 18H, J = 7.5 Hz, -CH2CH3), 1.28–1.25 (m, 48H, -CH2(CH2)4CH3), 0.93–0.87 (t, 18H, J = 7.5 Hz, -CH2(CH2)4CH3), -3.00 (s, 3H, NH), -3.19 (s, 3H, NH). HR-MS (MALDI-TOF): m/z 2191.5042 [M] , 2191.4923 calcd. for C153H186N12. UV-vis (CH2Cl2): λmax, nm (ε × 10-3 M-1.cm-1) 284.0 (51.1), 311.0 (67.0), 407.1 (641.5), 502.0 (51.8), 535.9 (19.9), 571.0 (21.7), 625.1 (7.1).
Zn-2,7,12-tri(13,17-diethyl-2,3,7,8,12,18-hexame-thylporphyrin-5-yl)-5,5′,10,10′,15,15′-hexa hexyltru-xene TruTriZnP (9). A saturated methanolic solution of Zn(OAc)2·2H2O (3.0 mL) was added to a solution of 8 (10 mg, 0.0046 mmol) in CHCl3 (30 mL). The reaction mixture was stirred overnight and the solvent was removed. The solid residue was purified by flash column

48 H.-J. XU ET AL.
Copyright © 2013 World Scientific Publishing Company J. Porphyrins Phthalocyanines 2013; 17: 48–55
chromatography on silica gel with 70% CHCl3-heptane as eluents followed by recrystallization from CH2Cl2/methanol to afford pure 9 as bright red crystals (yield: 10 mg, 92%). 1H NMR (CDCl3): δ, ppm 9.99–9.42 (m, 6 H, H-meso), 8.99 (m, 3H, H-meso), 8.78–8.71 (m, 6H, H-truxene), 8.20 (d, 3H, J= 5.1 Hz, H-truxene), 3.62 (m, 18H, -CH2-), 3.50 (s, 18H, -CH3), 3.32 (m, 6H, -CH2-), 3.20 (s, 12H, -CH3), 2.77 (m, 24H, -CH2-), 1.50–1.42 (m, 48H, -CH2-), 1.18–1.07 (m, 24H, -(CH2)4CH2CH3), 0.81–0.78 (m, 12H, -(CH2)4CH2CH3). HR-MS (MALDI-TOF): m/z 2377.2059 [M] , 2377.2323 calcd. for C153H180N12Zn3. UV-vis (CH2Cl2): λmax, nm (ε × 10-3 M-1.cm-1) 312.0 (48.7), 410.0 (588.3), 535.9 (33.5), 571.0 (24.9).
RESULTS AND DISCUSSION
Synthesis
3,4-dimethyl-1H-pyrrole-2-carboxylic acid 1 was readily obtained from the reaction of 3,4-dimethyl-1H-pyrrole-2-ethylcarboxylate with sodium hydroxide and then with acetic acid in 75% yield (Scheme 1). 3,3′-dicarboxy-5,5′-diformyl-4,4’-dimethyl-dipyrryl methane reacts with 1 in the presence of a hydrobromic acid/acetic acid solution in N2 atmosphere to give a,c-biladiene dibromide 2 in 77% yield, as described in the literature [21].
Scheme 2 shows the synthetic route to access to the mono- and tri- carbaldehydehexahexyltruxene (5a and 5b, respectively). In order to remove the reactive hydrogen atoms and to improve the solubility, full alkylation was
carried out at the 5-, 10-, and 15-positions, leading to 5,5,10,10,15,15-hexahexyltruxene [4] 3 in 84% yield.
Mono- or full tri-bromination of 3 afforded 4a and 4b in high yields [4, 12]. The mono-brominated derivative 4a was synthesized according to the reported procedure for the tris-brominated derivative 4b, only the molar ratio of the Br2 and truxene is different from the tris-brominated derivatives. In addition, the progress of the reaction was monitored by 1H NMR. By-products containing a little of di- or tris-brominated derivatives were observed. The pure compounds 4a and 4b were isolated after purification by chromatography column and recrystallization. Mono- (5a) or tri-carbaldehyde-hexahexyltruxene (5b) were obtained in 84% and 87% yields, respectively, by the mono- or tri-lithiation of 3 in the presence of dry DMF followed by hydrolysis of the intermediate imidate salt [7].
The syntheses of mono- or triporphyrins containing the truxene derivatives are outlined in Schemes 3 and 4, respectively. Based on our previously reported method [22], mono- (5a) or tricarbaldehydehexahexyltruxene (5b) and a,c-biladiene dibromide 2 were dissolved in ethanol and were reacted in the presence of para-toluenesulfonic acid (PTSA) for two days, redissolved in CH2Cl2 after removal of the reaction solvent under vacuum and washed with an excess of sodium hydrogen carbonate. Final purification by column chromatog-raphy on silica gel afforded the free base mono- or trisporphyrins TruP (6) and TruTriP (8) in 29 and 13% yield, respectively.
Standard procedures were then used to metalate the porphyrin core using zinc acetate. A solution of porphyrin TruP (6) or TruTriP (8) in CHCl3 was stirred
NH
CO2C2H5
1. NaOH, EtOH
2. acetic acidNH
CO2H
NH HN
OHC CHO
HBr/acetic acidethanol, N2
1
NH+
NH +HN
HN
2Br-
2
Scheme 1
C6H13C6H13
C6H13C6H13
C6H13
C6H131) n-BuLi/THF
2) n-C6H13Br
Br2/DCMC6H13
C6H13
C6H13C6H13
C6H13
C6H13
R1
Br
R1
1) n-BuLi/Et2O
2) DMF
C6H13C6H13
C6H13C6H13
C6H13
C6H13
R1
CHO
R1
3 4a: R1 = H4b: R1 = Br
5a: R1 = H5b: R1 = CHO
2
5
7
1012
15
Truxene
Scheme 2

SHAPE-PERSISTENT POLY-PORPHYRINS ASSEMBLED BY A CENTRAL TRUXENE 49
Copyright © 2013 World Scientific Publishing Company J. Porphyrins Phthalocyanines 2013; 17: 49–55
with 4 equiv. of zinc acetate dihydrate dissolved in a small volume of absolute methanol at room temperature. The metalation reaction was monitored by UV-vis spectroscopy and MALDI-TOF mass spectrometry. The zinc complexes TruZnP (7) and TruTriZnP (9) were obtained in nearly quantitative yield.
Compounds 6–9 were characterized by 1H NMR, MALDI-TOF mass spectrometry, and UV-vis spectroscopy (Experimental section and Supporting information, SI). The 1H NMR spectrum of porphyrin TruTriP (8) displays two singlets at δ = 10.23 (6H) and 9.99 (3H) ppm, assigned to the nine meso-protons (Fig. 1). The chemical shifts for the internal NH-pyrrole resonances range between -3.00 and -3.19 ppm and appear as doublets due to the unsymmetrical porphyrinic structure. Nine aromatic protons placed at 8.89, 8.41
and 8.13 ppm, respectively, are ascribed to the truxene protons. In the aliphatic region, quartet signals at 4.11 (12H) ppm are accounting for the methylene protons connected to the pyrrole ring. The protons of the three different types of methyl groups linked to the pyrrole ring display signals located at 3.68, 3.62 and 2.72 ppm, respectively. The resonances of the β-methylene protons linked to the truxene appear as multiplets at 3.44 (6H) and 2.50 (6H) ppm.
The methyl protons of the long alkyl chains display signals at 1.01 ppm as triplets. However, the other alkyl chain protons are less well-defined with resonances in the 1.29–1.45 ppm range. Compounds TruP (6), TruZnP (7) and TruTriZnP (9) exhibit similar 1H NMR spectra as for TruTriP (8). Their 1H NMR data are given in the Experimental Section and their spectra are placed in the
NH+
NH +HN
HN
2Br-
2
ethanol, PTSA, N2reflux
C6H13C6H13
C6H13C6H13
C6H13C6H13
CHOC6H13
C6H13
C6H13
C6H13
C6H13
N NNN M
6 (TruP): M = 2H
7 (TruZnP): M = Zn
C6H13
Scheme 3
NH+
NH +HN
HN
2Br-
2C6H13
C6H13
C6H13C6H13
C6H13
C6H13
CHO
CHO
OHC C6H13
C6H13
C6H13C6H13
C6H13
C6H13
N
NN
N
N
NN
N
N
NN
N
8 (TruTriP): M = 2H
9 (TruTriZnP): M = Zn
M
M
M
ethanol, PTSA, N2reflux
Scheme 4

50 H.-J. XU ET AL.
Copyright © 2013 World Scientific Publishing Company J. Porphyrins Phthalocyanines 2013; 17: 50–55
SI. The truxene moiety of TruTriP (8) and TruTriZnP (9) has a perfect planar C3h symmetry with three peripheral porphyrin rings. Three para-C atoms (2-, 7-, 12-) exhibit an equilateral triangle with the edge length of
9.65 Å for TruTriP (8) and TruTriZnP (9), as reported in the literature [20].
By mass spectrometry, the molecular ions of the free-base porphyrins and metal complexes 6–9 were observed in each case as the most intense peak, and the data agree well with the expected molecular formula. For example, the HR-MS MALDI-TOF mass spectrum of TruTriP (8) exhibits the parent-ion peak at m/z = 2191.5042 (calculated for C153H186N12 m/z 2191.4923) (SI).
Spectroscopic and photophysical properties
The absorption spectra of the free base porphyrins (TruP (6) and TruTriP (8)) exhibit the intense Soret band (S0–S2 transition) at ~407 nm and the Q-bands (S0–S1 transitions) at ~502 nm at 298 K (see TruTriP (8) in Fig. 2).
For the zinc(II) porphyrins (TruZnP (7) and TruTriZnP (9)), the Soret and Q-bands are observed at ~410 nm and ~540 nm, respectively, at 298 K (Fig. 2). The absorption maxima in Soret and Q-bands for TruTriP (8) and TruTriZnP (9), exhibit very little variations relative to TruP (6) and TruZnP (7), respectively, illustrating the poor conjugation between the truxene and porphyrin units. This is consistent with the right angle formed by these aromatic planes as previously discussed by one of us [14], and the preliminary X-ray structure obtained for TruP (6) (below; ~90°; see Fig. S9).
The bands associated with the Tru unit are observed at ~310 nm and due to a truxene-centered π–π* transition [14]. The UV-visible data of the target porphyrins are
presented in Table 1 and the increase of the number of porphyrins (for example, the comparison between TruP (6) and TruTriP (8)) results in the obvious absorptivities enhancement, implying the increase in effective light harvesting ability.
The shape and positions of the Soret and Q-bands of the porphyrin units (TruP (6) and TruTriP (8)) are the same. Moreover, the fluorescence maxima of TruP (6) and TruTriP (8) are also almost the same further demonstrating that there is a very weak conjugation between porphyrin and truxene π-systems [14]. Finally, there is essentially no red-shift of Soret and Q-bands going from TruZnP (7) to TruTriZnP (9), further evidencing the poor conjugation between the porphyrin and truxene π-systems.
Fig. 1. Representative 1H NMR spectrum of porphyrin TruTriP (8) (300 MHz, 298 K, CDCl3, *CH2Cl2 (solvent))
Fig. 2. UV-vis spectra (CH2Cl2) of TruTriP (8) (black) and TruTriZnP (9) (red)

SHAPE-PERSISTENT POLY-PORPHYRINS ASSEMBLED BY A CENTRAL TRUXENE 51
Copyright © 2013 World Scientific Publishing Company J. Porphyrins Phthalocyanines 2013; 17: 51–55
The fluorescence quantum yields (ΦF) of the porphyrin moiety excited in the Q-bands (λexc = 500 for (6) and (8) and 540 nm for (7) and (9)) are 0.13, 0.020, 0.067 and 0.019 for TruP (6), TruZnP (7), TruTriP (8) and TruTriZnP (9) at 298 K, respectively. At 77 K, a strong phosphorescence arising from the zinc(II) porphyrin (TruZnP (7) and TruTriZnP (9)) (λexc = 540 nm) is observed at ~800 nm (Fig. 4). The 0–0 phosphorescence peaks are observed at 789 nm and 812 nm for TruZnP (7) and TriTruZnP (9), respectively.
The truxene moiety exhibits a fluorescence band in the 350–400 nm window with some vibronic structure at 298 K, and a strong phosphorescence band at 77 K with a detailed vibronic structure starting at 457 nm [13, 23]. Based on the position of the 0–0 peaks in the absorption and emission spectra of truxene and porphyrins, the energy diagram and the roles of energy donor and acceptor are defined (Fig. 5). Selective excitation at 310 nm, where the truxene absorbs the most, results in a large decrease of the fluorescence intensity and phosphorescence intensity
of the donor, whereas the overall emission intensity arising from the free base or zinc(II) porphyrin unit remains strong. For TruTriP, the truxene fluorescence is almost absent at 298 K due to S1 energy transfer (Fig. 6). In addition, the excitation spectra monitored in the porphyrin fluorescence at 298 K (λmax = 628 nm for TruP (6) and TriTruP (8), and 580 nm for TruZnP (7) and TriTruZnP (9)) overlap well the combined absorptions of the truxene unit and the porphyrin core (Fig. 3), evidencing the energy transfer from truxene to free base porphyrins or zinc(II) porphyrins.
In addition, the excitation spectra monitored at these porphyrin-centered fluorescence bands exhibits the bands arising from both the truxene and porphyrin units also providing further evidence for energy transfer. The singlet–singlet energy transfers from S1(Tru) to S1(P) and S1(ZnP), or to S2(P) to S2(ZnP) are possible [14], but this cannot be discriminated in this work. The photophysical data for the truxene, free base and zinc(II) porphyrin chromophores are listed in Table 3.
Fig. 3. Absorption (black), corrected excitation (red) and emission (blue) spectra of TruP (6), TruZnP (7), TruTriP (8) and TruTriZnP (9) in 2MeTHF at 298 K
Table 1. UV-vis absorption data for all target dyads in 2MeTHF at 298 K
Compound λabs, nm ( × 10-3 M-1.cm-1)a
Truxene Soret Q
TruP (6) 308 (54.9) 404 (242.7) 504 (15.7), 536 (5.2), 578 (4.4), 653 (1.65)
TruTriP (8) 312 (81.6) 407 (779.2) 502 (66.6), 534 (24.6), 580 (18.7), 650 (7.65)
TruZnP (7) 309 (45.3) 413 (307.2) 543 (16.5), 578 (10.2),
TruTriZnP (9) —b 416 (923.5) 544 (58.3), 578 (31.7)
a The absorption bands are assigned to the truxene, the porphyrin free-base or zinc(II) porphyrin (Soret band and Q-bands). bNot observed.

52 H.-J. XU ET AL.
Copyright © 2013 World Scientific Publishing Company J. Porphyrins Phthalocyanines 2013; 17: 52–55
Table 2. Emission data for all dyads in 2MeTHF
Compound Chromoa λem, nmb λem, nm ΦFc
298 K (λexc = 540 nm)
77 K (λexc = 504 nm)
298 K
TruP (6) Tr 366, 380 360, 427 d
P 628, 663, 697 622, 655, 690 0.127
TruZnP (7) Tr 366 404, 424, 432 d
P 580, 637 575, 633, 706, 789 0.020
TruTriP (8) Tr d 360, 378, 435, 501, 543 d
P 629, 661, 697 622, 654, 691, 730 0.067
TruTriZnP (9) Tr 366, 426 404, 429, 492 d
P 581, 637 583, 642, 726, 812 0.019
aTr: chromophore = truxene; P: chromophore = porphyrin free-base; ZnP: chromophore = zinc(II) porphyrin. b The emission spectra were recorded using λexc = 310 nm under the inert atmosphere at 298 K. cFluorescence quantum yields (ΦF) of the samples in 2MeTHF were measured by using tetraphenylporphyrin free-base (λexc = 500 nm) and tetraphenylporphyrin zinc (λexc = 540 nm) (H2TPP, ΦF = 0.10 in THF, ZnTPP, ΦF = 0.033 in THF) as standards. dToo weak to be accurately measured.
Fig. 4. Absorption (black), corrected excitation (red) and emission (blue) spectra of TruP (6), TruTriP (8), TruZnP (7) and TruTriZnP (9) in 2MeTHF at 77 K
Fig. 5. State diagram representing the different fragments involved in the energy transfer processes in this work. Phos.: phosphorescence; SSET: singlet–singlet energy transfer; TTET: triplet–triplet energy transfer; TSET: triplet–singlet energy transfer; ISC: intersystem crossing

SHAPE-PERSISTENT POLY-PORPHYRINS ASSEMBLED BY A CENTRAL TRUXENE 53
Copyright © 2013 World Scientific Publishing Company J. Porphyrins Phthalocyanines 2013; 17: 53–55
All fluorescence lifetimes and kET data are listed in Table 3. The singlet–singlet energy transfer rate (kET) is extracted by kET
. = (1/τF)-(1/τFo),[15] where τF and
τFo are the fluorescence lifetimes of the donor (truxene)
in the presence and absence of the acceptor (free base
porphyrin or zinc(II) porphyrins), respectively. In all cases, the truxene unit is considered as comparison species. At 298 K, the singlet kET values are 5.0, 1.4, 1.0, and 1.3 (ns)-1 for TruP (6), TruTriP (8), TruZnP (7) and TruTriZnP (9) respectively. At 77 K, the rates are 5.9, 1.3, 2.3, and 0.86 (ns)-1 for TruP (6), TruTriP (8), TruZnP (7) and TruTriZnP (9) respectively. Experimentally, there is no major change in rate constants for all the cases at the two temperatures, consistent with an energy transfer process but more relevant to this work, with an absence of dyad conformation. There is, indeed, no possibility of significantly changing the dihedral angle between the porphyrin and truxene planes as the methyl groups in the porphyrin β-positions are forcing it to be perpendicular (~90˚). Attempts to accurately confirm this angle by X-ray crystallography were made but suitable crystals were not obtained. TruP (6) crystals exhibited too much disorder for publication purposes. Nonetheless, the dihedral angle was indeed found to be ~90° (see Fig. S9 in the SI). These rates are considered somewhat efficient but medium when compared to other closely spaced multi-porphyrinic assemblies [15].
Importantly, the kET values are very similar to those reported for TetraTruP, TetraTruZnP, DodecaTruP and DodecaTruZnP (Chart 1; 0.74 < kET < 5.9 (ns)-1), which do not have β-methyl groups. The similarity between the rates indicates that indeed the mean angle between the truxene and porphyrin planes is also ~90° for the latter as previously anticipated.
The dipole–dipole interactions (Förster) [24–26] and exchange (Dexter) [26, 27] mechanisms are assumed to be operative in the singlet–singlet energy transfers for short donor–acceptor–separations as those investigated here [26]. The donor and acceptor are expected to be very poorly conjugated owing to the quasi right angle
Table 3. Fluorescence lifetimes and singlet–singlet energy transfer rates of the porphyrin systems in 2MeTHF at 298 K and 77 K
Compound Chromoa τF, nsb λem, nmb kET, ns-1
298 K
τF, nsb λem, nmb kET, ns-1
77 K298 K 77 K
Et4Me4PhP P 1.70 ± 0.10 1.94 ± 0.10c
Tr Tr 56.26 ± 0.15 380 (310) 64.64 ± 0.52 380 (310)
TruP (6) P
Tr
15.51 ± 0.43
0.25 ± 0.05
620 (500)
380 (310) 5.0
24.97 ± 0.47
0.17 ± 0.04
620 (500)
380 (310) 5.9
TruTriP (8) P
Tr
17.20 ± 0.22
0.75 ± 0.03
620 (500)
380 (310) 1.4
22.47 ± 0.46
0.82 ± 0.15
620 (500)
380 (310) 1.3
TruZnP (7) P
Tr
1.41 ± 0.04
0.97 ± 0.18
580 (568)
380 (310) 1.0
1.17 ± 0.06
0.43 ± 0.13
580 (568)
380 (310) 2.3
TruTriZnP (9) P
Tr
1.16 ± 0.17
0.81 ± 0.11
580 (568)
380 (310) 1.3
1.32 ± 0.08
1.15 ± 0.05
580 (568)
380 (310) 0.86
aTr: chromophore = truxene; P: chromophore = porphyrin free-base; ZnP: chromophore = zinc(II) porphyrin. bThe lifetime was recorded at the shown emission wavelength and the samples were under an inert atmosphere. The values in parentheses indicate at which wavelength the samples were excited. cFrom Ref. 17.
Fig. 6. Top: corrected emission spectrum of TruTriP (8) at 298 K in 2MeTHF (λex = 310 nm). Bottom: expansion of the 350–600 nm region. The sharp peaks at ~440, ~480 and ~545 nm are artifacts

54 H.-J. XU ET AL.
Copyright © 2013 World Scientific Publishing Company J. Porphyrins Phthalocyanines 2013; 17: 54–55
formed by the β-pyrrole-alkyl-substituted porphyrin ring and truxene, which is totally consistent with the very small red-shift of the absorption (Soret and Q-bands), and emission bands going from TruP (6) to TruTriP (8), or from TruZnP (7) to TruTriZnP (9). This fact greatly diminishes the efficiency in singlet–singlet energy transfer operating according to the Dexter exchange mechanism, in which the spatial orbital overlap is necessary. Therefore it is most likely that the Dexter mechanism cannot contribute to the overall rate. The rates are found to be slower again due to the poor orbital conjugation.
In addition, the relative orientation of the transition moments (κ2) of the two chromophores has an important impact on energy transfer rates according to the Förster theory [24, 25, 28]. κ2 takes a maximum value (4) when the dipole transition moments are parallel and is minimal (0) when perpendicular. The quasi right angle between truxene and porphyrin plane will result in a very low κ2 values, hence leading to slower energy transfer rates, as observed.
Furthermore, because truxene and porphyrin chromophores are actually nonpolar compounds, the dipole transition moments are very small. The Förster rate constant is further found to be slower [24, 25, 28]. Finally, the integral overlap (J ) between the emission spectrum of donor (truxene) and the absorption spectrum of acceptor (porphyrin) will play an important role to the singlet energy transfer assigned to a Förster mechanism. From Figs 3 and 4, the spectral overlap between the emission spectrum of truxene and the absorption spectrum of porphyrin is very weak, again leading to the slower rates.
In conclusion, even though that the Förster mechanism is assumed to be operative in these molecular systems, the energy transfer rates are found to be relatively slower due to the above-mentioned several structural parameters which are being performed to reduce the singlet–singlet energy transfer rate constants.
The phosphorescence lifetimes (τP) of TruZnP (7) and TriTruZnP (9) is 67 ms and 65 ms at 726 nm at 77 K, respectively, which are typical for triplet lifetimes for this kind of zinc(II) porphyrins. The phosphorescence of the truxene unit (λmax ~580 nm) was never observed indicating efficient triplet–triplet energy transfer (truxene ⇒ porphyrins) [14].
CONCLUSION
A series of rigid shape-persistent porphyrins substi-tuted by a central truxene (zinc(II) porphyrin: TruZnP (7) and TruTriZnP (9) and porphyrin free base: TruP (6) and TruTriP (8)), have been designed in order to investigate the singlet energy transfer rates in a structurally addressable manner. The energy donor (truxene) and acceptor (porphyrin) were intentionally tailored in a way to minimize the π-orbital conjugation
between the porphyrin and truxene planes. Evidence for efficient singlet energy transfers from the truxene to the porphyrin core has been provided and their rates are considered efficient but average when compared to other closely-spaced multiporphyrin assemblies. This effect is expectedly due to a poor orbital overlap between the truxene and porphyrin π-systems, which is predictable from the right angle (X-ray) between the porphyrin and truxene planes for TruP (6). The close similarity in the kET values reported for the parent dyad systems (0.74 < kET < 5.9 (ns)-1),8 which do not exhibit β-methyl groups (Chart 1), and those investigated in this work (0.86 < kET < 5.9 (ns)-1), which have β-methyl substituents, clearly demonstrates that the former series must also exhibit a right angle between the aromatic planes. This conclusion was also proposed and interpreted by hexyl-hexyl interactions between the truxene moieties as corroborated by computer modeling. This work experimentally supports this previous conclusion.
Supporting information
MALDI-TOF mass spectra of compound 6–9, 1H NMR spectra (300 MHz, 298 K, CDCl3) of compound 6–9 (Figs S1–S8), and ortep view of TruP (6) (Fig. S9) are given in the supplementary material. This material is available free of charge via the Internet at http://www.worldscinet.com/jpp/jpp.shtml.
Acknowledgements
This research was supported by the Natural Sciences and Engineering Research Council of Canada (NSERC), le “Fonds Québécois de la Recherche sur la Nature et les Technologies (FQRNT),” the “Centre d’Etudes des Matériaux Optiques et Photoniques de l’Université de Sherbrooke (CEMOPUS),” and the “Agence Nationale de la Recherche (ANR)” for Research “Chair of Excellence” grant. The “Centre National de la Recherche Scientifique” (ICMUB, UMR CNRS 6302) is gratefully thanked for financial support. Hai-Jun Xu also gratefully acknowledges the “Région Bourgogne” and CNRS for a post-doctoral fellowship. Support was provided by the CNRS, the “Université de Bourgogne” and the “Conseil Régional de Bourgogne” through the 3MIM integrated project (“Marquage de Molécules par les Métaux pour l’Imagerie Médicale”). Antony Lapprand is acknowledged for the registration of few fluorescence lifetimes.
REFERENCES
1. Gómez-Lor B, de Frutos O, Ceballos PA, Granier T and Echavarren AM. Eur. J. Org. Chem. 2001: 2107–2114.
2. Cao X-Y, Zhang W-B, Wang J-L, Zhou X-H, Lu H and Pei J. J. Am. Chem. Soc. 2003; 125: 12430–12431.

SHAPE-PERSISTENT POLY-PORPHYRINS ASSEMBLED BY A CENTRAL TRUXENE 55
Copyright © 2013 World Scientific Publishing Company J. Porphyrins Phthalocyanines 2013; 17: 55–55
3. Cao XY, Liu XH, Zhou XH, Zhang Y, Jiang Y, Cao Y, Cui YX and Pei J. J. Org. Chem. 2004; 69: 6050–6058.
4. Kanibolotsky AL, Berridge R, Skabara PJ, Perepi-chka IF, Bradley DDC and Koeberg M. J. Am. Chem. Soc. 2004; 126: 13695–13702.
5. Pei J, Wang J-L, Cao X-Y, Zhou X-H and Zhang W-B. J. Am. Chem. Soc. 2003; 125: 9944–9945.
6. Ventura B, Barbieri A, Barigelletti F, Diring S and Ziessel R. Inorg. Chem. 2010; 49: 8333–8346.
7. Yuan M-S, Fang Q, Liu Z-Q, Guo J-P, Chen H-Y, Yu W-T, Xue G and Liu D-S. J. Org. Chem. 2006; 71: 7858–7861.
8. Zheng Q, He GS and Prasad PN. Chem. Mater. 2005; 17: 6004–6011.
9. Kimura M, Kuwano S, Sawaki Y, Fujikawa H, Noda K, Taga Y and Takagi K. J. Mater. Chem. 2005; 15: 2393–2398.
10. Chan CKM, Tao CH, Tam HL, Zhu NY, Yam VWW and Cheah KW. Inorg. Chem. 2009; 48: 2855–2864.
11. Lambert C, Noll G, Schmalzlin E, Meerholz K and Brauchle C. Chem.-Eur. J. 1998; 4: 2129–2135.
12. Yuan M-S, Liu Z-Q and Fang Q. J. Org. Chem. 2007; 72: 7915–7922.
13. Duan X-F, Wang J-L and Pei J. Org. Lett. 2005; 7: 4071–4074.
14. Du B, Fortin D and Harvey PD. Inorg. Chem. 2011; 50: 11493–11505.
15. Harvey PD. In The Porphyrin Handbook, Vol. 18, Kadish KM, Smith KM and Guilard R. (Eds.) Aca-demic Press: Boston, 2003; pp 63.
16. Li B, Li J, Fu Y and Bo Z. J. Am. Chem. Soc. 2004; 126: 3430–3431.
17. Loutfy RO and Law KY. J. Phys. Chem. 1980; 84: 2803–2808.
18. Aly SM, Ayed C, Stern C, Guilard R, Abd-El-Aziz AS and Harvey PD. Inorg. Chem. 2008; 47: 9930–9940.
19. Dehmlow EV and Kelle T. Synth. Commun. 1997; 27: 2021–2031.
20. Yuan S-C, Chen H-B, Zhang Y and Pei J. Organic Letters 2006; 8: 5701–5704.
21. Tanaka M, Ohkubo K, Gros CP, Guilard R and Fuku-zumi S. J. Am. Chem. Soc. 2006; 28: 14625–14633.
22. Barbe J-M, Habermeyer B, Khoury T, Gros CP, Richard P, Chen P and Kadish KM. Inorg. Chem. 2010; 49: 8929–8940.
23. Baunsgaard D, Harrit N, El Balsami M, Negri F, Orlandi G, Frederiksen J and Wilbrandt R. J. Phys. Chem. A. 1998; 102: 10007–10016.
24. Förster T. Ann. Phys. 1948; 2: 55–73. 25. Förster T. Naturwissenschaften 1946; 33: 166–175. 26. Faure S, Stern C, Guilard R and Harvey PD. J. Am.
Chem. Soc. 2004; 126: 1253–1261. 27. Dexter DL. J. Chem. Phys. 1953; 21: 836. 28. Harvey PD, Stern C and Guilard R. In Handbook
of Porphyrin Science, Kadish KM, Smith KM and Guilard R. (Eds.) World Scientific Publishing: Sin-gapore, 2011; pp 1–179.

Journal of Porphyrins and PhthalocyaninesJ. Porphyrins Phthalocyanines 2013; 17: 56–62
DOI: 10.1142/S1088424612501258
Published at http://www.worldscinet.com/jpp/
Copyright © 2013 World Scientific Publishing Company
INTRODUCTION
Porphyrins and their analogues are the most commonly administered photosensitizers in the photodynamic therapy (PDT), which is a promising treatment of cancer and some non-malignant conditions [1–3]. In general, administered photosensitizers damage cancer cells by the generation of singlet oxygen (1O2) (Type II mechansim), which is formed through energy transfer to molecular oxygen from the photoexcited photosensitizer.
However, the phototoxic effect of 1O2 on the PDT is restricted because the oxygen concentration in a cancer cell is relatively low [4]. Another important mechanism of photosensitized biomolecule damage is the oxidation reaction through electron transfer (ET) (Type I mechanism), which requires absolutely no oxygen [5]. The ET mechanism requires highly oxidative activity (a lower reduction potential) in the photoexcited state of the photosensitizer. Larger excitation energy is advantagous for the lower reduction potential of the photosensitizer in the photoexcited state. Ultra-violet photosensitizers mainly induce biomolecule photodamage through the ET mechanism, whereas a visible-light photosensitizer is not appropriate for this mechanism. Therefore, it is
Photosensitized damage of protein by fluorinated
diethoxy phosphorus(V)porphyrin
Kazutaka Hirakawa*a , Keito Azumia, Yoshinobu Nishimurab, Tatsuo Araib,
Yoshio Nosakac and Segetoshi Okazakid
a Department of Basic Engineering (Chemistry), Faculty of Engineering, Shizuoka University, Johoku 3-5-1, Naka-ku, Hamamatsu, Shizuoka 432-8561, Japan b Department of Chemistry, University of Tsukuba, Tennodai 1-1-1, Tsukuba, Ibaraki 305-8571, Japan
c Department of Materials Science and Technology, Nagaoka University of Technology, Kamitomioka 1603-1, Nagaoka, Niigata 940-2188, Japan
d Medical Photonics Research Center, Hamamatsu University School of Medicine, Handayama 1-20-1, Higashi-ku, Hamamatsu, Shizuoka 431-3192, Japan
Received 22 June 2012Accepted 20 July 2012
ABSTRACT: The effect of the axial ligand fluorination of the water-soluble P(V)porphyrin complex on photosensitized protein damage was examined. The activity of singlet oxygen generation by diethoxyP(V)porphyrin was slightly improved by the fluorination of the ethoxy chains. Absorption spectrum measurements demonstrated the binding interaction between the P(V)porphyrins and human serum albumin, a water-soluble protein. Photo-irradiated P(V)porphyrins damaged the amino acid residue of human serum albumin, resulting in the decrease of the fluorescence intensity from the tryptophan residue of human serum albumin. A singlet oxygen quencher, sodium azide, could not completely inhibit the damage of human serum albumin, suggesting that the electron transfer mechanism contributes to protein damage as does singlet oxygen generation. The decrease of the fluorescence lifetime of P(V)porphyrin by human serum albumin supported the electron transfer mechanism. The estimated contributions of the electron transfer mechanism are 0.57 and 0.44 for the fluorinated and non-fluorinated P(V)porphyrins, respectively. The total quantum yield of the protein photo-oxidation was slightly enhanced by this axial fluorination.
KEYWORDS: P(V)porphyrin, fluorination, photosensitizer, singlet oxygen, electron transfer, protein oxidation.
SPP full member in good standing
*Correspondence to: Kazutaka Hirakawa, email: [email protected], tel: +81 53-478-1287, fax: +81 53-478-1287

PHOTOSENSITIZED DAMAGE OF PROTEIN BY FLUORINATED DIETHOXY PHOSPHORUS(V)PORPHYRIN 57
Copyright © 2013 World Scientific Publishing Company J. Porphyrins Phthalocyanines 2013; 17: 57–62
important to select the appropriate molecular design to achieve ET-mediated biomolecule damage using a visible-light photosensitizer. Since high-valent porphyrin complexes demonstrate a lower reduction potential in their photoexcited state than free-base or low-valent metal complexes, these porphyrins are advantageous for the oxidative ET reaction [5–13]. Indeed, derivatives of high-valent porphyrin complexes, such as P(V) [5, 9] and Sb(V) [13] complexes, photosensitize DNA damage through two mechanisms, i.e. 1O2 generation and the ET reaction. In this study, photosensitized protein oxidation by a porphyrin P(V) complex (Fig. 1), diethoxyP(V)tetraphenyl porphyrin (EtPP) and its axial fluorinated compound (FEtPP), was examined. The specific characteristics of the porphyrin P(V) complexes are the variety of the substituted axial ligand and the relatively low redox potential of the one-electron reduction in the photoexcited state. In addition, P(V)porphyrin is cationic and water-soluble. The purpose of this study is the evaluation of a fluorination effect of the axial ligand on the photosensitized reaction. As a target protein model, human serum albumin (HSA), a water-soluble protein, was used, because its structure and property were elucidated.
EXPERIMENTAL
Materials
DichloroP(V)tetraphenylporphyrin chloride (Cl2PP) was obtained by the phosphorus incorporation into commercially available tetraphenylporphyrin (Wako Chemicals Co., Osaka, Japan) according to the previous report [14].
EtPP was synthesized according to the previous report [6] using the following procedure. 20 mg of Cl2PP was dissolved in 2 mL of ethanol to reflux at 80 °C for 2 h. Solvent was removed under vacuum. The residue was purified by column chromatography on silica gel with an eluent of chloroform-methanol (4/1, vol/vol), resulting in
a pure product with 78% yield. 1H NMR (CDCl3, TMS): δ, ppm -2.40 ~ -2.29 (4H, m, P-OCH2CH3), -1.74 (6H, td, JH-H = 6.0 Hz, JP-H = 2.1 Hz, P-OCH2CH3), 7.78 ~ 7.81 (12H, m, meta- and para-H of phenyl group), 7.94 ~ 8.01 (8H, m, ortho-H of phenyl group), 9.07 (8H, d, JH-H = 2.7 Hz, H). MS (FAB): m/z 733 (calcd. for [M]+ 733). UV-vis (ethanol): λmax, nm 423.5, 555.0, 594.0.
FEtPP was synthesized by the similar procedure with that of EtPP. 20 mg of Cl2PP was dissolved in 2 mL of trifluoroethanol to reflux at 80 °C for 2 h. Solvent was removed under vacuum. The residue was purified by column chromatography on silica gel with an eluent of chloroform-methanol (4/1, vol/vol), resulting in a pure product with 91% yield. 1H NMR (CDCl3, TMS): δ, ppm -2.05 ~ -1.94 (4H, m, P-OCH2CF3), 7.79 (4H, t, JH-H = 1.8 Hz, para-H of phenyl group), 7.81 (8H, d, JH-H = 1.8 Hz, meta-H of phenyl group), 7.96 ~ 8.00 (8H, m, ortho-H of phenyl group), 9.19 (8H, d, JH-H = 3.0 Hz, H). MS (FAB): m/z 841 (calcd. for [M]+ 841). UV-vis (ethanol): λmax, nm 428.5, 559.0, 600.0.
HSA was from Sigma-Aldrich Co. LLC. (St. Louis, MO, USA). Ethanol and sodium azide were from Wako Chemicals Co.. Deuterium oxide (D2O) was from Acrross Organics (New Jersey, USA). Sodium phosphate buffer (pH 7.6) was from Nacalai Tesque Inc. (Kyoto, Japan).
Spectroscopic measurements
The absorption spectrum of P(V)porphyrins and HSA was measured with a UV-vis spectrophotometer UV-1650PC (Shimadzu, Kyoto, Japan). The fluorescence spectra of P(V)porphyrins and HSA were measured with an F-4500 fluorescence spectrophotometer (Hitachi, Tokyo, Japan).
Detection of damage to HSA photosensitized by P(V)porphyrins
As a target biomacromolecule, HSA, a water-soluble protein, was used. The interaction between P(V)porphyrins and HSA was examined by a UV-vis absorption
OCH2CH3N
NN
N
PH3CH2CO+
Cl-
OCH2CF3N
NN
N
PF3CH2CO+
Cl-
FEtPP EtPP
Fig. 1. Structures of FEtPP (left) and EtPP (right)

58 K. HIRAKAWA ET AL.
Copyright © 2013 World Scientific Publishing Company J. Porphyrins Phthalocyanines 2013; 17: 58–62
measurement. The sample solution containing 8 μM P(V)porphyrins and 10 μM HSA in a sodium phosphate buffer (pH 7.6) was irradiated with a light-emitting diode (LED) (λmax = 519 nm, 1 mW.cm-2, CCS Inc., Kyoto, Japan). The intensity of the LED light source was measured with a light meter (LM-331, AS ONE, Osaka, Japan). Protein damage by P(V)porphyrins was evaluated by measurement of the fluorescence intensity from the amino acid residues as previously reported [15]. The excitation and detection wavelengths were 298 and 350 nm, respectively.
Detection of singlet oxygen
The 1O2 generation was directly measured by near-infrared luminescence at around 1270 nm from 1O2, which corresponds to the 1O2(
1Δg)–3O2(
3Σg-) transition.
The procedure is the same as that described in an earlier report [16]. The quantum yield of 1O2 generation (ΦΔ) was estimated from the comparison of the emission intensity with that of the reference photosensitizer, methylene blue (ΦΔ = 0.52 in H2O) [17].
The kinetics of 1O2 generation and its decay were examined by the time-resolved near-infrared emission measurement. The sample solutions of 2 mL contained 8 μM P(V)porphyrins with or without HSA in a sodium phosphate buffer (pH 7.6). The excitation light was the second harmonic (532 nm) of a pulsed Nd:YAG laser (5 ns, 10 Hz, Minilite-II, Continuum, CA, USA). The beam was passed through a set of dielectric multilayer film mirrors to eliminate stray light and irradiate from the 45° direction of the surface of a 1 cm × 1 cm × 4.5 cm quartz cell. The emission from the front surface of the sample cell was collected with a set of quartz lenses, passed through a cold mirror (CLDM-50S, Sigma Koki, Tokyo, Japan), separated by a Bosch-Lomb Shimadzu monochromator, and then introduced into a photomultiplier (R5509–41, Hamamatsu Photonics, Hamamatsu, Japan), which was cooled to 200 K with liquid nitrogen. The signal from the photomultiplier was amplified by 75 with an amplifier (SR-455, Stanford Research, CA, USA) and then counted with a scaler/averager (SR430, Stanford Research). By changing the wavelength, the luminescence intensity showed a maximum at 1270 nm, confirming the detection of the phosphorescence of 1O2. To analyze the time profile of 1O2 emission, the signal obtained at 1270 nm was accumulated for 20,000 scans with a bin width of 40 ns.
Electrochemical measurements
The redox potentials of P(V)porphrins were measured with a differential pulse voltammometry (Hokuto Denko, Tokyo, Japan) using a platinum working electrode, a platinum counter electrode, and a saturated calomel reference electrode (SCE) in acetonitrile.
Fluorescence lifetime measurements
Fluorescence decay was measured using a time-correlated single-photon counting method [18]. Laser
excitation at 410 nm was achieved by using a diode laser (LDH-P-C-410, PicoQuant, Berlin, Germany) with a power control unit (PDL 800-B, PicoQuant) in a repetition rate of 2.5 MHz. The temporal profiles of fluorescence decay were detected by using a micro-channel plate photomultiplier (R3809U, Hamamatsu Photonics) equipped with a TCSPC computer board module (SPC630, Becker and Hickl Gmbh, Berlin, Germany). The full-width at half-maximum (FWHM) of the instrument response function was 51 ps. The values of χ2 and the Durbin-Watson parameters were used to determine the quality of the fit obtained by nonlinear regression.
RESULTS AND DISCUSSION
Interaction between P(V)porphyrins and HSA
In the presence of HSA, the hyperchromic effect and red-shift were observed in the UV-vis absorption spectra of FEtPP (Fig. 2), indicating the static interaction between FEtPP and the protein. The analysis of the absorption spectrum suggests the 4:1 complex formation between both P(V)porphyrins and HSA (inset of Fig. 2). Similar results were observed in the case of EtPP. Job’s plot of the absorption change showed the intersection points at ca. 0.2 in the both cases of FEtPP and EtPP, supporting the 0.8:0.2 (= 4:1) complex formation (Fig. 3). The apparent association constant (Kap) between P(V)poprhyrins and HSA was evaluated under an assumption of the following equation:
apb
[P(V)porphyrin-HSA]
[P(V)porphyrin][HSA]=K (1)
Fig. 2. Absorption spectra of FEtPP in the presence of HSA. The sample solution contained 8 μM FEtPP and HSA (1, 2, 5, 10, or 20 μM) in a 10 mM sodium phosphate buffer (pH 7.6). The inset indicates the relationship between the absorbance of P(V)porphyrin at 440 nm and the concentration of HSA. The intersection point of two asymptotes indicates almost 2 μM of HSA, suggesting the 4:1 complex formation between P(V)porphyrin and HSA

PHOTOSENSITIZED DAMAGE OF PROTEIN BY FLUORINATED DIETHOXY PHOSPHORUS(V)PORPHYRIN 59
Copyright © 2013 World Scientific Publishing Company J. Porphyrins Phthalocyanines 2013; 17: 59–62
where [P(V)porphyrin] is the concentration of the non-binding photosensitizer, FEtPP or EtPP, [HSA]b is the concentration of the binding sites of HSA without a binding porphyrin (four times the actual concentration of free HSA), and [P(V)porphyrin-HSA] is the concentration of the HSA-binding photosensitizer. The estimated values of Kap were 4.6 104 M-1 and 2.6 104 M-1 for FEtPP and EtPP, respectively. The affinity between FEtPP and HSA is slightly larger than that of EtPP.
Photosensitized damage of HSA by P(V)porphyrins
The intensity of HSA fluorescence around 350 nm, assigned to the tryptophan residue, was decreased by photo-irradiation in the presence of these P(V)porphyrins. The fluorescence decrement of HSA can be explained by the amino acid oxidation through the photosensitized reaction [15]. The observed extent of this HSA damage by the fluorinated P(V)porphyrin, FEtPP, was almost the same as that of the EtPP (Fig. 4). The quantum yields of tryptophan degradation photosensitized by P(V)porphyrins for 120 min irradiation were estimated from the decrease of the tryptophan fluorescence and the absorbed photon number by the porphyrins. The estimated yields were 2.9 × 10⁻⁵ and 2.2 × 10⁻⁵ for FEtPP and EtPP, respectively. The quantum yield of HSA photodamage by FEtPP was slightly larger than that of EtPP.
This HSA damage was partially inhibited by sodium azide, a physical quencher of 1O2 [19] (Fig. 5). Furthermore, HSA damage was enhanced in D2O (data not shown), in which the lifetime of 1O2 is markedly elongated (about 2 ~ 4 μs in H2O to 70 μs in D2O) [20]. These findings suggest HSA oxidation by 1O2. However, HSA damage was not completely inhibited by an excess amount of sodium azide (~10 mM). These results
suggest that the ET mechanism is partly responsible for HSA photodamage, as is the 1O2 mechanism. Because the almost all 1O2 can be quenched by 10 mM sodium azide, the damage of HSA photosensitized by P(V)porphyrins with 10 mM sodium azide should be due to the ET mechanism. The quenching rate coefficient of 1O2 by sodium azide is almost diffusion control limit (kdif), which is calculated as follows:
dif
8000R
3
Tk =
η (2)
where R is the gas constant, T is the absolute temperature, and is the viscosity of water (8.91 × 10⁻⁴ kg.m-1.s-1). The quenching efficiency of 1O2 by sodium azide (Efq) can be calculated from the following equation using the lifetime of 1O2 ( Δ = 3.5 μs , described in latter):
q 3
qq 3
[NaN ]
[NaN ] 1/
kEf
k Δ
=+ τ
(3)
Fig. 3. Job’s plots of the Soret band peak of P(V)porphyrins with HSA. The sample solution contained 0 ~ 10 μM FEtPP or EtPP and 0 ~ 10 μM HSA in a 10 mM sodium phosphate buffer (pH 7.6). The total concentration of P(V)porphyrin and HSA was 10 μM
Fig. 4. Time course of HSA damage photosensitized by FEtPP and EtPP. The sample solution contained 8 μM P(V)porphyrins and 10 μM HSA in a 10 mM sodium phosphate buffer (pH 7.6). The vertical axis “[HSA]” indicates the relative concentration of non-damaged HSA
Fig. 5. Effect of sodium azide (NaN3) on HSA photo-oxidation by FEtPP. The sample solution contained 8 μM FEtPP, 10 μM HSA and indicated concentration of NaN3 in a 10 mM sodium phosphate buffer (pH 7.6). The vertical axis “[HSA]” indicates the relative concentration of non-damaged HSA

60 K. HIRAKAWA ET AL.
Copyright © 2013 World Scientific Publishing Company J. Porphyrins Phthalocyanines 2013; 17: 60–62
where [NaN3] is the concentration of sodium azide. In the presence of 10 mM sodium azide, the Efq becomes 0.996. The roughly estimated contributions of the HSA damage through the ET mechanism for 120 min irradiation were 0.57 and 0.44 for FEtPP and EtPP, respectively. Therefore, the contributions of the 1O2 mechanism are 0.43 and 0.56 for FEtPP and EtPP, respectively. The ET mechanism was slightly enhanced in the case of fluorinated P(V)porphyrin.
The HSA damage was not observed under anaerobic conditions. The formed radical cation of the amino acid residue through the ET should undergo a reaction with the surrounding elements, such as molecular oxygen or water. Furthermore, re-oxidation of the reduced photosensitizer, which is formed thorugh ET from the amino acid residue to the photoexcited photosensitizer, is important. In vivo, oxidative agents, such as metal ions, might oxidize the reduced photosentizer. In in vitro experiments, molecular oxygen is an important oxidative agent to remove the electron from the reduced photosensitizer. The rapid reverse-ET should inhibit the following reactions in simple aqueous solution without oxygen. These results showed that the following reaction with molecular oxygen is necessary for protein oxidation through ET in this experimental condition. Formed superoxide through re-oxidation of the reduced photosensitizer should be dismutated into hydrogen peroxide and decomposed into water and molecular oxygen. The electron, which is removed from the photosensitizer, should be used to form hydroxide ion or final product of decomposed amino acid.
Singlet oxygen generation by the photosensitized reaction of P(V)porphyrins
The photosensitized 1O2 generation by these P(V)porphyrins was confirmed by the detection of near-infrared emission around 1270 nm (Fig. 6), which is assigned to the 1O2(
1Δg)–3O2(
3Σg-) transition. The estimated ΦΔ values
for FEtPP and EtPP were 0.68 and 0.59, respectively. The fluorination of this porphyrin slightly improved the 1O2 generating ability. These relatively large values of ΦΔ indicate that the 1O2 mechanism is also important for photosensitized biomolecule damage in the presence of a sufficient concentration of molecular oxygen.
Time profile of 1O2 emission and estimated lifetime of the triplet excited state
The lifetime of the 1O2 ( Δ) and the triplet excited state (T1) of these photosensitizers ( T) was estimated from the time-resolved emission of 1O2 (data not shown). The emission intensity of 1O2 as a function of time, I(t), can be expressed with the following equation [21]:
0d r
1( ) exp - - exp -
⎧ ⎫⎛ ⎞ ⎛ ⎞⎪ ⎪= ⎨ ⎬⎜ ⎟⎜ ⎟τ τ⎝ ⎠⎝ ⎠⎪ ⎪⎩ ⎭
tI t I (4)
where I0 is the pre-exponential factor, d is the decay time constant of the emission, and r is the rise time constant of this emission. When the Δ is longer than r, d corresponds to Δ. In general, r equals to T because the T1 is dominantly quenched by O2 molecules. In contrast,
r indicates Δ, if T is longer than Δ. The analysis of the time-resolved 1O2 emission gave the kinetic parameters, as shown in Table 1. The observed value of d, around 3.5 μs, almost coincided with the typical lifetime of 1O2 ( Δ) in H2O (2 ~ 4 μs) [20]. The values of r should correspond to the T in H2O. The estimated T values indicate that 1O2 is generated within about two μs in the photochemical process of P(V)porphyrin in a phosphate buffer.
Redox potentials of P(V)porphyrins
The reversible reduction peak was observed for both P(V)porphyrins (FEtPP: -0.40 V vs SCE; EtPP: -0.30 V vs SCE) (Table 2). The oxidation potentials of P(V)porphyrin (Eox) were roughly estimated from the reduction potential (Ered) and the energy of the singlet excited state (S1) of P(V)porphyrins (ES1). The ES1 was calculated from the fluorescence maximum of P(V)porphyrins. The redox potential of EtPP was smaller
Fig. 6. Near-infrared emission spectra of 1O2 generated by the photosensitization of FEtPP and EtPP. The sample solution contained 8 μM FEtPP or EtPP in a 10 mM sodium phosphate buffer (pH 7.6)
Table 1. Singlet oxygen quantum yields and the related time constants
Porphyrin ΦΔ Δ (μs) T (μs)
FEtPP 0.68 3.5 1.8
EtPP 0.59 3.5 1.9
The sample solution contained 8 μM P(V)porphyrins in a 10 mM sodium phosphate buffer (pH 7.6).

PHOTOSENSITIZED DAMAGE OF PROTEIN BY FLUORINATED DIETHOXY PHOSPHORUS(V)PORPHYRIN 61
Copyright © 2013 World Scientific Publishing Company J. Porphyrins Phthalocyanines 2013; 17: 61–62
than that of FEtPP, suggesting that the axial ligand fluorination does not increase the electron affinity of the P(V)porphyrin ring.
The free energy change (-ΔG) for the ET oxidation of the tryptophan residue by the photoexcited P(V)porphyrins was roughly calculated from the following equation [22]:
-ΔG = ES1 - e(Eox - Ered) (5)
where e is the electronic charge and Eox is the oxidation potential of the amino acid. The oxidation potential of tryptophan is almost 0.65 V vs. SCE under the similar conditions of this study [23]. Because the charge of the P(V) porphyrin is neutralized by the ET, the factor of the distance between the ET donor and acceptor is negligible [8]. The estimated values of -ΔG (Table 2) suggest that the oxidation of the tryptophan residue of HSA through the ET by the photoexcited FEtPP and EtPP is possible.
Fluorescence quenching of P(V)porphyrins by HSA
The fluorescence lifetime ( f) of P(V)porphyrins with or without HSA was summarized in Table 3. The time-resolved fluorescence intensity could be fitted by a single exponential function in the FEtPP case. The double exponential function was well-fitted in the case of EtPP, suggesting the conformation difference. In the presence of HSA, the decay curves could be fitted by the double exponential function for the cases of both P(V)porphyrins, indicating that the microenvironment of porphyrins is affected through the interaction of HSA. The value of f was decreased by the interaction with HSA, supporting the ET reaction between amino acid and the S1 of P(V)porphyrins.
Photostability of P(V)porphyrins
The stability of these P(V)porphyrins during the photosensitized reaction was checked by UV-vis absorption measurements. The Soret band absorbance of P(V)porphyrins was decreased by photo-irradiation (λmax = 519 nm, 1 mW.cm-2, 120 min) in the presence of 10 μM HSA as follows: 5% and 8% for FEtPP and EtPP,
respectively. These results indicated that a part of P(V)porphyrin itself is decomposed through photosensitized reaction.
CONCLUSION
In conclusion, P(V)porphyrins, FEtPP and EtPP, could induce protein photodamage through 1O2 generation and the ET mechanism. 1O2 generation is a well-known mechanism for porphyrin photosensitization [24, 25]. The ET mechanism is hardly observed in the case of protein or DNA damage by a visible-light photosensitizer [5]. The time-resolved fluorescence study suggests that the electron abstraction from the tyrptophan residue to the S1 of P(V)porphyrins contributes to the ET mechanism of HSA photodamage. The radical cation of the tryptophan residue formed through ET should undergo further reaction with the surrounding elements, such as water and oxygen. An oxidized product, such as N-formylkynurenine, should be finally formed [26]. Since HSA damage was not observed under anaerobic conditions, the final protein damage depends on the oxygen under this experimental condition. The fluorination of the axial ligand of P(V)porphyrin slightly improved the ΦΔ value. The total quantum yield of the protein photodamage was slightly enhanced through this fluorination of the axial ligand of P(V)porphyrin. FEtPP and EtPP should have ability to induce DNA photodamage. The ET and 1O2 generation selectively cause guanine-specific oxidation. Indeed, we have previously reported the guanine-specific damage by other P(V)porphyrin, dihydroxoP(V)tetraphenylporphyrin (OHPP) [9]. The values of ΦΔ of FEtPP and EtPP are lager than that of OHPP (0.28). Furthermore, the values of Ered of FEtPP and EtPP are higher than that of OHPP (-0.5 V). Therefore, we can speculate that FEtPP and EtPP induce severe DNA photodamage at guanine residues compared with the previous reported P(V)porphyrin.
Table 2. Redox potential and the parameter about the electron transfer oxidation
Porphyrin Ered (V) Eox (V) -ΔG (eV)
FEtPP -0.40 1.63 0.98EtPP -0.30 1.73 1.05
The Eox was calculated from the value of Ered and the wavelength of fluorescence maximum. The -ΔG was estimated from the excitation energy of P(V)porphyrins and the redox potentials of P(V)porphyrins and tryptophan.
Table 3. Fluorescence lifetime of P(V)porphyrins with or without HSA
Porphyrin HSA f (ns) [fraction]
FEtPP without 4.43 [1.000]
+ 5 μM 4.08 [0.449] 0.81 [0.551]
+ 10 μM 4.07 [0.414] 0.90 [0.586]
+ 20 μM 4.02 [0.392] 0.94 [0.608]
EtPP without 4.95 [0.785] 2.37 [0.215]
+ 5 μM 4.68 [0.634] 1.43 [0.366]
+ 10 μM 4.61 [0.579] 1.39 [0.421]
+ 20 μM 4.48 [0.556] 1.33 [0.444]
The sample solution contained 8 μM P(V)porphyrins with or without HSA in a 10 mM sodium phosphate buffer (pH 7.6). Ex = 410 nm. Em = 630 nm.

62 K. HIRAKAWA ET AL.
Copyright © 2013 World Scientific Publishing Company J. Porphyrins Phthalocyanines 2013; 17: 62–62
Acknowledgements
The authors thank Dr. Jotaro Nakazaki and Professor Hiroshi Segawa (The University of Tokyo) for measurement of the redox potential. This work was supported by a Grant-in-Aid for Scientific Research from the Ministry of Education, Culture, Sports, Science and Technology (MEXT) of the Japanese Government.
REFERENCES
1. Dolmans DEJGJ, Fukumura D and Jain RK. Nat. Rev. Cancer 2003; 3: 380–387.
2. Castano AP, Mroz P and Hamblin MR. Nat. Rev. Cancer 2006; 6: 535–545.
3. Wilson BC and Patterson MS. Phys. Med. Biol. 2008; 53: R61–R109.
4. Peskin BS and Carter MJ. Medical Hypotheses 2008; 70: 298–304.
5. Hirakawa K. In New Research on DNA Damage, Nova Science Publishers Inc.: New York, 2008; Chapter 9, pp 197.
6. Hirakawa K and Segawa H. J. Photochem. Photobiol., A 1999; 123: 67–76.
7. Takeuchi Y, Hirakawa K, Susumu K and Segawa H. Electrochemistry 2004; 72: 449–451.
8. Hirakawa K and Segawa H. Photochem. Photobiol. Sci. 2010; 9: 704–709.
9. Hirakawa K, Kawanishi S, Hirano T and Segawa H. J. Photochem. Photobiol., B 2007; 87: 209–217.
10. Shiragami T, Matsumoto J, Inoue H and Yasuda M. J. Photochem. Photobiol., C 2005; 6: 227–248.
11. Inoue H, Okamoto T, Kameo Y, Sumitani M, Fujiwara A, Ishibashi D and Hida M. J. Chem. Soc. Perkin Trans. 1994; 1: 105–111.
12. Andou Y, Ishikawa K, Shima K, Shiragami T, Yasuda M and Inoue H. Bull. Chem. Soc. Jpn. 2002; 75: 1757–1760.
13. Hirakawa K, Kawanishi S, Matsumoto J, Shiragami T and Yasuda T. J. Photochem. Photobiol., B 2006; 82: 37–44.
14. Marrese CA and Carrano CJ. Inorg. Chem. 1983; 22: 1858–1862.
15. Hirakawa K, Ebara Y, Hirano T and Segawa H. J. Jpn. Soc. Laser Surg. Med. 2009; 29: 372–382.
16. Matsumoto J, Shinbara T, Tanimura S, Matsumoto T, Shiragami T, Yokoi H, Nosaka Y, Okazaki S, Hirakawa K and Yasuda M. J. Photochem. Photobiol., A 2011; 218: 178–184.
17. Usui Y and Kamogawa K. Photochem. Photobiol. 1974; 19: 245–247.
18. Hirakawa K, Hirano T, Nishimura Y, Arai T and Nosaka Y. J. Phys. Chem. B 2012; 116: 3037–3044.
19. Sima J. Coord. Chem. Rev. 2006; 250: 2325–2334. 20. Ogilby PR and Foote CS. J. Am. Chem. Soc. 1983;
105: 3423–3430. 21. Krasnovsky AA Jr. J. Photochem. Photobiol., A
2008; 196: 210–218. 22. Weller A. Z. Phys. Chem. Noue Folge 1982; 133: 93–98. 23. Nana CG, Feng ZZ, Li WX, Ping DJ and Qin CH.
Anal. Chim. Acta 2002; 452: 245–254. 24. DeRosa MC and Crutchley RJ. Coord. Chem. Rev.
2002; 233–234: 351–371. 25. Lang K, Mosinger J and Wagneroviá DM. Coord.
Chem. Rev. 2004; 248: 321–350. 26. Ehrenshaft M, de Oliveira Silva S, Perdivara I, Bilski
P, Sik RH, Chignell CF, Tomer KB and Mason RP. Free Radic. Biol. Med. 2009; 46: 1260–1266.
Journal of Porphyrins and PhthalocyaninesJ. Porphyrins Phthalocyanines 2013; 17: 63–72
DOI: 10.1142/S1088424612501234
Published at http://www.worldscinet.com/jpp/
Copyright © 2013 World Scientific Publishing Company
INTRODUCTION
Caldariomyces fumago chloroperoxidase (CCPO) is a versatile heme enzyme that has been under continuous study for forty five years [1–8] and has been shown to
catalyze a multitude of reactions. This 42 kDa enzyme was originally shown to halogenate organic substrates, but the enzyme is also an efficient catalase and peroxidase [2, 3]. In recent years, different mechanistic pathways have been added to CCPO’s arsenal [5, 6], as well as a continuing push for enzyme structural information [8, 9]. Scheme 1 shows the known CCPO pathways and possible intermediates created, the most important of which is the oxidized Fe(IV)-oxo porphyrin radical termed Compound I (Cpd I). Cpd I was first isolated and
Reaction of ferric Caldariomyces fumago chloroperoxidase
with meta-chloroperoxybenzoic acid: sequential formation
of compound I, compound II and regeneration of the ferric
state using one reactant
Daniel P. Collinsa, Issa S. Isaaca, Eric D. Coultera†, Paul W. Hagerb,
David P. Ballou*c and John H. Dawson*a,d
a Department of Chemistry and Biochemistry, University of South Carolina, Columbia, SC 29208, USA b Department of Biology, East Carolina University, Greenville, NC 27858, USA c Department of Biological Chemistry, Medical School, University of Michigan, Ann Arbor, MI 48109, USA d School of Medicine, University of South Carolina, Columbia, SC 29208, USA
Received 26 April 2012Accepted 2 August 2012
ABSTRACT: The mechanism of the reaction between ferric Caldariomyces fumago chloroperoxidase (CCPO) and meta-chloroperoxybenzoic acid (mCPBA) has been examined. It has previously been established that an Fe(IV)-oxo porphyrin radical species known as Compound I (Cpd I) is formed by two-electron oxidation of the native ferric enzyme by a variety of oxidants including organic peracids and hydroperoxides. Cpd I can return to the ferric state either by direct oxygen insertion into an organic substrate (e.g. a P450 oxygenase-like reaction), or by two consecutive one-electron additions, the first resulting in an intermediate Fe(IV)-oxo species known as Compound II (Cpd II). There has been much debate over the role of Cpd II and the details of its structure. In the present study, both CCPO Fe(IV)-oxo intermediates are formed, but unlike most CCPO reactions, Cpd I and Cpd II are formed using the same reactant, mCPBA. Thus, the peracid is used as an oxo donor to produce Cpd I and then as a reductant to reduce Cpd I to Cpd II, and finally, Cpd II to the ferric state. The observation of saturation kinetics with respect to mCPBA concentration for each step is consistent with the formation of CCPO-mCPBA complexes in each phase of the reaction. The original reaction mechanism for ferric CCPO with mCPBA was hypothesized to involve a scrambling mechanism with a unique Fe-OOO-C(O)R intermediate formed with no observed Cpd II intermediate. The data reported herein clearly demonstrate the formation of Cpd II in returning the oxidized enzyme back to its native ferric state.
KEYWORDS: chloroperoxidase, compound I, compound II, meta-chloroperoxybenzoic acid, peracid, rapid-scan stopped-flow spectroscopy, saturation kinetics.
SPP full member in good standing
*Correspondence to: David P. Ballou, email: [email protected] and John H. Dawson, email: [email protected]†Deceased, August 24, 2006
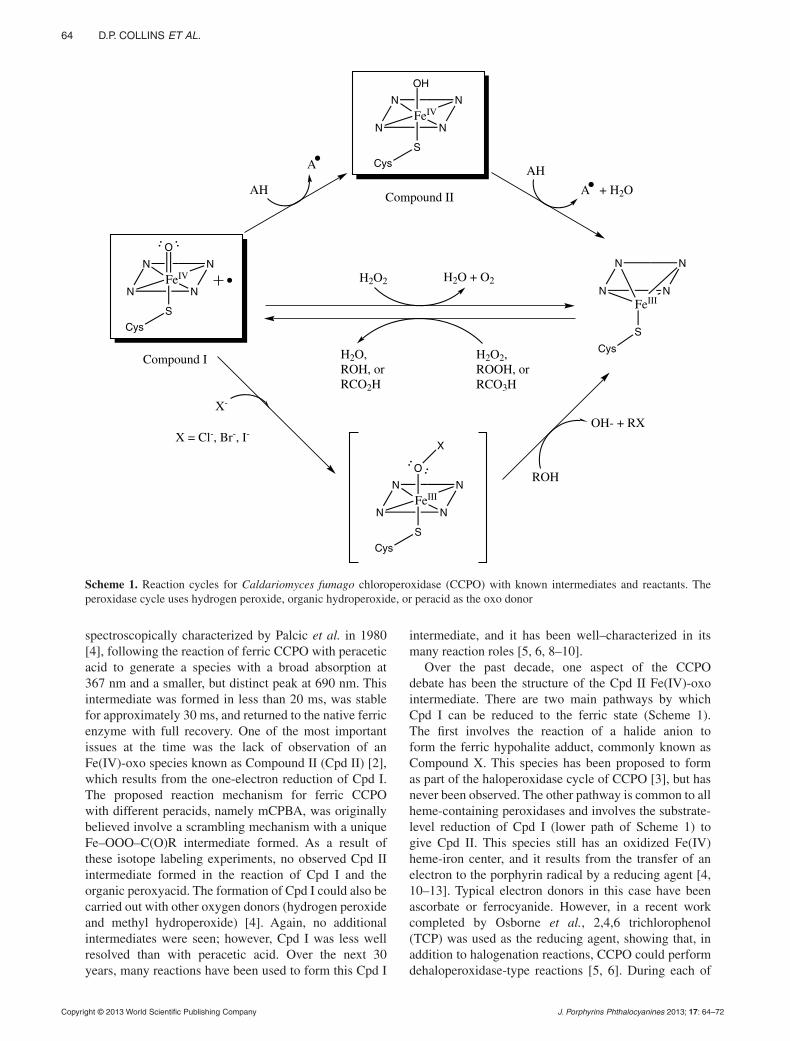
64 D.P. COLLINS ET AL.
Copyright © 2013 World Scientific Publishing Company J. Porphyrins Phthalocyanines 2013; 17: 64–72
spectroscopically characterized by Palcic et al. in 1980 [4], following the reaction of ferric CCPO with peracetic acid to generate a species with a broad absorption at 367 nm and a smaller, but distinct peak at 690 nm. This intermediate was formed in less than 20 ms, was stable for approximately 30 ms, and returned to the native ferric enzyme with full recovery. One of the most important issues at the time was the lack of observation of an Fe(IV)-oxo species known as Compound II (Cpd II) [2], which results from the one-electron reduction of Cpd I. The proposed reaction mechanism for ferric CCPO with different peracids, namely mCPBA, was originally believed involve a scrambling mechanism with a unique Fe–OOO–C(O)R intermediate formed. As a result of these isotope labeling experiments, no observed Cpd II intermediate formed in the reaction of Cpd I and the organic peroxyacid. The formation of Cpd I could also be carried out with other oxygen donors (hydrogen peroxide and methyl hydroperoxide) [4]. Again, no additional intermediates were seen; however, Cpd I was less well resolved than with peracetic acid. Over the next 30 years, many reactions have been used to form this Cpd I
intermediate, and it has been well–characterized in its many reaction roles [5, 6, 8–10].
Over the past decade, one aspect of the CCPO debate has been the structure of the Cpd II Fe(IV)-oxo intermediate. There are two main pathways by which Cpd I can be reduced to the ferric state (Scheme 1). The first involves the reaction of a halide anion to form the ferric hypohalite adduct, commonly known as Compound X. This species has been proposed to form as part of the haloperoxidase cycle of CCPO [3], but has never been observed. The other pathway is common to all heme-containing peroxidases and involves the substrate-level reduction of Cpd I (lower path of Scheme 1) to give Cpd II. This species still has an oxidized Fe(IV) heme-iron center, and it results from the transfer of an electron to the porphyrin radical by a reducing agent [4, 10–13]. Typical electron donors in this case have been ascorbate or ferrocyanide. However, in a recent work completed by Osborne et al., 2,4,6 trichlorophenol (TCP) was used as the reducing agent, showing that, in addition to halogenation reactions, CCPO could perform dehaloperoxidase-type reactions [5, 6]. During each of
N N
N NFeIV
S
Cys
O
Compound I
N N
N NFeIV
S
Cys
OH
Compound II
N N
N NFeIII
S
Cys
AH
A + H2OAH
A
H2O,ROH, orRCO2H
H2O2,ROOH, orRCO3H
H2O2 H2O + O2
N N
N NFeIII
S
Cys
O
X
X-
X = Cl-, Br-, I-
ROH
OH- + RX
Scheme 1. Reaction cycles for Caldariomyces fumago chloroperoxidase (CCPO) with known intermediates and reactants. The peroxidase cycle uses hydrogen peroxide, organic hydroperoxide, or peracid as the oxo donor

REACTION OF FERRIC CALDARIOMYCES FUMAGO CHLOROPEROXIDASE WITH META-CHLOROPEROXYBENZOIC ACID 65
Copyright © 2013 World Scientific Publishing Company J. Porphyrins Phthalocyanines 2013; 17: 65–72
these reactions, Cpd II with its characteristic spectral peaks was observed. In particular, a peak at 438 nm is seen, along with a shoulder at ~380 nm. In the visible region, distinct alpha and beta bands are formed, which are characteristic of Cpd II of peroxidases such as horseradish peroxidase [14]. An important observation during these reactions was the consecutive observation of both Cpd I and Cpd II, consistent with a mechanism involving two consecutive one-electron steps [15]. Other peroxidases also show similar reactions involving both high-valent heme intermediates, Cpd I and Cpd II [16].
Cpd II was originally believed to have an iron(IV)-oxo structure in which the only difference compared to Cpd I was the lack of the porphyrin radical. Recently, however, it has been shown that Cpd II has an iron(IV)-hydroxyl structure resulting from protonation of the oxo oxygen [9, 17]. The electron-donating character of the cysteine ligand is also believed to play a stabilizing role in both Cpd I and Cpd II [18, 19].
One important aspect of CCPO is the functional and structural similarity between this enzyme and cytochrome P450 [20]. Consequently, insight gained on one system can be useful for understanding the other. The P450 enzymes have been the focus of extensive study over the past 50 years due to their importance in drug metabolism and organic substrate solublization. Both P450 and CCPO contain a protoporphyrin IX prosthetic group, and both hemes are ligated to a proximal cysteine-thiolate sulfur; this active site coordination structure is believed to be optimal for ferryl formation in heme enzymes, even though other chloroperoxidase and dehaloperoxide enzymes have been shown to be histidine ligated systems [21]. The active site environment helps determine the individual chemical roles of both enzymes, as well as the spectral characteristics of their complexes with exogenous ligands [22]. One important goal of study is the determination of how the high-valent states, Cpd I and Cpd II, of CCPO can react with various compounds and thus aid our understanding of how the analogous species in P450 enzymes react. Because it has been shown that CCPO can carry out oxygen insertion reactions [23] analogous to those of P450 enzymes, study of the reactions of these intermediates of CCPO with various substrates is likely to be helpful to the understanding of the reactions in P450. Supporting this notion is the recent confirmation that Cpd I of CYP119 is an iron(IV) porphyrin radical [24], like that of CCPO. Cpd I in P450 is thought to be the active oxygen that brings about hydroxylation of substrates. The continuing goal of studying enzymes like CCPO and P450 is to not only to understand the structure of both enzymes, but also to learn how the key intermediates react with a variety of substrates.
In this work, we have re-examined the reaction of ferric CCPO with the well-known oxidizing agent, meta-chloroperoxybenzoic acid (mCPBA), using rapid-scan, stopped-flow spectroscopy to monitor the reaction. We
report that this peracid not only serves as an oxo donor to the ferric heme iron to generate Cpd I, but it also can serve as the electron donor to the oxidized enzyme active site. Upon mixing ferric CCPO with mCPBA, we observe consecutive phases in which ferric CCPO is first oxidized to Cpd I, Cpd I is then reduced to Cpd II, and, finally, Cpd II is converted back to the ferric resting state.
RESULTS
Formation of CCPO Cpd I from the ferric enzyme
When mCPBA is rapidly mixed with ferric CCPO in the stopped-flow spectrophotometer and characterized by rapid scan spectra, three phases are observed. In the first phase of the reaction, mCPBA oxidized the ferric CCPO to form Cpd I (Figs 1 and 2). The largest spectral changes are the disappearance of the Soret absorption peak at 400 nm of ferric CCPO and the formation of a new peak at 367 nm during the first 30 ms after mixing. This species has been determined previously to be CCPO Cpd I, which is stable for 1–2 s [4, 25]. Additional changes seen during the conversion from the ferric enzyme to the Fe(IV)-oxo porphyrin radical of Cpd I include the disappearance of the two visible peaks at 516 nm and 544 nm and the formation of a peak at 690 nm for CCPO Cpd I. Individual wavelength traces observed during this reaction are shown in Fig. 2; the formation of Cpd I is indicated by those at 690 nm and 367 nm and the disappearance of the ferric enzyme by that at 400 nm.
Formation of Compound II from Cpd I
In the second phase of the reaction, occurring over the next 10 s, CCPO Cpd I converts to the Fe(IV)-oxo Cpd II using mCPBA as a reducing agent. The spectral data for this conversion are shown in Fig. 3; most notable is
Fig. 1. Rapid-scan stopped flow absorption data for the reaction of CCPO (8 μM) with mCPBA (100 μM) recorded from 1.5–200 ms; only selected spectra are shown. Reaction carried out at 4 °C, pH 4.0 in a buffer containing 50 mM potassium phosphate. Concentrations are those after mixing

66 D.P. COLLINS ET AL.
Copyright © 2013 World Scientific Publishing Company J. Porphyrins Phthalocyanines 2013; 17: 66–72
the disappearance of the peak for Cpd I at 367 nm and the formation of a new species with characteristic peaks at 438 and ~380 nm. This spectrum has been shown previously to be that of Cpd II [6]. The other spectral changes that take place during this conversion are the loss of the Cpd I peak at 690 nm formed in the first phase, as well as the formation of two new peaks at 541 nm and 571 nm, both indicative of Cpd II. Individual traces showing the conversion of Cpd I to Cpd II are in Fig. 4; the formation of Cpd II (trace at 438 nm) and the disappearance of the oxidized Compound I formed in phase 1 (traces at 367 nm and 690 nm) are kinetically well correlated. Another aspect of this phase of the reaction is the possible formation of a radical organic species, possibly mCPBA·. In order to probe the identity
Fig. 2. Individual absorbance traces vs. time for the CCPO and mCPBA stopped flow experiment in phase 1. Trace at 400 nm is attributed to the disappearance of ferric CCPO, and the 367 nm and 690 nm traces coincide with the formation of Compound I
Fig. 3. Rapid-scan stopped flow absorption data for the reaction of CCPO (8 μM) with mCPBA (800 μM) recorded over 20 s; only selected spectra are shown. Reaction was at 4 °C, pH 4.0 in a buffer containing 50 mM potassium phosphate. Concentrations are those after mixing
Fig. 4. Individual absorbance traces vs. time for the CCPO and mCPBA stopped flow experiment for phase 2 shown in Fig. 3. The 367 nm and 690 nm traces coincide with the formation of Compound I, while the 438 nm trace is attributed to the disappearance of Compound II
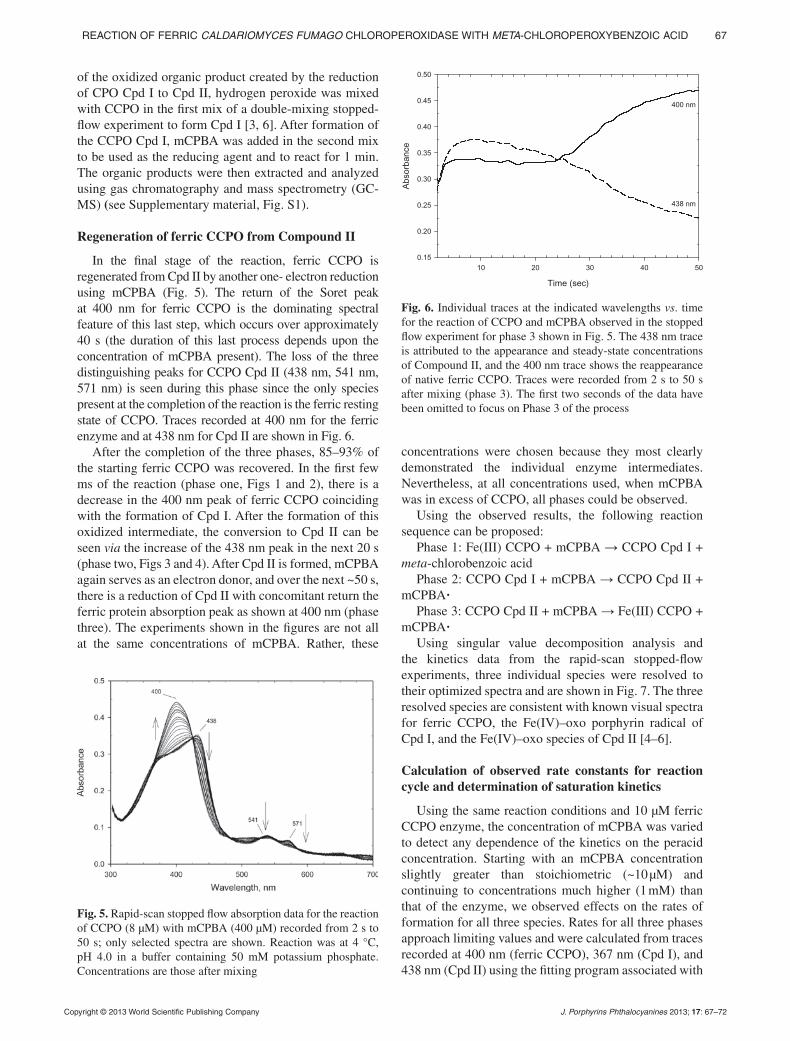
REACTION OF FERRIC CALDARIOMYCES FUMAGO CHLOROPEROXIDASE WITH META-CHLOROPEROXYBENZOIC ACID 67
Copyright © 2013 World Scientific Publishing Company J. Porphyrins Phthalocyanines 2013; 17: 67–72
of the oxidized organic product created by the reduction of CPO Cpd I to Cpd II, hydrogen peroxide was mixed with CCPO in the first mix of a double-mixing stopped-flow experiment to form Cpd I [3, 6]. After formation of the CCPO Cpd I, mCPBA was added in the second mix to be used as the reducing agent and to react for 1 min. The organic products were then extracted and analyzed using gas chromatography and mass spectrometry (GC-MS) (see Supplementary material, Fig. S1).
Regeneration of ferric CCPO from Compound II
In the final stage of the reaction, ferric CCPO is regenerated from Cpd II by another one- electron reduction using mCPBA (Fig. 5). The return of the Soret peak at 400 nm for ferric CCPO is the dominating spectral feature of this last step, which occurs over approximately 40 s (the duration of this last process depends upon the concentration of mCPBA present). The loss of the three distinguishing peaks for CCPO Cpd II (438 nm, 541 nm, 571 nm) is seen during this phase since the only species present at the completion of the reaction is the ferric resting state of CCPO. Traces recorded at 400 nm for the ferric enzyme and at 438 nm for Cpd II are shown in Fig. 6.
After the completion of the three phases, 85–93% of the starting ferric CCPO was recovered. In the first few ms of the reaction (phase one, Figs 1 and 2), there is a decrease in the 400 nm peak of ferric CCPO coinciding with the formation of Cpd I. After the formation of this oxidized intermediate, the conversion to Cpd II can be seen via the increase of the 438 nm peak in the next 20 s (phase two, Figs 3 and 4). After Cpd II is formed, mCPBA again serves as an electron donor, and over the next ~50 s, there is a reduction of Cpd II with concomitant return the ferric protein absorption peak as shown at 400 nm (phase three). The experiments shown in the figures are not all at the same concentrations of mCPBA. Rather, these
concentrations were chosen because they most clearly demonstrated the individual enzyme intermediates. Nevertheless, at all concentrations used, when mCPBA was in excess of CCPO, all phases could be observed.
Using the observed results, the following reaction sequence can be proposed:
Phase 1: Fe(III) CCPO + mCPBA CCPO Cpd I + meta-chlorobenzoic acid
Phase 2: CCPO Cpd I + mCPBA CCPO Cpd II + mCPBA·
Phase 3: CCPO Cpd II + mCPBA Fe(III) CCPO + mCPBA·
Using singular value decomposition analysis and the kinetics data from the rapid-scan stopped-flow experiments, three individual species were resolved to their optimized spectra and are shown in Fig. 7. The three resolved species are consistent with known visual spectra for ferric CCPO, the Fe(IV)–oxo porphyrin radical of Cpd I, and the Fe(IV)–oxo species of Cpd II [4–6].
Calculation of observed rate constants for reaction cycle and determination of saturation kinetics
Using the same reaction conditions and 10 μM ferric CCPO enzyme, the concentration of mCPBA was varied to detect any dependence of the kinetics on the peracid concentration. Starting with an mCPBA concentration slightly greater than stoichiometric (~10 μM) and continuing to concentrations much higher (1 mM) than that of the enzyme, we observed effects on the rates of formation for all three species. Rates for all three phases approach limiting values and were calculated from traces recorded at 400 nm (ferric CCPO), 367 nm (Cpd I), and 438 nm (Cpd II) using the fitting program associated with
Fig. 5. Rapid-scan stopped flow absorption data for the reaction of CCPO (8 μM) with mCPBA (400 μM) recorded from 2 s to 50 s; only selected spectra are shown. Reaction was at 4 °C, pH 4.0 in a buffer containing 50 mM potassium phosphate. Concentrations are those after mixing
Time (sec)
10 20 30 40 50
Absorb
ance
0.15
0.20
0.25
0.30
0.35
0.40
0.45
0.50
438 nm
400 nm
Fig. 6. Individual traces at the indicated wavelengths vs. time for the reaction of CCPO and mCPBA observed in the stopped flow experiment for phase 3 shown in Fig. 5. The 438 nm trace is attributed to the appearance and steady-state concentrations of Compound II, and the 400 nm trace shows the reappearance of native ferric CCPO. Traces were recorded from 2 s to 50 s after mixing (phase 3). The first two seconds of the data have been omitted to focus on Phase 3 of the process

68 D.P. COLLINS ET AL.
Copyright © 2013 World Scientific Publishing Company J. Porphyrins Phthalocyanines 2013; 17: 68–72
the Kinetic Studio stopped-flow program. The rates of all three phases are shown in Fig. 8. This behavior implies that mCPBA forms individual complexes with ferric, Cpd I, and Cpd II, and that these complexes react at maximum rates as indicated in these figures. Fitting the rates of each of the phases vs. the concentrations of mCPBA to hyperbolic equations, maximum rates and apparent Kd values were obtained as indicated in Table 1. The rate constant k1 is the observed rate for the conversion of ferric CCPO to Cpd I (Fig. 8A), k2 is for the conversion of Cpd I to Cpd II (Fig. 8B), and finally k3 is the rate of regeneration of ferric CCPO from Cpd II (Fig. 8C) (Scheme 2). The lifetime of the Cpd II intermediate (e.g. the steady-state region on the 400 nm trace in Fig. 6) is shown in Fig. 9 to be proportional to the concentration of mCPBA. This is consistent with the rate-limiting step of the reaction during turnover being the conversion of Cpd II to ferric CCPO.
DISCUSSION
The overall reaction of ferric CCPO with mCPBA involves two distinct types of chemical processes. Phase 1 involves the two-election oxidation of the Fe(III) heme to form the Fe(IV)-oxo porphyrin radical Cpd I with mCPBA serving as the oxo-donor (Scheme 1). The other product created in this phase is meta-chlorobenzoic acid. This reaction has been detailed in previous experiments [26], and the resulting CCPO intermediate has spectra identical to those obtained with other oxo-donors to CCPO, such as peracetic acid or hydrogen peroxide [4, 10–13]. Saturation kinetics with respect to the mCPBA concentration (Fig. 8A) strongly suggests that a binding adduct is formed en route from ferric CCPO to Cpd I. An apparent dissociation constant of 128 μM for the acylperoxo intermediate and a maximum rate of formation of Cpd I (98 s-1) were calculated from the
same saturation plot. This is the fastest step in the overall reaction. The reaction scheme for Phase 1 is:
Fe(III) CCPO mCPBA [mCPBA-CCPO] k1
Cpd I meta-chlorobenzoic acid
A reasonable possibility for a binding complex is an acylperoxo-iron(III) adduct (Compound 0-like), an intermediate that has been implicated with other heme proteins, namely myoglobin and horseradish peroxidase [27, 28], and has also been suggested in studies using singular value decomposition analysis of data for the reaction of mCPBA with another cysteine-ligated heme
Wavelength (nm)
300 400 500 600 700
(mM
cm
)ε
-1
0
20
40
60
80 CCPO Cpd I
CCPO Cpd II
Ferric CCPO
Fig. 7. Singular value decomposition (SVD) analysis of the rapid-scan data collected from the reaction of CCPO (8 μM) with mCPBA (600 μM). Reaction was carried out at 4 °C, pH 4.0 in a buffer containing 50 mM potassium phosphate. Concentrations are those after mixing
Fig. 8. Dependence of k1-3 on the concentration mCPBA. (a) saturation kinetics for the first phase of the reaction of CCPO and mCPBA. (b) saturation kinetics for the second phase of the reaction of CCPO and mCPBA. (c) shows the kinetics for the third phase

REACTION OF FERRIC CALDARIOMYCES FUMAGO CHLOROPEROXIDASE WITH META-CHLOROPEROXYBENZOIC ACID 69
Copyright © 2013 World Scientific Publishing Company J. Porphyrins Phthalocyanines 2013; 17: 69–72
protein, cytochrome P450cam [29]. In that study, a slightly blue-shifted species was observed before the enzyme converted to Cpd I when mCPBA and P450cam were reacted at 4 °C. One aim of the present examination not spectroscopically observed a similar species in CCPO, but this species not spectroscopically observed. However, past experiments have indicated that the CCPO Compound 0 hydroperoxo intermediate can only be seen at temperatures much lower than 4 °C [30].
The second phase of the overall process involves the reaction of the newly formed CCPO Cpd I with the mCPBA still present. In this step, the peracid does not play its usual role as an oxo-donor, but, instead, serves as the reducing agent to convert Cpd I to the other ferryl species, Cpd II. This contrasts with most laboratory experiments with peroxidases (and other hemoproteins) that use separate reducing agents such as ascorbate to reduce Cpd I to Cpd II [6, 10–13]. To convert Cpd I to Cpd
II, the porphyrin radical oxidizes mCPBA, converting it to a radical. Our results and interpretation are consistent with the spectral and kinetics data reported by Dunford and co-workers [31, 32].
Peroxidases are capable of abstracting a hydrogen atom from organic substrates, so it is predicted that CCPO Cpd I will remove the hydrogen atom from the hydroxyl group of the mCPBA that is located in the active site, thus forming a protonated Cpd II as discussed in the introduction, as well as mCPBA· [Cl-Ar-C(O)OO·]. Using 5,5-dimethyl-1-pyrroline N-oxide (DMPO) as a radical trap with detection by EPR, it has been shown that a peroxyl radical (ROO·) is generated by CCPO when it reacts with an alkyl hydroperoxide [33–35]. It has been reported that in analogous reactions myeloperoxidase Cpd I can abstract a hydrogen atom from hydrogen peroxide and that prostaglandin endoperoxidase Cpd I can abstract a hydrogen atom from alkyl hydroperoxides [32, 33, 36]. To test this further, Cpd I was formed by the reaction of H2O2 with ferric CCPO. The resulting Cpd I was then mixed with mCPBA and the only product observed by GC-MS analysis was the carboxylic acid, meta-chlorobenzoic acid (mCBA). Because H2O2 is used to form Cpd I, mCBA can only be formed in the subsequent steps in which Cpd II and ferric CCPO are formed. Thus all mCBA is formed from phases 2 and 3.
A mechanism for the degradation of the oxidized mCPBA· species to the carboxylic acid is presented in Scheme 2. CCPO Cpd I is proposed to abstract a hydrogen atom from mCPBA by a similar mechanism as described previously [31–36], yielding Cl-Ar-C(O)OO·. Then, the radical can either abstract a hydrogen atom from the aqueous solvent to reform the mCPBA to be used again in the oxygen donation to the ferric enzyme, or a reactive dimer of the radical can form. The resulting dimer, Cl-Ar-C(O)-O4-C(O)-Ar-Cl, will then lose molecular oxygen as proposed by Mason in studies of the reaction of CPO with alkyl peroxides [33]. Loss of O2 leads to a new radical species, Cl-Ar-C(O)O·. This radical will then do the same hydrogen atom abstraction from the solvent to form the observed mCBA. It was also possible that the Cl-Ar-C(O)O· intermediate could form a dimer by radical recombination, creating a Cl-Ar-C(O)OOC(O)-Ar-Cl meta-chlorobenzoyl peroxide (mCPBO) product. This species is stable, but due to the low concentration of Cl-Ar-C(O)O· in solution and the availability of hydrogen in the solvent, formation
Fig. 9. Plot of the lifetime Cpd II vs. concentration of mCPBA. The data were obtained from the steady-state portions of plots of reactions such as that shown in Fig. 6
Cl
OOO
Cl
OOHOCCPO Cpd I
CCPO Cpd II
O4
O
O
Cl
Cl
Cl
OO2x
2
O2 Cl
OHO
H2OOH
H2OOH
Scheme 2. Proposed mechanism for the degradation of oxidized mCPBA· to mCBA
Table 1. Summary of the dissociation constants (Kd) and maximum enzymatic rate (kmax) for the three phases of the CCPO/mCPBA reaction
Reaction Kd, μM kmax, s-1
Ferric CCPO/mCPBA interaction 128 ± 10 97.5 ± 3
Compound I/mCPBA interaction 58 ± 7 10.3 ± 0.5
Compound II/mCPBA interaction 24 ± 6 0.26 ± 0.04

70 D.P. COLLINS ET AL.
Copyright © 2013 World Scientific Publishing Company J. Porphyrins Phthalocyanines 2013; 17: 70–72
of this dimer peroxide seems highly unlikely; it was not observed in the GC-MS analysis. The organic radicals described in Scheme 2 should be observable using trapping protocols [31–36]. The unusual aspect of this mechanism is that CCPO uses mCPBA, normally an oxidant, as a reducing agent. This is not seen when CCPO is reacted with peracetic acid as the oxo-donor. In that case, the ferric enzyme converts to Cpd I readily, but the only way to observe conversion to the reduced Cpd II is with the addition of an exogenous reducing agent such as ascorbate. Presumably, peracetic acid is not a strong enough reducing agent to also play that role.
Even though the radical species of the mCPBA has not been isolated, apparent saturation kinetics with this substrate for phase 2 allows us to calculate an apparent dissociation constant for the Cpd I/mCPBA complex (Kd = 58 μM) as well as the observed maximal rate for the subsequent chemistry (k2 = 10.3 s-1). mCPBA reacts more slowly with and binds less tightly to Cpd I than to ferric CCPO. The reaction scheme for Phase 2 is:
CCPO Cpd I + mCPBA [mCPBA-Cpd I] k2
Cpd II + mCPBA (Cl-Ar-COOO )
For the third and final phase, an analogous two-step mechanism to that described for phase two is proposed for regeneration of the ferric CCPO enzyme as indicated below.
CCPO Cpd II + mCPBA [mCPBA-Cpd II] k3
Fe (III) CCPO + Cl-Ar-COOO + H2O
A value of k3 = 0.26 s-1 has been determined for the maximal rate of conversion of the mCPBA-Cpd II complex to ferric CCPO plus the Cl-Ar-COOO with an apparent Kd value of 24 μM for complex formation. Presumably, the result of this step is the abstraction of another hydrogen atom from a molecule of mCPBA to generate a molecule of water bound to the ferric heme iron plus the metachloroperbenzoate radical. Dissociation of the water returns the enzyme to its ferric five-coordinate, high-spin resting state. The recovery of the starting enzyme for the entire process after multiple turnovers is approximately 85–93%. The small loss of ferric enzyme could be due to many causes. It has been shown that using high concentrations of peracids and other oxo-donors with other thiolate-ligated enzymes causes some or even nearly complete bleaching or destruction of the heme [28], but for the most part, the recovery and viability of the CCPO during this process shows that it can withstand harsh conditions and higher peracid concentrations than most cysteine anchored enzymes.
One interesting observation for this phase (Fig. 6) is the period in which the absorbance for Cpd II (438 nm) remains relatively flat. This is consistent with the conversion of Cpd II to the ferric enzyme being the rate-limiting step during turnover as implicated by the rates of the three phases just described. Consistent with this
notion, the spectral properties observed during this phase are largely those of CCPO Cpd II. In fact, the length of time that the steady-state phase is observed at 438 nm is directly proportional to the concentration of mCBA used (Fig. 9). It has been proposed that one role of CCPO Cpd II is to protect the heme. Cpd I is strongly oxidizing and prolonged exposure of the enzyme to this intermediate can lead to degradation of the heme. Converting the porphyrin radical species of Cpd I to Cpd II allows for peroxidase reactions to continue with Cpd II still being a fairly strong oxidizer without the possibility of bleaching or heme destruction. In this case, the enzyme converts from Cpd I to Cpd II a few seconds after mixing to ensure safety of the heme active site. Depending on the amount of mCPBA in solution, Cpd II has been observed to last up to approximately 40 s (Fig. 9). Once all of the mCPBA substrate is oxidized, the Cpd II intermediate is reduced back to the ferric resting state.
One important aspect of the proposed reaction cycle that has raised questions over the past decade is the location of the site for substrate binding for CCPO. The oxidation of the heme center takes place in the active site due to the direct transfer of the oxygen from mCPBA via the putative acylperoxo intermediate, but all of the oxidizing work completed by the enzyme thereafter has had a less definitive location. In past studies, it was suggested that oxidation of organic substrates occurred at the heme edge of the enzyme [37]. With the saturation kinetics and binding affinities calculated herein, it seems more likely that both the formation of Cpd I via direct oxo-transfer from bound mCPBA, and subsequent steps in which mCPBA serves as a hydrogen atom donor also occur at the heme center (i.e. coupled electron and proton atom loss from mCPBA). Presumably, when mCPBA acts as a reductant, it binds in a different orientation so that its hydroxyl is proximal to the ferryl species. On the other hand, it cannot be ruled out that the two one-electron oxidation steps of mCPBA occur at the heme edge followed by deprotonation (i.e. uncoupled electron and proton loss from mCPBA). Either mechanism is plausible and further studies will be needed to address this issue.
EXPERIMENTAL
Caldariomyces fumago chloroperoxidase was grown and purified as previously described [38]. Meta-chloroperoxybenzoic acid (mCPBA) was purchased (Sigma-Aldrich) and contained a maximum purity of 77% peracid. To obtain 99% mCPBA, the purchased compound was purified using previously described methods; because the highly purified mCPBA is an explosive hazard if heated, the temperature was carefully controlled [39]. The mCPBA purity was determined using the triiodide assay (ε353 = 25.5 mM-1.cm-1) [40]. Concentrated peracid stock solutions (500 mM) were prepared in acetone and diluted in 50 mM potassium phosphate (KPi) buffer, pH 4.0, for kinetics experiments.

REACTION OF FERRIC CALDARIOMYCES FUMAGO CHLOROPEROXIDASE WITH META-CHLOROPEROXYBENZOIC ACID 71
Copyright © 2013 World Scientific Publishing Company J. Porphyrins Phthalocyanines 2013; 17: 71–72
UV-visible absorption studies were completed using a Cary 400 spectrophotometer interfaced with a Dell PC. All kinetics experiments were performed at 4 °C at pH 4.0 in 50 mM potassium phosphate buffer using a Hi-Tech Ltd. SF-61 DX2 rapid-scan, stopped-flow instrument equipped with a Hi-Tech MG-6000 rapid scan diode array detector. The dead times of the instrument is 1.5 ms. The software used for kinetics experiments and rate constant determination is the Kinetic Studio application created by Hi-Tech Scientific. Singular value decomposition analysis of the data was completed using the Specfit Global Analysis program.
CONCLUSION
The interactions of CCPO and mCPBA during the different phases are summarized in Scheme 3. The first phase is the conversion from the ferric enzyme to Cpd I via an as yet to be observed acylperoxo intermediate. This step would be completed by the widely known oxo-donation mechanism with meta-chlorobenzoic acid as the other product. The second and third steps are then highlighted by a change in role for the mCPBA as Cpd I and Cpd II are each reduced by single electron transfers (in the form of a hydrogen atom) to produce the resting ferric state. In both of these steps mCPBA serves an electron donor by net transfer of a hydrogen atom (proton plus electron)
N N
N NFe III
S
Cys
Feric CCPO
N N
N NFe IV
SCys
O
Compound I
N N
N NFe IV
SCys
OH
Compound II
Cl
OOHO
Cl
OOHO
Cl
OOO
Cl
OOO
N N
N NFeIV
SCys
O
ClO
O
Cl
OOHO
N N
N NFe IV
SCys
O
ClO
HOO
N N
N NFeIV
SCys
OH
ClO
HOO
H+
H+
Cl
OHO
Acylperoxo-Fe(III) complex
CCPO Cpd I -mCPBA complex
CCPO Cpd II -mCPBA complex
k1obs
k2obs
k3obs
Scheme 3. Summary of the observed reaction of CCPO with meta-chloroperoxybenzoic acid

72 D.P. COLLINS ET AL.
Copyright © 2013 World Scientific Publishing Company J. Porphyrins Phthalocyanines 2013; 17: 72–72
forming Cpd II in the second phase and regenerating the ferric CCPO in the third phase. The observed saturation kinetics (summarized in Table 1) demonstrate that in each case, a CCPO/substrate complex is formed, and that the two steps of each phase are the formation of the complex followed by dissociation of the complex into the products. The singular value decomposition analysis for the rapid reaction kinetics results also generates the known spectra for the two oxo intermediates that have previously been reported using different reagents and helps illustrate that the peracid has the ability to oxygenate the heme center and reduce the highly reactive intermediates without the addition of another agent.
Acknowledgements
Financial support provided by the National Science Foundation (MCB 0820456).
Supporting information
<< to be completed by author(s) >> given in the supplementary material (Figs S1–S2). This material is available free of charge via the Internet at http://www.worldscinet.com/jpp/jpp.shtml.
REFERENCES
1. Morris DR and Hager LP. J. Biol. Chem. 1966; 8: 1763–1768.
2. Hager LP, Doubek DL, Silverstein RM, Hargis JH and Martin JC. J. Am. Chem. Soc. 1972; 94: 4364–4366.
3. Dawson JH. Science 1988; 240: 433–439. 4. Palcic MM, Rutter R, Araiso T, Hager LP and Dun-
ford HB. Biochem. Biophys. Res. Commun. 1980; 94: 1123–1127.
5. Osborne RL, Raner GM, Hager LP and Dawson JH. J. Am. Chem. Soc. 2006; 128: 1036–1037.
6. Osborne RL, Coggins MK, Terner J and Dawson JH. J. Am. Chem. Soc. 2007; 129: 14838–14839.
7. Dawson JH, Kan L-S, Penner-Hahn JE, Eble KS, Bruce GS, Hager LP and Hodgson KO. J. Am. Chem. Soc. 1986; 108: 8114–8116.
8. Kim SH, Perera R, Hager LP, Dawson JH and Hoff-man BM. J. Am. Chem. Soc. 2006; 128: 5598–5599.
9. Green MT, Dawson JH and Gray HB. Science 2004; 304: 1653–1656.
10. Nakajima R, Yamazaki I and Griffin BW. Biochem. Biophys. Res. Commun. 1985; 128: 1–6.
11. Dolphin D, Forman A, Borg DC, Fajer J and Felton RH. Proc. Nat. Acad. Sci. (USA) 1971; 68: 614–618.
12. Kaneko Y, Tamura M and Yamazaki I. Biochemistry 1980; 19: 5795–5799.
13. Lambeir AM, Dunford HB and Pickard MA. Eur. J. Biochem. 1987; 163: 123–127.
14. Hewson WD and Hager LP. J. Biol. Chem. 1979; 254: 3182–3186.
15. Osborne RL, Coggins MK, Raner GM, Walla M and Dawson JH. Biochemistry 2009; 48: 4231–4238.
16. Davydov R, Osborne, RL, Shanmugam M, Du J, Dawson JH and Hoffman BM. J. Am. Chem. Soc. 2010; 132: 14995–15004.
17. Davydov R, Osborne RL, Kim SH, Dawson JH and Hoffman BM. Biochemistry 2008; 47: 5147–5155
18. Lai W, Chen H and Shaik S. J. Phys. Chem. B 2009; 113: 7912–7917.
19. Stone KL, Behan RK and Green MT. Proc. Natl. Acad. Sci. USA 2006; 103: 12307–12310.
20. Sono M, Roach MP, Coulter ED and Dawson JH. Chem. Rev. 1996; 96: 2841–2887.
21. Roach MP, Chen, YP, Woodin SA, Lincoln DE, Lovell CR and Dawson JH. Biochemistry 1997; 36: 2197–2202.
22. Sono M, Eble KS and Dawson JH. J. Biol. Chem. 1985; 260: 15530–15535.
23. Manoj KM and Hager LP. Biochim. Biophys. Acta. 2001; 1547: 408–417.
24. Rittle J and Green MT. Science 2010; 330: 933–937. 25. Egawa T, Proshlyakow DA, Miki H, Makino R,
Ogura T, Kitagawa T and Ishimura Y. J. Biol. Inorg. Chem. 2001; 6: 46–54.
26. Arasio T, Rutter R, Palcic M, Hager LP and Dun-ford HB. Can. J. Biochem. 1981; 59: 233–236.
27. Baek HK and Van Wart HE. Biochemistry 1989; 28: 5714–5719.
28. Shintaku M, Matsuura K, Yoshioka S, Takahashi S, Ishimori K and Morishima I. J. Biol. Chem. 2005; 280: 40934–40938.
29. Spolitak T, Dawson JH and Ballou DP. J. Inorg.Bio-chem. 2006; 100: 2034–2044.
30. Denisov IG, Dawson JH, Hager LP and Sligar SG. Biochem. Biophys. Res. Comm. 2007; 363: 954–958.
31. Marquez LA, Huang JT and Dunford HB. Biochem-istry 1994; 33: 1447–1454.
32. Bakovic M and Dunford HB. J. Biol. Chem.1996; 271: 2048–2056.
33. Chamulitrat W, Takahashi N and Mason RP. J. Biol. Chem. 1989; 264: 7889–7899.
34. Hall RD, Chamulitrat W, Takahashi N, Chignell CF and Mason RP. J. Biol. Chem. 1989; 264: 7900–7906.
35. Van der Zee J, Barr DP and Mason RP. Free Rad. Biol. Med. 1996; 20: 199–206.
36. Dunford HB. Xenobiotica 1995; 25: 725–733. 37. Manoj KM and Hager LP. Biochemistry 2008; 47:
2997–3003. 38. Hollenberg PF and Hager LP. Methods Enzymol.
1978; 52: 521–529. 39. Aggarwal VK, Gultekin Z, Grainger RS, Adams H
and Spargo PL. J. Chem. Soc., Perkin Trans. 1 1998; 2771–2781.
40. Cotton ML, Dunford HB and Raycheba JM. Can. J. Biochem. 1973; 51: 627–631.

Journal of Porphyrins and PhthalocyaninesJ. Porphyrins Phthalocyanines 2013; 17: 73–85
DOI: 10.1142/S108842461250126X
Published at http://www.worldscinet.com/jpp/
Copyright © 2013 World Scientific Publishing Company
INTRODUCTION
Photodynamic therapy (PDT) is a successful and clinically approved anti-cancer modality that involves three basic components, namely, a photosensitizer,
light and oxygen [1]. Individually, none of these species is toxic, but when combined together produce reactive oxygen species such as singlet oxygen, superoxide and hydroxyl radicals. Selectivity for tumors is provided by two mechanisms: the tendency of intravenously injected photosensitizer to accumulate in tumors, and the ability to spatially confine the light delivery to the area of the lesion [2–4]. The production of reactive oxygen species inside the malignant cells leads to cell necrosis via apoptosis
Synthesis and evaluation of cationic bacteriochlorin
amphiphiles with effective in vitro photodynamic activity
against cancer cells at low nanomolar concentration
Sulbha K. Sharmaa, Michael Krayerb, Felipe F. Sperandioa,c-e, Liyi Huanga,c,f,
Ying-Ying Huanga,c,g, Dewey Holtenh, Jonathan S. Lindsey*b and
Michael R. Hamblina,c,i
a Wellman Center for Photomedicine, Massachusetts General Hospital, Boston, MA 02114, USA b Department of Chemistry, North Carolina State University, Raleigh, NC 27695, USA c Department of Dermatology, Harvard Medical School, Boston MA, USA d Department of Oral Pathology, School of Dentistry, University of Sao Paulo, Sao Paulo, SP 05508-000, Brazil e CAPES Foundation, Ministry of Education of Brazil, Brasília, DF 70040-020, Brazil f Department of Infectious Diseases, First Affiliated College & Hospital, Guangxi Medical University, Nanning 530021, China g Aesthetic and Plastic Center of Guangxi Medical University, Nanning, China h Department of Chemistry, Washington University, St. Louis, MO 63130, USA i Harvard-MIT Division of Health Sciences and Technology, Cambridge, MA 02139, USA
Received 10 July 2012Accepted 2 August 2012
ABSTRACT: Bacteriochlorins are attractive candidates as photosensitizers for photodynamic therapy (PDT) due to their intense absorption in the near-infrared (NIR) region of the spectrum where light transmission through tissue is maximal. Many naturally occurring bacteriochlorins are inherently unstable due to adventitious atmospheric oxidation. A de novo synthesis affords bacteriochlorins that contain a geminal dimethyl group in each reduced pyrrole ring to increase stability against oxidation. Here, three new synthetic bacteriochlorins, each bearing a single side-chain containing one or two positive charges, were investigated for their in vitro PDT activity against HeLa human cancer cells. All bacteriochlorins were active at low nanomolar concentration when activated with NIR light; those bearing a single positive charge exhibited faster uptake and higher activity. The bacteriochlorins were localized in mitochondria, lysosomes and endoplasmic reticulum as shown by organelle specific fluorescent probes. Cell death was via apoptosis as shown by cell morphology and nuclear condensation. Taken together, the results show the importance of appropriate peripheral groups about a photosensitizer for effective PDT applications.
KEYWORDS: photodynamic therapy, HeLa cancer cells, bacteriochlorins, confocal microscopy, subcellular localization, apoptosis.
SPP full member in good standing
*Correspondence to: Jonathan S. Lindsey, email: [email protected]

74 S.K. SHARMA ET AL.
Copyright © 2013 World Scientific Publishing Company J. Porphyrins Phthalocyanines 2013; 17: 74–85
or autophagy depending on the cell type, structure of the photosensitizer and the light parameters employed [5]. Though many tetrapyrrole-based photosensitizers, such as porphyrins have been clinically approved for some types of cancer, such molecules suffer from various limitations. One limitation is the low absorption of light in the near-infrared (NIR) region of the spectrum where tissue transmission of light is highest. Therefore, PDT using currently available photosensitizers penetrates only the first 2–3 mm of tissue. To overcome this limitation, bacteriochlorins have gained considerable interest as potential photosensitizers. Bacteriochlorins differ from porphyrins by the reduction of two opposite pyrrole rings. The reduction of the number of π-electrons from 22 to 18 raises the energy (and changes the nature) of the HOMO, and thus narrows the HOMO–LUMO energy gap. This change in the HOMO–LUMO energy gap causes a bathochromic and hyperchromic effect (i.e. redshift and intensification) on the Q-band. A bacteriochlorin therefore has an intense absorption band (~100,000 M-1.cm-1) in the 720–850 nm spectral region where light penetration through tissue is maximal.
Naturally derived bacteriochlorins have been investigated for their in vitro and in vivo PDT efficacy in animal models, and a Pd-bacteriopheophorbide derivative called TOOKAD has been tested in clinical trials for prostate cancer [6, 7]. A major limitation of naturally derived bacteriochlorins is their instability in the presence of oxygen. To overcome such limitations, a number of groups have developed routes to synthetic bacterichlorins. The synthesis of bacteriochlorins has been the subject of a number of reviews over the past decade [8–11]. Notable recent advances include (1) Brückner’s two-fold OsO4-mediated dihydroxylation of meso-tetraarylporphyrins followed by ring-expansion of the resulting tetrahydroxybacteriochlorins to give morpholino-bacteriochlorins [12], and (2) Pereira’s scalable diimide-mediated reduction of meso-tetraarylporphyrins to give the corresponding bacteriochlorins [13]. Our own contribution in this area entails a de novo synthetic pathway to bacteriochlorins wherein a geminal dimethyl group is located in each reduced pyrrole ring [14, 15]. The chemical robustness of the synthetic bacteriochlorins and the versatility of the synthetic methodology enable wavelength tunability and substituent tailorability (e.g. lipophilicity, molecular asymmetry) as needed for PDT applications [16, 17]. In an earlier study, three somewhat lipophilic synthetic bacteriochlorins were found to overcome the resistance of melanoma to PDT [18]. Members of a set of 12 synthetic bacteriochlorins with varying peripheral substituents, including four bacteriochlorins bearing two or four positive charges, were examined as photosensitizers for killing HeLa human cervical cancer cells, which led to quantitative structure-function relationships [19]. Furthermore, three cationic bacteriochlorins (bearing two, four or six positive charges) proved effective in antimicrobial PDT
[20]. Each of these bacteriochlorins was substituted with positively charged groups at two opposite sites on the macrocycle.
In the present study we describe the synthesis of three cationic bacteriochlorins bearing one rather than two charged substituents. Furthermore, the three bacteriochlorins are examined for their photodynamic efficacy in killing HeLa human cervical cancer cells. This cell line was chosen for two reasons: (1) to facilitate comparisons with our prior studies of the PDT activity of other sets of bacteriochlorins against HeLa cells, including analogs that contain two (rather than one) of the same charged groups, and (2) HeLa cells are by far the most common human cancer cell line used in cancer research studies. The bacteriochlorins were derived from a monoformylbacteriochlorin [16] by reductive amination and quaternization. The three bacteriochlorins are shown in Chart 1. By changing the amine employed in the reductive amination, the number of sites for quaternization and the lipophilicity of the resulting cationic alkylammonium group can be controlled. The placement of singly or doubly charged groups at one site at the periphery of the hydrophobic bacteriochlorin
N HN
NNH
N
N HN
NNH
NN
N
BC-2′
N HN
NNH
N
BC-4′
I
I
I
I
BC-3′
Chart 1. Synthetic, cationic bacteriochlorin amphiphiles examined herein

IN VITRO PDT WITH AMPHIPHILIC BACTERIOCHLORINS 75
Copyright © 2013 World Scientific Publishing Company J. Porphyrins Phthalocyanines 2013; 17: 75–85
macrocycle affords amphiphilic character. Numerous cationic (and amphiphilic) chlorins have been prepared by derivatization of chlorophyll-related compounds (for leading references see Refs. 21–27). On the other hand, to our knowledge only one example of an analogous cationic derivative of bacteriochlorophyll has been reported [28].
RESULTS AND DISCUSSION
Molecular design
Bacteriochlorins have emerged relatively recently as candidates for PDT. The bacteriochlorin examined most extensively to date is WST9 (Tookad), a palladium chelate derived from bacteriochlorophyll a (Chart 2). Tookad bears one anionic group at physiological pH and hence is amphiphilic in character. Analogs in this series include the serine conjugate of bacteriochlorophyllide (Bchl-ser) [29], a zwitterionic compound, and WST-11 (TOOKAD soluble) [30], which bears two anionic
groups. Each compound is amphiphilic given the location of the charged groups with respect to the hydrophobic bacteriochlorin macrocycle. A naturally derived bacteriochlorin-imide containing a single positive charge (I) has been prepared [28], but to our knowledge has not yet been examined for PDT activity, and a number of non-cationic analogs also have been prepared [31]. A family of tetraanionic bacteriochlorins, of which II is the parent member, and aryl sulfonamide analogs, have been designed and subjected to extensive PDT studies [32–34]. Such compounds are not amphiphilic in the traditional sense given the rectilinear placement of four anionic substituents. Previously, we prepared nine cationic bacteriochlorins [16, 19, 20] of which three representative structures (III–V) are displayed in Chart 2. The bacteriochlorins prepared in this manner bear two, four or six charges, and in each case the macrocycles are substituted at both pyrrole moieties.
The molecular design employed herein (BC-2′, BC-3′, BC-4′) centers broadly around analogs of IV and V. The analogs contain a single site of substitution rather than two sites. Changing the composition of the aminoalkyl
N N
NN
Pd
O
O
OOO
O
WST9
N HN
NNH
O
OO
NO O
NH
O
N
N N
NN
Mg
O
O
OO
Bchl-ser
OO
H3N
N N
NN
Pd
O
OOO
O
NOH
S
WST11
O
O
N HN
NNH
HN O
NHO
N
N
N HN
NNH
N
N
N HN
NNH
N
N
N
N
N
N
N HN
NNHCl
S
Cl
S
Cl
S
Cl
S
O
OO
OO O
O
O
O
OO
O
I
II III IV V
OO
O
Chart 2. Representative bacteriochlorins (counterions are omitted for clarity)

76 S.K. SHARMA ET AL.
Copyright © 2013 World Scientific Publishing Company J. Porphyrins Phthalocyanines 2013; 17: 76–85
moiety allows tuning of (i) the number of charges, (ii) the spatial disposition of the charges, and (iii) the lipophilic character of the positively charged moiety. The resulting compounds have a polar head group (positively charged nitrogen) and a hydrophobic tail (bacteriochlorin macrocycle), and as such are well-suited for comparison with their disubstituted analogs (III–V and other members), which carry a positive charge on each side of the bacteriochlorin macrocycle.
Synthesis of bacteriochlorins
Reaction of 3,13-dibromo-8,8,18,18-tetramethylbac-terio chlorin with Pd(PPh3)4 in toluene/DMF at 70 °C under an atmosphere of CO for 2 h and subsequent treatment with Bu3SnH afforded the corresponding 3,13-diformyl bacteriochlorin in 60% yield along with 3-formyl-13-desbromobacteriochlorin BC-1 in 25% yield [16]. By this method a total of 100 mg of the 3,13-diformylbacteriochlorin and 30 mg of BC-1 were prepared. The 3,13-diformyl bacteriochlorin was used previously in reductive amination reactions to afford a variety of disubstituted bacteriochlorins [16]. While not a rational method of synthesis, the availability of the mono-formylbacteriochlorin BC-1 presented an opportunity to prepare a small family of amphiphilic bacteriochlorins. A complementary approach was recently reported by Yu and Ptaszek [35], who showed that a 3,13-dibromo-5-methoxybacteriochlorin underwent sequential Pd-mediated derivatization reactions. One of the resulting unsymmetrically substituted bacteriochlorins has been employed for in vivo imaging of ovarian cancer [36].
In the work described herein, reductive amination has been carried out with BC-1 to afford monosubstituted bacteriochlorins. The reductive amination of BC-1 was carried out at modest concentrations (12 mM), using sodium triacetoxyborohydride [37] in 1,2-dichloroethane containing acetic acid. Reductive amination with dimethylamine afforded 3-(dimethylaminomethyl)bacteriochlorin BC-2 in 88% yield after column chromatography. Similar treatment with bis(3-(dimethy-lamino)propyl)amine or dipropylamine afforded BC-3 or BC-4 in 70% or 75% yield, respectively (Scheme 1). Each bacteriochlorin was characterized by 1H NMR spectroscopy, mass spectrometry (LD-MS or ESI-MS) and absorption spectroscopy.
To impart amphiphilic character, the aminoalkyl bacteriochlorins were subjected to conditions for quaternization [38]. Quaternization using methyl iodide in CHCl3 at room temperature is known to alkylate the alkyl amino substituents rather than the pyrrolic or pyrrolinic nitrogens [16, 38]. Thus, the overnight reaction of bacteriochlorin BC-2 with excess methyl iodide in CHCl3 at room temperature resulted in the iodide salt BC-2′. Similarly, bacteriochlorin BC-3 or BC-4 was converted to the corresponding iodide or diiodide salt in excellent yield (Scheme 1). Bacteriochlorin BC-4′ was
designed to extend the hydrophobic alkyl chains on the quaternized nitrogen to potentially facilitate insertion into a phospholipid bilayer, a design strategy that has been explored with porphyrins [39, 40].
Bacteriochlorin BC-3 contains three tertiary amines. However, treatment of BC-3 only methylated the two distal nitrogens and not the proximal nitrogen. Evidence in support of this interpretation stems from ESI-MS and
R2NH, NaBH(OAc)3,AcOH, ClCH2CH2Cl, rt
N HN
NNH
R2N
N
N
N
N
N
MeI, CHCl3,rt, 24 h
N
N
N
N
N
82%
80%
98%
I
CHCl340 °C, 72 h
no reaction
N HN
NNH
OHC
MeI, CHCl3,rt, 24 h
MeI, CHCl3,rt, 24 h
BC-1
BC-2 (88% yield) BC-2′
BC-3 (70% yield)
BC-3′
BC-4 (75% yield)BC-4′
(iodide counterions are not displayed for clarity)
NR2
Scheme 1. Synthesis of amphiphilic bacteriochlorins

IN VITRO PDT WITH AMPHIPHILIC BACTERIOCHLORINS 77
Copyright © 2013 World Scientific Publishing Company J. Porphyrins Phthalocyanines 2013; 17: 77–85
1H NMR spectroscopy: (1) MS data shows a molecular ion peak at m/z = 299.7338, which for a doubly charged ion corresponds to a parent molecule of mass 599.4676 Da, and (2) the 1H NMR spectrum of BC-3, shows a singlet at 2.20 ppm (12 protons), which is attributed to the N-methyl group; whereas in BC-3′, the singlet appears at 3.09 ppm and integrates for 18 protons. More complex spectra would be expected if the proximal nitrogens were methylated preferentially, and a greater number of charges if both distal and proximal nitrogens were quaternized. These observations are consistent with previous observations on disubstituted bacteriochlorins [16]. Attempted alkylation of BC-4 using excess propyl iodide in CHCl3 at 45 °C for 72 h gave recovered starting material rather than the expected tripropylaminomethyl bacteriochlorin.
Each cationic bacteriochlorin was purified by washing the crude product with organic solvents such as ether and CH2Cl2/hexanes to give the corresponding quaternary salts, which were clean by 1H NMR spectroscopy. Purification of BC-4′ was also achieved by silica gel chromatography [CH2Cl2/MeOH (9:1)].
Characterization of bacteriochlorins
A. Structural proof. The cationic bacteriochlorins were characterized by ESI-MS, 1H NMR spectroscopy (in CDCl3 or DMSO-d6) and absorption spectroscopy. The ESI-MS spectrum of each bacteriochlorin BC-2, BC-2′, BC-4 and BC-4′ only showed a molecular ion peak at m/z = 383.22, which is attributed to benzyl-type cleavage at the 3-CH2-NR2 or 3-CH2-NR3 bond to yield the bacteriochlorin-CH2 molecular ion. BC-3 and BC-3′ each displayed a molecular ion peak at m/z = 383.22, along with the expected parent molecular ion peak.
B. Solubility. Each bacteriochlorin (regardless of neutral or charged) was readily soluble at room temperature in CH2Cl2 or CHCl3. In addition BC-3′, which contains two positive charges, was also soluble in H2O at modest concentrations (~0.1 mM).
C. Absorption spectral properties. The absorption spectra for all bacteriochlorins were collected in CH2Cl2. Representative spectra are shown in Fig. 1. The absorption spectra were characteristic of bacteriochlorins [41, 42], with Qy bands ranging from 715–719 nm and relatively little difference between the neutral bacteriochlorins and their cationic derivatives. BC-2 and BC-4 showed a small (2–3) nm hypsochromic shift (718 nm to 715 nm; 717 nm to 715 nm) of the Qy band upon quaternization, whereas BC-3 showed a slight (1 nm) bathochromic shift (718 nm to 719 nm) upon quaternization. In BC-2′ and BC-4′, the positively charged nitrogens and the bacteriochlorin π-system are separated by only a single methylene group.
The absorption spectrum for BC-3′ was also collected in H2O. The absorption spectra of BC-3′ taken in CH2Cl2 and H2O were comparable and showed only slight broadening of the Qy band in H2O (full-width-at-half-maximum
increased from 16 nm in CH2Cl2 to 22 nm in H2O). In both solvents the λmax for the Qy band was at 719 nm with the other absorption bands varying only little between the two solvents. This observation further illustrates that a given tetrapyrrole chromophore exhibits very similar spectral features in organic and aqueous media if homogenously dispersed [43, 44]. Synthetic bacteriochlorins related to those described herein typically have a molar absorptivity of ~120,000 M-1cm-1 at the Qy maximum [14]. Such features are in keeping with the spectral characteristics of the natural bacteriochlorin photosynthetic chromophores [41] once one considers the typically larger spectral widths of the latter, giving generally similar integrated band intensities.
A few interesting comparisons can be made concerning the above-noted spectral effects of quaternization for the monosubstituted bacteriochlorins vs. the disubstituted analogs prepared previously [16]. Quaternization to form disubstituted 3,13-bis(trimethylammoniomethyl)bacteriochlorin IV (Chart 2) in CH2Cl2 results in a 15-nm bathochromic shift in the Qy band (722 to 737) nm, which is slightly larger than the 11-nm shift found when H2O is used as the solvent for the quaternized species IV (which introduces a potential solvent effect). In both cases, the bathochromic shifts are opposed to the small hypsochromic shifts (2–3 nm in CH2Cl2) for quaternization to form BC-2′ (or BC-4′). Similarly, quaternization of the disubstituted bacteriochlorin V (726 nm in H2O; not soluble in CH2Cl2) gives a 4-nm bathrochromic shift vs. the neutral parent bacteriochlorin (722 nm in CH2Cl2) compared to the 1-nm bathochromic shift for the monosubstituted BC-3/BC-3′ pair in the same media.
Collectively, the spectral differences found for quaternization of monosubstituted vs. disubstituted bacteriochlorins, and effects of solvent, may in part reflect the fact that quaternization of monosubstituted
Fig. 1. Absorption spectra of BC-2′ (solid) and BC-3′ (dashed) in CH2Cl2, normalized in the Qy band

78 S.K. SHARMA ET AL.
Copyright © 2013 World Scientific Publishing Company J. Porphyrins Phthalocyanines 2013; 17: 78–85
bacteriochlorins gives the molecule a (substantially larger) permanent dipole moment whereas quaternization of the symmetric, disubstituted analogs does not.
Photobleaching
Significant photobleaching of BC-3′ was observed upon illumination with very low amounts of 700–850-nm light (1–2 J/cm2) as measured by reduction of fluorescence (Fig. 2). Bacteriochlorins BC-2′ and BC-4′ were more photostable but still were photobleached upon illumination with 8 J/cm2. No attempts were made to identify any photoproducts formed in the photobleaching.
In vitro PDT on HeLa cells
In vitro photoinactivation studies were carried out with HeLa cells after incubating with bacteriochlorins in complete medium for 24 h followed by exposure to NIR light (700–850 nm). The results are shown in Fig. 3. Initial studies had shown an extremely high PDT activity and necessitated reducing the concentrations of bacteriochlorins several times in order to find measurable cell survival after light delivery. Eventually a range of concentrations from 1–10 nM allowed LD50 concentration values (in nM) to be calculated after 5, 10 or 20 J/cm2 of 700–850 nm light had been delivered. The effectiveness for PDT activity was higher for BC-2′ and BC-4′ than for BC-3′ (compare Figs 3a and 3c with Fig. 3b).
The LD50 values in Table 1 were 1.5 to 6.0 nM for BC-2′ and 1.5 nM to 5.0 nM for BC-4′ compared to 7.5 nM to >10 nM for BC-3′. Dark toxicity was negligible or very low for all compounds (up to 0.5 μM) and there was no
Fig. 2. Photobleaching of bacteriochlorins (1 μM in methanol) using 400-nm excitation and monitored by reduction in fluorescence (600−800 nm)
Fig. 3. In vitro PDT killing of HeLa cells incubated with increasing concentrations of bacteriochlorin for 24 hours in complete medium and illuminated with NIR light (5, 10 and 20 J/cm2). (a) BC-2′; (b) BC-3′; (c) BC-4′

IN VITRO PDT WITH AMPHIPHILIC BACTERIOCHLORINS 79
Copyright © 2013 World Scientific Publishing Company J. Porphyrins Phthalocyanines 2013; 17: 79–85
evident cytotoxicity of the 10 J/cm2 NIR light alone (i.e. without any bacteriochlorin). This is the first study showing effective LD50 phototoxicity at such a low (1.5–5.0 nM) concentration of the photosensitizer. In our previous study with 12 synthetic bacteriochlorins [19], phototoxicity at nanomolar concentrations was observed after 10 J/cm2 of NIR light, but the lowest LD50 (out of 12 compounds tested) was 15 nM and two of the present compounds are therefore 5–10 times more active.
The effect of incubation time on phototoxicity was tested to assess the rate at which the cells became photosensitive when incubated with the bacteriochlorin. The most active compounds (BC-2′ and BC-4′) exhibited faster kinetics of photosensitization with significant killing apparent after 3–5 h, while the less active BC-3′ also had slower kinetics, with PDT killing still increasing after 24 h (Fig. 4). One explanation for these observations is that the more lipophilic nature of a singly charged bacteriochlorin (BC-2′ and BC-4′) enables more rapid entry into cells by diffusion, while the more polar and slightly bulkier doubly charged bacteriochlorins (BC-3′ and others studied previously) are predominantly taken-up into the cells by the slower process of endocytosis.
Subcellular localization
Different subcellular localizations of the bacteriochlorins might be expected, if the singly charged bacteriochlorins BC-2′ and BC-4′ were taken-up more by diffusion while the doubly charged bacteriochlorin BC-3′ was taken-up more by endocytosis. Therefore, each of the three bacteriochlorins (BC-2′, BC-3′, BC-4′) was incubated with HeLa cells and examined using confocal microscopy to determine the subcellular localization of the compounds. For these studies the bacteriochlorin was coincubated with green-fluorescent probes specific for mitochondria (MitoTracker, Fig. 5a), lysosomes (LysoTracker, Fig. 5b), or endoplasmic reticulum (ER Tracker, Fig. 5c). The fluorescence of the bacteriochlorin is shown in red and the fluorescence of the organelle-specific probe is shown in green.
Bacteriochlorin BC-2′ localized mainly in the mitochondria and endoplasmic reticulum and to a lesser extent in the lysosomes, while BC-3′ showed good overlap with lysosomal and less overlap with mitochondria and poor overlap with the ER probe.
Table 1. LD50 values of bacteriochlorins against HeLa cells after various fluences of lighta
5 J/cm2 10 J/cm2 20 J/cm2
BC-2′ 6.0 nM 3.0 nM 1.5 nM
BC-3′ N/D (>10 nM) 10 nM 7.5 nM
BC-4′ 5.0 nM 2.5 nM 1.5 nM
a Values were obtained from the data in Fig. 1. N/D, not determined.
Fig. 4. Effect of incubation time on PDT killing. Bacteriochlorins were incubated at 10 nM, and 10 J/cm2 of NIR light was used. (a) BC-2′; (b) BC-3′; (c) BC-4′
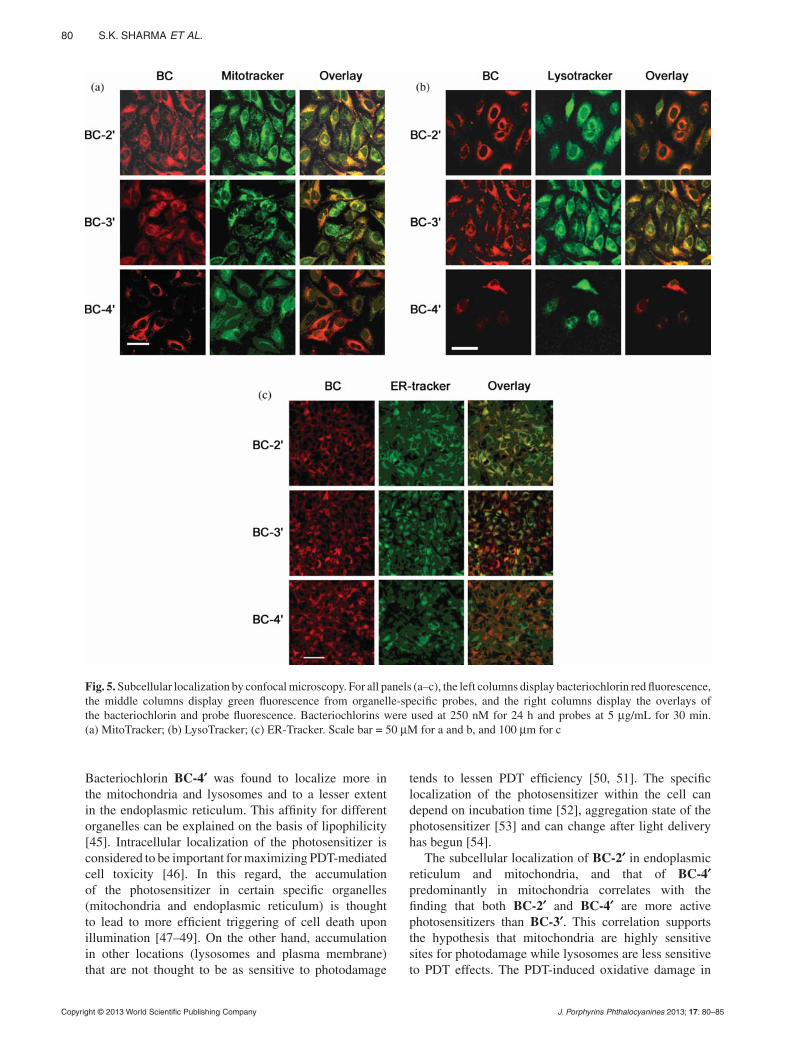
80 S.K. SHARMA ET AL.
Copyright © 2013 World Scientific Publishing Company J. Porphyrins Phthalocyanines 2013; 17: 80–85
Bacteriochlorin BC-4′ was found to localize more in the mitochondria and lysosomes and to a lesser extent in the endoplasmic reticulum. This affinity for different organelles can be explained on the basis of lipophilicity [45]. Intracellular localization of the photosensitizer is considered to be important for maximizing PDT-mediated cell toxicity [46]. In this regard, the accumulation of the photosensitizer in certain specific organelles (mitochondria and endoplasmic reticulum) is thought to lead to more efficient triggering of cell death upon illumination [47–49]. On the other hand, accumulation in other locations (lysosomes and plasma membrane) that are not thought to be as sensitive to photodamage
tends to lessen PDT efficiency [50, 51]. The specific localization of the photosensitizer within the cell can depend on incubation time [52], aggregation state of the photosensitizer [53] and can change after light delivery has begun [54].
The subcellular localization of BC-2′ in endoplasmic reticulum and mitochondria, and that of BC-4′ predominantly in mitochondria correlates with the finding that both BC-2′ and BC-4′ are more active photosensitizers than BC-3′. This correlation supports the hypothesis that mitochondria are highly sensitive sites for photodamage while lysosomes are less sensitive to PDT effects. The PDT-induced oxidative damage in
Fig. 5. Subcellular localization by confocal microscopy. For all panels (a–c), the left columns display bacteriochlorin red fluorescence, the middle columns display green fluorescence from organelle-specific probes, and the right columns display the overlays of the bacteriochlorin and probe fluorescence. Bacteriochlorins were used at 250 nM for 24 h and probes at 5 μg/mL for 30 min. (a) MitoTracker; (b) LysoTracker; (c) ER-Tracker. Scale bar = 50 μM for a and b, and 100 μm for c

IN VITRO PDT WITH AMPHIPHILIC BACTERIOCHLORINS 81
Copyright © 2013 World Scientific Publishing Company J. Porphyrins Phthalocyanines 2013; 17: 81–85
mitochondria and the ensuing change in mitochondrial membrane potential have been shown to correlate with induction of apoptosis by PDT agents [55, 56].
The cellular and nuclear morphology studies carried out after PDT showed an apoptotic mode of cell death in all the bacteriochlorins examined as shown in Fig. 6. The bright-field images in the PDT-treated cells showed apoptotic bodies (black arrows), and the Hoechst nuclear stain showed condensed nuclei (white arrows).
Lipophilic cationic photosensitizers are known to localize in mitochondria [57] while less lipophilic cationic photosensitizers localize in lysosomes [58]. The second positive charge present on BC-3′ increases the cationic character and thus apparently reduces the lipophilicity sufficiently to alter the localization from mitochondria to lysosomes and thus decreases the PDT efficacy to some extent; however, even BC-3′ still has very high activity versus comparable compounds. The mono-substituted molecular framework in the present compounds was much more active than the symmetrical disubstituted framework we reported previously [19]. Bacteriochlorins bearing two positive charges (one on each side) had LD50 values ranging from 3000 nM to 800 nM, corresponding to ≥ 2 orders of magnitude lower activity than the similar mono-substituted bacteriochlorins reported here. The explanation undoubtedly resides in the amphiphilic character of the mono-substituted bacteriochlorins. Insertion of tetrapyrrole photosensitizers into cell membranes may be critically involved in the sub-cellular mechanism [59], and it is expected that amphiphilic, mono-substituted bacteriochlorins would do so more easily than the symmetrical disubstituted bacteriochlorins studied previously.
EXPERIMENTAL
General synthesis procedures1H NMR (400 MHz) spectra were collected at
room temperature in CDCl3 unless noted otherwise. Absorption spectra were obtained in CH2Cl2 or water at room temperature. Bacteriochlorins were analyzed by laser desorption mass spectrometry (LD-MS) in the absence of a matrix [60]. Electrospray ionization mass spectroscopy (ESI-MS) data are reported for the molecular ion or protonated molecular ion. 3-Formyl-8,8,18,18-tetramethylbacteriochlorin (BC-1) was prepared as described previously [16].
Synthesis
3-(dimethylaminomethyl)-8,8,18,18-tetramethyl-bacteriochlorin (BC-2). Following a procedure for reductive amination [37], a solution of BC-1 (5.0 mg, 0.012 mmol) in 1,2-dichloroethane (1.0 mL) was treated with dimethylamine (32 μL, 0.062 mmol, 2.0 M in THF). The mixture was stirred at room temperature under argon for 5 min before adding NaBH(OAc)3 (5.0 mg, 0.025 mmol) all at once, followed by glacial acetic acid (1.4 μL, 0.024 mmol). The reaction was complete after 6 h as determined by TLC (silica, CH2Cl2). The mixture was quenched by the addition of saturated aqueous NaHCO3
(2 mL) and ethyl acetate. The organic layer was separated, dried (Na2SO4), and concentrated. The crude product was subjected to column chromatography [silica, CH2Cl2/MeOH (99:1)] to yield a green solid (4.7 mg, 88%). 1H NMR: δ, ppm -2.37 (brs, 1 H), -2.24 (brs, 1 H), 1.96 (s,
Fig. 6. Cellular morphology by bright-field fluorescence microscopy of PDT-treated cells. (a) Control cells; (b) BC-2′, PDT treated; (c) BC-3′, PDT treated; (d) BC-4′, PDT treated. Nuclear morphology of PDT-treated cells by Hoechst fluorescence staining of nuclei: (a) control cells; (b) BC-2′, PDT treated; (c) BC-3′, PDT treated; (d) BC-4′, PDT treated. Scale bar = 100 μm

82 S.K. SHARMA ET AL.
Copyright © 2013 World Scientific Publishing Company J. Porphyrins Phthalocyanines 2013; 17: 82–85
12 H), 2.59 (s, 6 H), 4.45 (s, 2 H), 4.50 (s, 2 H), 4.68 (s, 2 H), 8.65 (s, 1 H), 8.69 (m, 1 H), 8.71 (s, 1 H), 8.72 (m, 1 H), 8.73 (m, 1 H), 8.80 (s, 1 H), 8.95 (s, 1H). LD-MS: m/z obsd. 427.9, calcd. 427.2 (C27H33N5). ESI-MS: m/z obsd. 383.2230, calcd. 383.2236 ([M′]+, C25H27N4, where M′ = M - N(CH3)2, M = C27H33N5). UV-vis (CH2Cl2): λabs, nm 341, 366, 490, 718.
3-(trimethylammoniomethyl)-8,8,18,18-tetra meth-ylbacteriochlorin iodide (BC-2′). Following a procedure for amine quaternization [16, 38], a solution of BC-2 (7.6 mg, 0.018 mmol) in CHCl3 (1 mL, stabilized with EtOH) was treated with MeI (12 μL, 0.18 mmol, 10 equiv) under argon. The mixture was stirred at room temperature for 24 h. Excess methyl iodide and solvent were removed under reduced pressure at ambient temperature. Purification of the crude product was achieved by adding anhydrous diethyl ether to the crude product (5.0 mL). The mixture was sonicated for 2 min in a benchtop sonication bath. The solid was filtered and washed with dichloromethane/hexanes [2 mL (1:3)] to yield the title compound (10 mg, 98%). 1H NMR: δ, ppm -1.55 (brs, 1 H), -1.37 (brs, 1 H), 1.81 (s, 6 H), 1.85 (s, 6 H), 3.69 (s, 9 H), 4.29 (s, 2 H), 4.53 (s, 2 H), 6.25 (s, 2 H), 8.47 (s, 1 H), 8.49 (s, 1 H), 8.57 (s, 1 H), 8.67 (dd, J = 5.36, 1.79 Hz, 2 H), 8.77 (d, J = 2.20 Hz, 1 H), 9.43 (s, 1 H). ESI-MS: m/z obsd. 383.2222, calcd. 383.2236 ([M′]+, C25H27N4, where M′ = M - N(CH3)3, M = C28H36N5). UV-vis (CH2Cl2): λabs, nm 341, 365, 498, 715.
3-[bis(3-(dimethylamino)propyl)aminomethyl]-8, 8,18,18-tetramethylbacteriochlorin (BC-3). A solution of BC-1 (5.0 mg, 0.012 mmol) in 1,2-dichloroethane (1.0 mL) was treated with bis(3-(dimethylamino)propyl)amine (14 μL, 0.062 mmol). The mixture was stirred at room temperature under argon for 5 min before adding NaBH(OAc)3 (5.0 mg, 0.025 mmol) all at once, followed by glacial acetic acid (1.4 μL, 0.024 mmol). The reaction was complete after 16 h as determined by TLC (silica, CH2Cl2). The mixture was quenched by the addition of saturated aqueous NaHCO3 (2 mL) and ethyl acetate. The organic layer was separated, dried (Na2SO4), and concentrated. The crude product was subjected to column chromatography [silica, CH2Cl2/MeOH (95:5)] to yield a green solid (5.0 mg, 70%). 1H NMR: δ, ppm -2.38 (brs, 1 H), -2.22 (brs, 1 H), 1.90 (m, 4 H), 1.96 (s, 6 H), 1.97 (s, 6 H), 2.20 (s, 12 H), 2.35 (t, J = 7.15 Hz, 4 H), 2.81 (t, J = 7.15 Hz, 4 H), 4.44 (s, 2 H), 4.47 (s, 2 H), 4.81 (s, 2 H), 8.63 (s, 1 H), 8.67 (m, 2 H), 8.70 (s, 1 H), 8.72 (m, 1 H), 8.80 (s, 1 H), 9.04 (s, 1 H). LD-MS: m/z obsd. 570.4. ESI-MS: m/z obsd. 285.7175, calcd. 285.7175 ([M + 2H]2+, M = C35H51N7). UV-vis (CH2Cl2): λabs, nm 342, 367, 491, 718.
3-[bis(3-(trimethylammonio)propyl)amino- methyl]-8,8,18,18-tetramethylbacteriochlorin diiodide (BC-3′). Under conditions similar to those for BC-2′, BC-3 (5.0 mg) afforded a green solid (6.3 mg, 82%). 1H NMR (DMSO-d6): δ, ppm −2.51 (brs, 1 H), −2.42 (brs, 1 H), 1.93 (s, 6 H), 1.94 (s, 6 H), 2.12 (m, 4 H), 2.82 (m, 4 H), 3.09 (s, 18 H), 3.38 (m, 4 H, overlapped by
H2O signal), 4.44 (s, 2 H), 4.48 (s, 2 H), 4.90 (s, 2 H), 8.88 (brs, 1 H), 8.89 (s, 1 H), 8.91 (d, J = 1.65 Hz, 1 H), 8.93 (s, 1 H), 8.95 (s, 1 H), 8.97 (brs, 1 H), 9.07 (s, 1 H). ESI-MS: m/z obsd. 299.7338, calcd. 299.7332 ([M]2+, M = C37H57N7). UV-vis (H2O): λabs, nm 339, 364, 493, 719. UV-vis (CH2Cl2): λabs, nm 342, 367, 491, 719.
3-(dipropylaminomethyl)-8,8,18,18-tetrame th-ylbacteriochlorin (BC-4). A solution of BC-1 (7.1 mg, 0.018 mmol) in 1,2-dichloroethane (1.0 mL) was treated with dipropylamine (15 μL, 0.090 mmol). The mixture was stirred at room temperature under argon for 5 min before adding NaBH(OAc)3 (10. mg, 0.05 mmol) all at once, followed by glacial acetic acid (1.4 μL, 0.024 mmol). The reaction was complete after 16 h as determined by TLC (silica, CH2Cl2). The mixture was quenched by the addition of saturated aqueous NaHCO3 (2 mL) and ethyl acetate. The organic layer was separated, dried (Na2SO4), and concentrated. The crude product was subjected to column chromatography [silica, CH2Cl2/MeOH (99:1)] to yield a green solid (6.3 mg, 75%). 1H NMR: δ, ppm -2.33 (brs, 1 H), -2.17 (brs, 1 H), 0.95 (t, J = 7.29, 6 H), 1.76 (m, 4 H), 1.96 (s, 6 H), 1.97 (s, 6 H), 2.74 (t, J = 7.29, 4 H), 4.43 (s, 2 H), 4.47 (s, 2 H), 4.82 (s, 2 H), 8.63 (s, 1 H), 8.67 (m, 1 H), 8.69 (s, 2 H), 8.72 (m, 1 H), 8.79 (s, 1 H), 9.04 (s, 1 H). LD-MS: m/z obsd. 483.5, calcd. 483.3 (C231H41N5). ESI-MS: m/z obsd. 383.2230, calcd. 383.2236 ([M′]+, C25H27N4, where M′ = M - N(CH2CH2CH3)2, M = C31H41N5). UV-vis (CH2Cl2): λabs, nm 341, 367, 491, 717.
3-(N-methyl-N,N-dipropylammoniomethyl)-8, 8,18,18-tetramethylbacteriochlorin (BC-4′). Under conditions similar to those for BC-2′, BC-4 (5.0 mg) afforded a green solid (5.0 mg, 80%). 1H NMR: δ, ppm -1.44 (brs, 1 H), -1.28 (brs, 1 H), 1.11 (t, J = 7.15 Hz, 6 H), 1.87 (s, 6 H), 1.89 (s, 6 H), 1.93–2.18 (m, 4 H), 3.43 (s, 3 H), 3.57–3.74 (m, 2 H), 3.74–3.92 (m, 2 H), 4.31 (s, 2 H), 4.54 (s, 2 H), 5.99 (s, 2 H), 8.46 (s, 1 H), 8.51 (s, 1 H), 8.56 (d, J = 1.93 Hz, 1 H), 8.58 (s, 1 H), 8.62–8.74 (m, 2 H), 9.41 (s, 1 H). ESI-MS: m/z obsd. 383.2230, calcd. 383.2236 ([M′]+, C25H27N4, where M′ = M - N[(CH3)(CH2CH2CH3)2], M = C32H44N5). UV-vis (CH2Cl2): λabs, nm 341, 365, 498, 715.
Cell culture
HeLa cancer cells (ATCC Manassas, VA) were cultured in RPMI medium with L-glutamine and NaHCO3 (Sigma, St Louis, MO) supplemented with 10% fetal bovine serum, penicillin/streptomycin (100 U/mL) (Sigma) at 37 °C in 5% CO2-humidified atmosphere in 75 cm2 flasks (Falcon, Invitrogen, Carlsbad, CA). On reaching 80% confluence, the cells were washed with phosphate-buffered saline (PBS) and harvested with 2 mL of 0.25% trypsin-EDTA solution (Sigma). Cells were then centrifuged and counted in Trypan Blue to ensure viability and plated at a density of 10,000/well in flat-bottom 96-well plates (Fisher Scientific, Pittsburgh, PA).

IN VITRO PDT WITH AMPHIPHILIC BACTERIOCHLORINS 83
Copyright © 2013 World Scientific Publishing Company J. Porphyrins Phthalocyanines 2013; 17: 83–85
In vitro PDT studies
After 24 h growth the cells were incubated with different concentration of bacteriochlorins diluted in RPMI medium (containing 10% serum, 100 U/mL penicillin and 100 g/mL streptomycin), and further incubated for an additional 24 h. The cells were then washed twice with PBS, the medium was replaced with fresh complete medium, and 10 J/cm2 of illumination was delivered with a Lumacare lamp (Newport Beach, CA) (700–850 nm range). Control groups were as follows: no bacteriochlorin and light treatment, light alone, and bacteriochlorin alone (at the same dilution used for PDT experiments). For kinetics studies, incubations were carried out with 10 nM of bacteriochlorins BC-2′, BC-3′, and BC-4′ for various times, and subsequently light with 10 J/cm2 of light was delivered.
Biological assays
MTT assay. Following PDT treatment the cells were returned to the incubator. After overnight incubation, the cell-culture media was removed and replaced with 500 μg/mL of MTT diluted in serum-free media. The cells were incubated for 4 h. At the end of incubation the media was removed, and the cells were dissolved in DMSO. The plate was read at 570 nm using a microplate spectrophotometer (Spectra Max 340 PC, Molecular Devices, Sunnyvale, CA). Each experiment was repeated 3 times.
Subcellular localization by fluorescence microscopy. Cells were plated in an optically transparent 96-well black-sided plate and grown for 24 h. The cells were then incubated with 250 nM bacteriochlorins in complete medium for another 24 h. Cells were washed in PBS and 5
g/mL of (i) LysoTracker green DND-26, (ii) MitoTracker green FM, or (iii) ER-Tracker green (Molecular Probes Invitrogen, Carlsbad, CA) was added and incubated for 30 min at 37 °C. Cells were again washed in PBS and 5–10 min later observed on an Olympus confocal FV1000 microscope and analyzed using the Olympus Fluoview software (Olympus America, Inc. Center Valley, PA). The microscope used excitation with a 488-nm argon laser and emission using either a band pass filter (525 ± 10 nm) or a 580-nm long pass filter and a 63x1.20 NA water immersion lens.
Nuclear condensation studies. The cells after PDT treatment were kept at 37 °C for 24 h and then stained with Hoechst 33342 (0.5 g/mL). Cells were again washed in PBS and the confocal laser fluorescence microscope was used to image the cells at a resolution of 800 × 800 pixels. The microscope employed excitation with a 405-nm laser and emission using either a band pass filter (470 ± 10 nm) or a 480-nm long pass filter.
Statistical analysis. Each value is the mean of three separate experiments with an error bar that reflects the standard deviation or standard error of the mean for that determination.
CONCLUSION
A de novo synthesis has afforded stable bacterio-chlorins that bear a single side-chain containing one or two positive charges. The compounds with one positive charge, BC-2′ and BC-4′, have LD50 values in the low nanomolar range. These values indicate that the two compounds are substantially more efficacious than any of the bacteriochlorins that we have studied previously. Additionally to our knowledge, they appear to be among the most powerful photosensitizers against cancer cells in vitro that have so far been reported. This high activity, relatively low dark toxicity and the ability to be activated by NIR light (which affords excellent tissue penetration), suggest that these bacteriochlorin motifs should be further investigated to mediate PDT in animal models of cancer.
Acknowledgements
This work was supported by a grant from the NIH (R01AI050875 to M.R.H.). M.K. was supported by the Jimmy V NCSU Cancer Therapeutics Training Program. L.H. was supported by a grant (R41AI072854) from the National Institute of Allergy and Infectious Diseases to NIRvana Pharmaceuticals, Inc. The content is solely the responsibility of the authors and does not necessarily represent the official views of the NIAID or the NIH. Mass spectra were obtained at the NCSU Department of Chemistry Mass Spectrometry Facility. Funding for the facility was obtained from the North Carolina Biotechnology Center and the NCSU Department of Chemistry.
REFERENCES
1. Agostinis P, Berg K, Cengel KA, Foster TH, Girotti AW, Gollnick SO, Hahn SM, Hamblin MR, Juzeniene A, Kessel D, Korbelik M, Moan J, Mroz P, Nowis D, Piette J, Wilson BC and Golab J. CA Cancer J. Clin. 2011; 61: 250–281.
2. Castano AP, Demidova TN and Hamblin MR. Photodiagn. Photodyn. Ther. 2004; 1: 279–293.
3. Castano AP, Demidova TN and Hamblin MR. Photodiagn. Photodyn. Ther. 2005; 2: 1–23.
4. Castano AP, Demidova TN and Hamblin MR. Photodiagn. Photodyn. Ther. 2005; 2: 91–106.
5. Kessel D and Oleinick NL. Methods Mol. Biol. 2010; 635: 35–46.
6. Huang Z, Chen Q, Dole KC, Barqawi AB, Chen YK, Blanc D, Wilson BC and Hetzel FW. Photochem. Photobiol. Sci. 2007; 6: 1318–1324.
7. Davidson SRH, Weersink RA, Haider MA, Gertner MR, Bogaards A, Giewercer D, Scherz A, Sherar MD, Elhilali M, Chin JL, Trachtenberg J andWilson BC. Phys. Med. Biol. 2009; 54: 2293–2313.
8. Brückner C, Samankumara L and Ogikubo J. In Handbook of Porphyrin Science, Vol. 17, Kadish K, Smith KM and Guilard R. (Eds.) World Scientific: Singapore, 2012; pp 1–112.

84 S.K. SHARMA ET AL.
Copyright © 2013 World Scientific Publishing Company J. Porphyrins Phthalocyanines 2013; 17: 84–85
9. Grin MA, Mironov AF and Shtil AA. Anti-Cancer Agents Med. Chem. 2008; 8: 683–697.
10. Galezowski M and Gryko DT. Curr. Org. Chem. 2007; 11: 1310–1338.
11. Chen Y, Li G and Pandey RK. Curr. Org. Chem. 2004; 8: 1105–1134.
12. Samankumara L, Wells S, Zeller M, Acuña AM, Röder B and Brückner C. Angew. Chem. Int. Ed. 2012; 51: 5757–5760.
13. Pereira MM, Abreu AR, Goncalves NPF, Calvete MJF, Simoes AVC, Monteiro CJP, Arnaut LG, Eusébio ME and Canotilho J. Green Chem. 2012; 14: 1666–1672.
14. Kim HJ and Lindsey JS. J. Org. Chem. 2005; 70: 5475–5486.
15. Taniguchi M, Cramer DL, Bhise AD, Kee HL, Bocian DF, Holten D and Lindsey JS. New J. Chem. 2008; 32: 947–958.
16. Ruzié C, Krayer M, Balasubramanian T and Lindsey JS. J. Org. Chem. 2008; 73: 5806–5820.
17. Krayer M, Ptaszek M, Kim HJ, Meneely KR, Fan D, Secor K and Lindsey JS. J. Org. Chem. 2010; 75: 1016–1039.
18. Mroz P, Huang YY, Szokalska A, Zhiyentayev T, Janjua S, Nifli AP, Sherwood ME, Ruzié C, Borbas KE, Fan D, Krayer M, Balasubramanian T, Yang E, Kee HL, Kirmaier C, Diers JR, Bocian DF, Holten D, Lindsey JS and Hamblin MR. FASEB J. 2010; 24: 3160–3170.
19. Huang YY, Mroz P, Zhiyentayev T, Sharma SK, Balasubramanian T, Ruzié C, Krayer M, Fan D, Borbas KE, Yang E, Kee HL, Kirmaier C, Diers JR, Bocian DF, Holten D, Lindsey JS and Hamblin MR. J. Med. Chem. 2010; 53: 4018–4027.
20. Huang L, Huang YY, Mroz P, Tegos GP, Zhiyentayev T, Sharma SK, Lu Z, Balasubramanian T, Krayer M, Ruzié C, Yang E, Kee HL, Kirmaier C, Diers JR, Bocian DF, Holten D, Lindsey JS and Hamblin MR. Antimicrob. Agents Chemother. 2010; 54: 3834–3841.
21. Losev A and Mauzerall D. Photochem. Photobiol. 1983; 38: 355–361.
22. Bonnett R, Nizhnik AN and White SG. J. Photochem. Photobiol. B: Biol. 1990; 6: 29–37.
23. Taima H, Okubo A, Yoshioka N and Inoue H. Tetrahedron Lett. 2005; 46: 4161–4164.
24. Nazarova A, Ignatova A, Feofanov A, Karmakova T, Pljutinskaya A, Mass O, Grin M, Yakubovskaya R, Mironov A and Maurizot JC. Photochem. Photobiol. Sci. 2007; 6: 1184–1196.
25. Pereira MM, Monteiro CJP, Simoes AV, Pinto SMA, Arnaut LG, Sa GFF, Silva EFF, Rocha LB, Simoes S and Formosinho SJ. J. Porphyrins Phthalocyanines 2009; 13: 567–573.
26. Huang L, Zhiyentayev T, Xuan Y, Azhibek D, Kharkwal GB and Hamblin MR. Lasers Surg. Med. 2011; 43: 313–323.
27. Li JZ, Wang JJ, Yoon I, Cui BC and Shim YK. Bioorg. Med. Chem. Lett. 2012; 22: 1846–1849.
28. Mironov AF, Grin MA, Tsiprovskii AG, Titeev RA, Nizhnik EA and Lonin IS. Mendeleev Commun. 2004; 204–207.
29. Meerovich IG, Kubasova IY, Oborotova NA, Meerovich GA, Demura SA, Brandis A, Rosenbach-Belkin V, Baryshnikov AY and Scherz A. Proc. SPIE 2005; 5973: 59730G1-G11.
30. Ashur I, Goldschmidt R, Pinkas I, Salomon Y, Szewczyk G, Sarna T and Scherz A. J. Phys. Chem. A 2009; 113: 8027–8037.
31. Mironov AF, Grin MA, Tsiprovskii AG, Segenevich AV, Dzardanov DV, Golovin KV, Tsygankov AA and Shim YK. Russ. J. Bioorg. Chem. 2003; 29: 190–197.
32. Dabrowski JM, Arnaut LG, Pereira MM, Monteiro CJ, Urbanska K, Simoes S and Stochel G. ChemMedChem 2010; 5: 1770–1780.
33. Dabrowski JM, Urbanska K, Arnaut LG, Pereira MM, Abreu AR, Simoes S and Stochel G. ChemMedChem 2011; 6: 465–475.
34. Dabrowski JM, Arnaut LG, Pereira MM, Urbanska K, Simoes S, Stochel G and Cortes L. Free Radic. Biol. Med. 2012; 52: 1188–1200.
35. Yu Z and Ptaszek M. Org. Lett. 2012; DOI 10.1021/ol3015545.
36. Alexander VM, Sano K, Yu Z, Nakajima T, Choyke PL, Ptaszek M and Kobayashi H. Bioconjugate Chem. 2012; DOI 10.1021/bc3002419.
37. Abdel-Magid AF, Carson KG, Harris BD, Maryanoff CA and Shah RD. J. Org. Chem. 1996; 61: 3849–3862.
38. Okada E, Tone H, Tsukushi N, Otsuki Y, Takeuchi H and Hojo M. Heterocycles 1997; 45: 339–345.
39. Reddi E, Ceccon M, Valduga G, Jori G, Bommer JC, Elisei F, Latterini L and Mazzucato U. Photochem. Photobiol. 2002; 75: 462–470.
40. Orlandi VT, Caruso E, Banfi S and Barbieri P. Photochem. Photobiol. 2012; 88: 557–564.
41. Kobayashi M, Akiyama M, Kano H and Kise H. In Chlorophylls and Bacteriochlorophylls — Biochemistry, Biophysics, Functions and Applications, Vol. 25, Grimm B, Porra RJ, Rüdiger W and Scheer H. (Eds.) Springer: Dordrecht, The Netherlands, 2006; pp 79–94.
42. Yang E, Kirmaier C, Krayer M, Taniguchi M, Kim HJ, Diers JR, Bocian DF, Lindsey JS and Holten D. J. Phys. Chem. B 2011; 115: 10801–10816.
43. Borbas KE, Chandrashaker V, Muthiah C, Kee HL, Holten D and Lindsey JS. J. Org. Chem. 2008; 73: 3145–3158.
44. Kee HL, Bhaumik J, Diers JR, Mroz P, Hamblin MR, Bocian DF, Lindsey JS and Holten D. J. Photochem. Photobiol. A: Chem. 2008; 200: 346–355.
45. Tejedor-Estrada R, Nonell S, Teixido J, Sagrista ML, Mora M, Villanueva A, Canete M and Stockert JC. Curr. Med. Chem. 2012; 19: 2472–2482.

IN VITRO PDT WITH AMPHIPHILIC BACTERIOCHLORINS 85
Copyright © 2013 World Scientific Publishing Company J. Porphyrins Phthalocyanines 2013; 17: 85–85
46. Oliveira CS, Turchiello R, Kowaltowski AJ, Indig GL and Baptista MS. Free Radic. Biol. Med. 2011; 51: 824–833.
47. Teiten MH, Bezdetnaya L, Morlière P, Santus R and Guillemin F. Br. J. Cancer 2003; 88: 146–152.
48. Francois A, Marchal S, Guillemin F and Bezdetnaya L. Int. J. Oncol. 2011; 39: 1537–1543.
49. Shahzidi S, Cunderlikova B, Wiedlocha A, Zhen Y, Vasovic V, Nesland JM and Peng Q. Photochem. Photobiol. Sci. 2011; 10: 1773–1782.
50. Pogue BW, Ortel B, Chen N, Redmond RW and Hasan T. Cancer Res. 2001; 61: 717–724.
51. Haywood-Small SL, Vernon DI, Griffiths J, Schofield J and Brown SB. Biochem. Biophys. Res. Commun. 2006; 339: 569–576.
52. Marchal S, François A, Dumas D, Guillemin F and Bezdetnaya L. Br. J. Cancer 2007; 96: 944–951.
53. MacDonald IJ, Morgan J, Bellnier DA, Paszkiewicz GM, Whitaker JE, Litchfield DJ and Dougherty TJ. Photochem. Photobiol. 1999; 70: 789–797.
54. Wood SR, Holroyd JA and Brown SB. Photochem. Photobiol. 1997; 65: 397–402.
55. Buytaert E, Dewaele M and Agostinis P. Biochim. Biophys. Acta 2007; 1776: 86–107.
56. Dewaele M, Verfaillie T, Martinet W and Agostinis P. Methods Mol. Biol. 2010; 635: 7–33.
57. Hügli, D, Seiffert W and Zimmermann HW. J. Photochem. Photobiol. B: Biol. 1995; 31: 145–158.
58. Kessel D, Luguya R and Vicente MGH. Photochem. Photobiol. 2003; 78: 431–435.
59. Dror SB, Bronshtein I, Garini Y, O’Neal WG, Jacobi PA and Ehrenberg B. Photochem. Photobiol. Sci. 2009; 8: 354–361.
60. Srinivasan N, Haney CA, Lindsey JS, Zhang W and Chait BT. J. Porphyrins Phthalocyanines 1999; 3: 283–291.

Journal of Porphyrins and PhthalocyaninesJ. Porphyrins Phthalocyanines 2013; 17: 86–91
DOI: 10.1142/S1088424612501295
Published at http://www.worldscinet.com/jpp/
Copyright © 2013 World Scientific Publishing Company
INTRODUCTION
Appropriately arranged multiple π-conjugated units through covalent and noncovalent interactions can provide functional materials such as semi-conductive devices and photovoltaic arrays [1]. Among the useful π-conjugated molecules, porphyrin has widely been used as a component of macromolecular systems including covalently linked oligomers and polymers [2, 3]. In particular, the meso–meso-linked porphyrin oligomers showed drastic exciton coupling between orthogonally arranged chromophores [3a], whereas the completely fused porphyrin tapes exhibited extremely red-shifted bands due to their π-extensions [3b]. The connection protocols of π-conjugated units are not limited to covalent bonding but also include a metal–ligand interaction. Metal-coordination polymers consisting of π-conjugated ligands can form electronic and electro-optical materials, whose properties can be tunable by both organic molecules and metal ions [4]. Thus, the design of programmed π-conjugated moieties and their arrangement by covalent linkages and metal coordination would afford functional organic–inorganic hybrid materials. A suitable motif is a dipyrrin, which serves as a bidentate monoanionic ligand for metal ions and also a precursor of highly emissive BODIPY [5]. We have
reported the meso–meso phenylethynyl-bridged dipyrrin dimers, which afforded ZnII-bridged polymers, resulting in the formation of submicrometer-scale spherical emissive particles [6]. The removal of spacers between the π-conjugated ligands would enable the significant electro-optical interactions that occur between metal complexing units. Thus far, meso–meso-linked BODIPY dimers (Fig. 1) were prepared by stepwise reactions [7, 8], although “metal-free” meso–meso-linked dipyrrin dimers, which are suitable building blocks of metal-coordination polymers, have not been reported yet. In this article, we report the synthesis, metal-coordination polymerization and transformation of a meso–meso-linked dipyrrin dimer.
RESULTS AND DISCUSSION
Meso–meso-linked dipyrrin dimer 2 was obtained quantitatively by the p-chloranil oxidation of tetra-pyrrolylethene 1, which was synthesized by the McMurry coupling of dipyrrolylketone according to a literature procedure [9] (Fig. 2a). 1H NMR in CDCl3 exhibited NH signals at 7.96 ppm for 1, whereas that of 2 showed no NH signals at rt due to intramolecular N–H···N hydrogen bonding as observed in the ordinary dipyrrin derivatives. Theoretical study of 2 at the level of B3LYP/6-31G(d,p) [10] exhibited an optimized structure comprising two almost orthogonally arranged dipyrrin planes with a dihedral angle of 80.24° (Fig. 2b). The distance between meso-carbons was estimated as
Meso–meso directly linked dipyrrolyl ligand dimer that
shows the formation of metal-coordination polymers
Hiromitsu Maeda* , Hiroaki Kobayashi and Ryo Akuta
College of Pharmaceutical Sciences, Ritsumeikan University, Kusatsu 525-8577, Japan
Received 21 August 2012Accepted 12 September 2012
ABSTRACT: A novel dipyrrolyl metal-coordination ligand dimer directly connected at the meso positions showed the formation of a ZnII-bridged coordination polymer and the spontaneous transformation to a meso–meso- and singly β–β-fused tetrapyrrolyl molecule in solution by C–C bond formation and concomitant proton migration.
KEYWORDS: coordination polymers, dipyrrins, meso–meso linkage, ring fusion.
SPP full member in good standing
*Correspondence to: Hiromitsu Maeda, email: [email protected], fax: +81 77-561-2659

MESO–MESO DIRECTLY LINKED DIPYRROLYL LIGAND DIMER THAT SHOWS THE FORMATION 87
Copyright © 2013 World Scientific Publishing Company J. Porphyrins Phthalocyanines 2013; 17: 87–91
1.502 Å, suggesting a disruption of the π-conjugation between the two dipyrrin units.
ZnII coordination of 2 by treating with 1 equiv. of Zn(OAc)2 in THF, as an appropriate solvent for dipyrrin-based metal-coordination polymers, was found to form coordination polymers 2n·ZnII
n (Fig. 3a(i)) as a red-colored colloidal suspension (Fig. 3a(ii)) in a few minutes. The suspension contained submicrometer-scale brick-like particles as revealed by scanning electron microscopy (SEM) and optical microscopy (OM) (Fig. 3b). A THF suspension as such from 2 is in contrast to the colloidal THF solutions obtained from phenylethynyl-bridged dipyrrin dimers [6]. Elemental analysis of the precipitate of 2n·ZnII
n with the contents of 57.65% (C), 4.19% (H), and 12.59% (N) supports the formation of coordination polymers along with 1.5 units of acetic acid, which are contained among polymer structures, per a ZnII complex unit. The IR spectrum of 2n·ZnII
n as a precipitate showed the absence of N–H stretching, also suggesting that the N sites were used to make coordination bonds with ZnII. The UV-vis absorption spectra of 2n·ZnII
n in a diluted THF solution (0.015 mM for 2) and as a precipitate exhibited λmax at 526 and 614 nm, respectively, both of which suggested the formation of dipyrrin–ZnII complexes by comparison with the λmax of 2 at 444 nm in THF (Fig. 3c).
However, the solution-state UV-vis absorption spectrum, containing possibly soluble oligomeric complexes, is similar to those of monomeric dipyrrin–ZnII complexes, suggesting that there is less excitonic coupling between
Fig. 1. Parent structure of meso–meso-linked BODIPY dimer
Fig. 2. (a) Synthesis of meso–meso-linked dipyrrin dimer 2 from tetrapyrrolylethene 1 and (b) DFT-optimized structure (top and side view) of 2
Fig. 3. (a)(i) Schematic representation and (ii) THF suspension of ZnII-bridged coordination polymer of 2, (b)(i) SEM and (ii) OM images of the polymer 2n·ZnII
n as a precipitate from THF, and (c) UV-vis absorption spectra of 2 and 2n·ZnII
n (orange and red lines, respectively; 0.015 mM in THF) and 2n·ZnII
n as a precipitate (black line) obtained by optical waveguide
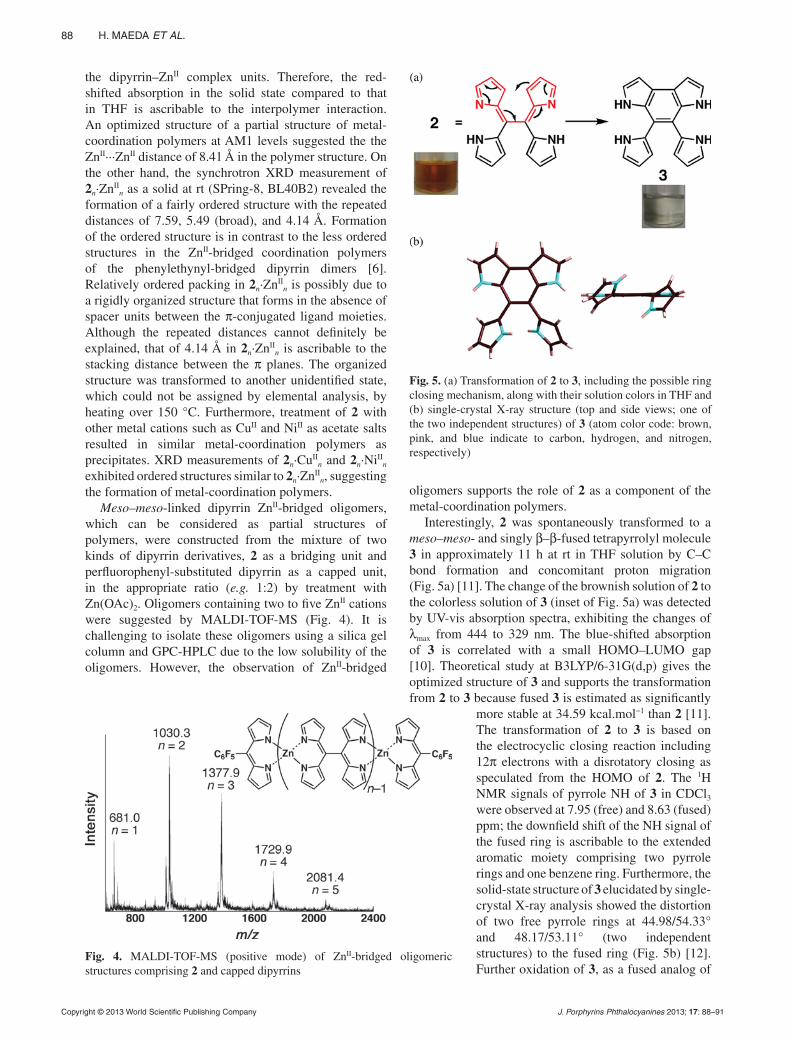
88 H. MAEDA ET AL.
Copyright © 2013 World Scientific Publishing Company J. Porphyrins Phthalocyanines 2013; 17: 88–91
the dipyrrin–ZnII complex units. Therefore, the red-shifted absorption in the solid state compared to that in THF is ascribable to the interpolymer interaction. An optimized structure of a partial structure of metal-coordination polymers at AM1 levels suggested the the ZnII···ZnII distance of 8.41 Å in the polymer structure. On the other hand, the synchrotron XRD measurement of 2n·ZnII
n as a solid at rt (SPring-8, BL40B2) revealed the formation of a fairly ordered structure with the repeated distances of 7.59, 5.49 (broad), and 4.14 Å. Formation of the ordered structure is in contrast to the less ordered structures in the ZnII-bridged coordination polymers of the phenylethynyl-bridged dipyrrin dimers [6]. Relatively ordered packing in 2n·ZnII
n is possibly due to a rigidly organized structure that forms in the absence of spacer units between the π-conjugated ligand moieties. Although the repeated distances cannot definitely be explained, that of 4.14 Å in 2n·ZnII
n is ascribable to the stacking distance between the π planes. The organized structure was transformed to another unidentified state, which could not be assigned by elemental analysis, by heating over 150 °C. Furthermore, treatment of 2 with other metal cations such as CuII and NiII as acetate salts resulted in similar metal-coordination polymers as precipitates. XRD measurements of 2n·CuII
n and 2n·NiIIn
exhibited ordered structures similar to 2n·ZnIIn, suggesting
the formation of metal-coordination polymers.Meso–meso-linked dipyrrin ZnII-bridged oligomers,
which can be considered as partial structures of polymers, were constructed from the mixture of two kinds of dipyrrin derivatives, 2 as a bridging unit and perfluorophenyl-substituted dipyrrin as a capped unit, in the appropriate ratio (e.g. 1:2) by treatment with Zn(OAc)2. Oligomers containing two to five ZnII cations were suggested by MALDI-TOF-MS (Fig. 4). It is challenging to isolate these oligomers using a silica gel column and GPC-HPLC due to the low solubility of the oligomers. However, the observation of ZnII-bridged
oligomers supports the role of 2 as a component of the metal-coordination polymers.
Interestingly, 2 was spontaneously transformed to a meso–meso- and singly β–β-fused tetrapyrrolyl molecule 3 in approximately 11 h at rt in THF solution by C–C bond formation and concomitant proton migration (Fig. 5a) [11]. The change of the brownish solution of 2 to the colorless solution of 3 (inset of Fig. 5a) was detected by UV-vis absorption spectra, exhibiting the changes of λmax from 444 to 329 nm. The blue-shifted absorption of 3 is correlated with a small HOMO–LUMO gap [10]. Theoretical study at B3LYP/6-31G(d,p) gives the optimized structure of 3 and supports the transformation from 2 to 3 because fused 3 is estimated as significantly
more stable at 34.59 kcal.mol−1 than 2 [11]. The transformation of 2 to 3 is based on the electrocyclic closing reaction including 12π electrons with a disrotatory closing as speculated from the HOMO of 2. The 1H NMR signals of pyrrole NH of 3 in CDCl3 were observed at 7.95 (free) and 8.63 (fused) ppm; the downfield shift of the NH signal of the fused ring is ascribable to the extended aromatic moiety comprising two pyrrole rings and one benzene ring. Furthermore, the solid-state structure of 3 elucidated by single-crystal X-ray analysis showed the distortion of two free pyrrole rings at 44.98/54.33° and 48.17/53.11° (two independent structures) to the fused ring (Fig. 5b) [12]. Further oxidation of 3, as a fused analog of
Fig. 4. MALDI-TOF-MS (positive mode) of ZnII-bridged oligomeric structures comprising 2 and capped dipyrrins
Fig. 5. (a) Transformation of 2 to 3, including the possible ring closing mechanism, along with their solution colors in THF and (b) single-crystal X-ray structure (top and side views; one of the two independent structures) of 3 (atom color code: brown, pink, and blue indicate to carbon, hydrogen, and nitrogen, respectively)

MESO–MESO DIRECTLY LINKED DIPYRROLYL LIGAND DIMER THAT SHOWS THE FORMATION 89
Copyright © 2013 World Scientific Publishing Company J. Porphyrins Phthalocyanines 2013; 17: 89–91
tetrapyrrolylethene 1, to dipyrrin derivatives has not been achieved. The transformation from dipyrrin dimer 2 to fused molecule 3 is a fascinating process to provide a new π-conjugated system that may act as a precursor of metal-coordination ligands with more planar structures. However, at present, the transformation behaves as one of the factors that interfere with the detailed examination of the metal-coordination behaviors of 2. In addition, the transformation of the coordination polymers 2n·M
IIn (M
= Zn, Cu, and Ni) was not observed. This observation can be presumably ascribable to the prevention of the electronic state suitable for ring closing by coordination at the pyrrole N sites.
EXPERIMENTAL
General procedures
Starting materials were purchased from Wako Pure Chemical Industries Ltd., Nacalai Tesque Inc., and Sigma-Aldrich Co. and used without further purification unless otherwise stated. Solution-state and solid-state UV-visible spectra were recorded on a Hitachi U-3500 spectrometer and a System Instruments surface and interface spectrometer SIS-50, respectively. Fluorescence spectra were recorded on a Hitachi F-4500 fluorescence spectrometer for ordinary solution. NMR spectra used in the characterization of products were recorded on a JEOL ECA-600 600 MHz spectrometers. All NMR spectra were referenced to solvent. Matrix-assisted laser desorption ionization time-of-flight mass spectrometries (MALDI-TOF-MS) were recorded on a Shimadzu Axima-CFRplus using positive mode. Elemental analyses were performed on a Yanaco CHN corder MT series for carbon, hydrogen, and nitrogen and the oxygen flask combustion method, the Laboratory for Organic Elemental Microanalysis, Kyoto University. TLC analyses were carried out on aluminum sheets coated with silica gel 60 (Merck 5554). Column chromatography was performed on Sumitomo alumina KCG-1525, Wakogel C-200, C-300, and Merck silica gel 60 and 60H.
Synthesis
Meso–meso-linked dipyrrin dimer 2. To a THF solution (2.5 mL) of 1,1,2,2-tetra(pyrrol-2-yl)ethene 1 [9b] (5.0 mg, 17.3 μmol) in ice bath was added p-chloranil (4.3 mg, 17.3 μmol) in THF (2.5 mL) slowly dropwise over the course of 30 min. After 1 h, the solution was washed with K2CO3 aq., and the organic layer was dried over anhydrous Na2SO4 and evaporated to afford 2 as a brown solid. Yield 4.9 mg (quant.). Rf = 0.10 (CH2Cl2).
1H NMR (600 MHz, CDCl3, 20 °C): δ, ppm 7.62 (s, 4H, pyrrole-H), 6.75 (m, 4H, pyrrole-H), 6.33 (m, 4H, pyrrole-H). UV-vis (CH2Cl2): λmax, nm 444. MALDI-TOF-MS: m/z (% intensity) 286.0 (100), 287.0 (55), 288.1 (80). Calcd. for C18H14N4 ([M]+): 286.12.
Meso–meso- and singly β–β-linked 1,1,2,2-tetra(2-pyrrolyl)ethene 3. The THF solution (100 mL) of 2 (99 mg, 0.346 mmol) was still standing for 11 h. After removal of the solvent in vacuo, silica gel column chromatography (Wakogel C-300, CH2Cl2) and recrystallization from CH2Cl2/hexane afforded 3 as a white solid. Yield 78 mg (79%). Rf = 0.64 (CH2Cl2).
1H NMR (600 MHz, CDCl3, 20 °C): δ, ppm 8.63 (s, 2H, pyrrole-H), 7.95 (s, 2H, pyrrole-H), 7.25 (m, 2H, pyrrole-H), 6.83 (m, 2H, pyrrole-H), 6.75 (m, 2H, pyrrole-H), 6.58 (m, 2H, pyrrole-H), 6.34 (m, 2H, pyrrole-H). UV-vis (CH2Cl2): λmax, nm 267, 336. MALDI-TOF-MS: m/z (% intensity) 286.1 (100), 287.1 (20), 288.1 (55). Calcd. for C18H14N4 ([M]+): 286.12. This compound was further characterized by single-crystal X-ray diffraction analysis.
Single-crystal X-ray analysis
A single crystal of 3 was obtained by vapor diffusion of hexane into a CH2Cl2 solution of 3. The data crystal was a yellow-colored prism of approximate dimensions 0.60 mm × 0.20 mm × 0.10 mm. Data was collected at 123 K on a Rigaku RAXIS-RAPID diffractometer with graphite monochromated Mo-Kα radiation (λ = 0.71075 Å), structure was solved by direct method. The non-hydrogen atoms were refined anisotropically. The calculations were performed using the Crystal Structure crystallographic software package of Molecular Structure Corporation [13].
Crystallographic data have been deposited at the Cambridge Crystallographic Data Centre (CCDC) under number CCDC-875752. Copies can be obtained on request, free of charge, via www.ccdc.cam.ac.uk/data_request/cif or from the Cambridge Crystallographic Data Centre, 12 Union Road, Cambridge CB2 1EZ, UK (fax: +44 1223-336-033 or email: [email protected]).
Computational methods
Ab initio and semiempirical calculations were carried out by using Gaussian 03 program [10]. The structures were optimized, and the total electronic energies were calculated at the B3LYP level using a 6–31G** basis set (for 2 and 3) or at AM1 level (for a metal complex). Molecular orbitals were determined by single point calculations at the B3LYP level using a 6–31+G** basis set of the optimized structures at the B3LYP level using a 6–31G** basis set.
Scanning Electron Microscopy (SEM)
SEM image was obtained with a HITACHI S-4800 scanning electron microscope at acceleration voltages of 10 kV. Silicon (100) was used as substrate, and a platinum coating was applied using a HITACHI E-1030 ion sputter.
Optical Microscopy (OM)
OM measurements were carried out with an Olympus LEXT OLS3500 using a glass substrate.

90 H. MAEDA ET AL.
Copyright © 2013 World Scientific Publishing Company J. Porphyrins Phthalocyanines 2013; 17: 90–91
Synchrotron X-ray diffraction analysis
High-resolution XRD analysis was carried out using a synchrotron radiation X-ray beam with a wavelength of 1.00 Å on BL40B2 at SPring-8 (Hyogo, Japan). A large Debye-Scherrer camera with a camera length of 532.7 mm was used with an imaging plate as a detector, where the diffraction pattern was obtained with a 0.01° step in 2θ. The exposure time to the X-ray beam was 10 s for 2n·ZnII
n and 30 s for 2n·CuII
n and 2n·NiIIn sealed in a quartz capillary.
SUMMARY
Novel dipyrrolyl ligand dimers were prepared. A meso–meso directly linked dimer was found to form metal-coordination polymers but was transformed into a new π-conjugated system. Peripheral modification at the pyrrole rings in these oligopyrrole derivatives would result in the formation of functional metal-coordination polymers, which could be useful as electrooptical materials. In addition, the coordination with trivalent metal cations would provide fascinating 2D honeycomb coordination networks. Furthermore, metal-coordination behaviors of ethene analogs 1 and 3, both of which have two NH sites in the dipyrrolyl moieties, were also observed during the preliminary examination. Further detailed investigations are currently underway.
Acknowledgements
This work was supported by Grant-in-Aid for Scientific Research on Innovation Areas (“Coordination Programming” Area 2107, No. 22108533) from the MEXT and Ritsumeikan R-GIRO project (2008–2013). We thank Prof. Atsuhiro Osuka and Mr. Tomohiro Higashino, Kyoto University, for single-crystal X-ray analysis, Dr. Takashi Nakanishi, NIMS, for SEM measurements, Dr. Noboru Ohta, JASRI/SPring-8, for synchrotron radiation XRD measurements (BL40B2 at SPring-8), Prof. Toshiyuki Hamura, Kwansei Gakuin University, for valuable discussion of electrocyclic closing reaction, and Prof. Hitoshi Tamiaki, Ritsumeikan University, for various measurements.
Supporting information
Figures S1–S7 are given in the supplementary material. This material is available free of charge via the Internet at http://www.worldscinet.com/jpp/jpp.shtml.
REFERENCES
1. Supramolecular Chemistry from Molecules to Nanomaterials, Gale PA and Steed JW. (Eds.) Wiley: 2012.
2. Handbook of Porphyrin Science, Vol. 1–10, Kadish KM, Smith KM and Guilard R. (Eds.) World Scien-tific: New Jersey, 2010.
3. As pioneering examples: a) Aratani N, Osuka A, Kim YH, Jeong DH and Kim D. Angew. Chem., Int. Ed. 2000; 39: 1458–1462. b) Tsuda A and Osuka A. Science 2001; 293: 79–82.
4. a) Transition Metals in Supramolecular Chemistry, Sauvage JP. (Ed.) John Wiley & Sons: Chichester, 1999. b) Metal-Containing and Metallosupramole-cular Polymers and Materials, Schubert US, New-kome GR and Manners I. (Eds.) ACS Symposium Series 928: Washington DC, 2006.
5. As representative book and review article: a) Falk H. The Chemistry of Linear Oligopyrroles and Bile Pigments, Springer-Verlag: Vienna, 1989. b) Wood TE and Thompson A. Chem. Rev. 2007; 107: 1831–1861. c) Baudron SA. CrystEngComm 2010; 12: 2288–2295.
6. Maeda H, Hasegawa M, Hashimoto T, Kakimoto T, Nishio S and Nakanishi T. J. Am. Chem. Soc. 2006; 128: 10024–10025.
7. Meso–meso-linked BODIPY dimers: a) Cakmak Y, Kolemen S, Duman S, Dede Y, Dolen Y, Kilic B, Kostereli Z, Yildirim LT, Dogan AL, Guc D and Akkaya EU. Angew. Chem., Int. Ed. 2011; 50: 11937–11941. b) Whited MT, Patel NM, Roberts ST, Allen K, Djurovich PI, Bradforth SE and Thompson ME. Chem. Commun. 2012; 48: 284–286.
8. Other directly linked BODIPY dimers: a) Bröring M, Bregier F, Kruger R and Kleeberg C. Eur. J. Inorg. Chem. 2008; 5505–5512. b) Bröring M, Kruger R, Link S, Kleeberg C, Kohler S, Xie X, Ventura B and Flamigni L. Chem. Eur. J. 2008; 14: 2976–2983. c) Ventura B, Marconi G, Bröring M, Kruger R and Flamigni L. New J. Chem. 2009; 33: 428–438. d) Rihn S, Erdem M, De Nicola A, Retail-leau P and Ziessel R. Org. Lett. 2010; 12: 1916–1919. e) Hayashi Y. Yamaguchi S, Cha WY, Kim D and Shinokubo H. Org. Lett. 2010; 12: 2992–2995. f) Nepomnyashchii AB, Bröring M, Ahrens J and Bard AJ. J. Am. Chem. Soc. 2011; 133: 8633–8645.
9. a) Synthesis of dipyrrolylketone: Plater JP, Aiken S and Bourhill G. Tetrahedron 2002; 58: 2405–2413. b) Synthesis of tetrapyrrolylethene: Khoury RG, Jaquinod L and Smith KM. Chem. Commun. 1997; 1057–1058.
10. Gaussian 03 (Revision C.01), Frisch MJ, Trucks GW, Schlegel HB, Scuseria GE, Robb MA, Chee-seman JR, Montgomery JA Jr, Vreven T, Kudin KN, Burant JC, Millam JM, Iyengar SS, Tomasi J, Barone V, Mennucci B, Cossi M, Scalmani G, Rega N, Petersson GA, Nakatsuji H, Hada M, Ehara M, Toyota K, Fukuda R, Hasegawa J, Ishida M, Naka-jima T, Honda Y, Kitao O, Nakai H, Klene M, Li X, Knox JE, Hratchian HP, Cross JB, Adamo C, Jara-millo J, Gomperts R, Stratmann RE, Yazyev O, Aus-tin AJ, Cammi R, Pomelli C, Ochterski JW, Ayala PY, Morokuma K, Voth GA, Salvador P, Dannen-berg JJ, Zakrzewski VG, Dapprich S, Daniels AD,

MESO–MESO DIRECTLY LINKED DIPYRROLYL LIGAND DIMER THAT SHOWS THE FORMATION 91
Copyright © 2013 World Scientific Publishing Company J. Porphyrins Phthalocyanines 2013; 17: 91–91
Strain MC, Farkas O, Malick DK, Rabuck AD, Raghavachari K, Foresman JB, Ortiz JV, Cui Q, Baboul AG, Clifford S, Cioslowski J, Stefanov BB, Liu G, Liashenko A, Piskorz P, Komaromi I, Mar-tin RL, Fox DJ, Keith T, Al-Laham MA, Peng CY, Nanayakkara A, Challacombe M, Gill PMW, John-son B, Chen W, Wong MW, Gonzalez C and Pople JA. Gaussian, Inc., Wallingford CT, 2004
11. Similar ring closing including an oxidation process was reported in thienyl derivative: Fischer E, Larsen J, Christensen JB, Fourmigué M, Madsen HG and Harrit N. J. Org. Chem. 1996; 61: 6997–7005.
12. Crystal data for 3 (from CH2Cl2/hexane): C18H14N4, Mw = 286.33, monoclinic, P21/a (no. 14), a = 9.720(2), b = 18.990(5), c = 15.098(5) Å, β = 99.347(10)°, V = 2749.9(12) Å3, Z = 8, Dc = 1.383 g cm-3, T = 123(2) K, μ(Mo-Kα) = 0.086 mm-1, R1 = 0.0433, wR2 = 0.1033, GOF = 1.025 (I > 2σ (I)). CCDC 875752.
13. CrystalStructure (Ver. 3.8), Single Crystal Struc-ture Analysis Software, Rigaku/MSC and Rigaku Corporation, 2006.

Journal of Porphyrins and PhthalocyaninesJ. Porphyrins Phthalocyanines 2013; 17: 92–98
DOI: 10.1142/S1088424612501313
Published at http://www.worldscinet.com/jpp/
Copyright © 2013 World Scientific Publishing Company
INTRODUCTION
Dye-sensitized solar cells (DSSC) have drawn much attention because of the relatively high efficiencies, simple device design, and lower production cost [1–3]. Overall efficiencies (η) greater than 11% have been demonstrated with ruthenium dyes [4–6]. In recent years, other types of sensitizers have also been intensely studied. Among the dyes under investigation, porphyrins are considered as one of the more efficient sensitizers for DSSC applications because of the vital roles of porphyrin derivatives in photosynthesis, the strong UV-visible light absorption, and the ease of modifying their chemical structures [7–19]. In the development of porphyrin dyes, Officer and co-workers reported the overall efficiency of porphyrin-sensitized solar cells (PSSC) above 7% by using a side-anchoring, fully conjugated dye [10]. With the use of cobalt-based electrolyte and an organic co-sensitizer, the PCE of the PSSC device reached 12% recently [11a]. Independently, our systematic studies have yielded several highly efficient porphyrin dyes in the
past [14–19], three of which showed overall efficiencies greater than 10% with the use of classic DSSC setup. It is worth noting that 4-carboxy-phenylethyne is often used as the anchoring group for the porphyrin dyes [8a, 11, 13–19], including many highly efficient ones [11, 17, 18]. However, only very basic electrochemistry of these porphyrins, such as the redox potentials, has been reported.
In this work, we aim to reveal more detailed electrochemical properties of zinc porphyrins modified with a 4-carboxy-phenylethynyl anchoring group. The porphyrins under investigation are denoted as PE1, PE1-OR6, and PE1-OR4 and their structures are shown in Chart 1. As shown in the chart, these porphyrins employ zinc biphenylporphine (ZnBPP) as the core chromophore and a 4-carboxy-phenylethyne as the anchoring substituent for DSSC applications. The differences in the structures of these porphyrins are the substituents on the 10,20-phenyl rings. For PE1, the phenyl groups are not further modified. For PE1-OR6, six dodecoxyl chains are added to the para- and meta-positions of the two phenyl rings. For PE1-OR4, four dodecoxyl chains are attached to the ortho-positions of the two phenyl groups. The dodecoxyl chains are introduced to increase the solubility of the porphyrin in the organic solvents.
Electrochemistry and spectroelectrochemistry
of carboxy phenylethynyl porphyrins
Pei-Shang Chao, Ming-Yu Kuo, Chen-Fu Lo, Min-Hsu Hsieh, Yu-Hsiang Cheng,
Chin-Li Wang, Hsiu-Yu Lu, Hshin-Hui Kuo, Yen-Ni Hsiao, Chieh-Ming Wang and
Ching-Yao Lin*
Department of Applied Chemistry, National Chi Nan University, No. 302 University Road, Puli, Nantou Hsien 54561, Taiwan
Received 23 July 2012Accepted 1 October 2012
ABSTRACT: Zinc 5-(4-carboxy-phenylethynyl)-10,20-biphenylporphines bearing various substituents on the 10,20-phenyl rings are studied for their electrochemical and spectroelectrochemical properties. Cyclic voltammetry and optically transparent thin-layer electrochemical measurements suggest that the first reductions of these porphyrins should be the reduction reaction of the carboxylic protons. For the porphyrin ring reactions, our study shows that the redox properties can be significantly affected by the alkoxyl chains on the 10,20-phenyl rings.
KEYWORDS: porphyrin, electrochemistry, spectroelectrochemistry, carboxyphenylethyne.
*Correspondence to: Ching-Yao Lin, email: [email protected], tel: +886 49-2910960 ext. 4152, fax: +886 49-2917956

ELECTROCHEMISTRY AND SPECTROELECTROCHEMISTRY OF CARBOXY PHENYLETHYNYL PORPHYRINS 93
Copyright © 2013 World Scientific Publishing Company J. Porphyrins Phthalocyanines 2013; 17: 93–98
As we have recently reported, the positions of these long alkoxyl groups play a significant role in improving the photovoltaic performance of the PSSC [17]. Likewise, the positions of the long alkoxyl groups were also observed to significantly affect the electrochemical behaviors of the porphyrins.
EXPERIMENTAL
Materials
Air-sensitive solids were handled in an MBraun Uni-lab glove box. A vacuum line and standard Schlenk techniques were employed to process air-sensitive solutions. Tetrahydrofuran (THF) was obtained from Merck (Darmstadt, Germany). Other chemicals were ordered from Acros Organics (New Jersey, U.S.A.). THF and tetrabutylammonium perchlorate (TBAP) were were purified according to the literature methods [20]. The synthesis of PE1, PE1-OR6 and PE1-OR4 has been previously reported [14, 17]. Free-base PE1-OR4 was prepared by demetallating PE1-OR4 in CHCl3 with HCl(aq). 100 mg PE1-OR4 was usually dissolved in 100 mL of CHCl3 for the process. After adding 10 mL of 12 M HCl(aq), the solution was stirred at room temperature for 4 hours. The completion of the reaction was monitored by UV-visible spectrscopy and TLC techniques. Upon completion, the organic solution was first neutralized by three washes of K2CO3(aq) followed by three washes of NH4Cl(aq). After chromatographic separation on silica gel (with CH2Cl2/MeOH = 9/1) and crystalization from CH2Cl2/MeOH, 71% of free-base PE1-OR4 was collected. Characterization data: 1H NMR (300 MHz CDCl3 at 7.26 ppm): , ppm 10.02 (s, 1H), 9.69 (d, J = 4.5 Hz, 2H), 9.16 (d, J = 4.8Hz, 2H), 8.92 (d, J = 4.5 Hz, 2H), 8.86 (d, J = 4.5 Hz, 2H), 8.30 (d, J = 8.0 Hz, 2H), 8.11 (d, J = 8.0, 2H), 7.71 (t, J = 8.4 Hz, 2H), 7.01 (d, J = 8.4 Hz, 4H), 3.85 (t, J = 6.5 Hz, 8H), 1.30–0.75 (m, 64H), 0.75–0.35 (m, 34H), -2.43 (s, 2H). Elemental analysis: C89H122N4O6, calcd. C 79.54%, H 9.15%, N 4.17%;
found C 79.23%, H 9.31%, N 3.82%. Mass [MH]+ calcd. 1342.94, found 1343.83.
Instrumentation
Absorption spectra were recorded on an Agilent 8453 UV-visible spectrophotometry system. A CH Instruments Electrochemical Workstation 611A was used to performed cyclic voltammograms and thin-layer electrolysis. Cyclic voltammetry was carried out with a standard three-electrode cell. The reference electrode (SCE) was isolated from the main compartment by a junction tipped with a platinum wire. Spectroelectrochemical results were measured with an air-tight, optically transparent thin-layer electrochemical (OTTLE) cell [21]. The cell is made of quartz with 1-mm in light path. The working electrode, constructed with a 100 mesh platinum gauze, was placed inside the cell, while the reference and counter electrodes were individually separated from the main compartment by a layer of fine glass frit. The electrochemical cells were all assembled in a glovebox equipped with a drytrain to exclude moisture and oxygen.
Molecular simulation
The molecular dynamics (MD) simulations of the porphyrins were carried out with the use of Materials Studio software package. Details of the simulation procedure have been previously published [17b]. To simplify the calculation, free-base porphyrins were used in these simulations.
RESULTS AND DISCUSSION
Figure 1 collects the cyclic voltammograms (CVs) of PE1 porphyrin, ZnBPP, 4-carboxy-phenylethyne (PE), and the blank solution (THF/0.1 M TBAP) under the same experimental conditions. The redox potentials are listed in Table 1. First of all, the reduction reaction of ZnBPP occurs at -1.40 V vs SCE as a quasi-reversible reaction (Fig. 1b). This potential is consistent with the formation
N N
N NZn
OH
O
OC12H25C12H25O
OC12H25C12H25O
N N
N NZn
OH
O N N
N NZn
OH
O
C12H25OOC12H25
OC12H25
OC12H25
OC12H25
C12H25O
PE1 PE1-OR6 PE1-OR4
Chart 1. Structural diagram of the PE1 porphyrins under investigation

94 P.-S. CHAO ET AL.
Copyright © 2013 World Scientific Publishing Company J. Porphyrins Phthalocyanines 2013; 17: 94–98
of a zinc porphyrin anion radical [22]. For PE1 porphyrin, two waves of reversible reductions were observed at -0.86 and -1.24 V vs SCE (Fig. 1a). Bulk electrolysis indicates that there are two electrons involved in these reduction reactions. In other words, there are two one-electron reduction reactions observed for PE1 porphyrin. Coulometric titration with the use of an OTTLE cell [21] agrees well with this suggestion (titration curves shown as insets in Fig. 2a and 2b). The first reduction of PE1 porphyrin is an ill-shaped, quasi-reversible reaction. Interestingly, the potential of this reaction is susceptible to the presence of H2O in the system. As shown in Fig. 1a and Table 1, the redox potential of PE1’s first reduction reaction is positively shifted from -0.86 V to -0.78 V vs SCE by increasing water content in the THF solution to 7.5% (v/v). A nearly identical phenomenon was also observed for the anchoring substituent,
4-carboxy-phenylethyne, under the same conditions (Fig. 1c). In contrast, the second reduction potential of PE1 porphyrin is not sensitive to the introduction of H2O. Half-wave potential of ZnPE1’s second reduction was observed at -1.24 V vs SCE. This value is consistent with the formation of a porphyrin anion radical. This potential is positively shifted from that of ZnBPP (-1.40 V) due to the more extended π-conjugation system of PE1 porphyrin [14]. As such, by comparing the CVs of PE1 with those of ZnBPP and 4-carboxy-phenylethyne, Fig. 1 indicates that the first reduction reaction of PE1 porphyrin should localize at the anchoring 4-carboxy-phenylethynyl group and the second reduction should occur at the porphine ring.
To further our understanding to the reduction reactions of PE1 porphyrin, spectroelectrochemical measurements were carried out with the use of an OTTLE cell in THF/TBAP under N2. Figure 2 collects the UV-visible spectrum changes of PE1 porphyrin upon (a) the first reduction at -1.10 V vs SCE, (b) the second reduction
at -1.40 V vs SCE, and (c) the acid-base titration by TBAOH. Coulometric titration (Fig. 2a and 2b insets) indicates that two reductions of PE1 are both one-electron transfer reactions. Upon the first reduction, the absorption bands of PE1 are slightly red-shifted and the absorption bands remain relatively sharp (Fig. 2a). Isosbestic points observed in this figure suggest that no intermediates were observed during the electrolysis. Intriguingly, these spectral changes are nearly identical to those of PE1 being
titrated by TBAOH (Fig. 2c). Therefore, this figure strongly suggests that the first reduction of PE1 in THF/TBAP should involve deprotonation reaction of the 4-carboxy-phenylethynyl substituent, generating a localized anion at the anchoring group. This phenomenon is similar to changing a substituent at the porphyrin meso-position and observing slightly shifted sharp absorption bands. Upon the second reduction, the absorption bands of PE1 became very broadened and largely red-shifted at -1.40 V vs SCE (Fig. 2b). These spectrum changes are consistent with the formation of a porphyrin anion radical, i.e. a one-electron reduction at the porphine core [22].
It has been reported that benzoic acid undergoes one-electron reduction reaction in solutions, generating benzoate anion and hydrogen [23]. Based on this mechanism, we suggest that the carboxylic substituent of PE1 porphyrin loses one proton upon the first one-electron reduction
Table 1. Reduction potentials of PE1, ZnBPP, and 4-carboxy-phenylethyne (PE)a
Entry THF/0.1 M TBAP Added H2O (2.5%) Added H2O (7.5%)
PE1 (Red 1) -0.86 V (450 mV) -0.83 V (390 mV) -0.78 V (300 mV)
PE1 (Red 2) -1.24 V (160 mV) -1.24 V (140 mV) -1.24 V (130 mV)
ZnBPP -1.40 V (190 mV) -1.39 V (170 mV) -1.40 V (200 mV)
PE -0.91 V (570 mV) -0.84 V (36 mV) -0.78 V (250 mV)
a Reaction conditions: 1.0 mM of the compound in 8 mL THF/0.1 M TBAP; Pt working and counter electrodes; SCE reference electrode; scan rate = 100 mV/s. For Fc+/0 in the same condition, E1/2 = +0.49 V vs SCE. Peak-to-peak separations (mV) are put in the parentheses for the quasi-reversible reactions.
Fig. 1. Cyclic voltammograms of 1.0 mM (a) PE1, (b) ZnBPP, (c) 4-carboxy-phenylethyne (PE) in 8 mL THF/0.1 M TBAP solutions, and (d) the blank solutions (THF/0.1 M TBAP). The dotted lines represent the dried solutions, thin solid lines: added 0.02 mL H2O (2.5%), and bold lines: added 0.06 mL H2O (7.5%). This figure qualitatively demonstrates the effect of H2O on the potential of PE1’s first reduction reaction

ELECTROCHEMISTRY AND SPECTROELECTROCHEMISTRY OF CARBOXY PHENYLETHYNYL PORPHYRINS 95
Copyright © 2013 World Scientific Publishing Company J. Porphyrins Phthalocyanines 2013; 17: 95–98
around -0.86 V vs SCE, yielding a carboxylate group and hydrogen. At -1.24 V vs SCE, the porphine core receives an additional electron and becomes a porphyrin anion radical. Scheme 1 illustrates this proposed mechanism. It is worth mentioning that it would be of great interests if the first reduction reaction of PE1 porphyrin were catalytical. That would translate to a possibility of continuous H2 generation. Unfortunately, we did not observe catalytical generation of hydrogen at this time.
Figure 3 collects the CVs of PE1, PE1-OR6, and PE1-OR4 in THF/TBAP. The redox potentials are listed in Table 2. As shown in the figure and table, PE1 and PE1-OR6 behaves very similarly. The first porphine ring reductions are both quasi-reversible for PE1 (-1.24 V vs SCE) and PE1-OR6 (-1.27 V vs SCE). However, the first porphine ring oxidations appear to be irreversible reactions for PE1 (+1.04 V vs SCE) and PE1-OR6 (+1.08 V vs SCE). As for PE1-OR4, the first porphine ring reduction was observed at -1.47 V vs SCE as a quasi-reversible reaction. Interestingly, the first oxidation of PE1-OR4 was observed as a quasi-reversible reaction at +0.85 V vs SCE, in sharp contrast to the irreversible oxidation waves of PE1 and PE1-OR6 under the same condition. This phenomenon strongly suggests that six alkoxyl chains at the meta- and para-positions of the phenyl groups should have very limited influence to the porphyrin redox behaviors. On the contrary, four alkoxyl chains at the ortho-positions of the phenyl groups have a significant impact to the potentials as well as the reversibility of the redox reactions. These differences may be attributed to two possibilities. (a) The four alkoxyl chains at the ortho-positions of the PE1-OR4 phenyl groups are in the positions to have more electron-donating influence than are the six alkoxyl chains at the meta- and para-positions of the PE1-OR6 phenyl rings. (b) The spacial arrangement of PE1-OR4’s four alkoxyl chains are in a shape of wrapping around the porphyrin core structure in the solution whereas PE1-OR6’s six alkoxyl chains extend into the solution (see below).
In order to further our understanding to the differences in the electrochemical behaviors mentioned above, we performed molecular simulations on PE1-OR6 and PE1-OR4 by using Materials Studio software package [24]. Because of the long alkoxyl chains, obtaining crystal structures of the porphyrins is not feasible. More importantly, simulation results provide the opportunity of visualizing the alkoxyl chains in the solutions. To simplify
Fig. 2. Absorption spectrum changes of PE1 porphyrin in THF/0.5 M TBAP upon (a) the first one-electron reduction, (b) the second one-electron reduction, and (c) TBAOH titration. The insets show the coulometric titration curves
Scheme 1. Proposed mechanism of PE1 porphyrin reduction reactions. This suggested mechanism is based on reference [23]
N N
N NZn
OH
O N N
N NZn
O-
OH +.
N N
N NZn
O-
O
-.
E1/2 = -1.40 VE1/2 = -0.86 V

96 P.-S. CHAO ET AL.
Copyright © 2013 World Scientific Publishing Company J. Porphyrins Phthalocyanines 2013; 17: 96–98
the calculation, free-base porphyrins were used in these simulations. The results are compared in Scheme 2. As shown in the scheme, the phenyl groups at the macrocyclic meso-positions are fairly perpendicular to the porphyrin macrocylic planes due to the steric hindrance between the porphine ring and the phenyl rings. As for the alkoxyl chains, the four dodecoxyl chains of PE1-OR4 are simulated to wrap around the porphine core whereas the six alkoxyl chains of PE1-OR6 are simulated to extend into the bulk
solution. As mentioned above, the redox potentials of the first porphine reduction and oxidation of PE1-OR4 are both negatively shifted from those of PE1 and PE1-OR6. In addition, the first oxidation of PE1-OR4 is much more reversible than those of PE1 and PE1-OR6. Therefore, in addition to the electro-donating influence of the alkoxyl groups, we suggest that PE1-OR4’s negatively shifted redox potentials as well as the reversible oxidation may also be attributed to the wrapping alkoxyl chains. This suggestion agrees well with the results observed for PE1-OR6. Because the PE1-OR6 simulation did not suggest the wrapping phenomenon, it is reasonable to observe that the electrochemical behaviors of PE1-OR6 remain
similar to those of PE1 porphyrin.Because of free-base porphyrins were used in the
simulations, it is of interest to observe the effect of the cental metal. Figure 4 compares the CVs of (zinc) PE1-OR4 and free-base PE1-OR4. The redox potentials of free-base PE1-OR4 are listed in Table 2. As shown in the figure and the table, removing the central metal ion from PE1-OR4 seem only to shift the redox potential positively. For the first porphyrin-ring reductions, the reactions are qusai-reversible for the zinc and the free-base porphyrins. The potentials, however, shift from PE1-OR4’s -1.47 V to free-base PE1-OR4’s -1.22 V. For the first porphyrin-ring oxidations, the reaction is qusai-reversible for PE1-OR4. Unfortunately, reversibility of free-base PE1-OR4’s first oxidation is difficult to determine because the reaction is very close to the detection limit of the solvent system. Consequently, we determine the oxidation potential by differential pulse voltammetry. Nevertheless, a similar positive shift is also observed. The oxidation potentials shift from PE1-OR4’s +0.85 V to free-base PE1-OR4’s +1.11 V. This phenomenon is consistent with the literature reports [25]. As for the carboxylic acid reduction, the redox couples do not seem to be sensitive to the removal of the central metal ion.
Fig. 3. Cyclic voltammograms of 1.0 mM of PE1 (grey lines), PE1-OR4 (bold dotted lines), and PE1-OR6 (thin solid lines) in THF/0.1 M TBAP (thin dotted lines) solutions
Table 2. Redox potentials of PE1, PE1-OR6, and PE1-OR4 porphine ring reactionsa
PE1 PE1-OR6 PE1-OR4 H2PE1-OR4
Reduction -1.24 (100) -1.27 (140) -1.47 (130) -1.22 (140)
Oxidation +1.08 (Epa) +1.04 (Epa) +0.85 (150) +1.11b
a Reaction conditions: 1.0 mM of the porphyrin in THF/0.1 M TBAP; Pt working and counter electrodes; SCE reference electrode; scan rate = 100 mV/s. For Fc+/0 in the same condition, E1/2 = +0.49 V vs SCE. Peak-to-peak separations (mV) are put in the parentheses for quasi-reversible reactions. b This value is determined by differential pulse voltammetry because the reaction is too close to the detection limit to have a correct reading.
Scheme 2. Simulated molecular structures of (a) PE1-OR4 and (b) PE1-OR6 in solutions. The alkoxyl and alkyl chains are highlighted. Note that this scheme is to visualize the orientations of the long alkoxyl chains in the solutions

ELECTROCHEMISTRY AND SPECTROELECTROCHEMISTRY OF CARBOXY PHENYLETHYNYL PORPHYRINS 97
Copyright © 2013 World Scientific Publishing Company J. Porphyrins Phthalocyanines 2013; 17: 97–98
Finally, it is worth mentioning that changing the lengths of the alkoxyl chains would not have a significant impact on the redox properties of alkoxyl-wrapped porphyrins. We have recently reported that shortening the alkoxyl groups from 12 carbons to 8 and to 4 carbons did not generate any sifnificant changes in the UV-visible absorptions, fluorescent emissions, and the redox behaviors of the LD14 porphyrins, a push-pull version of PE1-OR4 [17b]. Molecular simulations were carried out in the said report and the results suggested that, despite the alkoxyl chains becoming shorter, the tendency to wrap around the porphyrin core remained the same for all versions of the LD14 porphyrins.
CONCLUSION
We demonstrated that the first reduction reaction of PE1 porphyrins is actually the reduction of the anchoring carboxylic proton. We also showed that the electrochemical behaviors of a zinc porphyrin can be significantly affected by wrapping the porphine core structure with long alkyl chains.
Acknowledgements
This work was supported by the National Science Council of Taiwan.
REFERENCES
1. a) Grätzel M. Nature. 2001; 414: 338–344. b) O’Regan B and Gratzel M. Nature. 1991; 353: 737–740.
2. Nazeeruddin MK, Zakeeruddin SM, Humphry-Baker R, Jirousek M, Liska P, Vlachopoulos N, Shklove VR, Fischer CH and Grätzel M. Inorg. Chem. 1999; 38: 6298–6305.
3. Hamann TW, Jensen RA, Martinson ABF, Ryswykac HV and Hupp JT. Energy Environ. Sci. 2008; 1: 66–78.
4. Nazeeruddin MK, De Angelis F, Fantacci S, Selloni A, Viscardi G, Liska P, Ito S, Takeru B and Grätzel M. J. Am. Chem. Soc. 2005; 127: 16835–16847.
5. Grätzel M. Inorg. Chem. 2005; 44: 6841–6851. 6. a) Chen CY, Wang M, Li JY, Pootrakulchote N,
Alibabaei L, Ngocle CH, Decoppet JD, Tsai JH, Grätzel C, Wu CG, Zakeeruddin SM and Grätzel M. ACS Nano. 2009; 3: 3103–3109. b) Kuang D, Klein C, Snaith H J, Moser JE, Humphry-Baker R, Comte P, Zakeeruddin SM and Grätzel M. Nano Lett. 2006; 6: 769–773.
7. a) Imahori H, Umeyama T, Ito S. Acc. Chem. Res. 2009; 42: 1809–1818. b) Martinez-Diaz MV, de la Torrea G and Torres T. Chem. Commun. 2010; 46: 7090–7108.
8. a) Mathew S, Iijima H, Toude Y, Umeyama T, Matano Y, Ito S, Tkachenko NV, Lemmetyinen H and Imahori H, J. Phys. Chem. C. 2011; 115: 14415–14424. b) Kira A, Matsubara Y, Iijima H, Umeyama T, Matano Y, Ito S, Niemi M, Tkachenko NV, Lemmetyinen H and Imahori H. J. Phys. Chem. C. 2010; 114: 11293–11304.
9. a) Lee CH, Chitre K and Galoppini E. J. Chin. Chem. Soc. 2010; 57: 1103–1110. b) Lee CH and Galoppini E. J. Org. Chem. 2010; 75: 3692–3704.
10. Campbell WM, Jolley KW, Wagner P, Wagner K, Walsh PJ, Gordon KC, Schmidt-Mende L, Nazeeruddin MK, Wang Q, Grätzel M and Officer DL. J. Phys. Chem. C. 2007; 111: 11760–11762.
11. a) Yella A, Lee HW, Tsao HN, Yi C, Chandiran AK, Nazeeruddin MK, Diau EWG, Yeh CY, Zakeeruddin SM and Grätzel M. Science, 2011; 334: 629–634. b) Bessho T, Zakeeruddin SM, Yeh CY, Diau EWG and Grätzel M. Angew. Chem. Int. Ed. 2010; 49: 6646–6649.
12. a) Park SW, Hwang DS, Kim DY, Kim D. J. Chin. Chem. Soc. 2010; 57: 1111–1118. b) Ishida M, Park SW, Hwang D, Koo YB, Sessler JL, Kim DY and Kim D. J. Phys. Chem. C. 2011; 115: 19343–19354.
Fig. 4. Cyclic voltammograms of 1.0 mM of PE1-OR4 (bold dotted lines), and free-base PE1-OR4 (dash lines) in THF/0.1 M TBAP (thin dotted lines) solutions. The arrows indicate the potential differences between the zinc and the free-base porphyrins

98 P.-S. CHAO ET AL.
Copyright © 2013 World Scientific Publishing Company J. Porphyrins Phthalocyanines 2013; 17: 98–98
13. Biroli AO, Tessore F, Pizzotti M, Biaggi C, Ugo R, Caramori S, Aliprandi A, Bignozzi CA, De Angelis F, Giorgi G, Licandro E and Longhi E. J. Phys. Chem. C. 2011; 115: 23170–23182.
14. a) Lin CY, Lo CF, Luo L, Lu HP, Hung CS and Diau EWG. J. Phys. Chem. C. 2009; 113: 755–764. b) Lo CF, Luo L, Diau EWG, Chang IJ and Lin CY. Chem. Commun. 2006: 1430–1432.
15. Lin CY, Wang YC, Hsu SJ, Lo CF and Diau EWG. J. Phys. Chem. C. 2010; 114: 687–693.
16. Lo CF, Hsu SJ, Wang CL, Cheng YH, Lu HP, Diau EWG and Lin CY. J. Phys. Chem. C. 2010; 114: 12018–12023.
17. a) Chang YC, Wang CL, Pan TY, Hong SH, Lan CM, Kuo HH, Lo CF, Hsu HY, Lin CY and Diau EWG. Chem. Commun. 2011; 47: 8910–8912. b) Wang CL, Lan CM, Hong SH, Wang YF, Pan TY, Chang CW, Kuo HH, Kuo MY, Diau EWG and Lin CY. Energy Environ. Sci. 2012; 5: 6933–6940. c) Lan CM, Wu HP, Pan TY, Chang CW, Chen CT, Wang CL, Lin CY and Diau EWG. Energy Environ. Sci. 2012; 5: 6460–6464.
18. Wang CL, Chang YC, Lan CM, Lo CF, Diau EWG and Lin CY. Energy Environ. Sci., 2011; 4: 1788–1795.
19. Wu CH, Hong SH, Kuo HH, Chu YY, Diau EWG and Lin CY, Chem. Commun. 2012; 48: 4329–4331.
20. Purification of laboratory chemicals, 3rd ed., Perrin DD and Armarego WLF. (Eds.) Pergamon Press: Oxford, 1988.
21. Lin CY, McGlashen ML, Hu S, Shim YK, Smith KM and Spiro TG. Inorg. Chim. Acta. 1996; 252: 179–184.
22. Hu S, Lin CY, Blackwood Jr. ME, Mukherjee A and Spiro TG. J. Phys. Chem. 1995; 99: 9694–9701.
23. Silvester DS, He W, Aldous L, Hardacre C and Richard GC, J. Phys. Chem. C. 2008; 112: 12966–12973.
24. Materials Studio. Accelrys Materials Studio, v 4.2, Accelrys Inc: San Diego, CA, 2006.
25. a) For the reviews: Kadish KM, Caemelbecke EV and Royal G. In The Porphyrin Handbook, Vol. 8, Kadish KM, Smith KM and Guilard G. (Eds.) Academic Press: New York, 2000. b) For the database of porphyrins redox potentials in nonaqueous media: Kadish KM, Royal G, Caemelbecke EV and Gueletti L. In The Porphyrin Handbook, Vol. 9, Kadish KM, Smith KM and Guilard G. (Eds.) Academic Press: New York, 2000.

Journal of Porphyrins and PhthalocyaninesJ. Porphyrins Phthalocyanines 2013; 17: 99–103
DOI: 10.1142/S1088424612501374
Published at http://www.worldscinet.com/jpp/
Copyright © 2013 World Scientific Publishing Company
INTRODUCTION
Zinc is a very common element in natural environment and the second most abundant transition metal in human body. It plays an important role in many biological processes. In fact, this element is vital for the functions of over 300 enzymes, stabilization of DNA, and gene expression [1, 2]. Therefore, development of novel sensors which can selectively detect Zn2+ ion in the environment has received considerable attention [3–6]. Among the various types of sensors, fluorescent sensors are of particular interest due to their high sensitivity and operational simplicity. For the application in biological systems, it is desirable that the probes can emit in the deep red or near-infrared region, ideally in the range of 650–900 nm, because of the combined virtues of good transmission, low auto-fluorescence, and deep tissue penetration in biological systems [7–8]. Silicon(IV) phthalocyanines are desirable candidates for this application because of their strong fluorescence emission at ca. 680 nm and ease of conjugation with various metal chelators to their axial positions. Phthalocyanine-based fluorescent sensors however remain little studied [9–11]. We report herein a novel silicon(IV) phthalocyanine with two axial bis(2-picolyl)amino (BPA) moieties, which are typical chelators for Zn2+ ion [12–15]. This compound responds remarkably toward Zn2+ ion in its fluorescent
spectrum, making it an interesting near-infrared fluorescent sensor for this important metal ion.
EXPERIMENTAL
General
All the reactions were performed under an atmosphere of nitrogen. Toluene and acetonitrile were distilled from sodium and calcium hydride, respectively. Chromatographic purifications were performed on silica gel (Macherey-Nagel, 70–230 mesh) columns with the indicated eluents. All other solvents and reagents were of reagent grade and used as received. The salts used for spectroscopic titration were Zn(ClO4)2·6H2O, Cd(ClO4)2·H2O, Hg(ClO4)2·3H2O, Cu(ClO4)2·6H2O, Pb(ClO4)2·3H2O, Mg(ClO4)2·6H2O, Ca(ClO4)2·4H2O, NaClO4, and KClO4. To show the effect of the counter anions, ZnCl2, Zn(CH3CO2)2, and ZnSO4·7H2O were also used. N,N-bis(2-picolyl)-2-amino ethanol was prepared as described [16].
1H and 13C{1H} NMR spectra were recorded on a Bruker DPX 300 spectrometer (1H, 300; 13C, 75.4 MHz) in CDCl3. Spectra were referenced internally using the residual solvent (1H: δ = 7.26) or solvent (13C: δ = 77.0) resonances relative to SiMe4. Electrospray ionization (ESI) mass spectra were measured on a Thermo Finnigan MAT 95 XL mass spectrometer. UV-vis and fluorescence spectra were recorded on a Cary 5G UV-vis-NIR spectrophotometer and a Hitachi F-4500 fluorescence spectrophotometer, respectively. The fluorescence
A phthalocyanine-based fluorescent sensor for Zn2+ ion
Hui He, Jian-Yong Liu and Dennis K.P. Ng*
Department of Chemistry, The Chinese University of Hong Kong, Shatin, N. T. Hong Kong, China
Received 9 July 2012Accepted 10 October 2012
ABSTRACT: This paper describes the preparation and spectral properties of a near-infrared fluorophore in which two bis(2-picolyl)amino moieties are axially linked to a silicon(IV) phthalocyanine core. The effects of various metal ions on its absorption and fluorescence spectra have been examined. The results indicate that this compound shows a high sensitivity and moderate selectivity toward Zn2+ ion.
KEYWORDS: near-infrared, fluorescent sensor, phthalocyanine, bis(2-picolyl)amine, zinc.
SPP full member in good standing
*Correspondence to: Dennis K. P. Ng, email :[email protected], tel : +852 3943-6375, fax : +852 2603-5057

100 H. HE ET AL.
Copyright © 2013 World Scientific Publishing Company J. Porphyrins Phthalocyanines 2013; 17: 100–103
quantum yields were determined by the equation: ΦF(sample) = (Fsample/Fref)(Aref/Asample)(nsample
2/nref2)ΦF(ref) [17], where F,
A, and n are the measured fluorescence (area under the emission peak), the absorbance at the excitation position, and the refractive index of the solvent, respectively. The unsubstituted zinc(II) phthalocyanine (ZnPc) in DMF was used as the reference [ΦF(ref) = 0.28] [18].
Synthesis
Preparation of phthalocyanine 1. A mixture of N,N-bis(2-picolyl)-2-aminoethanol (0.10 g, 0.41 mmol), silicon(IV) phthalocyanine dichloride (0.13 g, 0.21 mmol), and NaH (20 mg, 0.83 mmol) in toluene (10 mL) was refluxed for 6 h. The solvent was removed in vacuo and the residue was dissolved in dichloromethane. After filtration, the filtrate was dried in vacuo and the residue was subject to column chromatography using CHCl3/MeOH/triethyl amine (100:10:1) as the eluent. The greenish blue solid obtained was further purified by recrystallization from CH2Cl2/hexane (1:10) (26 mg, 12%). 1H NMR: δ, ppm 9.55–9.58 (m, 8 H, Pc-Hα), 8.31–8.34 (m, 8 H, Pc-Hβ), 7.97 (d, J = 4.5 Hz, 4 H, C5H4N), 6.88–6.93 (m, 4 H, C5H4N), 6.72–6.76 (m, 4 H, C5H4N), 5.50 (d, J = 7.5 Hz, 4 H, C5H4N), 1.93 (s, 8 H, NCH2), -0.35 (t, J = 4.5 Hz, 4 H, NCH2), -2.00 (t, J = 4.5 Hz, 4 H, OCH2).
13C{1H} NMR: δ, ppm 159.0, 149.2, 148.0, 135.8, 135.5, 130.9, 123.7, 121.3, 121.0, 58.7, 53.4, 53.2. MS (ESI): m/z isotopic clusters peaking at 782 {70%, [M - BPA]+} and 1047 {5%, [M + Na]+}. HRMS (ESI): m/z calcd. for C60H48N14NaO2Si [M + Na]+ 1047.3757; found 1047.3747.
RESULTS AND DISCUSSION
Phthalocyanine 1 was prepared readily by treating the commercially available silicon(IV) phthalocyanine
dichloride with 2-N,N-bis(2-picolyl)aminoethanol in the presence of NaH in toluene (Scheme 1). The compound was purified by silica gel column chromatography followed by recrystallization, and fully characterized with various spectroscopic methods.
The electronic absorption spectrum of 1 was recorded in MeCN. It showed a Soret band peaking at 353 nm, an intense and sharp Q-band at 672 nm, together with two vibronic bands at 604 and 640 nm. The Q-band strictly followed the Lambert Beer’s law showing that the compound is non-aggregated in MeCN (Fig. 1).
The changes in absorption spectrum of 1 in MeCN toward various metal ions were then examined and the results are shown in Fig. S1 (Supporting information). Upon addition of Zn2+, Cd2+, Hg2+, Mg2+, Ca2+, Na+, or
1
N
NN
OH
NaH, toluene N
NN
NN
NN
NSi
N
NN
O
N
NN
O12%
N
NN
NN
NN
NSi
Cl
Cl
Scheme 1. Synthesis of phthalocyanine 1
Fig. 1. Electronic absorption spectra of 1 in MeCN in different concentrations. The inset plots the Q-band absorbance versus the concentration of 1

A PHTHALOCYANINE-BASED FLUORESCENT SENSOR FOR ZN2+ ION 101
Copyright © 2013 World Scientific Publishing Company J. Porphyrins Phthalocyanines 2013; 17: 101–103
K+ ion (up to 15 equiv.), no significant change in the absorption spectrum was observed. However, addition of Cu2+ or Pb2+ ion induced a bathochromic shift of ca. 10 nm of the Q-band.
The fluorescence spectrum of 1 was also recorded in MeCN. It exhibited a weak fluorescence emission at ca. 680 nm as a result of partial reductive quenching of the singlet excited state of the phthalocyanine by the amino nitrogen atom of BPA. Upon addition of Zn2+ ion, the fluorescence intensity at 676 nm gradually increased and eventually reached a 5-fold enhancement when 15 equiv. of Zn2+ ion was added (Fig. 2). This can be attributed to the binding of Zn2+ ion by the BPA unit which inhibits the photoinduced electron transfer (PET) process. By using the data in the absence and at very low concentrations of Zn2+ ion, the detection limit was estimated to be 0.03 μM.
The binding stoichiometry of 1 and Zn2+ ion was examined by a Job’s plot of the fluorescence data (Fig. 3). The result indicated that 1 binds to Zn2+ ion in a 1:2 manner, which can be attributed to the presence of two BPA units in 1, each of them binds to a Zn2+ ion. The overall association constant K was determined by a 1:2 nonlinear least-squares analysis [19] of the change in fluorescence intensity with the concentration of Zn2+ ion (the inset of Fig. 2). The value was found to be (6.2 ± 0.9) × 1011 M-2. The 1:1 association constant between BPA and Zn2+ ion in a related system has been reported to be 2.34 × 10⁵ M-1 [20]. The determined value is therefore comparable with the literature value assuming that the two BPA units bind independently to Zn2+.
The response of the fluorescence spectrum of 1 toward other metal ions was also examined in MeCN (Fig. S2 in Supporting information). Both Cd2+ and Hg2+ ions could also enhance the fluorescence intensity of 1, but the effect was weaker compared with that of Zn2+ ion. The effect of Mg2+ and Ca2+ ions was even weaker, while Na+ and K+ ions
exerted virtually no effect on the fluorescence spectrum of 1. Addition of Cu2+ ion quenched the fluorescence effectively due to electron transfer. By contrast, addition of Pb2+ ion reduced the emission intensity at 676 nm and concomitantly induced a new emission band at 688 nm. Figure 4 shows the effects of all these metal ions. It can be seen clearly that Zn2+ ion induces the greatest fluorescence enhancement. Table 1 summarizes all these spectral data including the fluorescence enhancement factor (FEF) and the overall association constants of several systems, which could be determined by fitting the corresponding fluorescence data with a 1:2 binding equation [19]. It can be seen that the FEF generally increases as the binding constant between 1 and the metal ion increases.
To examine whether this probe can function in aqueous media, similar experiments were performed in H2O/MeCN (1:9 v/v). In this mixed solvent system, compound 1 could still be soluble and remained non-aggregated as shown by the sharp and intense Q-band, which obeyed the Lambert Beer’s law (Fig. S3 in Supporting information). Upon addition of Zn2+ ion (up to 15 equiv.), the absorption spectrum was essentially unchanged, while the fluorescence emission at 680 nm increased gradually (Figs S4 and S5 in Supporting information) as in neat MeCN, but the enhancement was about two-fold smaller. This is in accord with the smaller overall association constant [(4.1 ± 0.6) × 1011 vs. (6.2 ± 0.9) × 1011 in MeCN]. To examine whether the counter anions have effect on the binding, we also employed other zinc(II) salts, including ZnCl2, Zn(CH3CO2)2, and ZnSO4·7H2O. As shown in Fig. S6 (Supporting information), the effect was essentially negligible. The fluorescence response of 1 toward other metal ions was further investigated in this solvent system. It was found that the trend is very similar to that in neat MeCN in which Zn2+ ion exerts the greatest effect (Fig. S7 in Supporting information). Attempts were also made
Fig. 2. Change in fluorescence spectrum (excited at 610 nm) of 1 in MeCN (2 μM) upon addition of Zn2+ ion (0–30 μM). The inset plots the fluorescence intensity at 676 nm versus the concentration of Zn2+ ion, and the corresponding best-fit
Fig. 3. Job’s plot for the binding of 1 with Zn2+ ion by monitoring the fluorescence intensity at 676 nm. The total concentration of 1 and Zn2+ was fixed at 4 μM

102 H. HE ET AL.
Copyright © 2013 World Scientific Publishing Company J. Porphyrins Phthalocyanines 2013; 17: 102–103
to increase the water content for the measurements. As shown in Fig. 5, the fluorescence enhancement decreases as the water content increases. In H2O/MeCN (1:4 v/v), the fluorescence intensity at 681 nm could only be increased by one-fold upon addition of Zn2+ ion.
CONCLUSION
In summary, we have synthesized a BPA-appended silicon(IV) phthalocyanine which can serve as a fluorescent sensor for Zn2+ ion. The complexation leads to a 5-fold fluorescence enhancement in MeCN due to inhibition of the intramolecular PET process.
Supporting information
Change in electronic absorption and fluorescence spectra of 1 in MeCN upon addition of various metal ions,
Fig. 4. (a) Fluorescence spectra and (b) change in fluorescence intensity at 676 nm of 1 (2 μM) in the presence of various metal ions (30 μM) in MeCN
Table 1. Electronic absorption and fluorescence data for 1 in the absence and presence of 15 equiv. of various metal ions in MeCN
Compound λmax, nm (log ε) λema, nm ΦF
b FEF K, M-2
1 674 (5.31) 676 0.04 — —
1-Zn2+ 672 (5.32) 678 0.20 5 (6.2 ± 0.9) × 1011
1-Cd2+ 675 (5.30) 679 0.17 4.3 (4.3 ± 0.6) × 1011
1-Hg2+ 676 (5.29) 680 0.13 3.3 —
1-Mg2+ 673 (5.31) 678 0.06 1.5 (4.3 ± 1.0) × 109
1-Ca2+ 673 (5.31) 677 0.05 1.3 (1.4 ± 0.3) × 109
1-Na+ 672 (5.32) 676 0.04 1 —
1-K+ 672 (5.32) 676 0.04 1 —
1-Cu2+ 681 (5.25) 668 0.007 0.18 —
1-Pb2+ 685 (5.27) 689 0.016 0.4 —
a Excited at 610 nm. b Relative to ZnPc (ΦF = 0.28 in DMF).
Fig. 5. Change in fluorescence intensity at the emission maximum of 1 in different solvents (2 μM) with the concentration of Zn2+ ion

A PHTHALOCYANINE-BASED FLUORESCENT SENSOR FOR ZN2+ ION 103
Copyright © 2013 World Scientific Publishing Company J. Porphyrins Phthalocyanines 2013; 17: 103–103
absorption spectra of 1 in H2O/MeCN (1:9 v/v) in different concentrations, change in absorption and fluorescence spectra of 1 in H2O/MeCN (1:9 v/v) upon addition of Zn2+ ion, change in fluorescence intensity at 680 nm of 1 in H2O/MeCN (1:9 v/v) with the concentration of different Zn2+ salts, change in fluorescence spectrum and intensity at 680 nm of 1 with various metal ions in H2O/MeCN (1:9 v/v), and 1H and 13C{1H} NMR spectra of 1 in CDCl3 are given in the supplementary material (Figs S1–S9). This material is available free of charge via the Internet at http://www.worldscinet.com/jpp/jpp.shtml.
REFERENCES
1. Fraústo da Silva JJR and Williams RJP. The Biolog-ical Chemistry of the Elements (2nd edn), Oxford University Press: Oxford, 2001; pp 315–335.
2. Frassinetti S, Bronzetti G, Caltavuturo L, Cini M and Della Croce C. J. Environ. Pathol. Toxicol. Oncol. 2006; 25: 597–610.
3. Carol P, Sreejith S and Ajayaghosh A. Chem. Asian J. 2007; 2: 338–348.
4. Domaille DW, Que EL and Chang CJ. Nat. Chem. Biol. 2008; 4: 168–175.
5. Tomat E and Lippard SJ. Curr. Opin. Chem. Biol. 2010; 14: 225–230.
6. Xu ZC, Yoon J and Spring DR. Chem. Soc. Rev. 2010; 39: 1996–2006.
7. Hilderbrand SA and Weissleder R. Curr. Opin. Chem. Biol. 2010; 14: 71–79.
8. Kobayashi H, Ogawa M, Alford R, Choyke PL and Urano Y. Chem. Rev. 2010; 110: 2620–2640.
9. Liu XJ, Qi C, Bing T, Cheng XH and Shangguan DH. Anal. Chem. 2009; 81: 3699–3704.
10. Ishii K, Kubo K, Sakurada T, Komori K and Sakai Y. Chem. Commun. 2011; 47: 4932–4934.
11. Caglar Y, Gumrukcuoglu N, Saka ET, Ocak M, Kantekin H and Ocak U. J. Incl. Phenom. Marcocy-clic Chem. 2012; 72: 443–447.
12. Leevy WM, Gammon ST, Jiang H, Johnson JR, Maxwell DJ, Jackson EN, Marquez M, Piwnica-Worms D and Smith BD. J. Am. Chem. Soc. 2006; 128: 16476–16477.
13. You Y, Lee S, Kim T, Ohkubo K, Chae WS, Fuku-zumi S, Jhon GJ, Nam W and Lippard SJ. J. Am. Chem. Soc. 2011; 133: 18328–18342.
14. Ashokkumar P, Ramakrishnan VT and Ramamur-thy P. J. Phys. Chem. A 2011; 115: 14292–14299.
15. Lee PK, Law WHT, Liu HW and Lo KKW. Inorg. Chem. 2011; 50: 8570–8579.
16. Groves JT and Kady IO. Inorg. Chem. 1993; 32: 3868–3872.
17. Eaton DF. Pure Appl. Chem. 1988; 60: 1107–1114. 18. Scalise I and Durantini EN. Bioorg. Med. Chem.
2005; 13: 3037–3045. 19. de la Peña AM, Zung NJB and Warner IM. J. Phys.
Chem. 1991; 95: 3330–3334. 20. Ashokkumar P, Ramakrishnan VT and Ramamur-
thy P. J. Phys. Chem. A 2011; 115: 14292–14299.

Journal of Porphyrins and PhthalocyaninesJ. Porphyrins Phthalocyanines 2013; 17: 104–117
DOI: 10.1142/S1088424612501350
Published at http://www.worldscinet.com/jpp/
Copyright © 2013 World Scientific Publishing Company
INTRODUCTION
For many years, nitroglycerine and other organic nitrates have been used for treatment of cardiovascular disorders, particularly coronary heart diseases, heart failure and hypertension. Such drugs release nitric oxide (NO) by spontaneous decomposition or bioconversion. This key signaling molecule is involved in the regulation of a variety of biological and physiological processes in mammals including blood pressure control and neurotransmission via activating soluble guanylate cyclase (sGC) [1]. The enzyme is activated by NO which binds to the heme moiety in the regulatory domain. Formation of nitrosyl heme disrupts the axial bond with histidine 105, which leads to conformational changes in the structure of the enzyme causing a dramatic increase of its activity. The NO-activated enzyme catalyses the transformation of guanosine triphosphate (GTP) into cyclic guanosine monophosphate (cGMP), an increased level of cGMP results in vasodilatation and inhibition of platelet aggregation [2]. However, prolonged administration of NO-releasing drugs causes many unwanted side effects, and effectiveness of the therapy
decreases due to the growing tolerance [1]. Some new NO-independent activators of sGC have already been introduced and their action depends on the heme in the regulatory domain of the enzyme, similarly to NO [3].
Ignarro and coworkers showed that some corrin and tetrapyrrole compounds, in particular protoporphyrin IX (1, PPIX), strongly regulate sGC in in vitro studies, however not in vivo [4]. It was proposed that porphyrin 1 interacts with the regulatory domain of sGC causing its activation by replacing heme and inducing structural changes similar to those occurring after complexation to NO. It was also reported that the propionic acid groups of porphyrin 1 are crucial as they interact with tyrosine 135 and arginine 139 of sGC [5]. Dicyanocobinamide, another corrin activator discovered by Martin et al., unlike other sGC regulators interacts directly with the catalytic domain of sGC by a mechanism of activation which is still unknown [6].
Thanks to the existence of highly efficient dietary uptake system in mammals [7], vitamin B12 has been utilized as a delivery vehicle for several bioactive and imaging molecules [8]. In particular, bioconjugates of vitamin B12 have been recently used in efficient oral delivery of insulin [8(h),8(j)] as well as anti-cancer drugs [8(r)] and in cancer diagnostics [8(l),8(p)]. Since the uptake system involves a series of transport proteins, conjugates of vitamin B12 must be recognized by them.
Design and synthesis of protoporphyrin IX/vitamin B12
molecular hybrids via CuAAC reaction
Rafał Loska, Anita Janiga and Dorota Gryko*
Institute of Organic Chemistry, Polish Academy of Sciences, Kasprzaka 44/52, 01-224 Warsaw, Poland
Received 14 August 2012Accepted 15 October 2012
ABSTRACT: The design and synthesis of new molecular hybrids composed of protoporphyrin IX (PPIX) and vitamin B12 via copper catalyzed alkyne azide cycloaddition reaction is described. New, clickable aminoazide and aminoalkyne linkers were prepared and subsequently attached to PPIX (via vinyl group) and to vitamin B12 giving desired building blocks. Preliminary results showed that respective water soluble hybrids were formed under CuAAC reaction. Gratifyingly, Cu incorporation into the PPIX core was avoided, which was important for further biological studies.
KEYWORDS: CuAAC, click chemistry, azides, alkynes, vitamin B12, protoporphyrin IX, molecular hybrids.
SPP full member in good standing
*Correspondence to: Dorota Gryko, email: [email protected], tel: +48 22-343-2051, fax: +48 22-632-6681

DESIGN AND SYNTHESIS OF PROTOPORPHYRIN IX/VITAMIN B12 MOLECULAR 105
Copyright © 2013 World Scientific Publishing Company J. Porphyrins Phthalocyanines 2013; 17: 105–117
It has been shown that recognition of vitamin B12 by the proteins, involved in its uptake (haptocorrin, intrinsic factor and transcobalamin II (TC-II)), is not impaired only when it is modified at specific sites, such as 1) 5′-hydroxy group on the ribose unit, 2) the phosphate unit, and 3) the ε peripheral propionamide unit. In the B12-TC-II complex the “tail” of vitamin B12, containing ribose ring and phosphate group is the only part of the B12 molecule accessible for the solvent [7(b)].
We envisaged that vitamin B12 could also facilitate uptake of PPIX and as such increase its bioavailability. Therefore, a hybrid molecule [9] composed of PPIX and vitamin B12 moieties was designed. Herein, we describe the synthesis of linker molecules suitable for linking vitamin B12 to PPIX (1), the synthesis of “clickable” vitamin B12 and PPIX derivatives, and finally our attempts to prepare their water-soluble bioconjugates.
RESULTS AND DISCUSSION
Design of the molecular hybrids
PPIX and its analogs can regulate sGC activity via binding to the regulatory domain. It was postulated that PPIX binds to the NO-dependent heme binding site. Moreover, the propionic acid groups at positions 2 and 18 form electrostatic bonds with amino acids’ basic groups (for example arginine) and such interactions are critical for the enzyme activation [5]. Therefore, it would be optimal to incorporate PPIX into the hybrid molecule by linking it to vitamin B12 via meso-position or one of its vinyl groups. We chose the latter possibility as we thought that it would not affect binding of PPIX to the enzyme, and because methods for functionalization of PPIX at vinyl groups are known [10].
On the other hand, the role of vitamin B12 fragment would be to deliver the whole hybrid from the intestine to endothelium cells. Thus, it should be linked to PPIX in such a way that neither molecule obstructs each other and that does not interfere with vitamin B12 binding to proteins. We chose the 5 -OH group as it can be readily functionalized in a selective manner [8(b),8(p)]. The other option would involve the synthesis of ε-acid via mild statistical hydrolysis [7].
The final step that is connection of PPIX (1) to vitamin B12 derivative could be achieved using the copper-catalyzed azide alkyne cycloaddition reaction (CuAAC) [11], which has been already used in the preparation of various tetrapyrroles derivatives [12]. The designed approach required the synthesis of linkers with either terminal azide or alkyne moieties and on its other terminus the amino group allowing its attachment either to PPIX or vitamin B12 at positions specified above. The strategy is outlined in Fig. 1.
One potential difficulty with this method lay with the incorporation of copper into porphyrins which was very likely to occur under typical CuAAC conditions. Protection of the PPIX core by metalation with, for example, Zn would increase the number of synthetic steps and subsequent Zn removal, performed on the final hybrid, might be problematic. Therefore, we concentrated on finding such conditions for CuAAC under which Cu incorporation into the porphyrin core would be avoided.
Synthesis of aminoazide linkers
Various aminoazide linkers were synthesized starting either from terminal dibromides or ethylene glycols. Selective monosubstitution of terminal leaving groups in symmetrical 1,6-dibromohexane
N N
N N
CONH2
H2NOC
H2NOC
Co
CN CONH2
CONH2
NH
O
OP
O
O OO
HO N
OH
NCONH2
N
NH N
NH
HO2C
HO2C
L I N K E R N3
L I N K E R
CuAACPPIX (1)
vitamin B12 (2)
NH2
H2N
Fig. 1. The general strategy of preparation of molecular hybrids containing PPIX (1) and vitamin B12 (2)
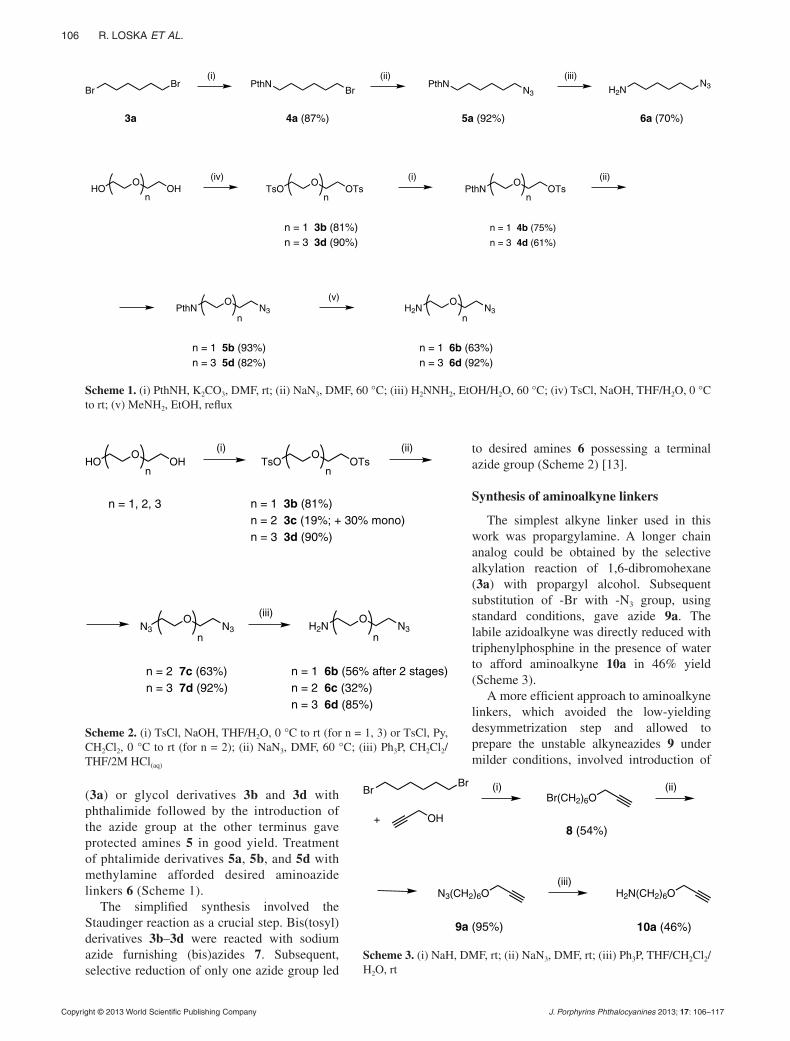
106 R. LOSKA ET AL.
Copyright © 2013 World Scientific Publishing Company J. Porphyrins Phthalocyanines 2013; 17: 106–117
(3a) or glycol derivatives 3b and 3d with phthalimide followed by the introduction of the azide group at the other terminus gave protected amines 5 in good yield. Treatment of phtalimide derivatives 5a, 5b, and 5d with methylamine afforded desired aminoazide linkers 6 (Scheme 1).
The simplified synthesis involved the Staudinger reaction as a crucial step. Bis(tosyl) derivatives 3b–3d were reacted with sodium azide furnishing (bis)azides 7. Subsequent, selective reduction of only one azide group led
to desired amines 6 possessing a terminal azide group (Scheme 2) [13].
Synthesis of aminoalkyne linkers
The simplest alkyne linker used in this work was propargylamine. A longer chain analog could be obtained by the selective alkylation reaction of 1,6-dibromohexane (3a) with propargyl alcohol. Subsequent substitution of -Br with -N3 group, using standard conditions, gave azide 9a. The labile azidoalkyne was directly reduced with triphenylphosphine in the presence of water to afford aminoalkyne 10a in 46% yield (Scheme 3).
A more efficient approach to aminoalkyne linkers, which avoided the low-yielding desymmetrization step and allowed to prepare the unstable alkyneazides 9 under milder conditions, involved introduction of
HOO
OHn
TsOO
OTsn
PthNO
OTsn
PthNO
N3n
H2NO
N3n
n = 1 4b (75%)
n = 3 4d (61%)
n = 1 3b (81%)n = 3 3d (90%)
n = 1 6b (63%)n = 3 6d (92%)
n = 1 5b (93%)n = 3 5d (82%)
BrBr PthN PthN N3
4a (87%) 5a (92%) 6a (70%)
H2NN3Br
(i) (ii) (iii)
(iv) (i) (ii)
(v)
3a
Scheme 1. (i) PthNH, K2CO3, DMF, rt; (ii) NaN3, DMF, 60 °C; (iii) H2NNH2, EtOH/H2O, 60 °C; (iv) TsCl, NaOH, THF/H2O, 0 °C to rt; (v) MeNH2, EtOH, reflux
HOO
OHn
TsOO
OTsn
N3O
N3n
H2NO
N3n
n = 2 7c (63%)n = 3 7d (92%)
n = 1 3b (81%)n = 2 3c (19%; + 30% mono)n = 3 3d (90%)
n = 1 6b (56% after 2 stages)n = 2 6c (32%)n = 3 6d (85%)
n = 1, 2, 3
(i) (ii)
(iii)
Scheme 2. (i) TsCl, NaOH, THF/H2O, 0 °C to rt (for n = 1, 3) or TsCl, Py, CH2Cl2, 0 °C to rt (for n = 2); (ii) NaN3, DMF, 60 °C; (iii) Ph3P, CH2Cl2/THF/2M HCl(aq)
Br
OH
Br(CH2)6O
H2N(CH2)6O
8 (54%)
10a (46%)
Br
N3(CH2)6O
9a (95%)
+
(i) (ii)
(iii)
Scheme 3. (i) NaH, DMF, rt; (ii) NaN3, DMF, rt; (iii) Ph3P, THF/CH2Cl2/H2O, rt
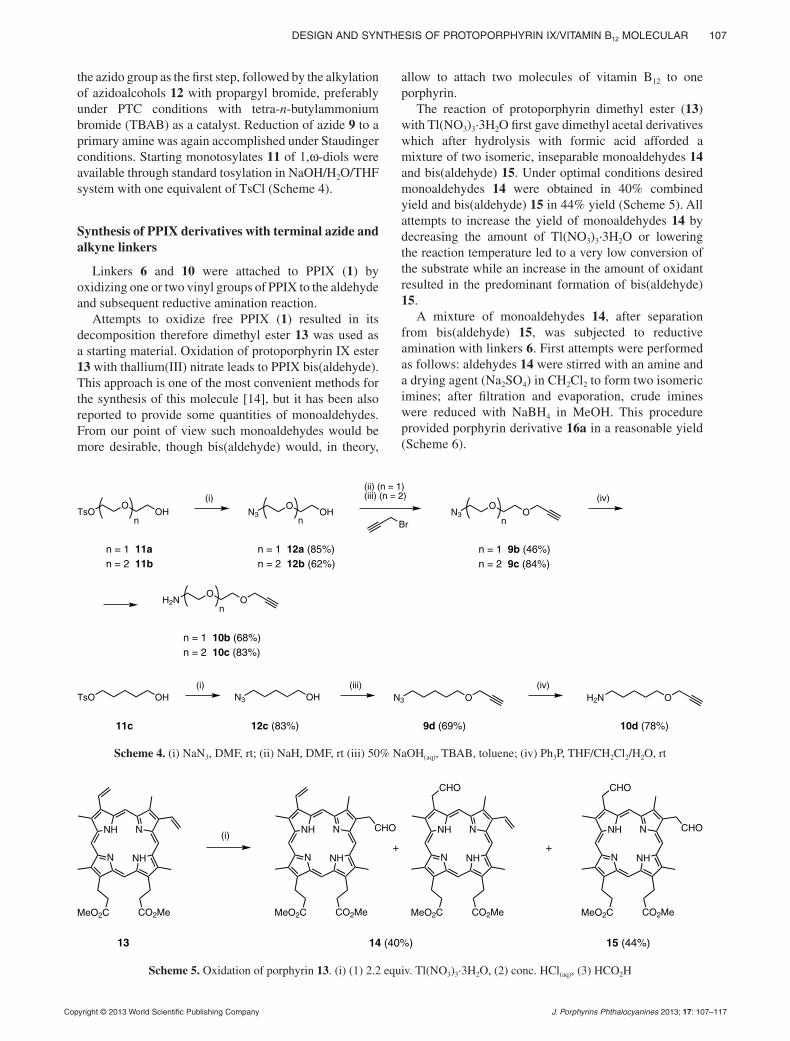
DESIGN AND SYNTHESIS OF PROTOPORPHYRIN IX/VITAMIN B12 MOLECULAR 107
Copyright © 2013 World Scientific Publishing Company J. Porphyrins Phthalocyanines 2013; 17: 107–117
the azido group as the first step, followed by the alkylation of azidoalcohols 12 with propargyl bromide, preferably under PTC conditions with tetra-n-butylammonium bromide (TBAB) as a catalyst. Reduction of azide 9 to a primary amine was again accomplished under Staudinger conditions. Starting monotosylates 11 of 1,ω-diols were available through standard tosylation in NaOH/H2O/THF system with one equivalent of TsCl (Scheme 4).
Synthesis of PPIX derivatives with terminal azide and alkyne linkers
Linkers 6 and 10 were attached to PPIX (1) by oxidizing one or two vinyl groups of PPIX to the aldehyde and subsequent reductive amination reaction.
Attempts to oxidize free PPIX (1) resulted in its decomposition therefore dimethyl ester 13 was used as a starting material. Oxidation of protoporphyrin IX ester 13 with thallium(III) nitrate leads to PPIX bis(aldehyde). This approach is one of the most convenient methods for the synthesis of this molecule [14], but it has been also reported to provide some quantities of monoaldehydes. From our point of view such monoaldehydes would be more desirable, though bis(aldehyde) would, in theory,
allow to attach two molecules of vitamin B12 to one porphyrin.
The reaction of protoporphyrin dimethyl ester (13) with Tl(NO3)3·3H2O first gave dimethyl acetal derivatives which after hydrolysis with formic acid afforded a mixture of two isomeric, inseparable monoaldehydes 14 and bis(aldehyde) 15. Under optimal conditions desired monoaldehydes 14 were obtained in 40% combined yield and bis(aldehyde) 15 in 44% yield (Scheme 5). All attempts to increase the yield of monoaldehydes 14 by decreasing the amount of Tl(NO3)3·3H2O or lowering the reaction temperature led to a very low conversion of the substrate while an increase in the amount of oxidant resulted in the predominant formation of bis(aldehyde) 15.
A mixture of monoaldehydes 14, after separation from bis(aldehyde) 15, was subjected to reductive amination with linkers 6. First attempts were performed as follows: aldehydes 14 were stirred with an amine and a drying agent (Na2SO4) in CH2Cl2 to form two isomeric imines; after filtration and evaporation, crude imines were reduced with NaBH4 in MeOH. This procedure provided porphyrin derivative 16a in a reasonable yield (Scheme 6).
TsOO
OH N3O
OH N3O
O
H2NO
O
n = 1 12a (85%)n = 2 12b (62%)
n = 1 9b (46%)n = 2 9c (84%)
n = 1 10b (68%)n = 2 10c (83%)
n
n = 1 11an = 2 11b
n n
n
TsO OH N3 OH N3 O H2N O
12c (83%) 9d (69%) 10d (78%)
(i)(ii) (n = 1)(iii) (n = 2) (iv)
(i) (iii) (iv)
Br
11c
Scheme 4. (i) NaN3, DMF, rt; (ii) NaH, DMF, rt (iii) 50% NaOH(aq), TBAB, toluene; (iv) Ph3P, THF/CH2Cl2/H2O, rt
N NH
NNH
CO2MeMeO2C
14 (40%) 15 (44%)
(i)
N NH
NNH
CO2MeMeO2C
CHO
N NH
NNH
CO2MeMeO2C
CHO
CHO
N NH
NNH
CO2MeMeO2C
CHO
+ +
13
Scheme 5. Oxidation of porphyrin 13. (i) (1) 2.2 equiv. Tl(NO3)3·3H2O, (2) conc. HCl(aq), (3) HCO2H

108 R. LOSKA ET AL.
Copyright © 2013 World Scientific Publishing Company J. Porphyrins Phthalocyanines 2013; 17: 108–117
However, the above procedure did not work well with linkers other than 6a and even in that case, the yields were not reproducible. A much more reliable protocol employed NaBH3CN as a reducing agent (Scheme 7) [15].
PPIX aldehydes 14 and 15 are moderately stable and their separation was troublesome. For these reasons, in terms of yield, as well as the number of laboratory operations needed and solvents and materials used, the overall efficiency of the synthesis of “clickable” porphyrin building blocks was further improved. When PPIX aldehydes 14 and 15 were not separated and purified, but instead the crude reaction mixture after oxidation and hydrolysis was used directly in the reductive amination reaction the overall yield increased. Using this protocol several PPIX derivatives of type 16 and 17 were obtained, containing both azide and acetylene linkers (Scheme 8).
Overall yields, based on ester 13, were moderate, but they include 3 reaction steps: oxidation, cleavage of the acetal and reductive amination. Unlike aldehydes 14 and 15, products 16 and 17 were reasonably stable and could be fairly easily separated from each other and characterized. Regioisomers of porphyrins 16 containing one linker and one vinyl group could not be separated. In some cases product 17 with two linkers was not even
observed. Its yield could be increased by using 3.3 equivalents of Tl(NO3)3·3H2O instead of 2.2.
Other methods of attaching linkers to PPIX (1) through its vinyl groups were considered as well, but they proved unsuccessful or inefficient. Alkene metathesis reaction of ester 13 or its zinc complex with Cbz-protected 8-amino-1-octene gave only traces of unidentified product while the Wittig reaction of a mixture of aldehydes 14 and 15 with an ylide stabilized with an amide group led to the decomposition of the starting material.
Preparation of vitamin B12 derivatives with azide and alkyne linkers at 5’ position
Linker molecules were attached to the 5′ hydroxyl group of the ribose ring of vitamin B12 using the well-established methodology of
carbamate formation mediated by carbonyldiimidazole (CDI) or carbonylditriazole (CDT) [8(b),(p)]. In the first reaction propargylamine and aminoalkyne 10c gave derivatives 18a and b in 35 and 38% yield respectively. A similar reaction of 10c but using CDT instead of CDI gave 82% of 18b. Therefore, the former coupling reagent was used in other examples of azide- and alkyne-functionalized vitamins 18 (Scheme 9).
These new derivatives 18 were easily separated from small-molecule organic compounds (mainly DMSO after the reaction) by precipitation from a mixture of Et2O with CHCl3 or CH2Cl2 [8(p)] and washing with Et2O. Further purification involved reverse-phase chromatography and then another precipitation and washing with Et2O. Purity of amines 18 was confirmed using reverse-phase HPLC. 1H NMR and HPLC proved that the reaction was selective at the 5’ primary hydroxyl group (products of the reaction with 2′ hydroxyl were not observed).
Attempted synthesis of hybrid molecules
The first attempt of the CuAAC reaction of porphyrin azide 16b with vitamin B12 derived alkyne 18c (Scheme 10) was performed under standard conditions: CuSO4·5H2O, sodium ascorbate, TBTA (tris[(1-benzyl-1H-1,2,3-triazol-4-yl)methyl]amine), t-BuOH/H2O [11(a)]. The
N HN
NNH
CO2MeMeO2C
CHO
N HN
NNH
CO2MeMeO2C
HN
(+ the other regioisomer)
N3
N HN
NNH
CO2MeMeO2C
N
N3
(i) (ii)
16a (41%)14
Scheme 6. Reductive amination of PPIX monoaldehydes 14. (i) 6a, Na2SO4, CH2Cl2; (ii) NaBH4, CH2Cl2/MeOH, 0 °C to rt
O N3H2N
H2NN3H2NR =
16b (25%)
+
16a (80%)
(i)
N NH
NNH
CO2MeMeO2C
NHR
N NH
NNH
CO2MeMeO2C
NHR
14
Scheme 7. Reductive amination of PPIX monoaldehydes 14. (i) RNH2, NaBH3CN, AcOH, MeCN
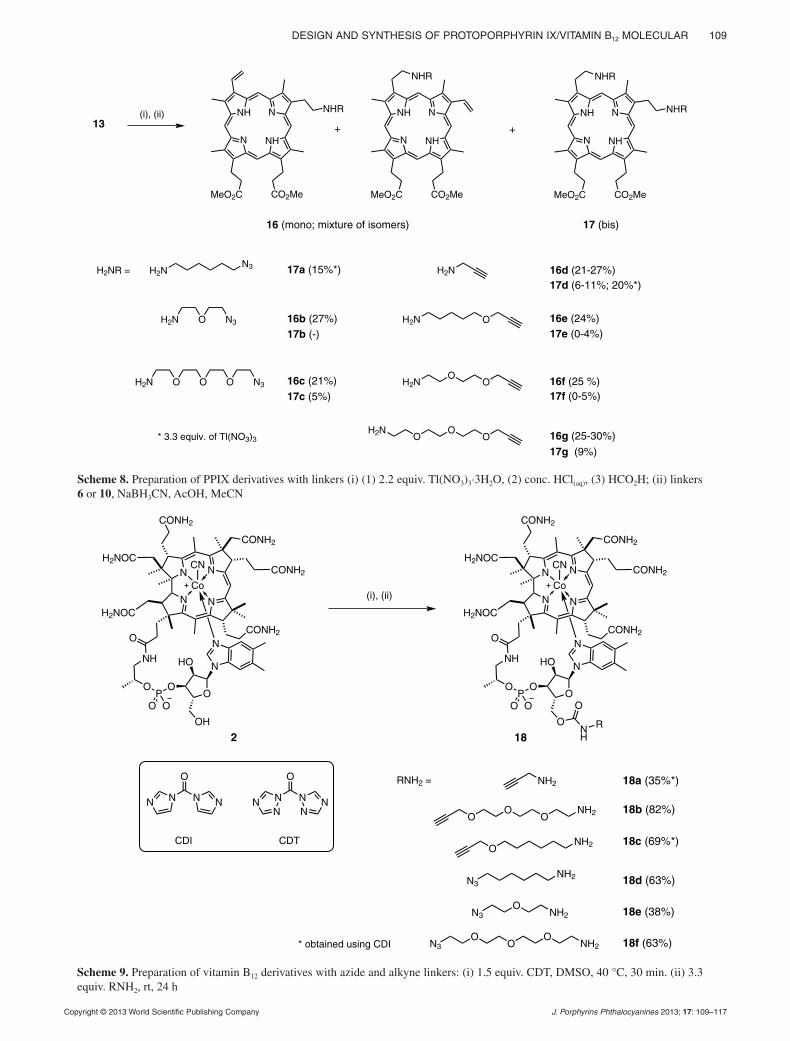
DESIGN AND SYNTHESIS OF PROTOPORPHYRIN IX/VITAMIN B12 MOLECULAR 109
Copyright © 2013 World Scientific Publishing Company J. Porphyrins Phthalocyanines 2013; 17: 109–117
O O OH2N N3
O N3H2N
H2NN3 H2NH2NR = 17a (15%*)
16b (27%) OH2N
+ +
17e (0-4%)16e (24%)
17b (-)
OO
H2N 16f (25 %)17f (0-5%)
* 3.3 equiv. of Tl(NO3)3
16d (21-27%)
16c (21%)
17c (5%)
OO
OH2N 16g (25-30%)
17d (6-11%; 20%*)
(i), (ii)
N NH
NNH
CO2MeMeO2C
NHR
N NH
NNH
CO2MeMeO2C
NHR
N NH
NNH
CO2MeMeO2C
NHR
NHR
13
16 (mono; mixture of isomers) 17 (bis)
17g (9%)
Scheme 8. Preparation of PPIX derivatives with linkers (i) (1) 2.2 equiv. Tl(NO3)3·3H2O, (2) conc. HCl(aq), (3) HCO2H; (ii) linkers 6 or 10, NaBH3CN, AcOH, MeCN
N N
N N
CONH2
H2NOC
H2NOC
Co
CN CONH2
CONH2
NH
O
OP
O
O OO
HO N
OH
NCONH2
(i), (ii)
N N
N N
CONH2
H2NOC
H2NOC
Co
CN CONH2
CONH2
NH
O
OP
O
O OO
HO N
O
NCONH2
O
NH
R
RNH2 = NH2
ONH2
18a (35%*)
18c (69%*)
18b (82%)O
OO
NH2
N3NH2
N3O
OO
NH2
18d (63%)
18f (63%)
O
NNN N
O
NNNN N
N
CDI CDT
18e (38%)N3O
NH2
* obtained using CDI
2 18
Scheme 9. Preparation of vitamin B12 derivatives with azide and alkyne linkers: (i) 1.5 equiv. CDT, DMSO, 40 °C, 30 min. (ii) 3.3 equiv. RNH2, rt, 24 h
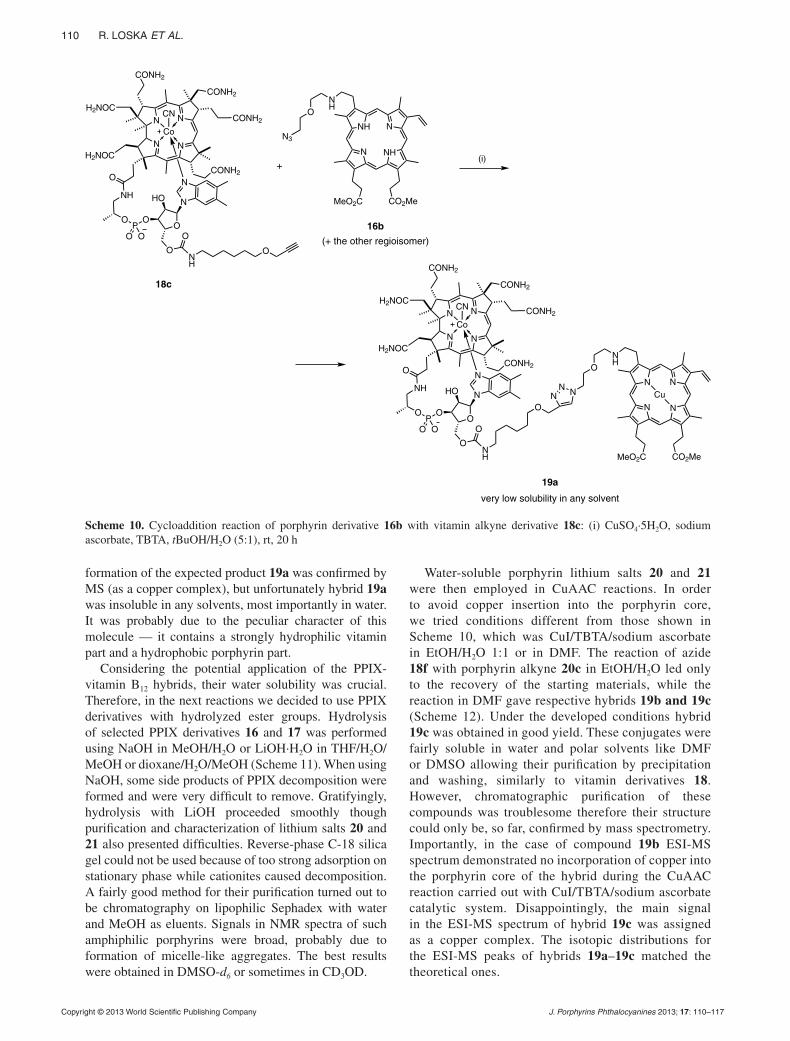
110 R. LOSKA ET AL.
Copyright © 2013 World Scientific Publishing Company J. Porphyrins Phthalocyanines 2013; 17: 110–117
formation of the expected product 19a was confirmed by MS (as a copper complex), but unfortunately hybrid 19a was insoluble in any solvents, most importantly in water. It was probably due to the peculiar character of this molecule — it contains a strongly hydrophilic vitamin part and a hydrophobic porphyrin part.
Considering the potential application of the PPIX-vitamin B12 hybrids, their water solubility was crucial. Therefore, in the next reactions we decided to use PPIX derivatives with hydrolyzed ester groups. Hydrolysis of selected PPIX derivatives 16 and 17 was performed using NaOH in MeOH/H2O or LiOH·H2O in THF/H2O/MeOH or dioxane/H2O/MeOH (Scheme 11). When using NaOH, some side products of PPIX decomposition were formed and were very difficult to remove. Gratifyingly, hydrolysis with LiOH proceeded smoothly though purification and characterization of lithium salts 20 and 21 also presented difficulties. Reverse-phase C-18 silica gel could not be used because of too strong adsorption on stationary phase while cationites caused decomposition. A fairly good method for their purification turned out to be chromatography on lipophilic Sephadex with water and MeOH as eluents. Signals in NMR spectra of such amphiphilic porphyrins were broad, probably due to formation of micelle-like aggregates. The best results were obtained in DMSO-d6 or sometimes in CD3OD.
Water-soluble porphyrin lithium salts 20 and 21 were then employed in CuAAC reactions. In order to avoid copper insertion into the porphyrin core, we tried conditions different from those shown in Scheme 10, which was CuI/TBTA/sodium ascorbate in EtOH/H2O 1:1 or in DMF. The reaction of azide 18f with porphyrin alkyne 20c in EtOH/H2O led only to the recovery of the starting materials, while the reaction in DMF gave respective hybrids 19b and 19c (Scheme 12). Under the developed conditions hybrid 19c was obtained in good yield. These conjugates were fairly soluble in water and polar solvents like DMF or DMSO allowing their purification by precipitation and washing, similarly to vitamin derivatives 18. However, chromatographic purification of these compounds was troublesome therefore their structure could only be, so far, confirmed by mass spectrometry. Importantly, in the case of compound 19b ESI-MS spectrum demonstrated no incorporation of copper into the porphyrin core of the hybrid during the CuAAC reaction carried out with CuI/TBTA/sodium ascorbate catalytic system. Disappointingly, the main signal in the ESI-MS spectrum of hybrid 19c was assigned as a copper complex. The isotopic distributions for the ESI-MS peaks of hybrids 19a–19c matched the theoretical ones.
N NH
NNH
CO2MeMeO2C
N N
N N
CONH2
H2NOC
H2NOC
Co
CN CONH2
CONH2
NH
O
OP
O
O OO
HO N
O
NCONH2
O
NH
+(i)
O
N3
ONH
very low solubility in any solvent
N N
NN
CO2MeMeO2C
N N
N N
CONH2
H2NOC
H2NOC
Co
CN CONH2
CONH2
NH
O
OP
O
O OO
HO N
O
NCONH2
O
NH
O
N
NH
O
NN Cu
(+ the other regioisomer)
18c
16b
19a
Scheme 10. Cycloaddition reaction of porphyrin derivative 16b with vitamin alkyne derivative 18c: (i) CuSO4·5H2O, sodium ascorbate, TBTA, tBuOH/H2O (5:1), rt, 20 h

DESIGN AND SYNTHESIS OF PROTOPORPHYRIN IX/VITAMIN B12 MOLECULAR 111
Copyright © 2013 World Scientific Publishing Company J. Porphyrins Phthalocyanines 2013; 17: 111–117
21d (82%)
16c, e
N NH
NNH
CO2LiLiO2C
R
NHOH2N 20c (56%)
N NH
NNH
CO2MeMeO2C
R
NHRNH2 =
N3O
OO
H2N 20e (76%)
N NH
NNH
CO2MeMeO2C
NH
N NH
NNH
CO2LiLiO2C
NH
NH
NH
17d
(i)
(ii)
OO
H2N 20f (51%)
Scheme 11. Hydrolysis of the ester groups in PPIX derivatives 16, 17. (i) LiOH . H2O, dioxane/H2O/MeOH; (ii) LiOH . H2O, THF/H2O/MeOH
18e
19b
(i)HN
ON NH
NNH
CO2LiLiO2C
N N
N N
CONH2
H2NOC
H2NOC
Co
CN CONH2
CONH2
NH
O
OP
O
O OO
HO N
NCONH2
NH
O
OO
O
O
NN
N
N N
N N
CONH2
H2NOC
H2NOC
Co
CN CONH2
CONH2
NH
O
OP
O
O OO
HO N
NCONH2
NH
O
OO
N
N N
HN
OO
N NH
NNH
CO2LiLiO2C 19c
20f+
18f
(i)
20c+
Scheme 12. Cycloaddition reactions. (i) CuI, TBTA, sodium ascorbate, DMF, rt

112 R. LOSKA ET AL.
Copyright © 2013 World Scientific Publishing Company J. Porphyrins Phthalocyanines 2013; 17: 112–117
EXPERIMENTAL
General information
Analytical grade solvents were used as received. All reagents were purchased from Sigma Aldrich or POCH. 1H and 13C NMR spectra were recorded at rt on Bruker or Varian 500 MHz with TMS as an internal standard. DCVC (dry column vacuum chromatography) was performed using Merck Silica Gel (200–300 mesh). Analytical thin layer chromatography (TLC) was performed using Merck Silica Gel GF254, 0.20 mm thickness and preparative TLC on Merck Silica Gel 60, 1 mm thickness. Chromatographic purification of water-soluble compounds was performed of LiChroprep RP-18 gel or Lipophilic Sephadex LH-20. High resolution ESI mass spectra were recorded on a Mariner spectrometer. UV-vis absorption spectra were recorded in DCM on a Perkin Elmer -25.
Synthesis of PPIX derivatives with terminal azide and alkyne linkers
Oxidation of porphyrin (13) — preparation of PPIX adehydes 14 and 15 [14]. To a 250 mL round-bottom flask porphyrin 13 (0.542 mmol, 320 mg) and CH2Cl2 (120 mL) were added under an argon atmosphere. The mixture was heated to 43 °C and a solution of Tl(NO3)3·3H2O (1.19 mmol, 530 mg) in MeOH (25 mL) was added in one portion with vigorous stirring of the reaction mixture. After 15 min (monitoring by TLC – 1% MeOH in CH2Cl2) the reaction mixture was cooled (cold water bath) and filtered through a pad of cotton. Conc. HCl(aq) (2 mL) was added to the filtrate and it was stirred vigorously. After about five minutes solid Na2CO3 and Na2SO4 were added and then the solution was filtered and evaporated. The residue (a mixture of dimethyl acetals of porphyrin) was dissolved in 85% formic acid (about 100 mL) and stored overnight at 0 °C or stirred at rt for 2 h. The acidic solution was then diluted with an equal amount of brine and extracted with CH2Cl2 (3 × 100 mL). The combined organic layers were washed with water (2 × 150 mL) and brine (150 mL), dried over a mixture of Na2CO3 (or K2CO3) and Na2SO4, filtrated and concentrated.
A mixture of PPIX monoaldehydes 14 was separated from bis(aldehyde) 15 by column chromatography on SiO2 using 2–5% MeOH/CH2Cl2.
Monoaldehydes 14 [14]. Yield 40%. 1H NMR (200 MHz; CDCl3; Me4Si): δH, ppm -3.84 (2H, bs), 3.27 (4H, t, 3JHH = 7.8 Hz), 3.45–3.65 (9H, m), 3.65–3.80 (9H, m), 4.38 (4H, m), 4.98 (2H, s), 6.18 (1H, d, 3JHH = 10.9 Hz), 6.36 (1H, d, 3JHH = 17.8 Hz), 8.25 (1H, dd, 3JHH = 17.1 Hz, 11.8 Hz), 9.80 (1H, s), 10.0 (2H, s), 10.1 (1H, s), 10.2 (1H, s).
Bis(aldehyde) 15 [14]. Yield 44%. 1H NMR (200 MHz; CDCl3; Me4Si): δH, ppm -3.82 (2H, bs), 3.27 (4H,
m), 3.57 (3H, s), 3.59 (6H, s), 3.61 (3H, s), 3.65 (6H, s), 4.39 (4H, t, 3JHH = 7.8 Hz), 5.02 (4H, s), 9.85 (2H, s), 10.0 (1H, s), 10.1 (1H, s), 10.2 (2H, s).
Reductive amination of PPIX aldehydes. A mixture of 14 and 15 (crude, obtained from 0.542 mmol of 13) was dissolved in acetonitrile (75 mL) followed by the addition of acetic acid (250 μl) under an argon atmosphere. Then, over a 15–20 min time period a solution of primary amine (2.71 mmol) in MeCN (5 mL) and AcOH (250 μL) was added dropwise, simultaneously with portionwise addition of NaBH3CN (8.24 mmol, 511 mg). After 1 h of stirring, the reaction mixture was diluted with chloroform (c.a. 100 mL) and washed with water (3 × 100 mL) and saturated Na2CO3(aq) (50 mL), dried over Na2SO4 and evaporated. The products were separated using chromatography on silica gel starting with 1-2% MeOH in CH2Cl2 up to 33% MeOH. Each product was then further purified on a new column or by using a preparative SiO2 TLC plate.
Porphyrin 16a. Yield 80%. IR (KBr): νmax, cm-1 3311, 2924, 2857, 2688, 2091, 1733, 1434, 1361, 1194, 1162, 1105, 906, 833, 726, 676. HRMS (ESI): calcd. for C42H53N8O4 ([M + H]+) 733.4184, found 733.4190. 1st isomer: 1H NMR (500 MHz; CDCl3; Me4Si): δH, ppm -4.62 (2H, bs), 0.86 (2H, m), 0.95–1.32 (6H, m), 2.91 (4H, m), 3.16 (4H, m), 3.40 (8H, m), 3.63 (3H, s), 3.64 (9H, s), 4.16–4.33 (6H, m), 6.02 (1H, dm, 3JHH = 10.5 Hz), 6.16 (1H, dm, 3JHH = 18 Hz), 7.96 (1H, dd, 3JHH = 17.2 Hz, 11.5 Hz), 9.33–9.80 (4H, m). 13C NMR (125 MHz, CDCl3; Me4Si): δC, ppm 11.7, 11.4, 11.5, 12.5, 21.6, 21.7, 26.2, 26.4, 28.4, 29.6, 31.4, 31.9, 36.8, 36.8, 48.3, 48.4, 51.0, 51.7, 95.8, 96.1, 96.3, 96.7, 97.0, 97.1, 120.1, 120.2, 130.1, 136.5 (bm), 173.5, 173.5. 2nd isomer: 1H NMR (500 MHz, CDCl3): δH, ppm -4.62 (2H, bs), 0.86 (2H, m), 0.95–1.32 (6H, m), 2.91 (4H, m), 3.16 (4H, m), 3.40 (8H, m), 3.63 (3H, s), 3.64 (9H, s), 4.16–4.33 (6H, m), 6.04 (1H, dm, 3JHH = 9.4 Hz), 6.20 (1H, dm, 3JHH = 18.4 Hz), 7.96 (1H, dd, 3JHH = 18.1 Hz, 12.0 Hz), 9.33–9.80 (4H, m). 13C NMR (125 MHz; CDCl3; Me4Si): δC, ppm 11.7, 11.4, 11.6, 12.6, 21.6, 21.7, 26.2, 26.4, 28.5, 29.7, 31.4, 31.9, 36.8, 36.8, 48.3, 48.4, 51.0, 51.7, 95.8, 96.1, 96.3, 96.7, 97.0, 97.1, 120.1, 120.2, 130.1, 136.5 (bm), 173.5, 173.5.
Porphyrin 17a. Yield 15%. IR (KBr): νmax, cm-1 3445, 3311, 2934, 2858, 2326, 2092, 1732, 1435, 1362, 1259, 1195, 1164, 1105, 835, 726, 676. HRMS (ESI): calcd. for C48H67N12O4 ([M + H]+) 875.5403, found 875.5394. 1H NMR (600 MHz; CDCl3; Me4Si): δH, ppm -3.98 (2H, bs), 1.28–1.38 (8H, m), 1.48 (4H, m), 1.59 (4H, m), 2.60 (8H, m), 3.10 (8H, m), 3.25 (4H, m, 3JHH = 8.4 Hz), 3.46 (3H, s), 3.48 (3H, s), 3.54 (3H, s), 3.55 (3H, s), 3.64 (3H, s), 3.66 (3H, s), 3.98 (2H, t, 3JHH = 7.8 Hz), 4.05 (2H, t, 3JHH = 8.0 Hz), 4.34 (4H, m), 9.84 (1H, s), 9.90 (1H, s), 9.91 (1H, s), 9.99 (1H, s). 13C NMR (150 MHz; CDCl3;
Me4Si): δC, ppm 11.6, 11.6, 11.6, 21.8, 24.1, 24.2, 26.6, 26.7, 27.1, 27.1, 27.2, 27.2, 28.7, 28.8, 36.9, 42.4, 42.4, 51.3, 51.7, 51.7, 57.5, 57.6, 59.8, 59.9.

DESIGN AND SYNTHESIS OF PROTOPORPHYRIN IX/VITAMIN B12 MOLECULAR 113
Copyright © 2013 World Scientific Publishing Company J. Porphyrins Phthalocyanines 2013; 17: 113–117
Porphyrin 16b. Yield 27%. IR (film): νmax, cm-1 3686, 3600, 3474, 2953, 2110, 1734, 1606, 1438, 1171, 841, 680. HRMS (ESI): calcd. for C40H49N8O5 ([M + H]+) 721.3820, found 721.3856. UV-vis (CH2Cl2): λmax, nm (log ε) 404 (5.16), 502 (3.98), 536 (3.95), 570 (3.87), 625 (3.49). 1st isomer: 1H NMR (500 MHz; CDCl3; Me4Si): δH, ppm -3.84 (2H, bs), 2.99 (2H, m), 3.11 (2H, m), 3.27 (4H, m), 3.45–3.54 (4H, m), 3.54–3.60 (6H, m), 3.61–3.64 (6H, m), 3.65–3.70 (8H, m), 4.21 (2H, m), 4.39 (4H, m), 6.16 (1H, dm, 3JHH = 11.6 Hz), 6.34 (1H, dm, 3JHH = 17.7 Hz), 8.26 (1H, dd, 3JHH = 17.8 Hz, 11.4 Hz), 9.99 (1H, s), 10.02 (1H, s), 10.06 (1H, s), 10.16 (1H, s). 2nd isomer: 1H NMR (500 MHz, CDCl3): δH, ppm -3.84 (2H, bs), 2.99 (2H, m), 3.11 (2H, m), 3.27 (4H, m), 3.45–3.54 (4H, m), 3.54–3.60 (6H, m), 3.61–3.64 (6H, m), 3.65–3.70 (8H, m), 4.21 (2H, m), 4.39 (4H, m), 6.16 (1H, dm, 3JHH = 11.6 Hz), 6.34 (1H, dm, 3JHH = 17.7 Hz), 8.25 (1H, dd, 3JHH = 17.7 Hz, 11.7 Hz), 10.00 (1H, m), 10.03 (2H, s), 10.06 (1H, s), 10.12 (1H, s).
Porphyrin 16c. Yield 21%. HRMS (ESI): m/z calcd. for C44H57N8O7 ([M + H]+) 809.4345, found 809.4326. 1H NMR (500 MHz; CDCl3; Me4Si): δH, ppm -4.16 (2H, bs), 2.88 (2H, m), 2.94 (4H, m), 3.04 (2H, m), 3.10 (2H, m), 3.24 (4H, t, 3JHH = 7.6 Hz), 3.36 (4H, m), 3.42 (2H, m), 3.52 (3H, s), 3.55 (5H, m), 3.59 (3H, s), 3.65 (3H, s), 3.66 (3H, s), 3.67 (3H, s), 4.03 (2H, m), 4.34 (4H, m), 6.13 (1H, m), 6.28 (1H, d, 3JHH = 17.7 Hz, 1st isomer), 6.31 (1H, d, 3JHH = 2nd isomer), 8.15 (1H, dd, 3JHH = 18.0 Hz, 11.5 Hz, 1st isomer), 8.19 (1H, dd, 3JHH = 17.8 Hz, 11.5 Hz, 2nd isomer), 9.74–9.83 (2H, m), 9.87–10.05 (2H, m). 1st isomer: 13C NMR (125 MHz, CDCl3; Me4Si): δC, ppm 11.5, 11.5, 11.6, 11.6, 21.8, 36.9, 50.2, 51.5, 51.7, 69.4, 69.7, 69.9, 69.9, 70.0, 70.2, 96.0, 96.3, 97.0, 97.4, 120.4, 130.4, 136.2 (m), 137.4 (m), 173.5, 173.6. 2nd isomer: 13C NMR (125 MHz; CDCl3; Me4Si): δC, ppm 11.5, 11.6, 11.6, 11.8, 21.7, 36.8, 50.2, 51.4, 51.7, 69.4, 69.7, 69.9, 69.9, 70.1, 70.2, 96.0, 96.4, 96.9, 97.4, 120.4, 130.4, 136.2 (m), 137.4 (m), 173.5, 173.6. Anal. calcd. for C44H56N8O7·1.5H2O: C, 63.22; H, 7.11; N, 13.40%. Found: C, 63.15; H, 7.11; N, 13.20%. Anal. calcd. for C44H56N8O7·2H2O: C, 62.54; H, 7.16; N, 13.26%. Found: C, 62.63; H, 7.24; N, 13.42%.
Porphyrin 17c. Yield 5%. MS (ESI): m/z 514.4 ([M + 2H]2+), 1027.7 ([M + H]+). 1H NMR (400 MHz; CDCl3;
Me4Si): δH, ppm -3.78 (2H, bs), 3.02 (4H, m), 3.07, (8H, m), 3.14 (4H, m), 3.20 (4H, m), 3.29 (8H, m), 3.35–3.56 (12H, m), 3.67 (18H, m), 4.28 (4H, m), 4.43 (4H, m), 10.10 (2H, m), 10.12 (2H, m).
Porphyrin 16d. Yield 27%. IR (KBr): νmax, cm-1 3309, 2946, 2910, 1732, 1614, 1434, 1361, 1226, 1195, 1162, 1107, 905, 832, 725, 677. UV-vis (CH2Cl2): λmax, nm (log ε) 331 (3.68), 404 (4.65), 502 (3.41), 537 (3.41), 570 (3.39), 602 (2.92), 626 (2.92). HRMS (ESI): calcd. for C39H44N5O4 ([M + H]+) 646.3388, found 646.3383. 1H NMR (500 MHz, DMSO-d6, Me4Si): δH, ppm -4.08 (2H, s), 3.11 (1H, m), ~3.30 (4H, m), 3.45 (2H, t, 3JHH
= 7.6 Hz), 3.53–3.64 (20H, m), 3.67 (2H, s, 1st isomer), 3.70 (2H, s, 2nd isomer), 4.21 (2H, m), 4.28–4.42 (4H, m), 6.17 (1H, d, 3JHH = 11.5 Hz, 1st isomer), 6.18 (1H, d, 3JHH = 11.6 Hz, 2nd isomer), 6.39 (1H, d, 3JHH = 17.7 Hz, 1st isomer), 6.41 (1H, d, 3JHH = 18.1 Hz, 2nd isomer), 8.42 (1H, dd, 3JHH = 17.1 Hz, 11.6 Hz, 1st isomer), 8.46 (1H, dd, 3JHH = 17.2 Hz, 11.6 Hz, 2nd isomer), 10.11–10.17 (2H, m), 10.17–10.24 (2H, m). 1st isomer: 13C NMR (125 MHz; CDCl3; Me4Si): δC, ppm 11.6, 11.6, 11.7, 12.7, 21.7, 36.9, 37.9, 50.4, 51.7, 71.5, 81.8, 96.1, 96.4, 96.6, 96.9, 97.0, 97.5, 120.5, 130.4, 137 (m), 173.5, 173.6. 2nd isomer: 13C NMR (125 MHz; CDCl3; Me4Si): δC, ppm 11.6, 11.6, 11.8, 12.8, 21.8, 37.0, 37.9, 50.4, 51.7, 71.5, 81.8, 96.1, 96.4, 96.6, 96.9, 97.0, 97.5, 120.5, 130.4, 137 (m), 173.5, 173.6.
Porphyrin 17d. Yield 20%. IR (KBr): νmax, cm-1 3288, 2912, 2857, ~2130, 1732, 1637, 1435, 1363, 1226, 1195, 1163, 1108, 833, 737, 677. HRMS (ESI): calcd. for C42H49N6O4 ([M + H]+) 701.3810, found 701.3831. 1H NMR (400 MHz; CDCl3; Me4Si): δH, ppm -3.86 (2H, bs), 2.16 (2H, m), 3.28 (4H, t, 3JHH = 7.7 Hz), 3.56 (8H, m), 3.60 (3H, s), 3.63 (3H, s), 3.65 (6H, s), 3.66 (6H, s), 4.21 (4H, m), 4.41 (4H, t, 3JHH = 7.6 Hz), 10.03 (1H, s), 10.05 (2H, s), 10.07 (1H, s). 13C NMR (100 MHz; CDCl3; Me4Si): δC, ppm 11.7, 11.8, 11.9, 21.8, 26.7, 36.9, 38.1, 50.6, 51.7, 51.7, 71.8, 81.6, 96.3, 96.7, 96.7, 96.8, 173.6. Anal. calcd. for C42H48N6O4·H2O: C, 70.17; H, 7.01; N, 11.69%. Found: C, 70.25; H, 6.78; N, 12.18%.
Porphyrin 16e. HRMS (ESI): calcd. for C44H54N5O5 ([M + H]+) 732.4119, found 732.4123. 1H NMR (600 MHz; CDCl3; Me4Si): δH, ppm -5.07 (2H, bs), 1.38 (2H, m), 1.50 (2H, m), 1.86 (2H, m), 2.29 (1H, t, 4JHH = 2.2 Hz), 2.89 (2H, m), 3.05 (2H, m), 3.11 (2H, m), 3.27 (2H, m), 3.33 (2H, m), 3.49 (3H, s), 3.52 (3H, s), 3.59 (3H, s), 3.63 (3H, s), 3.63 (3H, s), 3.64 (3H, s), 3.93 (2H, m), 4.11 (2H, m), 4.15 (4H, m), 5.94 (1H, m), 6.06 (1H, d, 3JHH = 18 Hz, 1st isomer), 6.11 (1H, d, 3JHH = 18 Hz, 2nd isomer), 7.77 (1H, dd, 3JHH = 18 Hz, 12 Hz, 1st isomer), 7.86 (1H, dd, 3JHH = 18 Hz, 12 Hz, 2nd isomer), 9.23 (1H, s), 9.39–9.64 (3H, m).
Porphyrin 17e. Yield 4%. HRMS (ESI): calcd. for C52H69N6O6 ([M + H]+) 873.5273, found 873.5301.
Porphyrin 16f. Yield 25%. HRMS (ESI): calcd. for C43H52N5O6 ([M + H]+) 734.3912, found 734.3909. 1H NMR (500 MHz; CDCl3; Me4Si): δH, ppm -4.16 (2H, bs), 2.16 (1H, m), 2.96 (2H, m), 3.23 (6H, m, 3JHH = 7.4 Hz), 3.41 (6H, m), 3.42 (5H, m), 3.55–3.63 (7H, m), 3.66 (6H, m), 3.73 (2H, m), 4.02–4.17 (2H, m), 4.32 (4H, m), 6.13 (1H, dm, 3JHH = 11.3 Hz), 6.29 (1H, dm, 3JHH = 17.7 Hz), 8.16 (1H, m, 3JHH = 17.2 Hz, 11.5 Hz), 9.80 (1H, s), 9.90 (2H, s), 10.00 (1H, s). 13C NMR (125 MHz; CDCl3;
Me4Si): δC, ppm 11.5, 11.6, 11.6, 11.8, 12.7, 12.8, 21.7, 21.8, 36.8, 36.9, 36.9, 48.5, 48.6, 51.1, 51.2, 51.7, 58.0, 58.0, 68.6, 68.6, 69.1 (m), 70.0, 70.1, 74.4, 74.4, 79.2, 96.0, 96.3, 96.5, 96.9, 97.0, 97.4, 120.4, 130.4, 136.0 (m), 137.4 (m), 173.5, 173.6.

114 R. LOSKA ET AL.
Copyright © 2013 World Scientific Publishing Company J. Porphyrins Phthalocyanines 2013; 17: 114–117
Porphyrin 17f. Yield 5%. HRMS (ESI): calcd. for C50H65N6O8 ([M + H]+) 877.4858, found 877.4860.
Porphyrin 16g. Yield 30%. IR (KBr): νmax, cm-1 3309, 2912, 2862, 2446, 2111, 1732, 1610, 1435, 1349, 1228, 1195, 1164, 1104, 912, 832, 726, 676. HRMS (ESI): calcd. for C45H56N5O7 ([M + H]+) 778.4174, found 778.4166. 1H NMR (500 MHz; CDCl3; Me4Si): δH, ppm -4.37 (2H, s), 2.26 (1H, m, 4JHH = 2.2 Hz), 2.90 (2H, m), 3.00 3.09 (4H, m), 3.12 (2H, m), 3.19 (4H, m), 3.340–3.42 (6H, m), 3.44 (3H, s), 3.45 (3H, s), 3.52 (3H, s), 3.63 (3H, s), 3.64 (3H, s), 3.66 (3H, s), 3.84 (1H, d, 4JHH = 2.1 Hz, 1st isomer), 3.86 (1H, d, 4JHH = 2.1 Hz, 2nd isomer), 3.98 (2H, t, 3JHH = 7.2 Hz, 1st isomer), 4.05 (2H, t, 3JHH = 7.3 Hz, 2nd isomer), 4.23 (4H, m), 6.06 (1H, d, 3JHH = 11.8 Hz, 1st isomer), 6.09 (1H, d, 3JHH = 11.7 Hz, 2nd isomer), 6.21 (1H, d, 3JHH = 17.8 Hz, 1st isomer), 6.26 (1H, d, 3JHH = 17.9 Hz, 2nd isomer), 8.03 (1H, dd, 3JHH = 17.9 Hz, 11.6 Hz, 1st isomer), 8.11 (1H, dd, 3JHH = 17.7 Hz, 11.5 Hz, 2nd isomer), 9.64–9.90 (4H, m). 13C NMR (125 MHz; CDCl3; Me4Si): δC, ppm 11.1, 11.1, 11.2, 11.5, 12.5, 12.9, 36.3, 36.3, 46.4, 48.6, 51.3, 57.3, 57.4, 65.9, 68.4, 69.4, 69.6, 69.7, 69.8, 77.1, 80.2, 96.6, 96.9, 97.0, 97.1, 97.2, 97.2, 120.4. 130.0, 137 (m), 172.9, 172.9, 172.9. UV-vis (CH2Cl2): λmax, nm (log ε) 403 (5.03), 502 (3.91), 536 (3.83), 571 (3.74), 625 (3.41).
Porphyrin 17g. Yield 9%. IR (KBr): νmax, cm-1 3444, 3261, 2945, 2866, 2447, 2111, 1733, 1438, 1351, 1251, 1196, 1104, 836, 732. HRMS (ESI): calcd. for C54H73N6O10 ([M + H]+) 965.5383, found 965.5382. UV-vis (CH2Cl2): λmax, nm (log ε) 402 (5.03), 498 (3.77), 533 (3.77), 567 (3.77, 621 (3.27).
Hydrolysis of PPIX derivatives. Dimethyl ester of a porphyrin derivative (0.130 mmol) was dissolved in dioxane or THF (9 mL) and MeOH (1.5 mL). LiOH·H2O (3.25 mmol, 136 mg) and water (3 mL) were added and the reaction mixture was stirred under an argon atmosphere for 24 h. The reaction mixture was diluted with water (15 mL) and extracted with CH2Cl2 (3 × 10 mL). Water phase was diluted with a few volumes of EtOH and evaporated. The residue was dissolved in water (2-3 mL), separated on a lipophilic sephadex column using first water and then 30% MeOH in water and evaporated.
Porphyrin 20c. Yield 56%. HRMS (ESI): m/z calcd. for C42H50N5O5 ([M + 3H]+) 704.3806, found 704.3802.
Porphyrin 20e. Yield 76%. HRMS (ESI): m/z calcd. for C42H53N8O7 ([M + 3H]+) 781.4032, found 781.4040. 1H NMR (500 MHz, DMSO-d6): δH, ppm -3.92 (2H, bs), 2.88 (4H, m), 3.00–3.90 (34H, m), 4.28 (6H, m), 6.18 (1H, d, 3JHH = 11.2 Hz), 6.42 (1H, d, 3JHH = 17.6 Hz), 8.49 (1H, m), 10.19 (1H, s), 10.28 (2H, s), 10.85 (1H, s).
Porphyrin 21d. Yield 82%. HRMS (ESI): m/z calcd. for C40H45N6O4 ([M + 3H]+) 673.3497, found 673.3509. 1H NMR (500 MHz, CD3OD): δH, ppm 3.14 (2H, m), 3.16 (2H, m, 4JHH = 1.6 Hz), 3.30 (6H, m), 3.39 (2H, m), 3.53 (5H, m), 3.59 (3H, s), 3.67 (m, 6H), 4.04 (2H, m), 4.16 (2H, m), 4.44 (4H, m), 9.93 (1H, s), 10.07 (1H, s), 10.09 (1H, s), 10.34 (1H, s).
Preparation of vitamin B12 derivatives with azide and alkyne linkers at 5’ position
Vitamin B12 (0.15 mmol, 200 mg) was dissolved in dry, degassed DMSO (5 mL, ultrasonic bath, bubbling argon for 15 min) at 35 °C under an argon atmosphere. With stirring, solid CDT (0.225 mmol, 37 mg) was added. After 30 min, amine (0.5 mmol) was added in dry DMSO (0.5 mL). After 30 min the heating bath was removed and the reaction mixture was stirred overnight. The reaction mixture was then added dropwise to a vigorously stirred 1:1 mixture of Et2O and CH2Cl2 (50 mL). After 30 min the clear solution above the red precipitate was removed by decantation, the precipitate was separated using a centrifuge, washed twice with CH2Cl2/Et2O 2:1 and three times with Et2O. After drying in air, the precipitate was dissolved in a small amount of water and separated using chromatography on RP gel using 0–30% EtOH in H2O. After evaporation, the product was dissolved in DMF (2 mL) and further purified using the same precipitation, centrifugation and washing procedure as described above.
Vitamin 18a. Yield 35%. HRMS (ESI): m/z calcd. for C67H91N15O15PCoNa2 ([M + 2Na]2+) 740.7837, found 740.7808. 1H NMR (400 MHz, DMSO-d6): δH, ppm 0.34 (3H, s), 0.85 (1H, m), 1.01 (3H, s), 1.03 (3H, s), 1.20 (3H, s), 1.26 (3H, s), 1.35 (3H, s), ~1.4 (1H, m), 1.55 (1H, m), 1.71 (3H, s), 1.73–1.80 (5H, m), 2.05 (3H, m), 2.19 (3H, s), 2.21 (3H, s), 2.15–2.35 (5H, m), 2.42 (3H, s), 2.35–2.51 (5H, m), 2.50 (3H, s), 2.70 (1H, m), 2.80 (1H, m), 2.92 (1H, m), 3.11 (1H, m), 3.17–3.25 (2H, m), 3.66 (1H, m), 3.81 (2H, m), 3.96 (1H, m), 4.08 (1H, m), 4.10–4.20 (3H, m), 4.33 (1H, d, 3JHH = 10.2 Hz), 4.65 (1H, m), 4.69 (1H, d, 3JHH = 8.3 Hz), 5.92 (1H, s), 6.24 (1H, s), 6.43 (1H, s), 6.46 (1H, s), 6.57 (1H, s), 6.80 (1H, s), 6.83 (1H, s), 7.03 (1H, s), 7.07 (1H, s), 7.10 (1H, s), 7.19 (1H, s), 7.24 (1H, s), 7.37 (1H, s), 7.41 (1H, d, JHH = 7.2 Hz), 7.58 (1H, s), 7.62 (1H, s), 7.73 (1H, s), 7.75 (1H, s), 7.80 (1H, s).
Vitamin 18b. Yield 82%. IR (KBr): νmax, cm-1 3346, 3200, 2936, 2134, 1668, 1573, 1498, 1402, 1222, 1144, 1083, 559. HRMS (ESI): m/z calcd. for C73H103N15O18PCoNa2 ([M + 2Na]2+) 806.8230, found 806.8231. 1H NMR (600 MHz, D2O): δH, ppm 0.30 (3H, s), 0.88 (1H, m), 0.95 (1H, m), 1.05 (3H, s), 1.11 (3H, d, 3JHH = 6.5 Hz), 1.24 (3H, s), 1.26 (3H, s), 1.30 (3H, s), 1.66–1.72 (2H, m), 1.72 (3H, s), 1.75–1.85 (4H, m), 1.85 (2H, m), 1.98 (1H, td, 3JHH = 14.1 Hz, 3.2 Hz), 2.04 (1H, d, 3JHH = 13.7 Hz), 2.12 (6H, s), 2.26 (2H, AB, 2JHH = 13.3 Hz), 2.30–2.57 (7H, m), 2.40 (3H, s), 2.42 (3H, s), 2.61 (2H, m), 2.86 (1H, m), 3.15–3.24 (3H, m), 3.29 (1H, dd, 3JHH = 10.9, 5.2 Hz), 3.44–3.49 (5H, m), 3.49–3.56 (6H, m), 3.94 (1H, d, 3JHH = 10.1 Hz), 4.01 (2H, s), 4.04 (1H, dd, 3JHH = 8.9 Hz, 2.0 Hz), 4.07 (1H, m), 4.15 (1H, m), 4.18 (1H, m), 4.46 (1H, d, 3JHH = 11.3 Hz), 4.60–4.71 (2H, m), 5.93 (1H, s), 6.18 (1H, d, 3JHH = 2.4 Hz), 6.36 (1H, s), 6.96 (1H, s), 7.13 (1H, s). 13C NMR (150 MHz, D2O): δC, ppm 15.0, 15.2, 15.6, 16.6, 18.8,

DESIGN AND SYNTHESIS OF PROTOPORPHYRIN IX/VITAMIN B12 MOLECULAR 115
Copyright © 2013 World Scientific Publishing Company J. Porphyrins Phthalocyanines 2013; 17: 115–117
18.8, 19.1, 19.1, 19.2, 19.7, 25.8, 27.7, 31.1, 31.2, 31.5, 31.7, 31.9, 34.2, 34.7, 36.8, 38.8, 40.1, 42.5, 42.7, 44.9, 47.0, 47.9, 51.2, 53.4, 55.5, 56.1, 57.7, 58.9, 62.7, 68.5, 68.5, 69.2, 69.4. 69.4, 69.5, 72.8, 73.1, 74.7, 78.8, 78.9, 79.7, 84.9, 86.8, 94.6, 103.9, 107.4, 111.2, 116.3, 129.7, 133.0, 135.0, 136.4, 141.6, 158.0, 165.1, 165.8, 173.4, 174.4, 174.9, 175.4, 175.6, 176.7, 176.8, 177.5, 177.6, 178.8, 179.9. UV-vis (H2O): λmax, nm (log ε) 278 (4.13), 305 (3.91), 322 (3.83), 361 (4.39), 408 (3.49), 548 (3.88), 968 (1.92).
Vitamin 18c. Yield 69%. HRMS (ESI): m/z calcd. for C73H103N15O16Na2PCo ([M + 2Na]2+) 790.8280, found 790.8242. 1H NMR (600 MHz, DMSO-d6): δH, ppm 0.32 (3H, s), 0.86 (1H, m), 0.99 (3H, s), 1.02 (3H, s), 1.06 (3H, s), 1.18 (3H, s), 1.21–1.32 (4H, m), 1.33 (3H, s), 1.35–1.41 (2H, m), 1.45–1.52 (3H, m), 1.60–1.74 (2H, m), 1.69 (3H, s), 1.75–1.84 (4H, m), 1.90–2.10 (3H, m), 2.12–2.26 (4H, m), 2.16 (3H, s), 2.18 (3H, s), 2.27–2.45 (7H, m), 2.30 (3H, s), 2.39 (2H, t, 3JHH = 5.4 Hz), 2.48 (3H, s), 2.57 (1H, m), 2.77 (1H, m), 2.89 (1H, m), 2.95 (2H, m), 3.09 (1H, d, 3JHH = 10.7 Hz), 3.15 (1H, dd, 3JHH = 10.5 Hz, 5.6 Hz), 3.25 (1H, dd, 3JHH = 10.5 Hz, 6.0 Hz), 3.41 (2H, m), 3.69 (1H, m), 3.91 (1H, d, 3JHH = 10.8 Hz), 4.01 (1H, m), 4.06 (1H, m), 4.09 (1H, dm, 4JHH = 2.4 Hz), 4.15 (1H, m), 4.29 (1H, d, 3JHH = 9.8 Hz), 4.61 (1H, m), 4.69 (1H, d, 3JHH = 7.0 Hz), 5.90 (1H, s), 6.28 (1H, s), 6.36 (1H, s), 6.44 (1H, s), 6.53 (1H, s), 6.74 (1H, s), 6.78 (1H, s), 7.03 (1H, s), 7.07 (1H, s), 7.08 (1H, s), 7.13 (1H, s), 7.18 (1H, s), 7.36 (2H, s), 7.54 (1H, s), 7.68 (1H, s), 7.71 (1H, s), 7.78 (1H, s), 7.81 (1H, s). 13C NMR (150 MHz, DMSO-d6): δC, ppm 15.0, 15.2, 16.4, 16.5, 18.7, 19.8, 19.9, 20.0, 20.1, 20.1, 25.3, 25.4, 26.0, 26.1, 27.1, 28.7, 28.8, 29.3, 29.9, 31.0, 31.6, 31.7, 34.0, 35.1, 38.0, 40.2, 42.0, 42.1, 44.6, 46.5, 47.3, 50.3, 52.9, 54.0, 54.9, 57.2, 58.6, 62.8, 67.2, 68.8, 69.1, 70.3, 74.8, 76.8, 76.9, 80.6, 84.4, 85.9, 93.5, 103.1, 105.8, 111.8, 116.4, 129.7, 131.3, 132.6, 136.2, 142.2, 156.1, 164.6, 165.4, 170.9, 171.1, 172.5, 172.8, 173.2, 173.3, 173.5, 173.6, 174.0, 178.2, 179.5.
Vitamin 18d. Yield 63%. IR (KBr): νmax, cm-1 3334, 3195, 2934, 2097, 1668, 1573, 1498, 1401, 1238, 1145, 1071, 559. HRMS (ESI): m/z calcd. for C70H100N18O15PCoNa ([M + Na]+) 1545.6577, found 1545.6519. 1H NMR (600 MHz, DMSO-d6): δH, ppm 0.29 (3H, s), 0.84 (1H, bs), 1.01 (3H, d, 3JHH = 6.6 Hz), 1.02 (3H, s), 1.14 (3H, s), 1.20 (3H, s), 1.25 (4H, m), 1.29 (3H, s), 1.37 (2H, m), 1.47 (2H, m), 1.56–1.70 (2H, m), 1.66 (3H, s), 1.70–1.80 (5H, m), 1.95–2.40 (3H, m), 2.13 (3H, s), 2.14 (3H, s), 2.15–2.28 (3H, m), 2.33 (1H, m), 2.36 (3H, s), 2.38–2.50 (6H, m), 2.44 (3H, s), 2.55 (1H, m), 2.74 (1H, m), 2.84 (1H, m), 2.92 (2H, m), 3.06 (1H, d, 3JHH = 10.7 Hz), 3.27 (2H, t, 3JHH = 7.1 Hz), 3.42 (1H, m), 3.65 (1H, dd, 3JHH = 9.3, 5.4 Hz), 3.91 (1H, d, 3JHH = 10.5 Hz), 3.96 (1H, d, 3JHH = 10.1 Hz), 4.03 (2H, m), 4.11 (1H, m), 4.25 (1H, d, 3JHH = 10.1 Hz), 4.66 (2H, m), 5.84 (1H, s), 6.31 (1H, d, 3JHH = 9.1 Hz), 6.40 (1H, s), 6.50 (1H, s), 6.75 (2H, s), 6.97 (1H, s), 6.99 (1H, s),
7.05 (1H, s), 7.09 (1H, s), 7.14 (1H, s), 7.32 (1H, s), 7.44 (1H, s), 7.50 (2H, s), 7.67 (2H, s), 7.76 (1H, s), 7.80 (1H, s). 13C NMR (150 MHz, DMSO-d6): δC, ppm 15.4, 16.1, 16.8, 16.9, 19.1, 20.2, 20.3, 20.4, 20.5, 20.5, 26.0, 26.1, 26.3, 27.6, 28.6, 29.7, 30.3, 31.5, 31.9, 32.1, 32.1, 34.3, 35.6, 38.5, 40.6, 42.1, 42.6, 45.0, 47.0, 47.8, 50.7, 51.0, 53.4, 54.4, 55.4, 59.0, 63.4, 69.3, 70.7, 73.3, 75.2, 79.9, 84.8, 86.5, 94.0, 103.5, 106.3, 112.2, 116.7, 130.2, 131.6, 132.9, 136.7, 142.6, 156.6, 165.0, 165.8, 171.4, 171.5, 172.9, 173.0, 173.2, 173.7, 174.0, 174.3, 175.5, 178.7, 179.9. UV-vis (H2O): λmax, nm (log ε) 278 (4.15), 305 (3.92), 322 (3.84), 361 (4.41), 408 (3.49), 519 (3.83), 549 (3.89), 962 (0.48).
Vitamin 18e. Yield 38%. 1H NMR (600 MHz, DMSO-d6): δH, ppm 0.29 (3H, s), 0.84 (1H, m), 1.02 (3H, s), 1.02 (3H, s), 1.14 (3H, s), 1.20 (3H, s), 1.29 (3H, s), 1.46 (1H, m), 1.61 (1H, m), 1.66 (3H, s), 1.67–1.80 (5H, m), 2.00 (3H, m), 2.13 (3H, s), 2.14 (3H, s), 2.15–2.21 (3H, m), 2.25 (1H, m), 2.32 (1H, m), 2.35 (3H, s), 2.38–2.51 (5H, m), 2.44 (3H, s), 2.57 (1H, m), 2.75 (1H, m), 2.86 (1H, m), 3.05 (1H, d, 3JHH = 10.4 Hz), 3.11 (2H, m), 3.30–3.42 (5H, m), 3.54 (2H, m), 3.65 (1H, m), 3.91 (1H, d, 3JHH = 10.5 Hz), 3.98 (1H, d, 3JHH = 9.9 Hz), 4.03 (2H, m), 4.13 (1H, m), 4.26 (1H, d, 3JHH = 10.0 Hz), 4.66 (2H, m), 5.84 (1H, s), 6.27 (1H, s), 6.30 (1H, s), 6.40 (1H, s), 6.50 (1H, s), 6.76 (2H, s), 6.97 (1H, s), 7.00 (1H, s), 7.05 (1H, s), 7.09 (1H, s), 7.13 (1H, s), 7.33 (1H, s), 7.42 (1H, s), 7.50 (1H, s), 7.65 (1H, s), 7.72 (2H, s), 7.83 (1H, s). 13C NMR (150 MHz, DMSO-d6): δC, ppm 15.5, 16.1, 16.8, 16.9, 19.1, 20.2, 20.3, 20.3, 20.5, 20.5, 26.0, 26.1, 27.5, 30.3, 31.5, 31.9, 32.1, 32.1, 34.3, 35.6, 38.5, 40.5, 42.1, 42.5, 45.0, 47.0, 47.8, 50.4, 50.7, 53.4, 54.4, 55.4, 59.0, 63.6, 69.3, 69.4, 69.4, 70.8, 73.2, 75.2, 79.9, 84.8, 86.5, 94.0, 103.5, 106.3, 112.1, 116.7, 130.2, 131.6, 133.0, 136.7, 142.6, 156.7, 165.0, 165.8, 171.4, 171.6, 173.0, 173.0, 173.2, 173.7, 174.0, 174.4, 175.5, 178.7, 179.9. UV-vis (H2O): λmax, nm (log ε) 279 (4.17), 306 (3.94), 323 (3.89), 361 (4.41), 518 (3.86), 548 (3.92).
Vitamin 18f. Yield 63%. IR (KBr): νmax, cm-1 3347, 3197, 2934, 2109, 1669, 1573, 1498, 1402, 1224, 1144, 1082, 559. HRMS (ESI): m/z calcd. for C72H104N18O18PCoNa2 ([M + 2Na]2+) 822.3315, found 822.3296. 1H NMR (600 MHz, DMSO-d6): δH, ppm 0.29 (3H, s), 0.84 (1H, m), 1.01 (3H, d, 3JHH = 6.2 Hz), 1.02 (3H, s), 1.14 (3H, s), 1.20 (3H, s), 1.30 (3H, s), 1.46 (1H, m), 1.58–1.71 (2H, m), 1.66 (3H, s), 1.76 (4H, m), 2.01 (3H, m), 2.13 (3H, s), 2.15 (3H, s), 2.14–2.27 (3H, m), 2.33 (2H, m), 2.35 (3H, s), 2.38–2.48 (3H, m), 2.44 (3H, s), 2.51 (2H, s), 2.55 (1H, m), 2.75 (1H, m), 2.86 (1H, m), 3.06 (1H, d, 3JHH = 11.0 Hz), 3.09 (2H, m, 3JHH = 5.7 Hz), 3.35 (2H, t, 3JHH = 4.8 Hz), 3.38 (2H, t, 3JHH = 6.2 Hz), 3.42 (1H, m), 3.45–3.51 (6H, m), 3.51–3.53 (2H, m), 3.56 (2H, t, 3JHH = 5.0 Hz), 3.65 (1H, dd, 3JHH = 9.5, 5.5 Hz), 3.91 (1H, d, 3JHH = 10.7 Hz), 3.98 (1H, m), 4.01 (1H, m), 4.05 (1H, m), 4.12 (1H, m), 4.23 (1H, d, 3JHH = 10.0 Hz), 4.66 (2H, m), 5.84 (1H, s), 6.31 (2H, bs), 6.40 (1H, s), 6.49 (1H, s), 6.75 (2H, s), 6.95 (1H, s), 6.99 (1H, s),

116 R. LOSKA ET AL.
Copyright © 2013 World Scientific Publishing Company J. Porphyrins Phthalocyanines 2013; 17: 116–117
7.06 (1H, s), 7.09 (1H, s), 7.14 (1H, s), 7.32 (1H, s), 7.42 (1H, s), 7.50 (1H, s), 7.65 (1H, s), 7.68 (1H, s), 7.76 (1H, s), 7.81 (1H, s). 13C NMR (150 MHz, DMSO-d6): δC, ppm 15.5, 16.1, 16.8, 16.9, 19.1, 20.2, 20.3, 20.4, 20.5, 20.5, 26.0, 26.1, 27.5, 30.3, 31.5, 31.9, 32.1, 32.1, 34.4, 35.6, 38.5, 40.9, 42.1, 42.5, 45.0, 47.0, 47.8, 50.4, 50.7, 53.4, 54.4, 55.4, 59.0, 63.6, 69.3, 69.6, 69.7, 70.0, 70.1, 70.2, 70.2, 70.7, 73.2, 75.2, 79.9, 84.8, 86.5, 94.0, 103.5, 106.3, 112.2, 116.7, 130.2, 131.6, 133.0, 136.7, 142.7, 156.7, 165.0, 165.8, 171.4, 171.5, 172.9, 173.0, 173.2, 173.7, 174.0, 174.3, 175.5, 178.7, 179.9. UV-vis (H2O): λmax, nm (log ε) 278 (4.15), 305 (3.93), 322 (3.85), 361 (4.40), 408 (3.52), 519 (3.84), 549 (3.89), 962 (1.59).
CuAAC reaction of alkine 18c with azide 16b in t-BuOH/H2O – hybrid 19a
PPIX azide derivative 16b (12 μmol, 8.9 mg), TBTA (16 μmol, 8.3 mg), sodium ascorbate (78 μmol, 15.5 mg) and vitamin B12 alkyne derivative 18c (13 μmol, 20.0 mg) were added to degassed (ultrasonic bath, bubbling Ar for 15 min) mixture of water and tert-BuOH (1:3.7, 2.5 mL). After stirring for 10 min CuSO4·5H2O (16 μmol, 4.0 mg) was added and the reaction mixture was stirred at rt for 20 h. By TLC analysis, the starting PPIX derivative and most of vitamin B12 derivative was consumed. A dark red precipitate was formed. It was filtered, washed with water (3 × 2 mL), tert-BuOH (2 mL) and CH2Cl2 (3 × 2 mL). The solid obtained after drying (6 mg) was insoluble in any common solvents (DMF, DMSO, etc.). It was analyzed using MS ESI spectroscopy.
Hybrid 19a. MS (ESI): m/z 2319.8 ([C113H150N23O21PCoCu]+), 1159.9 ([C113H151N23O21PCoCu]2+).
CuAAC reaction in DMF
CuI (80 μmol, 15 mg) and TBTA (201 μmol, 107 mg) were dissolved to dry, degassed (ultrasonic bath, bubbling Ar for 15 min) DMF (5 mL). After 15 min, when the solution was completely clear, vitamin derivative (18f or 18e, 30.7 μmol), PPIX derivatived (20c or 20f, 28 μmol) and sodium ascorbate (160 μmol, 32 mg) were added. The reaction mixture was stirred overnight at rt and then it was added dropwise to a vigorously stirred mixture of Et2O and CH2Cl2 (1:1, 25 mL). After 30 min the clear solution above the red precipitate was removed by decantation, the precipitate was separated using a centrifuge, washed twice with CH2Cl2/Et2O 2:1 and three times with Et2O. After drying, the precipitate was dissolved in water and separated by chromatography on RP gel. Unreacted vitamin B12 was first removed with 10% EtOH in H2O, and the new product was then eluted with 50% EtOH in H2O or 50% i-PrOH in H2O, in some difficult cases basified with 2% LiOH. After evaporation it was dissolved in DMF (1.5–2 mL), precipitated and washed in the same way as described for the crude reaction mixture.
Hybrid 19b. MS (ESI): m/z 1147.9 ([C113H151N22O23
PCoLi3]2+).
Hybrid 19c. MS (ESI): m/z 1140.5 ([C109H143N23O22
PCoCu]2+).
CONCLUSION
A series of PPIX derivatives containing one or two linkers, attached through the PPIX vinyl group making them suitable for CuAAC reaction, was synthesized. Considering the versatility of CuAAC, these derivatives could be used for bioconjugation with a broad variety of substrates. We have also showed that propionyl methyl esters could be easily hydrolyzed with lithium hydroxide in good yield. CuAAC reactions of porphyrin derivatives with suitably functionalized vitamin B12 derivatives gave desired, water soluble hybrids. The presence of free carboxylate groups in PPIX part are the prerequisite for hybrid’s water solubility. Interestingly, under the optimal conditions for CuAAC copper insertion into the PPIX part of the hybrid was avoided, which is a rare case in the chemistry of porphyrins. Further effort is needed to develop methods of processing and purification of such hybrids to enable their appropriate characterization and pharmacological evaluation.
Acknowledgements
This work was supported by the European Regional Development Found with the TEAM program, Grant no. TEAM/2009-3/4.
Supporting information
Experimental procedures for the synthesis of linkers 6 and 10 are given in the supplementary material. This material is available free of charge via the Internet at http://www.worldscinet.com/jpp/jpp.shtml.
REFERENCES
1. a) Chen Z, Zhang J and Stamler JS. Proc. Nat. Acad. Sci. USA 2002; 99: 8306–8311. b) Nitric Oxide: Biochemistry, Molecular Biology, and Therapeutic Implications, Ignarro LJ and Murad F. (Eds.) Aca-demic Press: 1995. c) Carpenter AW and Schoen-fisch MH. Chem. Soc. Rev. 2012; 41: 3742–3752. d) Maxwell AJ. Nitric oxide 2002; 6: 101–124.
2. a) Murad F. N. Engl. J. Med. 2006; 355: 2003–2011. b) Martin E, Sharina I, Kots A and Murad F. Proc. Nat. Acad. Sci. USA 2003; 100: 9208–9213. c) Friebe A and Koesling D. Nitric Oxide 2009; 21: 149–156.
3. Boerrigter G and Burnett JC. Cardiovasc. Drug Rev. 2007; 25: 30–45.
4. a) Wolin MS, Wood KS and Ignarro LJ. J. Biol. Chem. 1982; 257: 13312–13320. b) Ignarro LJ, Wood KS and Wolin MS. Proc. Nat. Acad. Sci. USA 1982; 79: 2870–2873. c) Waldman SA, Sinacore MS, Lewicki JA, Chang LY and Murad F. J. Biol. Chem. 1984; 259: 4038–4042. d) Dierks EA, Hu S,

DESIGN AND SYNTHESIS OF PROTOPORPHYRIN IX/VITAMIN B12 MOLECULAR 117
Copyright © 2013 World Scientific Publishing Company J. Porphyrins Phthalocyanines 2013; 17: 117–117
Vogel KM, Yu AE, Spiro TG and Burstyn JN. J. Am. Chem. Soc. 1997; 119: 7316–7323. e) Ignarro LJ. J. Physiol. Pharm. 2002; 53: 503–514. f) Carr HS, Tran D, Reynolds MF, Burstyn JN and Spiro TG. Biochemistry 2002; 41: 10149–10157.
5. Ignarro LJ, Ballot B and Wood KS. J. Biol. Chem. 1984; 259: 6201–6207.
6. a) ó Proinsias K, Giedyk M, Sharina IG, Martin E and Gryko D. ACS Med. Chem. Lett. 2012; 3: 476–479. b) Sharina IG, Sobolevsky M, Doursout M-F, Gryko D and Martin E. J. Pharmacol. Exp. Ther. 2012; 340: 723–732.
7. a) Gruber K, Puffer B and Kraütler B. Chem. Soc. Rev. 2011; 40: 4346–4363. b) Petrus AK, Fairchild TJ and Doyle RP. Angew. Chem. Int. Ed. 2009; 48: 1022–1028. c) Wuerges J, Garau J, Geremia S, Fedosov SN, Petersen TE and Randaccio L. Proc. Nat. Acad. Sci. USA 2003; 100: 4386–4391. d) Wil-bur DS, Pathare PM, Hamlin DK, Rothenberg SP and Quadros EV. Bioconjugate Chem. 1999; 10: 912–920.
8. a) Clardy SM, Allis DG, Fairchild TJ and Doyle RP. Expert Opin. Drug Deliv. 2011; 8: 127–140. b) JF McEwan, HS Veitch and GJ Russell-Jones. Biocon-jugate Chem. 1999; 10: 1131–1136. c) Pathare PM, Wilbur DS, Heusser S, Quadros EV, McLoughlin P and Morgan AC. Bioconjugate Chem. 1996; 7: 217–232. d) Russell-Jones GJ. Adv. Drug Del. Rev. 1996; 20: 83–97. e) Howard, Jr. WA, Bayomi A, Natara-jan E, Aziza MA, El-Ahmady O, Grissom CB and West FG. Bioconjugate Chem. 1997; 8: 498–502. f) Mundwiler S, Spingler B, Kurz P, Kunze S and Alberto R. Chem. Eur. J. 2005; 11: 4089–4095. g) Siega P, Wuerges J, Arena F, Gianolio E, Fedosov SN, Dreos R, Geremia S, Aime S and Randaccio L. Chem. Eur. J. 2009; 15: 7980–7989. h) Petrus AK, Allis DG, Smith RP, Fairchild TJ and Doyle RP. ChemMedChem 2009; 4: 421–426. i) van Sta-veren DR, Benny PD, Waibel R, Kurtz P, Pak J-K and Alberto R. Helv. Chim. Acta 2005; 88: 447–460.
j) Chalasani KB, Russell-Jones GJ, Yandrapu SK, Diwan PV and Jain SK. J. Controlled Release 2007; 117: 421–429. k) Russell-Jones GJ, McTavish K, McEwan J, Rice J and Nowotnik D. J. Inorg. Bio-chem. 2004; 98: 1625–1633. l) Viola-Villegas N, Rabideau AE, Bartholoma M, Zubieta J and Doyle RP. J. Med. Chem. 2009; 52: 5253–5261. m) Bag-nato JD, Eilers AL, Horton RA and Grissom CB. J. Org. Chem. 2004; 69: 8987–8996. n) Hogenkamp HPC, Collins DA, Live D, Benson LM and Naylor S. Nucl. Med. Biol. 2000; 27: 89–92. o) Smeltzer CC, Cannon MJ, Pinson PR, Munger Jr. JD, West FG and Grissom CB. Org. Lett. 2001; 3: 799–801. p) Lee M and Grissom CB. Org. Lett. 2009; 11: 2499–2502. q) Alsenz J, Russell-Jones GJ, Westwood S, Levet-Trafit B and de Smidt PC. Pharm. Res. 2000; 17: 825–832. r) Wilson S, Reinhard KS and Gao X. US Patent 2007; 0066561 A1. s) Wang X, Wei L and Kotra LP. Bioorg. Med. Chem. 2007; 15: 1780–1787.
9. a) Meunier B. Acc. Chem. Res. 2008; 41: 69–77. b) Ojima I. Acc. Chem. Res. 2008; 41: 108–119.
10. Pavlov VY. Russ. J. Org. Chem. 2007; 43: 1–34. 11. a) Kolb HC, Finn MG and Sharpless KB. Angew.
Chem. Int. Ed. 2001; 40: 2004–2021. a) Meldal M and Tornøe CW. Chem. Rev. 2008; 108: 2952–3015. b) Iha RK, Wooley KL, Nystrom AM, Burke DJ, Kade MJ and Hawker CJ. Chem. Rev. 2009; 109: 5620–5686.
12. Dumoulin F and Ahsen V. J. Porphyrins Phthalo-cyanines 2011; 15: 481–504.
13. a) Schwabacher AW, Lane JW, Schiesher MW, Leigh KM and Johnson CW. J. Org. Chem. 1998; 63: 1727–1729. b) Klein E, DeBonis S, Thiede B, Skoufias DA, Kozielski F and Lebeau L. Bioorg. Med. Chem. 2007; 15: 6474–6488.
14. Kenner GW, McCombie SW and Smith KM. Liebigs Ann. Chem. 1973; 1329–1338.
15. a) Borch RF, Bernstein MD and Durst HD. J. Am. Chem. Soc. 1971; 93: 2897–2904. b) Lane CF. Syn-thesis 1975; 135–146.

Journal of Porphyrins and PhthalocyaninesJ. Porphyrins Phthalocyanines 2013; 17: 118–124
DOI: 10.1142/S1088424612501362
Published at http://www.worldscinet.com/jpp/
Copyright © 2013 World Scientific Publishing Company
INTRODUCTION
Physical and chemical properties of metalloporphyrins are mediated by the electronic configuration of the central metal ion. Iron(III) porphyrinate complexes that are best described as a quantum admixture (S = 3/2, 5/2) have been known for many years.1,2 Previous studies of the admixed-spin complexes indicate that the nature of the axial ligand can govern the degree of S = 3/2 character; the magnetochemical series ranking of ligand field strengths was developed by Reed and co-workers based on spin states of iron(III) tetraphenylporphyrin complexes.3
Recently, more attention has been focused on the role of the porphyrin ring conformation in determining the extent of S = 3/2 character.4
Conformational flexibility of the porphyrin macrocycle has been considered as a means of affecting the redox, spectroscopic, and catalytic properties of metalloporphyrins and can be involved in controlling of the electronic configuration of iron porphyrins.5–7 Rath and Ghosh8 reported that there are two different iron spin states in μ-hydroxo-diiron(III) bisporphyrin complex, one is the high-spin state (S = 5/2), the other is the admixed spin-state (S = 5/2, 3/2), and which is possibly caused by the differing extent of the ruffling distortion of the two porphyrin rings. Moreover, the ground electronic state of chloro(porphyrinato)iron(III) complexes is typically high-spin; however, [Fe(OMTPP)(Cl)] and [Fe(OETPP)(Cl)]9–11 are known to have an admixed intermediate spin, but in distinctly varying amounts.
Compared to well-documented tetraarylporphyrin complexes, tetraalkylporphyrin complexes have shown greater differences in physiochemical properties thanks to their nonplanar core conformations.12–21 Nakamura and co-workers utilized the NMR technique to determine electronic structures in a series of five- and six-coordinate
Effect of the ruffled porphyrin ring on electronic structures:
structure and characterization of [Fe(TalkylP)(OClO3)] and
[Fe(TPrP)(THF)2]ClO4 (alkyl = Ethyl, Et and n-Propyl, Pr)
Ming Li,a Allen G. Oliver,a Teresa J. Neal,a Charles E. Schulz,*b and
W. Robert Scheidt *,a
a The Department of Chemistry and Biochemistry, University of Notre Dame, Notre Dame, Indiana 46556, USA b The Department of Physics, Knox College, Galesburg, Illinois 61401, USA
Received 15 August 2012 Accepted 15 October 2012
ABSTRACT: We report the synthesis of Fe(TalkylP)(OClO3)] (alkyl = ethyl and propyl) and [Fe(TPrP)(THF)2]ClO4, which are characterized by UV-vis, EPR, X-ray crystallography, and solid-state magnetic susceptibilities. The macrocycles of all three complexes are ruffled, all of the structural features for [Fe(TEtP(OClO3)] and [Fe(TPrP)(OClO3)] are characteristic of the nearly pure S = 3/2 state, while the structural parameters for [Fe(TPrP)(THF)2]ClO4 feature a pure intermediate-spin (S = 3/2) state, which are all consistent with EPR and magnetic data. It is clear from these studies that the ruffled conformation plays a significant role in affecting the extent of S = 3/2 character.
KEYWORDS: iron (III), intermadete spin, weak-field ligands
SPP full member in good standing
*Correspondence to: Charles E. Schultz. email: cschulz@ knox.com and W. Robert Scheidt, email: [email protected], tel: +574-631-5939, fax: +574-63-16652

EFFECT OF THE RUFFLED PORPHYRIN RING ON ELECTRONIC STRUCTURES 119
Copyright © 2013 World Scientific Publishing Company J. Porphyrins Phthalocyanines 2013; 17: 119–124
(meso-tetralkylporphyrinato)iron(III) complexes.20,22,23 We have previously studied neutral and π-cation radical derivatives of [Fe-(TalkylP)(Cl)] (alkyl = ethyl, η-propyl and η-hexyl), which revealed intermolecular π–π interactions controlled by the alkyl groups at the meso-positions.24 In this paper, we explore the effect of the core conformation on the electronic structures. The present paper reports the synthesis of Fe(TalkylP)(OClO3)] (alkyl = Ethyl and propyl) and [Fe(TPrP)(THF)2]ClO4, which are characterized by UV-vis, EPR, X-ray crystallography, and solid-state magnetic susceptibilities and explore effect of the substituents on meso-positions on core conformation. It is clear from these studies that the ruffling conformation plays a significant role in affecting the extent of S = 3/2 character.
EXPERIMENTAL SECTION
General Information. All manipulations were carried out under argon using a double manifold vacuum line, Schlenkware, and cannula techniques. Dichloromethane was distilled over CaH2, tetrahydrofuran (THF) and hexanes were distilled over sodium benzophenone. All other chemicals were used as received from Aldrich or Fisher. meso-Tetra-n-propylporphyrin (H2TPrP) was prepared according to Neya’s method,25 while meso-tetraethylporphyrin (H2TEtP) was prepared according to Lindsey’s method.26 The chloroiron(III) derivatives [Fe(TPrP)(Cl)] and [Fe(TEtP)(Cl)] were synthesized by literature methods.27
Preparation of [Fe(TalkylP)(OClO3)] (alkyl = Et and Pr) complexes. [Fe(TPrP)-(Cl)] (20 mg, 0.035 mmol) and AgClO4 (11 mg, 0.054 mmol) were placed in a 100-mL Schlenk flask, and dichloromethane (∼20 mL) was added. The solution was stirred for 20 hrs and filtered/transferred into another small flask. The filtrate was layered with hexane. Red-purple crystals formed after ∼4 days. UV-vis and IR spectra were measured on samples comprised of selected crystals. UV-vis (CH2Cl2 solution): λmax: 394, 524, 708 nm. IR(KBr): ν(C1O4) 1161(s), 1080(s), 638(m) cm-1. [Fe(TEtP)(OClO3)]: UV-vis (CH2Cl2 solution): λmax: 401, 522, 706 nm. IR(KBr): ν(C1O4) 1161(s), 1080(s), 626(m) cm–1.
Preparation of [Fe(TPrP)(THF)2]ClO4. [Fe(TPrP)(Cl)] (20 mg, 0.035 mmol) and AgClO4 (11 mg, 0.054 mmol) were placed in a 100-mL Schlenk flask, and THF (~20 mL) was added. The solution was stirred overnight and filtered/transferred into a small Schlenk flask. The filtration solution was layered with hexane. Dark-purple crystals formed after ~5 days. UV-vis (THF): λmax: 394, 533, 703 nm. IR(KBr): ν(C104) 1145(s), 1116(s), 1080(s, br), 637(m), 624(m) cm–1.
X-Ray Structure Determinations. X-ray diffraction data for [Fe(TPrP)(OClO3)], [Fe-(TEtP)(OClO3)] and [Fe(TPrP)(THF)2]ClO4 complexes were collected on a Nonius FAST area-detector diffractometer. Our detailed methods and procedure for small molecular X-ray data collection have been described previously.28
All structures were solved by direct methods.29 Subsequent difference Fourier calculations revealed the positions of the remaining non-hydrogen atoms. All non-hydrogen atoms were refined anisotropically by full-matrix least-squares method30 except one oxygen atom [O(2a) and O(2b)] in [Fe(TPrP)(OClO3)] and three oxygen atoms [O(4a) and O(4b), O(5a) and O(5b), O(6a) and O(6b)] in [Fe(TPrP)(THF)2]ClO4. Hydrogen atoms of the porphyrin ligands and the solvent molecule were idealized with the standard SHELXL idealization methods. Brief crystallographic data for all complexes are listed in Table 1.
Physical Characterization. UV/visible spectra were recorded on a Perkin-Elmer Lambda 19 spectrometer and IR spectra on a Perkin-Elmer model 883 or on a Perkin-Elmer Paragon 1000 as KBr pellets. Magnetic susceptibility measurements were obtained on ground samples in the solid state over the temperature range 6–300 K on a Quantum Design MPMS SQUID susceptometer. All samples were immobilized in Dow Corning silicone grease. Measurements at two fields (2 and 20 kG) showed that no ferromagnetic impurities were present. χM was corrected for the underlying porphyrin ligand diamagnetism according to previous experimentally observed values;31 all remaining diamagnetic contributions (χdia) were calculated using Pascal’s constants.32,33 All measurements included a correction for the diamagnetic sample holder and diamagnetic immobilizing agent.
RESULTS AND DISCUSSION
We report the synthesis and characterization (including UV-Visible and EPR spectra, magnetic susceptibility data and crystal structures) of [Fe(TEtP)(OClO3)], [Fe(TPrP)(OClO3)] and [Fe(TPrP)(THF)2]ClO4. Labeled ORTEP diagram of [Fe(TEtP)(OClO3)] and [Fe(TPrP)(OClO3)] are shown in Figs 1 and 2. Table 2 lists selected bond lengths and angles for both complexes. The coordination environments of the iron atoms in [Fe(TEtP(OClO3)] and [Fe(TPrP)(OClO3)] are similar. The axial Fe−O and average Fe−Np distances are 2.0840(15) and 1.974(5) Å for [Fe(TEtP)(OClO3)], and 2.0631(18) and 1.972(4) Å for [Fe(TPrP)(OClO3)].
The average Fe−Np distances are in accord with those expected for an intermediate-spin state of dominant S = 3/2 character and not the high-spin state. The Fe−Np values observed here are dramatically shorter than the average Fe−Np distances of 2.001(5) Å in [Fe(TPP)(OClO3)]
34 and 1.994(10) Å in [Fe(OEP)(OC103)],35
which are both admixed-intermediate spin complexes, but are comparable to 1.978(3) Å in [Fe(TPP)(FSbF5) with 98% S = 3/2 character.36 All of the structural features for [Fe(TEtP)(OClO3)] and [Fe(TPrP)(OClO3)] are characteristic of the nearly pure S = 3/2 state. This observation is reflected in their EPR spectra and in solid-state magnetic data.

120 M. LI ET AL.
Copyright © 2013 World Scientific Publishing Company J. Porphyrins Phthalocyanines 2013; 17: 120–124
The EPR spectra of both complexes in the solid state at 77 K show a broad peak with g⊥ = 4.2 for [Fe(TEtP)(OClO3)] and g⊥ = 4.3 for [Fe(TPrP)(OClO3)], the apparent g⊥ is quite distinct from the range of typical high-spin ferric (g⊥ ≈ 6), and close to the value predicted for intermediate-spin iron (III)
porphyrin (g⊥ 4). The effective magnetic moments (μeff) of 4.36 μΒ in [Fe(TEtP)(OClO3)] and 4.53 μΒ in [Fe(TPrP)(OClO3)] at 300 K lie between theoretical spin-only values (μeff) of high-spin (5.92 μΒ) and intermediate-spin (3.87 μΒ), therefore, suggesting a predominant contribution of the S = 3/2 spin state to both complexes. These values are also smaller than those found in the admixed-spin systems [Fe(TPP)(OClO3)] (5.2 μΒ)34 and [Fe(OEP)(OClO3)] (4.8 μΒ).35
Table 1. Brief crystallographic data and data collection parameters
[Fe(TEtP)(OClO3)] [Fe(TPrP)(OClO3)] [Fe(TPrP)(THF)2]ClO4
Formula C28H28ClFeN4O4 C32H36ClFeN4O4 C40H52ClFeN4O6
FW 575.84 631.95 848.26
a, Å 10.2565(4) 10.8344(10) 23.085(2)
b, Å 10.9066(9) 11.889(2) 18.8929(5)
c, Å 12.5276(13) 12.0571(9) 9.4840(4)
, deg 111.095(12) 88.145(11) 90
, deg 96.075(8) 80.165(11) 90
γ, deg 105.626(7) 72.371(10) 90
V, Å3 1226.66(17) 1458.0(3) 4136.4(4)
Z 2 2 4
Space group P1 P1 Pna21
Dc, g/cm3 1.559 1.439 1.362
F(000) 598 662 1804
μ, mm–1 0.769 0.654 0.485
Radiation (λ, Å) 0.71073 0.71073 0.71073
Temperature, K 130(2) 130(2) 130(2)
Final R indices [I > 2 σ(I)] R1 = 0.0464 R1 = 0.0561 R1 = 0.0797
wR2 0.1211 wR2 0.1249 wR2 0.1967
Final R indices [for all data] R1 = 0.0525; R1 = 0.0714 R1 = 0.0984
wR2 0.1252 wR2 0.1337 wR2 0.2131
Fig. 1. ORTEP diagram of [Fe(TEtP)(OClO3)] displaying the atom labeling scheme. Thermal ellipsoids of all atoms are contoured at the 50% probability level. Hydrogen atoms have been omitted for clarity.
Fig. 2. ORTEP diagram [Fe(TPrP)(OClO3)] displaying the atom labeling scheme. Thermal ellipsoids of all atoms are contoured at the 50% probability level. Hydrogen atoms have been omitted for clarity.

EFFECT OF THE RUFFLED PORPHYRIN RING ON ELECTRONIC STRUCTURES 121
Copyright © 2013 World Scientific Publishing Company J. Porphyrins Phthalocyanines 2013; 17: 121–124
The temperature-dependent effective magnetic moments of both complexes are plotted in Figure 3, and can be fitted with a modified admixed intermediate-spin Maltempo model,37
( ) ( ) ( ). . . . .2-�� �� �� �� ��� �� �� �� ��
OH H L S L S g H S S J S Sβ= + ζ + ′ ′ + ′ ′
where HO is the splitting between the sextet and quartet states, and ζ is the spin-orbit coupling parameter. The fit is the solid and dashed lines in Fig. 3, yielding an 8 − 11% admixture of
S = 5/2 character in [Fe(TPrP)(OClO3)] and an admixture of only 1% S = 5/2 character in [Fe(TEtP)(OClO3)].
The coupling constants derived from fitting the magnetic data for both complexes imply that there is an antiferromagnetic magnetic exchange interaction of the iron(III) centers, the Fe-Fe exchange interaction in [Fe(TEtP)(OClO3)] is slightly bigger (J = −1.2 cm−1) than in [Fe(TPrP)(OClO3)] (J= −0.9 cm−1). The Fe–Fe interaction is consistent with their respective Fe–Fe distances of 5.44 and 6.07 Å in a pairwise π–π interaction.
Comparison of structural parameters with spin state for five-coordinate complexes are summarized in Table 3. It is found that there is a clear correlation between the
Table 2. Selected bond lengths (Å) and angles (°) for [Fe(TEtP)(OClO3)] and [Fe(TPrP)(OClO3)]
[Fe(TEtP)(OClO3)] [Fe(TPrP)(OClO3)]
Bond lengths (Å)
Fe(1)−N(1) 1.9775(17) 1.973(2)
Fe(1)−N(2) 1.9732(16) 1.9773(19)
Fe(1)−N(3) 1.9788(16) 1.971(2)
Fe(1)−N(4) 1.9672(16) 1.9678(19)
Fe(1)−O(1) 2.0840(15) 2.0631(18)
Bond angles (°)
N(1)−Fe(1)−N(2) 89.29(7) 88.91(8)
N(1)−Fe(1)−N(3) 162.90(7) 165.38(8)
N(1)−Fe(1)−N(4) 89.39(7) 88.93(8)
N(2)−Fe(1)−N(3) 89.09(7) 89.25(8)
N(2)−Fe(1)−N(4) 169.33(7) 166.22(8)
N(3)−Fe(1)−N(4) 89.06(7) 89.41(8)
N(1)−Fe(1)−O(1) 102.04(7) 97.62(8)
N(2)−Fe(1)−O(1) 92.49(6) 93.40(7)
N(3)−Fe(1)−O(1) 95.04(6) 96.97(8)
N(4)−Fe(1)−O(1) 98.15(7) 100.37(7)
Fig. 3. Comparison of observed and calculated values of μeff/monomer vs. T for [Fe(TEtP)(OClO3)](Δ) and [Fe(TPrP)(OClO3)] (o). The lines (solid or dashed) are model calculations assuming pairwise spin coupling. The parameters used were, for [Fe(TEtP)(OClO3)], mixed spin (5/2, 3/2) with the 3/2 excited-state multi-plet at 380 cm–1, spin-orbit coupling ζ = 35 cm-1, and antiferromagnetic coupling with J = –1.2 cm-1; for [Fe(TPrP)(OClO3)], with the 3/2 excited-state multiplet at 310 cm–1, spin-orbit coupling ζ = 118 cm-1, and antiferromagnetic coupling with J = –0.9 cm-1.
Table 3. Stereochemical/spin-state relationships for five-coordinate complexes.
Complex Fe Np, Å Fe-Aax, Å Δa, Å % S = 3/2 Core conformation Ref.
[Fe(TPP)(Cl)] 2.070(9) 2.211(1) 0.59 0 planar 44
1,2-bis[Fe(OEP)− 2.063(9) 1.873(9) 0.11 0 saddled 45
(OClO3)]ethanec 2.057(9) 1.940(7) 0.11 0 saddled 45
[Fe(TPP)(OCOCF3)] 2.054(5) 1.921(4) 0.48 0 saddled 46
[Fe(OEP)(OCOCCl3)]b 2.033(5) 1.975(9) 0.38 22 ruffled 47
[Fe(OMTPP)(Cl)] 2.034(6) 2.247(3) 0.51 35 saddled 10
[Fe(OETPP)(Cl)] 2.031(5) 2.2418(23) 0.43 40 saddled 10
[Fe(TPP)(OClO3)] 2.001(5) 2.029(4) 0.30 65 ruffled 34
[Fe(OEP)(OClO3)] 1.994(10) 2.067(9) 0.26 82 planar 35
[Fe(TEtP)(OClO3)] 1.974(5) 2.0840(15) 0.26 99 ruffledd tw
[Fe(TPrP)(OClO3)] 1.972(4) 2.0631(18) 0.29 ~91 ruffled tw
[Fe(OETPP)(OClO3)] 1.963(7) 2.059(6) 0.25 100 saddled 49a Iron atom displacement from 24-atom core. b Two crystalline forms.c 1,2-bis[perchloratoiron(III) 5-(2,3,7,8,12,13,17,18-octaethylporphyrinyl)]ethane.d There is a minor saddling component as well.

122 M. LI ET AL.
Copyright © 2013 World Scientific Publishing Company J. Porphyrins Phthalocyanines 2013; 17: 122–124
Fe−Np bond length and the percent S = 3/2 character, the shortened Fe−Np distance is characteristic of increased S = 3/2 character. This trend is attributed to the axial ligand strength and core conformation changes. As shown in Figure 4 illustrating the displacements of the macrocyclic atoms from the mean plane defined by the least-squares plane of the 24-atom porphyrin ring, both of the porphyrin rings are described as having ruffled conformation, and which is more highly ruffled than that found in [Fe(TPP)(OClO3)],
34 thus resulting in a higher population of S = 3/2 character due to destabilization of the dx2–y2 orbital.4,22 The saddled complexes have a different scenario from the ruffled complexes. In addition to destabilization of the dx2–y2 orbital, the saddle conformation also destabilizes the iron dπ (dxz and dyz) orbitals because
of the stronger interaction between the iron dπ and porphyrin 3eg orbitals.4,38
The molecular structure of [Fe(TPrP)(THF)2]ClO4 is shown in Fig. 5. Table 4 lists selected bond lengths and angles for [Fe(TPrP)(THF)2]ClO4. Two THF molecules are bonded to iron atom at the distances of 2.147(4) and 2.162(4) Å (average 2.155(7) Å), the four iron–nitrogen bond distances are almost identical, and their average value is 1.970(1) Å, which is significantly shorter than the 2.016(3) and 1.999(2) Å in the admixed intermediate spin complexes, [Fe(TPP)(THF)2]ClO4
23,39 and [Fe(OEP)(THF)2]ClO4,
40 respectively. A powder EPR spectrum
Fig. 4. Formal diagrams of the porphinato core displaying perpendicular displacements, in units of 0.0lÅ, of the core atoms from the 24-atom mean plane. Also entered on the diagrams are the values of the averaged bond distances (Å) and angles (°). [Fe(TEtP)(OClO3)] (top) and [Fe(TPrP)(OClO3)] (bottom).
Fig. 5. ORTEP diagram [Fe(TPrP)(THF)2]+ displaying the atom
labeling scheme. Thermal ellipsoids of all atoms are contoured at the 50% probability level. Hydrogen atoms have been omitted for clarity.
Table 4. Selected bond lengths (Å) and angles (°) for [Fe(TPrP)(THF)2]ClO4
Bond lengths (Å)
Fe(1)−N(1) 1.970(4) Fe(1)−N(4) 1.970(4)
Fe(1)−N(2) 1.971(4) Fe(1)−O(1) 2.147(4)
Fe(1)−N(3) 1.970(4) Fe(1)−O(2) 2.162(4)
Bond angles (°)
N(1)−Fe(1)−N(2) 89.82(17) N(2)−Fe(1)−O(1) 93.20(18)
N(1)−Fe(1)−N(3) 179.49(19) N(3)−Fe(1)−O(1) 89.70(17)
N(1)−Fe(1)−N(4) 89.92(17) N(4)−Fe(1)−O(1) 88.19(17)
N(2)−Fe(1)−N(3) 89.97(17) N(1)−Fe(1)−O(2) 91.32(17)
N(2)−Fe(1)−N(4) 178.59(19) N(2)−Fe(1)−O(2) 88.73(17)
N(3)−Fe(1)−N(4) 90.31(17) N(3)−Fe(1)−O(2) 89.14(17)
N(1)−Fe(1)−O(1) 89.84(18) N(4)−Fe(1)−O(2) 89.89(17)
O(1)−Fe(1)−O(2) 177.75(16)

EFFECT OF THE RUFFLED PORPHYRIN RING ON ELECTRONIC STRUCTURES 123
Copyright © 2013 World Scientific Publishing Company J. Porphyrins Phthalocyanines 2013; 17: 123–124
of [Fe(TPrP)(THF)2]ClO4 at 77 K has a signal with g⊥ = 4.00 while that obtained in CH2Cl2 shows signals with g⊥ = 4.16 and g = 2.00, indicative of an intermediate-spin (S = 3/2) iron III) porphyrins. The effective magnetic moments of [Fe(TPrP)(THF)2]ClO4, determined in the solid state, are 3.9 μB at 20 K and 4.1 μB at 300 K, and thus shows only a little temperature dependence between 300 K and 20 K. The observed moments are almost identical to the spin-only value of 3.9 μB for the intermediate-spin state. Therefore, the electronic structure of the iron in [Fe(TPrP)(THF)2]ClO4 is best described by a pure intermediate-spin (S = 3/2) state.
Figure 6 presents the formal diagram of the porphinato core of [Fe(TPrP)(THF)2]ClO4 displaying the perpendicular displacements of each atom from the 24-atom mean plane of the porphinato core. The porphyrin ring has a ruffled conformation, similar to those observed for [Fe(TEtP)(THF)2]ClO4
41 and [Fe(TiPrP)(THF)2]ClO4 (
iPr = isopropyl).42 The degree of distortion increases with increasing steric bulk at meso-positions, with the order of the distortion [Fe(TEtP)(THF)2]ClO4 < [Fe(TPrP)(THF)2]ClO4 < [Fe(TiPrP)(THF)2]ClO4. The average Fe−Np distances decrease in the same order with values 2.006(3), 1.970(1) and 1.967(12) Å.
The experimental studies have indicated that the highly ruffled conformation results in the destabilization of the dx2–y2 orbital due to the effective interactions between four nitrogen atoms and the iron dx2–y2 orbital,4 consequently, the electronic configuration of the iron (III) atom tends to be the intermediate-spin state with the increase of the core distortion. As demonstrated by NMR, EPR, Mössbauer and SQUID,43 [Fe(TEtP)(THF)2]ClO4 exhibits an admixture (S = 5/2, 3/2), but the complexes [Fe(TiPrP)
(THF)2]ClO4 and [Fe(EtPrP)(THF)2]ClO4 (EtPr = 1-ethylpropyl) are all pure intermediate spin-states.
ACKNOWLEDGEMENTS
We thank the National Institutes of Health for support of this research under Grant GM-38401 to WRS. Funds for the purchase of the FAST area detector diffractometer was provided through NIH Grant RR-06709 to the University of Notre Dame. We also thank the National Science Foundation for the purchase of the SQUID equipment under Grant DMR-9703732.
SUPPORTING INFORMATION
Crystallographic details (Tables S1–S3) are given in the supplementary material. This material is available free of charge via the Internet at http://www.worldscinet.com/jpp/jpp.shtml. Crystallographic data have been deposited at the Cambridge Crystallographic Data Centre (CCDC) under Nos. CCDC 896004–896006. Copies can be obtained on request, free of charge, via www.ccdc.cam.ac.uk/data_request/cif or from the Cambridge Crystallographic Data Centre, 12 Union Road, Cambridge CB2 1EZ, UK (fax: +44 1223–336–033 or email: [email protected]).
REFERENCES
1. Scheidt WR and Reed CA. Chem. Rev. 1981; 81: 543.
2. Weiss R, Gold A and Terner J. Chem. Rev. 2006; 106: 2550.
3. a) Evans DR and Reed CA. J. Am. Chem. Soc. 2000; 122: 4660. b) Reed CA and Guiset F. J. Am. Chem. Soc. 1996; 118: 3281.
4. Nakamura M. Coord. Chem. Rev. 2006; 250: 2271. 5. Senge MO. J. Chem. Soc., Chem. Commun. 2006;
243. 6. Shelnutt JA, Song X-Z, Ma J-G, Jia S-L, Jentzen W
and Medforth CJ. Chem. Soc. Rev.1998; 27: 31. 7. a) Walker FA. Chem. Rev. 2004; 104: 589. b) Walker
FA. Coord. Chem. Rev. 1999;185–186: 471. 8. Ghosh SK and Rath SP. J. Am. Chem. Soc. 2010;
132: 17983. 9. Abbreviations: TPP, dianion of tetraphenylporphy-
rin; OEP, dianion of octaethylporphyrin; OMTPP, dianion of 2,3,7,8,12,13,17,18-octamethyl-5,10, 15,20-tetraphenylporphyrin; OETPP, dianion of 2,3,7,8,12,13,17,18-octaethyl-5,10,15,20-tetra-phenylporphyrin; Np, porphinato nitrogen atom; H2TPrP, dianion of meso-tetra-n-propylporphyrin; H2TEtP, dianion of meso-tetraethylporphyrin; H2T
iPrP, dianion of meso-tetra-i-propylporphyrin. 10. Cheng R-J, Chen P-Y, Chen C-C and Peng S-M. J.
Am. Chem. Soc. 1997; 119: 2563.
Fig. 6. Formal diagram of the porphinato core displaying perpendicular displacements, in units of 0.01 Å, of the core atoms from the 24-atom mean plane for [Fe(TPrP)(THF)2]ClO4. Also entered on the diagrams are the values of the averaged bond distances(Å) and angles (°).

124 M. LI ET AL.
Copyright © 2013 World Scientific Publishing Company J. Porphyrins Phthalocyanines 2013; 17: 124–124
11. Schünemann V, Gerdan M, Trautwein AX, Haoudi N, Mandon D, Fisher J, Weiss R, Tabard A and Guilard R. Angew. Chem., Int. Ed. Engl. 1999; 38: 3181.
12. Veyrat M, Maury O, Faverjon F, Ovr DE, Ramas-seul R, Marchon JC, Turowska-Tyrk L and Scheidt WR. Angew. Chem., Int. Ed. Engl. 1994; 33: 220.
13. Ema T, Senge MO, Nelson NY, Ogoshi H and Smith KM. Angew. Chem., Int. Ed. Engl. 1994; 33: 1879.
14. Lin C-Y, Hu S, Rush T III and Spiro TG. J. Am. Chem. Soc. 1996; 118: 9452.
15. Jentzen W, Simpson MC, Hobbs JD, Song X, Ema T, Nelson NY, Medforth CJ, Smith KM, Veyrat M, Mazzanti M, Ramasseul R, Marchon JC, Takeuchi T, Gooddard WA III and Shelnutt JA. J. Am. Chem. Soc. 1995; 117: 11085.
16. Mazzanti M, Marchon JC, Shang M, Scheidt WR, Jai S and Shelnutt JA. J. Am. Chem. Soc. 1997; 119: 12400.
17. Nakamura M, Ikeue T, Fujii H and Yoshimura T. J. Am. Chem. Soc. 1997; 119: 6284.
18. Wolowiec S, Latos-Grazynski L, Toronto D and Marchon JC. Inorg. Chem. 1998; 37: 724.
19. Nakamura M, Ikeue T, Fujii H, Yokoyama M and Tajima K. Inorg. Chem. 1998; 37: 2405.
20. Ikeue T, Ohgo Y, Uchida A, Nakamura M, Fujii H and Yokoyama M. Inorg. Chem. 1999; 38: 1276.
21. Ikeue T, Ohgo Y, Saitoh T, Nakamura M, Fujii H and Yokoyama M. J. Am. Chem. Soc. 2000; 122: 4068.
22. Sakai T, Ohgo Y, Hoshino A, Ikeue T, Saitoh T, Takahashi T and Nakamura M. Inorg. Chem. 2004; 43: 5034.
23. Hoshino A, Ohgo Y and Nakamura M. Inorg. Chem. 2005; 44: 7333.
24. a) Li M, Neal TJ, Ehlinger N, Schulz CE and Scheidt WR. J. Porphyrins and Phthalo–cyanines 2010; 14: 115. b) Li M, Neal TJ, Wyllie GR, Schulz CE and Scheidt WR. Inorg. Chem. 2010; 49: 8078.
25. Neya S and Funasaki N. J. Heterocyclic Chem. 1997; 34: 689.
26. Lindsey JS, Schreiman IC, Hsu HC, Kearney PC and Marguerettaz AM. J. Org. Chem. 1989; 54: 828.
27. Adler AD, Longo FR, Kampas F and Kim, J. J. Inorg. Nucl. Chem. 1970; 32: 2443.
28. Scheidt WR and Turowska-Tyrk I. Inorg. Chem. 1994; 33: 1314.
29. Sheldrick GM. Acta Crystallogr. 1990; A46: 467.
30. Sheldrick GM. Acta Crystallogr. Sect. A. 2008; A64: 112.
31. Sutter TPG, Hambright P, Thorpe AN and Quoc N. Inorg. Chim. Acta 1992; 195: 131.
32. Selwood PW. Magnetochemistry, Interscience, New York, 1956; Chapter 2.
33. Earnshaw A. Introduction to Magnetochemistry. Academic, London, 1968; Chapter 1.
34. Reed CA, Mashiko T, Bentley SR, Kaster ME, Scheidt WR, Spartalian K and Lang G. J. Am. Chem. Soc. 1979; 101: 2948.
35. Masuda H, Taga T, Osaki K, Sugimoto H, Yoshida Z and Ogoshi H. Inorg. Chem. 1980; 19: 950.
36. Shelly K, Bartczak T, Scheidt WR and Reed CA. Inorg. Chem. 1985; 24: 4325.
37. Maltempo MM. J. Chem. Phys. 1974; 61: 2540. 38. Cheng R-L and Chen P-Y. Chem.-Eur. J. 1999; 5:
1708. 39. Chen L, Yi G-B, Wang L-S, Dharmawardana UR,
Dart AC, Khan MA and Richter-Addo GB. Inorg. Chem. 1998; 37: 4677.
40. a) Cheng B, Safo MK, Orosz RD, Reed CA, Deb-runner PG and Scheidt WR. Inorg. Chem. 1994; 33: 1319. b) Masuda H, Taga T, Osaki K, Sugimoto H, Yoshida Z and Ogoshi H. Bull. Chem. Soc. Jpn. 1982; 55: 3891.
41. Ohgo Y, Saitoh T and Nakamura M. Acta Cryst. 1999; C55: 1284.
42. Ohgo Y, Saitoh T and Nakamura M. Acta Cryst. 2001; C57: 233.
43. a) Ikeue T, Saitoh T, Yamaguchi T, Ohgo Y and Nakamura M. J. Chem. Soc., Chem. Commun. 2000; 1989. b) Sakai T, Ohgo Y, Ikeue T, Takahashi M, Takeda M and Naka mura M. J. Am. Chem. Soc. 2003; 125: 13028.
44. Scheidt WR and Finnegan MG. Acta Crystallogr. 1989; C45: 1214.
45. Ghosh SK, Patra R and Rath SP. Inorg. Chem. 2010; 49: 3449.
46. Moy SA, Gonzalez JA and Wilson LJ. Acta Crystal-logr. 1995; 51: 1490.
47. Neal TJ, Cheng B, Ma JG, Shelnutt JA, Schulz CE and Scheidt WR. Inorg. Chim. Acta 1999; 291: 49.
48. Scheidt WR, Geiger DK, Lee YJ, Reed CA and Lang G. Inorg. Chem. 1987; 26: 1039.
49. Barkigia KM, Renner MW and Fajer J. J. Porphy-rins and Phthalocyanines 2001; 5: 415.
Journal of Porphyrins and PhthalocyaninesJ. Porphyrins Phthalocyanines 2013; 17: 125–134
DOI: 10.1142/S1088424612501386
Published at http://www.worldscinet.com/jpp/
Copyright © 2013 World Scientific Publishing Company
INTRODUCTION
Photodynamic therapy (PDT) for the treatment of various tumors and other diseases has been remarkably well utilized in recent years because of its distinctive characteristics, such as a noninvasive therapeutic method and minimal damage to normal tissues. The mechanism of PDT is based on the administration of a photosensitizer (PS) by local injection. After injection of the PS, the appropriate light is irradiated on the tumor site and leads to the generation of highly reactive oxygen species including free radicals, radical anion species (O2
-, HO ) and singlet oxygen (1O2). These reaction products induce apoptosis and/or necrosis of exposed cells, and photodestruction of tumor vasculature [1–4]. Photofrin (PII), the first PS approved by the U.S. Food and drug administration (FDA), has been widely used in clinical PDT. However, several aspects of PII have proven
problematic, including low accumulation in tumor tissue, weak absorption of red light at approximately 630 nm and the risk of skin photoreactions that often occur in patients after PII administration for PDT [5, 6]. For these reasons, new PSs to supplement PII’s weaknesses have been synthesized in an attempt to kill cancerous cells with a greater efficiency and specificity. Primarily, metallo-phthalocyanine (MPc) has been considered as a replacement for PII [7–9]. The MPc structure is similar to that of porphyrins, but it has extra aromatic rings. MPc also strongly absorbs red light (molar extinction coefficient, 2.5 × 10⁵ M-1.cm-1, 675 nm), which allows a tissue penetration depth of light that is almost twice that of PII using 630 nm light. Moreover, MPc results in a reduced the incidence of skin photoreaction in patients after PDT treatment [10, 11]. Nevertheless, MPc is not applicable to physiological systems because it is water insoluble and induces precipitation in biological environments. To solve this problem, various nanotechnologies for PSs delivery have been studied [12, 13]. Some carriers, in particular those which use targeting ligands, liposomes
Advanced photodynamic agent from chondroitin
sulfate/zinc phthalocyanine conjugate
SongYi Baek and Kun Na*
Nano Biomedical Polymer Research Laboratory, Department of Biotechnology, The Catholic University of Korea, 43 Jibong-ro, Wonmi-gu, Bucheon-si, Gyeonggi-do 420-743, Korea
Received 28 September 2012Accepted 25 October 2012
ABSTRACT: In order to improve the therapeutic effect of zinc phthalocyanines (ZnPc), a photoactive nanodrug was prepared with acetylated chondroitin sulfate (AcCS), utilizing a simple chemical method. AcCS/ZnPc nanodrugs have a unimodal size distribution below 200 nm and a negative surface charge due to AcCS located on the nanodrug surface. In organic solvent such as DMSO or DMF, it has strong fluorescence intensity and generates abundant singlet oxygen. However, in aqueous solvent, AcCS/ZnPc nanodrugs developed a self-organized form which induced reducing fluorescence intensity and singlet oxygen generation. The cellular uptake of the nanodrug was determined using a cell lysis test and confocal microscopy observation. The results indicated that cellular internalization efficiency of the nanodrug was 1.7–2.1 times higher than that of free ZnPc. Also, the phototoxicity of the nanodrug was detected via MTT assay with or without light. Although free ZnPc did not exhibit cytotoxicity in both light and dark condition, the nanodrug exhibited increasing cytotoxicity after irradiation. We therefore suggest that AcCS/ZnPc nanodrugs may have promising applications as new photodynamic agents for the clinical treatment of various tumors.
KEYWORDS: zinc phthalocyanine, photoactive, nanodrug, chondroitin sulfate, phototoxicity.
*Correspondence to: Kun Na, email: [email protected], tel: +82 2-2164-4832, fax: +82 2-2164-4865

126 S. BAEK AND K. NA
Copyright © 2013 World Scientific Publishing Company J. Porphyrins Phthalocyanines 2013; 17: 126–134
or cell penetrating peptides have received considerable attention, allowing for the control of phototoxicity of PSs within the body [14] and also helping PSs to reach the targeting site. However, liposome was unstable that leaded to degradation of carriers before reach the targeting site. And also, other carrier systems appeared incomplete release and decreased singlet oxygen generation (SOG) by self-quenching effect. To solve these problems, we have previously reported on the nanodrug delivery system manufactured by hyaluronic acid, pullulan or chondroitin sulfate (CS) with pheophorbide-a or chlorin e6, which results appeared potential possibility of PDT [14–16]. These polysaccharide based nanodrug system revealed outstanding results in PDT. Therefore, in this study, we used CS as a cancer targetable nanodrug backbone for conjugation of zinc(II) tetracarboxyphthalocyanine (ZnPc) that was described as promising PS replacing first generation PSs. CS is a constituent of skin, cartilage, extracellular matrix (ECM) and umbilical cords, so it has superb biocompatibility [17, 18]. Moreover, CS is able to connect with CD44 receptor, which is overexpressed on cancer cells. For this reason, CS exhibits a particular efficiency of reaching target sites [19, 20].
To make an effective nanodrug, we firstly prepared acetylated CS (AcCS) for conjugation of ZnPc in organic solvent. When bound to each other through ester bonding, ZnPc is located in the hydrophobic core and AcCS is in the outer membrane, which contributes to combining cell membrane receptors like CD44 [21, 22], allowing favorable cellular uptake at the tumor site. AcCS/ZnPc nanodrug in aqueous solution showed reduced photoactivity, fluorescence intensity and SOG, owing to a self-quenching effect that was induced with the short distances between each of the ZnPc molecules
in the nanodrug. However, this self-quenching effect may disappear and induce tumor cell death with the destruction of the nanodrug structure as a result of enzymatic action of the ECM and cellular compartments such as endosomes and lysosomes [23] (Scheme 1).
In this paper, the physicochemical properties and photoactivity of the nanodrug were examined in terms of particle size, zeta potential, fluorescence intensity and SOG. Cellular internalization and in vitro phototoxicity were also determined by cell lysis test, confocal observation and an MTT assay.
MATERIALS AND METHODS
Materials
CS (25000 g/mol) was purchased from the Carl Roth Company (Germany). ZnPc (753.97 g/mol) was kindly provided by the Seoul National University (Seoul, Korea). Acetic anhydride (AA), pyridine, formamide, anhydrous dimethyl sulfoxide (DMSO) were purchased from Junsei Chemicals. 1,3-dicyclohexyl carbodiimide (DCC), 4-dimethylaminopyridine (DMAP), 3-(4,5-dimethyl-2-thiazolyl)-2,5-diphenyl-2H-tetrazolium bromide (MTT) were purchased from the Sigma-Aldrich Co. (St. Louis, MO, USA). The dialysis membrane was sourced from Spectrum Laboratories Inc. (Rancho Dominguez, CA). HeLa cells were obtained from the Korean Cell Line Bank (KCLB No. 10002). RPMI 1640 medium, fetal bovine serum (FBS), antibiotics (penicillin and streptomycin), and Dulbecco’s phosphate buffered saline (DPBS) were obtained from Gibco BRL (Invitrogen Corp., Carlsbad, CA, USA).
Scheme 1. Schematic concept of ACP nanodrugs. ACP nanodrugs do not show fluorescence intensity and singlet oxygen generation during blood circulation due to a self-quenching effect. However, when the nanodrugs are internalized in tumor cells, the lost photoactivities are restored due to the cleavage of the AcCS backbone, which is caused by various enzymes in cellular compartments

ADVANCED PHOTODYNAMIC AGENT FROM CHONDROITIN SULFATE/ZINC PHTHALOCYANINE CONJUGATE 127
Copyright © 2013 World Scientific Publishing Company J. Porphyrins Phthalocyanines 2013; 17: 127–134
Preparation of AcCS
In order to prepare the amphiphilic CS polymer, acetyl moieties were chemically introduced to CS. CS (1 g) was dissolved in 10 mL of formamide via vigorous stirring at room temperature. After 1 h, 150 μL of pyridine and 67 μL of AA were added. The reactant mixture was stirred for 12 h and it was then placed in a molecular porous dialysis membrane (molecular weight cutoff; MWCO size 3.5 kDa) for three days. The yellow AcCS powder was obtained by lyophilization. The structure of AcCS and the degree of acetylation were analyzed by 1H NMR spectroscopy. For 1H NMR (300 MHz, DMSO-d6), broad multiple peaks, δH, ppm 1.9 (3H, -COCH3, 3H, -NH-COCH3), were used. Also, the particle size and zeta potential of AcCS were estimated using a dynamic light scattering instrument (DLS; Zetasizer Nano ZS, Malvern Instruments Ltd., UK) and field emission scanning electron microscopy (FE-SEM; S-4700; Hitachi, Japan) (Supporting information, Fig. S1).
Synthesis of AcCS/ZnPc conjugate
The synthesis of AcCS/ZnPc conjugate was conducted via a conventional carbodiimide reaction. Two different
concentrations of ZnPc (3 or 5 mg) were dissolved in 5 mL of DMSO containing predetermined amounts of DCC and DMAP, respectively. The ZnPc solutions were vigorously stirred for 12 h to activate the carboxylic group of ZnPc. Two AcCS samples (50 mg) were dissolved in 10 mL of DMSO for 4 h with vigorously stirring. Each activated ZnPc solutions (3 or 5 mg) were added in AcCS solutions, respectively. The mixtures were vigorously stirred for 48 h at room temperature.
Using distilled water (DW), the reactants were dialyzed for three days with a dialysis membrane (MWCO 10 kDa) which was repeated three times to remove unreacted free ZnPc. After dialysis, first purified reactants undergo the vacuum filtration process. In that course, the unreacted ZnPc and dicyclohexylurea, side-products from the chemical reaction, were successfully removed. The final filtrate was flash frozen and lyophilized. And then, the synthesized AcCS/ZnPc compounds were analyzed through by 1H NMR spectroscopy using DMSO-d6 solution (Fig. 1) and FT-IR spectroscopy (Nicolet, Magna IR 550) (Supporting information, Fig. S2). In 1H NMR, δH, ppm 1.9 (3H, -COCH3 and 3H, -NH-COCH3) and 8.0 (1H, broad, -CH and 1H, s, -CH) were used.
OOSO3-
H
OHH
OH
COO-
OOSO3-
H H
H
NHCOCH3H
CH2OCCH3
OO
O
OOSO3-
H
OHH
OH
COO- H2COSO3
-
H H
H
NHCOCH3H
CH2O
OOO
n
NN
N
N
NNN
NZn
COOH
HOOC
C
COOH
O
ed
a
a c
b(a)
(b) (c)
Fig. 1. 1H NMR spectra of original materials and synthetic compounds. (a) structure of ACP compound, (b) 1H NMR spectra of free ZnPc and AcCS, (c) 1H NMR spectra of ACP 1 and 2 compounds. Comparing of (b) and (c) spectra, we confirmed synthetic results between AcCS and ZnPc

128 S. BAEK AND K. NA
Copyright © 2013 World Scientific Publishing Company J. Porphyrins Phthalocyanines 2013; 17: 128–134
Characterization of AcCS/ZnPc nanodrug
AcCS/ZnPc compounds were dissolved in aqueous solution to form self-organized nanoparticles. The particle size and zeta potential of each samples were estimated using a DLS at a wavelength of 488 nm using an argon ion laser system (Figs 2a and 2c). The determination of AcCS/ZnPc compound formation was performed at 25 °C in triplicate, with the sampling time and analysis set to automatic. The morphology of the compounds was observed under FE-SEM (Figs 2b and 2d). A drop of the nanodrug in water (10 μL) was placed on a graphite surface and was coated with Pt by sputtering for 4 min at 20 mA. The average size of AcCS/ZnPc nanodrugs was also assessed by measuring the diameter of particles in the SEM images.
Analysis of fluorescence and SOG from AcCS/ZnPc nanodrug
To estimate the photosensitizing efficiency and the self-quenching effect, free ZnPc, ACP 1 (AcCS/ZnPc 3 mg) and ACP 2 (AcCS/ZnPc 5 mg) were prepared. The concentration was adjusted to 5 μg/mL in DMSO and DW, respectively. Free ZnPc was dissolved in DMSO to make stock solutions (1 mg/mL), which were then diluted with DMSO or DW to adjust suitable concentration. Fluorescence spectra were determined at room temperature in 1 cm × 1 cm optical quartz cells using a fluorescence spectrophotometer (RF-5301PC; Shimadzu, Japan) with a xenon short-arc lamp (XOB 150; Ushino, Japan) and excitation at 670 nm (Fig. 3a). The fluorescence images were observed in a 96 well
(a) (b)
(c) (d)
Fig. 2. Size distribution and morphology of ACP nanodrugs. (a, c) Size distribution of the ACP 1 and ACP 2 by DLS. (b, d) Photographs of the ACP 1 and ACP 2 nanodrugs by FE-SEM

ADVANCED PHOTODYNAMIC AGENT FROM CHONDROITIN SULFATE/ZINC PHTHALOCYANINE CONJUGATE 129
Copyright © 2013 World Scientific Publishing Company J. Porphyrins Phthalocyanines 2013; 17: 129–134
plate using in vivo image station (IVIS) (Fig. 3b). All experiments were compared with 5 μg/mL of free ZnPc in DMSO or DW.
To evaluate the SOG of the ACP nanodrugs and free ZnPc, a chemical method using 9,10-dimethylanthracene (DMA) and singlet oxygen sensor green (SOSG) was used with fluorescent spectroscopy [24, 25]. When the appropriate light was irradiated to the mixture consisting of PS and DMA, 1O2 was generated from PS reacted with DMA and the DMA fluorescence intensity was reduced [26]. However, SOSG and water soluble reagent combined with 1O2 resulting in an increase in fluorescence intensity. ACP compound dissolved in DMF and DW were mixed with a solution of 20 μM DMA and 2.0 μM SOSG reagent, respectively. The mixture was then irradiated with a 670 nm laser source (Institute of Electronics) at 10 mW/cm2 for 10 min. The fluorescence intensity of DMA (Ex 360 nm, Em 380–550 nm) and SOSG (Ex494 nm, Em 534) was recorded every 40 s using a fluorescence spectrophotometer (Fig. 4).
Cell culture and incubation conditions
HeLa cells obtained from the KCLB were cultured in 10 mL of RPMI 1640 medium supplemented with 10% FBS and 1% penicillin/streptomycin. Cells were cultured at 37 °C in 100% humidity and 5% CO2 and were subcultured in new medium every 2–3 days. ACP 1 and 2 were dissolved in serum free (SF) medium, but free ZnPc, as a hydrophobic PS, was dissolved in DMSO and was then diluted in SF medium (DMSO concentration < 0.1%). The free ZnPc solution did not show precipitation which results confirmed transmittance test and observation of microscope. These data do not show in this paper. Untreated cells were irradiated or kept in the dark, and were used as a reference standard.
In vitro cellular uptake tests
To observe the cellular internalized ZnPc, a cell lysis test and confocal imaging were utilized.
Cell lysis test. To determine the concentration of cellular internalized ZnPc using lysis buffer, HeLa cells (1 × 10⁶ cells/well) were seeded into 6 well plates in 2 mL of culture medium and were treated with free ZnPc, ACP 1 and 2 nanodrugs (10 μg/mL of ZnPc) for 1, 3, 6, or 12 h at 37 °C. For further test, the concentration of ZnPc was decided by the cytotoxicity test result of free ZnPc (Supporting information, Fig. S3). The cells were then washed twice with DPBS, and protein extraction solution (RIPA buffer) was applied to HeLa cells for cell lysis. The lysis solution was separated to supernatant and debris using a centrifuge (12,000 rpm, 15 min), and the supernatant (100 μL) was transferred to a 96 well plate. Cellular uptake quantities of ACP nanodrugs and free ZnPc were estimated by using a fluorescence microplate reader (Fluorescence ELISA; Biotek, Synergy MX) at an excitation wavelength of 670 nm and an emission wavelength of 700 nm. All experiments were carried out three times.
Confocal microscopy. To observe the subcellular localization of the free ZnPc and the ACP nanodrug, the HeLa cells (1 × 10⁵ cells/well in a 12 well plate) were treated with the free ZnPc and the ACP nanodrug (10 μg/mL of ZnPc) for 6 h at 37 °C. The cells were then washed twice with DPBS, fixed with 4% paraformaldehyde, and visualized using a confocal laser scanning microscope (CLSM; LSM 510 Meta; Zeiss, Germany). An optimal pinhole size of 120 μm was selected to exclude fluorescent light emitted from out of focus planes above and below the focusing plane. An objective with magnifications of 400 was used for capturing the images. A laser line with a wavelength of 630 nm was used for the excitation of DAPI, and a HeNe laser line was used for the excitation
Fig. 3. Fluorescence intensity (F.I.) of free ZnPc and ACP nanodrugs. (a) Near-infrared (NIR) fluorescence intensity comparison in DMSO and DW. (b) NIR fluorescence images by IVIS; (i) free ZnPc, (ii) ACP 1, (iii) ACP 2. All samples are of the same concentration (5 μg/mL ZnPc)

130 S. BAEK AND K. NA
Copyright © 2013 World Scientific Publishing Company J. Porphyrins Phthalocyanines 2013; 17: 130–134
of ZnPc. A long pass filter (LP 650 nm) was used at the emission end for the detection of ZnPc. The fluorescence images were analyzed using the CLSM Image Browser software (Zeiss). In this experiment, we used ACP 2 nanodrug result because ACP 1 and 2 revealed same results, and cellular uptake time was based on the cell lysis test result.
In vitro phototoxicity test
HeLa cells (5 × 10⁴ cells/well) were seeded in 100 μL of culture medium on 96 well plates and were allowed to attach for 24 h. After incubation for 24 h, the medium was replaced with 100 μL of SF culture medium containing free ZnPc and ACP nanodrugs at different concentrations of ZnPc, and were incubated for a further 6 h. Prior to irradiation, the cells were washed twice with DPBS and were added to fresh culture medium. Samples were divided into two groups under contrasting conditions: one was irradiated at 30 J/cm2 by a 670 nm laser source (Institute of Electronics), and the other was not irradiated.
Cell viability was observed following incubation for 24 h using MTT assay. The data represent the percentage of viable cells compared to the control. All experiments carried out three times.
RESULTS AND DISCUSSION
Preparation of AcCS/ZnPc nanodrugs
CS, a linear polysaccharide containing a repeating unit, was used for the production of nanodrugs, including ZnPc. However, CS had poor solubility in organic solvent, which limited chemosynthesis between CS and ZnPc. For this reason, they required a hydrophobic moiety such as an acetyl group (-COCH3). To prepare the amphiphilic CS, we introduced hydrophobic acetyl groups of AA to CS, using pyridine as a catalyzer (Scheme 2). In this work, we adjusted the amount of minimum AA modification because the conversion of CS to AcCS was required to make CS soluble in DMSO for conjugation
OOSO3-
H
OHH
OH
COO-
OOSO3-
H H
H
NHCOCH3H
CH2OCCH3
OO
O
OOSO3-
H
OHH
OH
COO-
OOSO3-
H H
H
NHCOCH3H
CH2OH
OOO
n
OOSO3-
H
OHH
OH
COO-
OOSO3-
H H
H
NHCOCH3H
CH2OH
OO
n
O
H3C
C
O
C
CH3
O O
Chondroitin sulfate (CS) Acetic anhydride
Chondroitin sulfate acetate (AcCS)
NN N
N
NNN
N Zn
COOH
HOOC
HOOC
COOH
ZnPc(COOH)4
pyridinert, 12 h formamide
OOSO3-
H
OHH
OH
COO-
OOSO3-
H H
H
NHCOCH3H
CH2OCCH3
OO
O
OOSO3-
H
OHH
OH
COO- H2COSO3
-
H H
H
NHCOCH3H
CH2O
OOO
n
NN
N
N
NNN
NZn
COOH
HOOC
C
COOH
O
DCC & DMAPrt, 48 h DMSO
AcCS/ZnPc compound
+
+
Scheme 2. Synthetic scheme of ACP conjugates

ADVANCED PHOTODYNAMIC AGENT FROM CHONDROITIN SULFATE/ZINC PHTHALOCYANINE CONJUGATE 131
Copyright © 2013 World Scientific Publishing Company J. Porphyrins Phthalocyanines 2013; 17: 131–134
with ZnPc. Acetylated CS was determined by 1H NMR in DMSO-d6. Generally, the proton signal of acetyl group appeared at δ = 1.9 ppm in 1H NMR spectrometry, but acetamidomethyl group’s peak in the CS chain appeared at 1.9 ppm also. We therefore disentangled the acetylation degree, comparing the increased intensity between the original CS and AcCS. The degree of acetylation was calculated to be 0.38 acetyl groups per unit (two glucose rings of CS). After AcCS analysis was complete, we synthesize ACP nanodrugs. The synthesis of ZnPc into AcCS was conducted through a carbodiimide reaction between the carboxyl groups of ZnPc and the hydroxyl groups of CS, and a flow diagram of the process is shown in Scheme 2. The final compounds structure of ACP 1 or 2, which was reacted with different amounts of ZnPc (3 or 5 mg) into AcCS backbone, was observed by 1H NMR (Fig. 1) and FT-IR (Supporting information, Fig. S2). In the 1H NMR spectrum, the δ = 8 ppm peak from ZnPc disappeared due to conjugation between carboxyl groups of ZnPc and hydroxyl groups of AcCS, producing a new peak at 1.9 ppm which originated from the acetyl groups of AcCS. In the FT-IR spectra of ACP compounds, they revealed C=O stretching at 1740 cm-1 and C–O bond at 1132 cm-1. This results show that AcCS and ZnPc were conjugated with each other through the ester bond. From the 1H NMR and FT-IR data, we supposed AcCS and ZnPc were successfully synthesized each others. The ZnPc concentration incorporated into ACP compounds was estimated by UV using a standard curve of free ZnPc, and ACP 1 and 2 compounds samples fed with 3 and 5 mg ZnPc into AcCS backbone showed 98.81 and 97.06% conjugation yield, respectively (Table 1).
Physicochemical properties of AcCS/ZnPc nanodrugs
To estimate the physicochemical properties of ACP compounds, such as size distribution or zeta potential using DLS, we dissolved samples in DW. In the aqueous phase, ACP compounds showed a self-aggregated behavior owing to hydrophobic moieties of ZnPc, which induced strong hydrophobic interactions amongst themselves, and were located within the inner core of nanodrugs. Their particle sizes were about 260 nm with a monodispersed size distribution which was smaller than only AcCS particle (about 610 nm) because AcCS had minimum AA quantities, hydrophobic moieties, that leading to formation of larger particles (Supporting information, Fig. S1). And also, All ACP nanodrugs (ACP
1 or 2) showed a strong negative charge indicating that the AcCS chain perfectly shielded ZnPc (Table 1). The morphology of ACP nanodrugs observed by FE-SEM was homogeneously distributed in spherical shapes, and all sizes were below 200 nm (Fig. 2). Comparing the DLS results, the nanodrug’s size from FE-SEM was much smaller because DLS samples were dissolved in water, increasing their size.
Photoactivity of AcCS/ZnPc nanodrugs
The photoactivity of ACP nanodrugs in terms of fluorescence intensity and SOG yield was estimated by fluorescence spectrophotometry and IVIS. In organic solvent, DMSO, free ZnPc, ACP 1 and 2 exhibited similar fluorescence intensities, indicating that ACP compounds maintained their original photoactivity. However, in aqueous solutions, the fluorescence intensities of all samples was dramatically reduced due to a self-quenching effect (Fig. 3a). When ACP 1 and 2 were dissolved in DW, ACPs formed nanoparticles by π-π interactions between ZnPcs located in the core, and/or cross-linking of the CS backbone. This phenomenon added to the self-quenching effect, resulting in the reduction of fluorescence intensity of all samples. The fluorescence images of free ZnPc, ACP 1 and 2 compounds in different solvent such as DMSO or DW were also observed using IVIS (Fig. 3b).
To evaluate the SOG of the ACP nanodrugs and free ZnPc, DMA and SOSG were used as indicators with fluorescent spectroscopy detection. In DMF, the fluorescence intensity of free ZnPc and ACP nanodrugs showed sharply reduced tendencies (Fig. 4a). This meant that all samples were evenly distributed in DMF and 1O2 was rapidly generated upon laser irradiation. However, in aqueous solvent, SOG of free ZnPc and ACP nanodrugs could scarcely generate 1O2 because of the self-quenching effect (Fig. 4b), indicating ZnPc assembly in the core of nanodrugs or free ZnPc aggregation in water. This crucial difference in the two solutions suggests that ACP nanodrugs have a targeted photoactivity.
In vitro cellular uptake of AcCS/ZnPc nanodrugs
To observe the cellular uptake behavior of free ZnPc and ACP nanodrugs, a cell lysis test with RIPA buffer and confocal microscopy observation using human cervical cancer (HeLa) cells were investigated.
Table 1. Physicochemical characterization of the ACP nanodrugs
Feed ZnPC, mga Conjugation yield, % Average size, nm Z-Potentials, mV
ACP 1 3 98.81265.1 ± 1.7 (PDI: 0.159)
-34.8 ± 0.8
ACP 2 5 97.06269.9 ± 4.7 (PDI: 0.182)
-34.8 ± 0.7
a Feeding ZnPC weight per 50 mg of AcCS.

132 S. BAEK AND K. NA
Copyright © 2013 World Scientific Publishing Company J. Porphyrins Phthalocyanines 2013; 17: 132–134
In the cell lysis test, all samples were incubated with HeLa cells for 1, 3, 6 or 12 h (Fig. 5). From the results, ACP 1 and 2 compounds appeared to have similar uptake quantities, except at 6 h, where the ZnPc concentration of ACP 2 was a little higher than that of ACP 1. However, free ZnPc showed low extracted ZnPc concentrations at all the tested times compared to nanodrug samples (ACP 1 and 2). These two different tendencies indicated that cellular internalization of free ZnPc occurred by passive diffusion, but ACP nanodrugs used a ligand-receptor pathway which helped nanodrugs influx into HeLa cells. Although the cellular internalization mechanism of AcCS/PS is still unsure, most polysaccharide based nanoparticles have been investigated to prove the cellular uptake mechanism, and many papers showed that the CS based nanodrug
was internalized into HeLa cells via sugar receptor [16, 27]. The confocal microscopy observation provided cellular internalization and distribution efficiency of the free ZnPc and ACP nanodrug (Fig. 6). From the results, we found that the free ZnPc did not present any vestige of a red fluorescence signal due to its low cellular internalization efficiency (Fig. 6a). However, the ACP nanodrug appeared strong fluorescence intensities in HeLa cells because CS located on nanodrug shells easily bounded CD44 receptors from the cancer cell membrane (Fig. 6b). The internalized ZnPc was mostly observed in the cytosol.
Phototoxicity of the AcCS/ZnPc nanodrugs
To estimate the phototoxicity of the ACP nanodrugs and free ZnPc, the viability of HeLa cells was measured after treatment with or without light at an intensity of 30 J/cm2 using a 670 nm laser source (Fig. 7). Cells treated with no light and no drugs were used as a control group, indicating a cell viability of 100%. In the case of free ZnPc, light or no light test results showed a similar tendency in cytotoxicity due to the lower cellular internalization efficiency. However, ACP 1 and 2 revealed different cytotoxicity results under light conditions compared to free ZnPc. With light conditions, ACP 1 and 2 showed enhanced cytotoxicity in the range of 50 μg/mL to 100 μg/mL. As we expected from the cellular uptake test results, the cytotoxicity of ACP 1 and 2 nanodrugs was much higher than that of free ZnPc, because nanodrugs internalized HeLa cells through the ligand-receptor pathway using CD44. When they are localized in cellular compartments such as endosomes or lysosomes, enzymatic actions induced the degradation of ACP nanodrugs. The ZnPc separated from the nanodrugs then recovered photoactivity in the cells, resulting in high cytotoxicity [12, 14].
Fig. 4. Singlet oxygen generation analysis of the free ZnPc and ACP nanodrugs. (a) Changes of DMA fluorescent intensity according to time in the presence of ZnPc samples in DMF. (b) Changes of SOSG fluorescent intensity in DW. Sample concentration is 5 μg/mL (ZnPc). Irradiation power is 10 mW/cm2 with 670 nm light source; ( : free ZnPc, : ACP 1, : ACP 2)
Fig. 5. Comparison of the uptake quantities among free ZnPc and ACP nanodrugs over time. ZnPc uptake was quantitatively analyzed with RIPA buffer (n = 3)
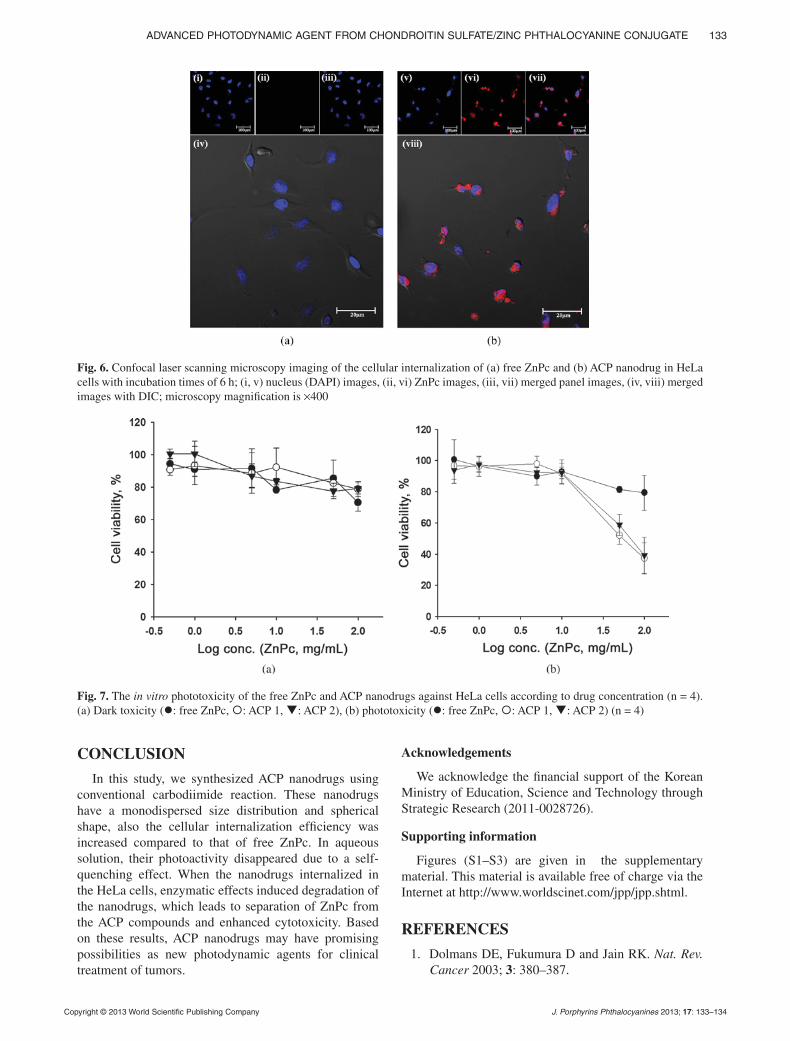
ADVANCED PHOTODYNAMIC AGENT FROM CHONDROITIN SULFATE/ZINC PHTHALOCYANINE CONJUGATE 133
Copyright © 2013 World Scientific Publishing Company J. Porphyrins Phthalocyanines 2013; 17: 133–134
CONCLUSION
In this study, we synthesized ACP nanodrugs using conventional carbodiimide reaction. These nanodrugs have a monodispersed size distribution and spherical shape, also the cellular internalization efficiency was increased compared to that of free ZnPc. In aqueous solution, their photoactivity disappeared due to a self-quenching effect. When the nanodrugs internalized in the HeLa cells, enzymatic effects induced degradation of the nanodrugs, which leads to separation of ZnPc from the ACP compounds and enhanced cytotoxicity. Based on these results, ACP nanodrugs may have promising possibilities as new photodynamic agents for clinical treatment of tumors.
Acknowledgements
We acknowledge the financial support of the Korean Ministry of Education, Science and Technology through Strategic Research (2011-0028726).
Supporting information
Figures (S1–S3) are given in the supplementary material. This material is available free of charge via the Internet at http://www.worldscinet.com/jpp/jpp.shtml.
REFERENCES
1. Dolmans DE, Fukumura D and Jain RK. Nat. Rev. Cancer 2003; 3: 380–387.
Fig. 6. Confocal laser scanning microscopy imaging of the cellular internalization of (a) free ZnPc and (b) ACP nanodrug in HeLa cells with incubation times of 6 h; (i, v) nucleus (DAPI) images, (ii, vi) ZnPc images, (iii, vii) merged panel images, (iv, viii) merged images with DIC; microscopy magnification is ×400
Fig. 7. The in vitro phototoxicity of the free ZnPc and ACP nanodrugs against HeLa cells according to drug concentration (n = 4). (a) Dark toxicity ( : free ZnPc, : ACP 1, : ACP 2), (b) phototoxicity ( : free ZnPc, : ACP 1, : ACP 2) (n = 4)

134 S. BAEK AND K. NA
Copyright © 2013 World Scientific Publishing Company J. Porphyrins Phthalocyanines 2013; 17: 134–134
2. Krestyn E, Kolarova H, Bajgar R and Tomankova K. Toxicol. In Vitro 2010; 24: 286–291.
3. Ding H, Yu H, Dong Y, Tian R, Huang G, Boothman DA, Sumer BD and Gao J. J. Control Release 2011; 156: 276–280.
4. Pass HI. J. Natl. Cancer. Inst 1993; 85: 443–456. 5. Berg K, Bommer JC and Moan J. Cancer Lett.
1989; 44: 7–15. 6. Macdonald IJ and Dougherty TJ. J. Porphyrins
Phthalocyanines 2001; 5: 105–129. 7. Spikes JD. Photochem Photobiol. 1986; 43:
691–699. 8. Allen CM, Sharman WM and Van Lier JE. J. Por-
phyrins Phthalocyanines 2001; 5: 161–169. 9. Rosenthal I. Photochem Photobiol. 1991; 53:
859–870. 10. Wan S, Parrish JA, Anderson R and Madden M.
Photochem Photobiol. 1981; 34: 679–681. 11. Brasseur N, Ali H, Autenrieth D, Langlois R and
Van Liert JE. Photochem Photobiol. 1985; 42: 515–521.
12. Park W, Park SJ and Na K. Biomaterials 2011; 32: 8261–8270.
13. Jang B, Park JY, Tung CH, Kim IH and Choi Y. ACS nano 2011; 5: 1086–1094.
14. Bae BC and Na K. Biomaterials 2010; 31: 6325–6335.
15. Li F, Bae BC and Na K. Bioconjug. Chem 2010; 21: 1312–1320.
16. Li F and Na K. Biomacromolecules 2011; 12: 1724–1730.
17. Wang DA, Varghese S, Sharma B, Strehin I, Ferma-nian S, Gorham J, Fairbrother DH, Cascio B and Elisseeff JH. Nat. Mater. 2007; 6: 385–392.
18. Volpi N and Maccari F. J. Chromatogr. B 2006; 834: 1–13.
19. Aruffo A, Stamenkovic I, Melnick M, Underhill CB and Seed B. Cell 1990; 61: 1303–1313.
20. Murai T, Sougawa N, Kawashima H, Yamagu-chi K and Miyasaka M. Immunol. Lett. 2004; 93: 163–170.
21. Culty M, Nguyen HA and Underhill CB. J. Cell Biol. 1992; 116: 1055–1062.
22. Underhill C. J. Cell Sci. 1992; 103: 293–298. 23. Chen K, Preuss A, Hackbarth S, Wacker M,
Langer K and Roder B. J. Photochem. Photobiol. B 2009; 96: 66–74.
24. Wilkinson F and Brummer JG. J. Phys. Chem. Ref. Data 1981; 10: 809–999.
25. Corey EJ and Taylor WC. J. Am. Chem. Soc. 1964; 86: 3881–3882.
26. Usui Y. Chem. Lett. 1973; 2: 743–744. 27. Park W, Park SJ and Na K. Colloids Surf. B Bioin-
terfaces 2010; 79: 501–508.

Journal of Porphyrins and PhthalocyaninesJ. Porphyrins Phthalocyanines 2013; 17: 135–141
DOI: 10.1142/S1088424612501398
Published at http://www.worldscinet.com/jpp/
Copyright © 2013 World Scientific Publishing Company
INTRODUCTION
Since a vitamin B12 derivative was isolated from an anaerobic microbe as a cofactor of a reductive dehalogenase involved [1], vitamin B12 and derivatives have received much attention from the viewpoint of remediation catalysts. Vitamin B12 and derivatives can acquire oxidation states Co(III), Co(II) or Co(I) [2–4], and the latter has been demonstrated to dehalogenate several halogenated pollutants utilizing its supernucleophilicity [5–11], in which an eco-friendly catalytic process is also required.
To meet the increasing demand for eco-friendly catalytic processes, photocatalysis with visible light is regarded as a promising method [12 14]. In this context, inorganic sensitizers, such as [Ru(bpy)3]
2+ (bpy = 2,2′-bipyridine), have been combined with conventional catalytic systems [15 19]. Moreover, readily available organic dyes have been used to overcome the high cost of the ruthenium complex [20–22]. We have been dealing with a hydrophobic vitamin B12, heptamethyl cobyrinate perchlorate [Cob(II)7C1ester]ClO4 1 [23, 24], as shown in Chart 1 and succeeded in combining it with [Ru(bpy)3]
2+ to develop visible-light-driven dehalogenation systems [25–27]. Furthermore, we have attempted to replace the ruthenium complex by a well-known xanthene dye, Rose Bengal [28]. However, the previous B12 model complex-Rose Bengal system was not applicable to prolonged photocatalysis due to the low
Dechlorination of DDT catalyzed by visible-light-driven
system composed of vitamin B12 derivative and Rhodamine B
Keishiro Taharaa,b, Kumiko Mikuriyaa, Takahiro Masukoa, Jun-ichi Kikuchib and
Yoshio Hisaeda*a,c
a Department of Chemistry and Biochemistry, Graduate School of Engineering, Kyushu University, Fukuoka 819-0395, Japan b Graduate School of Materials Science, Nara Institute of Science and Technology, Ikoma 630-0192, Japan c Center for Molecular Systems (CMS), Kyushu University, Fukuoka 819-0395, Japan
Received 18 October 2012Accepted 2 November 2012
ABSTRACT: The visible-light-driven dechlorination of 1,1-bis(4-chlorophenyl)-2,2,2-trichloroethane (DDT) was carried out in the presence of a hydrophobic vitamin B12, heptamethyl cobyrinate perchlorate and Rhodamine B. DDT was successfully dechlorinated to form 1,1-bis(4-chlorophenyl)-2,2-dichloroethane (DDD) as the mono-dechlorinated product upon visible light irradiation with a tungsten lamp (λ > 440 nm). Upon prolonged visible light irradiation to DDT, DDMU (1-chloro-2,2-bis(4-chlorophenyl)ethylene), DDMS (1-chloro-2,2-bis(4-chlorophenyl)ethane) and DCS (trans-4,4′-dichlorostilbene) were obtained as the di- and tri-dechlorinated products. The use of the photostable organic sensitizer enabled prolonged photocatalysis via a noble-metal-free process. The vitamin B12 derivative was replaced by an imine/oxime-type cobalt complex although the cobalt complex system showed a lower catalytic activity than the B12 derivative system. The dechlorination mechanism in the B12-Rhodamin B system was investigated by various methods such as UV-vis absorption and fluorescence quenching.
KEYWORDS: vitamin B12, Rhodamine B, organic photosensitizer, DDT, dechlorination, visible-light-driven catalysis.
SPP full member in good standing
*Correspondence to: Yoshio Hisaeda, email: [email protected], tel: +81 92-802-2826, fax: +81 92-802-2827

136 K. TAHARA ET AL.
Copyright © 2013 World Scientific Publishing Company J. Porphyrins Phthalocyanines 2013; 17: 136–141
photostability of the organic dye. To achieve both a good photostability and a noble-metal-free process, we herein chose Rhodamine B 2 [29, 30] as a new sensitizer. Our choice of 2 was based on its excellent photostability and potential use as an electron mediator (E0(Rho/Rho −) = −0.8 V vs. SCE)) [20, 30], although the application of 2 to reductive organic transformations represents almost unexplored research area. In this study, we demonstrate that the present B12 model complex-Rhodamine B system efficiently dechlorinates 1,1-bis(4-chlorophenyl)-2,2,2-trichloroethane (DDT) and 1,1-bis(4-chlorophenyl)-2,2-dichloroethane (DDD) via a visible-light-driven process without noble metal complexes as sensitizers. An imime/oxime-type cobalt complex was also used to investigate appreciate reaction conditions for the efficient dechlorination. Furthermore, we demonstrate that the use of the photostable organic sensitizer enables prolonged photocatalysis.
EXPERIMENTAL
Materials
All chemicals were of reagent grade and used as received. Ethanol-d6 (C2D5OD) was purchased from ISOTEC. DDT and DDD were purchased from TCI. Heptamethyl cobyrinate perchlorate, [Cob(II)7C1ester] (1) [23] and diaqua(11-hydroxyimino-4,10-dipropyl-5,9-diazatrideca-4,9-dien-3-one oximato)cobalt(II) tetraphenylborate, [Co(II){(C2C3)(DO)(DOH)pn}]B(C6H5)4 (3) [31] were synthesized by previously reported methods.
General analyses and measurements
The UV-vis absorption spectra were measured using a Hitachi U-3300 spectrometer at room temperature. The 1H NMR spectra were recorded by a Bruker Avance 500 spectrometer installed at the Center of Advanced Instrumental Analysis of Kyushu University, and the chemical shifts (in ppm) were referenced relative to the residual protic solvent peak.
The GC-MS data were obtained using a Shimadzu GC-QP5050A equipped with a J&W Scientific DB-1 column (length 30 m; ID 0.25 mm, film 0.25 μm). The quenching experiments of the singlet excited state of Rhodamine B 2 were performed using a Hitachi F-4501 spectrofluorometer at 25 °C. The fluorescence quenching of 2 by triethanolamine (TEOA) was analyzed using the Stern–Volmer plot [32].
Photocatalysis
As a typical experiment of the photochemical reduction of 1, the EtOH solution containing 1 (2.5 × 10⁻⁵ M), 2 (2.5 × 10⁻⁶ M) and TEOA (2.5 × 10⁻² M) was degassed for 10 min then irradiated with a 200 W tungsten lamp with a cutoff filter (λ > 440 nm). After irradiation, the photochemical reaction was followed by UV-vis spectroscopy. Reference experiments in the absence of either TEOA, 2 or in the dark was performed in the same manner.
As a typical experiment of the photocatalytic dechlorination, the EtOH solution containing 1 (5.0 × 10⁻⁴ M), 2 (5.0 × 10⁻⁵ M), TEOA (5.0 × 10⁻¹ M) and DDT (1.0 × 10⁻² M) was degassed for 10 min. The solution was stirred and irradiated with a 200 W tungsten lamp with a cutoff filter (λ > 440 nm) at ambient temperature for 1 h. After irradiation, water was added to the reaction solution and the products were extracted with diethylether and hexane. The products were identified by 1H NMR comparisons with the corresponding authentic samples [33–35]. The authentic samples of DCS [7], DDMU [33] and DDMS [36] were synthesized according to the previously reported methods. The product yields were quantified by 1H NMR comparisons with 1,4-dioxane as the internal standard in the same manner as the previous reports. The photocatalytic dechlorination was carried out in EtOH-d6, the deuterium incorporation ratio in the dechlorinated product was determined by 1H NMR and GC-MS. The photocatalysis of DDD was performed in a similar manner.
RESULTS AND DISCUSSION
Photochemical reduction of vitamin B12 derivative
We first attempted to activate 1 to the supernucleophilic Co(I) species by a photocatalytic process. We chose TEOA as an electron donor for the present B12-Rhodamine B system. This is because TEOA has been widely used as a sacrificial reducing agent for photocatalytic systems [37, 38]. Indeed, it was demonstrated that Rhodamine B was reductively quenched by tertiary amines [39]. The UV-vis absorption spectrum of an EtOH solution of 1
Chart 1.
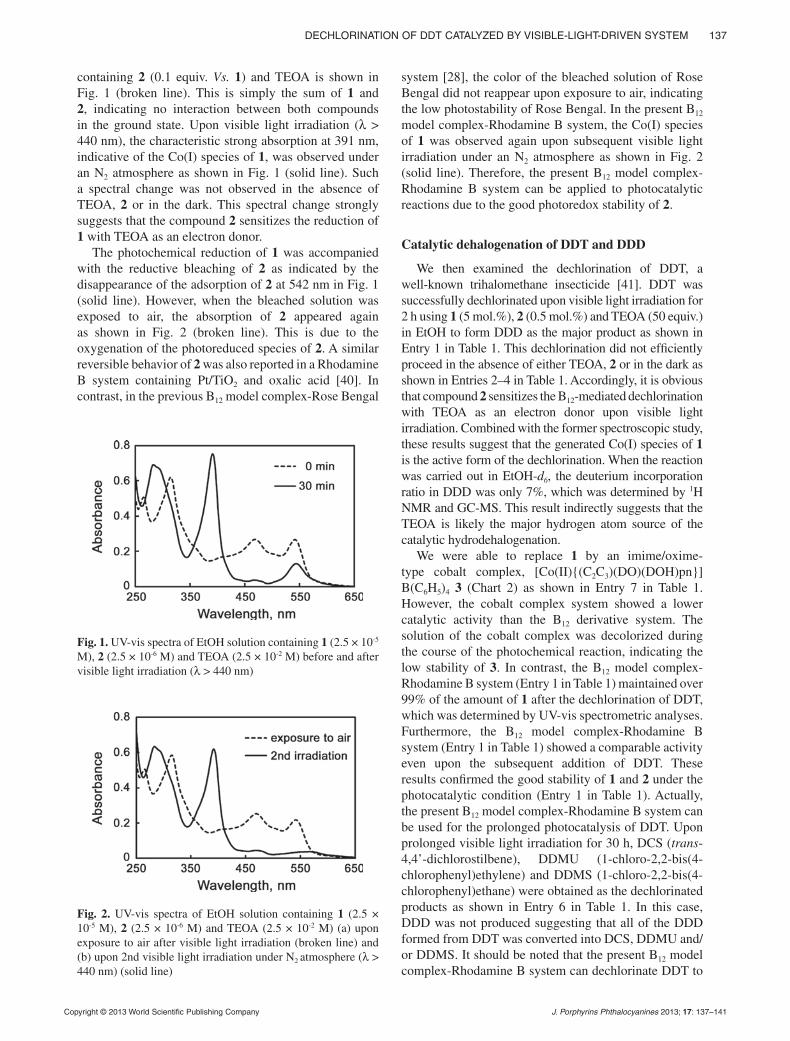
DECHLORINATION OF DDT CATALYZED BY VISIBLE-LIGHT-DRIVEN SYSTEM 137
Copyright © 2013 World Scientific Publishing Company J. Porphyrins Phthalocyanines 2013; 17: 137–141
containing 2 (0.1 equiv. Vs. 1) and TEOA is shown in Fig. 1 (broken line). This is simply the sum of 1 and 2, indicating no interaction between both compounds in the ground state. Upon visible light irradiation (λ > 440 nm), the characteristic strong absorption at 391 nm, indicative of the Co(I) species of 1, was observed under an N2 atmosphere as shown in Fig. 1 (solid line). Such a spectral change was not observed in the absence of TEOA, 2 or in the dark. This spectral change strongly suggests that the compound 2 sensitizes the reduction of 1 with TEOA as an electron donor.
The photochemical reduction of 1 was accompanied with the reductive bleaching of 2 as indicated by the disappearance of the adsorption of 2 at 542 nm in Fig. 1 (solid line). However, when the bleached solution was exposed to air, the absorption of 2 appeared again as shown in Fig. 2 (broken line). This is due to the oxygenation of the photoreduced species of 2. A similar reversible behavior of 2 was also reported in a Rhodamine B system containing Pt/TiO2 and oxalic acid [40]. In contrast, in the previous B12 model complex-Rose Bengal
system [28], the color of the bleached solution of Rose Bengal did not reappear upon exposure to air, indicating the low photostability of Rose Bengal. In the present B12 model complex-Rhodamine B system, the Co(I) species of 1 was observed again upon subsequent visible light irradiation under an N2 atmosphere as shown in Fig. 2 (solid line). Therefore, the present B12 model complex-Rhodamine B system can be applied to photocatalytic reactions due to the good photoredox stability of 2.
Catalytic dehalogenation of DDT and DDD
We then examined the dechlorination of DDT, a well-known trihalomethane insecticide [41]. DDT was successfully dechlorinated upon visible light irradiation for 2 h using 1 (5 mol.%), 2 (0.5 mol.%) and TEOA (50 equiv.) in EtOH to form DDD as the major product as shown in Entry 1 in Table 1. This dechlorination did not efficiently proceed in the absence of either TEOA, 2 or in the dark as shown in Entries 2–4 in Table 1. Accordingly, it is obvious that compound 2 sensitizes the B12-mediated dechlorination with TEOA as an electron donor upon visible light irradiation. Combined with the former spectroscopic study, these results suggest that the generated Co(I) species of 1 is the active form of the dechlorination. When the reaction was carried out in EtOH-d6, the deuterium incorporation ratio in DDD was only 7%, which was determined by 1H NMR and GC-MS. This result indirectly suggests that the TEOA is likely the major hydrogen atom source of the catalytic hydrodehalogenation.
We were able to replace 1 by an imime/oxime-type cobalt complex, [Co(II){(C2C3)(DO)(DOH)pn}]B(C6H5)4 3 (Chart 2) as shown in Entry 7 in Table 1. However, the cobalt complex system showed a lower catalytic activity than the B12 derivative system. The solution of the cobalt complex was decolorized during the course of the photochemical reaction, indicating the low stability of 3. In contrast, the B12 model complex-Rhodamine B system (Entry 1 in Table 1) maintained over 99% of the amount of 1 after the dechlorination of DDT, which was determined by UV-vis spectrometric analyses. Furthermore, the B12 model complex-Rhodamine B system (Entry 1 in Table 1) showed a comparable activity even upon the subsequent addition of DDT. These results confirmed the good stability of 1 and 2 under the photocatalytic condition (Entry 1 in Table 1). Actually, the present B12 model complex-Rhodamine B system can be used for the prolonged photocatalysis of DDT. Upon prolonged visible light irradiation for 30 h, DCS (trans-4,4’-dichlorostilbene), DDMU (1-chloro-2,2-bis(4-chlorophenyl)ethylene) and DDMS (1-chloro-2,2-bis(4-chlorophenyl)ethane) were obtained as the dechlorinated products as shown in Entry 6 in Table 1. In this case, DDD was not produced suggesting that all of the DDD formed from DDT was converted into DCS, DDMU and/or DDMS. It should be noted that the present B12 model complex-Rhodamine B system can dechlorinate DDT to
Fig. 1. UV-vis spectra of EtOH solution containing 1 (2.5 × 10⁻⁵ M), 2 (2.5 × 10⁻⁶ M) and TEOA (2.5 × 10⁻² M) before and after visible light irradiation (λ > 440 nm)
Fig. 2. UV-vis spectra of EtOH solution containing 1 (2.5 × 10⁻⁵ M), 2 (2.5 × 10⁻⁶ M) and TEOA (2.5 × 10⁻² M) (a) upon exposure to air after visible light irradiation (broken line) and (b) upon 2nd visible light irradiation under N2 atmosphere (λ > 440 nm) (solid line)

138 K. TAHARA ET AL.
Copyright © 2013 World Scientific Publishing Company J. Porphyrins Phthalocyanines 2013; 17: 138–141
form the tri-dechlorinated compound (DCS) as the major product.
The B12 model complex-Rhodamine B system was further utilized for the dechlorination of the relatively less reactive DDD. DDD was successfully dechlorinated upon visible light irradiation for 30 h to form DCS, DDMU and DDMS as dechlorinated products as shown in Entry 1 in Table 2. These dechlorinated products were also obtained from DDD in the previous catalytic systems mediated by 1 [34, 36]. The product distribution from DDD in Entry 1 in Table 2 is similar to that from DDT in Entry 6 in Table 1. These results confirm the
above-mentioned suggestion that DDT was dechlorinated to DDD, which was further dechlorinated to the di- and/or tri-dechlorinated products in Entry 6 in Table 1.
Mechanistic aspects
To gain a mechanistic insight into the photochemical reduction of 1, quenching experiments of the singlet excited state of 2 in EtOH were performed. Fluorescence quenching of 2 was observed upon the addition of TEOA and analyzed using the Stern–Volmer plot [32] as shown in Fig. 3. The quenching rate constant (kq) was determined to be 4.7 × 10⁸ M-1.s-1. This result is consistent with a previous report that the singlet excited state of 2 is reductively quenched by tertiary amines such as triethylamine [39]. On the other hand, the fluorescent quenching of 2 was not observed upon the addition of 1.
Based on the present and previous studies [33, 36, 42], a plausible reaction mechanism for Entry 1 in Table 1 is proposed as shown in Fig. 4. Initially, the singlet excited state of 2 is reductively quenched by TEOA to form the one-electron-reduced species of 2 (Rho −) and the nitrogen-centered radical cation (TEOA +). It was proposed that the deprotonation of TEOA + by TEOA yields a carbon-centered radical and that the hydrogen atom abstraction at TEOA by TEOA + yields another
Table 1. Catalytic dechlorination of DDT mediated by B12 model complex-Rhodamine B systema
Product yields, %c
Entry Compound Conversion, %b DDD DCS DDMU DDMS TNd
1 1, 2 100 93 0 0 0 186
2 1, 2e 3 1 0 0 0 2
3 1, 2f 0 — — — — 0
4 1 29 23 0 0 0 —
5 2 19 16 0 0 0 32
6 1, 2g 100 0 58 13 20 364
7 2, 3h 71 47 0 0 0 94
8 1, [Ru(bpy)3]2+ i 100 89 0 0 0 178
aConditions: [1] = 5.0 × 10⁻⁴ M, [2] = 5.0 × 10⁻⁵ M, [DDT] = 1.0 × 10⁻² M, [TEOA] = 5.0 × 10⁻¹ M, solvent: EtOH, N2 atmosphere with irradiation by a 200 W tungsten lamp (λ > 440 nm) for 2 h. bConversion was estimated by the recovery of DDT. cProducts were analyzed by NMR. dTotal turnover numbers based on the initial concentration of Rhodamine B. eThe reaction was carried out in the dark. f In the absence of TEOA. gProlonged visible light irradiation for 30 h. h[3] = 5.0 × 10⁻⁴ M. i [[Ru(bpy)3]
2+] = 5.0 × 10⁻⁵ M.
Chart 2.

DECHLORINATION OF DDT CATALYZED BY VISIBLE-LIGHT-DRIVEN SYSTEM 139
Copyright © 2013 World Scientific Publishing Company J. Porphyrins Phthalocyanines 2013; 17: 139–141
carbon-centered radical [43 45]. These carbon-centered radicals denote a second electron to form the products as shown in Fig. 4 [43 45]. The electron transfer from Rho − to 1 affords the formation of the Co(I) species of the B12 derivative because the combination of 1 and 2 is thermodynamically favorable (E0(Co(II)/Co(I)) = −0.64 V vs. SCE [24], E0(Rho/Rho −) = −0.8 vs. SCE [20, 30]). The resulting supernucleophilic Co(I) species of the B12 derivative dechlorinates DDT to form an alkylated complex. The Co–C bond of the alkylated complex is cleaved by visible light irradiation to form a radical species and 1. The radical species mainly abstracts hydrogen from TEOA to form DDD. The turnover numbers based on 2 was 186 (Entry 1 in Table 1). The UV-vis spectrometric analyses revealed that 89% of 2 was unchanged after the dechlorination of DDT.
Table 2. Catalytic dechlorination of DDD mediated by B12 model complex-Rhodamine B systema
Entry Compound Conversion, %b
Product yields, %c
TNdDCS DDMU DDMS
1 1, 2 94 56 25 14 190
2 1 1 0 0 0 0
3 2 2 0 1 0 2
aConditions: [1] = 5.0 × 10⁻⁴ M, [2] = 5.0 × 10⁻⁵ M, [DDT] = 1.0 × 10⁻² M, [TEOA] = 5.0 × 10⁻¹ M, solvent: EtOH, N2 atmosphere with irradiation by a 200 W tungsten lamp (λ > 440 nm) for 30 h. bConversion was estimated by the recovery of DDD. cProducts were analyzed by NMR. dTotal turnover numbers based on the initial concentration of Rhodamine B.
Fig. 3. Stern–Volmer plot of fluorescence quenching of 2 (1.0 × 10⁻⁶ M) by TEOA at 25 °C. λex = 530 nm, λem = 568 nm; F0 = original fluorescence intensity, F = fluorescence intensity after addition of TEOA
Fig. 4. Proposed mechanism of the dechlorination of DDT mediated by B12 model complex-Rhodamine B system

140 K. TAHARA ET AL.
Copyright © 2013 World Scientific Publishing Company J. Porphyrins Phthalocyanines 2013; 17: 140–141
This result confirms the good photoredox stability of Rhodamine B in the present system. The use of such a photostable sensitizer enabled the efficient electron transfer from the electron donor (TEOA) to the final acceptor (DDT) to afford good turnovers relative to 2. Thus, we have successfully replaced [Ru(bpy)3]
2+ in the previous system [25] (Entry 8 in Table 1) by an organic sensitizer without a decrease in the catalytic activity. The DDD formed from DDT is further dechlorinated by the Co(I) species of the B12 derivative to form an alkylated complex. According to a previous mechanistic study on the reaction of vitamin B12 with DDD [46], the alkylated complex reacts via a cobalt chloride α-elimination to yield DCS. This is analogous to the reaction of organic gem-dihalide with copper [47]. The α-elimination generates a carbenoid type intermediate which will readily rearrange to the product. DDMU and DDMS are formed by the β-elimination and the hydrogen abstraction of the radical species resulting from the homolysis of the alkylated complex, respectively [36].
CONCLUSION
In conclusion, a new catalytic system composed of a vitamin B12 derivative and Rhodamine B dechlorinated DDT to DDD via a noble-metal-free and visible-light-driven process. Furthermore, the present B12 model complex-Rhodamine B system can be used for the prolonged photocatalysis to further dechlorinate DDD to form the tri-dechlorinated compound as the major product.
Acknowledgements
This work was partially supported by a Grant-in-Aid for Scientific Research on Innovative Areas “Molecular Activation toward Straightforward Synthesis” (No. 23105537) from the Ministry of Education, Culture, Sports, Science and Technology (MEXT) of Japan and a Grant-in-Aid for Challenging Exploratory Research (No. 24655134) from the Japan Society for the Promotion of Science (JSPS), SEKISUI “Innovations Inspired by Nature” Support Program, and Kyushu University P&P Program.
REFERENCES
1. Kräutler B, Fieber W, Ostermann S, Fasching M, Ongania K, Gruber K, Kratky C, Mikl C, Siebert A and Diekert G. Helv. Chim. Acta 2003; 86: 3698.
2. Kräutler B. Vitamin B12 and B12-Proteins, Kräutler B, Arigoni D and Golding BT. (Eds.) Wiley-VCH: Weinheim, 1998.
3. Wohlfarth G and Diekert G. Chemistry and Bio-chemistry of B12, Banerjee R. (Eds.) Wiley-Inter-science: New York, 1999.
4. Toraya T. Chem. Rev. 2003; 103: 2095–2128.
5. Jensen KP. J Phys Chem B 2005; 109: 10505–10512. 6. Liptak MD and Brunold TC. J. Am. Chem. Soc.
2006; 128: 9144–9156. 7. Zanette D and Nome F. J. Org. Chem. 1979; 44:
2308–2309. 8. Rusling JF, Miaw CL and Couture EC. Inorg. Chem.
1990; 29: 2025–2027. 9. Burris DR, Delcomyn CA, Smith MH and Roberts
AL. Environ. Sci. Technol. 1996; 30: 3047–3052. 10. Shey JA and van der Donk WA. J. Am. Chem. Soc.
2000; 122: 12403–12404. 11. McCauley KM, Pratt DA, Wilson SR, Shey J,
Burkey TJ and van der Donk WA. J. Am. Chem. Soc. 2005; 127: 1126–1136.
12. Albini A and Fagnoni M. Green Chem. 2004; 6: 1–6.
13. Palmisano G, Augugliaro V, Pagliaro M and Palmisano L. Chem. Commun. 2007; 3425–3437.
14. Fagnoni M, Dondi D, Ravelli D and Albini A. Chem. Rev. 2007; 107: 2725–2756.
15. Fukuzumi S. Bull. Chem. Soc. Jpn. 1997; 70: 1–28. 16. Nicewicz DA and MacMillan DWC. Science 2008;
322: 77–80. 17. Ischay MA, Anzovino ME, Du J and Yoon TP.
J. Am. Chem. Soc. 2008; 130: 12886–12887. 18. Narayanam JMR, Tucker JW and Stephenson RJ.
J. Am. Chem. Soc. 2009; 131: 8756–8757. 19. Zeitler K. Angew. Chem. Int. Ed. 2009; 48:
9785–9789. 20. Neumann M, Fueldner S, Koenig B and Zeitler K.
Angew. Chem. Int. Ed. 2011; 50: 951–954. 21. Hari DP and Koenig B. Org. Lett. 2011; 13:
3852–3855. 22. Hari DP and Schroll P and Konig B. J. Am. Chem.
Soc. 2012; 134: 2958–2961. 23. Murakami Y, Hisaeda Y and Kajihara A. Bull.
Chem. Soc. Jpn. 1989; 56: 3642–3646. 24. Hisaeda Y, Nishioka T, Inoue Y, Asada K and
Hayashi T. Coord. Chem. Rev. 2000; 198: 21–37. 25. Shimakoshi H, Tokunaga M, Baba T and Hisaeda Y.
Chem. Commun. 2004; 1806–1807. 26. Shimakoshi H, Kudo S and Hisaeda Y. Chem. Lett.
2005; 34: 1096–1097. 27. Shimakoshi H, Nishi M, Tanaka A, Chikama K and
Hisaeda Y. Chem. Commun. 2011; 47: 6548–6550. 28. Tahara K and Hisaeda Y. Green Chem. 2011; 13:
558–561. 29. Beija M, Afonso CAM and Martinho JMG. Chem.
Soc. Rev. 2009; 38: 2410–2433. 30. Mchedlov-Petrossyan NO, Kukhtik VI and Bezugliyz
VD. J. Phys. Org. Chem. 2003; 16: 380–397. 31. Murakami Y, Hisaeda Y, Fan S-D and Matsuda Y.
Bull. Chem. Soc. Jpn. 1989; 62: 2219–2228. 32. Lakowicz JR. Principles of Fluorescence
Spectroscopy, Springer-Verlag: New York, 2006. 33. Shimakoshi H, Tokunaga M and Hisaeda Y. Dalton
Trans. 2004; 878–882.

DECHLORINATION OF DDT CATALYZED BY VISIBLE-LIGHT-DRIVEN SYSTEM 141
Copyright © 2013 World Scientific Publishing Company J. Porphyrins Phthalocyanines 2013; 17: 141–141
34. Shimakoshi H, Sakumori E, Kaneko K and Hisaeda Y. Chem. Lett. 2009; 38: 468–469.
35. Shimakoshi H, Li L, Nishi M and Hisaeda Y. Chem. Commun. 2011; 47: 10921–10923.
36. Jabbar MA, Shimakoshi H and Hisaeda Y. Chem. Commun. 2007; 1653–1655.
37. Esswein AJ and Nocera DG. Chem. Rev. 2007; 107: 4022–4047.
38. Lazarides T, McCormick T, Du P, Luo G, Lindley B and Eisenberg R. J. Am. Chem. Soc. 2009; 131: 9192–9194.
39. Frank AJ, Otvos JW and Calvin M. J. Phys. Chem. 1979; 83: 716–722.
40. Li LX, Lu GX and Li SB. J. Photochem. Photobio. A 2002; 152: 219–228.
41. Fellenberg G. The Chemistry of Pollution, Wiley: Chichester, 2000; pp 123.
42. Tahara K, Shimakoshi H, Tanaka A and Hisaeda Y. Bull. Chem. Soc. Jpn. 2010; 83: 1439–1446.
43. Probst B, Rodenberg A, Guttentag M, Hamm P and Alberto R. Inorg. Chem. 2010; 49: 6453–6460.
44. Kutal C, Weber MA, Ferraudi G and Geiger D. Organometallics 1985; 4: 2161–2166.
45. Chan S-F, Chou M, Creutz C, Matsubara T and Sutin N. J. Am. Chem. Soc. 1981; 103: 369–379.
46. Nome F and Zanette D. Can. J. Chem. 1990; 58: 2402–2405.
47. Kawabata N, Naka M and Yamashita S. J. Am. Chem. Soc. 1976; 98: 2676–2677.

Journal of Porphyrins and PhthalocyaninesJ. Porphyrins Phthalocyanines 2013; 17: 142–149
DOI: 10.1142/S1088424612501404
Published at http://www.worldscinet.com/jpp/
Copyright © 2013 World Scientific Publishing Company
INTRODUCTION
Self-exchange reactions are the simplest reactions in solution, in which reactants and products are the same, and therefore there is no change in the free energy associated to them. Self-exchange rates and activation parameters derived under these conditions can be used to interpret redox reactions in which a net chemical change occurs (cross reactions) [1]. The knowledge of self-exchange rates is also of technological interest, in particular the self-exchange reaction rates of redox molecules control the efficiency of the electron transfer mediation in biosensors [2]. Most of the self-exchange rates in electron transfer between proteins containing redox-active metals reported to date have been measured by NMR [3–5]. In diamagnetic-paramagnetic exchange systems, the most widespread approach to determine electron self-exchange rate constants is the use of transverse relaxation rate (1/T2) enhancements obtained by measuring the broadening of resonances of the diamagnetic form as a function of the concentration of the paramagnetic species [6]. Electron
self-exchange rate constants can also be derived from T1 values determined by inversion recovery methods [5, 7, 8] because relaxation of the magnetization of a nucleus exchanging between two sites becomes bi-exponential when the isolated sites decay mono-exponentially, each with its own time constant (T1
ox, T1red). Under these
conditions the determination of the self-exchange rate is based on the measure of: (i) the apparent T1 of the nucleus in one of the two redox forms as observed in the mixture of oxidized and reduced protein; (ii) the T1 of the nucleus in the reduced protein in the absence of exchange; (iii) the T1 of the nucleus in the oxidized protein in the absence of exchange. The knowledge of the concentrations of the two redox states is also required [6].
When the exchange rate is slow with respect to the chemical shift difference of the nuclei undergoing exchange, magnetization transfer occurs and can be detected in suitably designed experiments [9]. The integrated intensity of cross peaks in two-dimensional EXSY experiments is related to chemical exchange rate constant, and 1H–1H EXSY experiments have been employed to learn about self-exchange electron transfer processes [4, 10, 11]. 1D saturation transfer experiments can also be used to the same purpose [12], they have also been peformed to identify exchange when signals of one
Electron self-exchange of cytochrome c measured via 13C
detected protonless NMR
Stefano Cacciatore, Mario Piccioli and Paola Turano*
Magnetic Resonance Center (CERM) and Department of Chemistry, University of Florence, Via L. Sacconi 6, Sesto Fiorentino 50019, Italy
Received 27 September 2012Accepted 11 November 2012
ABSTRACT: The use of protonless 13C –13C′ EXSY (COCO-EXSY) is proposed here to measure electron self-exchange rates. The experiment is compared to the commonly employed 1H and 15N EXSY experiments using as a reference system human cytochrome c. In COCO-EXSY, the exchange peaks are stronger than in the other experiments with respect to the self peaks and their intensity is less dependent on the choice of the EXSY mixing time. The use of 13C directed detection may be essential for all those cases where T2 relaxation is detrimental, as in the case of proteins containing highly paramagnetic metal centers, or rotating slowly in solution, or where the amide signals are difficult to detect due to chemical or conformational exchange. The proposed experiment has a general applicability and can be used to monitor exchange phenomena different from electron self-exchange.
KEYWORDS: electron self-exchange, protonless NMR, EXSY, 13C direct detection, cytochrome c.
SPP full member in good standing
*Correspondence to: Paola Turano, email: [email protected], tel: +39 055-457-4266, fax: +39 055-457-4253

ELECTRON SELF-EXCHANGE OF CYTOCHROME c MEASURED via 13C DETECTED PROTONLESS NMR 143
Copyright © 2013 World Scientific Publishing Company J. Porphyrins Phthalocyanines 2013; 17: 143–149
of the two species are broadened beyond detection [13, 14]. HSQC-type spectra as well as 1D saturation transfer have been used to study folding/unfolding equilibria [15–17], proline cis/trans isomerizations [18], slow complex formation [19, 20]. They have been used also to assign 15N-HSQC cross-peaks of paramagnetic proteins under conditions in which the paramagnetic form of the protein exchanges with its diamagnetic form on the appropriate time scale [21]. The best performing variant of the 15N-HSQC experiment for chemical exchange uses 15N longitudinal magnetization and therefore allows the simultaneous measurement of exchange and 15N longitudinal relaxation rates (Nz exchange) [17]. Nz exchange experiments rely on 15N–15N EXSY that, with respect to those based on 1H–1H EXSY, has the advantage to involve a nucleus with longer relaxation times. Here we present a new experiment: the COCO-EXSY in which exchange occurs between 13C′ spins. Indeed, an exchange experiment that relies on the 13C spin of backbone carbonyl groups is expected to have better performances than one based on 15N transfer because of the lower 13C′ relaxation rates. Furthermore 13C direct detection, albeit a theoretical (γH/γC)5/2 decrease in sensitivity, has been proved to be particularly suitable for the characterization of the coordination sphere in highly paramagnetic species [22–28], of very high molecular weight systems [29–32], and of proteins where 1H resonances are broadened beyond detection due to exchange phenomena [33–36].
To demonstrate this approach and to discuss various aspects of electron self-exchange measurements via NMR, experiments have been recorded using as reference system mixtures of 13C,15N uniformly labeled reduced and oxidized human cytochrome c. Cytochrome c is one of the most commonly studied electron transfer proteins for biochemical studies. Since early 70’s cytochrome c has been spectroscopically characterized by NMR in both oxidation states [37–43]. Later on, structural and dynamic features of cytochrome c have been extensively studied by high field NMR [44–54] when isolated and when interacting with redox partners. More recently, its role as a mediator in apoptosis has open new routes of structural investigation [55–59]. Cytochrome c has been found to possess some peroxidase activity in vivo [60] and in vitro [61]. It also reacts with superoxide and this reaction has been used for the detection of this reactive oxygen species in solution already for long time [62]. The reaction can be also confined to surfaces and combined with heterogeneous electron transfer to electrodes to result in a sensor allowing spatially and time resolved
measurements [63, 64]. Our group has been recently involved in a collaborative project for the development of cytochrome c based biosensors [65, 66].
RESULTS AND DISCUSSION
The COCO-EXSY experiment
Electron self-exchange rates between oxidized and reduced forms of human cytochrome c were measured with different pulse sequences, with magnetization pathways as in Fig. 1.
In standard 1H–1H EXSY [67] (Fig. 1a) 1Hz spins are transferred from one state to the other via a routine 15N HSQC-1H NOESY experiment [68, 69] in which the mixing time is optimized to detect peaks arising from chemical exchange rather than dipolar interactions. The NMR signals are acquired on the 15N dimension prior to the exchange and on the 1H dimension after the exchange mixing period. Each backbone amide group HN gives a typical pattern of two self peaks ( ox ox
i iN H and rd rdi iN H ) and
two exchange peaks ( ox rdi iN H and rd ox
i iN H ). The same four-peak pattern is obtained when
magnetization exchange between the two states occurs via 15Nz–
15Nz transfer (Fig. 1b) [17]. After 15N chemical shift evolution, magnetization is converted in a pure Nz state and exchange occurs; finally Nz spins are converted into observable 1H signals. Essentially, the pulse sequence is the same used to measure non-selective 15N longitudinal relaxation times T1, where the inversion recovery period is replaced by the exchange mixing time. Although providing the same four-peak pattern, these two experiments may differ in the relative intensity of exchange and self peaks.
Fig. 1. Magnetization pathways in different pulse sequences. (a) 15N HSQC–1H EXSY; (b) 15N HSQC–15N EXSY; (c) 13C observed COCO-EXSY. Labels A and B indicate the two different protein forms. Spins acquired in both dimensions are indicated by circles. The rectangular boxes indicate the EXSY mixing period and exchanging spins. Indices z and x indicate the state of the magnetization on the z axis or on the x, y plane, respectively
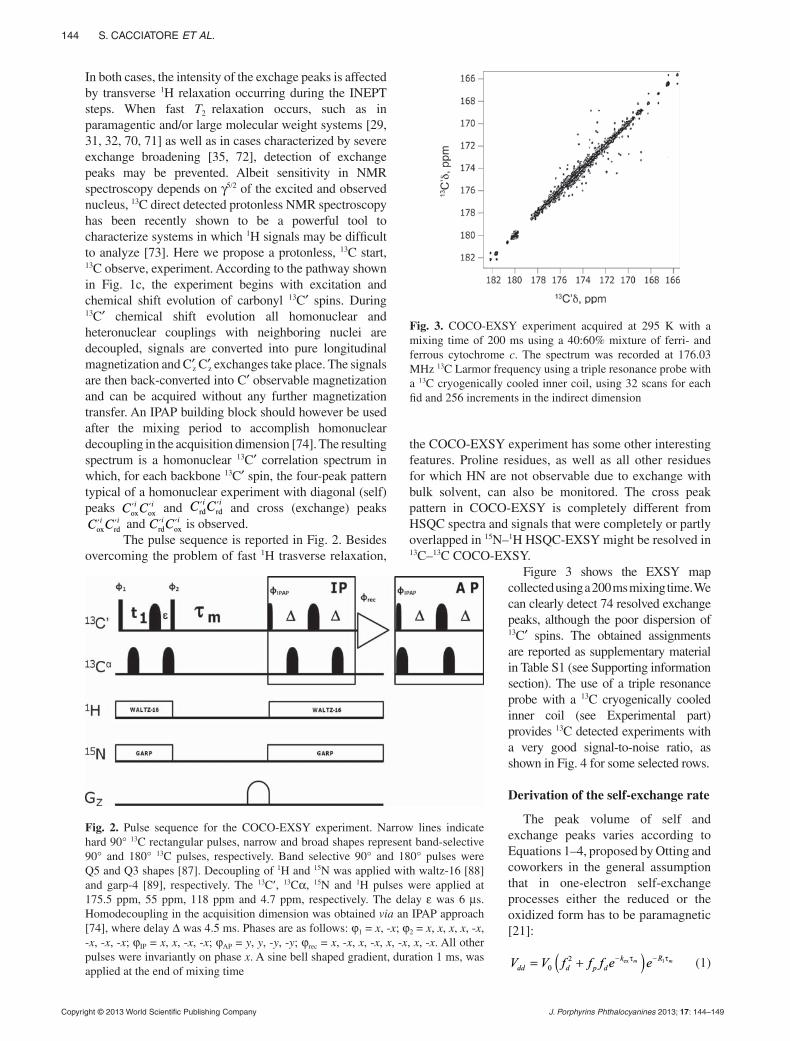
144 S. CACCIATORE ET AL.
Copyright © 2013 World Scientific Publishing Company J. Porphyrins Phthalocyanines 2013; 17: 144–149
In both cases, the intensity of the exchage peaks is affected by transverse 1H relaxation occurring during the INEPT steps. When fast T2 relaxation occurs, such as in paramagentic and/or large molecular weight systems [29, 31, 32, 70, 71] as well as in cases characterized by severe exchange broadening [35, 72], detection of exchange peaks may be prevented. Albeit sensitivity in NMR spectroscopy depends on γ5/2 of the excited and observed nucleus, 13C direct detected protonless NMR spectroscopy has been recently shown to be a powerful tool to characterize systems in which 1H signals may be difficult to analyze [73]. Here we propose a protonless, 13C start, 13C observe, experiment. According to the pathway shown in Fig. 1c, the experiment begins with excitation and chemical shift evolution of carbonyl 13C′ spins. During 13C′ chemical shift evolution all homonuclear and heteronuclear couplings with neighboring nuclei are decoupled, signals are converted into pure longitudinal magnetization and C′z C′z exchanges take place. The signals are then back-converted into C′ observable magnetization and can be acquired without any further magnetization transfer. An IPAP building block should however be used after the mixing period to accomplish homonuclear decoupling in the acquisition dimension [74]. The resulting spectrum is a homonuclear 13C′ correlation spectrum in which, for each backbone 13C′ spin, the four-peak pattern typical of a homonuclear experiment with diagonal (self) peaks ox ox
i iC C′ ′ and rd rdi iC C′ ′ and cross (exchange) peaks
ox rdi iC C′ ′ and rd ox
i iC C′ ′ is observed. The pulse sequence is reported in Fig. 2. Besides
overcoming the problem of fast 1H trasverse relaxation,
the COCO-EXSY experiment has some other interesting features. Proline residues, as well as all other residues for which HN are not observable due to exchange with bulk solvent, can also be monitored. The cross peak pattern in COCO-EXSY is completely different from HSQC spectra and signals that were completely or partly overlapped in 15N–1H HSQC-EXSY might be resolved in 13C–13C COCO-EXSY.
Figure 3 shows the EXSY map collected using a 200 ms mixing time. We can clearly detect 74 resolved exchange peaks, although the poor dispersion of 13C′ spins. The obtained assignments are reported as supplementary material in Table S1 (see Supporting information section). The use of a triple resonance probe with a 13C cryogenically cooled inner coil (see Experimental part) provides 13C detected experiments with a very good signal-to-noise ratio, as shown in Fig. 4 for some selected rows.
Derivation of the self-exchange rate
The peak volume of self and exchange peaks varies according to Equations 1–4, proposed by Otting and coworkers in the general assumption that in one-electron self-exchange processes either the reduced or the oxidized form has to be paramagnetic [21]:
( )ex 120
m mk Rdd d p dV V f f f e e− τ − τ= + (1)
Fig. 2. Pulse sequence for the COCO-EXSY experiment. Narrow lines indicate hard 90° 13C rectangular pulses, narrow and broad shapes represent band-selective 90° and 180° 13C pulses, respectively. Band selective 90° and 180° pulses were Q5 and Q3 shapes [87]. Decoupling of 1H and 15N was applied with waltz-16 [88] and garp-4 [89], respectively. The 13C , 13Cα, 15N and 1H pulses were applied at 175.5 ppm, 55 ppm, 118 ppm and 4.7 ppm, respectively. The delay ε was 6 μs. Homodecoupling in the acquisition dimension was obtained via an IPAP approach [74], where delay Δ was 4.5 ms. Phases are as follows: ϕ1 = x, -x; ϕ2 = x, x, x, x, -x, -x, -x, -x; ϕIP = x, x, -x, -x; ϕAP = y, y, -y, -y; ϕrec = x, -x, x, -x, x, -x, x, -x. All other pulses were invariantly on phase x. A sine bell shaped gradient, duration 1 ms, was applied at the end of mixing time
Fig. 3. COCO-EXSY experiment acquired at 295 K with a mixing time of 200 ms using a 40:60% mixture of ferri- and ferrous cytochrome c. The spectrum was recorded at 176.03 MHz 13C Larmor frequency using a triple resonance probe with a 13C cryogenically cooled inner coil, using 32 scans for each fid and 256 increments in the indirect dimension

ELECTRON SELF-EXCHANGE OF CYTOCHROME c MEASURED via 13C DETECTED PROTONLESS NMR 145
Copyright © 2013 World Scientific Publishing Company J. Porphyrins Phthalocyanines 2013; 17: 145–149
( ) 1 420
ex m m X Xk Rpp p p dV V f f f e e e τ− τ − τ − λ= + (2)
( ) 1 20 1 ex m m X Xk R
dp p dV V f f e e e τ− τ − τ − λ= − (3)
( ) 1 20 1 ex m m X Xk R
pd d pV V f f e e eτ− τ − τ − λ= − (4)
In Equations 1–4 Vdd and Vpp are the volumes of diamagnetic and paramagnetic self peaks, Vdp and Vpd are the volumes of the two exchange peaks, fd and fp are the molar fractions of diamagnetic and paramagnetic
forms of the protein in the experimental mixture, kex is the self-exchange rate constant, m is the mixing time that is varied within the series of experiments, R1 is the longitudinal nuclear relaxation rate (i.e., T1
-1) and
X is the paramagnetic contribution to the transverse relaxation rate during coherence transfer processes that are operative for durations τX before and after the EXSY period (Fig. 1) and involve nucleus X (X = 1H in HSQC type experiments and 13C in the COCO-EXSY). In this formulation, R1 is assumed to be the same for both the diamagnetic and paramagnetic forms, an approximation that is by far less important for heteronuclei because paramagnetic contributions affecting T1 values are scaled down by γx
2, i.e. by one and two orders of magnitude when passing from 1H to 13C and 15N, respectively.
According to Equations 1 and 2, the volume of the self peaks as a function of m should decay with a biexponential behavior with rate constants kex and R1. This behavior is observed in Fig. 5 (solid circles) where the geometric mean of the self peaks volume is reported: the slower decay going from 1H to 15N and then to 13C is due to the lower relaxation rates of the heteronucleus with respect to proton. The volume of the exchange peaks (Equations 3 and 4) decays with rate constant R1
but builds up according to the term ex1 .mke− τ− Again, this is observed in Fig. 5 (asterisks), where the geometric mean of the exchange peaks is shown. The value of kex can be obtained from the simultaneous fit of either Equations 1–4 or from the two geometric means reported in Fig. 5. In both cases, this implies a multiparameter fitting of kex, R1 (in the assumption of equal relaxation rates for the diamagnetic and paramagnetic species) and V0; H is not fitted but estimated from 1H linewidths in HSQC experiments [21]. The molar fractions are easily estimated from reference 1D or 2D NMR spectra.
On the other hand, the dependency from X and R1 and V0, with the approximations implied in the above assumptions, can be easily eliminated when
Fig. 4. Selection of rows extracted from the COCO-EXSY experiment of Fig. 3. The exchange peaks detectable on each row are indicated by stars and self peaks by circles. For the row corresponding to 168.8 ppm, two diagonal peaks are overlapped
Fig. 5. Integrated volumes for self and exchange peaks as a function of mixing time. Intensities are reported as % with respect to self peak intensities at zero mixing times obtained from the fitting of the experimental data. Reported values refer to the geometric mean of self and exchange peaks, respectively. Sample plots reported refer to Arg 38 (1H EXSY, panel (a), Ile 58 (15N EXSY, panel (b) and Ile 75 (COCO-EXSY, panel (c). Asterisks and solid circles refer, respectively, to the geometric mean of the exchange peaks and of the diagonal peaks

146 S. CACCIATORE ET AL.
Copyright © 2013 World Scientific Publishing Company J. Porphyrins Phthalocyanines 2013; 17: 146–149
considering the ratio of the product of the volumes of the exchange peaks (VdpVpd) divided by the product of the volumes of the self peaks (VddVpp). In this way the dependencies from initial peak intensities, signal losses due to transverse relaxation before and after the mixing period, longitudinal relaxation affecting signal intensity throughout the sequence, are ruled out and the ratio only depends on the build up of the EXSY, according to Equation 5:
( )
( )( )ex
ex ex
22 2
2 2
1 m
m m
kp dpd dp
k kpp dd d p d p p d
f f eV V
V V f f f e f f f e
− τ
− τ − τ
−=
+ + (5)
where the only fittable parameter is kex. The fitting of Equation 5, performed simultaneously on
all the well resolved peaks, provided very similar results for each of the three experiments: namely, kex = 37 ± 10 s-1 from 1H EXSY, kex = 39 ± 10 s-1 from 15N EXSY and kex = 38 ± 10 s-1 from 13C EXSY.
From the ratio /pd dp pp ddV V V V shown in Fig. 6 one can appreciate the build-up curve of the EXSY transfer. The deviation from the predicted build-up for 1H EXSY data points (Fig. 6a) at mixing times longer than 200 ms is due to the high proton relaxation rates. At long mixing times, peaks are barely detectable from the noise and therefore the values of /pd dp pp ddV V V V are calculated from the ratio of the products of very small intensities and affected by very large errors.
Equations 1–5 are all based on the assumption that R1 values of the two redox states are the same. On the contrary, redox-dependent protein dynamics has been observed in a number of metallo proteins [75–81]. In addition, paramagentic contributions to the relaxation properties of nuclei have a r-6 distance dependence, affecting nuclei within a sphere of a radius that depends on the nature of the chromophore [82–84]. Both contributions depend upon γ2 and therefore errors due to different R1 values are less important for the COCO-EXSY experiment than for
1H–1H EXSY. 15N–15N EXSY would be even better due to the lower γ. However, at the present state of the art, 15N–15N EXSY experiments are not feasible.
EXPERIMENTAL
NMR experiments
All NMR experiments were performed on a 16.4 T Bruker Avance 700 MHz Spectrometer, operating at Larmor Frequencies of 700.06 MHz and 176.03 MHz for 1H and 13C, respectively, and on a 21.2 T Bruker Avance 900 MHz spectrometer, operating at 1H Larmor frequency of 899.45 MHz. Proton detected experiments were performed with a triple resonance inverse detection cryogenically cooled probe, and 13C detected experiments were performed with a triple resonance probe with a 13C cryogenically cooled inner coil. Electron self-exchange measurements were recorded at 295 K. For 15N HSQC-1H EXSY experiments, 1024 × 400 data point matrices were acquired, using 64 scans each fid, a recycle delay of 0.8 s and mixing times ranging from 10 ms to 400 ms. For 15N HSQC–15N EXSY experiments, 1024 × 400 data point matrices were acquired, using 64 scans each fid, a recycle delay of 0.8 s and mixing times ranging from 20 ms to 800 ms. In 13C detected COCO-EXSY experiments, 512 × 256 data point matrices were acquired using 32 scans each fid, a recycle delay of 1.5 s and mixing times ranging from 40 ms to 800 ms. Data processing was performed using the software TOPSPIN. Data fitting was performed using the standard R [85] function “optim” with the “L-BFGS-B” method. All calculations were made using scripts developed in-house.
Sample preparation13C, 15N uniformly labeled full length human cytochrome
c overexpressed in BL21(DE3)C41 E. coli [86] was purchased from Protera s.r.l. The total protein concentration
Fig. 6. EXSY experimental build up curves obtained by reporting the ratio of the EXSY, according to /pd dp pp ddV V V V as a function of mixing time for (a) 1H EXSY; (b) 15N EXSY; (c) COCO-EXSY. Reported values arise from the same amino acids reported in Fig. 5

ELECTRON SELF-EXCHANGE OF CYTOCHROME c MEASURED via 13C DETECTED PROTONLESS NMR 147
Copyright © 2013 World Scientific Publishing Company J. Porphyrins Phthalocyanines 2013; 17: 147–149
was 1 mM for all samples, in 20 mM phosphate buffer, pH 6.8 with 10% D2O. The fully reduced form was prepared upon addition of DTT under anaerobic conditions; the fully oxidized form of the protein was obtained upon addition of K3[Fe(III)(CN)6] and the oxidizing agent was then removed by ultrafiltration before NMR data acquisition. Samples for electon self-exchange measurements, at various oxidized/reduced ratios, were obtained by mixing fully oxidized and fully reduced protein.
CONCLUSION
Protonless EXSY experiments are here proposed as a robust tool to measure electron self-exchange rates. The relative intensity of exchange peaks vs. self peaks is higher in COCO- than in HSQC-EXSY-type experiments. Moreover, given the longer relaxation rates of 13C′ heteronuclei, exchange peak intensity remains strong over an ample range of mixing times and therefore COCO-EXSY experiments will only marginally be affected by mis-calibration of the mixing time. Independently on the used pulse scheme, single parameter fitting of Equation 5 rather than multiparameter simultaneous fitting of Equations 1–4 provides a more stable estimate of kex values, removing dependency from assumptions that contrast with experimental evidences. The most important example in this sense is the use of a common R1 for the two redox states in Equation 1–4, while different nuclear relaxation rates of paramagnetic and diamagnetic redox states of electron transfer and redox proteins are always measured.
The proposed COCO-EXSY could also be used to monitor exchange phenomena different from self-exchange reactions, as long as they occur on the slow exchange time scale with respect to NMR chemical shift difference time scale. The long longitudinal relaxation times of 13C pave the way to the application of this type of pulse sequence to all those systems that have resulted particularly suitable for 13C direct detection experiments. They are (i) very high molecular weight proteins, whose 1H signals are broadened, (ii) intrinsically disordered proteins, where the limited dispersion in 1H chemical shift in HSQC type experiments would make very difficult to resolve exchange peaks from self peaks and (iii) paramagentic proteins, where paramagnetic relaxation enhancements are smaller for 13C detection than for 1H detection, due to the low γ of 13C.
In summary, the protonless COCO-EXSY and the single parameter fitting of the ratio between self and exchange peaks constitute very conveninent tools to derive exchange rates for one electron self-exchange reactions and for all circumstances in which fast transverse proton relaxation occurs.
Acknowledgements
The financial support of MIUR PRIN 2009 “Biologia strutturale meccanicistica: avanzamenti metodologici e biologici” is acknowledged.
Supporting information
Table S1 is given in the supplementary material. This material is available free of charge via the Internet at http://www.worldscinet.com/jpp/jpp.shtml.
REFERENCES
1. Gray HB and Winkler JR. Biological Inorganic Chemistry: Structure & Reactivity, University Science Books: Sausalito (CA), 2006; pp 261–267.
2. Boguslavsky L, Hale PD, Geng L, Skotheim TA and Lee H-S. Solid State Ionics 1993; 60: 189–197.
3. Gupta RK and Redfield AG. Science 1970; 169: 1204–1206.
4. Santos H, Turner DL, Xavier AV and LeGall J. J. Magn. Reson. 1984; 59: 177–180.
5. Ubbink M and Canters GW. Biochemistry 1993; 32: 13893–90113.
6. Van Pouderoyen G, Cigna G, Rolli G, Cutruzzola F, Malatesta F, Silvestrini MC, Brunori M and Canters GW. Eur. J. Biochem. 1997; 247: 322–331.
7. Leigh JS Jr. J. Magn. Reson. 1971; 4: 308–311. 8. Dixon DW, Hong X and Woehler SE. Biophys. J.
1989; 56: 339–351. 9. Ernst RR, Bodenhausen G and Wokaun A.
Principles of Nuclear Magnetic Resonance in one and two dimensions, Oxford University Press: London, 1987.
10. Soriano A, Li D, Bian S, Agarwal A and Cowan JA. Biochemistry 1996; 35: 12479–12486.
11. Yang F, Knipp M, Shokhireva TK, Berry RE, Zhang H and Walker FA. J. Biol. Inorg. Chem. 2009; 14: 1077–1095.
12. Bertini I, Gaudemer A, Luchinat C and Piccioli M. Biochemistry 1993; 32: 12887–12893.
13. Bertini I, Ciurli S, Dikiy A, Gasanov R, Luchinat C, Martini G and Safarov N. J. Am. Chem. Soc. 1999; 121: 2037–2046.
14. Donaire A, Jiménez B, Fernandez CO, Pierattelli R, Niizeki T, Moratal JM, Hall JF, Kohzuma T, Hasnain SS and Vila AJ. J. Am. Chem. Soc. 2002; 124: 13698–13708.
15. Bertini I, Cowan JA, Luchinat C, Natarajan K and Piccioli M. Biochemistry 1997; 36: 9332–9339.
16. Farrow NA, Muhandiram R, Singer AU, Pascal SM, Kay CM, Gish G, Shoelson SE, Pawson T, Forman-Kay JD and Kay LE. Biochemistry 1994; 33: 5984–6003.
17. Farrow NA, Zhang O, Forman-Kay J and Kay LE. J. Biomol. NMR 1994; 4: 727–734.
18. Bosco DA, Eisenmesser EZ, Pochapsky S, Sundquist WI and Kern D. Proc. Natl. Acad. Sci. USA 2002; 99: 5242–5247.
19. Vialle-Printemps C, Van Heijenoort C and Guittet E. J. Magn. Reson. 2002; 142: 276–279.
148 S. CACCIATORE ET AL.
Copyright © 2013 World Scientific Publishing Company J. Porphyrins Phthalocyanines 2013; 17: 148–149
20. Iwahara J and Clore GM. J. Am. Chem. Soc. 2006; 128: 404–405.
21. John M, Headlam MJ, Dixon NE and Otting G. J. Biomol. NMR 2007; 37: 43–51.
22. Caillet-Saguy C, Turano P, Piccioli M, Lukat-Rodgers G, Czjzek M, Guigliarelli B, Izadi-Pruneyre N, Rodgers K, Delepierre M and Lecroisey A. J. Biol. Chem. 2008; 283: 5960–5970.
23. Caillet-Saguy C, Delepierre M, Lecroisey A, Bertini I, Piccioli M and Turano P. J. Am. Chem. Soc. 2006; 128: 150–158.
24. Caillet-Saguy C, Piccioli M, Turano P, Lukat-Rodgers G, Wolff N, Rodgers K, Izadi-Pruneyre N, Delepierre M and Lecroisey A. J. Biol. Chem. 2012; 287: 26932–26943.
25. Lancaster JR, Zaballa ME, Sproules S, Sundararajan M, DeBeer S, Richards HJ, Vila AJ, Neese F and Gray HB. J. Am. Chem. Soc. 2012; 134: 8241–8253.
26. Abriata LA, Ledesma GN, Pierattelli R and Vila AJ. J. Am. Chem. Soc. 2009; 131: 1939–1946.
27. Alontaga AY, Bunce RA, Wilks A and Rivera M. Inorg. Chem. 2006; 45: 8876–8881.
28. Zeng Y, Caignan GA, Bunce RA, Rodriguez JC, Wilks A and Rivera M. J. Am. Chem. Soc. 2005; 127: 9794–9807.
29. Turano P, Lalli D, Felli IC, Theil EC and Bertini I. Proc. Natl. Acad. Sci. USA 2010; 107: 545–550.
30. Bermel W, Felli IC, Matzapetakis M, Pierattelli R, Theil EC and Turano P. J. Magn. Reson. 2007; 188: 301–310.
31. Matzapetakis M, Turano P, Theil EC and Bertini I. J. Biomol. NMR 2007; 38: 237–242.
32. Musiani F, Bertosa B, Magistrato A, Zambelli B, Turano P, Losasso V, Micheletti C, Ciurli S and Carloni P. J. Chem. Theory Comput. 2010; 6: 3503–3515.
33. Bermel W, Bertini I, Chill JH, Felli IC, Kumar VMV, Haba N and Pierattelli R. ChemBioChem 2012; 13: 2425–2432.
34. Felli IC and Pierattelli R. IUBMB Life 2012; 64: 473–481.
35. Felli IC, Pierattelli R and Tompa P. In Intrinsically disordered proteins, Bertini I, McGreevy KS and Parigi G. (Eds.) Wiley-Blackwell: 2012; pp 137–152.
36. Balayssac S, Bertini I, Luchinat C, Parigi G and Piccioli M. J. Am. Chem. Soc. 2006; 128: 15042–15043.
37. Wüthrich K. Proc. Natl. Acad. Sci. USA 1969; 63: 1071–1078.
38. Moore GR and Williams RJP. Eur. J. Biochem. 1980; 103: 533–541.
39. Moore GR and Williams RJP. Eur. J. Biochem. 1980; 103: 503–512.
40. Moore GR and Williams RJP. Eur. J. Biochem. 1980; 103: 493–502.
41. Moore GR and Williams RJP. Eur. J. Biochem. 1980; 103: 513–522.
42. Moore GR and Williams RJP. Eur. J. Biochem. 1980; 103: 543–550.
43. Moore GR and Williams RJP. Eur. J. Biochem. 1980; 103: 523–532.
44. Assfalg M, Bertini I, Del Conte R, Giachetti A and Turano P. Biochemistry 2007; 46: 6232–6238.
45. Banci L, Bertini I, Reddig T and Turano P. Eur. J. Biochem. 1998; 256: 271–278.
46. Banci L, Bertini I, Bren KL, Gray HB, Sompornpisut P and Turano P. Biochemistry 1997; 36: 8992–9001.
47. Banci L, Bertini I, Gray HB, Luchinat C, Reddig T, Rosato A and Turano P. Biochemistry 1997; 36: 9867–9877.
48. Banci L, Bertini I, Huber JG, Spyroulias GA and Turano P. J. Biol. Inorg. Chem. 1999; 4: 21–31.
49. Banci L, Bertini I, Spyroulias GA and Turano P. Eur. J. Inorg. Chem. 1998; 1: 583–591.
50. Berners-Price S, Bertini I, Gray BH, Spyroulias GA and Turano P. J. Inorg. Biochem. 2004; 98: 814–823.
51. Bertini I, Turano P, Vasos PR, Chevance S, Bondon A and Simonneaux G. J. Mol. Biol. 2004; 336: 489–496.
52. Bertini I, Rosato A and Turano P. J. Porphyrins Phthalocyanines 2004; 8: 238–245.
53. Baistrocchi P, Banci L, Bertini I, Turano P, Bren KL and Gray HB. Biochemistry 1996; 35: 13788–13796.
54. Banci L, Bertini I, Bren KL, Cremonini MA, Gray HB, Luchinat C and Turano P. J. Biol. Inorg. Chem. 1996; 1: 117–126.
55. Bertini I, Chevance S, Del Conte R, Lalli D and Turano P. Plos ONE 2011; 6: 18329.
56. Liptak MD, Fagerlund RD, Ledegrwood EC, Wilbanks SM and Bren KL. J. Am. Chem. Soc. 2011; 133: 1153–1155.
57. Acehan D, Jiang X, Morgan DG, Heuser JE, Wang X and Akey CW. Mol. Cell 2002; 9: 423–432.
58. Yuan S, Yu X, Topf M, Ludtke SJ, Wang X and Akey CW. Structure 2010; 18: 571–583.
59. Yuan S, Yu X, Topf M, Dorstyn L, Kumar S, Ludtke SJ and Akey CW. Structure 2011; 19: 128–140.
60. Kagan VE, Tyurin VA, Jiang J, Tyurina YY, Ritov VB, Amoscato AA, Osipov AN, Belikova NA, Kapralov AA, Kini V, Vlasova II, Zhao Q, Zou M, Di P, Svistunenko DA, Kurnikov IV and Borisenko GG. Nat. Chem. Biol. 2005; 1: 223–232.
61. Fujita A, Senzu H, Kunitake T and Hamachi I. Chem. Lett. 1994; 1219–1232.
62. McCord JM and Fridovich I. J. Biol. Chem. 1969; 244: 6049–6055.
63. Beissenhirtz MK, Scheller FW and Lisdat F. Anal. Chem. 2004; 76: 4665–4671.
64. Gobi KV and Mizutani F. J. Electroanal. Chem. 2000; 484: 172–181.

ELECTRON SELF-EXCHANGE OF CYTOCHROME c MEASURED via 13C DETECTED PROTONLESS NMR 149
Copyright © 2013 World Scientific Publishing Company J. Porphyrins Phthalocyanines 2013; 17: 149–149
65. Wegerich F, Turano P, Allegrozzi M, Möhwald H and Lisdat F. Anal. Chem. 2009; 81: 2976–2984.
66. Wegerich F, Turano P, Allegrozzi M, Möhwald H and Lisdat F. Langmuir 2011; 27: 4202–4211.
67. Meier BH and Ernst RR. J. Am. Chem. Soc. 1979; 101: 6441–6442.
68. Fesik SW and Zuiderweg ERP. J. Magn. Reson. 1988; 78: 588–593.
69. Whittaker SB-M, Boetzel R, MacDonald C, Lian LY, Pommer AJ, Reilly A, James R, Kleanthous C and Moore GR. J. Biomol. NMR 1998; 12: 145–159.
70. Zambelli B, Cremades N, Neyroz P, Turano P, Uversky VN and Ciurli S. Mol. Biosyst. 2012; 8: 220–228.
71. Gelis I, Katsaros N, Luchinat C, Piccioli M and Poggi L. Eur. J. Biochem. 2003; 270: 600–609.
72. Mori M, Kateb F, Bodenhausen G, Piccioli M and Abergel D. J. Am. Chem. Soc. 2010; 132: 3594–3600.
73. Bermel W, Bertini I, Felli IC, Piccioli M and Pierattelli R. Progr. NMR Spectrosc. 2006; 48: 25–45.
74. Ottiger M, Delaglio F and Bax A. J. Magn. Reson. 1998; 131: 373–378.
75. Banci L, Bertini I, Cramaro F, Del Conte R, Rosato A and Viezzoli MS. Biochemistry 2000; 39: 9108–9118.
76. Barker PD, Bertini I, Del Conte R, Ferguson SJ, Hajieva P, Tomlinson EJ, Turano P and Viezzoli MS. Eur. J. Biochem. 2001; 268: 4468–4476.
77. Giachetti A, La Penna G, Perico A and Banci L. Biophys. J. 2004; 87: 498–512.
78. Jiménez B, Piccioli M, Moratal JM and Donaire A. Biochemistry 2003; 42: 10396–10405.
79. Bertini I, Bryant DA, Ciurli S, Dikiy A, Fernández CO, Luchinat C, Safarov N, Vila AJ and Zhao J. J. Biol. Chem. 2001; 276: 47217–47226.
80. Sakamoto K, Kamiya M, Uchida T, Kawano K and Ishimori K. Biochem. Biophys. Res. Commun. 2010; 398: 231–236.
81. Fetrow JS and Baxter SM. Biochemistry 1999; 38: 4480–4492.
82. Bertini I, Turano P and Vila AJ. Chem. Rev. 1993; 93: 2833–2932.
83. Arnesano F, Banci L and Piccioli M. Q. Rev. Biophys. 2006; 38: 167–219.
84. Walker FA. In Proton NMR and EPR Spectroscopy of Paramagnetic Metalloporphyrins, The Porphyrin Handbook, Vol. 5, Kadish KM, Smith KM and Guilard R (Eds.) Academic Press: San Diego, CA, 2000; pp 81–183.
85. Ihaka R and Gentleman R. J. Comput. Graph. Stat. 1996; 5: 299–314.
86. Jeng WY, Chen CY, Chang HC and Chuang WJ. J. Bioenerg. Biomembr. 2002; 34: 423–431.
87. Emsley L and Bodenhausen G. J. Magn. Reson. 1992; 97: 135–148.
88. Shaka AJ, Keeler J and Freeman R. J. Magn. Reson. 1983; 53: 313–340.
89. Böhlen J-M and Bodenhausen G. J. Magn. Reson. Ser. A 1993; 102: 293–301.

Journal of Porphyrins and PhthalocyaninesJ. Porphyrins Phthalocyanines 2013; 17: 150–156
DOI: 10.1142/S108842461250143X
Published at http://www.worldscinet.com/jpp/
Copyright © 2013 World Scientific Publishing Company
INTRODUCTION
Colorectal cancer (CRC) is the third most common solid internal malignancy, with 243,460 new cases diagnosed in the US in 2012 [1]. Colon cancer typically progresses over a relatively long period and in a linear fashion from adenomatous polyps to carcinoma, and this time-interval allows for routine colon screening [1, 2]. Screening, detection and removal of polyp adenomas or early stage cancer can reduce the incidence of colorectal cancer by 80% [3] and it has been the advent of broader population screening that has largely led to the improvement in mortality observed during the past 20 years [1]. Current screening techniques include flexible sigmoidoscopy, standard colonoscopy, radiography and CT colonoscopy [4] with standard colonoscopy being the accepted gold standard screening method [2]. While
these current technologies identify large adenomatous lesions, they frequently miss at least two forms of early CRC: small adenomas (< 5 mm) and flat lesions, particularly those in patients with ulcerative colitis [3]. The consequences of “hits” and “misses” following colonoscopic screening have been difficult to determine; however, in a recent population-based, case-controlled study, colonoscopy was found to reduce deaths from left-sided CRC but not deaths from right-sided cancers [5]. This study, the largest attempt to date to evaluate the relationship between colonoscopy and CRC-deaths, speculates that right-side CRCs are often small-sized or flat-shaped or more rapidly progressive. Therefore, successful preventive colonoscopic screening for CRC requires a more effective detection of early dysplastic lesions and cancer.
Improvements in colonoscopic techniques will likely be made by enhancing the sensitivity of cancer foci identification. Newer technologies that are being employed to accomplish this goal include chromoendoscopy, narrow band imaging, and blue light
Synthesis and biological investigations of a ZnPc-antiCEA
bioconjugate for imaging of colorectal cancer
Inder Sehgala, Hairong Lib, Benson Ongarorab, Daniel Devillierb and M. Graça H.
Vicente*b
a Department of Comparative Biomedical Sciences, School of Veterinary Medicine, Louisiana State University, Baton Rouge, LA 70803, USA b Department of Chemistry, Louisiana State University, Baton Rouge, LA 70803, USA
Received 6 November 2012Accepted 28 November 2012
ABSTRACT: Two zinc(II) phthalocyanines (ZnPcs) were conjugated with a monoclonal antibody (MAb) directed against carcinoembryonic antigen (CEA), using an in situ activated carboxylic acid on the ZnPcs. The bioconjugate with the highest ZnPc/MAb ratio of 3 was investigated in vitro for its ability to target and fluorescently label human colorectal HT-29 cells. The ZnPc-CEA MAb 2 was observed to efficiently target HT-29 cells, about 37 times more than unconjugated ZnPc. Furthermore, in the presence of a 4-fold excess of unlabelled anti-CEA antibody, the fluorescence signal of 2 was reduced by ~90% showing that the targeting is CEA-mediated. These studies further confirm the high specificity of Pc-antibody conjugates for antigens over-expressed on tumor cells and warrant further investigations of these immunoconjugates and their derivatives for imaging of colorectal cancer.
KEYWORDS: phthalocyanine, carcinoembryonic antigen, antibody, colorectal cancer, fluorescence.
SPP full member in good standing
*Correspondence to: M. Graça H. Vicente, email: [email protected], tel: +1 225-578-7405

SYNTHESIS AND BIOLOGICAL INVESTIGATIONS OF A ZNPC-ANTICEA BIOCONJUGATE 151
Copyright © 2013 World Scientific Publishing Company J. Porphyrins Phthalocyanines 2013; 17: 151–156
auto-fluorescence (reviewed in Ref. 4). In addition to these new surveillance techniques, once a region of interest is identified, a confocal laser microscope can be used for in situ histology. A confocal laser endomicroscope consists of confocal microscopic lenses integrated into the tip of an endoscope which projects laser light onto the mucosal surface. The fluorescent imaging agents used at the present time include fluorescein, acriflavine and cresyl violet. These agents stain mucosal tissue but they are non-specific and stain normal as well as neoplastic regions [3]. With improved specificity detection agents, confocal laser endomicroscopy could provide a powerful complement to standard endoscopy enabling subcellular resolution of colonic mucosa [3] and identifying intraepithelial neoplasias during colonoscopic exam. Fluorescence is a sensitive in vivo imaging technology that, if CRC-selective, would be a more superior indicator of suspicious regions than relying on visualizing mucosal morphology alone. It would also reduce the need for random biopsies that are taken from at-risk patients during colonoscopy. Currently, one of the main barriers to the development of highly sensitive and effective near-IR fluorescence imaging is the lack of highly tumor-selective fluorophores. Advantages of near-IR fluorescence for bioimaging applications include low Raman scattering cross-sections associated with the use of low energy excitation photons, larger Raman-free observation windows and reduced absorption and fluorescence from other compounds [6]. Phthalocyanines (Pcs), also known as aza-porphyrins, are a class of synthetic tetrapyrrolic compounds related to the naturally occurring porphyrins, containing an extended 18 π-electron system. Due to their strong absorptions and emissions in the near-IR, Pcs have found multiple applications in biology and medicine as imaging agents and as photosensitizers for the photodynamic therapy (PDT) of cancers [7–9]. PDT involves light activation of a photosensitizer with subsequent in situ production of singlet oxygen and other reactive oxygen species (ROS), which destroy photosensitizer-accumulated cells via necrosis and/or apoptosis [10, 11]. Photofrin is an FDA-approved porphyrin, a derivative of hematoporphyrin IX, that has been used for nearly two decades in the PDT treatment of various cancers, including lung, skin, cervical and bladder. Pcs have emerged as promising second-generation photosensitizers due to their intense absorptions at longer wavelengths (λmax > 670 nm) than porphyrins, and low dark toxicity. We have recently reported the conjugation of phthalocyanines to peptide ligands directed at the human epidermal growth factor receptor (EGFR), over-expressed in several cancer cell lines, including CRC [12]. These studies showed that certain ZnPc-peptide conjugates had low dark and phototoxicities, and efficiently accumulated in cancer cells over-expressing EGFR, up to 17 times more than unconjugated ZnPc, 24 h after exposure to A431 cells. Another methodology for selective delivery of fluorophores to tumor cells involves
conjugation to antibodies tumor-associated antigens [13]. Herein we report the synthesis and conjugation of ZnPcs to monoclonal antibody (MAb) directed against carcinoembryonic antigen (CEA). CEA is most commonly associated with clinical CRC because of its widespread use as the serum marker used to evaluate CRC recurrence after treatment [14, 15]. The CEA protein is a cell surface glycoprotein over-expressed in approximately 90% of all CRC and over 90% of precursor aberrant crypt foci. Expression of CEA is correlated with significantly higher ultimate patient mortality and metastatic potential [16, 17]. Furthermore, CEA is non-internalizing, which is expected to minimize phototoxicity and favor the CRC-imaging application of the bioconjugate [18]. Here, we demonstrate the synthesis and cancer targeting selectivity of a ZnPc-anti-CEA conjugate as a lead imaging agent for fluorescent surveillance of colon cancer foci.
RESULTS AND DISCUSSION
Synthesis
The synthetic route to ZnPc-antiCEA bioconjugates 2 and 3 is shown in Scheme 1. The starting ZnPc 1 was prepared as we have recently reported, from reaction of the corresponding aminophenoxy-substituted ZnPc [19] with diglycolic anhydride in DMF [12]. Activation of the carboxylic acid of ZnPc 1 using DIEA, HOBt and TBTU in DMSO, followed by addition of the commercially available anti-CEA MAb in NaHCO3 solution gave bioconjugate 2. On the other hand, conjugation of ZnPc 1 with commercially available tert-butyl protected PEG, followed by deprotection using TFA in dichloromethane, produced the corresponding ZnPc-PEG in 68% overall yield, as we have previously reported [12]. The conjugation of the Zn-PEG with anti-CEA MAb following a similar procedure, produced bioconjugate 3. This coupling reaction between a Pc bearing an activated carboxylic acid and the MAb, randomly labels amino groups on the CEA, such as lysine residues. The ZnPc/CEA molar ratio obtained from the coupling reactions was determined as previously reported [20–22], by measuring the absorbance at 280 nm to estimate the concentration of MAb and the absorbance at 338 nm to estimate the concentration of ZnPc. The molar MAb and ZnPc concentrations were calculated using the formula CCEA = [A280nm –(0.5 × AZnPc)]/εCEA, CZnPc = AZnPc/εZnPc where εCEA = 223,045 (M-1.cm-1), εPc2 = 49,471 (M-1.cm-1) and εPc3 = 39,716 (M-1.cm-1). The extinction coefficients of the ZnPcs were determined by dissolving unconjugated ZnPcs in 0.1 M NaHCO3 containing 0.1% DMSO. For the case of ZcPc-antiCEA 2, a molar ratio of 3 was determined, while for bioconjugate 3, a ratio of 2 was obtained. The relatively low ratios determined might be as a result of the poor solubility of the ZnPcs in the basic aqueous media [23–25]. Molar ratios of 2

152 I. SEHGAL ET AL.
Copyright © 2013 World Scientific Publishing Company J. Porphyrins Phthalocyanines 2013; 17: 152–156
to 5 are usually considered optimal [26]. Based on our ratio result, bioconjugate 2, bearing the highest ZnPc/CEA ratio, was prepared in larger amount for preliminary biological evaluation (vide infra).
Studies in HT-29 cells
The HT-29 cells were first immunostained with anti-CEA MAb to demonstrate the cell surface expression of the antigen in vitro, as shown in Fig. 1a. We then separately incubated the cells with ZnPc-CEA MAb 2 at a concentration of 1 μM for an 8 h period at 37 °C, to allow for antibody binding. The fluorescence emission from the ZnPc-CEA bioconjugate was imaged at 700 nm. This
emission pattern showed conjugate associated with HT-29 cells both on the cell surface as well as intracellularly, as shown in Fig. 1b. Since CEA is non-internalizable, the intracellular accumulation of Pc suggests MAb-mediated delivery of ZnPc to the cell surface and some degree of uncoupling of Pc from antibody, possibly the non-covalently coupled ZnPc, allowing free Pc to diffuse into the cell. However, when cells were incubated with the untargeted ZnPc 1 alone at 10 μM, a 10-fold increase over the ZnPc levels used Fig. 1b, only a very low degree of fluorescence was detected, as shown in Fig. 1c. At 1 μM, an amount equivalent to the ZnPc level used for the image in Fig. 1b, no fluorescence was observable.
1
N
N
N
NN
N
N
N
Zn
NH
OO
OH
O O
3
N
N
N
NN
N
N
N
Zn
NH
OO
NH
O OO
OO antiCEA
O
1. t-butyl-12-amino-4,7,10-trioxadodecanoateDIEA, HOBt, EDCI, DMF, 72 h, rt
2. TFA, dichloromethane, 4 h3. DIEA, HOBt, TBTU, antiCEA MAb, DMSO/NaHCO3 2
N
N
N
NN
N
N
N
Zn
NH
OO
antiCEA
O O
DIEA, HOBt, TBTU
antiCEA MAb, DMSO/NaHCO3
Scheme 1. Synthesis of ZnPc-antiCEA MAb bioconjugates 2 and 3
Fig. 1. Images of human colorectal HT-29 cells in the presence of: (a) anti-CEA MAb, showing surface expression of CEA. (b) ZnPc-CEA MAb 2 at 1 μM concentration, showing fluorescence emission at 700 nm. (c) Unconjugated ZnPc 1 at 10 μM concentration, showing low uptake with cytoplasmic staining (at 1 μM, no fluorescence is observed, image not shown)

SYNTHESIS AND BIOLOGICAL INVESTIGATIONS OF A ZNPC-ANTICEA BIOCONJUGATE 153
Copyright © 2013 World Scientific Publishing Company J. Porphyrins Phthalocyanines 2013; 17: 153–156
To determine if cell association of the ZnPc-CEA MAb conjugate 2 was based on specific targeting of surface CEA as opposed to non-specific associations, we incubated HT-29 cells with conjugate 2 in the presence and absence of unconjugated anti-CEA antibody. The purpose of this study was to use the unlabeled antibody to compete with the ZnPc-CEA conjugate for antigen binding. In this assay, we imaged and measured fluorescence emission at 700 nm, as shown in Fig. 2. Cells without any added ZnPc-CEA 2 showed minimal fluorescence (Fig. 2a), while cells with ZnPc-CEA 2 showed a high level of fluorescence (Fig. 2b), which was reduced by ~90% upon addition of a 4-fold excess of unlabeled anti-CEA (Fig. 2c). In addition, cells incubated with unconjugated ZnPc 1 showed only background levels of fluorescence at this wavelength (Fig. 2d).
In order to quantify the fluorescence intensity observed in HT-29 cells at excitation 550 nm and emission 700 nm, a Kodak in vivo FX imager was used and the results obtained are summarized in Table 1. While unconjugated ZnPc 1 gave a fluorescence signal similar to background, the ZnPc-CEA MAb 2 showed a 37-fold enhancement in fluorescence signal, which was significantly reduced when a 4-fold excess of anti-CEA MAb was added. These results show the very high specificity of the ZnPc-CEA MAb for HT-29 cells, which is ~6-fold higher than those determined recently with EGFR-targeted ZnPc-peptide ligands [12]. Our results are in agreement with previous reports that show retention of immunoreactivity upon covalent conjugation of aluminum(III)-Pc (AlPcS4) to antiCEA 35A7 MAb using a five atom link, and with a Pc/MAb ratio of up to 16 [20].
A promising lead conjugate for in vivo imaging must also be minimally associative with non-colon cancer cells such as mucosal epithelium. To investigate this, we designed a co-culture system consisting of HT-29 cells and murine colon epithelial cells obtained from a primary culture of mucosal scrapings [27]. Cells in the co-culture were incubated with ZnPc-CEA MAb 2 then stained for CEA and for mucin-like glycoproteins. These glycoproteins are more highly expressed in normal colon epithelia cells than in HT-29 cancer cells. Figure 3 demonstrates that ZnPc-CEA MAb 2 selectively labels HT-29 cells (identified by CEA expression) but not foci of normal colon epithelial cells (which are human CEA negative but strongly mucin-positive). This assay therefore indicates a negligible level of non-specific conjugate association with non-target expressing cells.
In addition to associating specifically with the CEA target, the conjugate must also possess minimal cytotoxicity for applicability as imaging agent. We incubated the ZnPc-CEA conjugate 2 or unconjugated ZnPc 1 at 10 μM (a level 10-fold higher than that necessary to labels cells) with HT-29 cells over a 24 h period and measured cell number as an index of viability in comparison to untreated cultures. The results obtained are represented in Fig. 4. This experiment demonstrated that conjugate 2 had minimal effects on cell number even at 24 h, while unconjugated ZnPc showed ~40% decrease, probably due to greater intracellular uptake of unconjugated ZnPc 1 compared with bioconjugate 2, which contains a non-internalizing antibody. This result is in agreement with previous reports demonstrating that non-internalizing antibody conjugates show lower photo-induced toxicity than internalizing conjugates [18, 28].
EXPERIMENTAL
General
All reagents and solvents were purchased from commercial sources and used directly without further purification. The MAb to human CEA, was purchased from Biodesign International (catalog # H45655M,
Fig. 2. ZnPc-CEA MAb conjugate targets CEA associated with HT-29 cells. (a) HT-29 cells containing no ZnPc (control). (b) Cells incubated with 1 μM ZnPc-CEA 2. (c) Cells incubated with 1 μM ZnPc-CEA plus a 4-fold excess of unconjugated anti-CEA antibody. (d) Cells incubated with unconjugated ZnPc 1
Table 1. Quantification of mean fluorescence intensity in HT-29 cells (excitation 550, emission 700). Fluorescent emissions of HT-29 cells were quantitated in a Kodak In Vivo FX imager based on units of fluorescence in net pixels per well above background for three experiments. Data reflects mean ± s.d.
No additive to media
ZnPc-antiCEA 2 ZnPc-antiCEA 2 + excess
unconjugated anti-CEA
ZnPc 1 alone
18 ± 5 407 ± 22 41 ± 9 11 ± 7

154 I. SEHGAL ET AL.
Copyright © 2013 World Scientific Publishing Company J. Porphyrins Phthalocyanines 2013; 17: 154–156
4.24 mg/mL, OD 280 nm). Silica gel 60 (230 × 400 mesh, Sorbent Technologies) and alumina gel (50–200 μm, neutral, standard activity I, Sorbent Technologies) were used for column chromatography. Analytical thin-layer chromatography (TLC) was carried out using polyester backed TLC plates 254 (precoated, 200 μm) from Sorbent Technologies. MicroSpinTM G-25 Columns were purchased from Amersham Biosciences. Centrifugation was performed on an Eppendorf Centrifuge 5417 R at 24 °C. The UV-vis absorption spectra were measured on an Ultrospec 400 UV-vis spectrophotometer from Pharmacia Biotech. ZnPc 1 was prepared as recently reported [19, 12].
Synthesis
ZnPc-antiCEA 2. The MAb (1 mg) was reconstituted at 2 mg/mL in 0.1 M NaHCO3 solution. ZnPc 1 (1 mg, 0.001 mmol) was dissolved in DMSO (100 μL). DIEA (0.078 mg, 0.006 mmol), HOBt (0.34 mg, 0.002 mmol)
and TBTU (0.59 mg, 0.002 mmol) were added to the DMSO solution and the reaction solution was stirred for 2 min. The reconstituted MAb solution (500 μL) was added into the activated phthalocyanine solution and the combined solution was kept with shaking frequently at room temperature for 1 h. Then the solution was kept at 4 °C overnight. The crude antibody-Pc conjugate solution was purified by spin column chromatography (50 μL for each spin column to load, 750 rcf, 1 min, 24 °C). The resulting solution was combined together to afford the blue conjugate solution (900 μL).
Zn-antiCEA 3. The MAb was reconstituted at 2 mg/mL in 0.1 M NaHCO3 solution. The ZnPc-PEG (1 mg, 0.001 mmol) was dissolved in DMSO (50 μL). DIEA (0.078 mg, 0.006 mmol), HOBt (0.34 mg, 0.002 mmol) and TBTU (0.59 mg, 0.002 mmol) were added to the DMSO solution and the reaction solution was stirred for 2 min. The reconstituted MAb solution (500 μL) was added into the activated Pc solution and the combined solution was kept at room temperature for 2 h, with frequent shaking. Then the solution was kept at 4 °C for 24 h, with occasional shaking. The crude antibody-Pc conjugate solution was purified by spin column chromatography (50 μL for each spin column to load, 750 rcf, 1 min, 24 °C). The resulting solution was combined to afford the blue conjugate solution (600 μL).
Cell studies
All tissue culture media and reagents were obtained from Invitrogen. HT-29 cells were cultured and maintained in McCoy’s 5a Medium Modified supplemented with 10% FBS and 1% antibiotic (Penicillin Streptomycin). HT-29 cells were infected with a lentivirus containing the enhanced green fluorescent protein (eGFP; virus purchased from Biogenova, Ellicott City, MD). Green fluorescent cells were sorted by flow cytometry and expanded to generate a line termed “HT-29 eGFP.”
Fig. 3. Co-culture of HT-29/normal colon epithelial cells incubated with ZnPc-CEA conjugate 2 at 1 μM concentration. (a) Staining with anti-CEA antibody reveals the HT-29 portion of the co-culture. (b) Imaging at 700 nm emission shows association of conjugate 2 with the CEA-expressing cells. (c) TRITC-labeled lectin from U. europaeus identifies mucin glycoproteins, more abundantly expressed on normal colonic epithelial cells
Fig. 4. Cytotoxicity in HT-29 cells of ZnPc-CEA conjugate 2 and ZnPc 1 at 10 μM concentrations. Data represents mean ± s.d. of four replicates
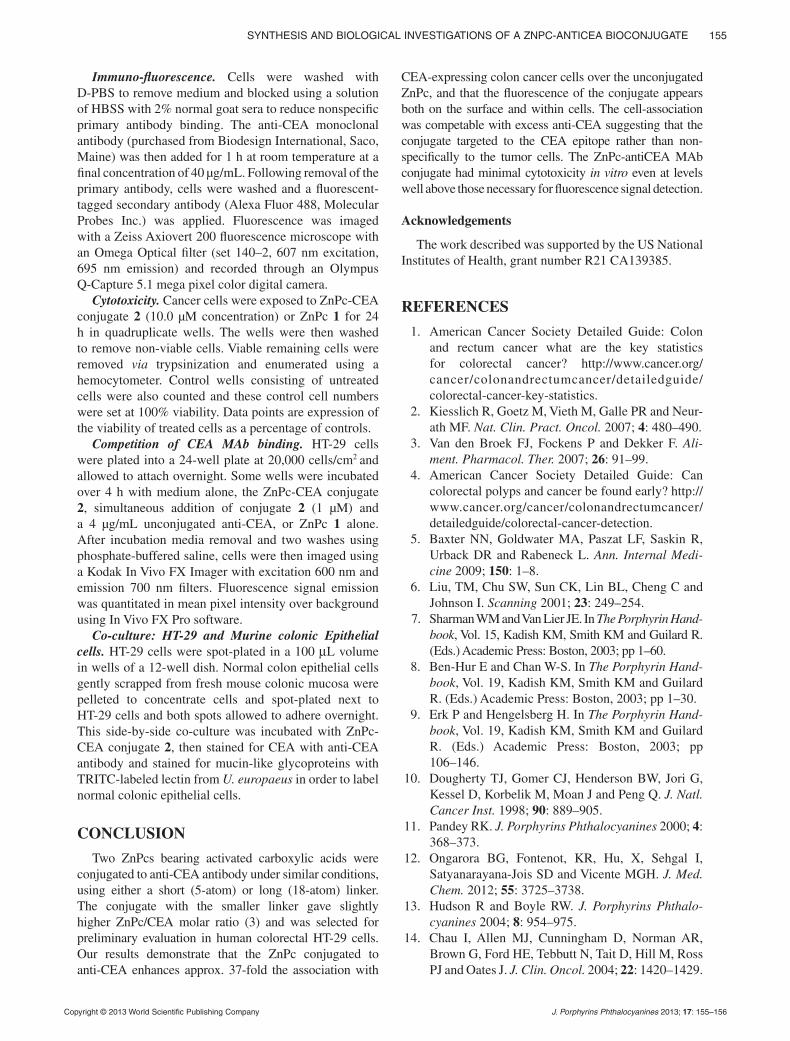
SYNTHESIS AND BIOLOGICAL INVESTIGATIONS OF A ZNPC-ANTICEA BIOCONJUGATE 155
Copyright © 2013 World Scientific Publishing Company J. Porphyrins Phthalocyanines 2013; 17: 155–156
Immuno-fluorescence. Cells were washed with D-PBS to remove medium and blocked using a solution of HBSS with 2% normal goat sera to reduce nonspecific primary antibody binding. The anti-CEA monoclonal antibody (purchased from Biodesign International, Saco, Maine) was then added for 1 h at room temperature at a final concentration of 40 μg/mL. Following removal of the primary antibody, cells were washed and a fluorescent-tagged secondary antibody (Alexa Fluor 488, Molecular Probes Inc.) was applied. Fluorescence was imaged with a Zeiss Axiovert 200 fluorescence microscope with an Omega Optical filter (set 140–2, 607 nm excitation, 695 nm emission) and recorded through an Olympus Q-Capture 5.1 mega pixel color digital camera.
Cytotoxicity. Cancer cells were exposed to ZnPc-CEA conjugate 2 (10.0 μM concentration) or ZnPc 1 for 24 h in quadruplicate wells. The wells were then washed to remove non-viable cells. Viable remaining cells were removed via trypsinization and enumerated using a hemocytometer. Control wells consisting of untreated cells were also counted and these control cell numbers were set at 100% viability. Data points are expression of the viability of treated cells as a percentage of controls.
Competition of CEA MAb binding. HT-29 cells were plated into a 24-well plate at 20,000 cells/cm2 and allowed to attach overnight. Some wells were incubated over 4 h with medium alone, the ZnPc-CEA conjugate 2, simultaneous addition of conjugate 2 (1 μM) and a 4 μg/mL unconjugated anti-CEA, or ZnPc 1 alone. After incubation media removal and two washes using phosphate-buffered saline, cells were then imaged using a Kodak In Vivo FX Imager with excitation 600 nm and emission 700 nm filters. Fluorescence signal emission was quantitated in mean pixel intensity over background using In Vivo FX Pro software.
Co-culture: HT-29 and Murine colonic Epithelial cells. HT-29 cells were spot-plated in a 100 μL volume in wells of a 12-well dish. Normal colon epithelial cells gently scrapped from fresh mouse colonic mucosa were pelleted to concentrate cells and spot-plated next to HT-29 cells and both spots allowed to adhere overnight. This side-by-side co-culture was incubated with ZnPc-CEA conjugate 2, then stained for CEA with anti-CEA antibody and stained for mucin-like glycoproteins with TRITC-labeled lectin from U. europaeus in order to label normal colonic epithelial cells.
CONCLUSION
Two ZnPcs bearing activated carboxylic acids were conjugated to anti-CEA antibody under similar conditions, using either a short (5-atom) or long (18-atom) linker. The conjugate with the smaller linker gave slightly higher ZnPc/CEA molar ratio (3) and was selected for preliminary evaluation in human colorectal HT-29 cells. Our results demonstrate that the ZnPc conjugated to anti-CEA enhances approx. 37-fold the association with
CEA-expressing colon cancer cells over the unconjugated ZnPc, and that the fluorescence of the conjugate appears both on the surface and within cells. The cell-association was competable with excess anti-CEA suggesting that the conjugate targeted to the CEA epitope rather than non-specifically to the tumor cells. The ZnPc-antiCEA MAb conjugate had minimal cytotoxicity in vitro even at levels well above those necessary for fluorescence signal detection.
Acknowledgements
The work described was supported by the US National Institutes of Health, grant number R21 CA139385.
REFERENCES
1. American Cancer Society Detailed Guide: Colon and rectum cancer what are the key statistics for colorectal cancer? http://www.cancer.org/cancer/colonandrectumcancer/detailedguide/colorectal-cancer-key-statistics.
2. Kiesslich R, Goetz M, Vieth M, Galle PR and Neur-ath MF. Nat. Clin. Pract. Oncol. 2007; 4: 480–490.
3. Van den Broek FJ, Fockens P and Dekker F. Ali-ment. Pharmacol. Ther. 2007; 26: 91–99.
4. American Cancer Society Detailed Guide: Can colorectal polyps and cancer be found early? http://www.cancer.org/cancer/colonandrectumcancer/detailedguide/colorectal-cancer-detection.
5. Baxter NN, Goldwater MA, Paszat LF, Saskin R, Urback DR and Rabeneck L. Ann. Internal Medi-cine 2009; 150: 1–8.
6. Liu, TM, Chu SW, Sun CK, Lin BL, Cheng C and Johnson I. Scanning 2001; 23: 249–254.
7. Sharman WM and Van Lier JE. In The Porphyrin Hand-book, Vol. 15, Kadish KM, Smith KM and Guilard R. (Eds.) Academic Press: Boston, 2003; pp 1–60.
8. Ben-Hur E and Chan W-S. In The Porphyrin Hand-book, Vol. 19, Kadish KM, Smith KM and Guilard R. (Eds.) Academic Press: Boston, 2003; pp 1–30.
9. Erk P and Hengelsberg H. In The Porphyrin Hand-book, Vol. 19, Kadish KM, Smith KM and Guilard R. (Eds.) Academic Press: Boston, 2003; pp 106–146.
10. Dougherty TJ, Gomer CJ, Henderson BW, Jori G, Kessel D, Korbelik M, Moan J and Peng Q. J. Natl. Cancer Inst. 1998; 90: 889–905.
11. Pandey RK. J. Porphyrins Phthalocyanines 2000; 4: 368–373.
12. Ongarora BG, Fontenot, KR, Hu, X, Sehgal I, Satyanarayana-Jois SD and Vicente MGH. J. Med. Chem. 2012; 55: 3725–3738.
13. Hudson R and Boyle RW. J. Porphyrins Phthalo-cyanines 2004; 8: 954–975.
14. Chau I, Allen MJ, Cunningham D, Norman AR, Brown G, Ford HE, Tebbutt N, Tait D, Hill M, Ross PJ and Oates J. J. Clin. Oncol. 2004; 22: 1420–1429.

156 I. SEHGAL ET AL.
Copyright © 2013 World Scientific Publishing Company J. Porphyrins Phthalocyanines 2013; 17: 156–156
15. Kaushal S, McElroy MK, Luiken GA, Talamini MA, Moossa AR, Hoffman M and Bouvet M. J. Gastrointest. Surg. 2008; 12: 1938–1950.
16. Pretlow TP, Roukhadze EV, O’Riordan MA, Chan JC, Amini SB and Stellato T.A. Gastroenterology 1994; 107: 1719–1725.
17. Hammarstrom S. Semin. Cancer Biol. 1999; 9: 67–81.
18. Carcenac M, Dorvillius M, Garambois V, Glaussel F, Larroque C, Langlois R, Hynes NE, van Lier JE and Pelegrin A. Br. J. Cancer 2001; 85: 1787–1793.
19. Ongarora BG, Hu X, Li H, Fronczek FR and Vicente MGH. Med. Chem. Comm. 2012; 3: 179–194.
20. Carcenac M, Larroque C, Langlois R, van Lier JE, Artus JC and Pelegrin A. Photochem. Photobiol. 1999; 70: 930–936.
21. Hudson R, Carcenac M, Smith K, Madden L, Clarke OJ, Pelegrin A, Greenman J and Boyle RW. Br. J. Cancer 2005; 92: 1442–1449.
22. Kaushal S, McElroy MK, Luiken GA, Talamini MA, Moossa AR, Hoffman RM and Bouvet M. J. Gastrointest. Surg. 2008; 12: 1938–1950.
23. Sutton JM, Clarke OJ, Fernandez N and Boyle RW. Bioconjugate Chem. 2002; 13: 249–263.
24. Vrouenraets MB, Visser GWM, Stigter M, Oppe-laar, H, Snow GB and van Dongen GAMS. Cancer Res. 2001 ; 61: 1970–1975.
25. Smith K, Malatesti N, Cauchon N, Hunting D, Lecomte R, van Lier JE, Greenman J, Boyle RW. Immunology 2011; 132: 256–265.
26. Vira S, Mekhedov E, Humphrey G and Blank PS. Anal. Biochem. 2010; 402: 146–150.
27. Bartsch I, Zschaler I, Haseloff M and Steinberg P. Cell. Dev. Biol. Animal 2004; 40: 278–284.
28. Del Governatore M, Hamblin MR, Piccinini EE, Ugolini G and Hasan T. Br. J. Cancer 2000; 82: 56–64.

Journal of Porphyrins and PhthalocyaninesJ. Porphyrins Phthalocyanines 2013; 17: 157–164
DOI: 10.1142/S1088424613500041
Published at http://www.worldscinet.com/jpp/
Copyright © 2013 World Scientific Publishing Company
INTRODUCTION
Smaragdyrins are pentapyrrolic expanded porphyrins [1] like sapphyrins [2, 3] but differ from sapphyrins in the number of bridging carbons and direct bonds that connect the five pyrrole rings. Sapphyrins contain four methine bridges and one direct bond and smaragdyrins contains three methine bridges and two direct bonds connecting the five pyrrole/heterocycle rings (Chart 1). Unlike sapphyrins, smaragdyrins are not very stable macrocycles [1]. Hence the chemistry of smaragdyrins are not well-established like sapphyrins. However, the recent synthesis of stable 5,10,19-meso-triaryl-25-oxasmaragdyrins with N4O core by Chandrashekar and co-workers [4, 5] renewed the research interest on these macrocycles. Recently, we reported [6] the synthesis of BF2 complexes of 25-oxasmaragdyrin which possesses the following advantageous properties compared to free-base oxasmaragdyrins: (1) exhibit strong band at ~710 nm that is three times more intense than the absorption band
of free-base oxasmaragdyrins present in the same region; (2) more fluorescent with decent quantum yields and (3) are electron deficient than free-base oxasmaragdyrins. Thus, covalently linking BF2-oxasmaragdyrin with redox active and fluorophore moieties would result in dyads with interesting optical and redox properties. In this paper, we report the synthesis of two novel covalently linked dyads: BF2-oxasmaragdyrin-boron-dipyrromethene (BODIPY) 1 and BF2-oxasmaragdyrin-ferrocene 2 synthesized under Pd(0) mediated coupling conditions by coupling BF2-oxasmaragdyrin containing meso-iodophenyl group [7] 3 with meso-ethynyl phenyl BODIPY 4 and α-ethynyl ferrocene 5 respectively. The spectral, electrochemical and photophysical studies indicated that the two moieties in dyads retain their individual characteristic features and showed a possibility of photoinduced energy transfer in BF2-oxasmaragdyrin-BODIPY dyad 1 and photoinduced electron transfer in BF2-oxasmaragdyrin-ferrocene dyad 2.
RESULTS AND DISCUSSION
The covalently linked BF2-oxasmaragdyrin-BODIPY dyad 1 and BF2-oxasmaragdyrin-ferrocene dyad 2 were synthesized as shown in Scheme 1. The key precursor, the functionalized free-base
Synthesis and studies of covalently linked BF2-
oxasmaragdyrin-BODIPY and BF2-oxasmaragdyrin-ferrocene
dyads
Yogita Pareek and Mangalampalli Ravikanth*
Department of Chemistry, Indian Institute of Technology Bombay, Powai, Mumbai 400 076, India
Received 16 November 2012Accepted 4 January 2013
ABSTRACT: Covalently linked BF2-oxasmaragdyrin-BODIPY and BF2-oxasmaragdyrin-ferrocene dyads were synthesized by coupling of meso-triaryl oxasmaragdyrin containing meso-iodophenyl group with meso-(p-ethynylphenyl) borondipyrromethene and -ethynyl ferrocene respectively under mild Pd(0) coupling conditions. NMR, absorption and electrochemical studies indicated that the two moieties in the dyads retain their individual characteristic features. The fluorescence studies indicated a possibility of photoinduced singlet-singlet energy transfer from BODIPY unit to BF2-oxasmaragdyrin unit in BF2-oxasmaragdyrin-BODIPY dyad and photoinduced electron transfer from ferrocene unit to excited state of BF2-oxasmaragdyrin unit in BF2-oxasmaragdyrin-ferrocene dyad.
KEYWORDS: smaragdyrin, BF2-smaragdyrin, energy transfer, electron transfer.
SPP full member in good standing
*Correspondence to: Mangalampalli Ravikanth, email: [email protected], tel: +91 022-2576-7176, 022, fax: +91 022-2576-7152

Copyright © 2013 World Scientific Publishing Company J. Porphyrins Phthalocyanines 2013; 17: 158–164
158 Y. PAREEK AND M. RAVIKANTH
5,10-(p-tolyl)-19-(4-iodophenyl)-25-oxasmaragdyrin 6 [7] was prepared by adopting 3+2 MacDonald type condensation of meso-(p-iodophenyl) dipyrromethane [10] with 16-oxatripyrrane [11] under mild acid catalyzed reaction conditions. The BF2 complex of 5,10-(p-tolyl)-19-(4-iodophenyl)-25-oxasmaragdyrin 3 was prepared by treating free-base oxasmaragdyrin 6 with 40 equivalents of triethylamine followed by 50 equivalents of BF3·OEt2 in CH2Cl2 at room temperature as reported earlier [6]. The dyads 1 and 2 were prepared by coupling of 3 with meso-(p-ethynylphenyl) BODIPY 4 and α-ethynyl ferrocene 5 respectively in toluene/triethylamine at 40 °C in the
presence of catalytic amount of Pd2(dba)3/AsPh3 for 4–6 h [12]. The progress of the reaction was followed by TLC analysis which showed a clear new spot corresponding to the required dyad 1 or 2 with the disappearance of spots corresponding to the monomeric precursors. The crude compounds were subjected to alumina column chromatographic purification and afforded BF2-oxasmaragdyrin-BODIPY dyad 1 in 66% yield and BF2-oxasmaragdyrin-ferrocene dyad 2 in 75% yield. The dyads 1 and 2 were freely soluble in common organic solvents and identities were confirmed by corresponding molecular ion peak in ES-MS mass spectra.
The dyads 1 and 2 were further confirmed by detailed 1D and 2D NMR spectroscopy. The comparison of 1H NMR spectra of dyad 1 along with its constituted monomers 3 and 4 are shown in Fig. 1a and 1H-1H COSY NMR spectrum of dyad 1 is shown in Fig. 1b. The resonances of the dyads 1 and 2 were assigned on the basis of the spectra observed for their constituted monomers taken independently and dyads showed overlapping features of both the constituted monomers without much significant shifts in their resonances in 1H NMR spectra. In 1H NMR spectrum of dyad 1, the eight pyrrole signals of BF2-oxasmaragdyrin unit appeared as four sets of doublets at 9.03, 9.61, 10.24 and 10.34 ppm which were identified by their cross peaks in 1H-1H COSY spectrum; the two protons of furan ring in dyad 1 were appeared as singlet at
Chart 1. Molecular structure of sapphyrin and smaragdyrin
Scheme 1. Synthesis of dyads 1 and 2

Copyright © 2013 World Scientific Publishing Company J. Porphyrins Phthalocyanines 2013; 17: 159–164
SYNTHESIS AND STUDIES OF COVALENTLY LINKED BF2-OXASMARAGDYRIN-BODIPY 159
9.43 ppm; the six pyrrole protons of BODIPY unit were appeared as three sets of signals at 6.62, 7.04 and 8.01 ppm which also showed clear cross peak connectivities in 1H-1H COSY spectrum; the eight bridging aryl protons were appeared as four sets of signals at 7.69, 7.88, 8.19 and 8.66 ppm and the eight protons of meso-aryl groups appeared as two sets of signals at 7.69 and 8.32 ppm and the two inner NH protons of BF2-oxasmaragdyrin unit appeared as unresolved triplet at -3.88 ppm. The very high field shift of inner NH protons is due to strong hydrogen bonding with the two fluoride ions of the BF2 unit, which exposes the inner NH protons to experience the strong ring current effect of the macrocycle. The dyad 2 containing BF2-oxasmaragdyrin and ferrocene moieties
showed similar NMR features for BF2-oxasmaragdyrin unit along with three sets of signals at 4.37, 4.40 and 4.70 ppm for nine ferrocenyl protons. Thus, NMR study of dyads 1 and 2 showed the features of the constituted monomers with minor changes in their chemical shifts relative to their corresponding monomers. The dyads 1 and 2 were further characterized by 19F and 11B NMR spectroscopy. The dyad 1 containing two BF2 units in two different chemical environments exhibited interesting features. In 11B NMR, the dyad 1 showed one broad unresolved signal at -12.35 ppm and one well-resolved triplet at 0.40 ppm corresponding to boron present in the oxasmaragdyrin and BODIPY units respectively (Fig. 2). The very high field shift of boron present in
Fig. 1. (a) Comparison of 1H NMR spectra of (i) 1, (ii) 3 and (iii) 4 recorded in CDCl3; the inset shows inner NH protons; (b) a section of 1H-1H COSY spectrum of dyad 1 showing connectivities between pyrrole and aryl protons of BF2-smaragdyrin and BODIPY units

Copyright © 2013 World Scientific Publishing Company J. Porphyrins Phthalocyanines 2013; 17: 160–164
160 Y. PAREEK AND M. RAVIKANTH
the oxasmaragdyrin macrocycle is because of strong π-delocalization effect of oxasmaragdyrin macrocyle [6] which is also evident in 19F NMR. In 19F NMR, the dyad 1 showed a broad unresolved signal at -149.4 ppm due to strong ring current effect of oxasmaragdyrin macrocycle and well-resolved typical quartet at -144.9 corresponding to BODIPY unit (Fig. 2). Similarly, the dyad 2 containing only one type of BF2 unit showed a broad unresolved signal at -13.10 ppm in 11B NMR and broad unresolved signal at -149.38 ppm in 19F NMR due to strong π-delocalization of oxasmaragdyrin macrocycle.
The absorption spectra of dyads 1 and 2 along with 1:1 mixture of their corresponding monomers were recorded in dichloromethane and data are presented in
Table 1. The comparison of absorption spectra of dyad 1 and 2 with 1:1 mixture of their constituted monomers is shown in Figs. 3a and 3b respectively. As clear from the Fig. 3a, the absorption spectrum of dyad 1 is essentially a linear combination of the absorption spectra of both monomers. The absorption spectrum of dyad 1 showed eight absorption bands at 449, 475, 504, 578, 591, 630, 648 and 708 nm. In this dyad 1, the only band at 504 nm was exclusively due to BODIPY unit and the remaining seven absorption bands were due to BF2-oxasmaragdyrin unit. The absorption spectrum of dyad 2 showed seven absorption bands corresponding to BF2-oxasmaragdyrin with slight changes in extinction coefficients compared to its 1:1 mixture of monomers. Thus, the absorption
Fig. 2. Comparison of 11B NMR and 19F NMR of (i) 4, (ii) 3 and (iii) 1 recorded in CDCl3
Table 1. Absorption and emission data of dyads 1 and 2 and along with their corresponding monomers recorded in dichloromethane
Absorption data Fluorescence data
Compound Soret band λ, nm (log ε)
Q-bands λ, nm (log ε)
λex Subunit Φ (%Q)a τ, ns
4 503 (5.92) — — — 490 BODIPY 0.030 — —
3 446 (5.20), 474 (4.75)
576 (sh), 591 (4.20)
630 (sh), 648 (4.45)
706 (4.70) 450 BF2-Smarg 0.090 — 4.0
1 449 (6.10),475 (5.75), 504 (5.32)
578 (sh), 591 (3.86)
630 (sh), 648 (4.06)
708 (4.48) 490490
BODIPYBF2-Smarg
0.00030.083
99—
ndb
3.8
1:1 mixture of 3 and 4
446 (5.99), 474 (5.65), 504 (5.24)
578 (sh),591 (3.74)
630 (sh), 648 (3.94)
710 (4.37) 490490
BODIPYBF2-Smarg
0.0250.079
——
——
2 445 (6.19), 473 (5.79)
578 (sh),591 (3.73)
630 (sh), 649 (3.96)
708 (4.40) 450 BF2-Smarg 0.075 17 3.5
1:1 mixture of 3 and 5
447 (6.16), 476 (5.80)
578 (sh),591 (3.72)
630 (sh), 649 (3.95)
708 (4.34) 450 BF2-Smarg 0.085 — —
a (%Q) denotes percentage of quenching of fluorescence quantum yield of BODIPY and BF2-smaragdyrin units. (%Q) = (1–ΦDA/ΦM) × 100. b Not detectable.

Copyright © 2013 World Scientific Publishing Company J. Porphyrins Phthalocyanines 2013; 17: 161–164
SYNTHESIS AND STUDIES OF COVALENTLY LINKED BF2-OXASMARAGDYRIN-BODIPY 161
study of dyads 1 and 2 indicated that the dyads showed absorption features of their constituted monomers with slight changes in their peak maxima and extinction coefficients compared to their 1:1 mixture of constituted monomers supporting the weak interaction between the BF2-smaragdyrin and BODIPY units in dyad 1 and BF2-oxasmaragdyrin and ferrocene units in dyad 2.
The electrochemical properties of dyads 1 and 2 and their corresponding monomers were investigated by cyclic voltammetry and differential pulse voltammetry in CH2Cl2 using tetrabutylammonium perchlorate (TBAP) as supporting electrolyte and data are tabulated in Table 2. The comparison of reduction waves of dyad 1 along with its corresponding monomers is presented in Fig. 4b and comparison of oxidation waves of dyad 2 along with monomers recorded using same concentration is presented in Fig. 4a. The redox waves of dyads 1 and 2 were assigned based on the redox chemistry of their corresponding constituted monomers. For example, dyad 1 showed two oxidations at 0.64 and 1.08 V and three reductions at -0.76, -1.10 and -1.61 V which are reversible or quasi-reversible and in some cases, irreversible. The BODIPYs are electron deficient and generally do not show any oxidation. Thus, the two oxidations observed in dyad 1 at 0.64 and 1.08 V were assigned exclusively to first and second oxidations of BF2-oxasmaragdyrin
unit. However, the BODIPYs and BF2-oxasmaragdyrins are generally exhibit one reversible and one quasi-reversible reductions. Thus, the reduction at -0.76 V was exclusively due to BODIPY unit; the reduction at -1.10 V was mainly due to BF2-oxasmaragdyrin unit and the reduction at -1.61 V was due to reduction of both BF2-oxasmaragdyrin and BODIPY units. Dyad 2 showed one two electron reversible oxidation at 0.65 V corresponding to oxidation of both ferrocene and BF2-oxasmaragdyrin units and another reversible oxidation at 1.08 V which was exclusively due to BF2-oxasmaragdyrin unit. In
Fig. 3. (a) Comparison of absorption spectra of dyad 1 (solid line) with its corresponding 1:1 mixture of monomers 3 and 4 (dotted line); (b) comparison of absorption spectra of dyad 2 (solid line) with its corresponding 1:1 mixture of monomers 3 and 5 (dotted line); (c) comparison of emission spectra of dyad 1 (solid line) with its corresponding 1:1 mixture of monomers 3 and 4 (dotted line) and (d) comparison of emission spectra of dyad 2 (solid line) with its corresponding 1:1 mixture of monomers 3 and 5 (dotted line)
Table 2. Electrochemical redox data (V) of dyads 1 and 2 and their corresponding monomers recorded in dichloromethane containing 0.1 M TBAP as supporting electrolyte using scan rate of 30 mV/s. E1/2 values reported are relative to SCE
Compound Oxidation Reduction
E1/2, V vs. SCE E1/2, V vs. SCE
3 0.64 1.08 — -1.08 -1.58
4 — — -0.74 — -1.58
5 0.62 — — — —
1 0.64 1.08 -0.76 -1.10 -1.61
2 0.65 1.08 — -1.10 -1.64

Copyright © 2013 World Scientific Publishing Company J. Porphyrins Phthalocyanines 2013; 17: 162–164
162 Y. PAREEK AND M. RAVIKANTH
addition, dyad 2 also showed one reversible reduction at -1.10 V and one irreversible reduction at -1.64 V corresponding to only BF2-oxasmaragdyrin unit. Thus, the redox properties of dyads 1 and 2 suggested that the two moieties in dyads retain their individual features without significant changes in their redox potentials.
The steady state fluorescence properties of dyads 1 and 2 along with 1:1 mixtures of their corresponding monomers in toluene are presented in Figs. 3c and 3d respectively and the relevant photophysical data are included in Table 1. Dyad 1 containing BODIPY unit as energy donor and BF2-oxasmaragdyrin unit as energy acceptor were studied using excitation wavelengths 450 nm and 490 nm where BF2-oxasmaragdyrin and BODIPY units respectively absorbs strongly. When dyad 1 was excited at 450 nm where BF2-oxasmaragdyrin absorbs strongly, the emission corresponding to BF2-oxasmaragdyrin was observed at 720 nm and the quantum yield matched with the monomer 3. However, when dyad 1 was excited at 490 nm where donor BODIPY absorbs strongly, the emission from BODIPY unit at 525 nm was quenched by 99% and the strong emission was observed from BF2-oxasmaragdyrin unit. On the other hand, the 1:1 mixture of monomers 3 and 4, upon excitation at 490 nm, showed strong emission from BODIPY unit and a weak emission from BF2-oxasmaragdyrin unit. The excitation spectrum of dyad 1 recorded at 720 nm showed the features of both BF2-oxasmaragdyrin and BODIPY units. All these observations strongly support an efficient singlet-singlet energy transfer from BODIPY unit to BF2-oxasmaragdyrin unit in dyad 1. Time-resolved fluorescence studies were carried out for dyad 1 by single-photon counting technique using excitation wavelength of 440 nm and emission decay was monitored at 525 nm corresponding to BODIPY unit, as well as 720 nm corresponding to BF2-oxasmaragdyrin unit. At 720 nm, the
fluorescence decay was fitted to single exponential with singlet state lifetime matching with BF2-oxasmaragdyrin monomer. However, the fluorescence decay monitored at 525 nm due to BODIPY unit was too fast and unable to measure the lifetime due to our instrument limitation. The significant decrease in the lifetime of BODIPY unit was due to singlet-singlet energy transfer from BODIPY unit to BF2-oxasmaragdyrin unit in dyad 1.
The steady state fluorescence spectrum of dyad 2 and 1:1 mixture of monomers 3 and 5 recorded at 450 nm using same concentrations showed that the fluorescence intensity of BF2-oxasmaragdyrin unit in dyad 2 is quenched with 17% reduction in quantum yield compared to 1:1 mixture of monomers. The reduction in quantum yield of BF2-oxasmaragdyrin unit in dyad 2 was attributed to the electron transfer from ferrocene moiety to BF2-oxasmaragdyrin unit. However, the electron transfer quenching by ferrocene moiety in dyad 2 was not very effective supporting weak communication between ferrocene and BF2-oxasmaragdyrin units in dyad 2. The fluorescence decay (Fig. 5) of dyad 2 monitored at 720 nm was fitted to single exponential and singlet state lifetime of BF2-oxasmaragdyrin unit in dyad 2 was decreased compared to monomer due to electron transfer from ferrocene to singlet excited state of BF2-oxasmaragdyrin unit.
EXPERIMENTAL
Chemicals
All general chemicals and solvents were procured from S.D. Fine Chemicals, India. Column chromatography was performed using silica gel and basic alumina obtained from Sisco Research Laboratories, India.
Fig. 4. Comparison of oxidation and reduction waves of cyclic voltammograms (solid line) and differential pulse voltammograms (dotted line) of (a) (i) 5, (ii) 3 and (iii) 2; (b) (i) 4, (ii) 3 and (iii) 1 recorded in dichloromethane containing 0.1 M TBAP as supporting electrolyte (scan rate 30 mV/s)

Copyright © 2013 World Scientific Publishing Company J. Porphyrins Phthalocyanines 2013; 17: 163–164
SYNTHESIS AND STUDIES OF COVALENTLY LINKED BF2-OXASMARAGDYRIN-BODIPY 163
Trimethylsilylacetylene and 2,3-dichloro-5,6-dicyano-1,4-benzoquinone (DDQ) was purchased from Sigma Aldrich. All the solvents used were of analytical grade and were purified and dried by routine procedures immediately before use.
Instrumentation1H NMR spectra were recorded with Varian 400 MHz
and Bruker 400 MHz instruments using trimethylsilane (TMS) as an internal standard. 11B NMR and 19F NMR were recorded on Bruker spectrometer operating at 128 MHz and 377 MHz respectively. All NMR measurements were carried out at room temperature in deuterochloroform (CDCl3). Absorption and steady state fluorescence spectra were obtained with Perkin-Elmer Lambda-35 and Varian Cary-Eclipse respectively. The fluorescence quantum yields (Φ) were estimated from the emission and absorption spectra by comparative method [8]. The time-resolved fluorescence decay measurements [9] were carried out at magic angle using a picosecond diode laser based time correlated single photon counting (TCSPC) fluorescence spectrometer from IBH, UK. ES-MS mass spectra were recorded with a Q-Tof Micromass spectrometer. Cyclic voltammetric (CV) and differential pulse voltammetric (DPV) studies were carried out with BAS electrochemical system utilizing the three electrode configuration consisting of a glassy carbon (working electrode), platinum wire (auxiliary electrode) and saturated calomel (reference electrode) electrodes in dry dichloromethane using 0.1 M tetrabutylammonium perchlorate as supporting electrolyte.
General synthesis for dyads 1 and 2
A solution of one equivalent of BF2 complex of 5,10-(p-tolyl)-19-(4-iodophenyl)-25-oxasmaragdyrin 3,
and one equivalent of meso-(p-ethynylphenyl) BODIPY 4 or α-ethynyl ferrocene 5 in dry toluene/triethyleamine (3:1) was purged with nitrogen for 15 min. The coupling was initiated by adding AsPh3 (1.2 equivalent) followed by Pd2(dba)3 (0.15 equivalent) and the reaction mixture was stirred at 35 °C for 6-7 h. TLC analysis indicated the appearance of new spot apart from the small amount of corresponding unreacted monomers. The crude reaction mixture was purified by basic alumina chromatography using petroleum ether/dichloromethane as eluent. The excess AsPh3 and small amounts of unreacted monomers were removed using petroleum ether/dichloromethane (80:20) and the dyads 1 and 2 were collected using petroleum ether/dichloromethane (40:60).
BF2-oxasmaragdyrin-BODIPY dyad 1. Yield 66%. mp > 300 °C. 1H NMR (400 MHz, CDCl3): δ, ppm -3.88 (t, 2H, NH), 2.80 (s, 6H, CH3), 6.62 (d, 2H, type g β-pyrrole), 7.04 (d, 2H, type f β-pyrrole), 7.69 (m, 6H, Ar), 7.88 (d, J = 8.30 Hz, 2H, Ar), 8.01 (s, 2H, type h β-pyrrole), 8.19 (d, J = 8.2 Hz, 2H, Ar), 8.32 (d, J = 8.2 Hz, 4H, Ar), 8.66 (d, J = 8.20 Hz, 2H, Ar), 9.03 (m, 2H, type b β-pyrrole), 9.43 (s, 2H, type a β-furan), 9.61 (d, J = 4.4 Hz, 2H, type e β-pyrrole), 10.24 (m, 2H, type c β-pyrrole), 10.34 (d, J = 4.5 Hz, 2H, type d β-pyrrole). 11B NMR (128 MHz, CDCl3): δ, ppm 0.40 (t), -12.35 (s). 19F NMR (377 MHz, CDCl3): δ, ppm -144.90 (t), -149.21 (s). ES-MS mass: C60H40B2F4N6O, calcd. av. mass 958.6 obsd. m/z 958.6 [M]+. Elemental analysis calcd. (%) C 75.18, H 4.21, N 8.77; found C 75.21, H 4.27, N 8.79.
BF2-oxasmaragdyrin-Ferrocene dyad 2. Yield 75%. mp > 300 °C. 1H NMR (400 MHz, CDCl3): δ, ppm -3.78 (t, 2H, NH), 2.79 (s, 6H, CH3), 4.37 (t, 2H, Fc), 4.40 (s, 5H, Fc), 4.70 (t, 2H, Fc), 7.69 (d, J = 7.70 Hz, 4H, Ar), 8.09 (d, J = 8.1 Hz, 2H, Ar), 8.29 (d, J = 7.8 Hz, 4H, Ar), 8.58 (d, J = 8.00 Hz, 2H, Ar), 8.99 (m, 2H, type b β-pyrrole), 9.47 (s, 2H, type a β-furan), 9.60 (d, J = 4.4 Hz, 2H, type e β-pyrrole), 10.20 (m, 2H, type c β-pyrrole), 10.31 (d, J = 4.5 Hz, 2H, type d β-pyrrole). 11B NMR (128 MHz, CDCl3): δ, ppm -13.10 (s). 19F NMR (377 MHz, CDCl3): δ, ppm -149.38 (s). ES-MS mass: C55H39BF2FeN4O, calcd. av. mass 876.5 obsd. m/z 876.5 [M]+. Elemental analysis calcd. (%) C 75.36, H 4.48, N 6.39; found: C 75.39, H 4.49, N 6.41.
CONCLUSION
In conclusion, we used our recently reported BF2-oxasmaragdyrin which possesses interesting optical, photophysical and electrochemical properties as building block to synthesize covalently linked BF2-oxasmaragdyrin-BODIPY and BF2-oxasmaragdyrin-ferrocene dyads under mild Pd(0) coupling conditions. The dyads are freely soluble in common organic solvents and characterized by ES-MS mass, 1D and 2D NMR techniques. Absorption and electrochemical studies indicated that the two moieties in dyads interact weakly and maintain their individual characteristic features.
Fig. 5. Fluorescence decay profile and weighted residuals distribution fit of dyad 2. The excitation wavelength used was 440 nm, and emission was detected at 720 nm

Copyright © 2013 World Scientific Publishing Company J. Porphyrins Phthalocyanines 2013; 17: 164–164
164 Y. PAREEK AND M. RAVIKANTH
The steady state and time-resolved fluorescence studies supported photoinduced energy transfer from BODIPY unit to BF2-oxasmaragdyrin unit in BF2-oxasmaragdyrin-BODIPY dyad 1 and photoinduced electron transfer from ferrocene to BF2-oxasmaragdyrin unit in BF2-oxasmaragdyrin-ferrocene dyad 2. However, it was noted from our preliminary photophysical studies that the energy transfer is more efficient in dyad 1 compared to electron transfer in dyad 2 which can be quantified by detailed photophysical studies. Thus, we conclude that BF2-oxasmaragdyrins are potential macrocycles for various applications including light-harvesting and molecular electronics.
Acknowledgements
MR thanks the Board of Research in Nuclear Sciences (BRNS) for funding and YP thanks the Council of Scientific and Industrial Research (CSIR) for fellowship.
REFERENCES
1. Pareek Y, Ravikanth M and Chandrashekar TK. Acc. Chem. Res. 2012; 45: 1801–1816.
2. Sessler JL and Davis JM. Acc. Chem. Res. 2001; 34: 989-997.
3. Sessler JL and Tomat E. Acc. Chem. Res. 2007; 40: 371-379.
4. Narayanan SJ, Sridevi B and Chandrashekar TK. Org. lett. 1999; 1: 587–590.
5. Sridevi B, Narayanan SJ, Rao R and Chandrashekar TK. Inorg. Chem. 2000; 39: 3669–3677.
6. Rao MR and Ravikanth M. J. Org. Chem. 2011; 76: 3582–3587.
7. Pareek Y and Ravikanth M. Eur. J. Org. Chem. 2011; 5390–5399.
8. Gupta I and Ravikanth M. Inorg. Chim. Acta 2007; 360: 1731–1742.
9. Kumaresan D, Datta A and Ravikanth M. Chem. Phys. Lett. 2004; 395: 87–91.
10. Lee C-H and Lindsey JS. Tetrahedron 1994; 50: 11427–11440.
11. Heo P-Y, Shin K and Lee C-H. Bull. Korean Chem. Soc. 1996; 17: 515–520.
12. Wagner RW, Johnson TE, Li F and Lindsey JS. J. Org. Chem. 1995; 60: 5266–5273.

CONTENTS
Journal of Porphyrins and PhthalocyaninesJ. Porphyrins Phthalocyanines 2013; 17: 1–164
Extending the limits of natural photosynthesis and implications for technical light harvesting 1Min Chen and Hugo Scheer*
Nanotechnology-based photodynamic therapy 16Hee-Jae Yoon and Woo-Dong Jang*
X-ray structure and properties of a cyclo[6]pyrrole[3]thio phene 27Thanh-Tuan Bui, Aude Escande, Christian Philouze, Gianluca Cioci, Sudip Ghosh,
Eric Saint-Aman, Jong Min Lim, Jean-Claude Moutet, Jonathan L. Sessler*, Dongho Kim* and Christophe Bucher*
Cancer cells uptake porphyrins via heme carrier protein 1 36Kazuhiro Hiyama, Hirofumi Matsui*, Masato Tamura, Osamu Shimokawa, Mariko Hiyama,
Tsuyoshi Kaneko, Yumiko Nagano, Ichinosuke Hyodo, Junko Tanaka, Yoshihiro Miwa, Tetsuo Ogawa, Takeo Nakanishi and Ikumi Tamai
Shape-persistent poly-porphyrins assembled by a cen tral truxene: synthesis, structure, and singlet 44 energy transfer behaviors
Hai-Jun Xu, Bin Du, Claude P. Gros*, Philippe Richard, Jean-Michel Barbe and Pierre D. Harvey*
Photosensitized damage of protein by fluorinated di ethoxy-phosphorus(V)porphyrin 56Kazutaka Hirakawa*, Keito Azumi, Yoshinobu Nishimura, Tatsuo Arai, Yoshio Nosaka
and Segetoshi Okazaki
Reaction of ferric Caldariomyces fumago chloro peroxi dase with meta-chloroperoxybenzoic acid: 63 sequential formation of compound I, compound II and regeneration of the ferric state using one reactant
Daniel P. Collins, Issa S. Isaac, Eric D. Coulter, Paul W. Hager, David P. Ballou* and John H. Dawson*
Synthesis and evaluation of cationic bacteriochlorin amphi philes with effective in vitro photodynamic 73 acti vity against cancer cells at low nanomolar concentration
Sulbha K Sharma, Michael Krayer, Felipe F. Sperandio, Liyi Huang, Ying-Ying Huang, Dewey Holten, Jonathan S. Lindsey* and Michael R. Hamblin*
Meso–meso directly linked dipyrrolyl ligand dimer that shows the formation 86 of metal-coordination polymers
Hiromitsu Maeda*, Hiroaki Kobayashi and Ryo Akuta
Electrochemistry and spectroelectrochemistry of car boxy-phenylethynyl porphyrins 92Pei-Shang Chao, Ming-Yu Kuo, Chen-Fu Lo, Min-Hsu Hsieh, Yu-Hsiang Cheng, Chin-Li Wang,
Hsiu-Yu Lu, Hshin-Hui Kuo, Yen-Ni Hsiao, Chieh-Ming Wang and Ching-Yao Lin*
A phthalocyanine-based fluorescent sensor for Zn2+ ion 99Hui He, Jian-Yong Liu and Dennis K.P. Ng*

Design and synthesis of protoporphyrin IX/vita min B12 molecular hybrids via CuAAC reaction 104Rafał Loska, Anita Janiga and Dorota Gryko*
Effect of the ruffled porphyrin ring on electronic struc tures: structure and characterization 118 of [Fe(TalkylP)(OClO3)] and [Fe(TPrP)(THF)2]ClO4 (alkyl = Ethyl, Et and n-Propyl, Pr)
Ming Li, Allen G. Oliver, Teresa J. Neal, Charles E. Schulz* and W. Robert Scheidt*
Advanced photodynamic agent from chondroitin sul fate/zinc phthalocyanine conjugate 125SongYi Baek and Kun Na*
Dechlorination of DDT catalyzed by visible-light-driven system composed of vitamin 135 B12 derivative and Rhodamine B
Keishiro Tahara, Kumiko Mikuriya, Takahiro Masuko, Jun-ichi Kikuchi and Yoshio Hisaeda*
Electron self-exchange of cytochrome c measu red via 13C detected protonless NMR 142Stefano Cacciatore, Mario Piccioli and Paola Turano*
Synthesis and biological investigations of a ZnPc-antiCEA bioconjugate for imaging of colorectal cancer 150Inder Sehgal, Hairong Li, Benson Ongarora, Daniel Devillier and M. Graça H. Vicente*
Synthesis and studies of covalently linked BF2-oxas maragdyrin-BODIPY and 157 BF2-oxasmaragdyrin-ferro cene dyads
Yogita Pareek and Mangalampalli Ravikanth*

Transfer of Copyright Agreement and Publishing Agreement
The transfer of copyright from the Author(s) should be explicitly stated to enable the Publisher to disseminate the Work to the
fullest extent. The following transfer must be signed and returned to the Publisher’s office. The work will not be published until
reception of the signed agreement.
World Scientific Publishing Co Pte Ltd
5 Toh Tuck Link,
Singapore 596224.
Fax: +65 6467 7667 - Email: [email protected]
The work entitled:
__________________________________________________________________________________________________
__________________________________________________________________________________________________
__________________________________________________________________________________________________
The Author(s) guarantees that the above article is the Author(s)’ original Work, and has never been published elsewhere before
and that the text, the illustrations, and any other materials included in the article do not infringe upon any existing copyright.
The Author(s) transfers to JPP, during the full term of copyright, free of charge, the exclusive rights comprised in the copyright
of the Work, including but not limited to the right to publish the Work and the material contained therein throughout the world, in
all languages, and in all media of expression now known or later developed, and to license or permit others to do so. However,
the following rights are reserved by Author(s):
– the right to use, free of charge, all or part of this article in future Works of their own, such as books or lectures;
– the right to reproduce the article for their own purposes provided the copies are not offered for sale;
– the right to make copies of all or part of the Work for the Author(s)’ use in classroom teaching.
The Author(s) indemnifies the Publisher and the Editors of the Journal of Porphyrins and Phthalocyanines for, and holds them
harmless from, any loss, expense or damage occasioned by a claim or suit by a third party for copyright infringement, or any
suit arising out of any breach of the foregoing warranties as a result of publication of his article.
Note: corrections, additions or deletions introduced at the proof stage which constitute a departure from the originally submitted
and accepted work will be incorporated at the Authors’ expense.
Signature* ___________________________ Date: ________________________________
Printed name: ___________________________________________________________________
*If signed by only one author on behalf of all coauthors, the additional statement must be signed.
« I represent and warrant that I am authorized to execute this copyright on behalf of all the authors of the article referred
above »
Signature ____________________________ Date: ________________________________


![Understanding the gas adsorption kinetics of Langmuir ...eprints.whiterose.ac.uk/123148/1/Hassan_-_Understanding_the_gas... · calixarenes [4], porphyrins [5] and phthalocyanines](https://img.dokumen.tips/doc/110x75/5e1d9beb8b9684692e68efc3/understanding-the-gas-adsorption-kinetics-of-langmuir-calixarenes-4-porphyrins.jpg)