Embed Size (px)
Citation preview
This article reprinted from: Murray, K. G., K. Winnett-Murray, and L. Hertel. 2005. Photosynthetic strategies and
their consequences for community succession. Pages 233-254, in Tested Studies for Laboratory Teaching, Volume 26 (M.A. O'Donnell, Editor). Proceedings of the 26th Workshop/Conference of the Association for Biology Laboratory Education (ABLE), 452 pages.
Compilation copyright © 2005 by the Association for Biology Laboratory Education (ABLE) ISBN 1-890444-08-1 All rights reserved. No part of this publication may be reproduced, stored in a retrieval system, or transmitted, in any form or by any means, electronic, mechanical, photocopying, recording, or otherwise, without the prior written permission of the copyright owner. Use solely at one’s own institution with no intent for profit is excluded from the preceding copyright restriction, unless otherwise noted on the copyright notice of the individual chapter in this volume. Proper credit to this publication must be included in your laboratory outline for each use; a sample citation is given above. Upon obtaining permission or with the “sole use at one’s own institution” exclusion, ABLE strongly encourages individuals to use the exercises in this proceedings volume in their teaching program. Although the laboratory exercises in this proceedings volume have been tested and due consideration has been given to safety, individuals performing these exercises must assume all responsibilities for risk. The Association for Biology Laboratory Education (ABLE) disclaims any liability with regards to safety in connection with the use of the exercises in this volume. The focus of ABLE is to improve the undergraduate biology laboratory experience by promoting the development and dissemination of interesting, innovative, and reliable laboratory exercises. Visit ABLE on the Web at: http://www.ableweb.org

233
Chapter 13
Photosynthetic Strategies and Their
Consequences for Community Succession
K. Greg Murray, Kathy Winnett-Murray, and Lori Hertel
Department of BiologyHope College
PO Box 9000
35 E. 12th Street
Holland, MI 49422-9000Phone: (616) 395-7720
[email protected], [email protected], [email protected]
K. Greg Murray received a B.A. and an M.S. in Biology from California State University, Northridge,
and a Ph.D. in Zoology from the University of Florida. He is currently a Professor of Biology at
Hope College where he teaches Ecology and Evolutionary Biology, Conservation Biology,Mathematical Biology, and introductory biology courses. Greg's current research investigates the
dynamics of forest regeneration, seed banks, and seedling establishment in Costa Rican cloud forest,
animal dispersal of seeds, and dispersal of invasive plant species, thus integrating his interests in
evolutionary and community ecology, plant-animal interactions, and conservation.
Kathy Winnett-Murray received a B.S. in Biological Sciences from the University of California,
Irvine, an M.S. in Biology from California State University, Northridge, and a Ph.D. in Zoology fromthe University of Florida. She is currently a Professor of Biology at Hope College where she teaches
Animal Behavior, Vertebrate Zoology, Comparative Anatomy, Introductory Biology and general
education courses in ecology. Her research interests include behavioral ecology of birds and otheranimals, and the ecology of invasive species. She also enjoys participating in a wide variety of
science outreach (K-12) and ecological education activities.
Lori Hertel is the Director of Laboratories for the Department of Biology at Hope College. Shereceived a B.S. in Biology from the University of Michigan and an M.S. in Biology from Western
Michigan University. She helps develop and teach introductory labs for majors and non-majors. Lori
is deeply involved in pre-college science education and organizes many outreach programs at HopeCollege; she was the 2003 winner of the Hope College Sigma Xi Outreach Award.
© 2005 Hope College

234 Photosynthetic strategies and forest succession
Contents
Introduction 234Student Outline 235
Objectives 235Background 235Procedure 237Data Analysis 241Data Sheet & worksheet 242
Materials 245Notes for the Instructor 246Acknowledgements 249Appendix A: Setting up the Portable Photosynthesis System 250Appendix B: Sample Class Data Sets and Student Worksheets 251
Introduction
This open-ended investigation involves a combination of field experiences to test predictionsderived from observed successional patterns in an eastern deciduous forest. Students discussseveral working hypotheses; these focus primarily on how competition for light influences thegrowth patterns of “pioneer” vs. “primary” forest tree species subjected to different lightenvironments (gaps vs. forest understory). Students then predict how those differences in lightwould translate into differences in photosynthetic rates of both kinds of trees in gaps vs.understory. Thus, students are challenged to consider how physiological patterns at theorganismal level (photosynthesis, growth rates) translate into community-level ecologicalpatterns (forest tree species composition and species turnover during succession). To test theirpredictions, students measure: (1) annual shoot growth increments in trees, (2)photosynthetically active radiation with light ceptometers in a variety of forest locations, and (3)photosynthetic rates with a portable photosynthesis system (alternative methods andinstrumentation are included in Appendix C). Students then statistically test their hypothesesusing the student’s t-test.
We use this exercise in a sophomore-level course for biology majors entitled: Ecology andEvolutionary Biology. Typically, it is a two-part lab. During the first lab period, studentsobserve successional patterns in the forest, discuss hypotheses, and conduct light and growthmeasurements on saplings. The second part we structure as a sign-up time (allowing 45 minutesper student group) on a separate day, during which each group conducts their photosyntheticmeasurements on living trees in the field using the portable photosynthetic system (for which wehave just one instrument). Class data are pooled and distributed via a course website, andstudents receive help with statistical analyses during a course discussion section and/or duringlecture.
Photosynthetic strategies and forest succession 235
Student Outline
Conceptual Objectives
1. Natural disturbance regimes (tree death by windthrow, fire, etc.) produce a complex lightenvironment, and different plant species are adapted to photosynthesize most efficiently in thedifferent light environments created.
2. Physiological specialization to different light environments gives rise to different growth andsurvival responses (hence, different success, or fitness) in species adapted to gap environmentsvs. those adapted to understory environments.
3. The specialization of different plant species on different (light) microhabitats promotes higherspecies diversity in the forest through "niche differentiation" than would otherwise be the case.
4. Understand how to state null and alternative hypotheses for purposes of statistical testing, andhow these are related to, but different from, the working hypotheses we seek to test.
Skills Objectives
1. Measurement of photosynthetically active radiation with light ceptometers.2. Measurement of annual shoot growth increments in trees.3. Measurement of photosynthetic rate with a portable photosynthesis system.4. Hypothesis testing with Student's t-test.5. Differences between one-tailed and two-tailed t-tests.6. How to summarize the results of a statistical test and state conclusions from it.
Background
In a forest undergoing succession, the composition of tree species represented in the canopychanges over time. For example, in certain eastern deciduous forests that were selectively logged50-100 years ago, Red Oak (Quercus rubra) and Black Cherry (Prunus serotina) currently representa greater proportion of the canopy than they are likely to comprise in the future. In contrast, otherspecies (e.g., Black maple, Acer nigrum, Sugar Maple, Acer saccharum, and American Beech,Fagus grandifolia) are projected to become more common in the future than they are now. Theresulting projected change in species composition is known as ecological succession.
Prunus serotina is an example of a “pioneer species” - trees that establish on a site soon after adisturbance removes the dominant species, and grow rapidly to reproductive size. Most are shade-intolerant, at least after they reach sapling size. Many also produce large numbers of offspring andinvest relatively little energy in wood, so the plant is especially susceptible to wind or other damage.As a result, many pioneers don't live very long, and so they are most characteristic of the early stagesof ecological succession. Because they are shade-intolerant and often don't persist for very long assuccession proceeds, we generally think of them as poor competitors for space in a mature forest.
Ecologists use the term “primary forest species” for plants that characterize the mature forestcommunity long after the last disturbance. In southern Michigan, for example, Fagus grandifolia,Acer nigrum, and Acer saccharum are good examples. Most primary species are shade-tolerant, sotheir seedlings and saplings can persist for long periods in the forest understory. Consequently, theygrow more slowly than pioneer species, and many don't reach reproductive size until they are manytens or even hundreds of years old, if ever. These plants also invest more of their energy in a densewood that can withstand wind stress and insect attack, but expend less energy than pioneers on any
236 Photosynthetic strategies and forest succession
given bout of reproduction. Because they are shade-tolerant and long-lived, we think of primaryforest species as superior competitors for space in a mature forest.
Many biological processes at one level of organization (e.g., communities) are actually the resultof those occurring at lower levels (e.g., populations). Such properties are known as collectiveproperties. This field exercise will examine factors that might drive the community-level process ofsuccession resulting from physiological processes at the organismal level (within individual plants).
For plants, light is often a limiting resource; most plants can be stimulated to higherphotosynthetic rates and higher growth rates by increasing the amount of light they receive. At thesame time, many plants are well adapted to living in low-light environments, such as the shadedunderstory of a forest. In this investigation, we will test some working hypotheses about thephotosynthetic responses of representative pioneer and primary forest tree species that might accountfor the successional patterns we see in the forest. Specifically, these hypotheses are:
a) Light intensity in treefall gaps exceeds that in adjacent forest understory.b) Pioneer species have faster photosynthetic rates than do primary forest species under gap
light conditions.c) Primary forest species have faster photosynthetic rates than do pioneer species under forest
understory light conditions.d) Growth rates of pioneer species exceed those of primary forest species in gaps.e) Growth rates of primary forest species exceed those of pioneer species in forest understory.
We will collect the following data:• light intensity in gap and understory patches (measured with light ceptometers sensitive
only to the wavelengths used for photosynthesis: 400-700 nm)• growth rates of representative pioneer and primary species over the previous year (by
measuring the increase in shoot length)• photosynthetic rates of representative species under gap and understory light conditions
(using a portable photosynthesis system)
Measurement of photosynthetic rates with a portable photosynthesis system
Not so long ago, biologists interested in measuring the rate at which plants convert light energyinto chemical energy via photosynthesis had to rely on indirect measurements or long-termmeasurements such as those based on biomass accumulation over time. These methods rely on lotsof assumptions that may not hold in all circumstances, and many of them take so long that they'renot feasible for understanding the factors that affect photosynthetic rates over short time periods.
Modern techniques for measuring photosynthetic rates make use of the fact that the rate ofenergy gain via photosynthesis is directly proportional to the rate at which a plant uses CO2 andproduces O2. Until recently though, such measurements could only be made with the necessaryprecision in the laboratory, or by taking a truckload of delicate equipment into the field. The adventof small, accurate infrared gas analyzers (IRGAs) has made it possible to construct portable systemsthat give accurate measurements in the field, since the relationship between the amount of energyincorporated into carbohydrate and the amount of CO2 used is known. Some systems also measuregas exchange in relation to transpiration, stomatal conductance, etc., as well as photosynthesis inplants, at the level of individual leaves. The machine uses it's own gas analyzers, light source, CO2
supply, and on-board computer to make all of these measurements, so it is important to use extremecare when transporting or using it.
Photosynthetic strategies and forest succession 237
The basic principle behind most (closed) portable photosynthesis systems is to pump air ofknown gas composition through a sealed chamber containing a photosynthesizing leaf. Bymeasuring the difference in CO2 concentration between the air entering and leaving the leafchamber, and combining this with precise measurements of the rate of air flow through the chamberand the amount of water vapor added to the outgoing air by the leaf, we can determine the rate atwhich the leaf is using CO2. Of course, the plant is also respiring at the same time, so it is producing
CO2 as well as using it. Since the instrument just measures the net change in CO2 concentration, it isactually measuring net photosynthetic rate (i.e., gross photosynthetic rate - gross respiration rate).Recall that:
Photosynthesis is essentially: 6CO2 + 6H20 + energy C6H12O6 + 6O2
While respiration is: C6H12O6 + 6O2 6CO2 + 6H20 + energy
Procedure
During the first part of the investigation, each lab group will collect two types of data in thefield: 1) light intensity in gap vs. understory patches, and 2) annual growth increments of pioneerand primary forest tree seedlings in gap vs. understory patches. Groups will also collect data on thephotosynthetic responses of seedlings adapted to gap and understory light conditions when subjectedto those different light environments in the field or in a greenhouse. Since collecting data on lightintensity and photosynthetic rates depends upon complex instruments that we have just a few of,different groups will rotate their use of instruments.
In the field, each lab group will be directed to a particular treefall gap by their lab instructor. Allof the data collected by this group will be from this gap and from a nearby forest understory sitelocated 15-20 m south (so as to remain in the same general part of the forest, with the same soilconditions, etc., while minimizing the influence of the gap on local light conditions). Lab groupswill take turns with the light ceptometers so that each group can collect both types of data in theirgap and understory patches.
Part 1: Light environments in gap vs. understory patches
For this part, you'll need to divide your group into two teams of two students, each with awalkie-talkie and a light ceptometer. The latter is a fancy light meter that is sensitive only in thephotosynthetically active portion (400-700 nm) of the electromagnetic spectrum. Recall thatchlorophyll absorbs most strongly in this part of the spectrum, which goes roughly from blue (400nm) to red (700 nm). Using the instructions below, the ceptometers will measure PAR(photosynthetically active radiation) in units of micromoles of photons per meter squared per second(µmol m-2 s-1), averaged over the 80 separate sensors on the unit.
We need two ceptometers because we want to express light intensity in the two patch types aspercentages of full sunlight, i.e., the light intensity at the top of the canopy, before it passes throughleaves, etc. Since the sun moves across the sky, and since clouds blowing across it can change lightintensity substantially over very short periods of time, it's important that we measure light intensityin the patch of interest (gap or understory) and in the open at the same instant; hence the walkie-talkies. So before taking any readings, your instructor will direct one of your teams to a locationoutside the edge of the forest, where the ceptometer will receive the same light intensity as thatabove the forest canopy. The other team will remain back at the treefall gap.
238 Photosynthetic strategies and forest succession
Each team of your group should take two readings: one at approximately 30 cm above groundlevel (seedling height) in the middle of your treefall gap, and another at the same height above theground at your forest understory site. Using the walkie-talkies, the two teams should take their gapmeasurements at the same instant, recording their PAR readings on the data sheet provided. Thenthe team in the forest should move to their understory site, and both teams should take and recordPAR readings again. Record your group's data in Table 1.
To take readings with the Decagon AccuPAR ceptometer:
• To turn on the unit, press the ON button and wait for the MAIN MENU to display.
• At the main menu select the READ option by pressing F2
• Then select the continuous option by pressing F4
• Then select the full probe option by pressing F3
• Make sure the instrument is level (use the bubble level at the base of the probe) and at thecorrect height above ground (30 cm), and read the value of PAR from the screen.
• To get back to the main menu, press the up arrow key (located in the upper right corner
of the keypad) twice.
• To turn the unit off, select F4 from the MAIN MENU.
Part 2: Seedling/sapling growth responses in gap vs. understory patches
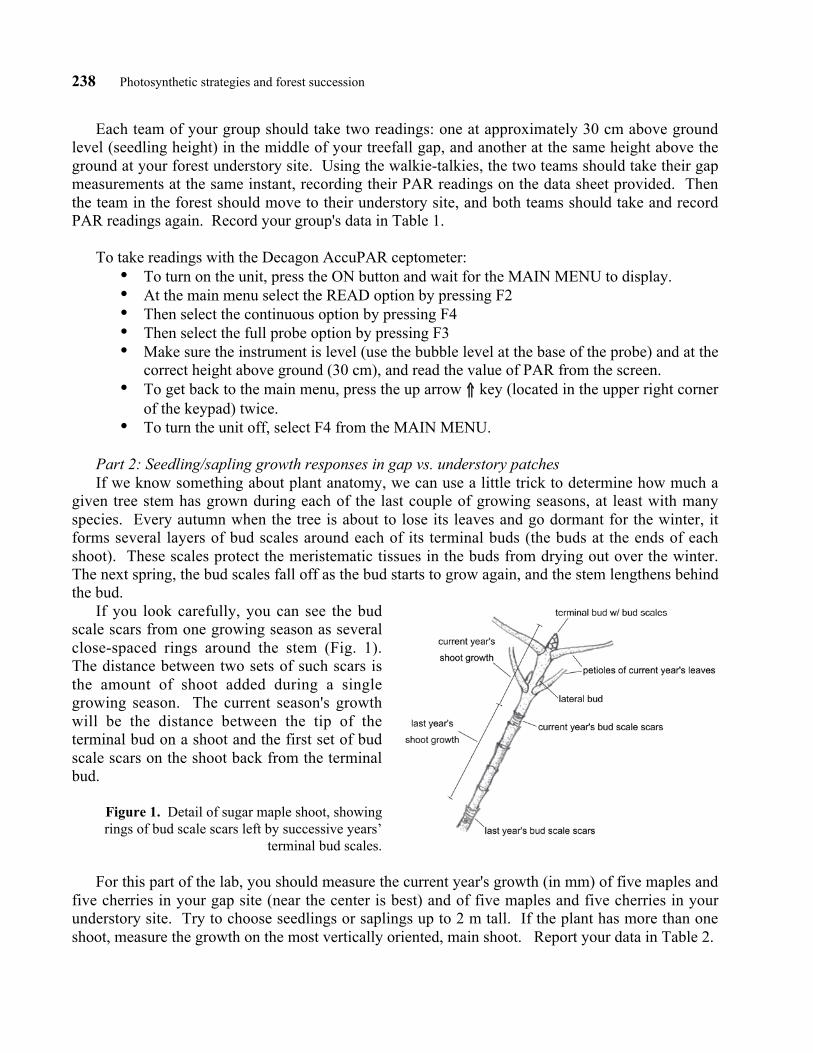
If we know something about plant anatomy, we can use a little trick to determine how much agiven tree stem has grown during each of the last couple of growing seasons, at least with manyspecies. Every autumn when the tree is about to lose its leaves and go dormant for the winter, itforms several layers of bud scales around each of its terminal buds (the buds at the ends of eachshoot). These scales protect the meristematic tissues in the buds from drying out over the winter.The next spring, the bud scales fall off as the bud starts to grow again, and the stem lengthens behindthe bud.
If you look carefully, you can see the budscale scars from one growing season as severalclose-spaced rings around the stem (Fig. 1).The distance between two sets of such scars isthe amount of shoot added during a singlegrowing season. The current season's growthwill be the distance between the tip of theterminal bud on a shoot and the first set of budscale scars on the shoot back from the terminalbud.
Figure 1. Detail of sugar maple shoot, showing
rings of bud scale scars left by successive years’
terminal bud scales.
For this part of the lab, you should measure the current year's growth (in mm) of five maples andfive cherries in your gap site (near the center is best) and of five maples and five cherries in yourunderstory site. Try to choose seedlings or saplings up to 2 m tall. If the plant has more than oneshoot, measure the growth on the most vertically oriented, main shoot. Report your data in Table 2.
Photosynthetic strategies and forest succession 239
Part 3: Photosynthetic responses of pioneer vs. primary forest trees in gap and understory light
environments
For this part of the lab, your group will need to sign up for a 1-hour time slot with your instructoror a TA. We'll have sign-up sheets in the lab - be sure that you sign up for a time slot before leavinglab!
The following is a bare-bones set of instructions on how to take the necessary photosynthesismeasurements with a particular instrument called the LI-6400 portable photosynthesis system,assuming that it has already been set up by the instructor.
1. Turn the LI-6400 ON. After 1 or 2 seconds, you will be asked if the infrared gas analyzer(IRGA) is connected:
Is the chamber/IRGA connected? (Y/N)
2. Press Y. The LI-6400 then scans the file systemLoading Open System 3.2…
3. If asked, select a Configuration. There may be other configurations available in the displaywindow, but for now, select "led source" (use the red arrow keys to highlight your selection, thenpress enter).
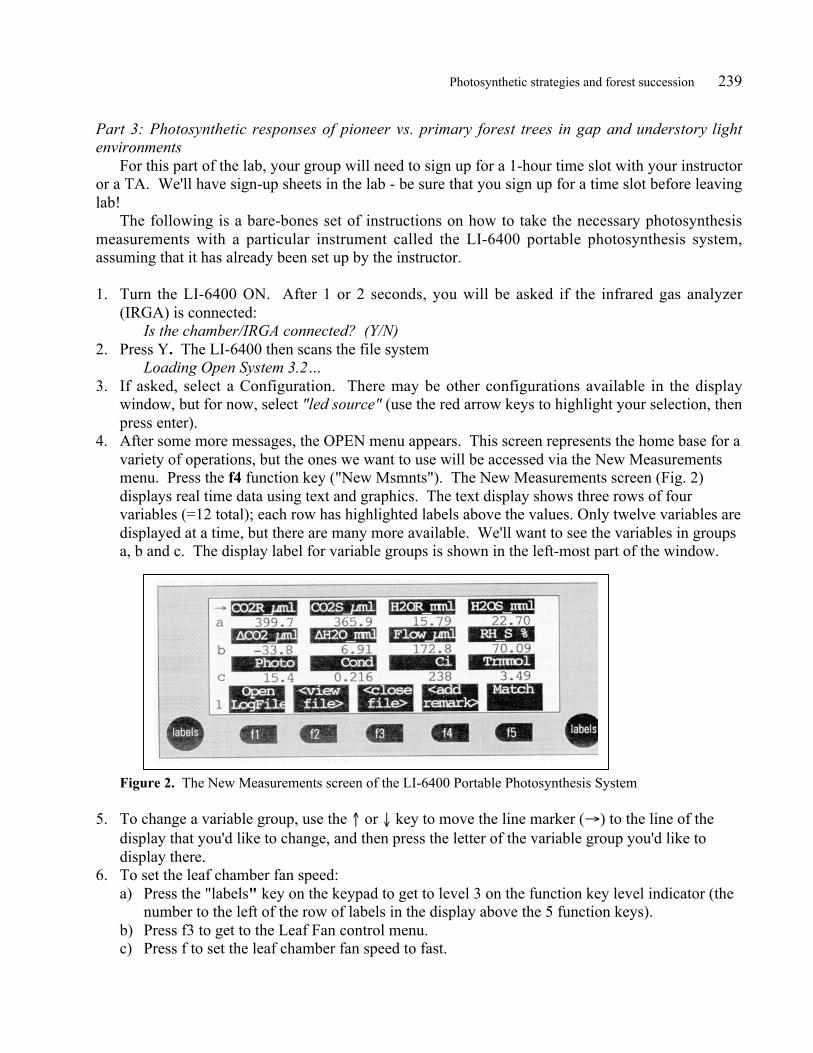
4. After some more messages, the OPEN menu appears. This screen represents the home base for avariety of operations, but the ones we want to use will be accessed via the New Measurementsmenu. Press the f4 function key ("New Msmnts"). The New Measurements screen (Fig. 2)displays real time data using text and graphics. The text display shows three rows of fourvariables (=12 total); each row has highlighted labels above the values. Only twelve variables aredisplayed at a time, but there are many more available. We'll want to see the variables in groupsa, b and c. The display label for variable groups is shown in the left-most part of the window.
Figure 2. The New Measurements screen of the LI-6400 Portable Photosynthesis System
5. To change a variable group, use the or key to move the line marker ( ) to the line of the
display that you'd like to change, and then press the letter of the variable group you'd like todisplay there.
6. To set the leaf chamber fan speed:a) Press the "labels" key on the keypad to get to level 3 on the function key level indicator (the
number to the left of the row of labels in the display above the 5 function keys).b) Press f3 to get to the Leaf Fan control menu.c) Press f to set the leaf chamber fan speed to fast.

240 Photosynthetic strategies and forest succession
7. Set the Flow control (f2 on level 2 of the function key level indicator) for flow rate of 400 µmol
sec-1, and the desiccant control knob to full bypass. The desiccant control knob is the top knobabove the clear plastic tube on the side of the machine that contains a desiccant (a water-absorbing compound). Setting this knob to full bypass allows the air entering the leaf chamberto retain all of its water vapor.
8. Set Mixer (f3 on level 2 of the function key level indicator) to 400 µmol mol-1 and set the CO2
scrubber control knob (the knob above the other clear plastic tube on the side of the machine) tofull scrub. The compound in the scrubber tube will remove all of the CO2 in the air entering themachine and the mixer will replace it with gas from the on-board CO2 cylinder to maintain theleaf chamber at a constant CO2 concentration of 400 µmol mol-1.
9. Set Temp (f4 on level 2 of the function key level indicator) to ‘N) None’ (Cooler OFF) to allowthe leaf temperature to remain at ambient.
10. To set the light intensity within the leaf chamber:a) Press the "labels" key on the keypad to get to level 2 on the function key level indicator.b) Press f5 to get to the Lamp control menu.c) Select Q) Quantum Flux, then press enter.d) Using the keypad, enter the desired PAR intensity, then press enter. IMPORTANT NOTE:
the in-chamber light source draws lots of power, so it will run the battery down quickly if lefton. Therefore, you should always turn the lamp OFF when you're not taking measurements.The same is true for CO2 consumption – turn the CO2 mixer off when you’re done with yourmeasurements.
11. To take a measurement of photosynthetic rate:a) Choose a leaf that will cover the entire surface area of the leaf chamber (i.e., at least 2 x 3 cm
in surface area).b) Clamp the leaf chamber onto the leaf, taking care that the knurled adjusting screw has been
set to provide enough pressure to seal the upper and lower gaskets against the leaf, but not somuch pressure as to prevent the movement of water through the vascular tissues in the leaves.
c) Turn on the led light source to the desired PAR (1000 µmol m-2 s-1 for gap, 16 for
understory; see below).d) Set up the LI-6400 to display photosynthetic rate in graphical form in real time:
• Choose f2 (GRAPH QuikPik) on level 4 of the function key level indicator.• Scroll down the choices with the down arrow until you get to "Photo and Cond" and
then press enter.e) Watch the photosynthetic rate reading on the graph. Since you've just changed the light
intensity experienced by the leaf, photosynthetic rate will probably change. It will changerapidly at first, but within a few minutes it should level off. After it levels off, take yourreading by pressing escape to get back to the variable groups screen, and reading the value ofPhoto on variable group c. The units are µmol CO2 m-2 s-1. To get back to the graphical
display, press 4 to get to level 4 of the function key level indicator and then press f3 (viewgraph).
f) When you're ready to change the light level, turn the CO2 mixer off, etc., you can get back tolevel 2 of the function key level indicator by pressing 2.
For this part of the lab, your group should take four measurements of net photosynthetic rate: oneeach from a sun-adapted maple seedling and a sun-adapted cherry seedling at high light intensity,

Photosynthetic strategies and forest succession 241
and one each from a shade-adapted maple and a shade-adapted cherry at low light intensity. For thehigh light intensity, we'll use 1000 µmol m-2 s-1 (about 60% of full sunlight) to simulate conditions
near the center of a gap. The low light intensity will be 16 µmol m-2 s-1 (about 1% of full sun) to
simulate conditions in forest understory. For each plant, be sure to do the high light intensitymeasurement first. Record your data in Table 3.
Data Analysis
Part 1. Light environments in gap vs. understory patches
Using class data, test the working hypothesis that light intensity (PAR, expressed as a percentageof incident light above the canopy) is higher in gaps than in adjacent forest understory. Since this isa directional hypothesis (i.e., that PAR is higher in gaps than in understory, and not simply that it isdifferent in gaps and understory), you will need to do a one-tailed t-test. To use the same table ofcritical values of the t-distribution for a one-tailed test, you use the column in the table for twice the
level that you want. For example, if you want = 0.05, you use the column labeled = 0.1.
Doing this puts the whole rejection region of 5% of the area under the curve below just one tail ofthe distribution. This is just what we want (and in fact it's why we call this a "one-tailed" test) -we're not even interested in the possibility that mean PAR could be higher in understory than ingaps, because that would make no sense. So we take our whole 5% rejection region and put it in justone tail of the distribution, and are thus able to reject the null hypothesis of no real difference inmean PAR with a smaller measured difference between them.
a) State the null (H0) and alternative (HA) hypotheses that you will test with the PAR data.b) Show the means and standard errors of PAR (include units) in gap and understory patches.c) Show the value of t that you compute from the class data, the number of degrees of freedom
for the test, and the critical value with which you compare your computed value.d) Write a statement to summarize your statistical results and state your conclusion.e) Construct a bar graph of the PAR data such that the heights of the bars represent the means
and the error bars represent one standard error of the means.
Part 2A: Growth rates of pioneer vs. primary forest species in gap conditions
Do analysis steps a) - e) above to test the working hypothesis that pioneer species have highergrowth rates than primary forest species in gap light conditions. Again, use class data.
Part 2B: Growth rates of pioneer vs. primary forest species in understory conditions
Do analysis steps a) - e) above to test the working hypothesis that primary forest species havehigher growth rates than pioneer species in understory light conditions. Again, use class data.
Part 3A: Photosynthetic rates of pioneer vs. primary forest species in gap conditions
Do analysis steps a) - e) above to test the working hypothesis that pioneer species have higherphotosynthetic rates than primary forest species in gap light conditions. Use data only from the sun-adapted plants. Again, use class data.
Part 3B: Photosynthetic rates of pioneer vs. primary forest species in understory light conditions
Do analysis steps a) - e) above to test the working hypothesis that primary forest species havehigher photosynthetic rates than pioneer species in understory light conditions. Here, use data onlyfrom shade-adapted plants. Again, use class data.
242 Photosynthetic strategies and forest succession
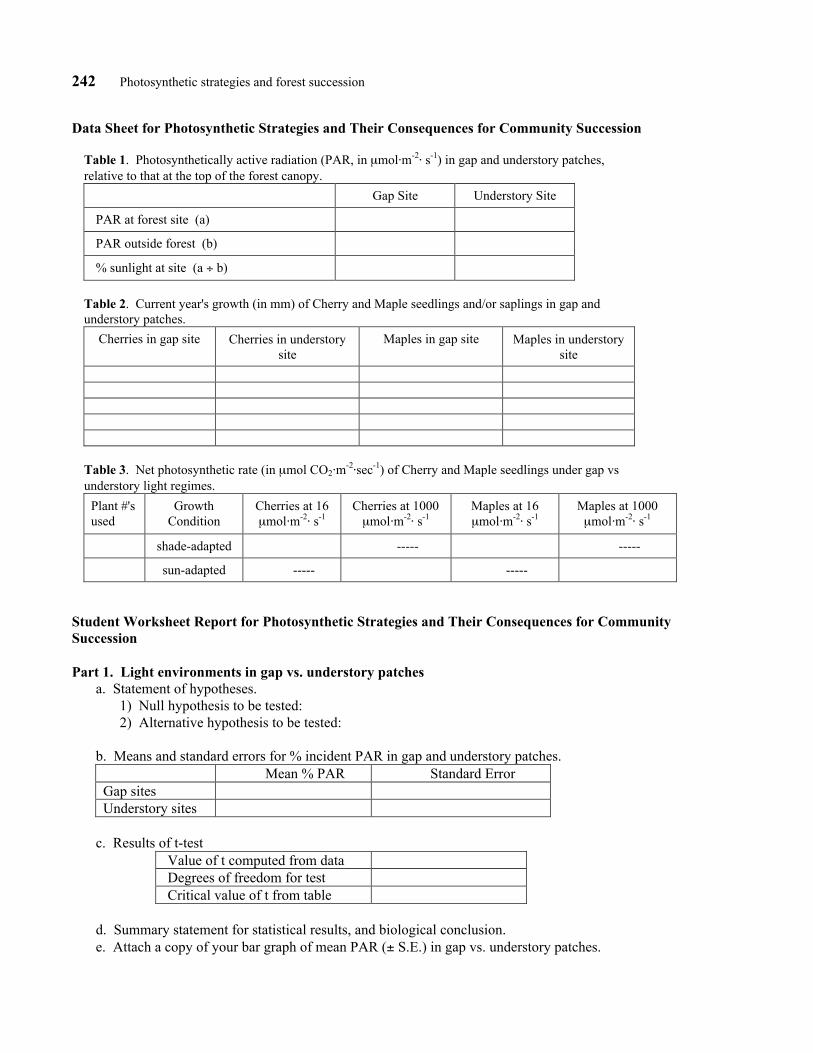
Data Sheet for Photosynthetic Strategies and Their Consequences for Community Succession
Table 1. Photosynthetically active radiation (PAR, in µmol m-2 s-1) in gap and understory patches,
relative to that at the top of the forest canopy.
Gap Site Understory Site
PAR at forest site (a)
PAR outside forest (b)
% sunlight at site (a ÷ b)
Table 2. Current year's growth (in mm) of Cherry and Maple seedlings and/or saplings in gap and
understory patches.
Cherries in gap site Cherries in understory
site
Maples in gap site Maples in understory
site
Table 3. Net photosynthetic rate (in µmol CO2 m-2 sec-1) of Cherry and Maple seedlings under gap vs
understory light regimes.
Plant #'s
used
Growth
Condition
Cherries at 16
µmol m-2 s-1Cherries at 1000
µmol m-2 s-1Maples at 16
µmol m-2 s-1Maples at 1000
µmol m-2 s-1
shade-adapted ----- -----
sun-adapted ----- -----
Student Worksheet Report for Photosynthetic Strategies and Their Consequences for Community
Succession
Part 1. Light environments in gap vs. understory patches
a. Statement of hypotheses.
1) Null hypothesis to be tested:
2) Alternative hypothesis to be tested:
b. Means and standard errors for % incident PAR in gap and understory patches.
Mean % PAR Standard Error
Gap sites
Understory sites
c. Results of t-test
Value of t computed from data
Degrees of freedom for test
Critical value of t from table
d. Summary statement for statistical results, and biological conclusion.
e. Attach a copy of your bar graph of mean PAR (± S.E.) in gap vs. understory patches.

Photosynthetic strategies and forest succession 243
Part 2: Seedling/sapling growth responses in gap vs. understory patches
A. Growth rates of pioneer vs. primary forest species in gap conditions
a. Statement of hypotheses.
1) Null hypothesis to be tested:
2) Alternative hypothesis to be tested:
b.`Means and standard errors for previous season's shoot growth of pioneer and primary forest species
in gap patches.
Mean shoot growth (mm) Standard Error
Pioneer species
Primary forest species
c. results of t-test
Value of t computed from data
Degrees of freedom for test
Critical value of t from table
d. Summary statement for statistical results, and biological conclusion.
e. Attach a copy of your bar graph of mean (± S.E.) shoot growth of pioneer vs. primary forest
species in gap conditions.
B. Growth rates of pioneer vs. primary forest species in understory conditions
a. Statement of hypotheses.
1) Null hypothesis to be tested:
2) Alternative hypothesis to be tested:
b. Means and standard errors for previous season's growth of pioneer and primary forest species inunderstory patches.
Mean shoot growth (mm) Standard Error
Pioneer species
Primary forest species
c. results of t-test
Value of t computed from data
Degrees of freedom for test
Critical value of t from table
d. Summary statement for statistical results, and biological conclusion.
e. Attach a copy of your bar graph of mean (± S.E.) shoot growth of pioneer vs. primary forest
species in understory conditions.

244 Photosynthetic strategies and forest succession
Part 3: Photosynthetic responses of pioneer vs. primary forest trees in gap and understory light
environments
A. Photosynthetic rates of sun-adapted pioneer vs. primary forest species in gap conditions
a. Statement of hypotheses.
1) Null hypothesis to be tested:
2) Alternative hypothesis to be tested:
b. Means and standard errors for net photosynthetic rate (in µmol CO2 m-2 s-1) of pioneer and
primary forest species under gap light conditions.
Mean net photosynthetic rate Standard Error
Pioneer species
Primary forest species
c. results of t-test
Value of t computed from data
Degrees of freedom for test
Critical value of t from table
d. Summary statement statistical results, and biological conclusion.
e. Attach a copy of your bar graph of mean (± S.E.) photosynthetic rate of pioneer vs. primary forest
species in gap light conditions.
B. Photosynthetic rates of shade-adapted pioneer vs. primary forest species in understory light
conditions
a. Statement of hypotheses.
1) Null hypothesis to be tested:
2) Alternative hypothesis to be tested:
b. Means and standard errors for net photosynthetic rate (in µmol CO2 m-2 s-1) of pioneer and
primary forest species in understory light conditions.
Mean net photosynthetic rate Standard Error
Pioneer species
Primary forest species
c. results of t-test
Value of t computed from data
Degrees of freedom for test
Critical value of t from table
d. Summary statement for statistical results, and biological conclusion.
e. Attach a copy of your bar graph of mean (± S.E) photosynthetic rate of pioneer vs. primary forest
species in understory light conditions.
Photosynthetic strategies and forest succession 245
Address the following questions, based upon the data you analyzed:
1. How did light levels differ between the two patch types (gap vs. forest understory)?
2. Do the results from our experiments on photosynthetic rate support our predictions - i.e., that pioneerspecies are better adapted to conditions typical of gaps while primary forest species are better adapted to
those in shaded forest understory?
3. Do the results from our measurements of annual growth increment support these same predictions? If
not, can you suggest possible explanations?4. Speculate on the likely effects, at the community level (i.e., species composition), of an increased
disturbance rate in this forest, such that the proportion of land area in gaps increased, and beneath-tree
canopy decreased. (This disturbance could be via increased storm or fire frequency or intensity due toclimate change or land management practices).
5. Similary, speculate on the likely effects of a decreased disturbance rate.
Materials
• 2 or more light ceptometers for measuring
photosynthetically active radiation (e.g.Decagon AccuPAR); use of the
ceptometers is staggered among groups
for the entire class; (purchased for approx.$3,000 each in 1998 with NSF-ILI grant
DUE 9851665; www.decagon.com
• 2 or more two-way radios (e.g. Motorola
Talkabout, approx. $80 each); 1 radio perceptometer
• 1 or more portable photosynthetic systems
(e.g. Li-Cor LI-6400; please see AppendixC for information on alternative methods
and systems); use is staggered among
groups for the entire class• data sheets – one set per student group
• clipboards – one set per student group
• cm rulers – one per student group (weprefer flexible plastic)
• hand magnifiers (10X) – one per student
group• regional tree field guides – one per student
group (e.g. Little, E.L. 1980. National
Audubon Society Field Guide to North
American Trees: Eastern Region. AlfredA. Knopf, New York, 714 pages.)

246 Photosynthetic strategies and forest succession
Notes for the Instructor
Successional Patterns
At our institution, this investigation is preceded by one in which students have documented thepatterns of forest succession at our study site. In so doing they have determined that earlysuccessional species such as Black Cherry (Prunus serotina) and Red Oak (Quercus rubra) arebecoming less common in the forest, and later successional species, such as American Beech (Fagus
grandifolia), Black Maple (Acer nigrum) and Sugar Maple (Acer saccharum) are increasing inproportional occurrence in the forest. Similar patterns of succession in any forest can bequalitatively determined by a quick examination of representation of species in the understory (i.e.what saplings are represented with the greatest frequency in the understory, and hence, will be thereplacers of canopy trees that die?) as compared with current canopy species composition (what treespecies currently dominant the canopy?). Any noticeable difference in the understory vs. canopyspecies composition can be interpreted as evidence that the future forest canopy will not have thesame composition as the current forest canopy, hence, that successional changes are underway. Forthe purposes of the photosynthetic strategies lab, the cursory examination is sufficient, but it is stillimportant to discuss successional patterns at the outset, in order to enable students to be able to makereasonable predictions about tree species responses to different light environments.
If a basic, quantitative introduction to forest succession is desired as a precursor to this lab,please refer to “Forest Succession” in Brewer, R. and M. T. McCann (1982) Laboratory and fieldmanual of ecology. CBS College Publishing, Saunders College Publishing, New York, 269 pages.Alternatively, email the authors (Murray et al.) for an electronic copy of a modified version of thislab that we use.
Staggering Use of Instruments
Since there are only a few “copies” of each of the major instruments used (e.g. ceptometers,portable photosynthesis system), it is important to stagger and rotate use of instruments by differentstudent groups for each portion of the lab. For a lab of 24 students divided into groups of 4, somegroups can begin with ceptometer measurements, while others begin with either sapling growthmeasurements or photosynthetic measurements. Because we have found photosyntheticmeasurements require about 45 minutes per group, we normally schedule a sign-up time forphotosynthesis in addition to the 3-hour lab during which light and growth measurements are made.On the “photosynthesis day,” instructors and undergraduate TAs split up the sign-up times so thatone staff member is available to help students set up, interpret and record their measurements.Although this requires additional time for the staff, the payoff is that every group of 4 studentsreceives personalized instruction and all members of each group can become proficient with directuse of the instrument. In fact, we routinely evaluate each individual’s ability to operate theseinstruments on lab practicals.
Two ceptometers and two radios are required for one group to complete the light measurements.This is because the “open sky” readings and the “understory” readings must be madesimultaneously, in order to calculate understory light as a proportion of what is “available” at thattime. Thus, a group of 4 students splits up into 2 teams of 2 people each; one team proceeds to theopen sky location, and the second team selects a station in the forest understory. The two teamscommunicate by way of the radios to “count down” precisely timed simultaneous readings in both

Photosynthetic strategies and forest succession 247
locations. Normally, each team can be finished and ready to rotate with another group of 4 within15-20 minutes.
Measurement of Growth Rates of Saplings
Not all tree species have well-developed bud scale scars. If you are using alternate species forthis lab, make sure to visit your field site first, and confirm that students will be able to easilyidentify bud scale scars. Measurements will be more reliable if instructors take 5-10 minutes at thebeginning of the lab (while in the field) to show bud scale scars on the tree species used, and also togather suggestions from students about how to standardize the measurement (e.g. will you measureto the proximal or distal scar line where a group occurs clustered together?) Encourage use of handmagnifiers since doing so clarifies most uncertainties about what are bud scale scars vs. othermarkings along the stem.
Measurement of Photosynthesis and Comparison of Systems
New improvements in technology have made it possible to measure photosynthesis in individualplants and plant leaves under field conditions and a variety of systems are available to choose fromto meet your teaching and research needs. The use of portable photosynthesis systems hasinfluenced the field of plant physiological ecology profoundly, and in particular, has beenindispensable in tackling pressing questions concerning the impacts of global climate change onecological systems. Most systems use a portable infrared gas analyzer (IRGA) to measure thechange in CO2 given off by the leaf placed in the chamber. All contain sensors that measure variousphysiological leaf parameters as well as conditions in the air moving through the leaf chamber (e.g.temperature, humidity, gas concentrations, etc.). We conduct this lab using the Li-Cor LI-6400system, which we purchased as part of an NSF-ILI curriculum and laboratory improvement grant(DUE 9851665). Although this enables us to train undergraduates using state-of-the-art researchinstrumentation, there are less costly systems available through other suppliers that are highlysuitable for undergraduate teaching labs. We have included information on a selection of thesesystems below. Regardless of the system chosen, we highly recommend that instructors whoanticipate using a portable photosynthesis system take advantage of the training workshops offeredby most vendors and develop their own exercise- and instrument-specific protocols. The particularinstructor protocol we use for running the instrument for this lab is included in Appendix A (andstudent instructions in the Student Outline).
A. LI-COR LI-6400 Portable Photosynthesis System. The research-level portable photosynthetic system used inour laboratory/field exercise was purchased for $26,450 (with CO2 injector and LED light source) in 1998 from LI-
COR environmental biosciences with part of an NSF-ILI grant (DUE 9851665) for “Instrumentation to Integrate
Pattern and Process in Organismal Biology and Ecology). The operator can control light intensity, temperature, and
relative humidity. The system is available with a variety of leaf chamber options and features an open path design
with the optical bench of the sample analyzer open directly to the leaf chamber mixing volume.
<http://www.licor.com/env/Products/li6400/6400.jsp>
B. CID, Inc. CI-340 Hand-Held Portable Photosynthesis System. This model contains the display, kepad,computer, gas analyzer, flow control system and battery all in a single, hand-held case. LED light source for
controlling light intensity and temperature control modules are optional. A variety of leaf chambers for different
types of leaves and a chlorophyll fluorescence module can be added. The basic unit is approximately $9,400 (LED
light source optional). <http://www.cid-inc.com>
C. Qubit Systems, Inc. Photosynthesis Package. Designed specifically for undergraduate laboratories, the QubitPhotosynthesis package sends experimental data to your computer in real time, and is equipped with a halogen light
source and power regulator, leaf chamber with oxygen sensor, light sensor, LabPro Interface and Logger Pro

248 Photosynthetic strategies and forest succession
Software, and other accessories. It contains no “on-board” LED light source, but is economically priced at
approximately $1330 (battery pack is an additional approx. $200). <www.qubitsystems.com>
D. PP SystemsTPS-1 Photosynthesis System. This system is smaller than, but similar in components to, the LI-COR 6400. The TPS-1 is designed for “basic research and teaching.” As with the Qubit photosynthesis package,
the instrument has full data logging capability, allowing transfer of data to PC or printer. It is an “open system”
sampling air going into and leaving the leaf chamber. A basic package containing the gas analyzer system and a
universal leaf cuvette costs approximately $9,975. <http://www.ppsystems.com>
E. Shoestring Budget. ABLE member Paul Willing ([email protected]) has designed a homemade respirationsystem that can potentially be used for animal respiration and photosynthesis measurements. It is based on use of a
CO2 sensor and O2 electrode from Vernier <http://www.vernier.com/probes/probes.html?co2-
bta&template+standard.html>. It is designed to run with Vernier’s LabPro interface and LoggerPro software (as is
the Qubit system above). One station is approx. $500-$700, and, according to Paul, will require that you re-seal the
CO2 sensor, attach LuerLok-type connections for gas flow and the O2 sensor, and affix your own pump and leaf
chamber. When complete, the set-up is quite sensitive and measures photosynthesis in approximately 1 minute.
Additional Ecological Questions to Explore
The combination of techniques introduced in this laboratory can be used to explore a variety ofother ecological questions. For example, if your study site does not show strong evidence ofsuccessional patterns, you and your students might instead choose to explore differences in growthand photosynthetic rates as a consequence of microhabitat features. These features could be lightlevel, temperature or moisture, proximity to pollution source, degree of herbivory evident on foliage,condition of leaves (e.g., dehydrated vs. hydrated), soil type, competition with other plants, timesince disturbance (e.g., fire, treefall, etc.).
One- and Two-tailed t-tests
Most of our students have completed t-tests in other biology core courses prior to conducting thislab. Hence, we use the opportunity in this lab to expand on their understanding of inferentialstatistics by introducing the concept of directional and non-directional alternate hypotheses. Moststatistical tables give one-tailed and two-tailed levels. If the alternative hypothesis is non-
directional, i.e. does not specify the direction of the difference, change, etc., then the student isconducting a two-tailed t-test. For example, if HA was simply that mean photosynthetic rate ofmaples and cherries differ. On the other hand, the student is conducting a one-tailed t-test when s/hehas specified beforehand the direction of the change in the HA, e.g. if s/he had predicted that meanphotosynthetic rate for maples is greater than it is for cherries under the same conditions. Then, ifthe student determines that cherry photosynthetic rates are actually greater, s/he must of course stillaccept HO, the null hypothesis. The student must decide whether or not s/he will do a one- or two-tailed t-test at the time s/he sets up the hypothesis, i.e. before even collecting or looking at the data.The reason for this is that levels for one-tailed tests are half those for two-tailed tests, or a t-value
insufficient to reject HO for a two-tailed test might be sufficient to reject HO for a one-tailed test.
t-tests on a TI graphing calculator
To conduct a t-test (either independent samples or a paired t-test) on a TI-83 type calculator, firstcreate 2 “lists” for your data (e.g. maple photosynthetic rates in List 1 and cherry photosyntheticrates in List 2) using the STAT menu (STAT, EDIT, create lists). Then return to the STAT menuand select TESTS. The examples given in this activity correspond to test choice 4: 2 Sample TTest.On the 2 Sample TTest screen, highlight inputs as follows: Inpt = Data; List1: L1 (or other location),List2: L2 (or other location), Freq1 =1, Freq2 =1. The next line asks for your working hypothesis

Photosynthetic strategies and forest succession 249
(mean 1 not equal to mean 2, or mean 1 < mean 2, or mean 1 > mean 2). Notice that, as discussedabove, your conclusion will depend on whether your working hypothesis was non-directional (mean1 not equal to mean 2) or directional. Select the appropriate working hypothesis, and lastly, selectPooled = Yes. Then highlight Calculate and press Enter to see the results. The calculator will reportthe t-statistic , the P-value that corresponds to this test statistic for your sample sizes, etc., thedegrees of freedom, the means and sample sizes for each sample group, and the standard deviationsfor each sample (shown as Sx1 and Sx2). The null hypothesis, Ho, is rejected if P > 0.05. Graphingcalculators offer an instructive way to learn the importance of specifying a one- or two-tailed t-testbecause you can easily return to the menu and answer questions such as: “What outcome would Ihave had if I had specified a non-directional hypothesis rather than a directional one?”
Acknowledgments
The equipment used for this field lab exercise was provided by a grant from the National ScienceFoundation to Hope College (DUE-9851665, K.G. Murray & K. Winnett-Murray, Co-PrincipalInvestigators: “Instrumentation to Integrate Pattern and Process in Organismal Biology andEcology”. Support was provided by the Hope College Collegial Fund for Faculty Development(2001) for the authors to develop, test and write laboratory investigations using this instrumentation.We thank our colleagues in the Biology Department at Hope College for support in testing,implementing, and providing improvements to this laboratory/field exercise. We thank ProfessorPaul Willing, Union College, for suggestions on alternative methods for measuring photosyntheticrates (see Appendix C).

250 Photosynthetic strategies and forest succession
Appendix A
Instructor's Notes for Setting up the Li-Cor 6400 Portable Photosynthesis System for this Lab
1. Before you leave campus, make sure you take the ceptometers, walkie talkies, and other supplies. Also
take extra AA batteries - these can be used for the ceptometers and be sure that you have the tripod,
sensor head, cable / hose assembly, extra batteries, CO2 cylinders, and o-rings for the LiCor 6400.2. Also bring jars of extra desiccant (drierite), and CO2 scrubber compound (calcium chloride). If either of
these need to be replaced, do it before you leave.
3. As soon as you arrive at the first field site, connect the cable/hose assembly to the LI-6400 and sensorhead, attach the sensor head to the tripod, and turn the machine on.
4. Make sure that the red cap is off the air intake port (near the ON switch).
5. When the Open 3.2 screen comes up, press f4 to get the New Measurements menu.
6. Open the leaf chamber and listen to make sure that the leaf fan is running (it will hiss).7. Put in a new CO2 cylinder if the machine has been sitting overnight. One cylinder should work fine for
several hours at least, but if the machine sits overnight, the cylinder will need to be changed. Even if the
machine is turned off, the gas leaks out of the system.8. If you take out a cylinder that still has gas in it, release the pressure slowly or the o-ring will freeze and
need to be replaced.
9. To replace the cylinder, put a new cylinder into the housing and screw the housing onto the base until youfeel some resistance. Then, tighten the housing the rest of the way quickly to puncture the cylinder
without venting the gas to the outside.
10. Set the flow rate to 400 µmol s-1
11. Adjust the leaf chamber tension (use the knurled knob) so that the foam gaskets are compressed a bit
when the chamber is closed, and then leave the chamber closed.
12. Set CO2 mixer to maintain a reference concentration of 400 µmol mol-1 s-1, and set the soda lime to full
scrub.
13. Set the desiccant to full bypass.
14. Exhale around the leaf chamber. If there are no leaks the sample chamber CO2 concentration
shouldn't increase by more than about 1 µmol mol-1 s-1
15. Match the IRGA's:
a) enter match mode by pressing f5 on level 1 of the function keysb) after the readings are fairly stable, the display will give you the option to MATCH IRGAs (f5) or
EXIT (f1). When the readings are pretty stable, press f5.
c) After matching, press f1 to exit match mode.d) You're now ready to clamp onto your first leaf.
16. After you’re done making measurements:
a) Make sure that the soda lime and desiccant knobs are set halfway between bypass and full scrub.b) Make sure that the leaf chamber lid tension is adjusted (use the knurled knob) so that the foam
gaskets are not compressed when the chamber lid is closed.
17. When your lab is finished:
a) Set up the ceptometers to charge (if you're using rechargables).b) Put fresh batteries in the LI-6400, and plug the ones you used into the charger.
c) Clean up the machines and cases if any leaves, sand, etc. got on them.

Photosynthetic strategies and forest succession 251
Pe
rce
nt
Fu
ll S
un
Appendix B
Sample Class Data Sets and Student Worksheets
Sample data sets. Compiled class data are posted 2-3 years at a time at K. Greg Murray’s course website for Biology
280: Ecology and Evolutionary Biology (URL below). This collection includes instructions for downloading data sets as
well as for importing text files into either SYSTAT or Microsoft Excel data tables.
(http://www.hope.edu/academic/biology/classdata/bio280/280home.htm)
Sample Student Worksheet for Photosynthetic Strategies and their Consequences for Community Succession.
Part 1. Light environments in gap vs. understory patches
a. Statement of hypotheses.
1) Null hypothesis to be tested: Any difference between mean PAR in gap and understory sites is small enough to
be due to sampling error alone
2) Alternative hypothesis to be tested: Mean PAR is higher in gap sites than in understory sites.
b. Means and standard errors for % incident PAR in gap and understory patches.Mean % PAR Standard Error
Gap sites 41.05 (n=12) 12.744
Understory sites 0.91 (n=12) 0.145
c. Results of t-testValue of t computed from data 3.149
Degrees of freedom for test 22
Critical value of t from table 1.717 (for 1-tailed)
d. Summary statement for statistical results, and biological conclusion.
Since 3.149>1.717, I reject the null hypothesis and accept the alternative
hypothesis, and conclude with 95% confidence that mean PAR is higher
in gaps than in forest understory.
e. Attach a copy of your bar graph of mean PAR (± S.E.) in gap vs.
understory patches.
Part 2: Seedling/sapling growth responses in gap vs. understory patches
A. Growth rates of pioneer vs. primary forest species in gap conditionsa. Statement of hypotheses.
1) Null hypothesis to be tested: Any difference between mean annual
growth increment of cherry and maple seedlings/saplings under gap
conditions is small enough to be due to sampling error alone.
2) Alternative hypothesis to be tested: Mean annual growth increment of cherry seedlings/saplings is greater
than that of maple seedlings/saplings under gap conditions.
b. Means and standard errors for previous season's shoot growth of pioneer and primary forest species in gap
patches.Mean shoot growth (mm) Standard Error
Pioneer species (Cherry) 154.80 (n=59) 14.252
Primary forest species (Maple) 84.58 (n=60) 7.237
c. results of t-testValue of t computed from data 4.415
Degrees of freedom for test 117
Critical value of t from table approx. 1.658 (for 1-tailed)
gap
understo
ry
Patch Type
0
20
40
60
80
100
120

252 Photosynthetic strategies and forest succession
Me
an
Gro
wth
Me
an
Gro
wth
d. Summary statement for statistical results, and biological
conclusion.Since 4.415>1.658, I reject the null hypothesis and
accept the alternative hypothesis, and conclude with 95%
confidence that mean annual growth increment is higher in
cherries than in maples under gap conditions.
e. Attach a copy of your bar graph of mean (± S.E.) shoot growth of
pioneer vs. primary forest species in gap conditions.
B. Growth rates of pioneer vs. primary forest species in understory
conditions
a. Statement of hypotheses.
1) Null hypothesis to be tested: Any difference between mean annual growth increment of cherry and maple
seedlings/saplings in understory conditions is small enough to be due to sampling error alone.
2) Alternative hypothesis to be tested: Mean annual growth increment of maple seedlings/saplings is greater
than that of cherry seedlings/saplings in understory conditions.
b. Means and standard errors for previous season's growth of pioneer and primary forest species in understory
patches.Mean shoot growth (mm) Standard Error
Pioneer species (Cherry) 90.27 (n=60) 8.100
Primary forest species (Maple) 59.70 (n=60) 5.675
c. results of t-testValue of t computed from data 3.091
Degrees of freedom for test 118
Critical value of t from table approx. 1.658 (for 1-tailed)
d. Summary statement for statistical results, and biological conclusion. Despite the fact that 3.091>1.658, the
mean annual growth increment of cherry seedlings/saplings was higher than that of maples (i.e. the opposite of
that specified by our alternative hypothesis), so that I must accept the null hypothesis that the difference
observed in means is small enough to have resulted from sampling error alone. This case illustrates an
interesting consequence of specifying a directional alternative hypothesis (which also allows us to do the more
powerful one-tailed statistical test). We specified the directional alternative hypothesis because our working
hypothesis was directional, and this was in turn based on our biological intuition (as it should be), rather than
on anything having to do with statistics. In a case like this, we can’t simply go back and change our alternative
hypothesis and conclude that cherries have higher annual growth increments than maples in the understory,
since doing so would be testing an hypothesis with the same observation that
prompted us to generate it in the first place – a terrible scientific
practice, but one that is too frequently committed. Instead, the
correct course of action would be to revise our working hypothesis
(and, hence, our alternative hypothesis), and test it with a different
set of data.
e. Attach a copy of your bar graph of mean (± S.E.) shoot growth of
pioneer vs. primary forest species in understory conditions.
Part 3: Photosynthetic responses of pioneer vs. primary forest trees in gap
and understory light environments
A. Photosynthetic rates of sun-adapted pioneer vs. primary forest species in gap conditions
a. Statement of hypotheses.
cherry mapleSpecies
0
100
200
300
400
500
600
cherry mapleSpecies
0
100
200
300
400

Photosynthetic strategies and forest succession 253
Mean
Photosynthetic
Mean
Photosynthetic
1) Null hypothesis to be tested: Any difference between mean photosynthetic rate of sun-adapted cherry and
maple seedlings/saplings under gap light conditions is small enough to be due to sampling error alone.
2) Alternative hypothesis to be tested: Mean photosynthetic rate of sun-adapted cherry seedlings/saplings is
higher than that of maple seedlings/saplings under gap light conditions.
b. Means and standard errors for net photosynthetic rate (in µmol CO2 m-2 s-1) of pioneer and primary forest
species under gap light conditions.Mean net photosynthetic rate Standard Error
Pioneer species (Cherry) 8.92 (n=12) 1.447
Primary forest species (Maple) 3.73 (n=12) 0.354
c. results of t-test
Value of t computed from data 3.480
Degrees of freedom for test 22
Critical value of t from table approx. 1.717(for 1-tailed)
d. Summary statement statistical results, and biological conclusion.
Since 3.480>1.717, I reject the null hypothesis and accept the
alternative hypothesis, concluding that mean photosynthetic rate in
sun-adapted cherries is higher than that of sun-adapted maples
under light conditions typical of treefall gaps.
e. Attach a copy of your bar graph of mean (± S.E.) photosynthetic rate
of pioneer vs. primary forest species in gap light conditions.
B. Photosynthetic rates of shade-adapted pioneer vs. primary forest species in understory light conditions
a. Statement of hypotheses.
1) Null hypothesis to be tested: Any difference between mean photosynthetic rate of shade-adapted cherry and
maple seedlings/saplings under understory light conditions is small enough to be due to sampling error
alone.
2) Alternative hypothesis to be tested: Mean photosynthetic rate of understory-adapted maple
seedlings/saplings is higher than that of cherry seedlings/saplings in understory light conditions.
b. Means and standard errors for net photosynthetic rate (in µmol CO2 m-2 s-1) of pioneer and primary forest
species in understory light conditions.Mean net photosynthetic rate Standard Error
Pioneer species (Cherry) 0.77 (n=12) 0.207
Primary forest species (Maple) 0.61 (n=12) 0.182
c. results of t-testValue of t computed from data 0.565
Degrees of freedom for test 22
Critical value of t from table approx. 1.717 (for 1-tailed)
d. Summary statement for statistical results, and biological conclusion. Since 0.565<1.717, I accept the null
hypothesis and conclude that the difference in mean photosynthetic
rate between shade-adapted cherries and maples in understory
light conditions could have resulted from sampling error alone.
e. Attach a copy of your bar graph of mean (± S.E) photosynthetic rate of
pioneer vs. primary forest species in understory light conditions.
cherry mapleSpecies
0
5
10
15
20
cherry mapleSpecies
-1
0
1
2
3

254 Photosynthetic strategies and forest succession
Address the following questions, based upon the data you analyzed:
I. How did light levels differ between the two patch types (gap vs. forest understory)?
Light levels differed in the way that we predicted: gaps had much higher light intensity than did understory
patches. This finding is consistent with that from many other temperate and tropical forests as well; estimates of 1-
2% of incident light reaching the forest floor are fairly typical. Interestingly, light level (hence, percent incident
sunlight) was highly variable among different treefall gaps, probably because we combined measurements made in
the morning (when no gaps received direct-beam sunlight) with those made in the afternoon (when many did).
Nevertheless, the data show that treefall gaps have a demonstrable effect on light intensity at the forest floor. Taking
all measurements at noon, or even integrating a larger number of measurements from many locations within each
gap would likely yield a more realistic (and less variable!) estimate of the light intensity in gaps.
II. Do the results from our experiments on photosynthetic rate support our predictions - i.e., that pioneer species are
better adapted to conditions typical of gaps while primary forest species are better adapted to those in shaded forest
understory?
Here the results provide mixed support for our hypothesis. On the one hand, sun-adapted cherries had
significantly higher photosynthetic rates under gap light conditions (PAR = 1000), as we had predicted. Thus
cherries appear to be better able to translate gap conditions into higher photosynthetic rates than are maples, at
least when grown in conditions simulating those occurring in gaps. On the other hand, there was no significant
difference between photosynthetic rates of shade-adapted maples and cherries in understory light conditions (PAR
= 16). On this basis we might conclude that maples and cherries are about equally well-adapted to conditions in the
understory (both had low but positive photosynthetic rates). Perhaps a good next step would be to increase our
sample size of PAR measurements in gap and understory sites to get a better representation of light levels to which
plants at the forest are actually acclimated, and then to measure photosynthetic rates at those same light intensities.
III. Do the results from our measurements of annual growth increment support these same predictions? If not, can you
suggest possible explanations?
Here again, the results support some of our predictions and not others. Cherries did grow more than maples
during the current growing season in gaps, as we predicted. However, the same thing occurred in the forest
understory, in contrast to our prediction that maples would grow faster there. The latter result is not consistent with
our finding of no difference between shade-adapted cherry and maple photosynthetic rates in understory light
conditions. As discussed above, we would have to collect more data to really determine whether cherries grow more
rapidly than maples in the understory, but the data we collected certainly suggest so.
IV. Speculate on the likely effects, at the community level (i.e., species composition) of an increased disturbance rate in
this forest, such that the proportion of land area in gaps increased and that beneath intact tree canopy decreased (say,
via increased storm or fire frequency or intensity due to climate change or land management practices)?
Based upon data presented here, increased disturbance in this forest would likely lead to increased recruitment of
pioneer species like Black Cherry, since the higher light levels would allow them to grow more rapidly than primary
forest species. Even though the cherries we sampled grew more than maples even in the understory, the difference in
growth increment between the species was greater in gaps. If the increased disturbance rate was consistent over
time, we might expect to see increased representation of pioneers in the forest canopy, relative to primary forest
species like the maples.
V. Similarly, speculate on the likely effects of a decreased disturbance rate.
Data presented here do not suggest an unambiguous effect of a decreased disturbance rate. The data on growth rates
in the understory suggest that we might expect an increased density of cherries, just as for an increased disturbance
rate. On the other hand, our finding of roughly equivalent photosynthetic rates in cherries and maples in understory
conditions suggests that neither species should have an advantage under low light conditions. The prediction of
increased cherry density even with decreasing disturbance rate makes little biological sense in light of other
researchers' work on the responses of these plants to light. The inconsistencies between this part of our study and
those of other scientists, as well as between different parts our own study, suggest caution in interpretation. At thevery least, we should increase our sample sizes and measure photosynthetic rates at the light levels actually
experienced by plants in the understory.