Embed Size (px)
Citation preview

Civil and Resource Engineering Dalhousie University
Photoelectrochemical Chemical Oxygen Demand Analysis in Drinking Water Amina Stoddart
February 11, 2016
Introduction
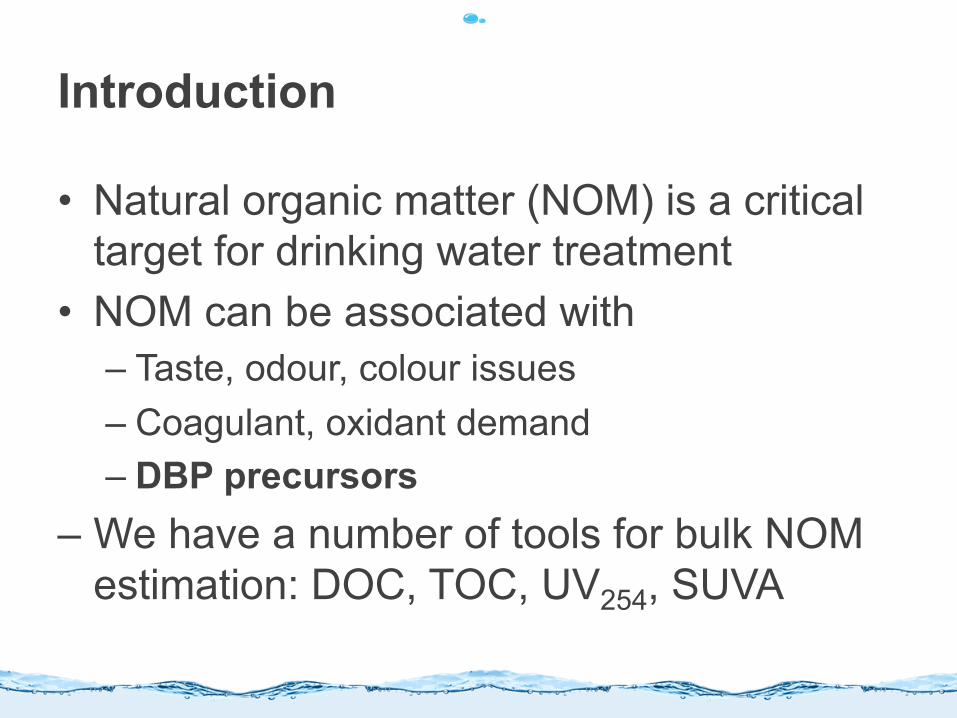
• Natural organic matter (NOM) is a critical target for drinking water treatment
• NOM can be associated with – Taste, odour, colour issues – Coagulant, oxidant demand – DBP precursors
– We have a number of tools for bulk NOM estimation: DOC, TOC, UV254, SUVA

Chemical Oxygen Demand (COD) Measurement in Drinking Water
• Traditional NOM surrogates may not be suitable for assessing NOM removal in all cases – UV254, SUVA
• Rely on aromaticity, which is not a chemical feature of many organic compounds, example sugars
– Carbon (e.g., as TOC, DOC) • Does not quantify the reactivity of the organic

What is Chemical Oxygen Demand?
+ O2 à CO2 + H2O + NH3
TOC measures conversion to CO2

What is Chemical Oxygen Demand?
+ O2 à CO2 + H2O + NH3
COD measures “demand” for oxygen
TOC measures conversion to CO2

Why is COD not often used in Drinking Water?
• The traditional method for COD determination is to oxidize with potassium dichromate under acidic conditions
• Issues: – Sensitivity – Use of hazardous chemicals
• Dichromate, mercury, surfuric acid
– Analysis time • Hours
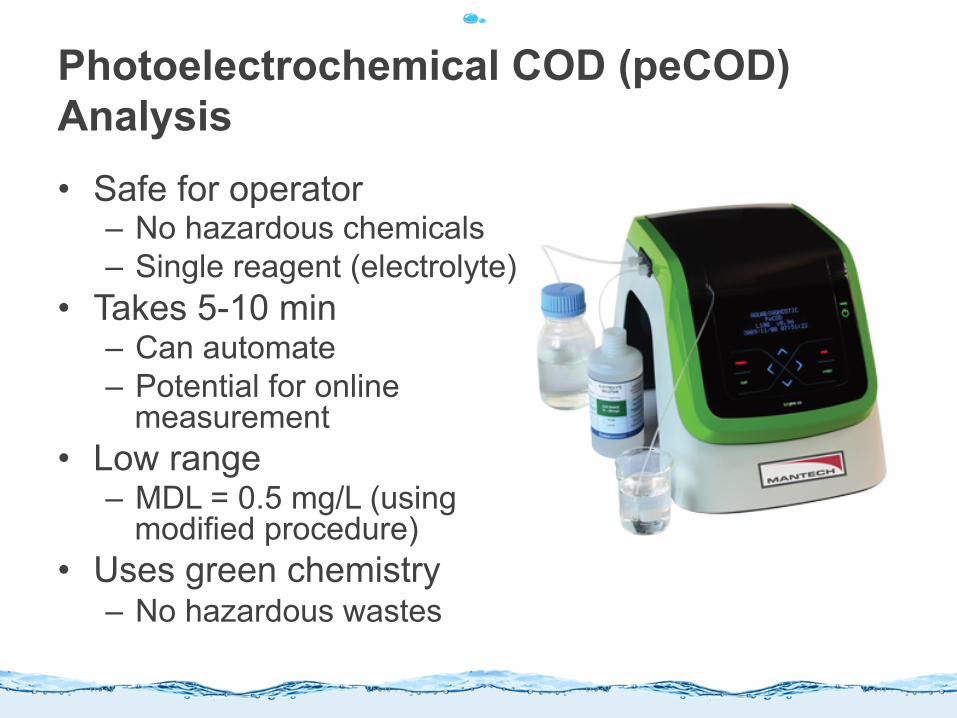
Photoelectrochemical COD (peCOD) Analysis • Safe for operator
– No hazardous chemicals – Single reagent (electrolyte)
• Takes 5-10 min – Can automate – Potential for online
measurement • Low range
– MDL = 0.5 mg/L (using modified procedure)
• Uses green chemistry – No hazardous wastes

Working Principle: peCOD

Technical Approach
1. Conducted initial method validation with model organic compounds a. Compared peCOD of carboxylic acids, amino acids and
reference compounds to the calculated theoretical oxygen demand (ThOD)
b. Verified peCOD applicability in the drinking water NOM range of concern
2. Tested technology at various drinking water treatment plants
3. Monitored full-scale drinking water biofiltration

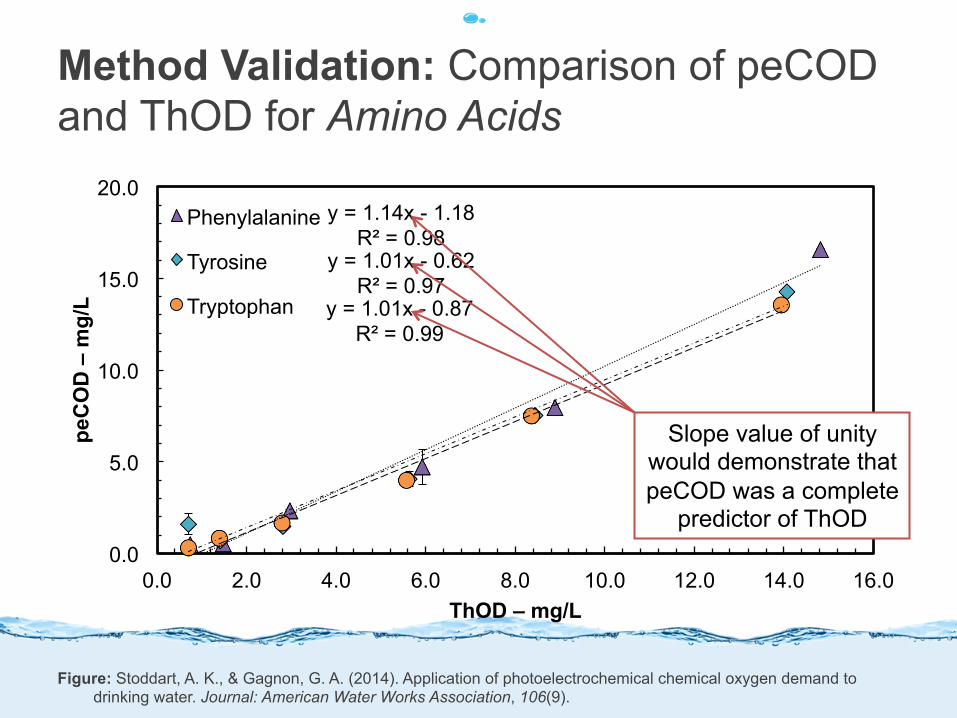
Method Validation: Comparison of peCOD and ThOD for Amino Acids
Figure: Stoddart, A. K., & Gagnon, G. A. (2014). Application of photoelectrochemical chemical oxygen demand to drinking water. Journal: American Water Works Association, 106(9).
y = 1.14x - 1.18 R² = 0.98
y = 1.01x - 0.62 R² = 0.97
y = 1.01x - 0.87 R² = 0.99
0.0
5.0
10.0
15.0
20.0
0.0 2.0 4.0 6.0 8.0 10.0 12.0 14.0 16.0
peC
OD
– m
g/L
ThOD – mg/L
Phenylalanine
Tyrosine
Tryptophan
Slope value of unity would demonstrate that peCOD was a complete
predictor of ThOD

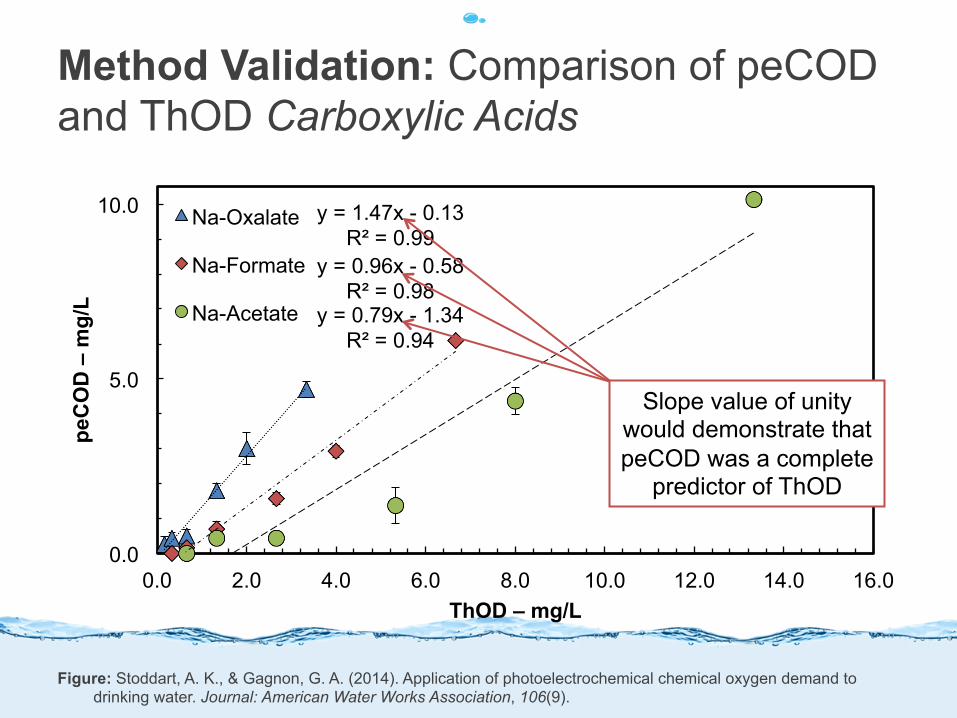
Method Validation: Comparison of peCOD and ThOD Carboxylic Acids
Figure: Stoddart, A. K., & Gagnon, G. A. (2014). Application of photoelectrochemical chemical oxygen demand to drinking water. Journal: American Water Works Association, 106(9).
y = 1.47x - 0.13 R² = 0.99
y = 0.96x - 0.58 R² = 0.98
y = 0.79x - 1.34 R² = 0.94
0.0
5.0
10.0
0.0 2.0 4.0 6.0 8.0 10.0 12.0 14.0 16.0
peC
OD
– m
g/L
ThOD – mg/L
Na-Oxalate
Na-Formate
Na-Acetate
Slope value of unity would demonstrate that peCOD was a complete
predictor of ThOD

Method Validation: Comparison of peCOD and TOC
• peCOD detectable at TOC concentrations characteristic of raw and treated water – i.e., 1-5 mg C/L
• peCOD:TOC ratios were predictable based on stoichiometry of the oxidation reaction – i.e., oxygen to carbon
ratio
y = 3.24x - 1.52 R² = 0.99
y = 3.05x - 1.10 R² = 0.96
y = 3.11x - 1.30 R² = 0.99
0.0
5.0
10.0
15.0
20.0
0.0 2.0 4.0 6.0
peC
OD
– m
g/L
TOC – mg/L
Phenylalanine
Tyrosine
Tryptophan
Figure: Stoddart, A. K., & Gagnon, G. A. (2014). Application of photoelectrochemical chemical oxygen demand to drinking water. Journal: American Water Works Association, 106(9).

Method Validation: Comparison of peCOD and TOC
• peCOD detectable at TOC concentrations characteristic of raw and treated water – i.e., 1-5 mg C/L
• peCOD:TOC ratios were predictable based on stoichiometry of the oxidation reaction – i.e., oxygen to carbon
ratio
Figure: Stoddart, A. K., & Gagnon, G. A. (2014). Application of photoelectrochemical chemical oxygen demand to drinking water. Journal: American Water Works Association, 106(9).
y = 1.03x - 0.34 R² = 0.99
y = 1.33x - 0.88 R² = 0.98
y = 2.14x - 1.62 R² = 0.94
0.0
5.0
10.0
0.0 2.0 4.0 6.0
peC
OD
– m
g/L
TOC – mg/L
Na-Oxalate
Na-Formate
Na-Acetate
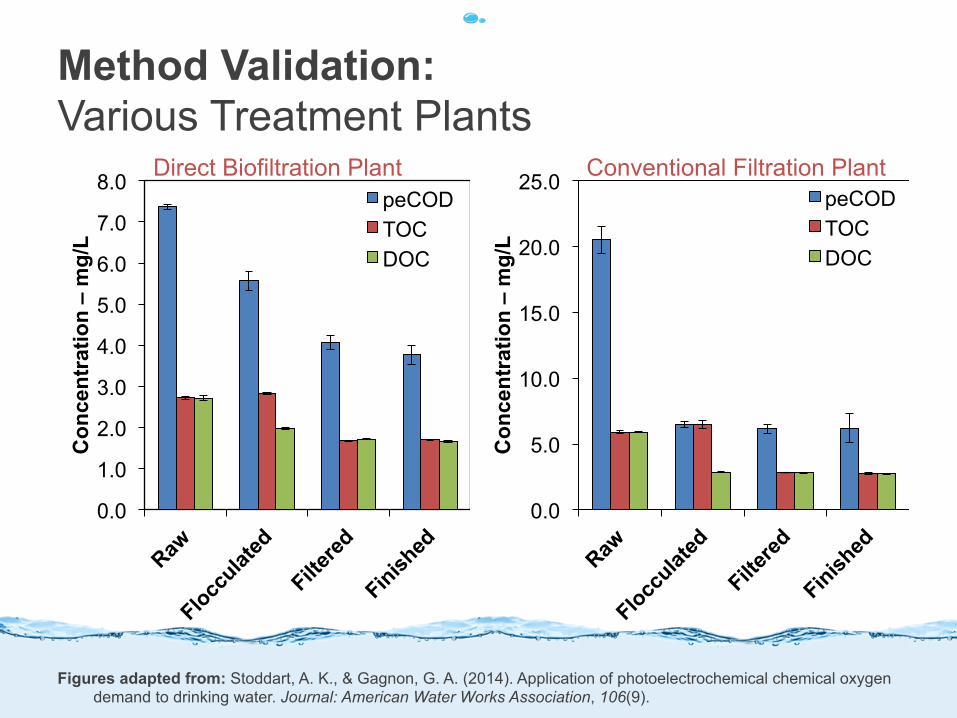
Method Validation: Various Treatment Plants
Figures adapted from: Stoddart, A. K., & Gagnon, G. A. (2014). Application of photoelectrochemical chemical oxygen demand to drinking water. Journal: American Water Works Association, 106(9).
0.0
1.0
2.0
3.0
4.0
5.0
6.0
7.0
8.0
Con
cent
ratio
n –
mg/
L
peCOD TOC DOC
0.0
5.0
10.0
15.0
20.0
25.0
Con
cent
ratio
n –
mg/
L
peCOD TOC DOC
Direct Biofiltration Plant Conventional Filtration Plant
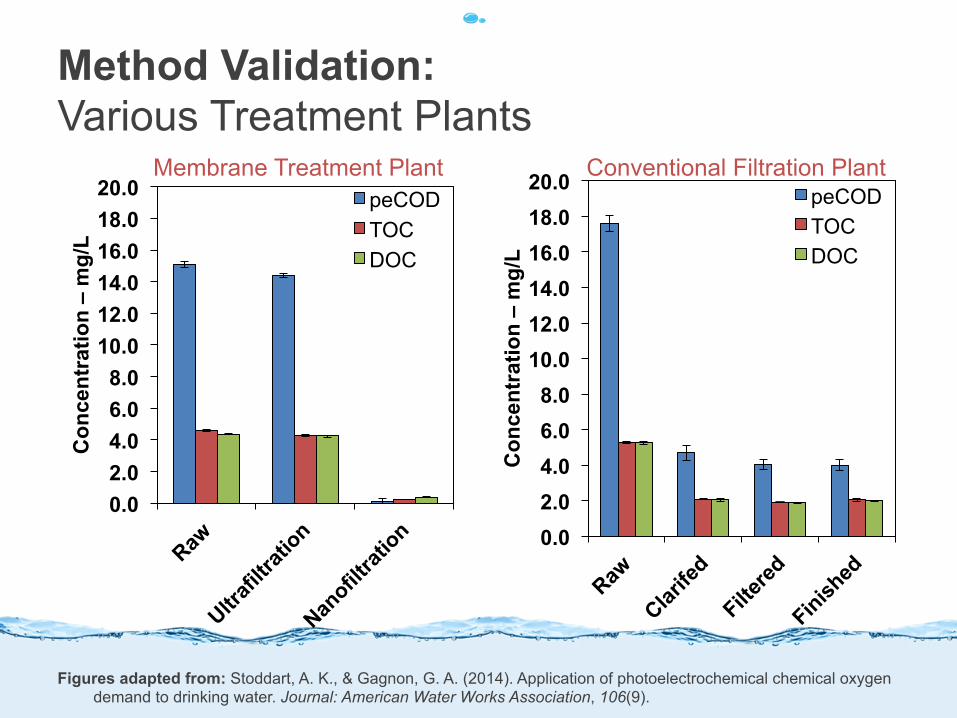
Method Validation: Various Treatment Plants
Figures adapted from: Stoddart, A. K., & Gagnon, G. A. (2014). Application of photoelectrochemical chemical oxygen demand to drinking water. Journal: American Water Works Association, 106(9).
Membrane Treatment Plant Conventional Filtration Plant
0.0 2.0 4.0 6.0 8.0
10.0 12.0 14.0 16.0 18.0 20.0
Con
cent
ratio
n –
mg/
L
peCOD TOC DOC
0.0 2.0 4.0 6.0 8.0
10.0 12.0 14.0 16.0 18.0 20.0
Con
cent
ratio
n –
mg/
L
peCOD TOC DOC
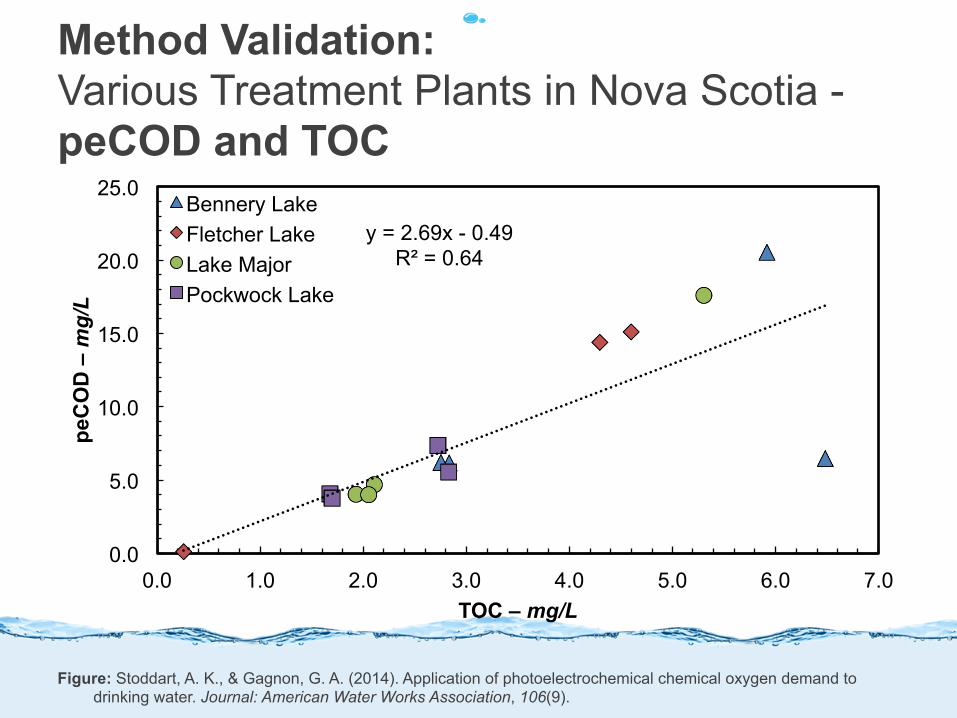
Method Validation: Various Treatment Plants in Nova Scotia - peCOD and TOC
Figure: Stoddart, A. K., & Gagnon, G. A. (2014). Application of photoelectrochemical chemical oxygen demand to drinking water. Journal: American Water Works Association, 106(9).
y = 2.69x - 0.49 R² = 0.64
0.0
5.0
10.0
15.0
20.0
25.0
0.0 1.0 2.0 3.0 4.0 5.0 6.0 7.0
peC
OD
– m
g/L
TOC – mg/L
Bennery Lake Fletcher Lake Lake Major Pockwock Lake

Method Validation: Various Treatment Plants in Nova Scotia - peCOD and DOC
y = 3.04x R² = 0.91
0.0
5.0
10.0
15.0
20.0
25.0
0.0 1.0 2.0 3.0 4.0 5.0 6.0 7.0
peC
OD
– m
g/L
DOC – mg/L
Bennery Lake Fletcher Lake Lake Major Pockwock Lake
Figure: Stoddart, A. K., & Gagnon, G. A. (2014). Application of photoelectrochemical chemical oxygen demand to drinking water. Journal: American Water Works Association, 106(9).
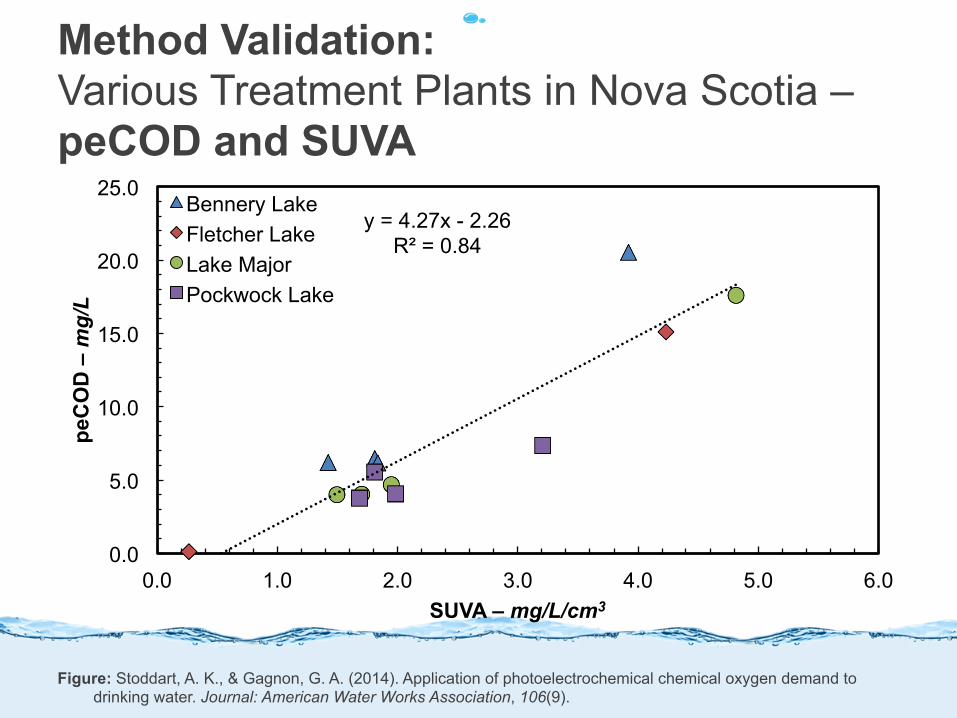
Method Validation: Various Treatment Plants in Nova Scotia – peCOD and SUVA
Figure: Stoddart, A. K., & Gagnon, G. A. (2014). Application of photoelectrochemical chemical oxygen demand to drinking water. Journal: American Water Works Association, 106(9).
y = 4.27x - 2.26 R² = 0.84
0.0
5.0
10.0
15.0
20.0
25.0
0.0 1.0 2.0 3.0 4.0 5.0 6.0
peC
OD
– m
g/L
SUVA – mg/L/cm3
Bennery Lake Fletcher Lake Lake Major Pockwock Lake

Case Study: Biofiltration Monitoring
Biofiltration Monitoring : Background
• Direct filtration drinking water treatment plant underwent conversion to biofiltration through removal of pre-chlorination
• Conversion resulted in – Reduction in HAAs (~40-60%) and THMs (~20-60%) – Increase in bioactivity on the filter media
• 40 ng ATP/cm3 to 200-300 ng ATP/cm3
• However, limited DOC removal across the filter occurred, making it difficult to assess treatment performance

Decrease in THM and HAA concentrations as a result of conversion
Figure adapted from: Stoddart, A. K., & Gagnon, G. A. (2015). JAWWA.
0
20
40
60
80
26-Feb-11 14-Sep-11 1-Apr-12 18-Oct-12 6-May-13 22-Nov-13 10-Jun-14 27-Dec-14
THM
—µg
/L
Filtration Biofiltration
0 10 20 30 40 50 60
26-Feb-11 14-Sep-11 1-Apr-12 18-Oct-12 6-May-13 22-Nov-13 10-Jun-14 27-Dec-14
HA
A—
µg/L
Filtration Biofiltration
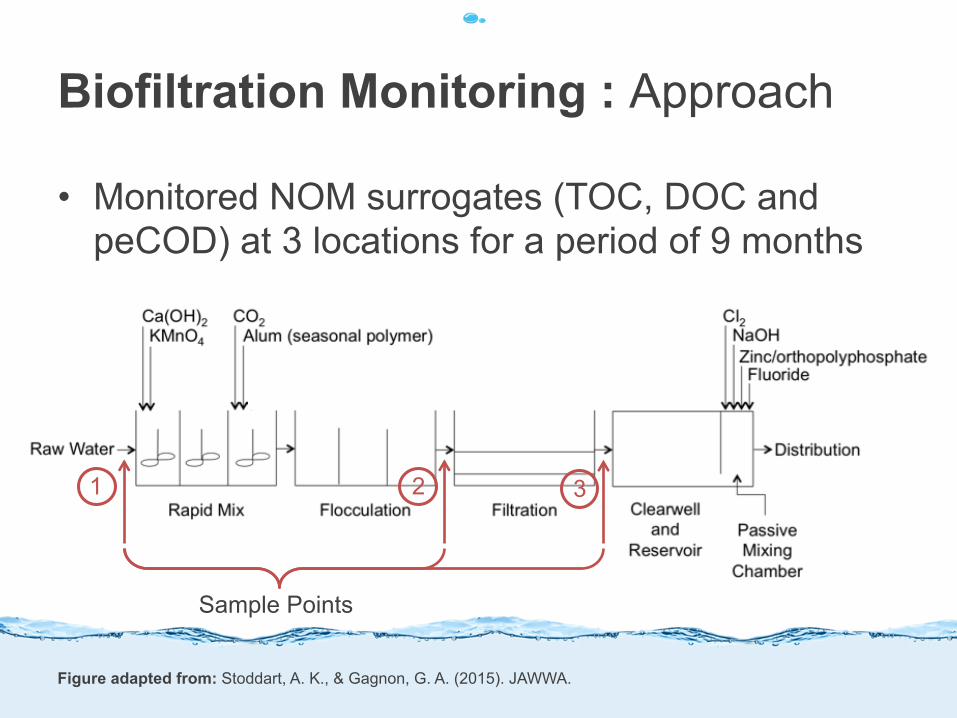
Biofiltration Monitoring : Approach
• Monitored NOM surrogates (TOC, DOC and peCOD) at 3 locations for a period of 9 months
Figure adapted from: Stoddart, A. K., & Gagnon, G. A. (2015). JAWWA.
Sample Points
1 2 3
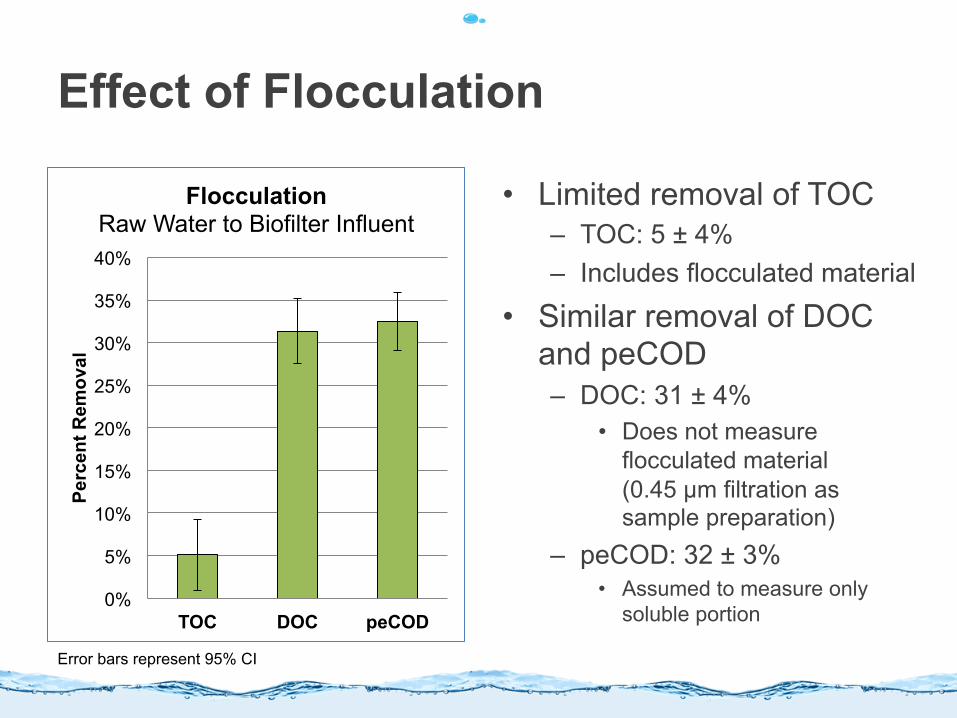
Effect of Flocculation
• Limited removal of TOC – TOC: 5 ± 4% – Includes flocculated material
• Similar removal of DOC and peCOD – DOC: 31 ± 4%
• Does not measure flocculated material (0.45 µm filtration as sample preparation)
– peCOD: 32 ± 3% • Assumed to measure only
soluble portion 0%
5%
10%
15%
20%
25%
30%
35%
40%
TOC DOC peCOD
Perc
ent R
emov
al
Flocculation Raw Water to Biofilter Influent
Error bars represent 95% CI

Effect of Biofiltration
• Greatest average removal of TOC – TOC: 29 ± 4% – Flocculated material
filtered out • Limited average
removal of DOC – DOC: 2 ± 1%
• More peCOD removal – peCOD: 19 ± 5%
0%
5%
10%
15%
20%
25%
30%
35%
TOC DOC peCOD
Perc
ent R
emov
al
Biofiltration Biofilter Influent to Biofilter
Effluent
Error bars represent 95% CI

Effect of Flocculation and Biofiltration
NOM Surrogate Raw Water
Flocculated Water
Biofiltered Water
TOC—mg/L 3.16 ± 0.13 3.00 ± 0.16 2.06 ± 0.07
DOC—mg/L 3.04 ± 0.34 2.07 ± 0.06 2.09 ± 0.12
peCOD—mg/L 8.51 ± 0.55 5.90 ± 0.46 4.64 ± 0.42

Effect of Flocculation and Biofiltration
NOM Surrogate Raw Water
Flocculated Water Removal Biofiltered
Water Removal
TOC—mg/L 3.16 ± 0.13 3.00 ± 0.16 0.16 2.06 ± 0.07 0.94
DOC—mg/L 3.04 ± 0.34 2.07 ± 0.06 0.97 2.09 ± 0.12 -‐0.05
peCOD—mg/L 8.51 ± 0.55 5.90 ± 0.46 2.61 4.64 ± 0.42 1.26
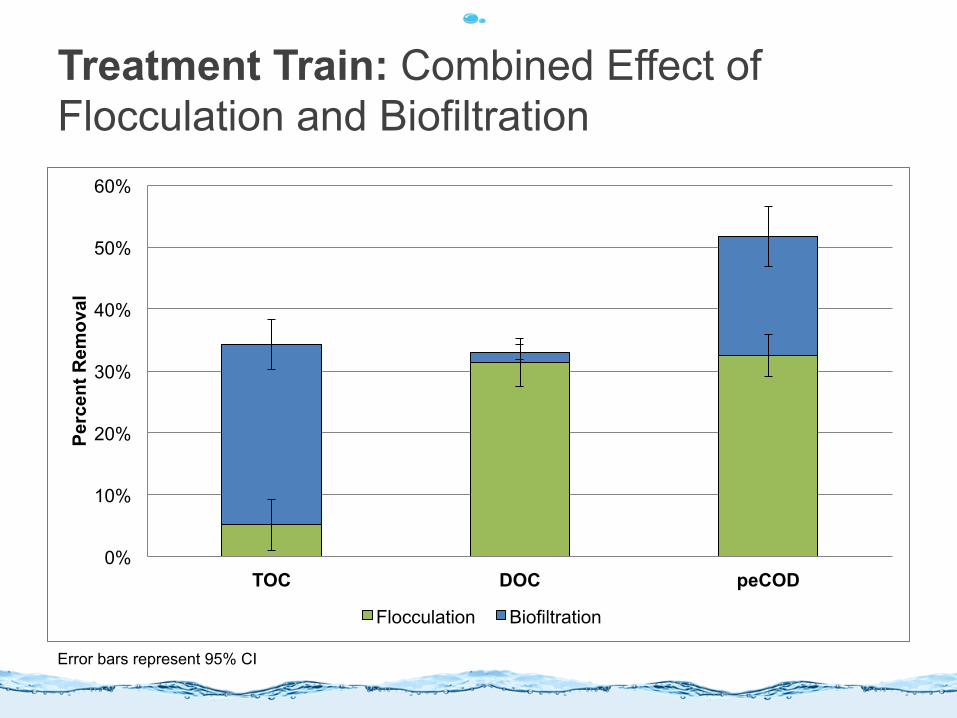
Treatment Train: Combined Effect of Flocculation and Biofiltration
0%
10%
20%
30%
40%
50%
60%
TOC DOC peCOD
Perc
ent R
emov
al
Flocculation Biofiltration
Error bars represent 95% CI
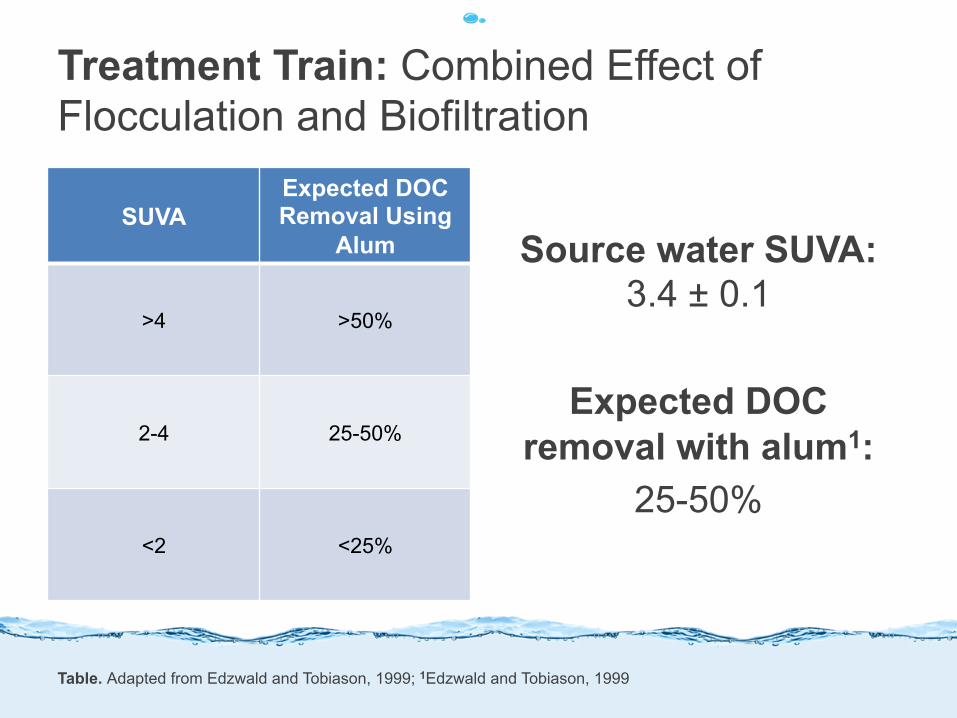
Treatment Train: Combined Effect of Flocculation and Biofiltration
SUVA Expected DOC Removal Using
Alum
>4 >50%
2-4 25-50%
<2 <25%
Source water SUVA:
3.4 ± 0.1
Expected DOC removal with alum1:
25-50%
Table. Adapted from Edzwald and Tobiason, 1999; 1Edzwald and Tobiason, 1999

Treatment Train: Combined Effect of Flocculation and Biofiltration
0%
10%
20%
30%
40%
50%
60%
TOC DOC peCOD
Perc
ent R
emov
al
Flocculation Biofiltration
Error bars represent 95% CI
Physical/chemical Removal: ~35%

Treatment Train: Combined Effect of Flocculation and Biofiltration
0%
10%
20%
30%
40%
50%
60%
TOC DOC peCOD
Perc
ent R
emov
al
Flocculation Biofiltration
Error bars represent 95% CI
Physical/chemical Removal: ~35%
Bio-oxidative Removal (?):
~15%

Decrease in THM and HAA concentrations as a result of conversion
Figure: Stoddart, A. K., & Gagnon, G. A. (2015). JAWWA.
0
20
40
60
80
26-Feb-11 14-Sep-11 1-Apr-12 18-Oct-12 6-May-13 22-Nov-13 10-Jun-14 27-Dec-14
THM
—µg
/L
Filtration Biofiltration
0 10 20 30 40 50 60
26-Feb-11 14-Sep-11 1-Apr-12 18-Oct-12 6-May-13 22-Nov-13 10-Jun-14 27-Dec-14
HA
A—
µg/L
Filtration Biofiltration
Does removal of these compounds translate to improved DBP control?
Conclusions
• peCOD can measure NOM rapidly, at low concentrations and without the use of hazardous chemicals
• peCOD is an appropriate bulk NOM parameter
• The use of peCOD to monitor biofiltration may provide additional information on NOM removal and subsequent biofilter performance to compliment other NOM surrogates