Embed Size (px)
Citation preview

I
PHOTO-TREATMENT OF PALM OIL MILLS
EFFLUENT (POME) OVER Cu/TiO2
PHOTOCATALYST
NG KIM HOONG
Thesis submitted in fulfilment of the requirements
for the award of the degree of
Bachelor of Chemical Engineering
Faculty of Chemical & Natural Resources Engineering
UNIVERSITI MALAYSIA PAHANG
DECEMBER 2013
©NG KIM HOONG (2013)

VI
ABSTRACT
The current work reports the use of titania based photocatalysts for the photo-
treatment of palm oil mill effluent collected from Felda Lepar Hilir 3, a local source.
Different metal loadings of copper viz. 2wt%, 5wt%, 10wt%, 15wt%, 20wt% and
25wt% were doped onto titania employing wet impregnation method. The synthesized
catalysts were subjected to physicochemical characterization. Gas pycnometer density
measurements revealed that the actual density of catalysts were lower than theoretical
density due to the porous structure as proven by the subsequent liquid N2
physisorption. In addition, X-ray diffraction pattern showed formation of CuO with
crystallite size ranging from 41.8 to 49.1 nm upon calcination. Significantly, liquid N2
physisorption showed that the BET specific surface area of catalysts prepared
decreased with wt% of Cu probably due to pore blockage Moreover, 5wt% Cu/TiO2
exhibits the largest pore volume, which is 0.049 cm3/g for both adsorption and
desorption volume. In the term of pore size, 20wt% of Cu/TiO2 has the largest
adsorption pore size, which is 23.39 nm while 5wt% of Cu/TiO2 has the largest
desorption pore size, which is 19.83 nm. Based on the UV-irradiated photoreaction
results, 20wt% Cu/TiO2 yielded the highest organic degradability (conversion) among
all the synthesized catalysts. Overall, 27.0% conversion was achieved within 1 h of
photoreaction. Based on the integral method, it seems that the POME photo-reaction
followed the 2nd
-order reaction. Moreover, 20 wt% Cu/TiO2 exhibited the highest
specific reaction constant at 2.60×10⁻⁵
(ppm.min)-1
. Besides, an optimum catalyst
loading were also discovered in current project. For 20wt% Cu/TiO2, the optimum
catalyst loading is 0.83g/L of POME solution. Finally, a longevity test was conducted
and it was found that more than 40% of the organic contaminant was decomposed
after 7 h of UV-irradiation. Moreover, CO and CO2 were detected in the gas products
from GC analysis. As conclusion, phototreatment for POME shows positive results in
current project and is suitable to replace the existing traditional POME method for
better efficiency.
Key words: Copper ; Palm oil mill effluent ; Photocatalysis, Titania-;
VII
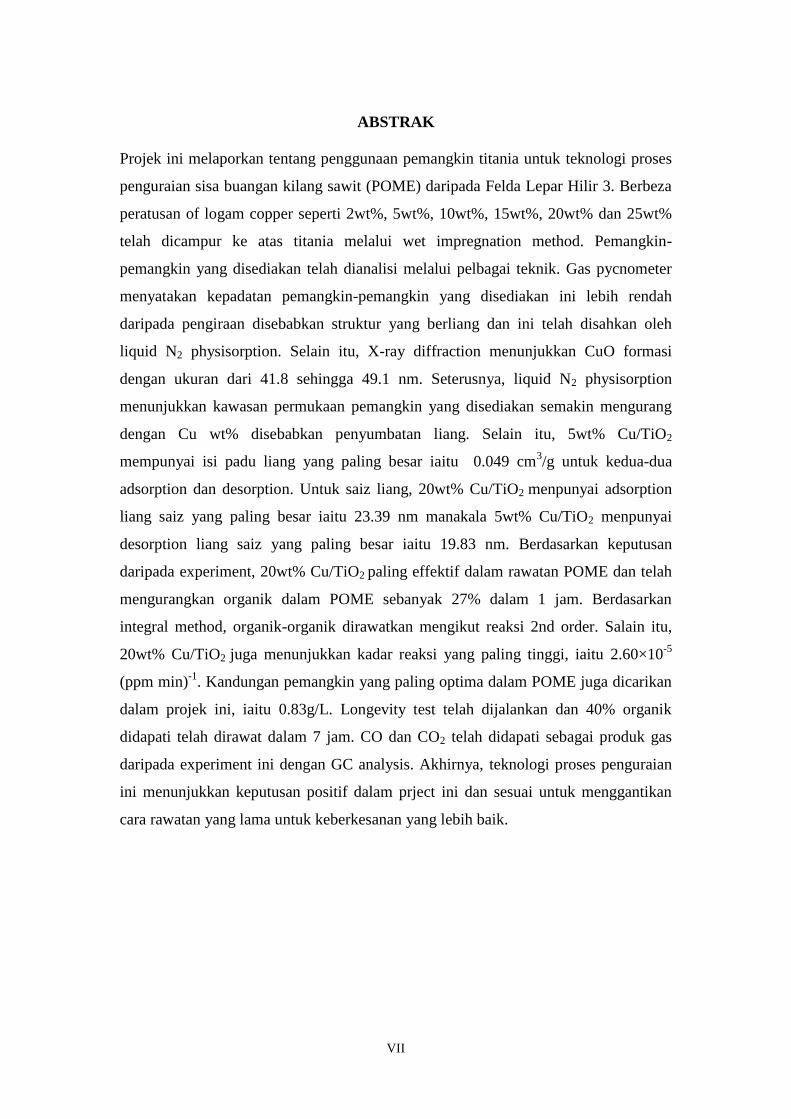
ABSTRAK
Projek ini melaporkan tentang penggunaan pemangkin titania untuk teknologi proses
penguraian sisa buangan kilang sawit (POME) daripada Felda Lepar Hilir 3. Berbeza
peratusan of logam copper seperti 2wt%, 5wt%, 10wt%, 15wt%, 20wt% dan 25wt%
telah dicampur ke atas titania melalui wet impregnation method. Pemangkin-
pemangkin yang disediakan telah dianalisi melalui pelbagai teknik. Gas pycnometer
menyatakan kepadatan pemangkin-pemangkin yang disediakan ini lebih rendah
daripada pengiraan disebabkan struktur yang berliang dan ini telah disahkan oleh
liquid N2 physisorption. Selain itu, X-ray diffraction menunjukkan CuO formasi
dengan ukuran dari 41.8 sehingga 49.1 nm. Seterusnya, liquid N2 physisorption
menunjukkan kawasan permukaan pemangkin yang disediakan semakin mengurang
dengan Cu wt% disebabkan penyumbatan liang. Selain itu, 5wt% Cu/TiO2
mempunyai isi padu liang yang paling besar iaitu 0.049 cm3/g untuk kedua-dua
adsorption dan desorption. Untuk saiz liang, 20wt% Cu/TiO2 menpunyai adsorption
liang saiz yang paling besar iaitu 23.39 nm manakala 5wt% Cu/TiO2 menpunyai
desorption liang saiz yang paling besar iaitu 19.83 nm. Berdasarkan keputusan
daripada experiment, 20wt% Cu/TiO2 paling effektif dalam rawatan POME dan telah
mengurangkan organik dalam POME sebanyak 27% dalam 1 jam. Berdasarkan
integral method, organik-organik dirawatkan mengikut reaksi 2nd order. Salain itu,
20wt% Cu/TiO2 juga menunjukkan kadar reaksi yang paling tinggi, iaitu 2.60×10⁻⁵
(ppm min)-1
. Kandungan pemangkin yang paling optima dalam POME juga dicarikan
dalam projek ini, iaitu 0.83g/L. Longevity test telah dijalankan dan 40% organik
didapati telah dirawat dalam 7 jam. CO dan CO2 telah didapati sebagai produk gas
daripada experiment ini dengan GC analysis. Akhirnya, teknologi proses penguraian
ini menunjukkan keputusan positif dalam prject ini dan sesuai untuk menggantikan
cara rawatan yang lama untuk keberkesanan yang lebih baik.

VIII
LIST OF EXIBITION
No Exibition Location
1 Citrex 2013 Universiti Malaysia Pahang, Malaysia
2 Pecipta 2013 KLCC, Malaysia
3 ISCRE 2014 Bangkok, Thailand

IX
TABLE OF CONTENTS
CHAPTER TITLE PAGE
SUPERVISOR’S DECLARATION II
STUDENT’S DECLARATION III
DEDICATION IV
ACKNOWLEDGEMENT V
ABSTACT VI
ABSTRAK VII
LIST OF EXIBITION VIII
TABLE OF CONTENTS IX
LIST OF FIGURE XII
LIST OF TABLE XV
LIST OF ABBREVIATIONS XVI
LIST OF ABBREVIATIONS XVII
LIST OF APPENDICES XVIII
1 INTRODUCTION
1.1 Background 1
1.2 Problem Statement 3
1.3 Objective 3
1.4 Scopes of Study 4
1.5 Rational and Significance 4
2 LITERATURE REVIEW
2.1 Introduction 6
2.2 Palm Oil Mill Effluent (POME) 7
2.3 POME Treatments 9
2.4 Titanium Dioxide (TiO2) as Photocatalyst 11
2.5 Mechanism of Photocatalysis 11
2.6 Past Photocatalysis Studies
2.6.1 Photocatalysis with Different Photocatalysts 13
2.6.2 The Effects of Different Dopants on TiO2
Photocatalyst
20
X
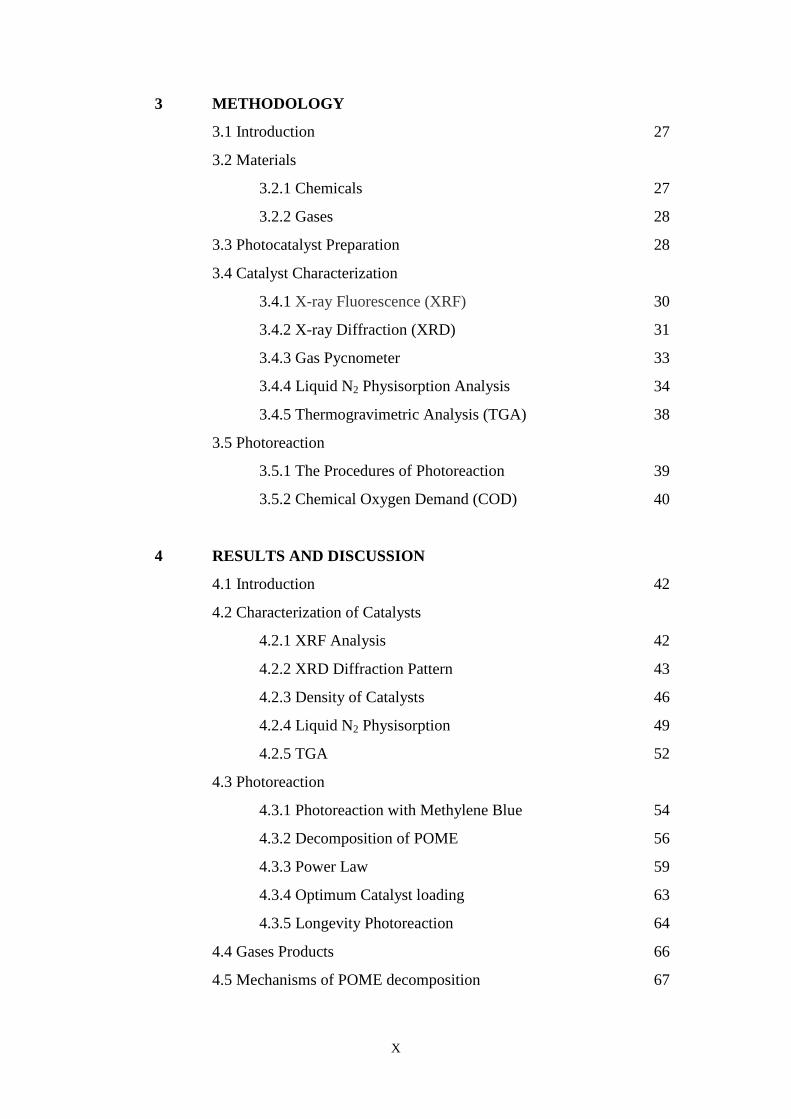
3 METHODOLOGY
3.1 Introduction 27
3.2 Materials
3.2.1 Chemicals 27
3.2.2 Gases 28
3.3 Photocatalyst Preparation 28
3.4 Catalyst Characterization
3.4.1 X-ray Fluorescence (XRF) 30
3.4.2 X-ray Diffraction (XRD) 31
3.4.3 Gas Pycnometer 33
3.4.4 Liquid N2 Physisorption Analysis 34
3.4.5 Thermogravimetric Analysis (TGA) 38
3.5 Photoreaction
3.5.1 The Procedures of Photoreaction 39
3.5.2 Chemical Oxygen Demand (COD) 40
4 RESULTS AND DISCUSSION
4.1 Introduction 42
4.2 Characterization of Catalysts
4.2.1 XRF Analysis 42
4.2.2 XRD Diffraction Pattern 43
4.2.3 Density of Catalysts 46
4.2.4 Liquid N2 Physisorption 49
4.2.5 TGA 52
4.3 Photoreaction
4.3.1 Photoreaction with Methylene Blue 54
4.3.2 Decomposition of POME 56
4.3.3 Power Law 59
4.3.4 Optimum Catalyst loading 63
4.3.5 Longevity Photoreaction 64
4.4 Gases Products 66
4.5 Mechanisms of POME decomposition 67

XI
5 CONCLUSIONS AND RECOMMENDATIONS
5.1 Conclusions 68
5.2 Recommendations 70
REFERENCE 71
APPENDICES 80

XII
LIST OF FIGURES
FIGURE TITLE PAGE
2.1 The mechanisms of photocatalyst (Lasa et al., 2005).
12
2.2 Kinetics curves of conversion of phenol with MnO2 as
photocatalyst (Zhang et al., 2011).
17
2.3 The graph of removal (%) of organic substances versus
photocatalyst concentration (Fenoll et al., 2012).
17
2.4 Concentration of 2,4,6-TCP vs irradiation time under visible-
light irradiation (λ > 400 nm) with the presence of LDH film
catalysts with different thickness (Tian et al., 2004).
18
2.5 Photoactivties of four metal oxides in deionized water at various
concentration (Lake, 1999).
19
2.6 Azobenzene formation in ethanol on Fe2O3 at different aniline
concentration under irradiation of UV-light and solar (visible)
light (Karunakaran & Senthilvelan, 2006).
20
2.7 Comparison of the decolorization efficiency of Procion red MX-
5B by different %wt of Ag/TiO2 (Lin & Lee, 2010).
22
2.8 The graph of (C/C0) of congo red versus UV irradiation time
with various catalyst composition (Farbod & Vala, 2013).
23
2.9 The (C/C0) of methyl orange versus visible light irradiation time
with different compositions of Fe/TiO2 catalyst (Cui et al.,2009).
24
2.10 Photocatalytic discoloration of methylene blue (MB) by TiO2–
Cu thin films (Carvalho et al., 2010).
25
2.11 Photocatalytic degradation of Orange II using Cu–Ni, bare TiO2,
10wt% Cu/TiO2 calcined at 498 K and 10wt% Ni/TiO2 calcined
at 498 K photocatalysts and Orange II solution without TiO2
(Raiz et al., 2012).
25
2.12 H2 production from methanol with different wt% of Cu/TiO2
photocatalyst (Wu & Lee, 2004).
26
3.1 A schematic diagram of XRD (A) Collimation (B) Sample (C)
Slit (D) Exit Beam Monochromator (E) Detector (X) Source of
X-Rays ( Source: Cullity, 1978).
33
3.2 Typical N2 adsorption-desorption isotherms of mesoporous
materials
35

XIII
LIST OF FIGURES
FIGURE TITLE PAGE
3.3 Typical N2 adsorption-desorption isotherms of mesoporous
materials.
36
3.4 The setup of photoreaction.
40
4.1 Complete XRD patterns for (a) 2wt% Cu/ TiO2 (b) 5wt% Cu/
TiO2 (c) 10wt% Cu/ TiO2 (d) 15wt% Cu/ TiO2 (e) 20wt% Cu/
TiO2 (f)25wt% Cu/TiO2.
44
4.2 XRD patterns for catalyst prepared from 2θ =35 to 45°.
45
4.3 The density of 2wt% Cu/ TiO2.
46
4.4 The density value obtained from Equations (4.1) and (4.2).
48
4.5 Comparisons of densities obtained from gas pycnometer and
Equations (4.1) and (4.2).
49
4.6 The isotherms for 2wt%, 5wt%, 10wt%, 15wt%, 20wt%, and
25wt% of Cu/TiO2 (from top top to bottom).
50
4.7 Derivative weight profile of catalysts prepared
53
4.8 Derivative weight profile of catalysts prepared from T=450 to
550 K.
54
4.9 The calibration curve for methylene blue.
55
4.10 Normalized COD for photoreaction of various wt% of catalysts.
57
4.11 The actual wt% of Cu and conversion of sample for 2wt% to
20wt% of Cu/TiO2.
58
4.12 The conversion and the pore diameter for 20wt% and 25wt% of
Cu/TiO2.
59
4.13 Graph for second-order reactions.
61
4.14 Comparison between predicted (1/CA) value and actual (1/CA)
value.
61
4.15 Residual plot for decomposition rate of organics in POME.
62
4.16 Graph of conversion versus catalyst loading.
63
4.17 The POME samples for t=0 h (left) and t=7 h (right).
64
4.18 The conversion profile of organics in POME. 65

XIV
LIST OF FIGURES
FIGURE TITLE PAGE
4.19 Photoreaction setup to collect gases products.
66
4.20 The gas chromatogram of gases produced.
67
XV
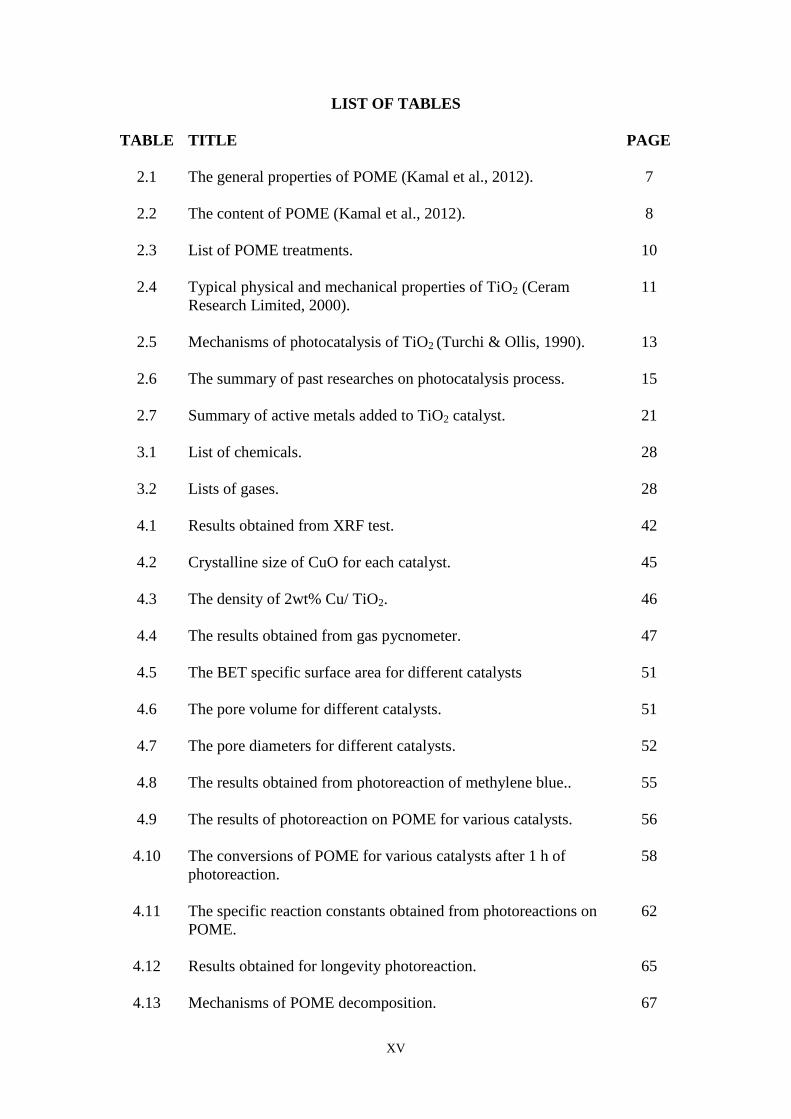
LIST OF TABLES
TABLE TITLE
PAGE
2.1 The general properties of POME (Kamal et al., 2012).
7
2.2 The content of POME (Kamal et al., 2012).
8
2.3 List of POME treatments.
10
2.4 Typical physical and mechanical properties of TiO2 (Ceram
Research Limited, 2000).
11
2.5 Mechanisms of photocatalysis of TiO2 (Turchi & Ollis, 1990).
13
2.6 The summary of past researches on photocatalysis process.
15
2.7 Summary of active metals added to TiO2 catalyst.
21
3.1 List of chemicals.
28
3.2 Lists of gases.
28
4.1 Results obtained from XRF test.
42
4.2 Crystalline size of CuO for each catalyst.
45
4.3 The density of 2wt% Cu/ TiO2.
46
4.4 The results obtained from gas pycnometer.
47
4.5 The BET specific surface area for different catalysts
51
4.6 The pore volume for different catalysts.
51
4.7 The pore diameters for different catalysts.
52
4.8 The results obtained from photoreaction of methylene blue..
55
4.9 The results of photoreaction on POME for various catalysts.
56
4.10 The conversions of POME for various catalysts after 1 h of
photoreaction.
58
4.11 The specific reaction constants obtained from photoreactions on
POME.
62
4.12 Results obtained for longevity photoreaction.
65
4.13 Mechanisms of POME decomposition. 67
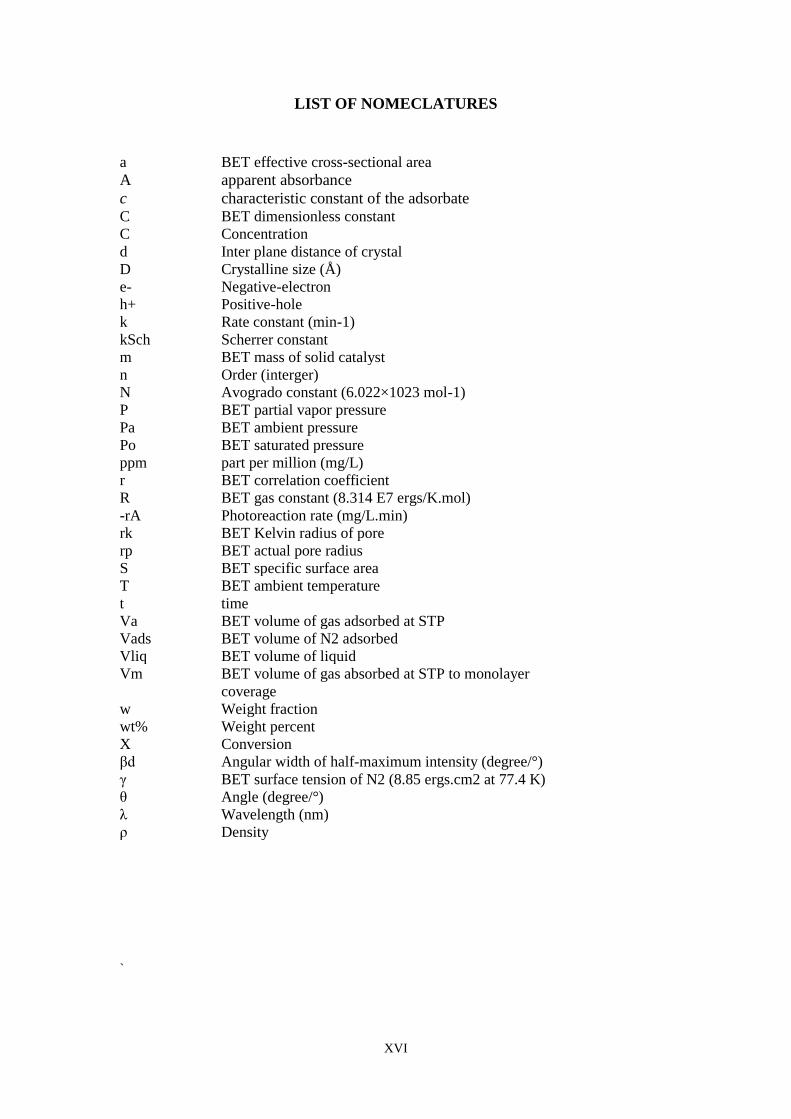
XVI
LIST OF NOMECLATURES
a BET effective cross-sectional area
A apparent absorbance
c characteristic constant of the adsorbate
C BET dimensionless constant
C Concentration
d Inter plane distance of crystal
D Crystalline size (Å)
e- Negative-electron
h+ Positive-hole
k Rate constant (min-1)
kSch Scherrer constant
m BET mass of solid catalyst
n Order (interger)
N Avogrado constant (6.022×10²³ mol-1)
P BET partial vapor pressure
Pa BET ambient pressure
Po BET saturated pressure
ppm part per million (mg/L)
r BET correlation coefficient
R BET gas constant (8.314 E7 ergs/K.mol)
-rA Photoreaction rate (mg/L.min)
rk BET Kelvin radius of pore
rp BET actual pore radius
S BET specific surface area
T BET ambient temperature
t time
Va BET volume of gas adsorbed at STP
Vads BET volume of N2 adsorbed
Vliq BET volume of liquid
Vm BET volume of gas absorbed at STP to monolayer
coverage
w Weight fraction
wt% Weight percent
X Conversion
βd Angular width of half-maximum intensity (degree/°)
γ BET surface tension of N2 (8.85 ergs.cm2 at 77.4 K)
θ Angle (degree/°)
λ Wavelength (nm)
ρ Density
`
XVII
LIST OF ABBREVIATIONS
BET Brunauer-Emmett-Teller
BJH Barrett, Joyner and Halenda
BOD Biochemical oxygen demand
COD Chemical oxygen demand
DH Dollimore and Heal
DSC Differential scanning calorimetry
DTA Differential thermal analysis
HRT Hydraulic retention time
LDH Layered double hydroxide
MB Methylene blue
POME Palm oil mills effluent
TGA Thermogravimetric Analysis
XRD X-ray Diffraction
XRF X-ray Fluorescence

XVIII
LIST OF APPENDICES
APPENDIX TITLE
PAGE
A Calculations for Catalyst Preparation
80
B XRF Results
82
C XRD Results
87
D TGA Results 99

1
CHAPTER 1
INTRODUCTION
1.1 Background
Malaysia has been regconised as one of the largest cooking oil producers in the world
(Wu et al., 2010) attributed to its tropical climate and abundance of arable land fit for
cash crop cultivation. Nonetheless, the growing success of this industry is often
overshadowed by massive industrial discharge from its mill. In the year 2008 alone, at
least 44 million tonnes of POME was generated in Malaysia (Wu et al., 2010). In a
survey carried out by Sime Darby Plantation (2011), on average, one tonne of fresh
fruit bunch processed produces about 0.65 tonne of POME. Palm oil mill effluent
(POME) contains high concentration of organic matter. The chemical oxygen demand
(COD) of POME is typically in the range of 45,000 to 65,000 mg/l whilst 5-days
biochemical oxygen demand (BOD) is averaging 18,000 to 48,000 mg/l (Chin et al.,
1996). In addition, oil and grease comprised of more than 2,000 mg/l (Chin et al,
1996). Significantly, the COD : N : P ratio is around 750 : 7.3 : 1 (Chin et al, 1996). A
more detailed information of POME will be presented in Section 2.2.
To avoid the water bodies being polluted, POME should undergo treatment before
discharged into the rivers. Various treatment and disposal methods have been
proposed, investigated and commercialized in the past decades to eliminate or reduce
POME pollution. The treatment processes include floatation, membrane technology,
various aerobic and anaerobic biodegradation and others (Ahmad et al., 2003).
However, an ideal treatment process should be cost-effective and most importantly,
the process should not leave any hazardous residues or at least reduces the harmful
materials to a safe level.

2
Significantly, for the past two decades, photocatalysis process has been touted as a
promising technology and hence widely investigated for application in treating
aqueous organic contents (Puzyn & Mostrag-Szlichtyng, 2012). Photocatalysis applies
concept of the acceleration of a photoreaction in the presence of a catalyst as well as
the UV or visible light irradiation. It is one of the cleanest technologies for the
degradation of waste water and any pollutants or contaminant in POME, since most of
the contaminants is organic substrate (Fujishima et al., 2000).
The catalyst that is normally used in photocatalysis process is the titanium
dioxide(TiO2)-based material as it possesses low toxicity, low resistance towards
corrosion and also a readily-available semiconductor (Amadelli, 2005). According to
Fujishima et al. (2000), TiO2 is an excellent photocatalyst material for environmental
purification. The discussion about catalyst, TiO2 is incorporated in Section 2.4.
The mechanisms of photocatalysis involve the absorption of light-energy (from UV or
visible) by photocatalyst. This in turn will trigger the excitation of electrons across the
energy gap into the conduction band. In the presence of water, the electron will
change into hydroxyl radical which can decompose organic compounds present in the
POME. This forms the basic concept that is to be applied in industrial to treat the
pollutant in POME (Linsebigler, 1995). The mechanisms of the catalyst is duly
highlighted in Section 2.5.
In POME photo-treatment, catalyst plays an important role in assuring the efficiency.
A perfect ratio of active metal doped will enhance the performance of the catalyst.
Chapter 3 will discuss the method in preparing the catalyst needed for this research,
including pre-treating of raw materials, procedure of preparing and the methods to
preserve the catalyst. Besides, Chapter 3 will also discuss on the steps to measure the
effectiveness of the catalysts.
The results obtained and related discussion are presented in Chapter 4. The POME
concentration was analyzed before and after the photo-treatment process employing
the techniques described in Chapter 3.

3
Finally, summary based on the results as well as the recommendation for future works
are presented in the Chapter 5.
1.2 Problem Statement
As aforementioned, Malaysia is one of the biggest palm oil producing country in the
world. Hence, large scale generation of waste in the form of POME is unavoidable
during the extraction of crude palm oil. The effluent contains high biochemical
oxygen demand (BOD) liquid waste and chemical oxygen demand (COD) as rightly
pointed out by Ahmad et al. (2003). Direct discharge of untreated POME to rivers will
cause serious implications to the existing environment. Therefore, it needs to be
treated before being released to the waterway.
Among all the treating methods, photocatalysis is chosen in current study due to its
efficiency and green pathway. For photocatalysis, the physicochemical properties of
catalyst influence the photocatalytic activity. In particular, the percentage of metal
loading in catalyst typically influences the catalyst quality. Titania-based
photocatalysts have been prepared with various active metal (copper in this study)
loadings. To date, there is paucity of information on photocatalyst treatment towards
POME. Therefore, the effectiveness of synthesized catalyst forms the pivotal
objective the current work.
1.3 Objective
The objective of this study is to undertake systematic analyses into the effects of
various photocatalyst formulations towards physicochemical properties and its
POME-photodegradation ability.

4
1.4 Scopes of Study
To meet the objective of the current work, the following scopes of research have been
identified:
1. To prepare TiO2-based photocatalyst with the following composition of active
metal using wet co-impregnation method :
i) 2 wt%
ii) 5 wt%
iii) 10 wt%
iv) 15 wt%
v) 20 wt%
vi) 25 wt%
2. To characterize the physicochemical properties of the photocatalysts via:
i) X-ray Fluorescence (XRF)
ii) X-ray Diffraction (XRD)
iii) Density determination
iv) Liquid N2 Physisorption
v) Thermogravimetric Analysis (TGA)
3. To conduct photocatalysis of POME with the catalysts prepared to determine
the optimum catalyst
4. To analyse the chemical oxygen demand (COD) of POME before and post
photoreaction
1.5 Rational and Significance
POME produced during palm oil production is highly polluting if directly discharge
into rivers without treatment. Therefore, a good purification or treatment of POME is
essential. With better treatment process, the toxicity of the POME will be less harmful
to environment or even diminished. Indirectly, this will help to prevent the
environment being compromised, as well as maintaining the ecological balance.

5
This project aims to help in exploring the application potential of photocatalysis
process in POME treatment. This will greatly enhance the effectiveness of
photocatalysis, not only in treating POME, but also prospectively for other industrial
wastewater. This technology has potential to be commercialized for industrial
application due to low cost and significantly low energy consumption.

6
CHAPTER 2
LITERATURE REVIEW
2.1 Introduction
Palm oil industry is one of the leading agricultural industries in Malaysia with an
average crude palm oil production of more than 13 million tonne per year (Nour et al.,
2011). However, the massive production of this crude palm oil results in even larger
amount of palm oil mill effluent (POME), circa 44 million tonnes of POME were
generated in the year 2008 alone (Wu et al., 2010). Unfortunately, POME is a highly
polluting wastewater with high chemical oxygen demand (COD) and biochemical
oxygen demand (BOD). Hence, it causes irreversible distress to the water resources if
discharge without treatment (Lam & Lee, 2011).
Significantly, common treatment methods employed in Malaysia are ponding system
and aerobic digestion (Tay, 1991; Nour et al., 2013). However, both methods have
some disadvantages for POME treatment, i.e. long retention time for ponding system
and high operating cost for aerobic method. Compounded to these, the land scarcities
that came along had invigorate the need for the development of new treating
technology such as photocatalysis treatment for POME that was introduced in this
thesis.
In this chapter, the previous researches related to this topic is critically reviewed in
particular research works that report on the effects of different metal loadings towards
photoreaction.

7
2.2 Palm Oil Mill Effluent (POME)
Oil palm is one of the world’s most rapidly expanding equatorial crops. Unfortunately,
extracting the palm oil via steam-extraction in any existing palm oil mill generates
huge amount of palm oil mill effluent (POME). POME is a brownish colloidal
suspension with high organic content and moderate temperature (343 to 353 K) as
described by Anon (1995). Generally, this waste is hot and acidic in nature and
comprised of oil, plant debris, and nutrients. Large palm oil mills typically produce an
average of 0.65 tonnes of raw POME for every tonne of fresh fruit bunches processed
(Lim et al., 2012). The general properties of POME are listed in Table 2.1. It shows
that the COD value of POME is as high as 15 000 to 100 000 mg/L. High COD values
indicate high organic contents within the POME.
Table 2.1 The general properties of POME (Kamal et al., 2012).
Physical & Chemical Properties Unit Value
Moisture Content % 93.4
Ash % 1.06
Total Solid g 65 – 80
Soluble Fibre % SS 1.12
Non Soluble Fibre % TS 3.9
COD mg/L 15 000-100 000
Table 2.2 lists the contents of POME. It shows that POME consists primarily of solid
and volatile organic solids at an average concentration of 40 000 mg/L while oil and
grease constitute 4000 mg/L. In addition, there are also some metal contents in POME,
viz. potasium (2270 mg/L), magnesium (615 mg/L), calcium (439 mg/L) and others.
Nonetheless, these inorganic metal contents are considerably lower than the
aforementioned organic content.
Due to the hazardous contaminants (cf. Tables 2.1 and 2.2), when POME is
discharged into waterways, it can pollute water source that serves as vital drinking
water for human and animal populations. More alarmingly, it is also extremely
harmful to the aquatic ecology by creating highly acidic environments or causing

8
eutrophication where excessive algal growth occurs on the surface of the water (Lim
et al., 2012).
Table 2.2 The content of POME (Kamal et al., 2012).
Parameter Average Metal Average
pH 4.7 Phosphorous 180
Oil and Grease 4000 Potasium 2270
Total Solids 40500 Magnesium 615
Suspernded Solids 18000 Calcium 439
Total Volatile Solids 34000 Baron 7.6
Amonical Nitrogen 35 Iron 46.5
Total Nitrogen 750 Manganese 2
Copper 0.89
Zinc 2.3
*All in mg/l except pH
Moreover, POME also is one of the sources of greenhouse gas (GHG) emissions (Lim
et al., 2012). It is well known that POME from the mill site is directly released into
open-air holding ponds for remediation and eventually greenhouse gases such as CO2,
CH4 and H2S will be released to the air unleashing potentially climate-crippling
effects.
To alleviate these catastrophe effects, POME can be utilised for producing value-
added chemicals in line with cradle-torave concept. According to America Palm Oil
Council (2003), POME is an excellent substitute for inorganic fertilizer. Upon
treatment, the pH of POME can be raised from 4.0 to circa 8.0. Moreover, the BOD is
also significantly lower whilst at the same time maintaining the plant nutrients. In
terms of fertilizer value, 500 litres of treated POME is equivalent to 1.96 kg of urea
(America Palm Oil Council, 2003).
Alternatively, as a potential source of renewable energy, hydrogen (H2) could be
extracted from POME. H2 is considered as a clean energy as no carbon will be emitted
when oxidized (Atif et al., 2005), therefore reducing dependency on the dwindling
fossil fuel (Lee, 2012).

9
2.3 POME Treatments
In Malaysia, most of the palm oil mills use anaerobic digestion for the primary
treatment (Tay, 1991). According to Ma et al. (1993), more than 85% the POME
producers in Malaysia have adopted the ponding system for POME treatment due to
its low capital and operating costs. However, this widely employed method has
several disadvantages. One of the disadvantages of ponding system is large land area
requirement for treatment process (Nour et al., 2011) as a large pond must be built.
Besides, long retention time is also needed for organic contents in the POME to
degrade to a safe level (Nour et al., 2011). Usually, the estimated retention time is
approximately one to two months. From the environment perspective, emissions of
biogas (mixture of CH4 and CO2) also poses a major problem to the ozone layer (Nour
et al., 2013).
Another common treatment method is aerobic method (cf. Table 2.3). This method is
very effective in handling wastewater as it needs shorter retention time (Nour et al.,
2013). For instance, Karim and Kamil (1989) found that by using the fungal inoculum,
the COD of the POME has recorded more than 95% reduction after 10 to 14 days of
fermentation. Besides, Oswal et al. (2002) also found that treating POME with
Yarrowia lipolytica NCIM 3589 to degrade alkanes contents have provided 95% of
reduction in COD within two days. In addition, Vijayaraghavan et al. (2007) disclosed
that POME treatment using aerobic oxidation based on an activated sludge process
was able to remove COD at higher rate in anaerobically-digested POME as compared
to diluted raw POME at hydraulic retention time (HRT) of 60 h. According to Doble
and Kumar (2005), one of the primary disadvantages of aerobic method is high energy
requirement for aeration, consequently the operating cost will be inflated. Besides, it
is also not suitable for land applications due to low inactivation rate of pathogen.
Other methods are summarized in Table 2.3, together with their retention time and the
corresponding COD reduction percentage.
To overcome these problems, photocatalysis process will be a good choice to replace
the aforementioned methods. According to Bahnemann (2004), the advantage of
photocatalysis in water purification is the complete decomposition of organics. The
effectiveness of POME treatment as the main purpose for the treatment is associated

10
with organic compound degradation. In terms of energy consumption, ultimately the
sun is a continuous and readily available power supply for photocatalysis as the
activator needed for this process is visible light or UV radiation (Maria et al., 2011.).
Hence, the operating costs will be greatly reduced. Based on these reasons, the
photocatalysis process is a potentially valuable technology in POME treatment. Thus,
the focus of the current work is to explore the potential of photocatalysis process on
POME treatment.
Table 2.3 List of POME treatments.
Treatment process Retention
Time (day)
Reduction
in COD (%)
Reference
Anaerobic
Anaerobic suspended growth
processes
35 96 Chin & Wong, 1983
Semi-continuous digester 5.6 75 Cail & Barford, 1985
Anaerobic filter 1 99 Borja & Banks, 1995
Anaerobic fluidized bed reactor 0.25 78 Borja & Banks, 1995
Membrane anaerobic system 3.15 92 Fakhru'l-Razi & Noor, 1999
Semi-commercial closed anaerobic
digester
17 >95 Yacob et al., 2006
Completely mixed reactors 50 83 Borja et al., 1995
Tank digester 30 98 Edewor ,1986
Tank digester with certain degree
of mixing
30 98 Ugoji, 1997
Modified anaerobic baffled reactor 10 95 Faisal & Unno, 2001
Anaerobic digester 15-16 91 Ma & Ong, 1986
Aerobic
Pressurized activated sludge
process
0.42 98 Ho & Tan, 1988
Aerobic treatment with Yarrowia
lipolytica
2 97 Oswal et al., 2002
Activated sludge reactor 2.5 10 Vijayaraghavan et al., 2007
Aerobic treatment with Y.
lipolytica þ 0.03 g/L FeCl3 þ
consortium developed from garden
soil
6 99 Oswal et al., 2002
Aerobic treatment with mixed
culture
7 >95 Karim & Kamil, 1989
Aerobic treatment with 5%
inoculum of Trichoderma viride
spores
14 >95 Karim & Kamil, 1989