Embed Size (px)
Citation preview
CHEMICAL PRECIPITATION OF PALM OIL MILL EFFLUENT
SHAZANA BINTI MOHD IBRAHIM
UNIVERSITI TEKNOLOGI MALAYSIA
CHEMICAL PRECIPITATION OF PALM OIL MILL EFFLUENT
SHAZANA BINTI MOHD IBRAHIM
A dissertation submitted in partial fulfilment of the
requirements for the award of the degree of
Master of Engineering (Environmental Engineering)
Faculty of Chemical and Natural Resources Engineering
Universiti Teknologi Malaysia
FEBRUARY 2009
iii
To my beloved mother and father
who have provided me with love, guidance and support
iv
ACKNOWLEDGEMENTS
I wish to express my gratitude to my master’s dissertation supervisor, Dr.
Mohd. Ariffin bin Abu Hassan, for his guidance and encouragement during this
research. Without his help, I believe this research would have not been completed. I
learned many aspects of research methods and analysis. In addition, I learned
patience, dedication, humility and respect for others. His vision, creativity and
ongoing support are great assets.
My appreciation also goes to pollution laboratory assistants, Mrs. Noraidah
Zhwal and Mr. Mohd. Azri Mohd. Salleh for their guidance and their generosity in
giving useful suggestions and providing pleasant laboratory conditions to work in.
I greatly appreciated the contribution of Mr. Abu from Felda Palm Industries
Sdn. Bhd. for his help and insights throughout the experiments.
Lastly but certainly not the least, I am indebted to my parents for their endless
support.
v
ABSTRACT
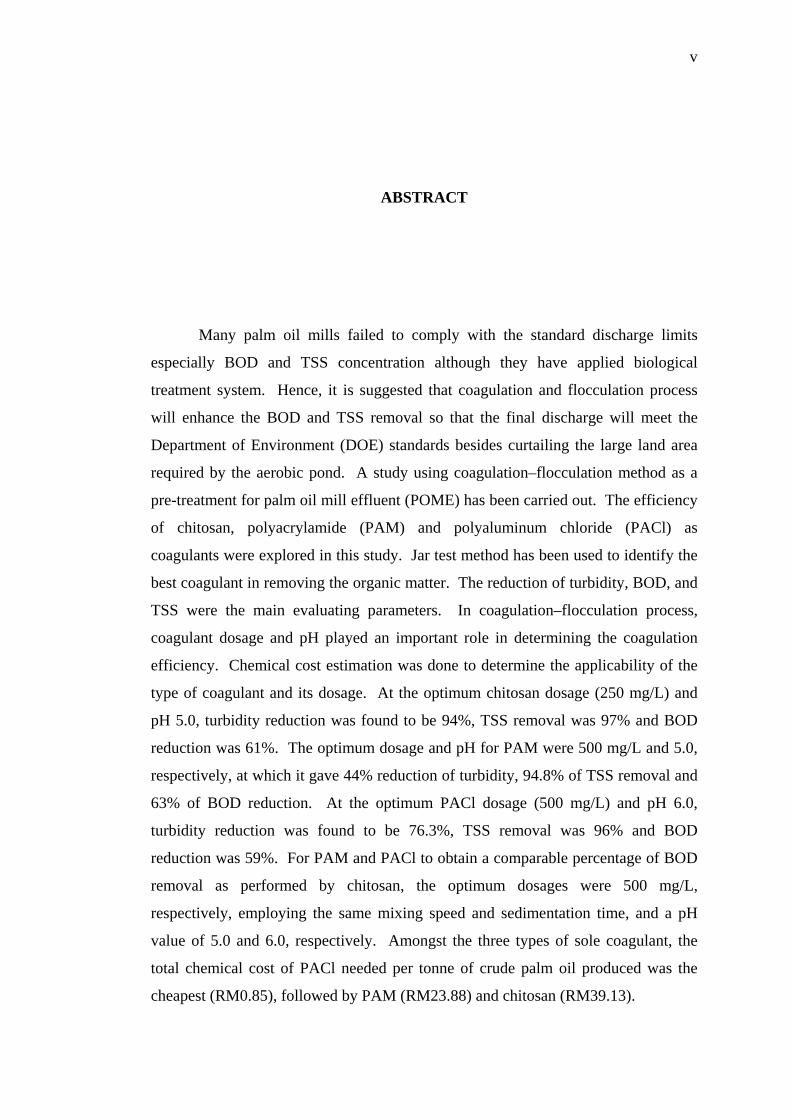
Many palm oil mills failed to comply with the standard discharge limits
especially BOD and TSS concentration although they have applied biological
treatment system. Hence, it is suggested that coagulation and flocculation process
will enhance the BOD and TSS removal so that the final discharge will meet the
Department of Environment (DOE) standards besides curtailing the large land area
required by the aerobic pond. A study using coagulation–flocculation method as a
pre-treatment for palm oil mill effluent (POME) has been carried out. The efficiency
of chitosan, polyacrylamide (PAM) and polyaluminum chloride (PACl) as
coagulants were explored in this study. Jar test method has been used to identify the
best coagulant in removing the organic matter. The reduction of turbidity, BOD, and
TSS were the main evaluating parameters. In coagulation–flocculation process,
coagulant dosage and pH played an important role in determining the coagulation
efficiency. Chemical cost estimation was done to determine the applicability of the
type of coagulant and its dosage. At the optimum chitosan dosage (250 mg/L) and
pH 5.0, turbidity reduction was found to be 94%, TSS removal was 97% and BOD
reduction was 61%. The optimum dosage and pH for PAM were 500 mg/L and 5.0,
respectively, at which it gave 44% reduction of turbidity, 94.8% of TSS removal and
63% of BOD reduction. At the optimum PACl dosage (500 mg/L) and pH 6.0,
turbidity reduction was found to be 76.3%, TSS removal was 96% and BOD
reduction was 59%. For PAM and PACl to obtain a comparable percentage of BOD
removal as performed by chitosan, the optimum dosages were 500 mg/L,
respectively, employing the same mixing speed and sedimentation time, and a pH
value of 5.0 and 6.0, respectively. Amongst the three types of sole coagulant, the
total chemical cost of PACl needed per tonne of crude palm oil produced was the
cheapest (RM0.85), followed by PAM (RM23.88) and chitosan (RM39.13).
vi
ABSTRAK
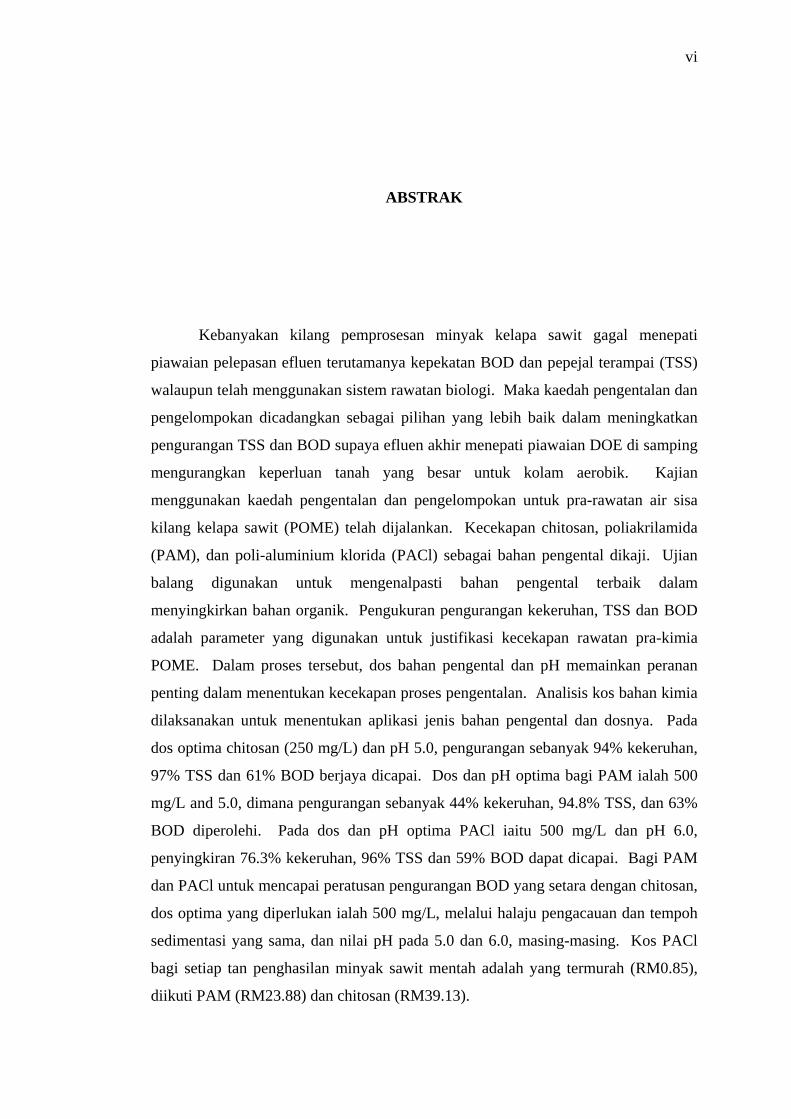
Kebanyakan kilang pemprosesan minyak kelapa sawit gagal menepati
piawaian pelepasan efluen terutamanya kepekatan BOD dan pepejal terampai (TSS)
walaupun telah menggunakan sistem rawatan biologi. Maka kaedah pengentalan dan
pengelompokan dicadangkan sebagai pilihan yang lebih baik dalam meningkatkan
pengurangan TSS dan BOD supaya efluen akhir menepati piawaian DOE di samping
mengurangkan keperluan tanah yang besar untuk kolam aerobik. Kajian
menggunakan kaedah pengentalan dan pengelompokan untuk pra-rawatan air sisa
kilang kelapa sawit (POME) telah dijalankan. Kecekapan chitosan, poliakrilamida
(PAM), dan poli-aluminium klorida (PACl) sebagai bahan pengental dikaji. Ujian
balang digunakan untuk mengenalpasti bahan pengental terbaik dalam
menyingkirkan bahan organik. Pengukuran pengurangan kekeruhan, TSS dan BOD
adalah parameter yang digunakan untuk justifikasi kecekapan rawatan pra-kimia
POME. Dalam proses tersebut, dos bahan pengental dan pH memainkan peranan
penting dalam menentukan kecekapan proses pengentalan. Analisis kos bahan kimia
dilaksanakan untuk menentukan aplikasi jenis bahan pengental dan dosnya. Pada
dos optima chitosan (250 mg/L) dan pH 5.0, pengurangan sebanyak 94% kekeruhan,
97% TSS dan 61% BOD berjaya dicapai. Dos dan pH optima bagi PAM ialah 500
mg/L and 5.0, dimana pengurangan sebanyak 44% kekeruhan, 94.8% TSS, dan 63%
BOD diperolehi. Pada dos dan pH optima PACl iaitu 500 mg/L dan pH 6.0,
penyingkiran 76.3% kekeruhan, 96% TSS dan 59% BOD dapat dicapai. Bagi PAM
dan PACl untuk mencapai peratusan pengurangan BOD yang setara dengan chitosan,
dos optima yang diperlukan ialah 500 mg/L, melalui halaju pengacauan dan tempoh
sedimentasi yang sama, dan nilai pH pada 5.0 dan 6.0, masing-masing. Kos PACl
bagi setiap tan penghasilan minyak sawit mentah adalah yang termurah (RM0.85),
diikuti PAM (RM23.88) dan chitosan (RM39.13).
vii
TABLE OF CONTENTS
CHAPTER TITLE PAGE
TITLE i DECLARATION ii DEDICATION iii ACKNOWLEDGEMENTS iv ABSTRACT v ABSTRAK vi TABLE OF CONTENTS vii LIST OF TABLES xii LIST OF FIGURES xiii LIST OF ABBREVIATIONS xv LIST OF APPENDICES xvi I INTRODUCTION
1.1 Introduction 1
1.2 Background of Research 3
1.3 Problem Statement 6
1.4 Objectives of Research 6
1.5 Scope of Research 7
1.6 Significance of Research 7
II LITERATURE REVIEW
2.1 Introduction 9
viii
2.2 Palm Oil Milling Process 10
2.3 Palm Oil Mill Effluent (POME) 13
2.4 Existing Palm Oil Wastewater Treatment Systems 17
2.4.1 Pretreatment 17
2.4.1.1 Sand and Oil Trap 17
2.4.1.2 Cooling System 17
2.4.2 Primary Treatment 18
2.4.2.1 Ponding Systems 18
2.4.2.2 Tank Digesters and Ponding Systems 20
2.4.2.3 Extended Aeration 21
2.4.3 Post-treatment 21
2.4.3.1 Land Treatment System 21
2.5 Previous Researches in the Field 22
2.6 Coagulation and Flocculation 28
2.6.1 Properties of Colloidal Systems 30
2.6.2 Colloidal Structure and Stability 30
2.6.3 Mechanism of Coagulation 31
2.6.3.1 Destabilization of Colloids 31
2.6.3.2 Bridging Mechanism 32
2.6.4 Influencing Factors 34
2.6.4.1 Coagulant Dosage 34
2.6.4.2 pH Value 35
2.6.4.3 Colloid Concentration and Zeta
Potential 35
2.6.4.4 Affinity of Colloids for Water 36
2.6.4.5 Mixing 36
2.6.5 Coagulants 37
2.6.5.1 Polymeric Inorganic Salts 37
2.6.5.2 Organic Polymers 38
2.6.6 Coagulation Aids 39
2.6.7 Coagulation Control 39
2.6.8 Jar Test 40
2.6.9 Rapid Mix 41
ix
2.6.10 Flocculation 41
2.7 Coagulation and Flocculation using Chitosan 42
2.8 Coagulation and Flocculation using Polyacrylamide
(PAM) 42
2.9 Coagulation and Flocculation using Polyaluminum
Chloride (PACl) 43
2.10 Efficiency of POME Treatment 44
2.10.1 Biochemical Oxygen Demand (BOD)
Analysis 44
2.10.2 Turbidity Analysis 45
2.10.3 Total Suspended Solids Analysis 45
2.11 Chemical Cost Estimation 46
III METHODOLOGY
3.1 Introduction 48
3.2 Materials and Methods 49
3.2.1 Experimental Materials 49
3.2.1.1 POME Sample Collection 49
3.2.1.2 Quantity 49
3.2.1.3 Containers 49
3.2.1.4 Representative Samples 50
3.2.1.5 Sample Preservation 50
3.2.1.6 Coagulants 50
3.2.2 Experimental Design 51
3.2.2.1 Laboratory Treatability Study 51
3.2.2.2 Reproducibility Studies 52
3.2.2.3 Characterization of POME 52
3.2.2.4 Optimum Dosage 53
3.2.2.5 Optimum pH Value 54
3.2.2.6 Jar Testing 55
3.2.3 Determination of the Response 56
3.2.3.1 Observation 56
x
3.2.3.2 Chemical Analyses 56
3.2.3.3 Biochemical Oxygen Demand (BOD)
Determination 56
3.2.3.4 Turbidity Determination 58
3.2.3.5 Total Suspended Solids
Determination 59
3.3 Comparison of the Performance of Chitosan, PAM
and PACl as Coagulants in POME Treatment 61
3.4 Chemical Cost Estimation 61
IV RESULTS AND DISCUSSIONS
4.1 Introduction 62
4.2 Characteristic Study of POME 63
4.3 Sole Coagulant for Coagulation
and Flocculation Processes 64
4.3.1 Chitosan as Sole Coagulant 64
4.3.1.1 Effect of Coagulant Dosage on BOD
Removal 64
4.3.1.2 Effect of Coagulant Dosage on TSS
Removal 66
4.3.1.3 Effect of Coagulant Dosage on
Turbidity Removal 67
4.3.2 Polyacrylamide (PAM) as Sole Coagulant 68
4.3.2.1 Effect of Coagulant Dosage on BOD
Removal 69
4.3.2.2 Effect of Coagulant Dosage on TSS
Removal 71
4.3.2.3 Effect of Coagulant Dosage on
Turbidity Removal 72
4.3.3 Polyaluminum Chloride (PACl) as Sole
Coagulant 74
xi
4.3.3.1 Effect of Coagulant Dosage on BOD
Removal 74
4.3.3.2 Effect of Coagulant Dosage on TSS
Removal 76
4.3.3.3 Effect of Coagulant Dosage on
Turbidity Removal 78
4.4 Optimum Dosage and Operating Condition Analysis 81
4.4.1 Chitosan Performance at Optimum Dosage 81
4.4.1.1 Effect of pH on BOD, TSS and
Turbidity Removal 81
4.4.2 PAM Performance at Optimum Dosage 84
4.4.2.1 Effect of pH on BOD, TSS and
Turbidity Removal 84
4.4.3 PACl Performance at Optimum Dosage 87
4.4.3.1 Effect of pH on BOD, TSS and
Turbidity Removal 87
4.5 Comparison of the Performance of Chitosan, PAM
and PACl as Coagulants in POME Treatment 90
4.6 Chemical Cost Estimation 93
V CONCLUSIONS AND RECOMMENDATIONS
5.1 Introduction 96
5.2 Conclusions 96
5.3 Recommendations 98
REFERENCES 100
APPENDICES 109
xii
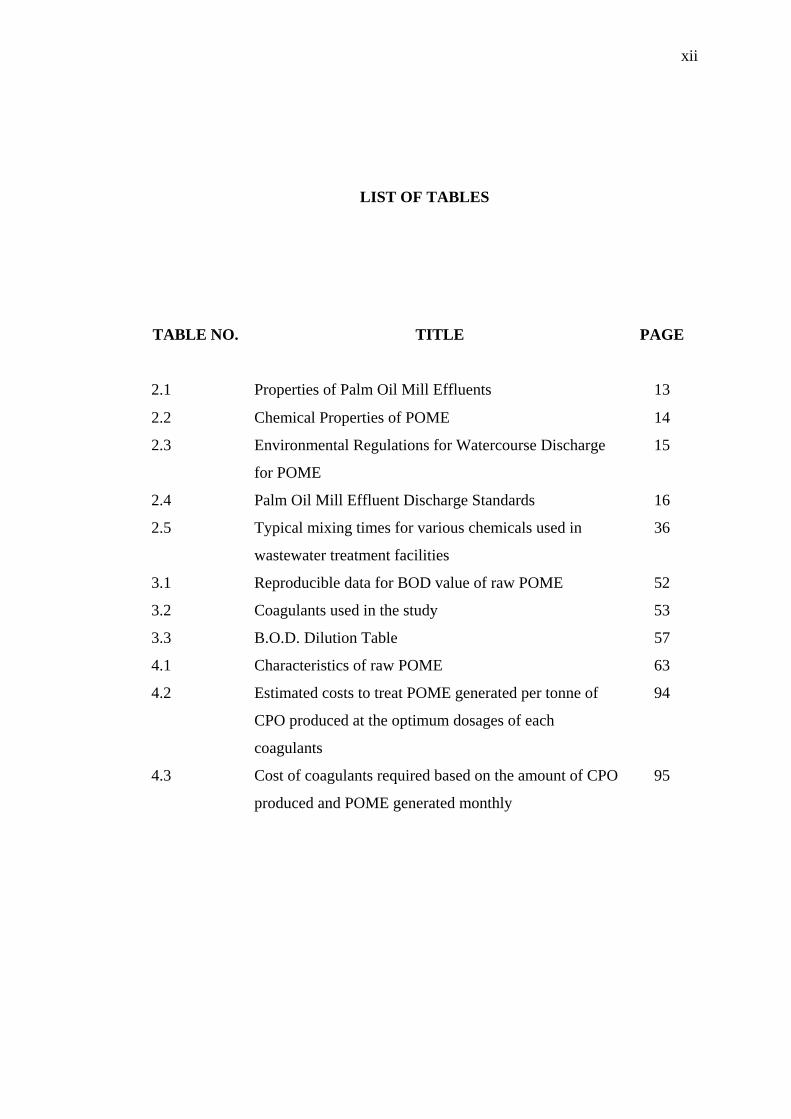
LIST OF TABLES
TABLE NO. TITLE PAGE
2.1 Properties of Palm Oil Mill Effluents 13
2.2 Chemical Properties of POME 14
2.3 Environmental Regulations for Watercourse Discharge
for POME
15
2.4 Palm Oil Mill Effluent Discharge Standards 16
2.5 Typical mixing times for various chemicals used in
wastewater treatment facilities
36
3.1 Reproducible data for BOD value of raw POME 52
3.2 Coagulants used in the study 53
3.3 B.O.D. Dilution Table 57
4.1 Characteristics of raw POME 63
4.2 Estimated costs to treat POME generated per tonne of
CPO produced at the optimum dosages of each
coagulants
94
4.3 Cost of coagulants required based on the amount of CPO
produced and POME generated monthly
95
xiii
LIST OF FIGURES
FIGURE NO. TITLE PAGE
2.1 Mass Flow in Palm Oil Mill Process 12
2.2 Palm Oil Mill Processing Flow Chart 12
2.3 Mechanisms of Coagulation 33
2.4 Interparticle Bridging with Organic Polymers 33
3.1 (a) Jar Test Apparatus 55
3.1 (b) pH Meter and Magnetic Stirrer 55
4.1 The Percentage of BOD Removal for Different Dosage of
Chitosan
65
4.2 The Percentage of TSS Removal for Different Dosage of
Chitosan
66
4.3 The Percentage of Turbidity Removal for Different Dosage
of Chitosan
67
4.4 Coagulation using 250 mg/L Chitosan at pH 5 68
4.5 The Percentage of BOD Removal for Different Dosage of
PAM
69
4.6 The Percentage of TSS Removal for Different Dosage of
PAM
71
4.7 The Percentage of Turbidity Removal for Different Dosage
of PAM
72
4.8 Coagulation with PAM at optimum dosage and initial pH;
after 1 hour settling time
73
4.9 The Percentage of BOD Removal for Different Dosage of
PACl
74
xiv
4.10 Schematic diagram showing the interaction of aluminium
species with initially negatively charged particles in water
75
4.11 The Percentage of TSS Removal for Different Dosage of
PACl
76
4.12 The Percentage of Turbidity Removal for Different Dosage
of PACl
78
4.13 Coagulation with PACl at Optimum Dosage and Initial pH 79
4.14 The Percentage of BOD Removal vs. Dosage of Chitosan,
PAM and PACl
80
4.15 The Percentage of BOD, TSS and Turbidity Removal
Using 250 mg/L Chitosan at Different pH of POME
82
4.16 (a) Supernatant After Treatment with Chitosan at pH 3 83
4.16 (b) Supernatant After Treatment with Chitosan at pH 4 83
4.16 (c) Supernatant After Treatment with Chitosan at pH 6 83
4.17 The Percentage of BOD, TSS and Turbidity Removal
Using 500 mg/L PAM at Different pH of POME
84
4.18 (a) PAM Performances at pH 3 86
4.18 (b) PAM Performances at pH 4 86
4.18 (c) PAM Performances at pH 6 86
4.19 The Percentage of BOD, TSS and Turbidity Removal
Using 500 mg/L PACl at Different pH of POME
87
4.20 (a) PACl Performances at pH 3 88
4.20 (b) PACl Performances at pH 4 88
4.20 (c) PACl Performances at pH 6 88
4.21 BOD Removal Using Chitosan, PAM and PACl vs.
Different pH of POME
90
4.22 TSS Removal Using Chitosan, PAM and PACl vs.
Different pH of POME
91
4.23 Turbidity Removal Using Chitosan, PAM and PACl vs.
Different pH of POME
92
xv
LIST OF ABBREVIATIONS
BOD Biochemical Oxygen Demand COD Chemical Oxygen Demand CPO Crude Palm Oil DO Dissolved Oxygen DOE Department of Environment
EFB Empty Fruit Bunches FFB Fresh Fruit Bunches HCl Hydrochloric acid
HRT Hydraulic Retention Time
MRE Mixed Raw Effluent
NaOH Sodium Hydroxide
NTU Nephelometric Turbidity Units
PACl Polyaluminum Chloride PAM Polyacrylamide POME Palm Oil Mill Effluent
ppm Parts Per Million
RO Reverse Osmosis
rpm Rotation Per Minute
TN Total Nitrogen
TS Total Solids
TSS Total Suspended Solids
UASB Upflow Anaerobic Sludge Blanket
UF Ultrafiltration
v/v Volume Per Volume
xvi
LIST OF APPENDICES
APPENDIX TITLE PAGE
A POME Characteristic Study 109
B Sole Coagulant for Coagulation and Flocculation
Processes
110
C Parameter Optimization 114
D Photo of the Coagulants Application in POME
Treatment
117
CHAPTER I
INTRODUCTION
1.1 Introduction
Malaysia presently accounts for 51% of world palm oil production and 62%
of world exports, and hence also for 8% and 22% of the worlds total production and
exports of oils and fats. As the leading producer and exporter of palm oil and palm
oil products, Malaysia has a significant role to play in fulfilling the growing global
need for oils and fats in general.
The oil palm growth in Malaysia has been bright. The crop has developed to
the multi billion ringgit industry as what is witnessed today. In Africa the crop exists
wild in the groves facing various constraints in efforts towards domestication. It is in
Malaysia that the crop's full potential was utilized. This revolution from wild to
domesticated, growing under well managed plantations is not without cost. A great
deal of effort went into appreciating this new crop and means of fitting it to its new
home.
2
It was during this development that more was discovered about the crop and
its interaction with the environment. Success in the plantation development carried
the crop to a new challenge, which is in the processing technology. Malaysia had to
take the lead in this new endeavor and developed technologies which are
economically sound. Development of the palm industry in Malaysia has been
exceptional. From a mere 400 hectares planted in 1920 the area increased to 54 000
hectares in 1960. Many more areas were opened up for oil palm cultivation, either
from virgin jungles, or from conversion of plantations that originally supported
rubber or other crops since then (MPOB Website).
This increase in area is a direct result of the government’s policy on crop
diversification. The area under oil palm stood at a staggering 2.6 million hectares by
1996. A corresponding growth in the milling and refining sectors was the result of
this fast growth in oil palm planting. Encouraged further by the government
incentive to make use of the country's rich agro-based resources, oleochemical
processing from palm oil and palm kernel oil began to assume prominence in 1980's.
Today, 3.88 million hectares of land in Malaysia is under oil palm cultivation
producing 14 million tonnes of palm oil in 2004 (MPOB Website).
Throughout its entire development in Malaysia, both upstream and
downstream, the oil palm and its product have always been linked with the
environment. Such a rapid increase in both downstream and upstream activities
would result in uncontrollable environmental pollution.
To produce palm oil, a considerable amount of water is needed, which in turn
generate a large volume of wastewater. Palm oil mills and palm oil refineries are
two main sources of palm oil wastewater; however, the first is the larger source of
pollution and effluent known as palm oil mill effluent (POME). The palm oil
processing became synonymous to POME pollution. An estimated 30 million tonnes
of POME are produced annually from more than 300 palm oil mills in Malaysia.
The oxygen depleting potential of POME is 100 times that of domestic sewage.
3
Owing to the high pollution load and environmental significance of POME, an
emphasis ought to be placed on its treatment system.
The year 1978 witnessed the enactment of the Environmental Quality
Regulations detailing POME discharge standards. Biochemical Oxygen Demand
(BOD) was the key parameter in the standards. From the initial BOD of 25 000 ppm
of the untreated POME, the load was reduced to 5 000 ppm in the first generation of
discharge standard, down to the present BOD of 100 ppm (Malaysia, 1977).
1.2 Background of Research
Wastewater, also known as sewage, originates from household wastes, human
and animal wastes, industrial wastewaters, storm runoff, and groundwater infiltration
(Lin, 2001). An understanding of physical, chemical and biological characteristics of
wastewater is very important in design, operation and management of collection,
treatment, and disposal of wastewater. The nature of wastewater includes physical,
chemical and biological characteristics which depend on the water usage in the
particular industry.
Depending on the nature of the industry and the projected uses of the waters
of the receiving streams, various waste constituents such as soluble organics and
suspended solids, may have to be removed before discharge (Eckenfelder, 2000).
The natural waters in streams, rivers, lakes, and reservoirs have a natural
waste assimilative capacity to remove solids, organic matter, even toxic chemicals in
the wastewater. However, it is a long process. Wastewater treatment facilities are
designed to speed up the natural purification process that occurs in natural waters and
4
to remove contaminants in wastewater that might otherwise interfere with the natural
process in the receiving waters (Lin, 2001). Methods of treatment consist of
physical, chemical and biological unit process.
The principal chemical unit processes used for wastewater treatment include
chemical coagulation, chemical precipitation, chemical disinfection, chemical
oxidation, advance oxidation processes, ion exchange, and chemical neutralization,
scale control, and stabilization (Metcalf and Eddy, 2004). Nevertheless, coagulation
(i.e. physicochemical destabilization of the colloidal system) and flocculation (i.e.
the aggregation of the particles) are most important in many water and sewage
treatment processes (Pawlowski, 1982).
There are quite a number of effluent treatment systems which are currently
used by the Malaysian palm oil industry. Among them are anaerobic/facultative
ponds, tank digestion and mechanical aeration, tank digestion and facultative ponds,
decanter and facultative ponds, and physicochemical and biological treatment.
Treatment of POME has also been tried using membrane technology, an up-flow
anaerobic filtration, an up-flow anaerobic sludge blanket and an up-flow anaerobic
sludge fixed film bioreactor. At present 85% of POME treatment is based on an
anaerobic and facultative ponding system, which is followed by another system
consisting of an open tank digester coupled with extended aeration in a pond
(Vijayaraghavan et al., 2007).
Chemical treatment of palm oil wastewater was investigated using
physicochemical treatment i.e. coagulation and flocculation. It is currently an
attractive option in POME treatment that numerous studies had been done on its
application in POME treatment system. The results showed that by applying alum,
93% suspended solid removal can be achieved (Ahmad et al., 2003a). Application of
chitosan as a coagulant showed the best performance as compared to activated
carbon and bentonite with more than 99% residual oil and suspended solid removal
(Ahmad et al., 2005b). Chitosan, besides being environmentally friendly, performed
5
better when compared to alum and polyaluminum chloride (PACl) (Ahmad et al.,
2006). Ariffin et al. (2005) concluded that cationic polyacrylamide (PAM) gave
99% turbidity and total suspended solid (TSS) removal, and 40% Chemical Oxygen
Demand (COD) removal. Bhatia et al. (2007a) studied the advantage of Moringa
Oleifera seeds usage. 99% TSS removal can be achieved when utilized with
flocculant (NALCO7751). The use of polymeric agent in the treatment of POME
was also considered (Ng et al., 1987; Ismail and Lau, 1987).
In the present scenario of POME treatment, anaerobic digestion is followed
by aerobic oxidation in facultative and algae ponds. Hence, in this study, the
coagulation and flocculation process is proposed as a pre-treatment before the
anaerobic digestion process with the intention of increasing the BOD and TSS
removal so that the final discharge will meet the Department of Environment (DOE)
standards besides curtailing the large land area required by the aerobic pond. The
efficiency of the coagulation and flocculation process was evaluated by treating the
mixed raw effluent obtained from the effluent treatment plant of Kilang Sawit
Penggeli, Felda Palm Industries Sdn. Bhd.
POME is a voluminous, high BOD liquid waste. It has total solids content of
5–7% which a little over half is dissolved solids, and the other half being a mixture
of various forms of organic and inorganic suspended solids. This property, coupled
with its high BOD loading and low pH, makes it not only highly polluting but also
extremely difficult to treat by conventional methods. The crude palm oil production
of 985,063 tonnes used 1,477,595m3 of water, and 738,797m3 was discharged as
POME (Bhatia et al., 2007a). A new and improved POME treatment technology
would be required in order to meet the requirements of DOE discharge limits (400
mg/L TSS and 100 mg/L BOD) and to curb watercourses pollution. There are many
processing plants failed to comply with the standard discharge limits even though
they have applied biological treatment system.
6
1.3 Problem Statement
A variety of coagulants has been studied to assess their ability to destabilize
the POME suspension and to flocculate the particulate matter. The conditions that
would allow for optimal use of the respective chemicals were noted especially for
suspended solid removal. However, the magnitudes of the increase in the BOD
removal rate by the application of the coagulants are still vague as there is currently
little published information on the use of coagulants in POME treatment for BOD
removal, with much of the information that is available being proprietary in nature.
Most studies performed did not carry out chemical cost analysis which is equally
important so as to determine the most cost effective process.
This study was designed to measure the effectiveness of chitosan, PACl and
PAM as coagulants for POME treatment by assessing the removal efficiency of TSS,
turbidity and BOD and to verify the most suitable and cost effective coagulant for
coagulation and flocculation of POME.
1.4 Objectives of Research
The project was aim to achieve the following objectives:
1. To study the potential and effectiveness of chitosan, PACl and PAM as
coagulants for POME treatment by assessing the removal efficiency of TSS,
turbidity and BOD.
2. To determine the optimum dosage of coagulant needed to achieve maximum
removal of TSS, turbidity and BOD.
7
3. To observe the influence of pH on the coagulation process and thus identify
the optimum pH which will give the highest removal.
4. To verify the most suitable and cost effective coagulant for coagulation and
flocculation of POME.
1.5 Scope of Research
The research primarily focused on the chemical pre-treatment of POME,
collected from Felda Palm Industries Sdn. Bhd (Kilang Sawit Penggeli), by using
chitosan, PACl and PAM as coagulants. TSS, turbidity and BOD removal efficiency
was determined in order to observe the performance of each coagulant.
Coagulation and flocculation process was carried out via jar test apparatus, in
which the optimum dosage of each coagulant to coagulate the mixed raw effluent at
the initial pH was identified. Alteration of the effluent’s initial pH was done so as to
verify the most optimum condition which will give the highest removal efficiencies.
This was followed by the chemical cost analysis with the purpose of selecting the
most suitable and cost effective coagulant.
1.6 Significance of Research
Palm mills in Malaysia is facing the challenge of balancing environmental
protection, their economic viability, and sustainable development after the DOE
enforced the regulation for the discharge of effluent from the crude palm oil industry,
under the Environmental Quality (Prescribed Premises) (Crude Palm Oil)
8
Regulations 1977. Quite a number of mills’ discharge did not meet the effluent
standards as stipulated by the DOE Malaysia. This indicates that up-grading of the
existing wastewater treatment plants has to be made in order to comply with the
effluent standards established by the authorities. The immediate implication of this
research is readily observable. By applying chemical pre-treatment in the POME
treatment system, it will significantly improve the treatment system and thus improve
the quality of the effluent discharge from the mill and reduce potential environmental
liabilities. The findings from this study will also provide way to the most feasible
and economical unit processes which can be further studied on a pilot plant scale.
CHAPTER II
LITERATURE REVIEW
2.1 Introduction
This chapter describes the palm oil milling process, POME and its chemical
properties, and environmental regulations for watercourse discharge for POME.
Existing palm oil wastewater treatment systems which are currently used by most
palm mill are also discussed in this chapter. Due to more stringent Environmental
Quality Regulations, various studies in POME treatment had been carried out by
many researchers. Previous studies in POME treatment were reviewed in this
chapter and detail discussions on physicochemical treatment (coagulation and
flocculation) of POME were made. Several coagulants were considered and the
parameters involved in evaluating the process efficiency were cited in this chapter.
10
2.2 Palm Oil Milling Process
Palm oil milling is the process that extracts crude palm oil from fresh fruit
bunches (FFB). In the extraction of oil from the oil palm fruits, no chemicals are
added, therefore making all generated wastes nontoxic to the environment. The
standard process consists of bunch sterilization, fruit stripping, digestion, screw
pressing for liquid extraction and centrifugation for oil separation (Teoh et al., 1980).
In order to inactivate the natural enzymes and loosen the fruits for easy
stripping the FFB is sterilized by steam. It is also to remove external impurities and
to detach the kernels from the shells. The sterilization process acts as the first
contributor to the accumulation of POME in the form of sterilizer condensate. Steam
condensate from the sterilizer contains palm oil and solid of 1% each. In normal
practice, it is discharged to the wastewater pond (Hassan et al., 2004).
A rotary thresher is used to strip off the fruits and then mashed in a digester.
The empty fruit bunches (EFB) can be recycled to the plantation for mulching or as
organic fertilizer. The digester consists of a cylindrical vessel equipped with stirrer
and expeller arms mainly to digest and press the fruitlets. Mixing water is added to
the digester, screw press and screening unit to improve extraction efficiency and flow
ability of the processing stream. The quantity of water has a direct effect on the
efficiency of the palm oil extraction process (Chungsiriporn et al., 2006).
Palm oil mixture, the extracted product, is a mixture of palm oil, water and
fine solid particles. Oil and pressed cake comprising nuts and fiber are produced at
the end of the process. The fiber and nuts are separated in the depericarper column.
The waste fiber is then burnt for energy generation inside the boiler. The nuts from
the digestion and pressing processes are polished before being sent to the nut-
cracking machine or ripple mill. The cracked mixture of kernels and shells is then
11
separated in a winnowing column using upward suction (hydrocyclone) and a clay
bath (Hassan et al., 2004).
The third source of POME is the washing water of the hydrocyclone. The
kernel produced is then stored before being transferred to palm kernel mill for oil
extraction. The palm oil mixture is continuously fed to the settling tank. Palm oil,
which is the lightest phase, overflows from the settling tank and is purified (by
moisture removal) for the final product called crude palm oil (CPO). Dirt and
impurities are removed from the oil by centrifugation. Before the CPO is transferred
to the storage tank, it is subjected to high temperatures to reduce the moisture content
in the CPO. This is to control the rate of oil deterioration during storage prior to
processing at the palm oil refinery (Hassan et al., 2004).
Bottom sludge from the settling tank consisting of water, solids and palm oil
residue of 7–10% is then passed through a decanter and a separator in series for oil
recovery. Water is added to the decanter and the separator to blend and balance the
phase for efficient oil recovery. POME that is a mixed stream of separator outlet,
sterilizer condensate and turbine cooling water is sent to a wastewater treatment
system (Chungsiriporn et al., 2006).
12
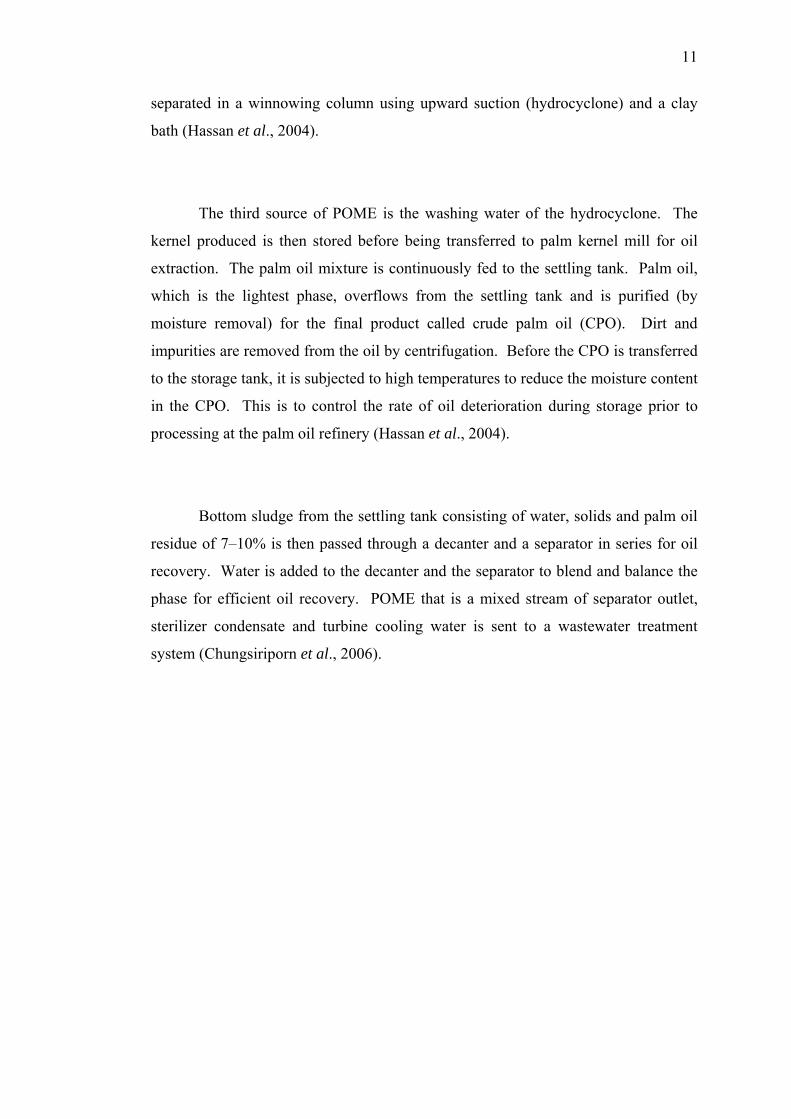
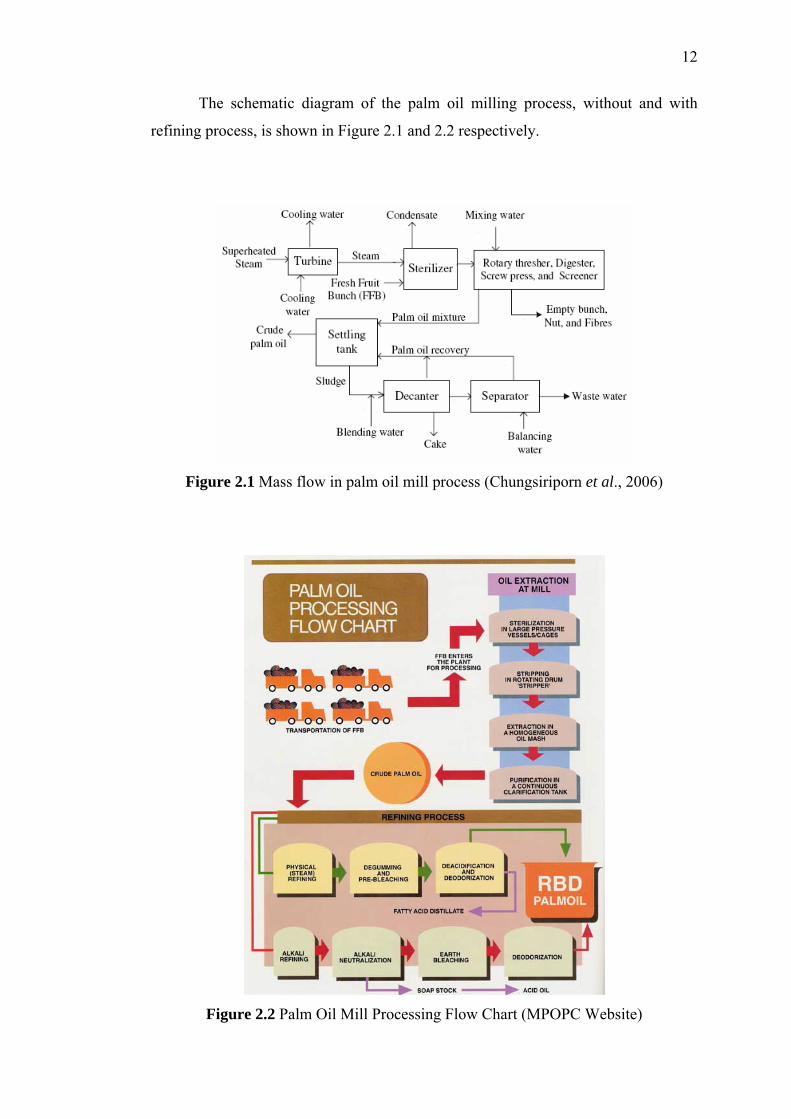
The schematic diagram of the palm oil milling process, without and with
refining process, is shown in Figure 2.1 and 2.2 respectively.
Figure 2.1 Mass flow in palm oil mill process (Chungsiriporn et al., 2006)
Figure 2.2 Palm Oil Mill Processing Flow Chart (MPOPC Website)
13
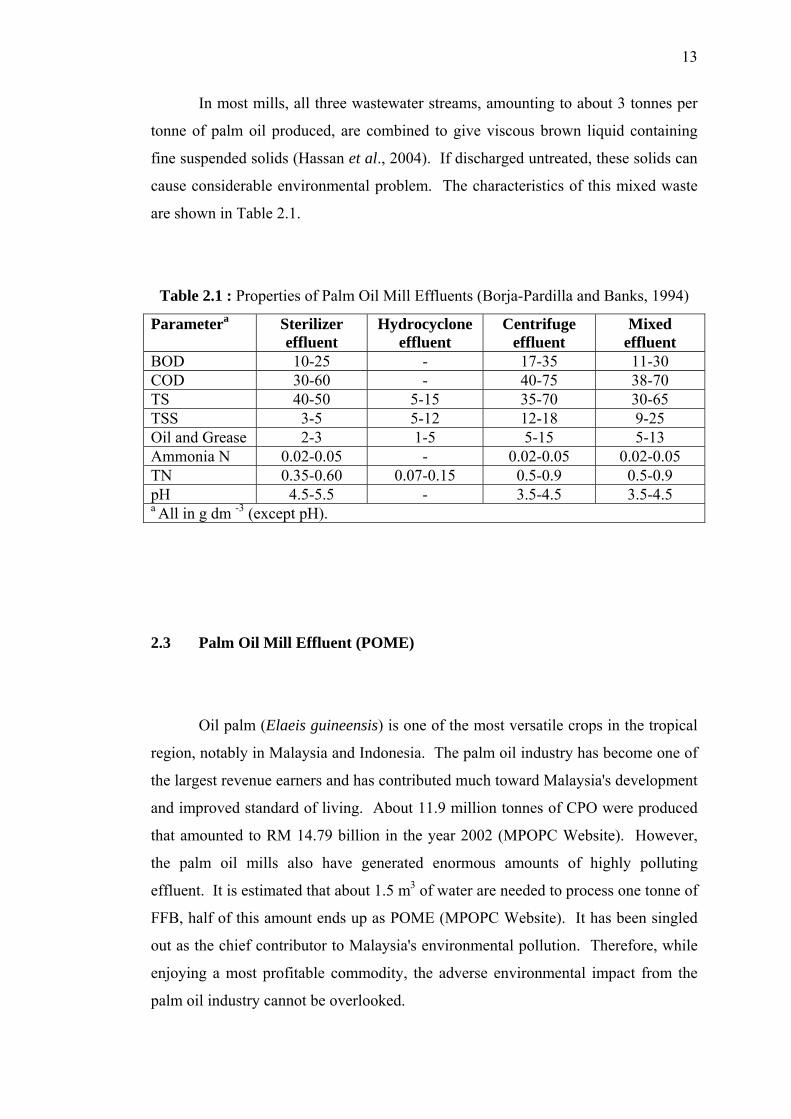
In most mills, all three wastewater streams, amounting to about 3 tonnes per
tonne of palm oil produced, are combined to give viscous brown liquid containing
fine suspended solids (Hassan et al., 2004). If discharged untreated, these solids can
cause considerable environmental problem. The characteristics of this mixed waste
are shown in Table 2.1.
Table 2.1 : Properties of Palm Oil Mill Effluents (Borja-Pardilla and Banks, 1994)
Parametera Sterilizer effluent
Hydrocyclone effluent
Centrifuge effluent
Mixed effluent
BOD 10-25 - 17-35 11-30 COD 30-60 - 40-75 38-70 TS 40-50 5-15 35-70 30-65 TSS 3-5 5-12 12-18 9-25 Oil and Grease 2-3 1-5 5-15 5-13 Ammonia N 0.02-0.05 - 0.02-0.05 0.02-0.05 TN 0.35-0.60 0.07-0.15 0.5-0.9 0.5-0.9 pH 4.5-5.5 - 3.5-4.5 3.5-4.5 a All in g dm -3 (except pH).
2.3 Palm Oil Mill Effluent (POME)
Oil palm (Elaeis guineensis) is one of the most versatile crops in the tropical
region, notably in Malaysia and Indonesia. The palm oil industry has become one of
the largest revenue earners and has contributed much toward Malaysia's development
and improved standard of living. About 11.9 million tonnes of CPO were produced
that amounted to RM 14.79 billion in the year 2002 (MPOPC Website). However,
the palm oil mills also have generated enormous amounts of highly polluting
effluent. It is estimated that about 1.5 m3 of water are needed to process one tonne of
FFB, half of this amount ends up as POME (MPOPC Website). It has been singled
out as the chief contributor to Malaysia's environmental pollution. Therefore, while
enjoying a most profitable commodity, the adverse environmental impact from the
palm oil industry cannot be overlooked.
14
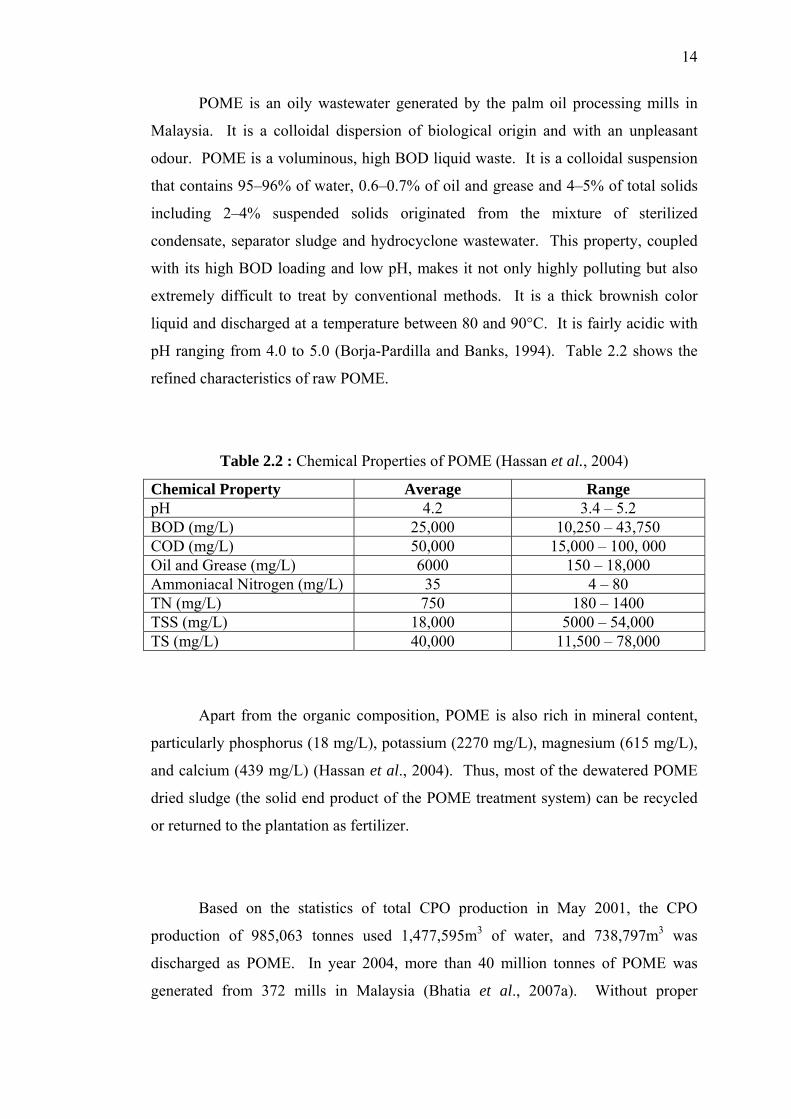
POME is an oily wastewater generated by the palm oil processing mills in
Malaysia. It is a colloidal dispersion of biological origin and with an unpleasant
odour. POME is a voluminous, high BOD liquid waste. It is a colloidal suspension
that contains 95–96% of water, 0.6–0.7% of oil and grease and 4–5% of total solids
including 2–4% suspended solids originated from the mixture of sterilized
condensate, separator sludge and hydrocyclone wastewater. This property, coupled
with its high BOD loading and low pH, makes it not only highly polluting but also
extremely difficult to treat by conventional methods. It is a thick brownish color
liquid and discharged at a temperature between 80 and 90°C. It is fairly acidic with
pH ranging from 4.0 to 5.0 (Borja-Pardilla and Banks, 1994). Table 2.2 shows the
refined characteristics of raw POME.
Table 2.2 : Chemical Properties of POME (Hassan et al., 2004)
Chemical Property Average Range pH 4.2 3.4 – 5.2 BOD (mg/L) 25,000 10,250 – 43,750 COD (mg/L) 50,000 15,000 – 100, 000 Oil and Grease (mg/L) 6000 150 – 18,000 Ammoniacal Nitrogen (mg/L) 35 4 – 80 TN (mg/L) 750 180 – 1400 TSS (mg/L) 18,000 5000 – 54,000 TS (mg/L) 40,000 11,500 – 78,000
Apart from the organic composition, POME is also rich in mineral content,
particularly phosphorus (18 mg/L), potassium (2270 mg/L), magnesium (615 mg/L),
and calcium (439 mg/L) (Hassan et al., 2004). Thus, most of the dewatered POME
dried sludge (the solid end product of the POME treatment system) can be recycled
or returned to the plantation as fertilizer.
Based on the statistics of total CPO production in May 2001, the CPO
production of 985,063 tonnes used 1,477,595m3 of water, and 738,797m3 was
discharged as POME. In year 2004, more than 40 million tonnes of POME was
generated from 372 mills in Malaysia (Bhatia et al., 2007a). Without proper
15
treatment of POME, the effluent will pollute watercourses where this effluent is
discharged.
The palm oil mills traditionally have discharged their effluents into rivers
leading to the seas. They relied solely on nature to absorb large quantities of waste
products. With the rapid expansion of the industry and the public's increased
awareness of environmental pollution, the industry is obliged both socially and
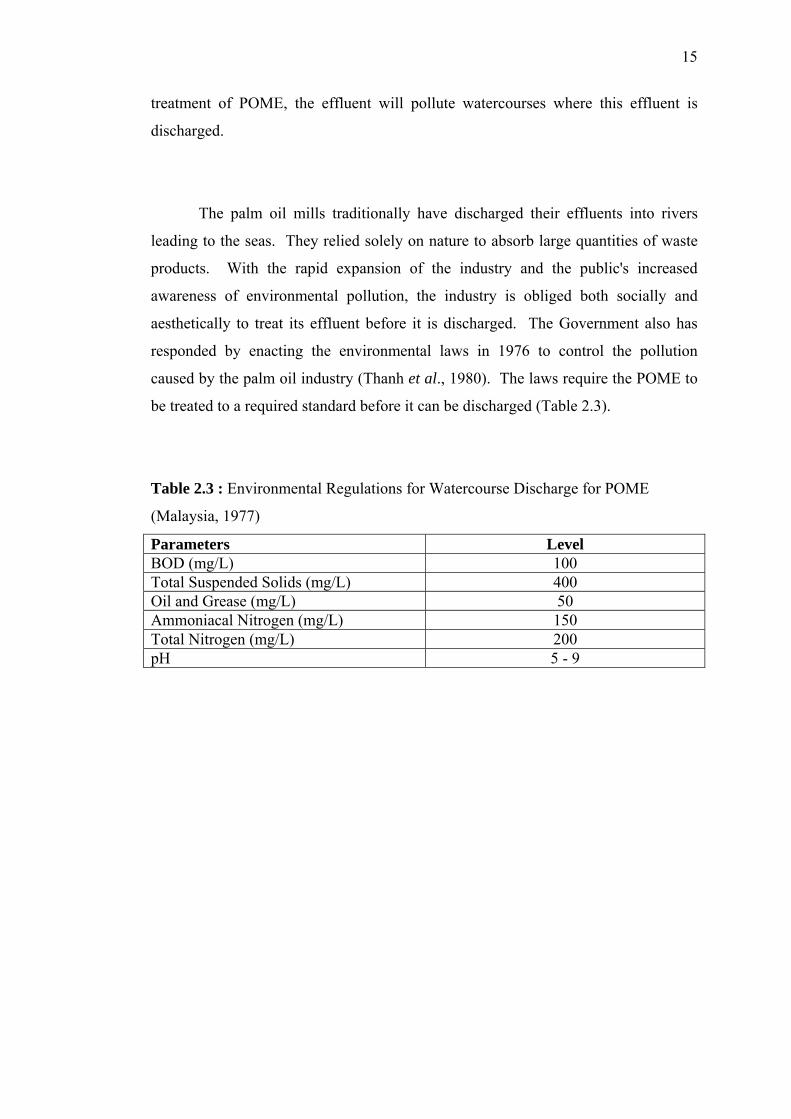
aesthetically to treat its effluent before it is discharged. The Government also has
responded by enacting the environmental laws in 1976 to control the pollution
caused by the palm oil industry (Thanh et al., 1980). The laws require the POME to
be treated to a required standard before it can be discharged (Table 2.3).
Table 2.3 : Environmental Regulations for Watercourse Discharge for POME
(Malaysia, 1977)
Parameters Level BOD (mg/L) 100 Total Suspended Solids (mg/L) 400 Oil and Grease (mg/L) 50 Ammoniacal Nitrogen (mg/L) 150 Total Nitrogen (mg/L) 200 pH 5 - 9
16
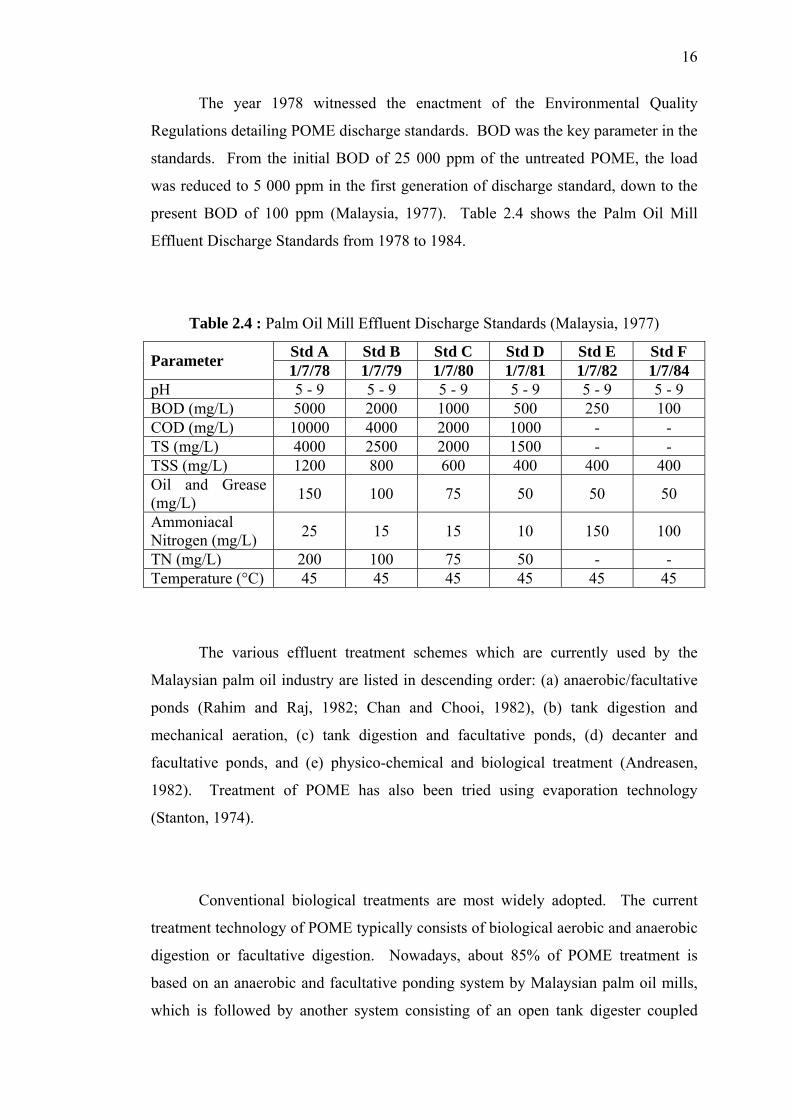
The year 1978 witnessed the enactment of the Environmental Quality
Regulations detailing POME discharge standards. BOD was the key parameter in the
standards. From the initial BOD of 25 000 ppm of the untreated POME, the load
was reduced to 5 000 ppm in the first generation of discharge standard, down to the
present BOD of 100 ppm (Malaysia, 1977). Table 2.4 shows the Palm Oil Mill
Effluent Discharge Standards from 1978 to 1984.
Table 2.4 : Palm Oil Mill Effluent Discharge Standards (Malaysia, 1977)
Std A Std B Std C Std D Std E Std F Parameter 1/7/78 1/7/79 1/7/80 1/7/81 1/7/82 1/7/84 pH 5 - 9 5 - 9 5 - 9 5 - 9 5 - 9 5 - 9 BOD (mg/L) 5000 2000 1000 500 250 100 COD (mg/L) 10000 4000 2000 1000 - - TS (mg/L) 4000 2500 2000 1500 - - TSS (mg/L) 1200 800 600 400 400 400 Oil and Grease (mg/L) 150 100 75 50 50 50
Ammoniacal Nitrogen (mg/L) 25 15 15 10 150 100
TN (mg/L) 200 100 75 50 - - Temperature (°C) 45 45 45 45 45 45
The various effluent treatment schemes which are currently used by the
Malaysian palm oil industry are listed in descending order: (a) anaerobic/facultative
ponds (Rahim and Raj, 1982; Chan and Chooi, 1982), (b) tank digestion and
mechanical aeration, (c) tank digestion and facultative ponds, (d) decanter and
facultative ponds, and (e) physico-chemical and biological treatment (Andreasen,
1982). Treatment of POME has also been tried using evaporation technology
(Stanton, 1974).
Conventional biological treatments are most widely adopted. The current
treatment technology of POME typically consists of biological aerobic and anaerobic
digestion or facultative digestion. Nowadays, about 85% of POME treatment is
based on an anaerobic and facultative ponding system by Malaysian palm oil mills,
which is followed by another system consisting of an open tank digester coupled
17
with extended aeration in a pond (Hassan et al., 2004). The most cost effective
technology is anaerobic treatment.
2.4 Existing Palm Oil Wastewater Treatment Systems
2.4.1 Pretreatment
2.4.1.1 Sand and Oil Trap
Manually operated sand and oil traps were installed as pretreatment units in
many wastewater treatment systems. This would minimize sand being discharged
into the next unit as it will accumulate in the primary pond or tank digester thereby
reducing its effective volume and increasing the frequency of desludging of these
units (Thanh et al., 1980). The mixed raw effluent (MRE) is then pumped into the
cooling and mixing ponds for stabilization before primary treatment. No biological
treatment occurs in these ponds. However, sedimentation of abrasive particles such
as sand will ensure that all pumping equipment is protected (Hassan et al., 2004).
2.4.1.2 Cooling System
Small holding pond or aeration tower was commonly used to bring down the
raw wastewater temperature prior to discharge into any treatment system. The raw
wastewater was cooled down to a temperature less than 35°C before feeding it into

18
an anaerobic pond (Thanh et al., 1980). The retention time of MRE in the cooling
and mixing ponds is between 1 and 2 days (Hassan et al., 2004).
2.4.2 Primary Treatment
2.4.2.1 Ponding Systems
The ponding system comprised of a series of anaerobic, facultative, and algae
ponds. An anaerobic pond is the most economical and feasible means in treating a
high strength organic waste. Because of its simplicity of construction, operation and
maintenance, it has been adopted by most of the palm oil mills throughout Malaysia
for waste treatment. These systems also require less energy due to the absence of
mechanical mixing. Mixing is very limited and achieved through the bubbling of
gases; generally this is confined to anaerobic ponds and partly facultative ponds
(Thanh et al., 1980).
The ponding system requires a vast area to accommodate a series of ponds in
order to achieve the desired characteristics for discharge. Generally anaerobic ponds
are designed to be followed by facultative waste stabilization ponds. In constructing
the ponds, the depth is crucial for determining the type of biological process. The
sizing of most of anaerobic pond systems was arbitrarily done. For anaerobic ponds,
the optimum depth ranges from 5 to 7 m, while facultative anaerobic ponds are 1 -
1.5 m deep. The hydraulic retention time (HRT) ranged from 40 to 200 days. The
effective HRT of anaerobic and facultative anaerobic systems is 45 and 20 days,
respectively (Hassan et al., 2004).
19
A shallower depth of approximately 0.5 – 1 m is required for aerobic ponds,
with an HRT of 14 days. The shapes of the anaerobic ponds vary from square to
narrow ditch, with a length to width ratios varying from 1:1 to as high as 110:1. The
POME is pumped at a very low rate of 0.2 to 0.35 kg BOD/m3.day of organic
loading. Under these optimum conditions, the system should be able to meet the
requirement of DOE. The number of ponds will depend on the production capacity
of each palm oil mill (Hassan et al., 2004).
The area occupied by the ponding system varies from 1 ha to as high as 5 ha.
Even in a mill having the same processing capacity, the land area provided will never
be the same. The inlet and outlet structures vary from one pond to another, the slope
of the pond was not properly done, the embankment was not firmly compacted, and
neglect of proper maintenance was apparent (Thanh et al., 1980).
One problem faced by pond operators is the formation of scum, which occurs
as the bubble rise to the surface, taking with them fine suspended solids. This results
from the presence of oil and grease in the POME, which are not effectively removed
during the pretreatment stage. Another disadvantage of the ponding system is the
accumulation of solid sludge at the bottom of the ponds. Eventually the sludge and
scum will clump together in side the pond, lowering the effectiveness of the pond by
reducing the volumetric capacity and HRT. When this happens, the sludge may be
removed by either using submersible pumps or excavators (Hassan et al., 2004).
Most of the treated effluents from these systems did not comply in all
respects with the final effluent standard stipulated by the DOE. Quite a number of
pond systems had been found to be inefficient; this is mainly due to improper start-
up and lack of knowledge in monitoring programme. At times, the performance of
facultative waste stabilization ponds could be affected due to various reasons such as
overloading, the blackish color of the anaerobically treated effluent inhibits light
penetration into the algae culture system, and toxic effects of some trace elements
(Thanh et al., 1980).
20
2.4.2.2 Tank Digesters and Ponding Systems
This system is a combination of an open digester tank and a series of ponding
systems. The anaerobic digestion is carried out in the digester, then in the facultative
and algae ponds. The raw wastewater is mixed with the tank digester’s effluent in a
ratio of 1:1 before being fed into both the concrete and steel tank digester on a
continuous basis. The digesters are constructed at various volumetric capacities
ranging from 600 up to 3600 m3 (Hassan et al., 2004).
The system runs at a HRT of 20 days. In other treatment plant, the tank
effluent is discharged into an aerated lagoon for further treatment. The retention
time in tank digester and aerated lagoon is 20 days. It has been shown that by using
an open digester, a better reduction of BOD can be achieved in a shorter time.
However, it has a higher organic loading of 0.8 – 1.0 kg BOD/m3 .day compared to
anaerobic ponds. Using the same principle as anaerobic ponds, mixing of POME is
achieved via bubbling of biogas. Occasionally, the mixing is also achieved when the
digester is being recharged with fresh POME. The treated POME is then overflowed
into the ponding system for further treatment (Hassan et al., 2004).
Although the digester system has been proven to be superior to anaerobic
ponds, it also has similar problems of scum formation and solid sludge accumulation.
Another serious problem is the corrosion of the steel structures due to long exposure
to hydrogen sulfide. Incident such as burst and collapsed digesters have been
recorded. Accumulated solids could be easily removed using the sludge pipe located
at the bottom of the digester. The dewatered and dried sludge can then be disposed
for land application (Thanh et al., 1980).
21
2.4.2.3 Extended Aeration
To complement the previous systems, mechanical surface aerators can be
introduced at the aerobic ponds. BOD can be reduced effectively through aerobic
processes. The aerators are normally installed at the end of the ponding system
before discharge. Nevertheless, this happens only where land area is a constraint and
does not permit extensive wastewater treatment. Or else, aerators must be provided
to meet DOE regulations (Hassan et al., 2004).
2.4.3 Post-treatment
2.4.3.1 Land Treatment System
Raw or partially treated palm oil wastewater mainly by anaerobic pond
system is applied to land by either discharging to overland flow or applying directly
for irrigation. In spite of the fact that the application of wastewater to oil palm has
been found to provide immediate benefits, many schemes were designed and
implemented without the knowledge of the assimilative capacity of the soil in
relation to the pollutants, except in a few cases where depth of wastewater
application had been limited and annual nitrogen loading rates had been studied
(Hassan et al., 2004).
Raw palm oil waste would not be suitable for land disposal because of its
high content of total solids, low pH, and high concentrations of certain trace elements
such as Fe, Cu, Cd, and Mn, while the anaerobically treated palm oil waste seems to
be more favorable for land application provided the high concentrations of total
22
dissolved solids and some trace elements are removed from the wastewater (Hassan
et al., 2004).
However, the existing conventional biological treatment is characterized by
long HRT, often in an excess of 20 d, necessitating large areas of land or digesters.
There are many processing plants failed to comply with the standard discharge limits
even though they have applied biological treatment system (Bhatia et al., 2007). A
ponding system consisting of 8 ponds in series was studied to evaluate the efficiency
for treating 600m3 POME per day. Even with a HRT of 60 d, effluent COD and
BOD were still as high as 1,725 and 610 mg/L, respectively. Effluent quality was
unable to meet the discharge standard set by the Malaysian DOE, so further
treatment is needed (Chin et al., 1996).
2.5 Previous Researches in the Field
To shorten the treatment time and lessen the land required, high-rate reactors
such as anaerobic filter, anaerobic baffled reactor, anaerobic fluidized reactor,
upflow anaerobic sludge blanket (UASB), upflow anaerobic sludge fixed film
bioreactor, and other hybrid reactors were put forward and tested in treating POME
(Ng et al., 1985, 1987; Borja-Pardilla and Banks, 1994; Borja, 1995; Borja et al.,
1996a; Borja-Pardilla et al., 1996b; Setiadi et al., 1996; Faisal and Unno, 2001,
Najafpour et al., 2006; Yacob et al., 2005, 2006a; Vijayaraghavan et al., 2007,
Yejian et al., 2008, Zinatizadeh et al., 2007). In an anaerobic fluidized bed reactor,
the maximum organic loading rate (OLR) could reach as high as 40 kg COD/ (m3·d)
(Borja-Pardilla et al., 1996b). But all these biological treatment systems need proper
maintenance and monitoring as the processes solely rely on microorganisms to
degrade the pollutants. The microorganisms are very sensitive to the changes in the
environment and thus great care has to be taken to ensure that a conducive
environment is maintained for the microorganisms to thrive in. It requires skilful
23
attention and commitment. How to ensure the stability of the system deserves most
urgent concern.
As for UASB, several months may be required for the development of
anaerobic sludge granules (Najafpour et al., 2006). The process appears to be
particularly sensitive to the TSS loading which can be applied, and also to the nature
of the organic content of the wastewater. At high organic loadings or at low
temperatures the insoluble organic fraction of the wastewater tends to accumulate
within the granule or sludge blanket region of the reactor; this leads to granule
destabilization or inhibition of granule formation. Under these conditions
methanogenesis is affected, leading ultimately to reactor failure as a result of
increased acid concentrations (Najafpour et al., 2006).
Therefore, in order to eliminate the pollution of POME, many more treatment
and disposal methods have been investigated and proposed so as to improve the
existing treatment system. This includes crop irrigation, animal fodder; decanting
and drying (Jorgensen, 1982), evaporation, wet oxidation, land disposal,
centrifugation with or without flocculation (Stanton, 1974), land application (Tam et
al., 1982), ultrafiltration (Tusirin and Suwandi, 1981; Ahmad et al., 2003b, Yejian et
al., 2008), adsorption (Ahmad et al., 2003a, 2003b, 2005a, 2005b), solvent extraction
(Ahmad et al., 2003a), and membrane technology (Ahmad et al., 2003b, 2006;
Yejian et al., 2008). POME treatment using tropical marine yeast, Yarrowia
lipolytica NCIM3589 was also investigated (Oswal et al., 2002). Coagulation-
flocculation method was often employed to remove TSS and residual oil in POME
treatment. Many coagulants, including inorganic salts (AlCl3, Al2 (SO4)3, FeCl3,
FeSO4, etc.) and polyelectrolyte (PACl, PAM and other synthetic polymers), were
used in evaluating their efficiency (Ng et al., 1987; Ariffin et al., 2005; Ahmad et al.,
2005a, 2006b; Vijayaraghavan et al., 2007).
In membrane separation processes, GH and CE (GH) membranes gave 63%
and 49% reductions in TSS and residual oil respectively at pH 9.0 and pressure of
24
1000 kPa (Ahmad et al., 2003a). Yejian et al. (2008) reported that in the membrane
process unit, almost all the suspended solids were captured by ultrafiltration (UF)
membranes and reduced turbidity from 111 NTU to 0.79 NTU, while reverse
osmosis (RO) membrane excluded most of the organic matter from RO permeate.
Suspended solids and color were undetectable in RO permeate. Performance in
terms of turbidity, COD and BOD for each treatment process, consisting of two
stages of chemical treatments and adsorption process by granular activated carbon
treatment as a pretreatment process while UF and RO membranes were used for
membrane separation treatment was studied (Ahmad et al., 2003b). The
pretreatment process was able to remove organic matter and TSS in POME by
reducing 97.9% turbidity, 56% COD and 71% BOD. For the membrane separation
treatment, the turbidity value was reduced to almost 100%, with a 98.8% reduction in
COD and 99.4% BOD reduction.
However, membrane separation technology for treating POME has never
been applied on an industrial scale due to POME characteristics. Membrane
processes have some limitations in dealing with the high suspended solids effluent.
The membranes will suffer from fouling and degradation during use. In order to
apply membrane separation technology, pretreatment processes must be carried out
to reduce the high content of suspended solids and oil in the fresh sample of POME
(Ahmad et al., 2003a).
In the batch adsorption process, an 88% reduction in residual oil was obtained
at a mixing speed of 100rpm for 1 h, pH 9.0 and an adsorbent dosage of 300 g dm−3
(Ahmad et al., 2003a). Ahmad et al. (2005a) reported that chitosan powder, at a
dosage of 0.5 g/l, 15 min of contact time and a pH value of 5.0, presented the most
suitable conditions for the adsorption of residue oil from POME. The adsorption
process performed almost 99% of residue oil removal from POME. Chitosan could
successfully remove 99% of residual oil and minimize the TSS content to a value of
25 mg/l from POME at a dosage of 0.5 g and employing a mixing time of 30 min, a
mixing rate of 100 rpm, sedimentation for 30 min and a pH value of ranging from 4.0
to 5.0 (Ahmad et al., 2005b). For activated carbon and bentonite, the optimum
25
dosages were 8.0 and 10.0 g/l, respectively, 30 min of mixing time at 150 rpm, 80
and 60 min of settling time, respectively, and pH of 4.0–5.0 to obtain the same
percentage of removal as performed by chitosan and can only reduce the TSS values
up to 35 and 70 mg/l, respectively, at the optimized conditions.
Evaporation processes were also used to treat POME. About 85% (v/v) water
in the POME can be recovered as distillate that later could be reused as boiler feed
water or process water with minimal chemical treatment. Energy requirements were
the major concern in this process. It was reported that 1 kg of steam is used to
evaporate 1 kg of water from POME (Ahmad et al., 2003b). Stanton (1974) also
reported that evaporation is technically proven but expensive in terms of energy and
capital equipment. Open pan evaporation produces a highly caramelized solid in
which much of the original protein value is lost.
Coagulation method is widely used in water and wastewater treatments and
well known for its capability of destabilizing and aggregating colloids. There are
number of different mechanisms involved in a coagulation process, including ionic
layer compression, adsorption and charge neutralization, inter-particle bridging, and
sweep coagulation. These mechanisms are very important in forming flocs of
residue oil and suspended solid which could be easily settled and finally removed.
Numerous researches have reported the treatment of POME using coagulation,
flocculation and settling procedure (Ismail and Lau, 1987; Ng et al., 1987; Ahmad et
al., 2003a, 2003b; Ariffin et al., 2005; Ahmad et al., 2005a, 2005b, 2006; Bhatia et
al., 2007a, 2007b; Vijayaraghavan et al., 2007).
The reduction of pollution strength in POME using five inorganic salts and
nine polymers was investigated by Ismail and Lau (1987). Treatment of POME with
80–100 mg/L of Magnafloc LT22 polymer aided in coagulation and flocculation of
TSS, producing 96%, 63%, 53% and 93–94% reduction in the turbidity, COD, TS
and TSS respectively, of the effluent. Treatment with 200 to 300 mg/L FeCl3 and 70
to 100 mg/L Magnafloc LT22 polymer reduced COD, TS and TSS by 47 to 53%, 43
26
to 49% and 92 to 94%, respectively. The TSS of POME can be substantially reduced
by treating with coagulating and flocculating agents before discharging into other
treatment systems.
Ng et al. (1987) assessed the ability of a variety of coagulants to destabilize
the POME suspension and to flocculate the particulate matter. Synthetic polymers
were found to be more effective than lime or alum. Excessively large quantities of
the latter were required in order to achieve the same percentage of removal as
performed by synthetic polymers. This might affect the usefulness of the recovered
solids in animal feed formulation and also lead to a sludge disposal problem.
A pilot plant study of POME treatment using coagulation was found to be
very successful by Ahmad et al. (2003a). The optimum values of the process
parameters obtained in the flocculation process were an alum dosage of 4000 mg
dm−3, mixing speed of 150rpm for 1 h and sedimentation time of 270 min, resulting
in 93% TSS removal. Adopting coagulation, sedimentation and activated carbon
adsorption as a pretreatment stage for POME treatment resulted in removal
efficiencies of 97.9% turbidity, 56% COD and 71% BOD (Ahmad et al., 2003b).
High charge density cationic PAM (485 C/g) is the most effective polymer
(Ariffin et al., 2005). It obtains 98% turbidity removal, 98.7% TSS removal and
54% COD removal with a dosage as low as 32 mg/l at pH 3.0 of POME. Very low
charge density (48.2 C/g) cationic PAM is effective only at very high dosages up to
250 mg/l. To obtain 99% turbidity removal, 99% TSS removal and 40% COD
removal, high dosage (200 mg/L) of low density cationic PAM is required.
Using the optimum conditions from the flocculation, chitosan powder, at a
dosage of 0.5 g/l, 15 min of contact time and a pH value of 5.0, presented the most
suitable conditions for the adsorption of residue oil from POME (Ahmad et al.,
2005a). Chitosan has also been compared to activated carbon and bentonite as a
27
potential residual oil remover. Ahmad et al. (2005b) reported that chitosan showed
the best removal compared to the other adsorbents for all the parameters studied.
Chitosan could successfully remove 99% of residual oil and minimize the TSS
content to a value of 25 mg/l from POME at a dosage of 0.5 g and employing a
mixing time of 30 min, a mixing rate of 100 rpm, sedimentation for 30 min and a pH
value of ranging from 4.0 to 5.0. For activated carbon and bentonite, the optimum
dosages were 8.0 g and 10.0 g/l, respectively, 30 min of mixing time at 150 rpm, 80
and 60 min of settling time, respectively, and pH of 4.0–5.0 to obtain the same
percentage of removal as performed by chitosan. Activated carbon and bentonite can
only reduce the TSS values up to 35 and 70 mg/l, respectively, at the optimized
conditions.
The performance of chitosan was compared to alum and PACl, in a study
conducted by Ahmad et al. (2006). The results obtained proved that chitosan was
comparatively more efficient and economical to alum and PACl. At the defined
optimum experimental conditions (dosage: 0.5 g/l, contact time: 15 min, mixing rate:
100 rpm, sedimentation time: 20 min and pH 4.0) chitosan showed more than 95% of
TSS and residue oil removal. For alum and PACl the optimum dosages were 8.0 and
6.0 g/l, respectively, 30 min of mixing time at 100 rpm, 50 and 60 min of settling,
respectively, and pH of 4.5 to obtain the same percentage of removal as performed
by chitosan.
According to Vijayaraghavan et al. (2007), for an influent COD
concentration of 59 700 mg/L at an alum dosage of 1700 mg/L, the residual COD,
TSS removal, sludge volume and pH were found to be 39 665 mg/L, 87%, 260 mol/L
and 6.3, respectively.
Bhatia et al. (2007a, 2007b) studied the advantage of Moringa Oleifera seeds
usage. Moringa oleifera seeds, an environmental friendly and natural coagulant are
an effective coagulant with the removal of 95% TSS and 52.2% reduction in the
COD (Bhatia et al., 2007b). The combination of MOAE with flocculant (NALCO
28
7751) resulted in 99.3% TSS removal and 52.5% COD reduction. It also reduced the
sludge volume index (SVI) to 210 mL/g with higher recovery of dry mass of sludge
(87.25%) and water (50.3%). At pH 5.0 and 120 min settling time, 99% TSS
removal can be achieved when utilized with flocculant (NALCO7751) (Bhatia et al.,
2007a).
The objective of this research was to investigate the performance of
physicochemical process as a chemical pretreatment in treating POME based on the
BOD, TSS and turbidity removal efficiency. A technological shift from biological
treatment to integrated biological and chemical process with environmental friendly
coagulants could result in improving the POME treatment system. It is intended to
increase the BOD and TSS removal efficiency so that the final discharge will meet
the DOE standards besides curtailing the large land area required by the aerobic
pond.
It is believed that physicochemical treatment will be able to treat POME in a
more beneficial way. This technology is increasingly being used for treating water
and wastewater. Several advantages in using coagulation and flocculation process
are: its wide applicability across a wide range of industries, the quality of the treated
water is more uniform regardless of the influent variations, and the plant can be
highly automated and does not require highly skilled operators (Metcalf and Eddy,
2004).
2.6 Coagulation and Flocculation
Coagulation and flocculation constitute the backbone processes in most water
and wastewater treatment plants. Their purpose is to improve the separation of
particulate species in downstream processes such as sedimentation and filtration.
29
Colloidal particles and other finely divided matter are brought together and
agglomerated to form larger size particles that can subsequently be removed in a
more efficient fashion. The coagulation process consists of three sequential steps
which are coagulant formation, particle destabilization and interparticle collisions
(Shammas, 2005).
Coagulant formation and particle destabilization are generally quick and
occur in a rapid-mixing tank. However, interparticle collisions, is a slower process
that is achieved by fluid flow and slow mixing. This is the process that causes the
agglomeration of particles and it takes place in the flocculation tank (Shammas,
2005).
Coagulation is usually accomplished through the addition of inorganic
coagulants such as aluminium- or iron-based salts, or synthetic organic polymers
commonly known as polyelectrolytes or natural organic polymers. Flocculant or
coagulant aids are available to help in the destabilization and agglomeration of
difficult and slow to settle particulate material (Metcalf and Eddy, 2004).
Coagulation is applied in water treatment, municipal wastewater treatment,
industrial waste treatment, and combined sewer overflow. It is used in the industrial
waste treatment to improve removals from secondary effluents, control of color,
handling seasonal wastes and providing treatment to meet stream and disposal
requirements at lower capital cost (Metcalf and Eddy, 2004).
30
2.6.1 Properties of Colloidal Systems
Colloidal particles are bigger than atoms and ions but are small enough that
they are usually not visible to the naked eye. They range in size from 0.001 to 10 µm
resulting in a very small ratio of mass to surface area. Colloids are tremendously
tiny particles that have very large surface area. The consequence of this smallness in
size and mass and largeness in surface area is that in colloidal suspensions
gravitational effects are insignificant, and surface phenomena predominate.
Colloidal particles have the affinity to adsorb various ions from the surrounding
medium that impart to the colloids an electrostatic charge relative to the bulk of the
surrounding water because of their tremendous surface. The developed electrostatic
repulsive forces prevent the colloids from coming together and, thus, contribute to
their dispersion and stability (Shammas, 2005).
2.6.2 Colloidal Structure and Stability
The stability of colloidal particulate matter is dependent on their
electrokinetic property. Colloidal particles acquiring similar primary charges
develop repulsive forces that keep them apart and prevent their agglomeration. The
primary electrical charges could be either negative or positive. However, the
majority of colloids that exist in aqueous systems are negatively charged (Metcalf
and Eddy, 2004).
A colloidal system as a whole does not have a net charge. Negative primary
charges on colloidal particles are balanced by positive counter-ions near the solid-
liquid interface and in the adjoining dispersion medium. In a similar fashion,
positively charged particles are counterbalanced by negative ions present in the
surrounding water. This natural inclination toward achieving electrical neutrality and
31
counterbalance of charges results in the formation of an electric double layer around
colloidal particles (Metcalf and Eddy, 2004).
2.6.3 Mechanism of Coagulation
2.6.3.1 Destabilization of Colloids
Destabilization of colloidal particles is accomplished by coagulation through
the addition of hydrolyzing electrolytes such as metal salts and/or synthetic organic
polymers. Upon being added to the water, the action of the metal salt is complex. It
undergoes dissolution, the formation of complex highly charged hydrolyzed metal
coagulants (hydroxyoxides of metals), interparticle bridging, and the enmeshment of
particles into flocs. Polymers work either on the basis of particle destabilization or
bridging between the particles (Shammas, 2005).
The destabilization process is achieved by the following four mechanisms of
coagulation: (1) double-layer compression, (2) adsorption and charge neutralization,
(3) entrapment of particles in precipitate, and (4) adsorption and bridging between
particles (Sincero and Sincero, 1996).
The addition of high-valence cations depresses the particle charge and the
effective distance of the double layer, thereby reducing the zeta potential. As the
coagulant dissolves, the cations serve to neutralize the negative charge on the
colloids. This occurs before visible floc formation, and rapid mixing which “coats”
the colloid is effective in this phase. Microflocs are then formed which retain a
positive charge in the acid range because of the adsorption of H+. These microflocs
also serve to neutralize and coat the colloidal particle. Flocculation agglomerates the
32
colloids with a hydrous oxide floc. In this phase, surface adsorption is also active.
Colloids not initially adsorbed are removed by enmeshment in the floc (Eckenfelder,
2000).
2.6.3.2 Bridging Mechanism
Polymers become attached at a number of adsorption sites to the surface of
the particles found in the wastewater. A bridge is formed when two or more particles
become adsorbed along the length of the polymer. Bridged particles become
intertwined with other bridged particles during the flocculation process. The size of
the resulting three-dimensional particles grows until they can be removed easily by
sedimentation (Shammas, 2005).
Where particle removal is to be achieved by the formation of particle-
polymer bridges, the initial mixing of the polymer and the wastewater containing the
particles to be removed must be accomplished in a matter of seconds. The mixing
intensity must be sufficient to bring about the adsorption of the polymer onto the
colloidal particles. If in adequate mixing is provided, the polymer will eventually
fold back on itself, in which case, it is not possible to form polymer bridges (Metcalf
and Eddy, 2004).
33
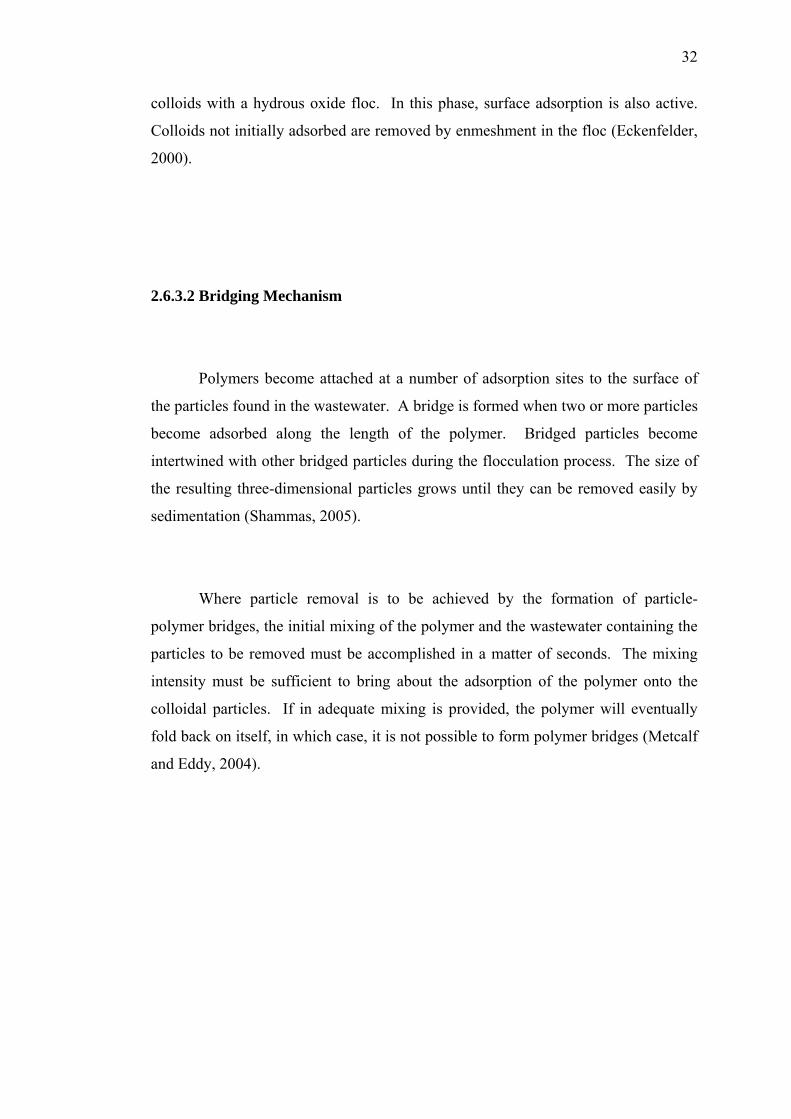
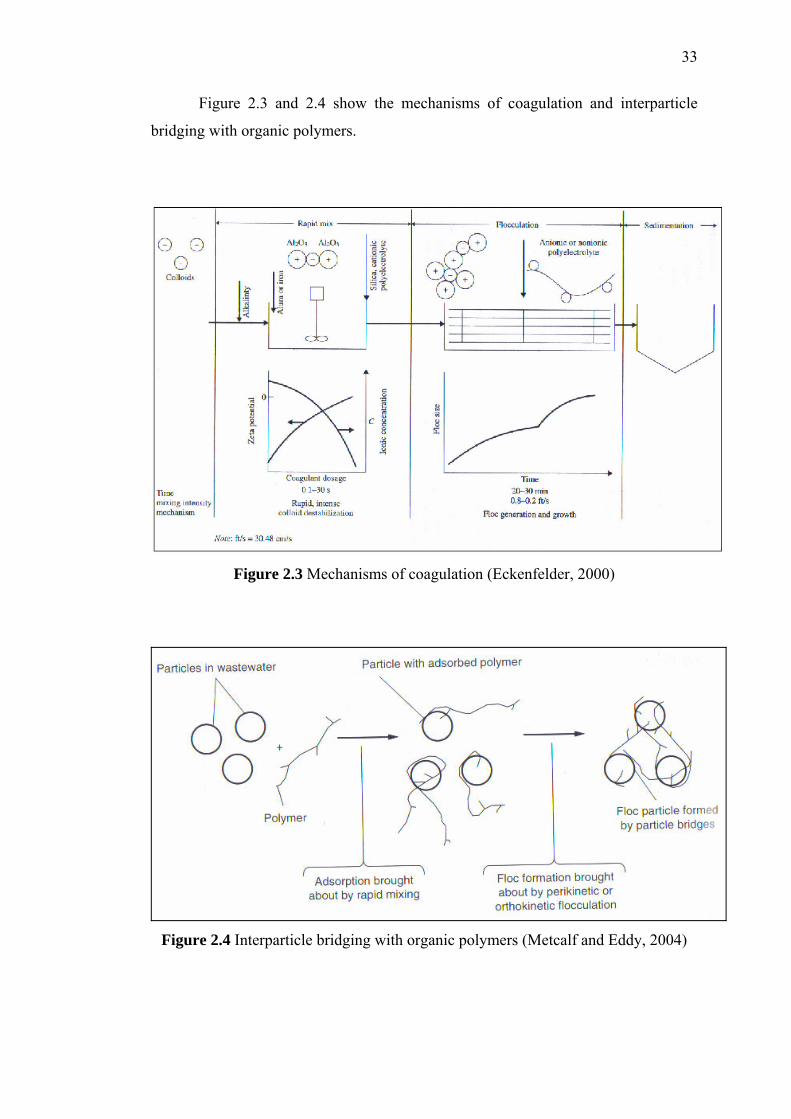
Figure 2.3 and 2.4 show the mechanisms of coagulation and interparticle
bridging with organic polymers.
Figure 2.3 Mechanisms of coagulation (Eckenfelder, 2000)
Figure 2.4 Interparticle bridging with organic polymers (Metcalf and Eddy, 2004)
34
2.6.4 Influencing Factors
Many factors affect the coagulation process. This includes colloid
concentration, coagulant dosage, zeta potential, affinity of colloids for water, pH
value and mixing (Shammas, 2005).
2.6.4.1 Coagulant Dosage
Aluminum and iron coagulant dosage effect on coagulation was reported by
Shammas (2005) and the relationship has been divided into four zones starting with
the first low-dosage zone and increasing the dosage progressively to the highest
dosage that is applied in zone four.
Zone 1 Not enough coagulant is present for the destabilization of the colloids.
Zone 2 Sufficient coagulant has been added to allow destabilization to take
place.
Zone 3 Excess concentration of coagulant can bring about charge reversal and
restabilization of particles.
Zone 4 Oversaturation with metal hydroxide precipitate entraps the colloidal
particles and produces very effective sweep coagulation.
The range of coagulant dosage that triggers the start, end, or elimination of
any of the above zones is dependent on colloidal particle concentration and pH value
(Shammas, 2005).
35
2.6.4.2 pH Value
The presence of H+ and OH- ions in the potential determining layer may
cause particle charge to be more positive or less negative at pH values below the
isoelectric point. pH value affects radically the solubility of colloidal dispersions.
The influence of pH on the polymer’s behaviour and effectiveness in coagulation is
vital because of the interaction between pH and the charge on the electrolyte. The
extent of charge change with pH is a function of the type of active group on the
polymer (carboxyl, amino, etc.) and the chemistry of those groups (Shammas, 2005).
2.6.4.3 Colloid Concentration and Zeta Potential
Colloidal concentration has a great impact on the dosage needed and the
efficiency of the coagulation process itself. The dosage of coagulants required for
the destabilization of a colloidal dispersion is stoichiometrically related to the
amount of colloidal particles present in solution (Shammas, 2005).
The zeta potential represents the net charge of colloidal particles. Therefore,
the higher the value of the zeta potential, the greater is the magnitude of the repulsive
power between the particles and hence the more stable is the colloidal system
(Metcalf and Eddy, 2004).
36
2.6.4.4 Affinity of Colloids for Water
The stability of hydrophilic dispersion depends more on their affinity for
water than on their electrostatic charge. Hydrophilic colloids are very stable and due
to their hydration shell, chemicals cannot readily replace sorbed water molecules
and, consequently, they are difficult to coagulate and remove from suspension.
Suspensions containing such particles require 10-20 times more coagulant than what
is normally needed to stabilize hydrophobic particles. Typical example is organic
colloids present in wastewater. The bulk of colloidal particles in turbid water usually
exhibit a mixture of hydrophobic-hydrophilic properties resulting in suspensions that
are intermediate in the degree of their difficulty to coagulate (Shammas, 2005).
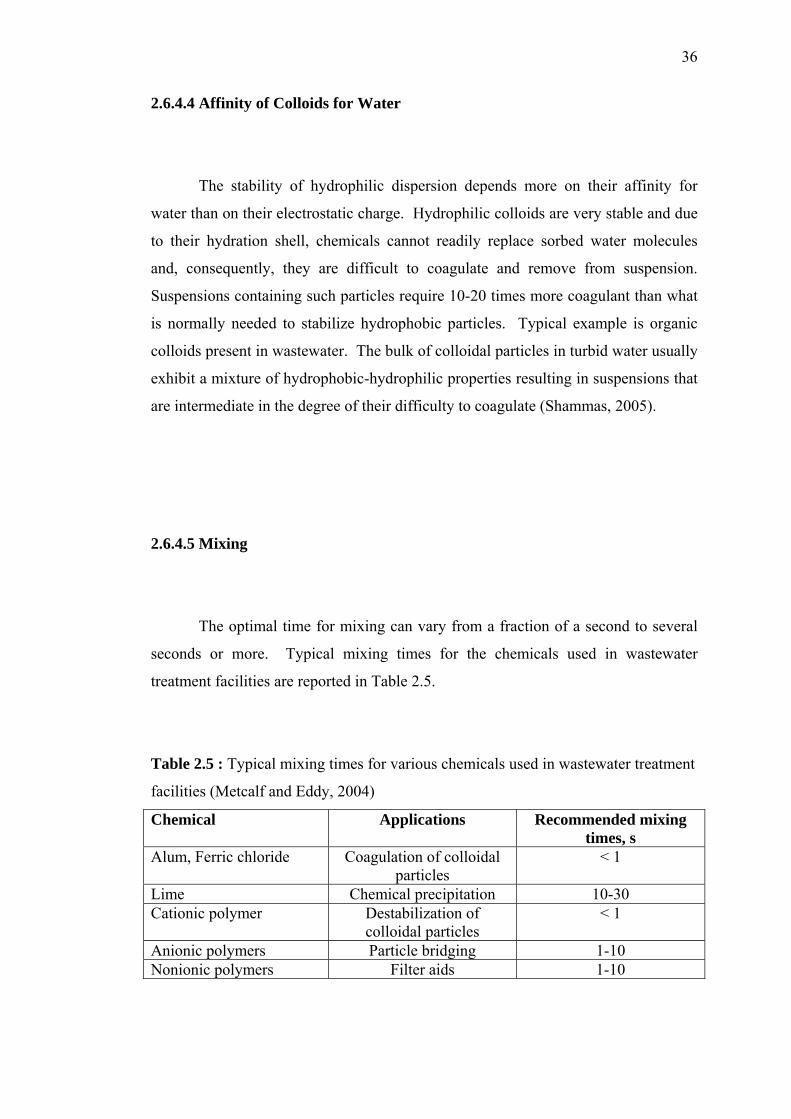
2.6.4.5 Mixing
The optimal time for mixing can vary from a fraction of a second to several
seconds or more. Typical mixing times for the chemicals used in wastewater
treatment facilities are reported in Table 2.5.
Table 2.5 : Typical mixing times for various chemicals used in wastewater treatment
facilities (Metcalf and Eddy, 2004)
Chemical Applications Recommended mixing times, s
Alum, Ferric chloride Coagulation of colloidal particles
< 1
Lime Chemical precipitation 10-30 Cationic polymer Destabilization of
colloidal particles < 1
Anionic polymers Particle bridging 1-10 Nonionic polymers Filter aids 1-10
37
2.6.5 Coagulants
Coagulant is the chemical that is added to destabilize the colloidal particles in
wastewater so that floc formation can result (Metcalf and Eddy, 2004). The choice
of coagulant chemical depends upon the nature of the suspended solid to be removed,
the raw wastewater conditions, and the cost of the amount of chemical necessary to
produce the desired result. Final selection of the coagulant (or coagulants) should be
made following thorough jar testing. Considerations must be given to required
effluent quality, cost, method and cost of sludge handling and disposal, and net
overall cost at the dose required for effective treatment (Metcalf and Eddy, 2004).
According to Shammas (2005), lime is the most commonly used chemical
because of its lower cost. However, soda ash has an advantage over lime in that it
does not increase water hardness. Ferric salts (ferric chloride and ferric sulfate)
when added to water, behave in a similar fashion to alum. Ferric coagulants may
have some advantages. Coagulation is effective over a wider pH range, a strong and
heavy floc is produced, which can settle rapidly. Sodium aluminate is also used as
coagulant. The main difference between sodium aluminate and other common
coagulants is its being alkaline rather than acidic in solution. Sodium aluminate can
be produced by dissolving alumina in sodium hydroxide. The main deterrent to the
wide scale use of this coagulant is its relatively high cost (Shammas, 2005).
2.6.5.1 Polymeric Inorganic Salts
Polymeric ferric and aluminum salts are increasingly being used to coagulate
turbid waters and are applied in conventional wastewater treatment systems as well.
This is because of their effectiveness, cheap, easy to handle and availability. They
forms positive charged Al species that adsorb to negatively charged natural particles
38
resulting in charge neutralization (Ahmad et al., 2006). PACl, a prehydrolized
inorganic salt is one of the examples (Metcalf and Eddy, 2004).
2.6.5.2 Organic Polymers
Synthetic organic polymers are long–chain molecules made up of small
subunits or monomeric units. Polyelectrolytes are polymers that contain ionizable
groups such as carboxyl, amino or sulfonic groups. Due to their ability to destabilize
particles by charge neutralization, interparticle bridging, or both, polymers function
as excellent coagulants. Cationic polymers are capable of destabilizing and
coagulating particles by both charge neutralization and interparticle bridging.
Anionic and nonionic polymers, on the other hand, destabilize negatively charged
colloidal particles through their bridging effect (Shammas, 2005).
Natural organic polymer like chitosan, has excellent properties, such as
biodegradability, biocompability, adsorption property, flocculating ability,
polyelectrolisity and its possibilities of regeneration in number of applications
(Ahmad et al., 2005b).
The effectiveness of polymers in accomplishing their function as coagulants
depends on several factors, which includes polymer properties and solution
characteristics. Among the polymer properties are functional groups on polymers,
charge density, molecular weight and degree of branching. Solution characteristics
take account of pH value and concentration of divalent cations (Shammas, 2005).
There is a constricted range for maximum performance. Concentrations
lower than essential will not generate effective coagulation, whereas overdosing of
39
polymers will results in charge reversal and restabilization of the colloidal system.
In addition polymers are more expensive compared to metallic salts. However, this
is usually more than compensated for by the lower polymer dosage as well as the
reduced sludge production (Metcalf and Eddy, 2004).
2.6.6 Coagulation Aids
Coagulation aids or flocculant are occasionally applied to attain optimum
conditions for coagulation and flocculation. The intention is to obtain faster floc
formation, produce denser and stronger flocs, decrease the coagulant dosage, broaden
the effective pH band, and improve the removal of turbidity and other impurities.
Alkalinity addition, polymers, particulate addition and pH adjustment are the four
typical types of coagulant aids (Shammas, 2005).
Acids and alkalis are used to adjust the pH of the water to fall within the
optimal pH range for coagulation (Sincero and Sincero, 1996). pH reduction is
usually accomplished by the addition of sulfuric or hydrochloric acid. Increasing the
pH is achieved by the addition of lime, sodium hydroxide, or soda ash.
2.6.7 Coagulation Control
Theoretical analysis of coagulation is essential for understanding the process,
for knowing how it works and what it can achieve as well as for discerning how to
obtain the maximum performance out of it. However, because the process is so
complex and the number of variables is so large, in most cases it is not feasible either
40
to predict the best type of coagulant and optimum dosage or the best operating pH.
The most practical approach is to simulate the process in a laboratory setting using
the jar test (Shammas, 2005).
2.6.8 Jar Test
The jar test is the most precious tool available for developing design criteria
for new plants, for optimizing plant operations, and for the evaluation and control of
the coagulation process. A jar test apparatus is a variable speed, multiple station or
gang unit that varies in configuration depending on the manufacturer. The
differences, such as the number of test stations (usually six), the size (commonly
1000 mL) and shape of test jars (round or square), method of mixing (paddles,
magnetic bars, or plungers), stirrer controls, and integral illumination, do not have a
significant impact on the performance of the unit. The jar test can be run to select
type and dosage of coagulants, coagulant aid and its dosage, optimum operating pH,
optimum energy and mixing time for rapid and slow mixing (Sincero and Sincero,
1996).
For dosage optimization, samples of wastewater are filled into a series of jars,
and different dosages of the coagulant are fed into the jars. The coagulants are
rapidly mixed at a speed of 60-80 rpm for a period of 30-60 s then allowed to
flocculate at a slow speed of 25-35 rpm for a period of 15-30 min. The suspension is
finally left to settle for 20-60 min under quiescent conditions. The appearance and
size of the flocs, the time for floc formation, and the settling characteristics are noted.
The supernatant is analyzed for turbidity, color, suspended solids, and pH. The
optimum chemical dosage is chose on the basis of best effluent quality and minimum
coagulant cost (Sincero and Sincero, 1996).
41
2.6.9 Rapid Mix
Rapid mixing is used to distribute the chemicals immediately (Sincero and
Sincero, 1996). In order to achieve instantaneous, uniform dispersion of the
chemicals through the wastewater body, rapid mixing is needed. It is not only
sufficient, but also desirable because the production of effective coagulant species
greatly depends on being able to achieve a uniform dispersion of the added
chemicals. The adsorption rate for the various coagulants products is also very fast.
It may be wise to achieve the required dispersion through a less intense mixing over
a longer time interval, when dealing with fragile colloidal particles (Shammas,
2005).
2.6.10 Flocculation
The function of flocculation is to optimize the rate of contact between the
destabilized particles, hence increasing their rate of collision and bridging about the
attachment and aggregation of the particles into larger and denser floc (Shammas,
2005). In consequence, the flocculation process permits the colloidal particles to
come together and build into bigger flocs that are more amenable to separation by
settling, or filtration. Optimal mixing must be supplied to bring particles into contact
and keep them from settling. Slow mixing can be attained mechanically or
hydraulically (Metcalf and Eddy, 2004).
42
2.7 Coagulation and flocculation using chitosan
Chitosan is a high molecular weight carbohydrate polymer manufactured
from chitin. It is a natural cationic polyelectrolyte formed by N-acetyl-D-
glucosamine units with β (1–4) glycosidic bounds. Chitosan owes its cationic nature
to the free amino groups obtained by removing some of the acetyl groups of chitin.
Chitin is widely distributed in marine nature, occurring in the insects, yeasts, fungi
and exoskeletons of crustaceans (Ahmad et al., 2006). Chitosan is a linear
polyelectrolyte at acidic pH and it has a high charge density, one charge per each
glucosamine unit. It is an excellent flocculant due to its high number of NH3+ groups
that can interact with negatively charged colloids and it forms complexes with many
metal ions (Pinotti et al., 2001).
Chitosan, a natural deacetylated marine polymer has been used in a variety of
practical fields including wastewater management, pharmacology, biochemistry, and
biomedical. Its largest use is still as a non-toxic flocculent in the treatment of
organically polluted wastewaters. Chitosan has high proportions of amino functions
that provide novel binding properties for many heavy metals in wastewater (Ahmad
et al., 2005a). Chitosan is not a health threatening material because it is a
biodegradable and biopolymeric material (Ahmad et al., 2005b).
2.8 Coagulation and flocculation using polyacrylamide (PAM)
Acrylamide is a crystalline, relatively stable monomer that is soluble in water
and in many organic solvents. It undergoes polymerization by conventional free-
radical methods, but can also be polymerized photochemically. All current industrial
production is believed to be free-radical polymerization. The pH of the reaction
medium is also important, since hydrolysis of amide groups can take place at high
43
pH, whereas imidization is favored at low pH and high temperature. By far the
greatest current interest is in those PAMs having very high molecular weights (> 5 x
106) (Pinotti et al., 2001).
Synthetic polyelectrolytes are known to be as much as 80 times more
efficient (weight for weight) in the removal of suspended colloidal particles than the
traditional water treatment agents. Their effectiveness as flocculants increases with
increasing molecular size, the limit of which is only dictated by problems in
solubility. The use of PAMs has been found to have extensive commercial
application in the clarification of water in industrial and municipal municipal
processes. However, the basis of the physicochemical interactions at the solid-
solution interface is still little understood (Ariffin et al., 2005).
2.9 Coagulation and flocculation using polyaluminum chloride (PACl)
PACl, an inorganic coagulant, has become more popular as the alternative
coagulants in recent years. The advantages over traditional coagulants are obvious
due to their stable preformed polymeric species and less pH dependence. Among the
available coagulants, aluminum sulphate (alum) and PACl are the most extensively
used coagulant for sludge conditioning and dewatering coagulation processes. The
most significant usage of aluminum coagulants are usually overdosed in order to
ensure coagulation efficiency. They are more effective at lower temperatures, a
broader pH range and forms positive charged Al species that adsorb to negatively
charged natural particles resulting in charge neutralization (Ahmad et al., 2006).
44
2.10 Efficiency of POME treatment
2.10.1 Biochemical Oxygen Demand (BOD) Analysis
The BOD determination is an empirical test in which standardizes laboratory
procedures is used to determine the relative oxygen requirements of wastewaters,
effluents, and polluted waters. The test has its widest application in measuring waste
loadings to treatment plants and in evaluating the BOD-removal efficiency of such
treatment systems. The test measures the molecular oxygen utilized during a
specified incubation period for the biochemical degradation of organic material
(carbonaceous demand) and the oxygen used to oxidize inorganic material such as
sulfides and ferrous iron (Standard Methods, 2005).
The most widely used parameter of organic pollution applied to both surface
water and wastewater is the 5-day BOD (BOD5). The method consists of filling with
diluted and seeded sample, to overflowing, an airtight bottle of specified size and
incubating it at the specified temperature for 5 d. Dissolved oxygen is measured
initially and after incubation, and the BOD is computed from the difference between
initial and final dissolved oxygen (Metcalf and Eddy, 2004).
BOD test results are used (1) to determine the approximate quantity of
oxygen that will be required to biologically stabilize the organic matter present, (2)
to determine the size of waste treatment facilities, (3) to measure the efficiency of
some treatment processes, and (4) to determine compliance with wastewater
discharge permits (Metcalf and Eddy, 2004).
45
2.10.2 Turbidity Analysis
The clarity of a natural body of water is an important determinant of its
condition and productivity. Turbidity in water is caused by suspended and colloidal
matter such as clay, silt, finely divided organic and inorganic matter, and plankton
and other microscopic organisms. Turbidity is an expression of the optical property
that causes light to be scattered and absorbed rather than transmitted with no change
in direction or flux level through the sample (Standard Methods, 2005).
Electronic nephelometers are the preferred instruments for turbidity
measurement. Nephelometers are relatively unaffected by small differences in
design parameters and therefore are specified as standard instrument for
measurement of low turbidities. Its precision, sensitivity, and applicability over a
wide turbidity range make the nephelometer method preferable to visual methods.
Formazin suspensions are used as the primary standard. The results of turbidity
measurements are reported as nephelometric turbidity units (NTU). Colloidal matter
will scatter or absorb light and thus prevent its transmission. It should be noted that
the presence of air bubbles in the fluid will cause erroneous turbidity readings. In
general, there is no relationship between turbidity and the concentration of total
suspended solids in untreated wastewater. There is, however, a reasonable
relationship between turbidity and total suspended solids for the settled and filtered
secondary effluent from the activated sludge process (Metcalf and Eddy, 2004).
2.10.3 Total Suspended Solids (TSS) Analysis
A well-mixed sample is filtered through a weighed standard glass-fiber filter
and the residue retained on the filter is dried to a constant weight at 103 to 105°C.
The increase in weight of the filter represents the total suspended solids (Standard
46
Methods, 2005). Because a filter is used to separate the TSS from the TDS, the TSS
test is somewhat arbitrary, depending on the pore size of the filter paper used for the
test. Filters with nominal pore sizes varying from 0.45 μm to about 2.0 μm have
been used for the TSS test (Metcalf and Eddy, 2004).
The measured values of TSS are dependent on the type and pore size of the
filter paper used in the analysis. Depending on the sample size used for the
determination of TSS, autofiltration, where the suspended solids that have been
intercepted by the filter also serve as a filter, can occur. Autofiltration will cause an
apparent increase in the measured TSS value over the actual value. Depending on
the characteristics of the particulate matter, small particles may be removed by
adsorption to material already retained by the filter. TSS is a lumped parameter,
because the number and size distribution of the particles that comprise the measured
value is unknown (Metcalf and Eddy, 2004).
Nevertheless, TSS test results are used routinely to assess the performance of
conventional treatment processes and the need for effluent filtration in reuse
applications. TSS is one of the two universally used effluent standards (along with
BOD) by which the performance of treatment plants is judged for regulatory control
purposes (Metcalf and Eddy, 2004)
2.11 Chemical Cost Estimation
Before the profitability of a project can be assessed, an estimate of the
investment required and the cost involved are needed. An estimate of the operating
costs is needed to judge the viability of a project, and to make choices between
possible alternative processing schemes (Sinnott, 1996).
47
The price of each coagulant is best obtained by getting quotations from
potential suppliers, but in the preliminary stages of a project, prices can be taken
from the literature or published prices. Open market prices for some chemical
products can fluctuate considerably with time (Smith, 2005).
The coagulant costs were based on the application of the coagulants at their
respective optimum dosage for the treatment of 1 cubic meter of POME fed. The
cost of each coagulant was also calculated based on the volume of mixed raw
effluent generated for each tonne of CPO produced. The cost is then compared to the
revenue earned from the CPO production to evaluate the viability of chemical pre-
treatment in treating POME.
Chemical cost analysis is equally important so as to determine the most cost
effective process. The cost of each coagulant needed to treat the amount of POME
generated monthly from the production of CPO is compared against the revenue
earned from the amount of CPO produced monthly (based on the latest market price
of palm oil).
CHAPTER III
METHODOLOGY
3.1 Introduction
This chapter describes the process and procedure involved in carrying out this
research. This includes POME sample collection and preservation, and chemical i.e.
coagulants preparation. Experimental design consists of POME characterization,
determination of optimum coagulant dosage and evaluation of optimum pH value via
jar testing, determination of the response through chemical analyses which includes
BOD, TSS and turbidity analysis, and chemical cost estimation.
49
3.2 Materials and Methods
3.2.1 Experimental Materials
3.2.1.1 POME Sample Collection
Samples of raw POME were collected from Kilang Sawit Penggeli, Felda
Palm Industries Sdn. Bhd., Kluang, Johor, at a temperature ranging from 80 to 90°C.
Samples may vary day to day depending on the discharge limit of the factory, climate
and condition of the palm oil processing.
3.2.1.2 Quantity
A 30-40 liter sample was sufficient for analysis. The storage containers were
filled completely to exclude air.
3.2.1.3 Containers
Samples were collected and stored in wide-mouthed bottles made of
polyethylene. All bottles were provided with stoppers, caps or plugs which should
resist the attack of material contained in the vessel. Sample bottles were carefully
cleaned before each use. Before filling, the sample bottles were rinsed out two or
three times with the effluent to be sampled.
50
3.2.1.4 Representative Samples
Sampling of the effluent was carried out at the designated point of discharge.
This technique was carried out so as to ensure that the samples obtained were
representative samples.
3.2.1.5 Sample Preservation
The POME was preserved at a temperature less than 4°C, but above the
freezing point in order to prevent the wastewater from undergoing biodegradation
due to microbial action (Standard Methods, 2005). Sample preservation as well as
the experimental works was carried out in Pollution Control Laboratory, Faculty of
Chemical and Natural Resources Engineering.
3.2.1.6 Coagulants
Chitosan was supplied by ACRŌS Organics, New Jersey, U.S.A. in the form
of a fine off-white powder with molecular weight between 100,000 and 300,000.
PAM and PACl were obtained from the Pollution Control Laboratory. The viscosity
of PAM is about 280cP (0.5% aqueous solution at 25°C). Its molecular weight is
more than 5,000,000. Both PAM and PACl were in powder form.
Distillated water was used to dilute hydrochloric acid solution (Merck,
Germany) and dissolve sodium hydroxide pellets (Merck, Germany) to obtain
51
solutions of 5 M. These solutions were then used for pH adjustment during the
treatment process.
3.2.2 Experimental Design
3.2.2.1 Laboratory Treatability Study
Treatability study is a laboratory test designed to provide critical data needed
to evaluate and, ultimately, to implement one or more economical treatment
technologies to treat and manage such wastes to meet the regulatory criteria for safe
disposal and/or reuse (USEPA Website). This study generally involves
characterizing untreated waste and evaluating the performance of the technology
under different operating conditions. These results may be qualitative or
quantitative, depending on the level of treatability testing. Yielded data can be used
as indicators of a technology’s potential to meet performance goals and can identify
operating standards for investigation during bench-or pilot-scale testing. These
studies are necessary to determine specific treatment as well as capital and operating
costs.
The physicochemical treatment ability study which was carried out consists
of POME characterization, determination of optimum coagulant dosage and
evaluation of optimum pH value via jar testing, determination of the response
through observations and chemical analyses, and chemical cost estimation.
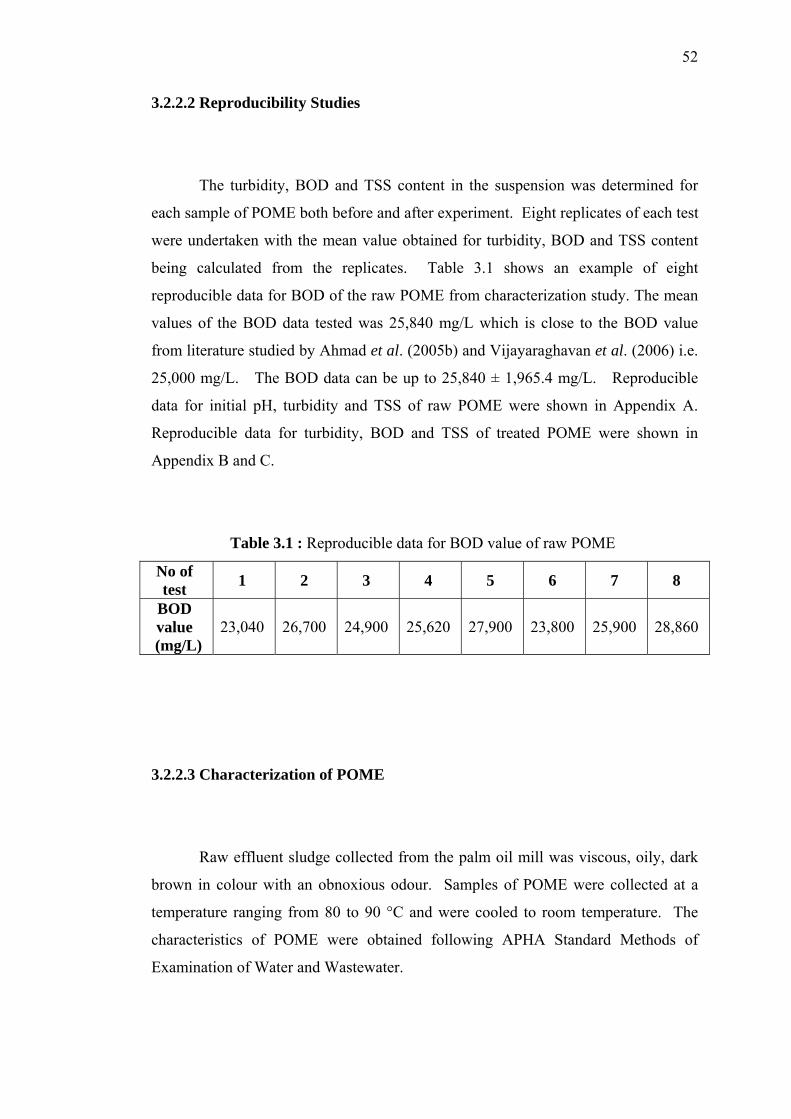
52
3.2.2.2 Reproducibility Studies
The turbidity, BOD and TSS content in the suspension was determined for
each sample of POME both before and after experiment. Eight replicates of each test
were undertaken with the mean value obtained for turbidity, BOD and TSS content
being calculated from the replicates. Table 3.1 shows an example of eight
reproducible data for BOD of the raw POME from characterization study. The mean
values of the BOD data tested was 25,840 mg/L which is close to the BOD value
from literature studied by Ahmad et al. (2005b) and Vijayaraghavan et al. (2006) i.e.
25,000 mg/L. The BOD data can be up to 25,840 ± 1,965.4 mg/L. Reproducible
data for initial pH, turbidity and TSS of raw POME were shown in Appendix A.
Reproducible data for turbidity, BOD and TSS of treated POME were shown in
Appendix B and C.
Table 3.1 : Reproducible data for BOD value of raw POME
No of test 1 2 3 4 5 6 7 8
BOD value (mg/L)
23,040 26,700 24,900 25,620 27,900 23,800 25,900 28,860
3.2.2.3 Characterization of POME
Raw effluent sludge collected from the palm oil mill was viscous, oily, dark
brown in colour with an obnoxious odour. Samples of POME were collected at a
temperature ranging from 80 to 90 °C and were cooled to room temperature. The
characteristics of POME were obtained following APHA Standard Methods of
Examination of Water and Wastewater.
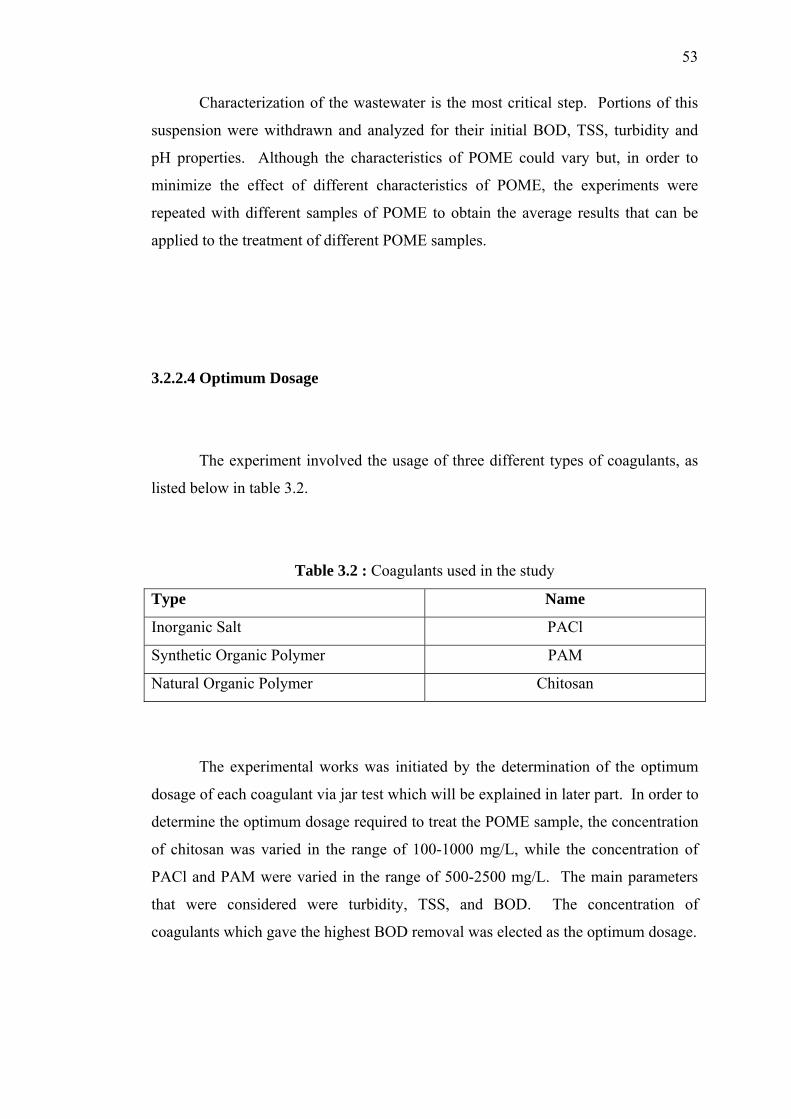
53
Characterization of the wastewater is the most critical step. Portions of this
suspension were withdrawn and analyzed for their initial BOD, TSS, turbidity and
pH properties. Although the characteristics of POME could vary but, in order to
minimize the effect of different characteristics of POME, the experiments were
repeated with different samples of POME to obtain the average results that can be
applied to the treatment of different POME samples.
3.2.2.4 Optimum Dosage
The experiment involved the usage of three different types of coagulants, as
listed below in table 3.2.
Table 3.2 : Coagulants used in the study
Type Name
Inorganic Salt PACl
Synthetic Organic Polymer PAM
Natural Organic Polymer Chitosan
The experimental works was initiated by the determination of the optimum
dosage of each coagulant via jar test which will be explained in later part. In order to
determine the optimum dosage required to treat the POME sample, the concentration
of chitosan was varied in the range of 100-1000 mg/L, while the concentration of
PACl and PAM were varied in the range of 500-2500 mg/L. The main parameters
that were considered were turbidity, TSS, and BOD. The concentration of
coagulants which gave the highest BOD removal was elected as the optimum dosage.
54
Reason behind the selection of BOD removal in determining the optimum
dosage is because it is the most critical parameter. Current regulatory requirement
stated the final BOD levels must be below 100 mg/L. However, most mills which
are currently using conventional biological treatment system do not comply with the
DOE standards in terms of BOD level.
3.2.2.5 Optimum pH Value
Once the optimum dosage for each coagulant was determined, pH adjustment
was carried out to find the most suitable pH value which will give the best BOD
removal. pH value of the POME was adjusted in the range of 3-6, as POME achieve
good removal at acidic condition. Ahmad et al., (2005a, 2005b and 2006) found that
chitosan performed best at pH 4.0 and 5.0. PACl are effective at broader pH range
(Ahmad et al., 2006). Ariffin et al. (2005) adjusted the pH of POME to 3.0 prior to
flocculation to achieve the best performance.
Because a number of chemicals are available that can be used for pH
adjustment, the choice will depend on the suitability of a given chemical for a
particular application and prevailing economics. Sodium Hydroxide (NaOH) was
used to raise pH of POME. It is convenient and is widely used for treatment where
small quantities are adequate (Metcalf and Eddy, 2004). NaOH pellets were
dissolved in distillated water on hot plate before being used. Hydrochloric acid
(HCl) was used to lower the pH of POME. It is recommended to use concentrated
HCl as small amount will be sufficient.
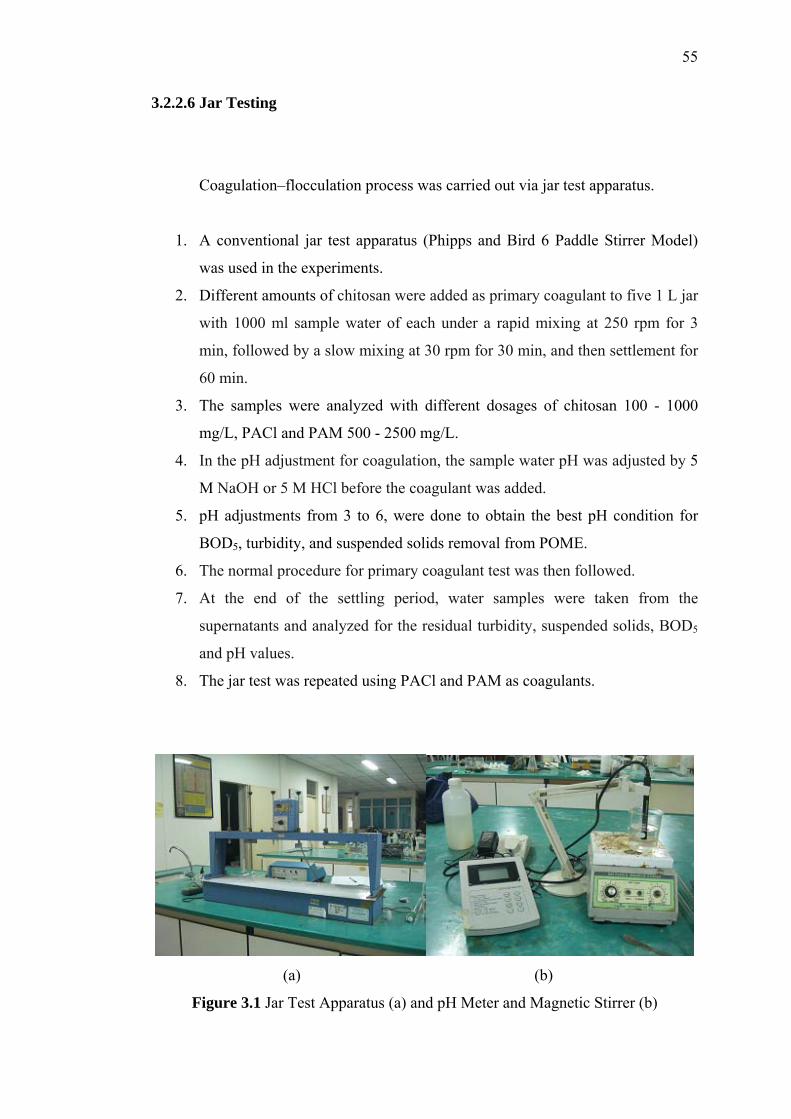
55
3.2.2.6 Jar Testing
Coagulation–flocculation process was carried out via jar test apparatus.
1. A conventional jar test apparatus (Phipps and Bird 6 Paddle Stirrer Model)
was used in the experiments.
2. Different amounts of chitosan were added as primary coagulant to five 1 L jar
with 1000 ml sample water of each under a rapid mixing at 250 rpm for 3
min, followed by a slow mixing at 30 rpm for 30 min, and then settlement for
60 min.
3. The samples were analyzed with different dosages of chitosan 100 - 1000
mg/L, PACl and PAM 500 - 2500 mg/L.
4. In the pH adjustment for coagulation, the sample water pH was adjusted by 5
M NaOH or 5 M HCl before the coagulant was added.
5. pH adjustments from 3 to 6, were done to obtain the best pH condition for
BOD5, turbidity, and suspended solids removal from POME.
6. The normal procedure for primary coagulant test was then followed.
7. At the end of the settling period, water samples were taken from the
supernatants and analyzed for the residual turbidity, suspended solids, BOD5
and pH values.
8. The jar test was repeated using PACl and PAM as coagulants.
(a) (b)
Figure 3.1 Jar Test Apparatus (a) and pH Meter and Magnetic Stirrer (b)
56
3.2.3 Determination of the Response
3.2.3.1 Observation
After the stirring is stopped, the nature and settling characteristics of the flocs
were observed and recorded qualitatively as poor, fair, good, or excellent. A hazy
sample denotes poor coagulation; a properly coagulated sample is manifested by
well-formed flocs that settle rapidly with clear supernatant above the flocs (Sincero
and Sincero, 1996).
3.2.3.2 Chemical Analyses
Accurate analysis is important not only to determine the efficacy of the
treatment but also to ascertain compliance with the standards. The BOD, turbidity
and TSS content of the supernatant was determined using methods recommended by
Standard Methods (2005). The reproducibility of the experimental data was
analyzed by repeating each experimental runs for eight times.
3.2.3.3 Biochemical Oxygen Demand (BOD) Determination
Wheaton BOD bottles, vitro ‘800’ with ground glass pennyhead stopper and
caps were used. The advantage of these bottles is the water seal which prevents air
bubbles being formed in the BOD bottles. The cap prevents evaporation of the water

57
seal during incubation. The bottles were cleaned with chromic acid mixture and then
washed out several times with clean water.
Dilution depends on the strength of the sample. Unless the BOD of the
sample is already known approximately, the required degree of dilution was not
known and more than one dilution was set up in duplicate. Table 3.3 shows the BOD
dilution table used in this study.
Table 3.3 : BOD Dilution Table
A B C
Dilution Aliquot of Sample Taken Second Dilution from (B)
1/10000 1 ml make up to 1000 ml
1/5000 2 ml make up to 1000 ml
1/2500 4 ml make up to 1000 ml
1/2000 5 ml make up to 1000 ml
1/1000
10 ml make up to 100 ml
with dilution water
10 ml make up to 1000 ml
1/1000 5 ml make up to 1000 ml
1/500 10 ml make up to 1000 ml
1/250 20 ml make up to 1000 ml
1/100
20 ml make up to 100 ml
with dilution water
50 ml make up to 1000 ml
1/100 20 ml make up to 1000 ml
1/50 40 ml make up to 1000 ml
1/25
100 ml make up to 200 ml
with dilution water 80 ml make up to 1000 ml
In the standard BOD test, a small sample of the wastewater to be tested was
placed in a 300mL BOD bottle. The bottle was then filled with dilution water
saturated in oxygen and containing the nutrients required for biological growth. To
ensure that meaningful results are obtained, the sample must be suitably diluted with
specially prepared dilution water so that adequate nutrients and oxygen will be
available during the incubation period.

58
Before the bottle was stoppered, the oxygen concentration in the bottle was
measured. After the bottle was incubated for 5 days (120 ± 1 hr) at 20°C ± 1°C, the
dissolve oxygen (DO) concentration was measured again. Longer time periods
(typically 7 days), which correspond to work schedules, are often used, especially in
small plants where the laboratory staff is not available on the weekends. The BOD
of the sample is the difference in the dissolve oxygen concentration values, expressed
in milligrams per liter, divided by the decimal fraction of sampled used. BOD
concentration and BOD removal efficiency were determined as equation 3.1 and 3.2
respectively.
BOD (mg/L) = P
DD 21 − (3.1)
Where D1 = DO of diluted sample immediately after preparation, mg/L
D2 = DO of diluted sample after 5-day incubation at 20°C, mg/L
P = fraction of wastewater sample volume to total combined volume
)2.3(%100% ×−
=POMErawforBOD
POMEtreatedforBODPOMErawforBODefficiencyremovalBOD
3.2.3.4 Turbidity Determination
Turbidity was determined as soon as possible after the sample is taken. All
samples were gently agitated before examination to ensure a representative
measurement. Formazin polymer was used as the primary standard reference
suspension. The turbidity of a specified concentration of formazin suspension is
defined as 4000 NTU.
59
Laboratory or process nephelometer consisting of a light source for
illuminating the sample and one or more photoelectric detectors with a readout
device to indicate intensity of light scattered at 90° to the path of incident light was
used. The sensitivity of the instrument should permit detecting turbidity differences
of 0.02 NTU or less in the lowest range in waters having a turbidity of less than 1
NTU. Sample cells or tubes of clear, colorless glass were used.
Cells were kept scrupulously clean, both inside and out, and were discarded if
scratched or etched. Tubes with sufficient extra length, or with a protective case,
were used so that they may be handled properly. Cells were filled with samples and
standards that have been agitated thoroughly and sufficient time was allowed for
bubbles to escape. Because small differences between sample cells significantly
impact measurement, matched pair of cells or the same cell for both standardization
and sample measurement was used. Turbidity removal efficiency was determined as
equation 3.3.
)3.3(%100×−
=POMErawforTurbidity
POMEtreatedforTurbidityPOMErawforTurbidity
Turbidity Removal
Efficiency %
3.2.3.5 Total Suspended Solids (TSS) Determination
Samples containing an excessive amount of suspended matter and those
containing colloidal matter are often difficult to filter. When it is impracticable to
use the filtration method, the centrifugal method should be used. Of the suspended
matter inclusive volatile oil, the following procedure only measures the non-volatile
part. The centrifugal method is not applicable if any part of the suspended matter
floats. The filter used most commonly for the determination of TSS is the Whatman
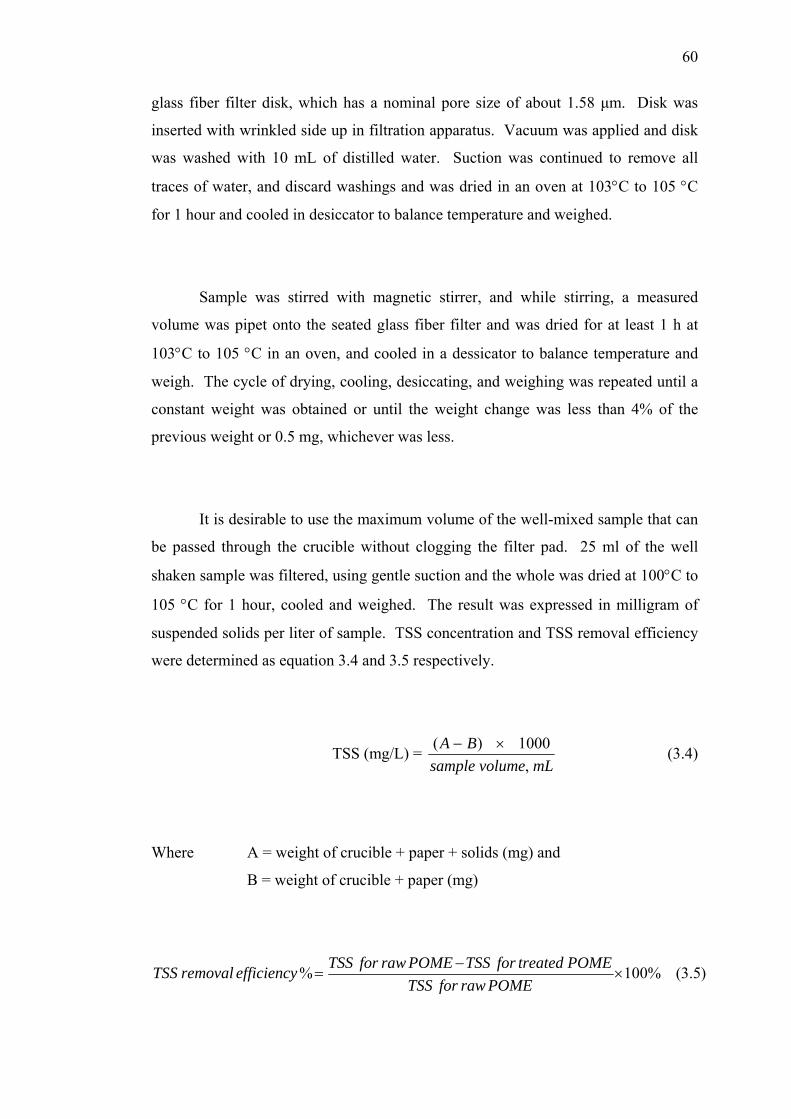
60
glass fiber filter disk, which has a nominal pore size of about 1.58 μm. Disk was
inserted with wrinkled side up in filtration apparatus. Vacuum was applied and disk
was washed with 10 mL of distilled water. Suction was continued to remove all
traces of water, and discard washings and was dried in an oven at 103°C to 105 °C
for 1 hour and cooled in desiccator to balance temperature and weighed.
Sample was stirred with magnetic stirrer, and while stirring, a measured
volume was pipet onto the seated glass fiber filter and was dried for at least 1 h at
103°C to 105 °C in an oven, and cooled in a dessicator to balance temperature and
weigh. The cycle of drying, cooling, desiccating, and weighing was repeated until a
constant weight was obtained or until the weight change was less than 4% of the
previous weight or 0.5 mg, whichever was less.
It is desirable to use the maximum volume of the well-mixed sample that can
be passed through the crucible without clogging the filter pad. 25 ml of the well
shaken sample was filtered, using gentle suction and the whole was dried at 100°C to
105 °C for 1 hour, cooled and weighed. The result was expressed in milligram of
suspended solids per liter of sample. TSS concentration and TSS removal efficiency
were determined as equation 3.4 and 3.5 respectively.
TSS (mg/L) = mLvolumesample
BA,
1000)( ×− (3.4)
Where A = weight of crucible + paper + solids (mg) and
B = weight of crucible + paper (mg)
)5.3(%100% ×−
=POMErawforTSS
POMEtreatedforTSSPOMErawforTSSefficiencyremovalTSS
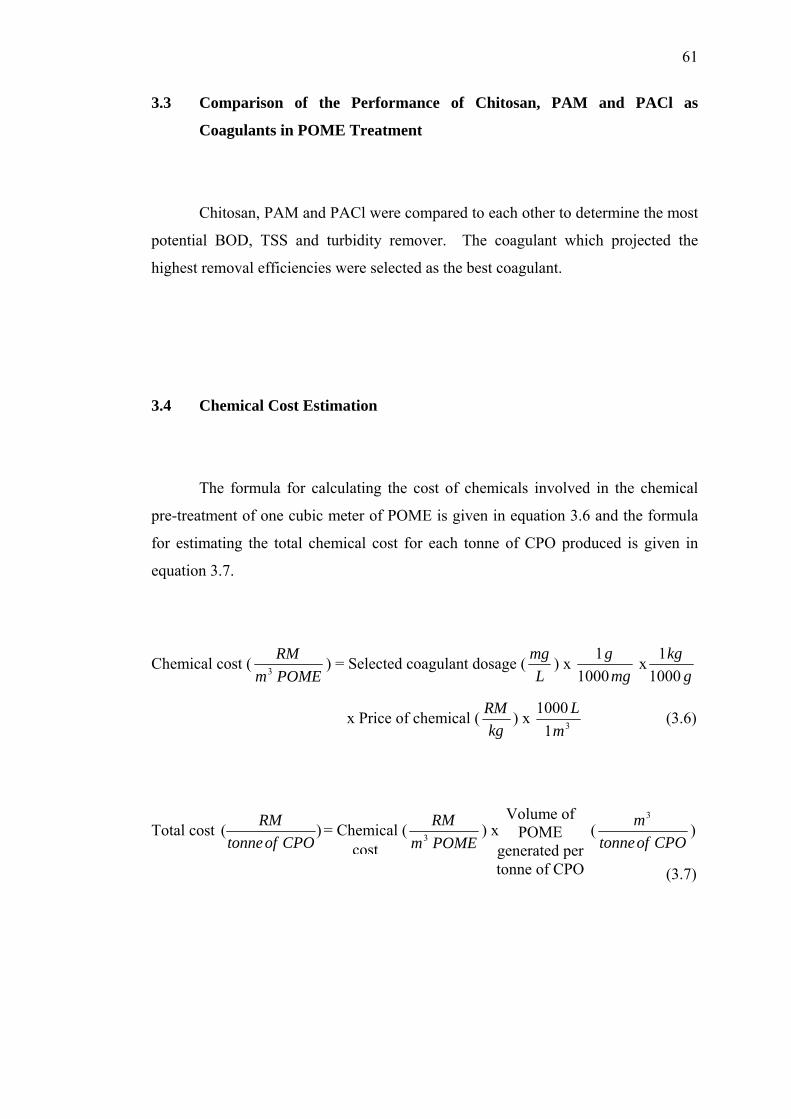
61
3.3 Comparison of the Performance of Chitosan, PAM and PACl as
Coagulants in POME Treatment
Chitosan, PAM and PACl were compared to each other to determine the most
potential BOD, TSS and turbidity remover. The coagulant which projected the
highest removal efficiencies were selected as the best coagulant.
3.4 Chemical Cost Estimation
The formula for calculating the cost of chemicals involved in the chemical
pre-treatment of one cubic meter of POME is given in equation 3.6 and the formula
for estimating the total chemical cost for each tonne of CPO produced is given in
equation 3.7.
Chemical cost (POMEmRM
3 ) = Selected coagulant dosage (L
mg ) x mg
g1000
1 xg
kg1000
1
x Price of chemical (kg
RM ) x 311000
mL (3.6)
Total cost )(CPOoftonne
RM = Chemical (POMEmRM
3 ) x (CPOoftonne
m3
)
(3.7)
Volume of POME
generated per tonne of CPO
cost
CHAPTER IV
RESULTS AND DISCUSSIONS
4.1 Introduction
This chapter presents the findings of this research and the interpretations of
the results obtained. Mainly, there were four parts of experiments were executed.
In the first part, characterization of raw POME were done in which the initial pH
value, turbidity, BOD, TSS concentration were verified. Subsequently, 1000 mL of
POME was used for each of the jar test which was conducted at 27ºC. Using
chitosan, PAM and PACl as sole coagulant, with a dosage range from 100 mg/L to
2500 mg/L at pH 5.0 (initial pH) under controlled rapid and slow mixing conditions,
jar test were performed. The performance of the coagulation and flocculation
processes of POME were evaluated by measuring supernatant turbidity, BOD, and
TSS of the POME at the end of the jar test. The results of these jar tests were used to
define the experimental condition i.e. optimum coagulant dosage which affect the
coagulation and flocculation processes.
The third part of the experiment was the pH optimization. Coagulation and
flocculation of POME were carried out with the optimum dosage of coagulants
obtained from part two but with varying pH. pH values varies between 3 and 6.
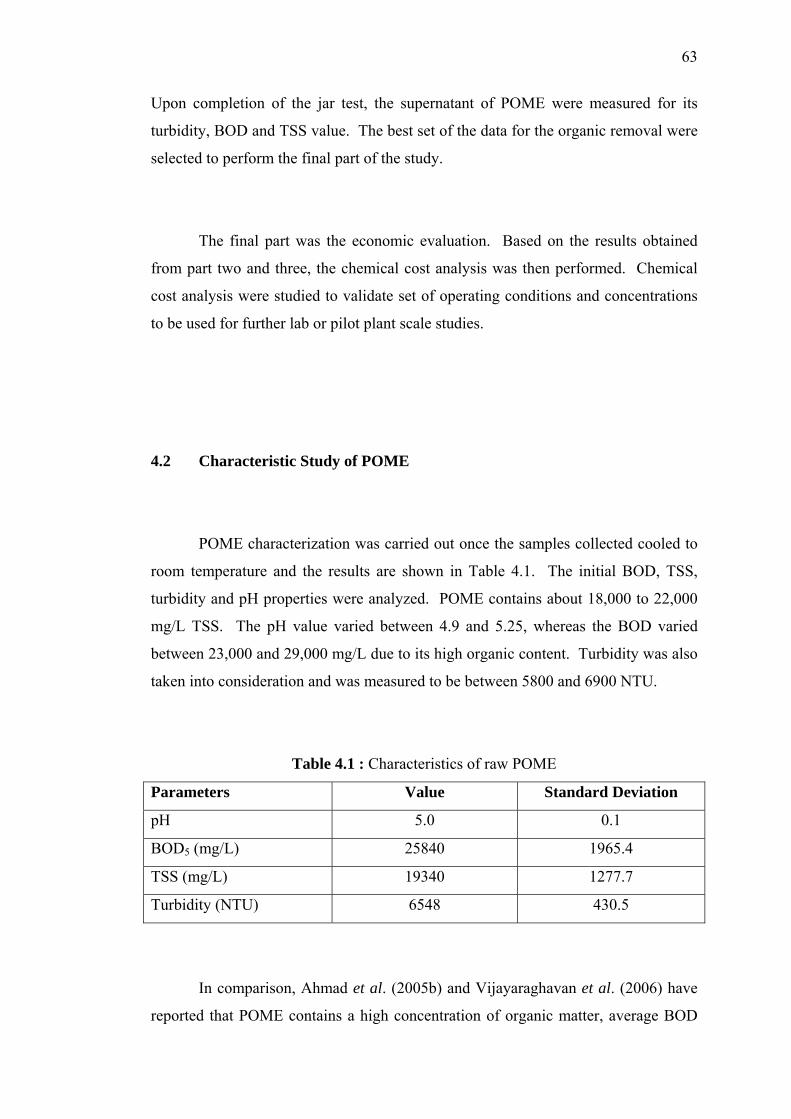
63
Upon completion of the jar test, the supernatant of POME were measured for its
turbidity, BOD and TSS value. The best set of the data for the organic removal were
selected to perform the final part of the study.
The final part was the economic evaluation. Based on the results obtained
from part two and three, the chemical cost analysis was then performed. Chemical
cost analysis were studied to validate set of operating conditions and concentrations
to be used for further lab or pilot plant scale studies.
4.2 Characteristic Study of POME
POME characterization was carried out once the samples collected cooled to
room temperature and the results are shown in Table 4.1. The initial BOD, TSS,
turbidity and pH properties were analyzed. POME contains about 18,000 to 22,000
mg/L TSS. The pH value varied between 4.9 and 5.25, whereas the BOD varied
between 23,000 and 29,000 mg/L due to its high organic content. Turbidity was also
taken into consideration and was measured to be between 5800 and 6900 NTU.
Table 4.1 : Characteristics of raw POME
Parameters Value Standard Deviation
pH 5.0 0.1
BOD5 (mg/L) 25840 1965.4
TSS (mg/L) 19340 1277.7
Turbidity (NTU) 6548 430.5
In comparison, Ahmad et al. (2005b) and Vijayaraghavan et al. (2006) have
reported that POME contains a high concentration of organic matter, average BOD
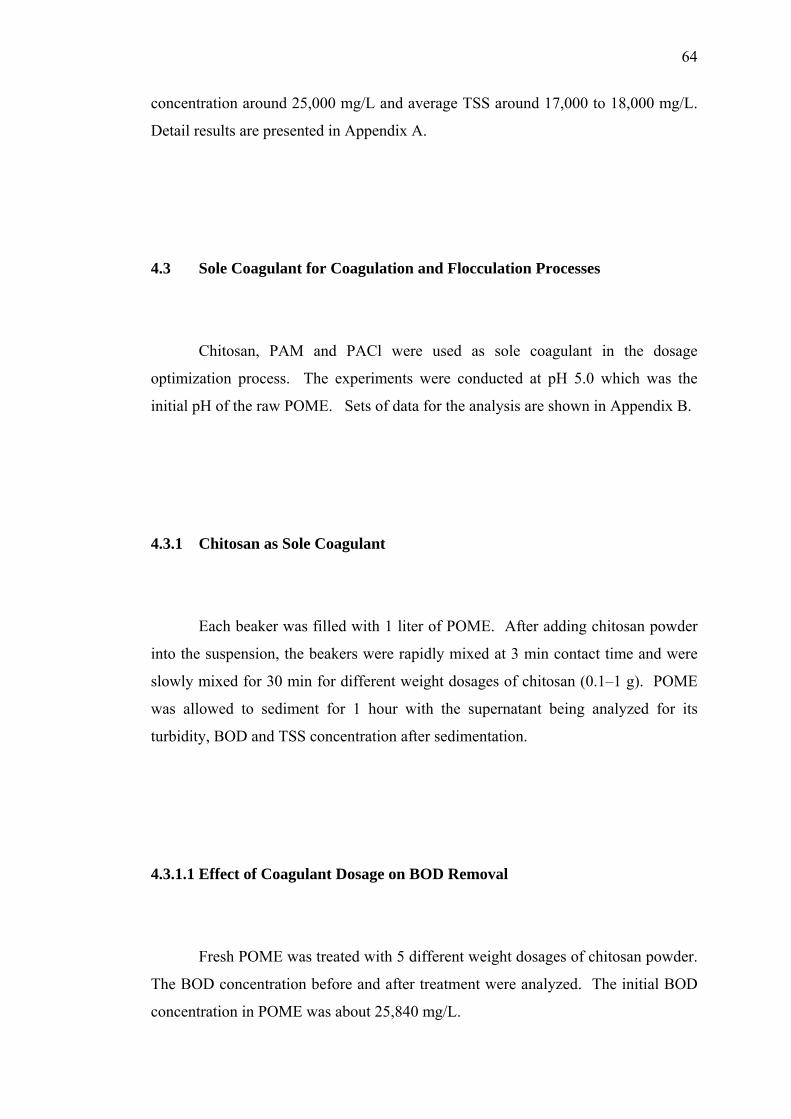
64
concentration around 25,000 mg/L and average TSS around 17,000 to 18,000 mg/L.
Detail results are presented in Appendix A.
4.3 Sole Coagulant for Coagulation and Flocculation Processes
Chitosan, PAM and PACl were used as sole coagulant in the dosage
optimization process. The experiments were conducted at pH 5.0 which was the
initial pH of the raw POME. Sets of data for the analysis are shown in Appendix B.
4.3.1 Chitosan as Sole Coagulant
Each beaker was filled with 1 liter of POME. After adding chitosan powder
into the suspension, the beakers were rapidly mixed at 3 min contact time and were
slowly mixed for 30 min for different weight dosages of chitosan (0.1–1 g). POME
was allowed to sediment for 1 hour with the supernatant being analyzed for its
turbidity, BOD and TSS concentration after sedimentation.
4.3.1.1 Effect of Coagulant Dosage on BOD Removal
Fresh POME was treated with 5 different weight dosages of chitosan powder.
The BOD concentration before and after treatment were analyzed. The initial BOD
concentration in POME was about 25,840 mg/L.
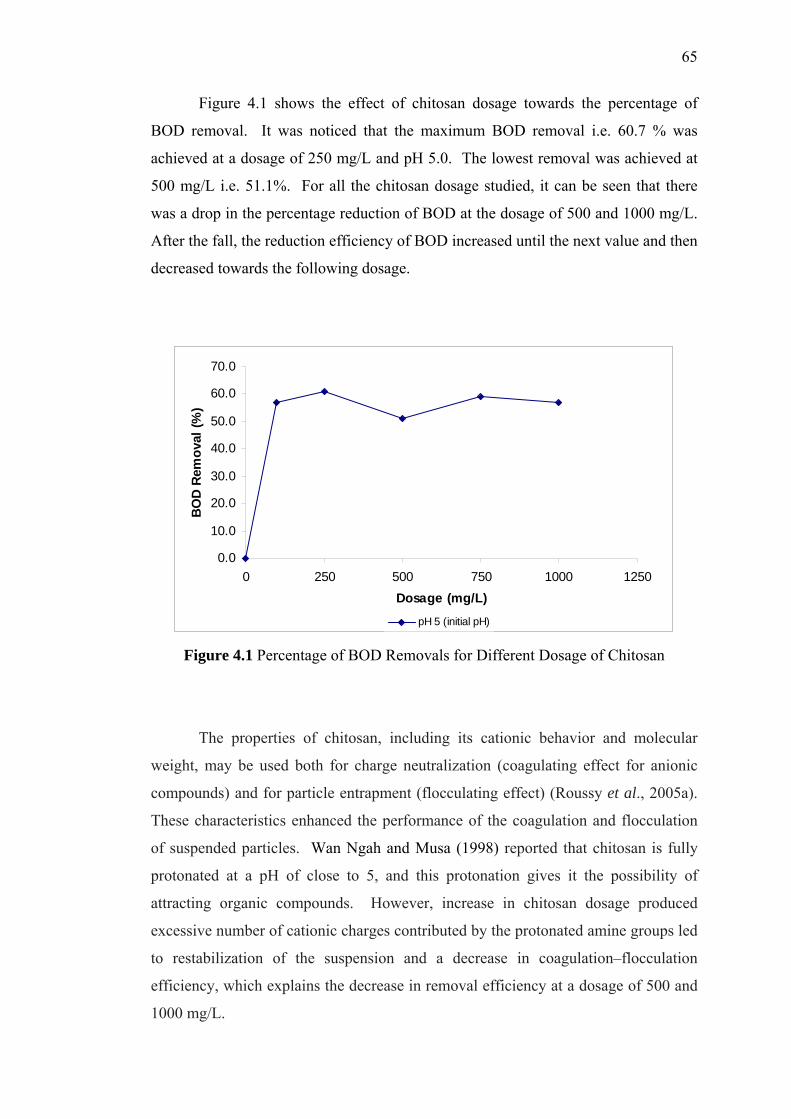
65
Figure 4.1 shows the effect of chitosan dosage towards the percentage of
BOD removal. It was noticed that the maximum BOD removal i.e. 60.7 % was
achieved at a dosage of 250 mg/L and pH 5.0. The lowest removal was achieved at
500 mg/L i.e. 51.1%. For all the chitosan dosage studied, it can be seen that there
was a drop in the percentage reduction of BOD at the dosage of 500 and 1000 mg/L.
After the fall, the reduction efficiency of BOD increased until the next value and then
decreased towards the following dosage.
0.0
10.0
20.0
30.0
40.0
50.0
60.0
70.0
0 250 500 750 1000 1250Dosage (mg/L)
BO
D Re
mov
al (%
)
pH 5 (initial pH)
Figure 4.1 Percentage of BOD Removals for Different Dosage of Chitosan
The properties of chitosan, including its cationic behavior and molecular
weight, may be used both for charge neutralization (coagulating effect for anionic
compounds) and for particle entrapment (flocculating effect) (Roussy et al., 2005a).
These characteristics enhanced the performance of the coagulation and flocculation
of suspended particles. Wan Ngah and Musa (1998) reported that chitosan is fully
protonated at a pH of close to 5, and this protonation gives it the possibility of
attracting organic compounds. However, increase in chitosan dosage produced
excessive number of cationic charges contributed by the protonated amine groups led
to restabilization of the suspension and a decrease in coagulation–flocculation
efficiency, which explains the decrease in removal efficiency at a dosage of 500 and
1000 mg/L.
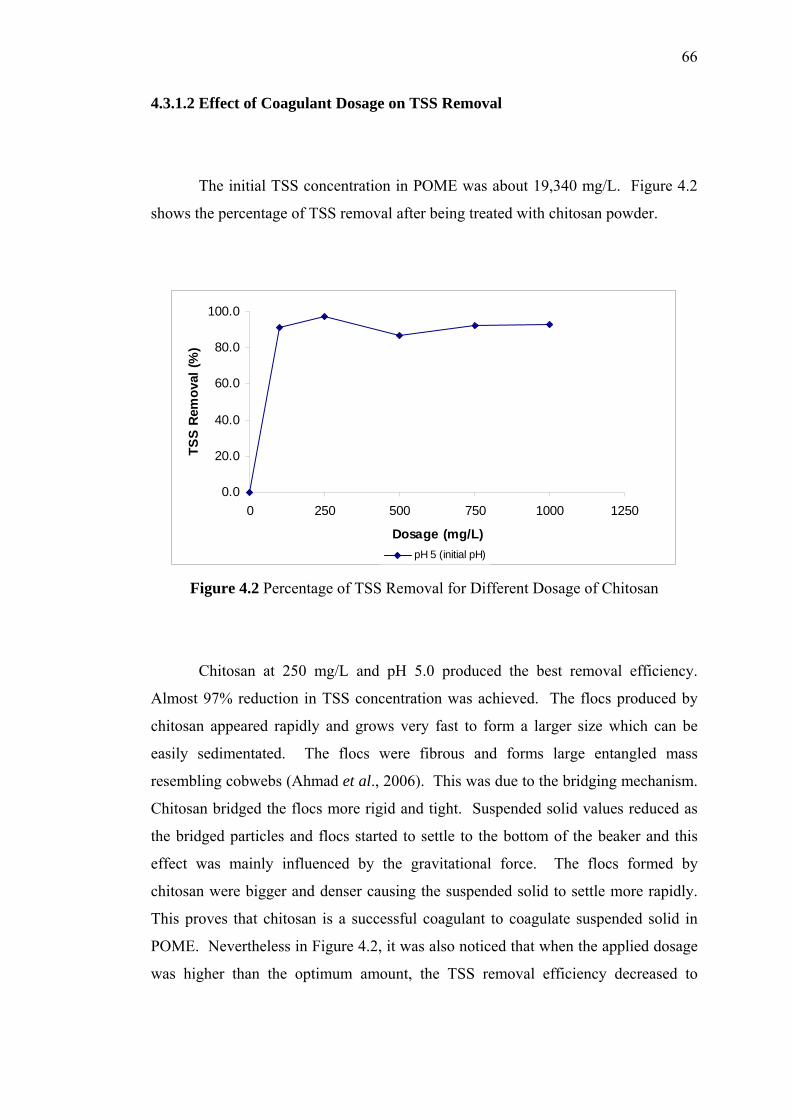
66
4.3.1.2 Effect of Coagulant Dosage on TSS Removal
The initial TSS concentration in POME was about 19,340 mg/L. Figure 4.2
shows the percentage of TSS removal after being treated with chitosan powder.
0.0
20.0
40.0
60.0
80.0
100.0
0 250 500 750 1000 1250
Dosage (mg/L)
TSS
Rem
oval
(%)
pH 5 (initial pH)
Figure 4.2 Percentage of TSS Removal for Different Dosage of Chitosan
Chitosan at 250 mg/L and pH 5.0 produced the best removal efficiency.
Almost 97% reduction in TSS concentration was achieved. The flocs produced by
chitosan appeared rapidly and grows very fast to form a larger size which can be
easily sedimentated. The flocs were fibrous and forms large entangled mass
resembling cobwebs (Ahmad et al., 2006). This was due to the bridging mechanism.
Chitosan bridged the flocs more rigid and tight. Suspended solid values reduced as
the bridged particles and flocs started to settle to the bottom of the beaker and this
effect was mainly influenced by the gravitational force. The flocs formed by
chitosan were bigger and denser causing the suspended solid to settle more rapidly.
This proves that chitosan is a successful coagulant to coagulate suspended solid in
POME. Nevertheless in Figure 4.2, it was also noticed that when the applied dosage
was higher than the optimum amount, the TSS removal efficiency decreased to
67
between 87.2 and 93%. This could be due to restabilization of colloid complex in
POME, thus causing complete charge reversal.
4.3.1.3 Effect of Coagulant Dosage on Turbidity Removal
Figure 4.3 shows the percentage of turbidity removal at different chitosan
dosages.
0
20
40
60
80
100
0 250 500 750 1000 1250Dosage (mg/L)
Turb
idity
Rem
oval
(%)
pH 5 (initial pH)
Figure 4.3 Percentage of Turbidity Removal for Different Dosage of Chitosan
The initial POME turbidity value was about 6548 NTU. After treatment with
250 mg/L chitosan at initial pH, the value decreased to 424 NTU i.e. 93.5% turbidity
removal which was the maximum removal efficiency. Figure 4.3 shows that the
turbidity removal and TSS reduction trends were similar to each other. Turbidity
analysis represents the suspended solid removal in POME. At higher chitosan
dosage i.e. 500 mg/L and initial pH, the removal efficiencies were slightly lower i.e.
79.6%.
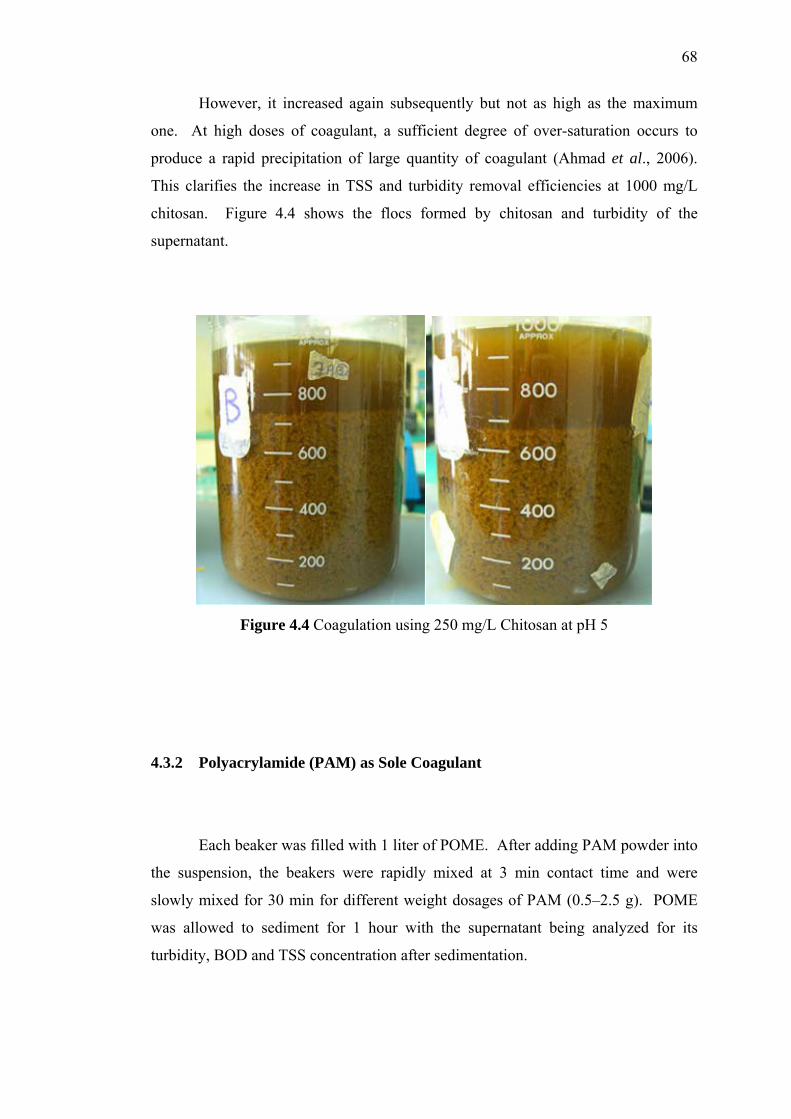
68
However, it increased again subsequently but not as high as the maximum
one. At high doses of coagulant, a sufficient degree of over-saturation occurs to
produce a rapid precipitation of large quantity of coagulant (Ahmad et al., 2006).
This clarifies the increase in TSS and turbidity removal efficiencies at 1000 mg/L
chitosan. Figure 4.4 shows the flocs formed by chitosan and turbidity of the
supernatant.
Figure 4.4 Coagulation using 250 mg/L Chitosan at pH 5
4.3.2 Polyacrylamide (PAM) as Sole Coagulant
Each beaker was filled with 1 liter of POME. After adding PAM powder into
the suspension, the beakers were rapidly mixed at 3 min contact time and were
slowly mixed for 30 min for different weight dosages of PAM (0.5–2.5 g). POME
was allowed to sediment for 1 hour with the supernatant being analyzed for its
turbidity, BOD and TSS concentration after sedimentation.
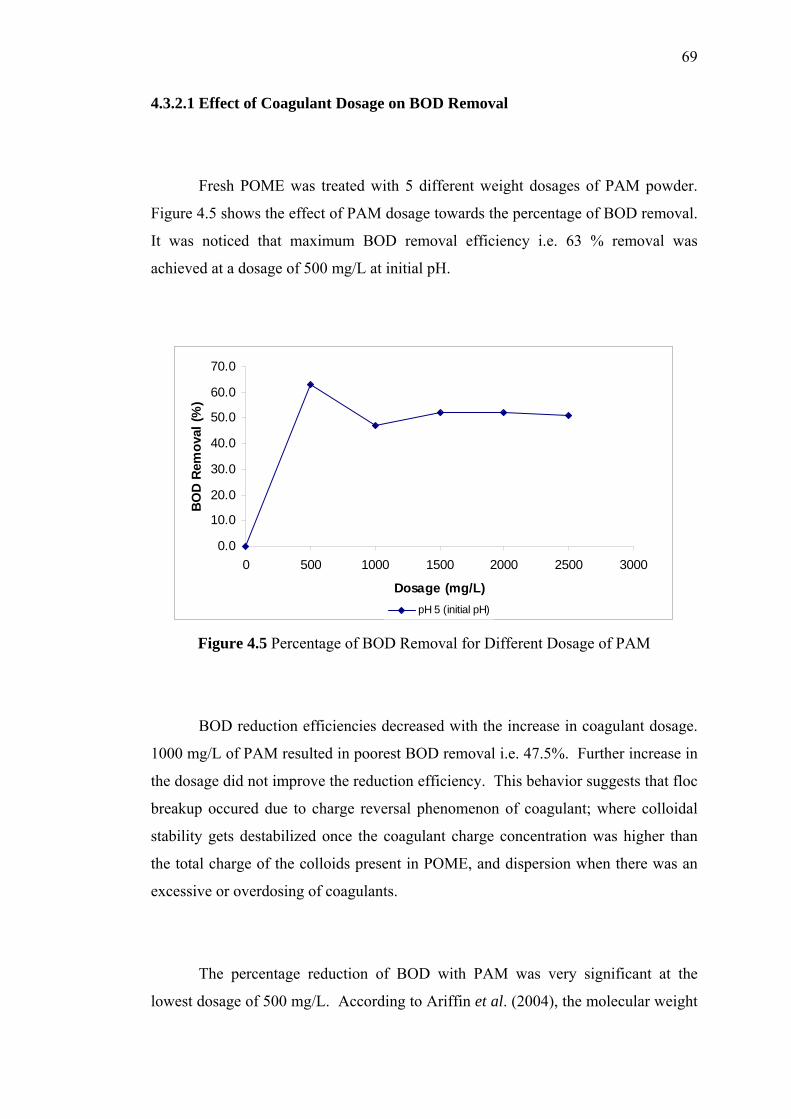
69
4.3.2.1 Effect of Coagulant Dosage on BOD Removal
Fresh POME was treated with 5 different weight dosages of PAM powder.
Figure 4.5 shows the effect of PAM dosage towards the percentage of BOD removal.
It was noticed that maximum BOD removal efficiency i.e. 63 % removal was
achieved at a dosage of 500 mg/L at initial pH.
0.0
10.0
20.0
30.0
40.0
50.0
60.0
70.0
0 500 1000 1500 2000 2500 3000
Dosage (mg/L)
BO
D Re
mov
al (%
)
pH 5 (initial pH)
Figure 4.5 Percentage of BOD Removal for Different Dosage of PAM
BOD reduction efficiencies decreased with the increase in coagulant dosage.
1000 mg/L of PAM resulted in poorest BOD removal i.e. 47.5%. Further increase in
the dosage did not improve the reduction efficiency. This behavior suggests that floc
breakup occured due to charge reversal phenomenon of coagulant; where colloidal
stability gets destabilized once the coagulant charge concentration was higher than
the total charge of the colloids present in POME, and dispersion when there was an
excessive or overdosing of coagulants.
The percentage reduction of BOD with PAM was very significant at the
lowest dosage of 500 mg/L. According to Ariffin et al. (2004), the molecular weight
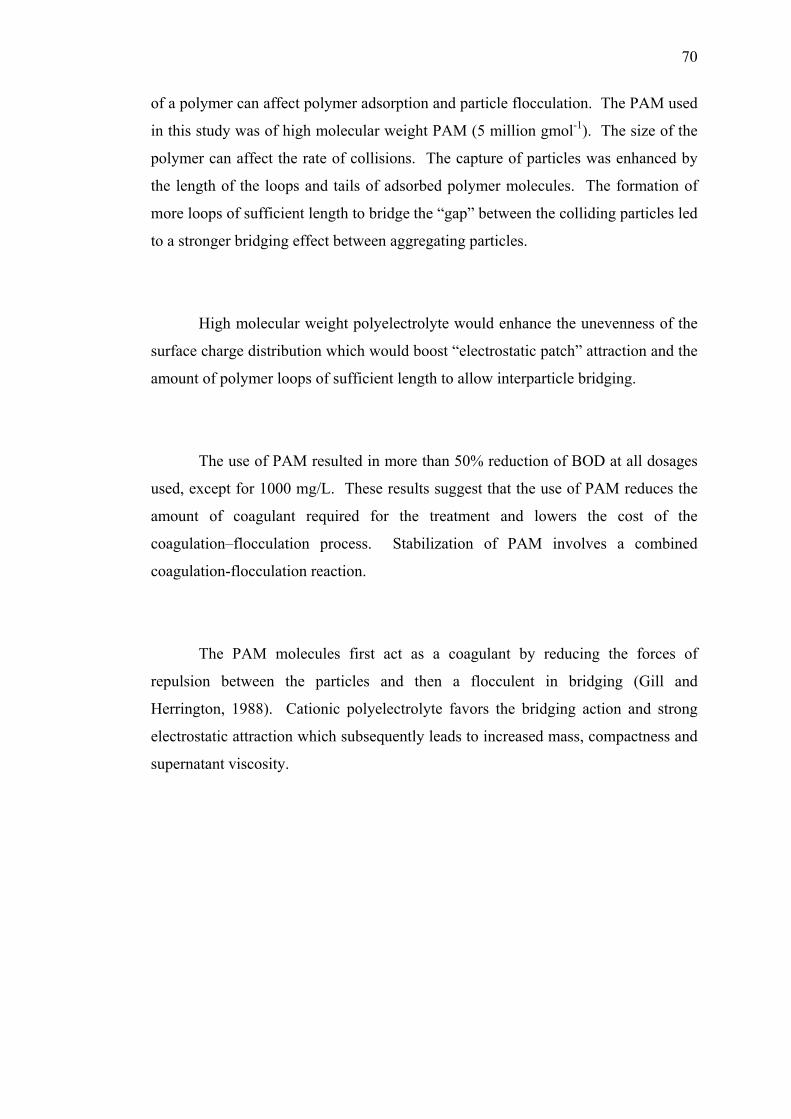
70
of a polymer can affect polymer adsorption and particle flocculation. The PAM used
in this study was of high molecular weight PAM (5 million gmol-1). The size of the
polymer can affect the rate of collisions. The capture of particles was enhanced by
the length of the loops and tails of adsorbed polymer molecules. The formation of
more loops of sufficient length to bridge the “gap” between the colliding particles led
to a stronger bridging effect between aggregating particles.
High molecular weight polyelectrolyte would enhance the unevenness of the
surface charge distribution which would boost “electrostatic patch” attraction and the
amount of polymer loops of sufficient length to allow interparticle bridging.
The use of PAM resulted in more than 50% reduction of BOD at all dosages
used, except for 1000 mg/L. These results suggest that the use of PAM reduces the
amount of coagulant required for the treatment and lowers the cost of the
coagulation–flocculation process. Stabilization of PAM involves a combined
coagulation-flocculation reaction.
The PAM molecules first act as a coagulant by reducing the forces of
repulsion between the particles and then a flocculent in bridging (Gill and
Herrington, 1988). Cationic polyelectrolyte favors the bridging action and strong
electrostatic attraction which subsequently leads to increased mass, compactness and
supernatant viscosity.
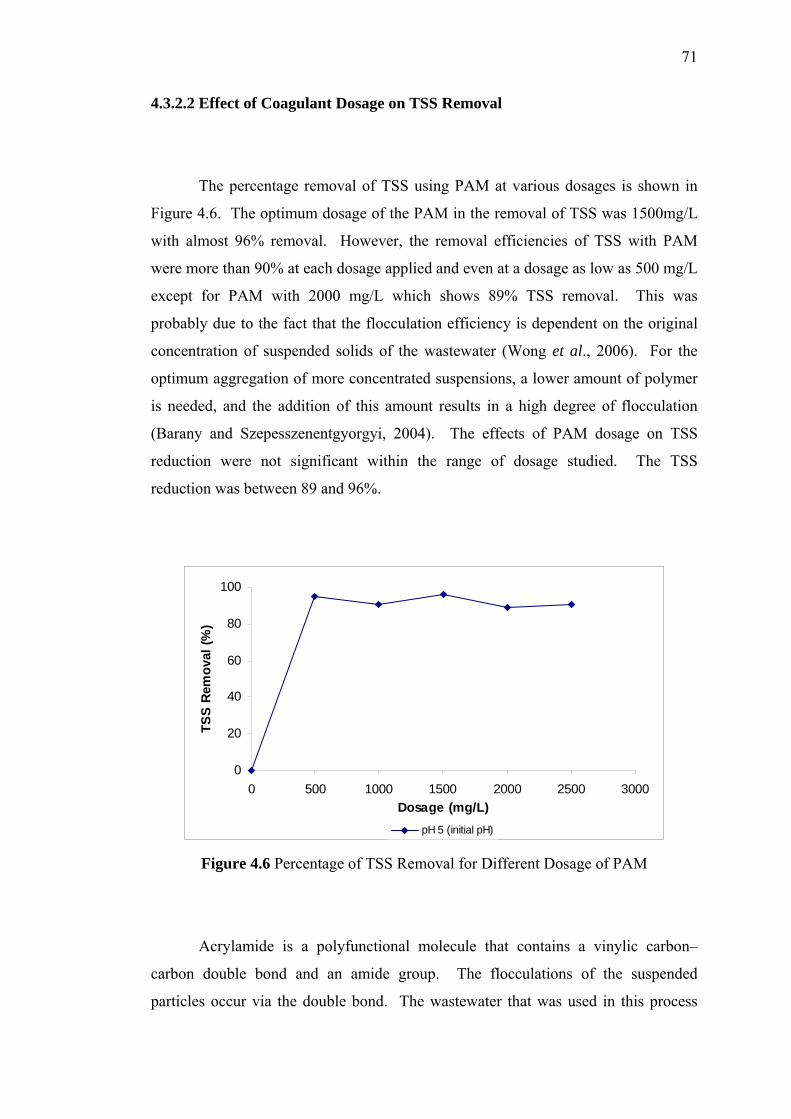
71
4.3.2.2 Effect of Coagulant Dosage on TSS Removal
The percentage removal of TSS using PAM at various dosages is shown in
Figure 4.6. The optimum dosage of the PAM in the removal of TSS was 1500mg/L
with almost 96% removal. However, the removal efficiencies of TSS with PAM
were more than 90% at each dosage applied and even at a dosage as low as 500 mg/L
except for PAM with 2000 mg/L which shows 89% TSS removal. This was
probably due to the fact that the flocculation efficiency is dependent on the original
concentration of suspended solids of the wastewater (Wong et al., 2006). For the
optimum aggregation of more concentrated suspensions, a lower amount of polymer
is needed, and the addition of this amount results in a high degree of flocculation
(Barany and Szepesszenentgyorgyi, 2004). The effects of PAM dosage on TSS
reduction were not significant within the range of dosage studied. The TSS
reduction was between 89 and 96%.
0
20
40
60
80
100
0 500 1000 1500 2000 2500 3000Dosage (mg/L)
TSS
Rem
oval
(%)
pH 5 (initial pH)
Figure 4.6 Percentage of TSS Removal for Different Dosage of PAM
Acrylamide is a polyfunctional molecule that contains a vinylic carbon–
carbon double bond and an amide group. The flocculations of the suspended
particles occur via the double bond. The wastewater that was used in this process
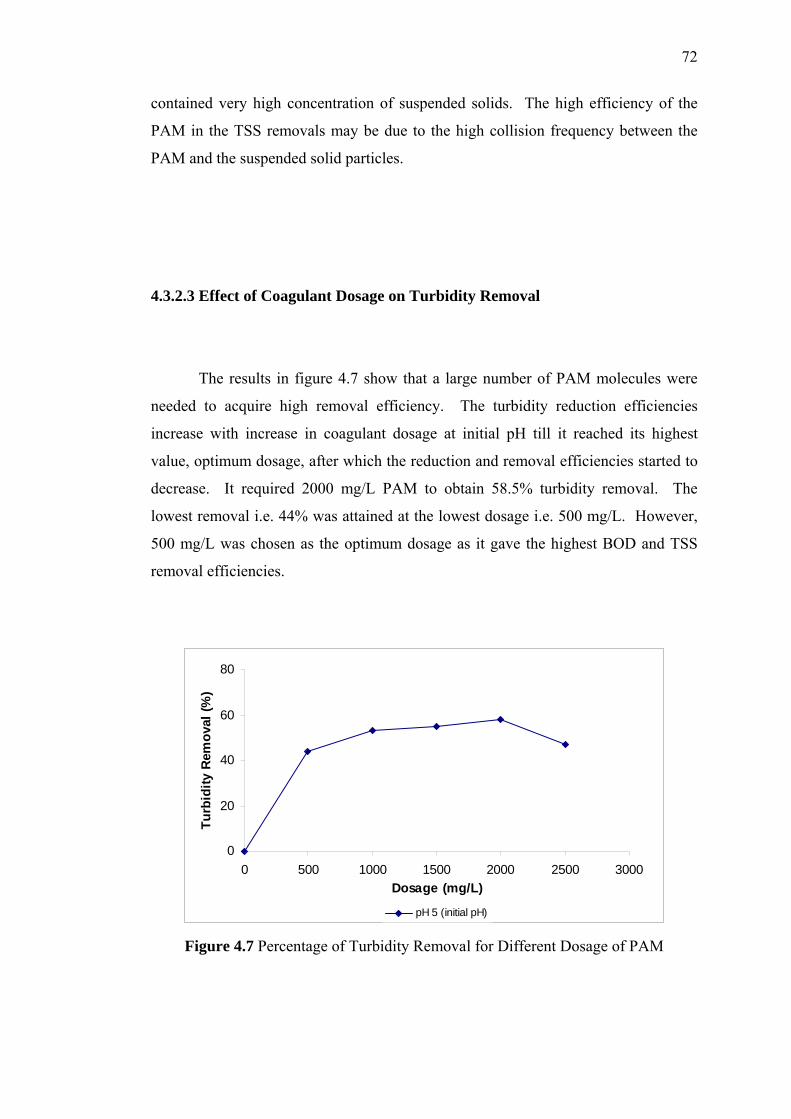
72
contained very high concentration of suspended solids. The high efficiency of the
PAM in the TSS removals may be due to the high collision frequency between the
PAM and the suspended solid particles.
4.3.2.3 Effect of Coagulant Dosage on Turbidity Removal
The results in figure 4.7 show that a large number of PAM molecules were
needed to acquire high removal efficiency. The turbidity reduction efficiencies
increase with increase in coagulant dosage at initial pH till it reached its highest
value, optimum dosage, after which the reduction and removal efficiencies started to
decrease. It required 2000 mg/L PAM to obtain 58.5% turbidity removal. The
lowest removal i.e. 44% was attained at the lowest dosage i.e. 500 mg/L. However,
500 mg/L was chosen as the optimum dosage as it gave the highest BOD and TSS
removal efficiencies.
0
20
40
60
80
0 500 1000 1500 2000 2500 3000Dosage (mg/L)
Turb
idity
Rem
oval
(%)
pH 5 (initial pH)
Figure 4.7 Percentage of Turbidity Removal for Different Dosage of PAM
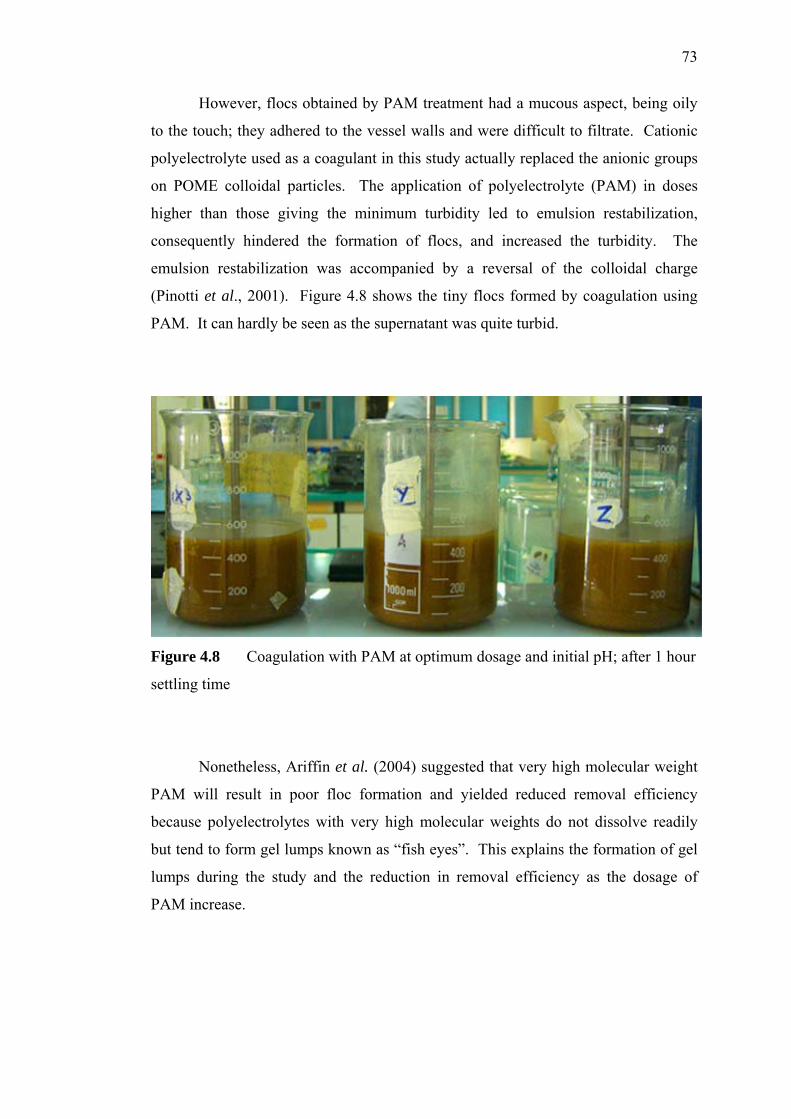
73
However, flocs obtained by PAM treatment had a mucous aspect, being oily
to the touch; they adhered to the vessel walls and were difficult to filtrate. Cationic
polyelectrolyte used as a coagulant in this study actually replaced the anionic groups
on POME colloidal particles. The application of polyelectrolyte (PAM) in doses
higher than those giving the minimum turbidity led to emulsion restabilization,
consequently hindered the formation of flocs, and increased the turbidity. The
emulsion restabilization was accompanied by a reversal of the colloidal charge
(Pinotti et al., 2001). Figure 4.8 shows the tiny flocs formed by coagulation using
PAM. It can hardly be seen as the supernatant was quite turbid.
Figure 4.8 Coagulation with PAM at optimum dosage and initial pH; after 1 hour
settling time
Nonetheless, Ariffin et al. (2004) suggested that very high molecular weight
PAM will result in poor floc formation and yielded reduced removal efficiency
because polyelectrolytes with very high molecular weights do not dissolve readily
but tend to form gel lumps known as “fish eyes”. This explains the formation of gel
lumps during the study and the reduction in removal efficiency as the dosage of
PAM increase.
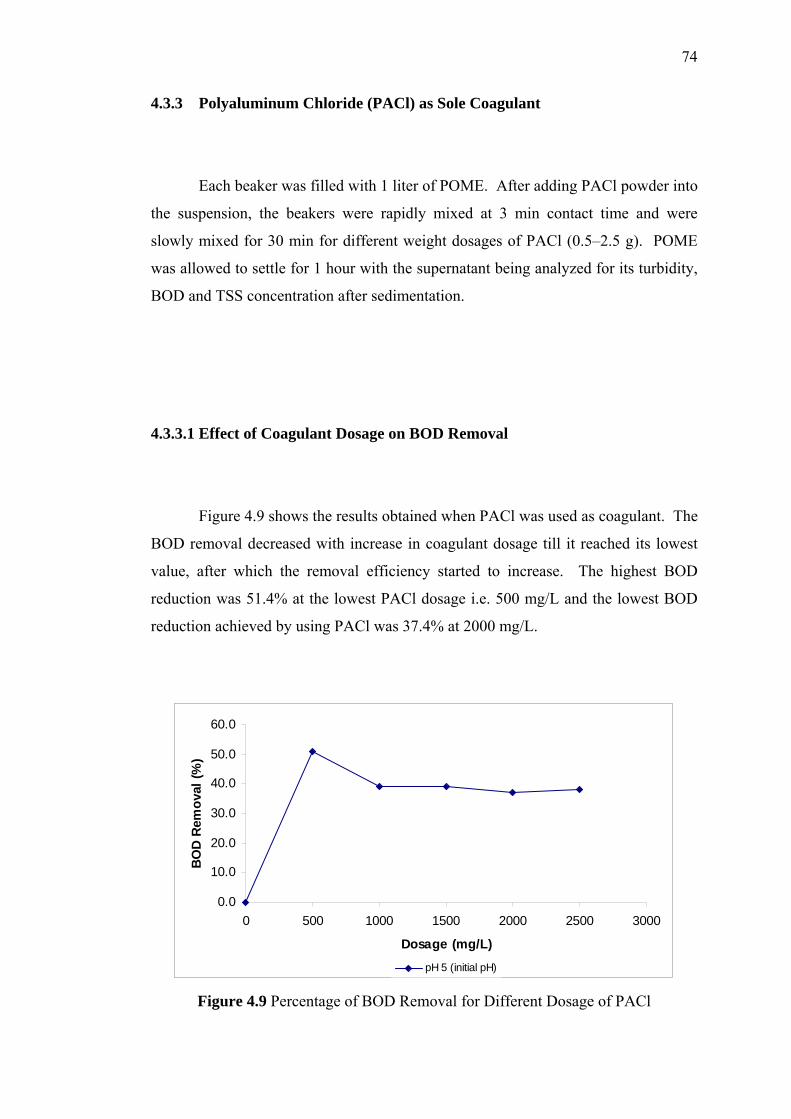
74
4.3.3 Polyaluminum Chloride (PACl) as Sole Coagulant
Each beaker was filled with 1 liter of POME. After adding PACl powder into
the suspension, the beakers were rapidly mixed at 3 min contact time and were
slowly mixed for 30 min for different weight dosages of PACl (0.5–2.5 g). POME
was allowed to settle for 1 hour with the supernatant being analyzed for its turbidity,
BOD and TSS concentration after sedimentation.
4.3.3.1 Effect of Coagulant Dosage on BOD Removal
Figure 4.9 shows the results obtained when PACl was used as coagulant. The
BOD removal decreased with increase in coagulant dosage till it reached its lowest
value, after which the removal efficiency started to increase. The highest BOD
reduction was 51.4% at the lowest PACl dosage i.e. 500 mg/L and the lowest BOD
reduction achieved by using PACl was 37.4% at 2000 mg/L.
0.0
10.0
20.0
30.0
40.0
50.0
60.0
0 500 1000 1500 2000 2500 3000
Dosage (mg/L)
BOD
Rem
oval
(%)
pH 5 (initial pH)
Figure 4.9 Percentage of BOD Removal for Different Dosage of PACl
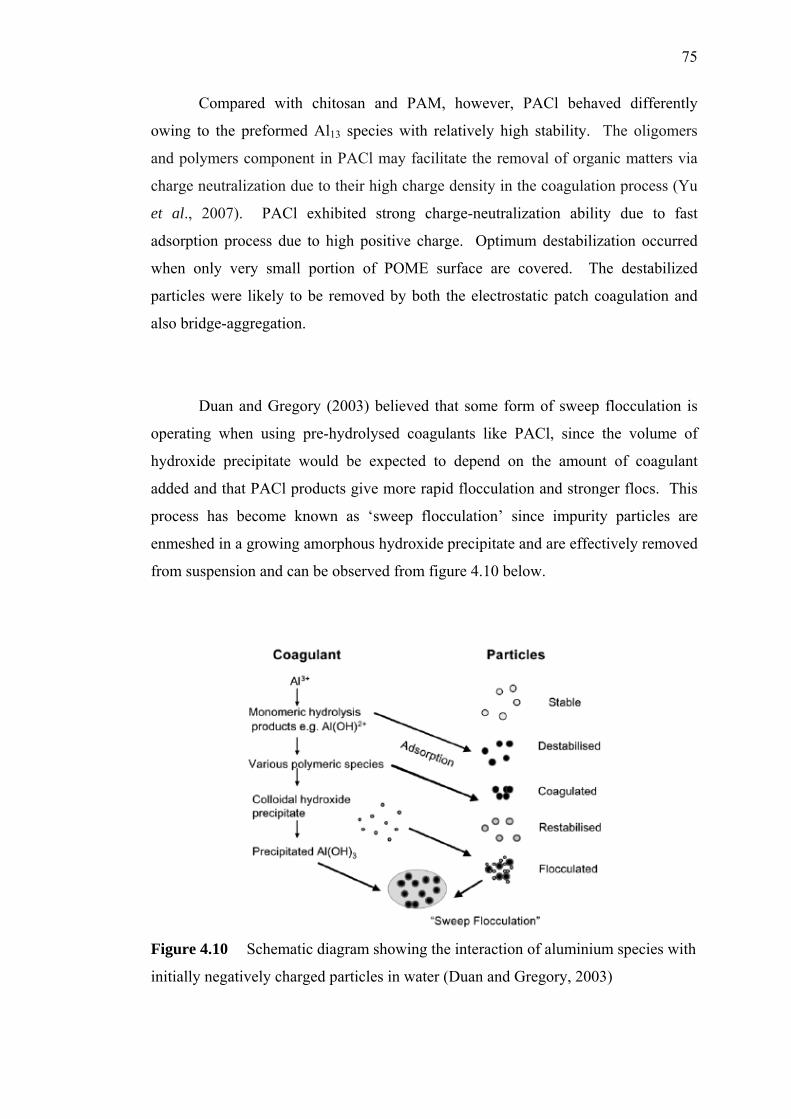
75
Compared with chitosan and PAM, however, PACl behaved differently
owing to the preformed Al13 species with relatively high stability. The oligomers
and polymers component in PACl may facilitate the removal of organic matters via
charge neutralization due to their high charge density in the coagulation process (Yu
et al., 2007). PACl exhibited strong charge-neutralization ability due to fast
adsorption process due to high positive charge. Optimum destabilization occurred
when only very small portion of POME surface are covered. The destabilized
particles were likely to be removed by both the electrostatic patch coagulation and
also bridge-aggregation.
Duan and Gregory (2003) believed that some form of sweep flocculation is
operating when using pre-hydrolysed coagulants like PACl, since the volume of
hydroxide precipitate would be expected to depend on the amount of coagulant
added and that PACl products give more rapid flocculation and stronger flocs. This
process has become known as ‘sweep flocculation’ since impurity particles are
enmeshed in a growing amorphous hydroxide precipitate and are effectively removed
from suspension and can be observed from figure 4.10 below.
Figure 4.10 Schematic diagram showing the interaction of aluminium species with
initially negatively charged particles in water (Duan and Gregory, 2003)
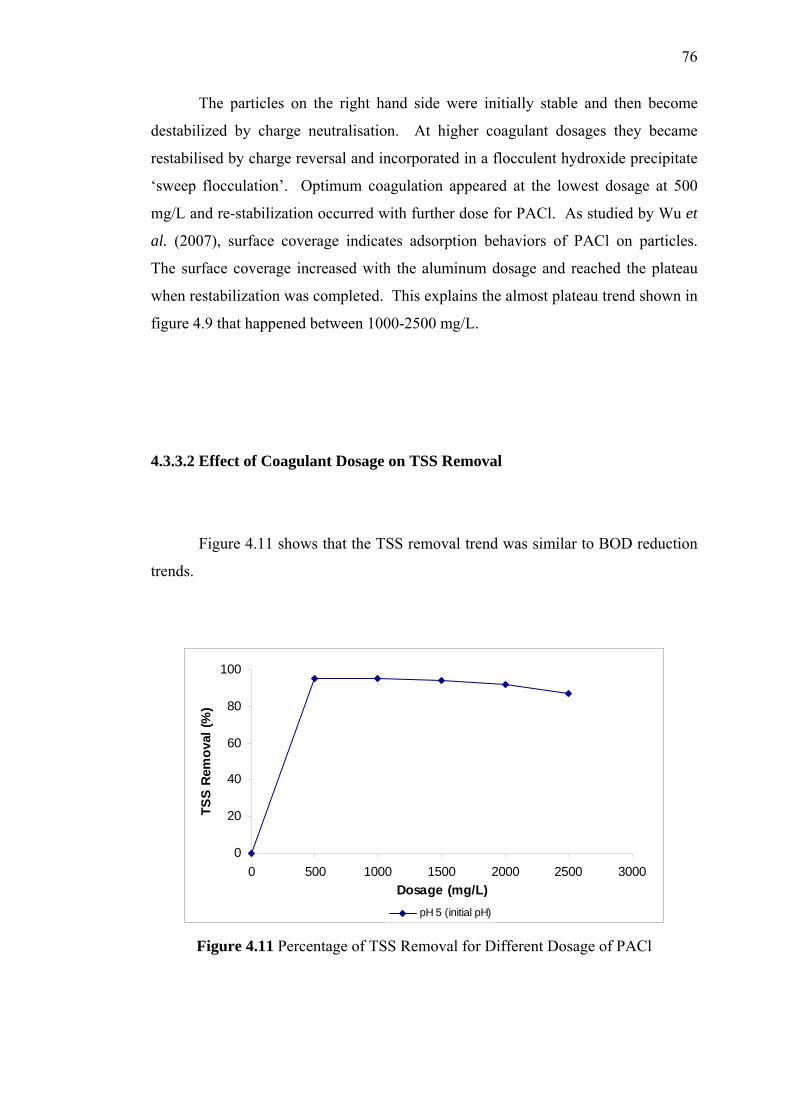
76
The particles on the right hand side were initially stable and then become
destabilized by charge neutralisation. At higher coagulant dosages they became
restabilised by charge reversal and incorporated in a flocculent hydroxide precipitate
‘sweep flocculation’. Optimum coagulation appeared at the lowest dosage at 500
mg/L and re-stabilization occurred with further dose for PACl. As studied by Wu et
al. (2007), surface coverage indicates adsorption behaviors of PACl on particles.
The surface coverage increased with the aluminum dosage and reached the plateau
when restabilization was completed. This explains the almost plateau trend shown in
figure 4.9 that happened between 1000-2500 mg/L.
4.3.3.2 Effect of Coagulant Dosage on TSS Removal
Figure 4.11 shows that the TSS removal trend was similar to BOD reduction
trends.
0
20
40
60
80
100
0 500 1000 1500 2000 2500 3000Dosage (mg/L)
TSS
Rem
oval
(%)
pH 5 (initial pH)
Figure 4.11 Percentage of TSS Removal for Different Dosage of PACl
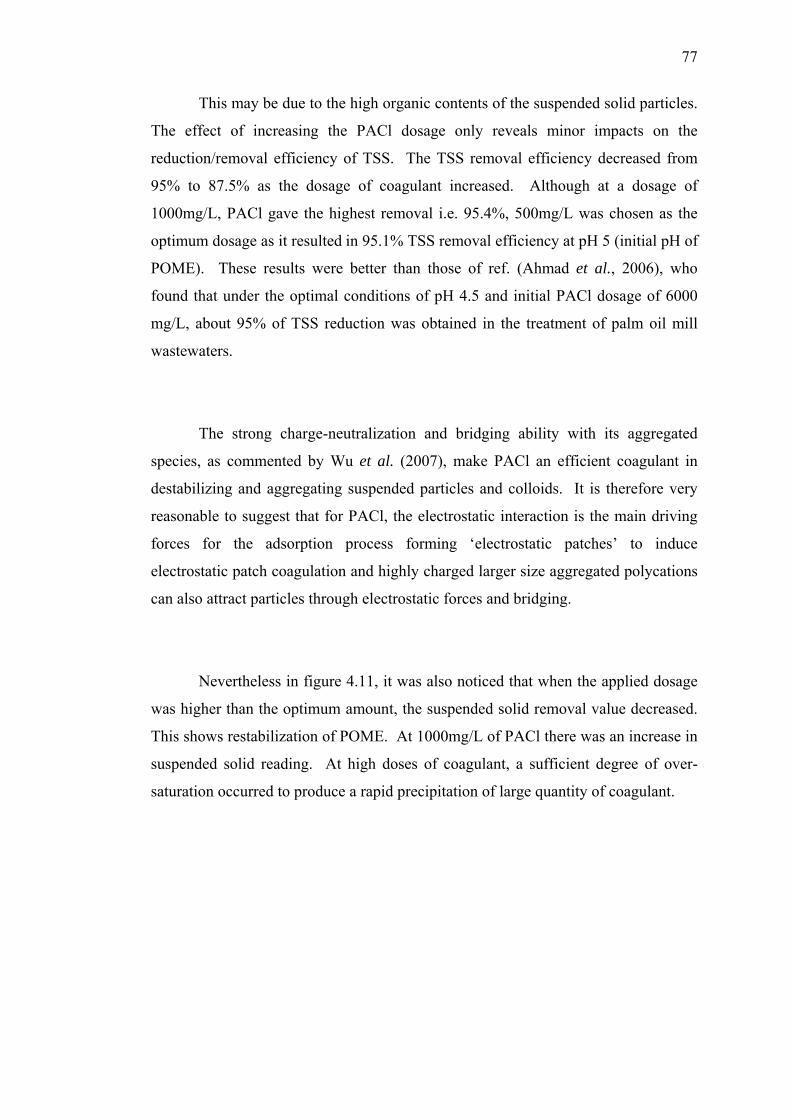
77
This may be due to the high organic contents of the suspended solid particles.
The effect of increasing the PACl dosage only reveals minor impacts on the
reduction/removal efficiency of TSS. The TSS removal efficiency decreased from
95% to 87.5% as the dosage of coagulant increased. Although at a dosage of
1000mg/L, PACl gave the highest removal i.e. 95.4%, 500mg/L was chosen as the
optimum dosage as it resulted in 95.1% TSS removal efficiency at pH 5 (initial pH of
POME). These results were better than those of ref. (Ahmad et al., 2006), who
found that under the optimal conditions of pH 4.5 and initial PACl dosage of 6000
mg/L, about 95% of TSS reduction was obtained in the treatment of palm oil mill
wastewaters.
The strong charge-neutralization and bridging ability with its aggregated
species, as commented by Wu et al. (2007), make PACl an efficient coagulant in
destabilizing and aggregating suspended particles and colloids. It is therefore very
reasonable to suggest that for PACl, the electrostatic interaction is the main driving
forces for the adsorption process forming ‘electrostatic patches’ to induce
electrostatic patch coagulation and highly charged larger size aggregated polycations
can also attract particles through electrostatic forces and bridging.
Nevertheless in figure 4.11, it was also noticed that when the applied dosage
was higher than the optimum amount, the suspended solid removal value decreased.
This shows restabilization of POME. At 1000mg/L of PACl there was an increase in
suspended solid reading. At high doses of coagulant, a sufficient degree of over-
saturation occurred to produce a rapid precipitation of large quantity of coagulant.
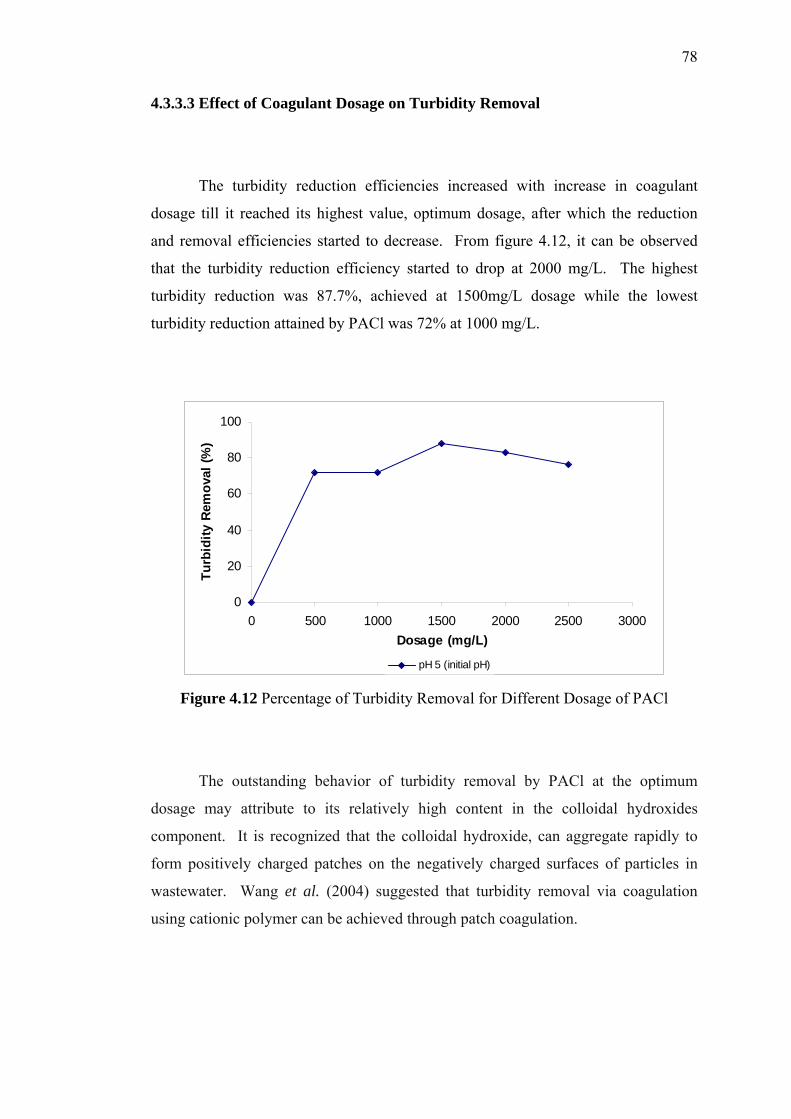
78
4.3.3.3 Effect of Coagulant Dosage on Turbidity Removal
The turbidity reduction efficiencies increased with increase in coagulant
dosage till it reached its highest value, optimum dosage, after which the reduction
and removal efficiencies started to decrease. From figure 4.12, it can be observed
that the turbidity reduction efficiency started to drop at 2000 mg/L. The highest
turbidity reduction was 87.7%, achieved at 1500mg/L dosage while the lowest
turbidity reduction attained by PACl was 72% at 1000 mg/L.
0
20
40
60
80
100
0 500 1000 1500 2000 2500 3000Dosage (mg/L)
Turb
idity
Rem
oval
(%)
pH 5 (initial pH)
Figure 4.12 Percentage of Turbidity Removal for Different Dosage of PACl
The outstanding behavior of turbidity removal by PACl at the optimum
dosage may attribute to its relatively high content in the colloidal hydroxides
component. It is recognized that the colloidal hydroxide, can aggregate rapidly to
form positively charged patches on the negatively charged surfaces of particles in
wastewater. Wang et al. (2004) suggested that turbidity removal via coagulation
using cationic polymer can be achieved through patch coagulation.
79
Wu et al. (2007) commented that the electrostatic patch coagulation and
bridge- aggregation can be used to explain the effective turbidity removal of PACl.
As the dose of PACl increased further, restabilization appeared after the maximum
turbidity removal. It was implied that particles repelled to each other due to the
strong electrostatic repulsion forces caused by adsorbed polycations.
Although the flocs formed by PACl were large and dense, as can be seen in
figure 4.13, the flocs that have been formed by PACl seemed to be easily dispersed
in the sample. The breakage of the flocs caused the sample to be turbid again. This
indirectly caused the suspended solid to disperse in the sample. Therefore, it is
clearly noticed that PACl acts only as a coagulant which flocs the suspended solid in
POME and settled it by gravity settling.
Figure 4.13 Coagulation with PACl at optimum dosage and initial pH
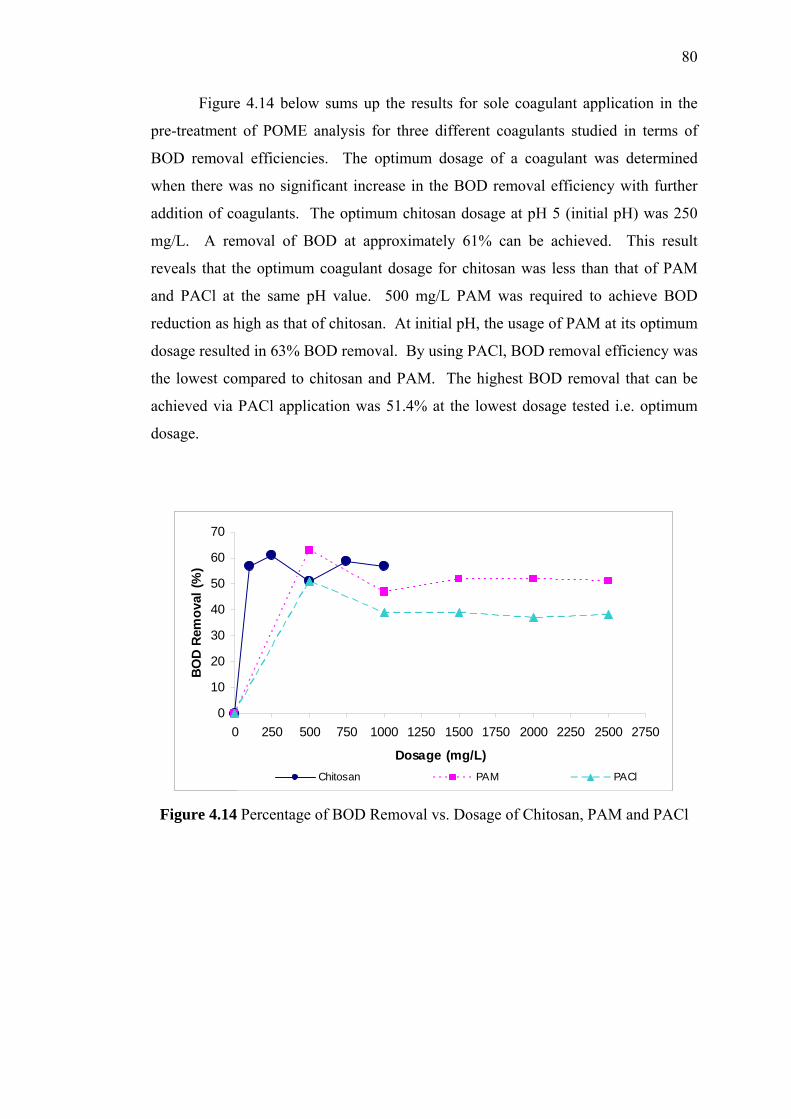
80
Figure 4.14 below sums up the results for sole coagulant application in the
pre-treatment of POME analysis for three different coagulants studied in terms of
BOD removal efficiencies. The optimum dosage of a coagulant was determined
when there was no significant increase in the BOD removal efficiency with further
addition of coagulants. The optimum chitosan dosage at pH 5 (initial pH) was 250
mg/L. A removal of BOD at approximately 61% can be achieved. This result
reveals that the optimum coagulant dosage for chitosan was less than that of PAM
and PACl at the same pH value. 500 mg/L PAM was required to achieve BOD
reduction as high as that of chitosan. At initial pH, the usage of PAM at its optimum
dosage resulted in 63% BOD removal. By using PACl, BOD removal efficiency was
the lowest compared to chitosan and PAM. The highest BOD removal that can be
achieved via PACl application was 51.4% at the lowest dosage tested i.e. optimum
dosage.
0
10
20
30
40
50
60
70
0 250 500 750 1000 1250 1500 1750 2000 2250 2500 2750
Dosage (mg/L)
BOD
Rem
oval
(%)
Chitosan PAM PACl
Figure 4.14 Percentage of BOD Removal vs. Dosage of Chitosan, PAM and PACl
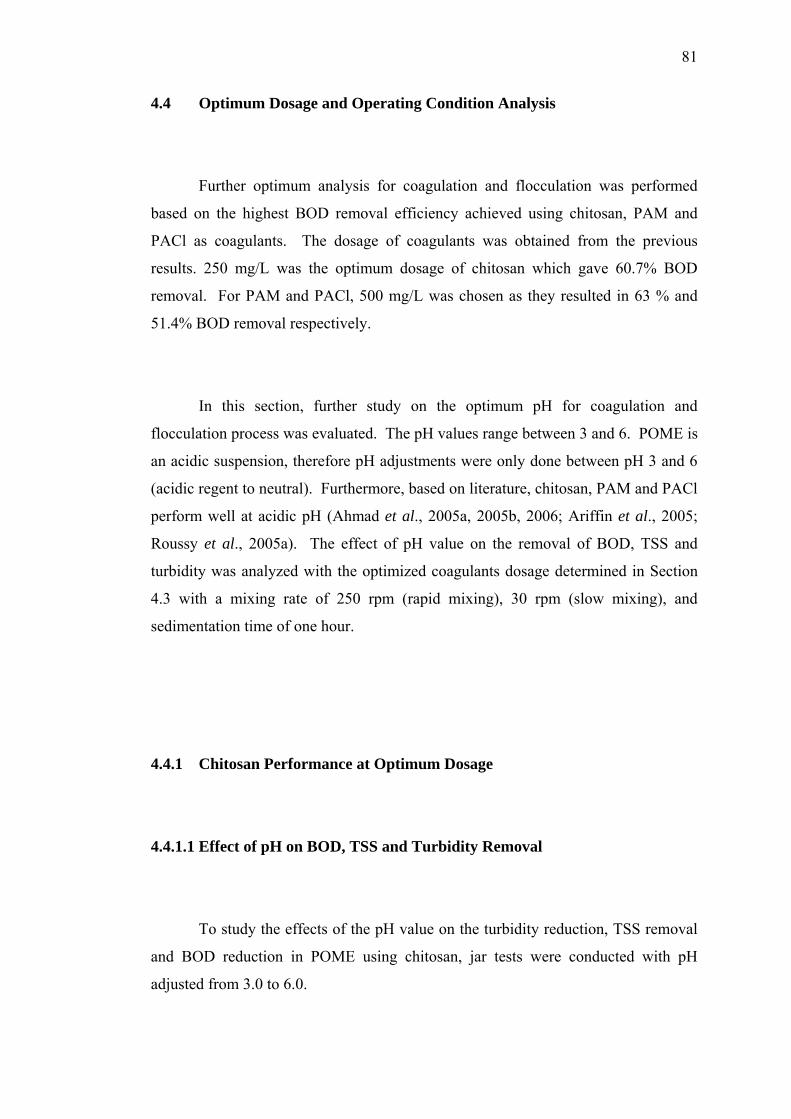
81
4.4 Optimum Dosage and Operating Condition Analysis
Further optimum analysis for coagulation and flocculation was performed
based on the highest BOD removal efficiency achieved using chitosan, PAM and
PACl as coagulants. The dosage of coagulants was obtained from the previous
results. 250 mg/L was the optimum dosage of chitosan which gave 60.7% BOD
removal. For PAM and PACl, 500 mg/L was chosen as they resulted in 63 % and
51.4% BOD removal respectively.
In this section, further study on the optimum pH for coagulation and
flocculation process was evaluated. The pH values range between 3 and 6. POME is
an acidic suspension, therefore pH adjustments were only done between pH 3 and 6
(acidic regent to neutral). Furthermore, based on literature, chitosan, PAM and PACl
perform well at acidic pH (Ahmad et al., 2005a, 2005b, 2006; Ariffin et al., 2005;
Roussy et al., 2005a). The effect of pH value on the removal of BOD, TSS and
turbidity was analyzed with the optimized coagulants dosage determined in Section
4.3 with a mixing rate of 250 rpm (rapid mixing), 30 rpm (slow mixing), and
sedimentation time of one hour.
4.4.1 Chitosan Performance at Optimum Dosage
4.4.1.1 Effect of pH on BOD, TSS and Turbidity Removal
To study the effects of the pH value on the turbidity reduction, TSS removal
and BOD reduction in POME using chitosan, jar tests were conducted with pH
adjusted from 3.0 to 6.0.
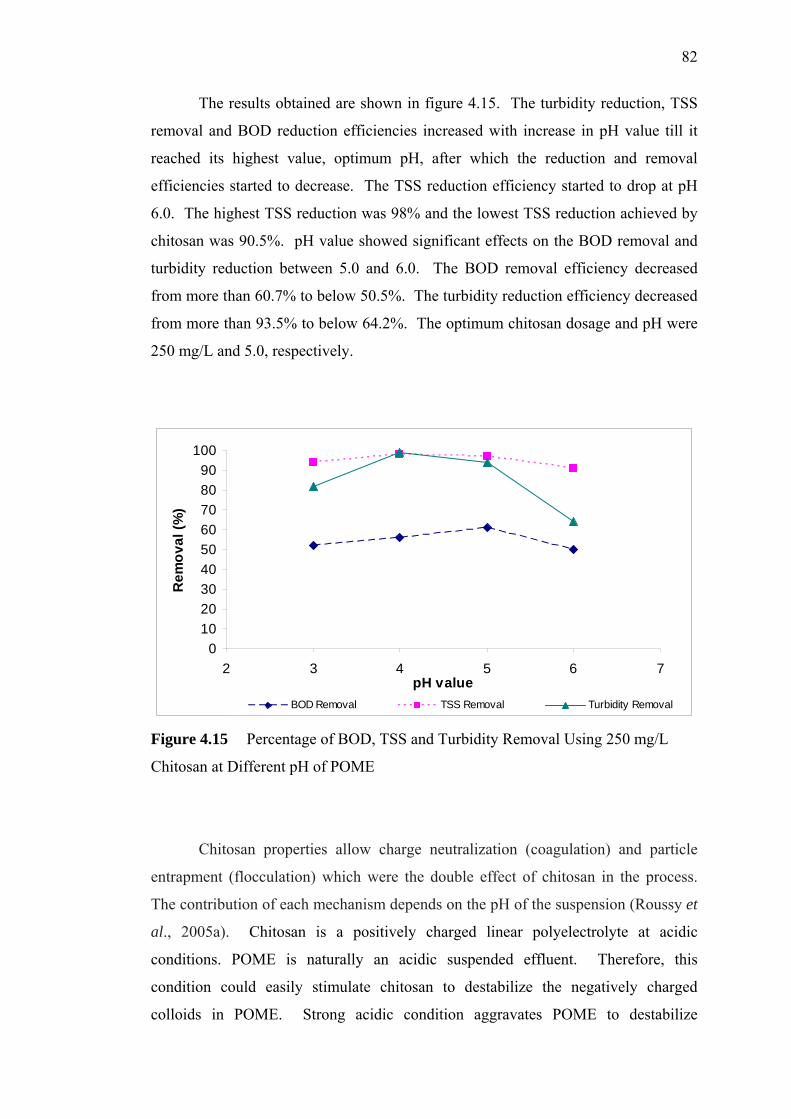
82
The results obtained are shown in figure 4.15. The turbidity reduction, TSS
removal and BOD reduction efficiencies increased with increase in pH value till it
reached its highest value, optimum pH, after which the reduction and removal
efficiencies started to decrease. The TSS reduction efficiency started to drop at pH
6.0. The highest TSS reduction was 98% and the lowest TSS reduction achieved by
chitosan was 90.5%. pH value showed significant effects on the BOD removal and
turbidity reduction between 5.0 and 6.0. The BOD removal efficiency decreased
from more than 60.7% to below 50.5%. The turbidity reduction efficiency decreased
from more than 93.5% to below 64.2%. The optimum chitosan dosage and pH were
250 mg/L and 5.0, respectively.
0102030405060708090
100
2 3 4 5 6 7pH value
Rem
oval
(%)
BOD Removal TSS Removal Turbidity Removal
Figure 4.15 Percentage of BOD, TSS and Turbidity Removal Using 250 mg/L
Chitosan at Different pH of POME
Chitosan properties allow charge neutralization (coagulation) and particle
entrapment (flocculation) which were the double effect of chitosan in the process.
The contribution of each mechanism depends on the pH of the suspension (Roussy et
al., 2005a). Chitosan is a positively charged linear polyelectrolyte at acidic
conditions. POME is naturally an acidic suspended effluent. Therefore, this
condition could easily stimulate chitosan to destabilize the negatively charged
colloids in POME. Strong acidic condition aggravates POME to destabilize
83
suspended solid in the suspension. Thus, enhances the coagulation of suspended
solids which explains the satisfactory BOD, TSS and turbidity removal between pH 4
and 5. Figure 4.16 shows the clarity of the supernatant after treatment and pH 4
indicates the best turbidity removal as compared to pH 3 and 6.
(a) (b) (c)
Figure 4.16 Supernatant after treatment with chitosan at (a) pH 3, (b) pH 4, and (c)
pH 6
Amine functional group of chitosan which attracts anionic ions to bind and
bridge (Osman and Arof, 2003) helps to coagulate negatively charged colloids in
POME. The protonation of amine groups in chitosan is also responsible for the
polymer dissolving in acidic solutions, with the notable exception of sulfuric acid
solutions (Roussy et al., 2005a). At pH more than 5, BOD, TSS and turbidity
removal efficiency started to decrease. Ahmad et al. (2005b) reported that the
optimum pH for coagulation using chitosan was around 4.0 to 5.0 and that pH 6.0
showed the poorest removal efficiency (Ahmad et al., 2006). The very low
efficiency of chitosan at slightly alkaline pH (pH 6.0) also confirmed that, at least
partial protonation of the biopolymer’s amine groups was required to achieve
efficient coagulation–flocculation of these organic suspensions. At pH 3, the
excessive number of cationic charges contributed by the protonated amine groups led
to restabilization of the suspension and a decrease in coagulation–flocculation
efficiency. Ahmad et al. (2006) reported that chitosan showed more than 95% of
TSS removal at 500 mg/L and pH 4.0. Nevertheless, this study proved that at only
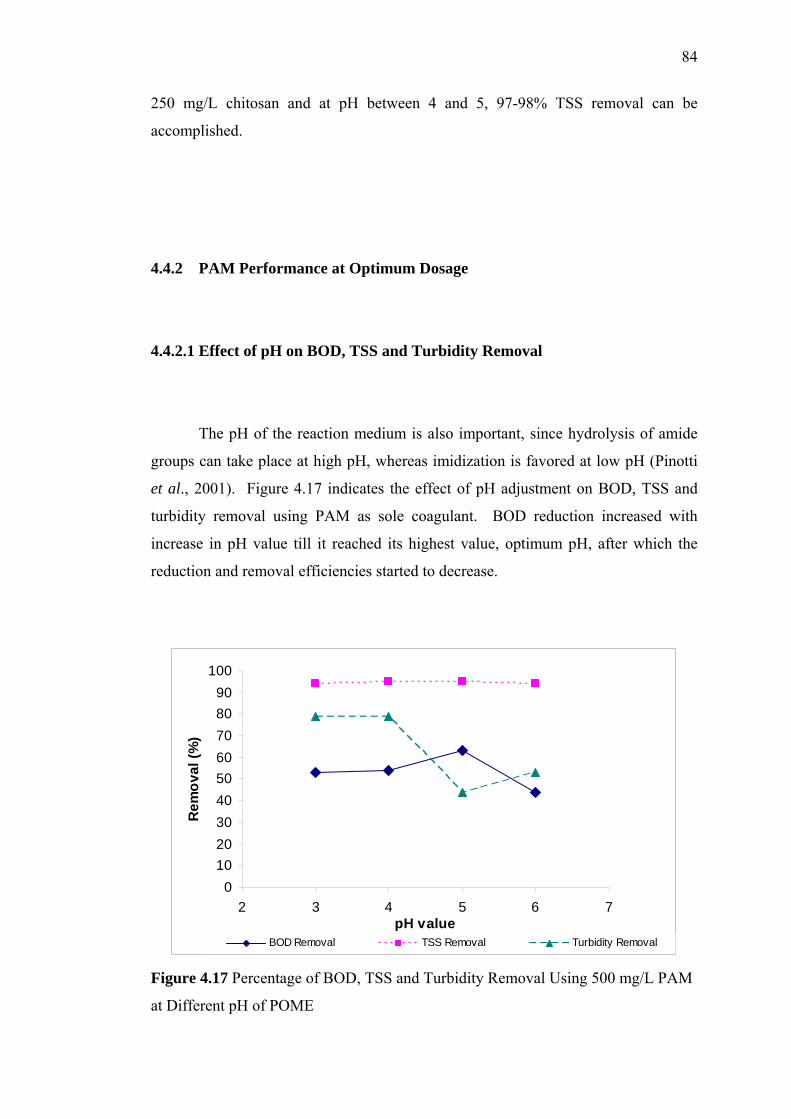
84
250 mg/L chitosan and at pH between 4 and 5, 97-98% TSS removal can be
accomplished.
4.4.2 PAM Performance at Optimum Dosage
4.4.2.1 Effect of pH on BOD, TSS and Turbidity Removal
The pH of the reaction medium is also important, since hydrolysis of amide
groups can take place at high pH, whereas imidization is favored at low pH (Pinotti
et al., 2001). Figure 4.17 indicates the effect of pH adjustment on BOD, TSS and
turbidity removal using PAM as sole coagulant. BOD reduction increased with
increase in pH value till it reached its highest value, optimum pH, after which the
reduction and removal efficiencies started to decrease.
0102030405060708090
100
2 3 4 5 6 7pH value
Rem
oval
(%)
BOD Removal TSS Removal Turbidity Removal
Figure 4.17 Percentage of BOD, TSS and Turbidity Removal Using 500 mg/L PAM
at Different pH of POME
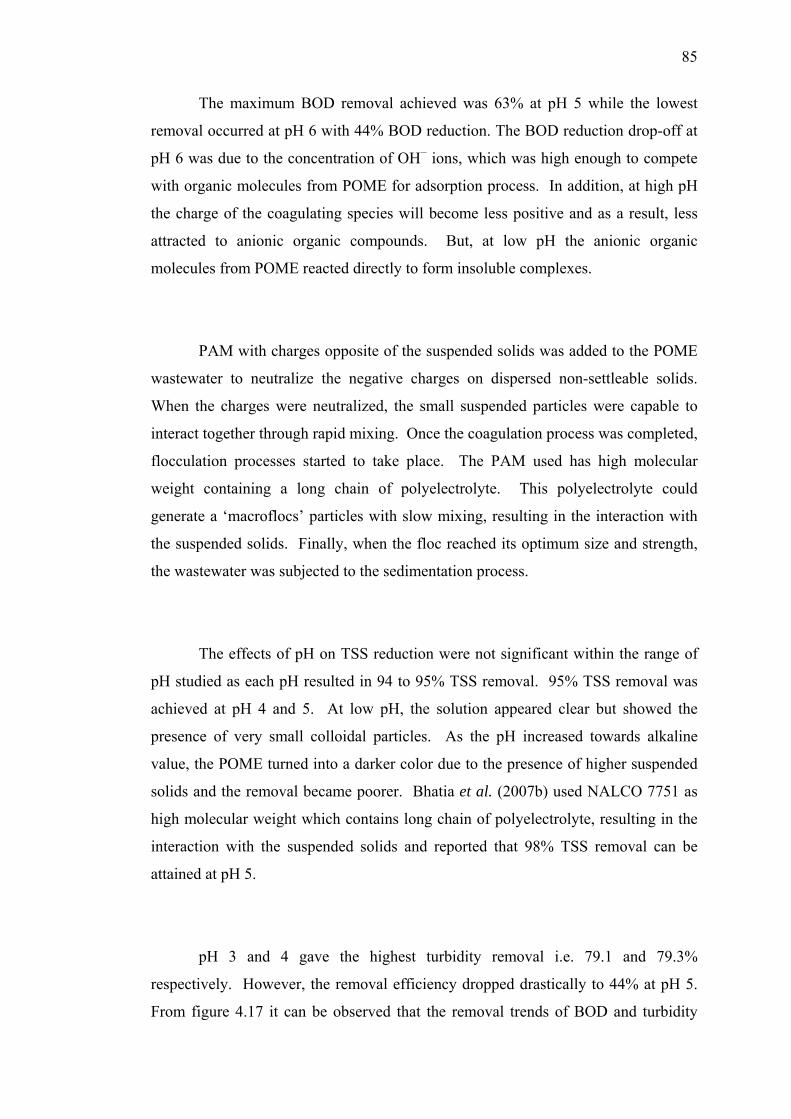
85
The maximum BOD removal achieved was 63% at pH 5 while the lowest
removal occurred at pH 6 with 44% BOD reduction. The BOD reduction drop-off at
pH 6 was due to the concentration of OH− ions, which was high enough to compete
with organic molecules from POME for adsorption process. In addition, at high pH
the charge of the coagulating species will become less positive and as a result, less
attracted to anionic organic compounds. But, at low pH the anionic organic
molecules from POME reacted directly to form insoluble complexes.
PAM with charges opposite of the suspended solids was added to the POME
wastewater to neutralize the negative charges on dispersed non-settleable solids.
When the charges were neutralized, the small suspended particles were capable to
interact together through rapid mixing. Once the coagulation process was completed,
flocculation processes started to take place. The PAM used has high molecular
weight containing a long chain of polyelectrolyte. This polyelectrolyte could
generate a ‘macroflocs’ particles with slow mixing, resulting in the interaction with
the suspended solids. Finally, when the floc reached its optimum size and strength,
the wastewater was subjected to the sedimentation process.
The effects of pH on TSS reduction were not significant within the range of
pH studied as each pH resulted in 94 to 95% TSS removal. 95% TSS removal was
achieved at pH 4 and 5. At low pH, the solution appeared clear but showed the
presence of very small colloidal particles. As the pH increased towards alkaline
value, the POME turned into a darker color due to the presence of higher suspended
solids and the removal became poorer. Bhatia et al. (2007b) used NALCO 7751 as
high molecular weight which contains long chain of polyelectrolyte, resulting in the
interaction with the suspended solids and reported that 98% TSS removal can be
attained at pH 5.
pH 3 and 4 gave the highest turbidity removal i.e. 79.1 and 79.3%
respectively. However, the removal efficiency dropped drastically to 44% at pH 5.
From figure 4.17 it can be observed that the removal trends of BOD and turbidity
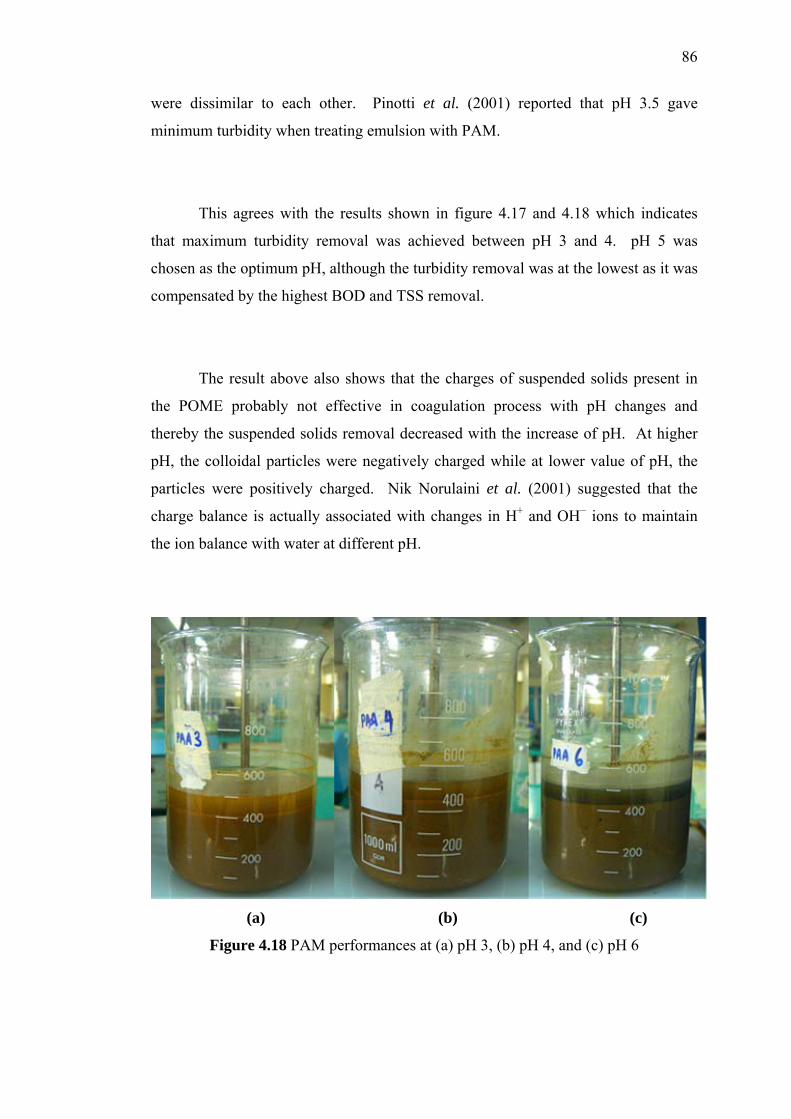
86
were dissimilar to each other. Pinotti et al. (2001) reported that pH 3.5 gave
minimum turbidity when treating emulsion with PAM.
This agrees with the results shown in figure 4.17 and 4.18 which indicates
that maximum turbidity removal was achieved between pH 3 and 4. pH 5 was
chosen as the optimum pH, although the turbidity removal was at the lowest as it was
compensated by the highest BOD and TSS removal.
The result above also shows that the charges of suspended solids present in
the POME probably not effective in coagulation process with pH changes and
thereby the suspended solids removal decreased with the increase of pH. At higher
pH, the colloidal particles were negatively charged while at lower value of pH, the
particles were positively charged. Nik Norulaini et al. (2001) suggested that the
charge balance is actually associated with changes in H+ and OH− ions to maintain
the ion balance with water at different pH.
(a) (b) (c)
Figure 4.18 PAM performances at (a) pH 3, (b) pH 4, and (c) pH 6
87
4.4.3 PACl Performance at Optimum Dosage
4.4.3.1 Effect of pH on BOD, TSS and Turbidity Removal
Figure 4.19 shows the effect of different pH on BOD, TSS and turbidity
removal using PACl as sole coagulant. pH shows significant effects on the BOD
reduction at pH 6. At pH 6, the BOD removal increased from 51 to 59% which was
the maximum reduction achieved. The effects of pH on TSS reduction were not
significant within the range of pH studied. All pH values show 95% TSS removal
except for pH 6 which showed 96% TSS removal i.e. the greatest reduction. pH 3
and 6 resulted in the highest turbidity removal which were 78 and 76% respectively.
The lowest turbidity reduction was 71% which was attained at pH 4. It can be seen
that an optimum range of pH exists between 5.0 and 6.0 beyond which effluent
quality deteriorates.
0102030405060708090
100
2 3 4 5 6 7pH value
Rem
oval
(%)
BOD Removal TSS Removal Turbidity Removal
Figure 4.19 Percentage of BOD, TSS and Turbidity Removal Using 500 mg/L PACl
at Different pH of POME

88
The optimum PACl dosage and pH were 500 mg/L and 6.0, respectively. At
lower pH and lower coagulant dosage, the only mechanism for destabilization of
particles was charge neutralization. At low pH, because the aggregates were small in
size, the mechanism of colloidal destabilization was mainly charge neutralization. At
lower dosage, PACl behaves like the alum salt; therefore, charge neutralization is the
principal mechanism for destabilization (Huang and Pan, 2002). Figure 4.20 shows
the performance of PACl at pH 3, 4, and 6.
.
(a) (b) (c)
Figure 4.20 PACl performances at (a) pH 3, (b) pH 4, and (c) pH 6
According to Ahmad et al. (2006), the optimal condition of coagulation using
PACl was around pH 4.0–5.0 and a dosage of 6000 mg/L to obtain the same
percentage of TSS removal as performed by chitosan and that pH 6 showed the
poorest removal efficiency. Nevertheless, in contrast, this study proved that at a
dosage as low as 500 mg/L, and pH 4 and 5, PACl could give 95% TSS removal.
The formation of PACl floc particles at different pH condition was studied by
Van Benschoten and Edwzwald (1990a, 1990b) and concluded that PACl is least
soluble between pH 6 and 7 which agreed with the results obtained from this study
89
for PACl application. Highest amount of PACl was converted to solids phase flocs
particles at those pH.
Pre-hydrolyzed coagulants like PACl are often more effective than simple Al
and Fe salts. Part of the reason has to do with highly charged cationic species, such
as Al13, which are rather stable and have a better opportunity to adsorb on negative
colloids and neutralize their charge.
As a summary for this section, all the coagulants showed a good potential of
BOD, TSS and turbidity removal at initial pH value (pH 5). These results can be
clearly seen in figure 4.15, 4.17 and 4.19. This encouraging fact could bring to a
conclusion that pH adjustment on POME in the real treatment system can be
discarded in order to remove the suspended solid by using any of these coagulants.
However, when the pH was adjusted to a higher value i.e. pH 6, only PACl showed
the best removal for all parameters compared to the acidic condition with 59% BOD
removal, 96% TSS removal and 76% turbidity reduction. PAM and chitosan
application resulted in poorer removal at pH 6 but portrayed best removal at pH 5.
By using chitosan, 61% BOD removal, 97% TSS removal and 94% turbidity
reduction can be achieved. At optimum dosage and pH, PAM gave 63% BOD
removal, 95% TSS removal and 44% turbidity reduction.
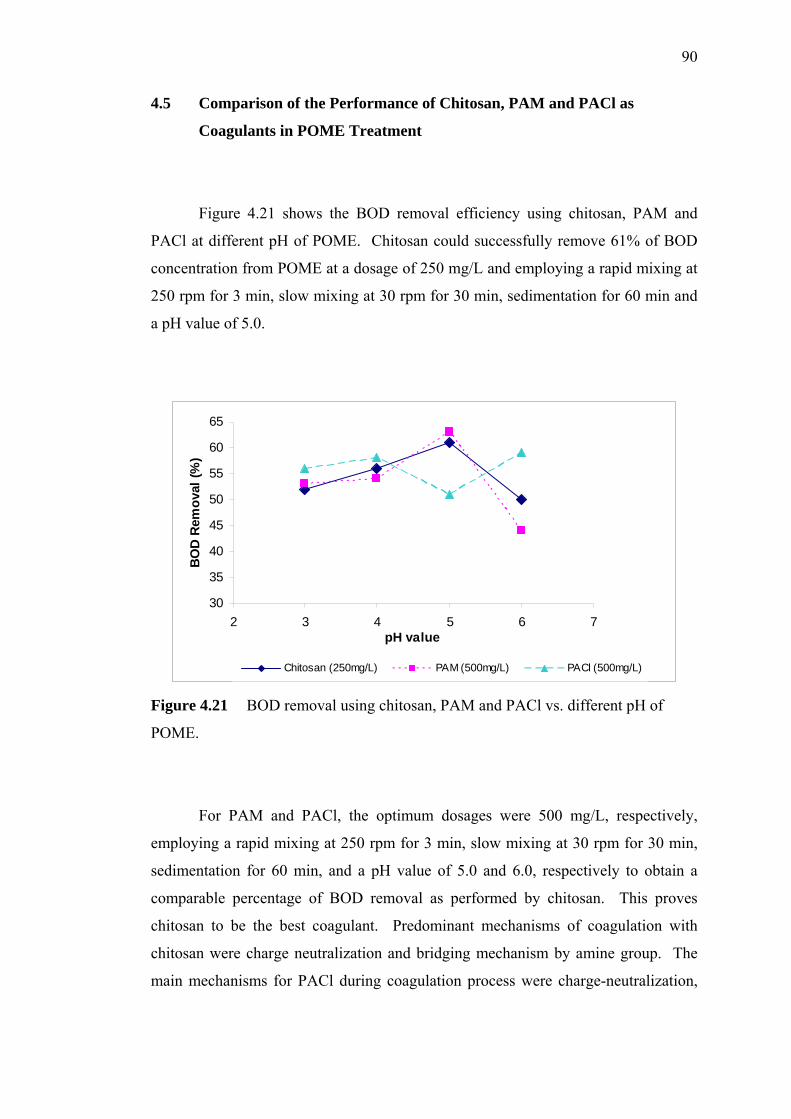
90
4.5 Comparison of the Performance of Chitosan, PAM and PACl as
Coagulants in POME Treatment
Figure 4.21 shows the BOD removal efficiency using chitosan, PAM and
PACl at different pH of POME. Chitosan could successfully remove 61% of BOD
concentration from POME at a dosage of 250 mg/L and employing a rapid mixing at
250 rpm for 3 min, slow mixing at 30 rpm for 30 min, sedimentation for 60 min and
a pH value of 5.0.
30
35
40
45
50
55
60
65
2 3 4 5 6 7pH value
BO
D R
emov
al (%
)
Chitosan (250mg/L) PAM (500mg/L) PACl (500mg/L)
Figure 4.21 BOD removal using chitosan, PAM and PACl vs. different pH of
POME.
For PAM and PACl, the optimum dosages were 500 mg/L, respectively,
employing a rapid mixing at 250 rpm for 3 min, slow mixing at 30 rpm for 30 min,
sedimentation for 60 min, and a pH value of 5.0 and 6.0, respectively to obtain a
comparable percentage of BOD removal as performed by chitosan. This proves
chitosan to be the best coagulant. Predominant mechanisms of coagulation with
chitosan were charge neutralization and bridging mechanism by amine group. The
main mechanisms for PACl during coagulation process were charge-neutralization,
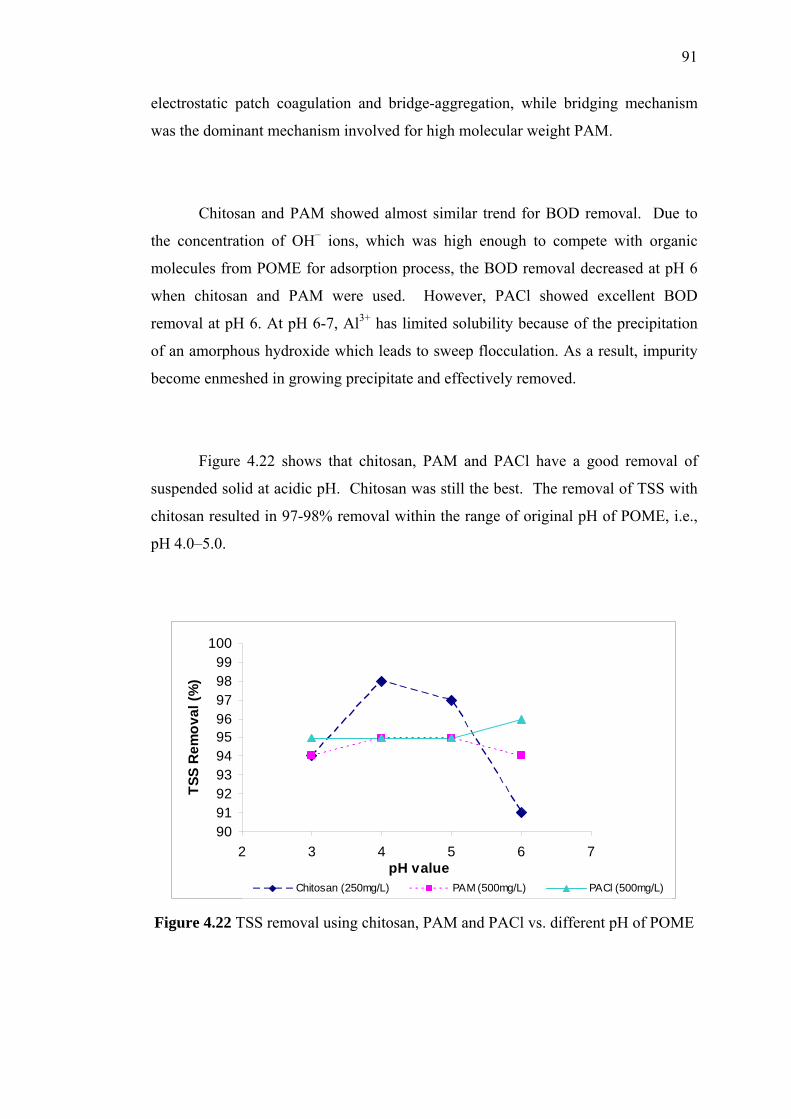
91
electrostatic patch coagulation and bridge-aggregation, while bridging mechanism
was the dominant mechanism involved for high molecular weight PAM.
Chitosan and PAM showed almost similar trend for BOD removal. Due to
the concentration of OH− ions, which was high enough to compete with organic
molecules from POME for adsorption process, the BOD removal decreased at pH 6
when chitosan and PAM were used. However, PACl showed excellent BOD
removal at pH 6. At pH 6-7, Al3+ has limited solubility because of the precipitation
of an amorphous hydroxide which leads to sweep flocculation. As a result, impurity
become enmeshed in growing precipitate and effectively removed.
Figure 4.22 shows that chitosan, PAM and PACl have a good removal of
suspended solid at acidic pH. Chitosan was still the best. The removal of TSS with
chitosan resulted in 97-98% removal within the range of original pH of POME, i.e.,
pH 4.0–5.0.
90919293949596979899
100
2 3 4 5 6 7pH value
TSS
Rem
oval
(%)
Chitosan (250mg/L) PAM (500mg/L) PACl (500mg/L)
Figure 4.22 TSS removal using chitosan, PAM and PACl vs. different pH of POME
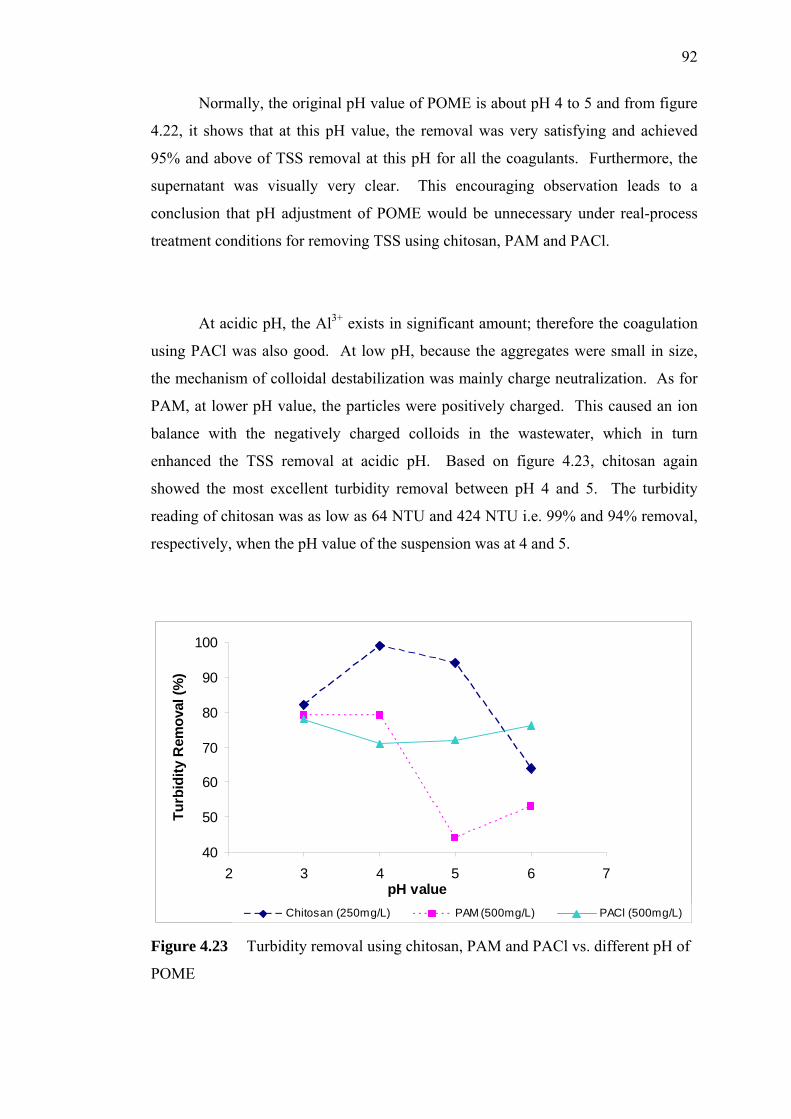
92
Normally, the original pH value of POME is about pH 4 to 5 and from figure
4.22, it shows that at this pH value, the removal was very satisfying and achieved
95% and above of TSS removal at this pH for all the coagulants. Furthermore, the
supernatant was visually very clear. This encouraging observation leads to a
conclusion that pH adjustment of POME would be unnecessary under real-process
treatment conditions for removing TSS using chitosan, PAM and PACl.
At acidic pH, the Al3+ exists in significant amount; therefore the coagulation
using PACl was also good. At low pH, because the aggregates were small in size,
the mechanism of colloidal destabilization was mainly charge neutralization. As for
PAM, at lower pH value, the particles were positively charged. This caused an ion
balance with the negatively charged colloids in the wastewater, which in turn
enhanced the TSS removal at acidic pH. Based on figure 4.23, chitosan again
showed the most excellent turbidity removal between pH 4 and 5. The turbidity
reading of chitosan was as low as 64 NTU and 424 NTU i.e. 99% and 94% removal,
respectively, when the pH value of the suspension was at 4 and 5.
40
50
60
70
80
90
100
2 3 4 5 6 7pH value
Turb
idity
Rem
oval
(%)
Chitosan (250mg/L) PAM (500mg/L) PACl (500mg/L)
Figure 4.23 Turbidity removal using chitosan, PAM and PACl vs. different pH of
POME
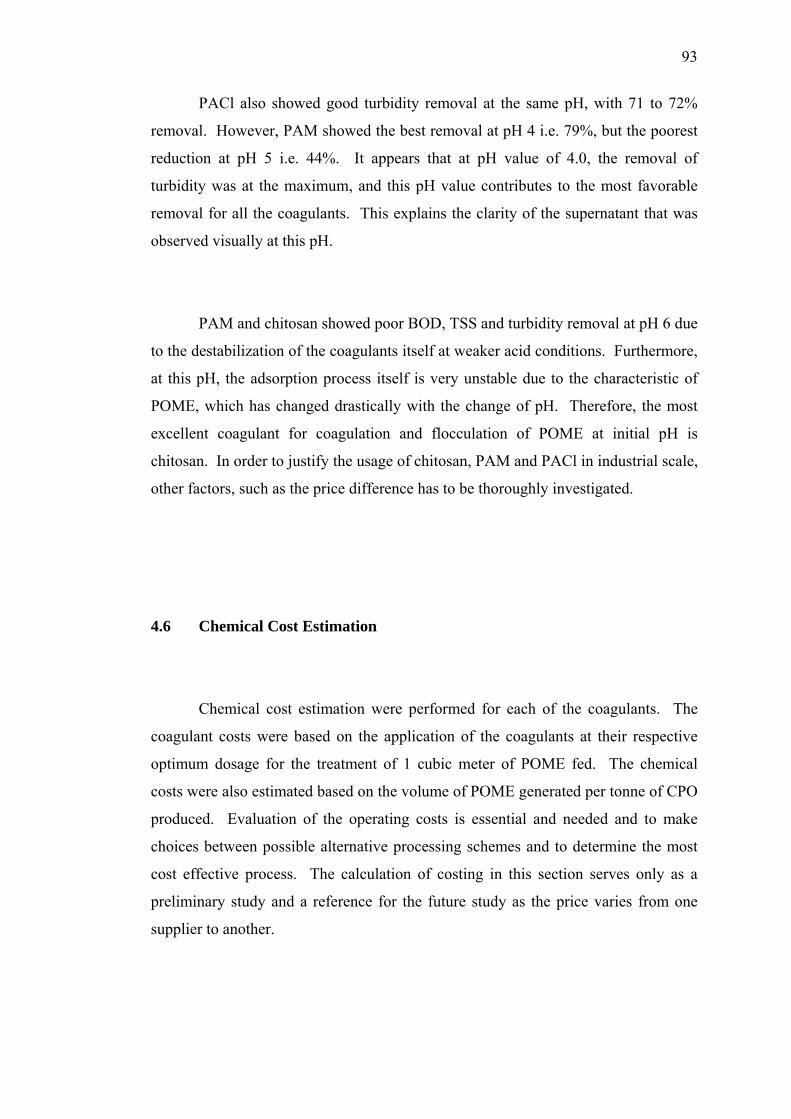
93
PACl also showed good turbidity removal at the same pH, with 71 to 72%
removal. However, PAM showed the best removal at pH 4 i.e. 79%, but the poorest
reduction at pH 5 i.e. 44%. It appears that at pH value of 4.0, the removal of
turbidity was at the maximum, and this pH value contributes to the most favorable
removal for all the coagulants. This explains the clarity of the supernatant that was
observed visually at this pH.
PAM and chitosan showed poor BOD, TSS and turbidity removal at pH 6 due
to the destabilization of the coagulants itself at weaker acid conditions. Furthermore,
at this pH, the adsorption process itself is very unstable due to the characteristic of
POME, which has changed drastically with the change of pH. Therefore, the most
excellent coagulant for coagulation and flocculation of POME at initial pH is
chitosan. In order to justify the usage of chitosan, PAM and PACl in industrial scale,
other factors, such as the price difference has to be thoroughly investigated.
4.6 Chemical Cost Estimation
Chemical cost estimation were performed for each of the coagulants. The
coagulant costs were based on the application of the coagulants at their respective
optimum dosage for the treatment of 1 cubic meter of POME fed. The chemical
costs were also estimated based on the volume of POME generated per tonne of CPO
produced. Evaluation of the operating costs is essential and needed and to make
choices between possible alternative processing schemes and to determine the most
cost effective process. The calculation of costing in this section serves only as a
preliminary study and a reference for the future study as the price varies from one
supplier to another.
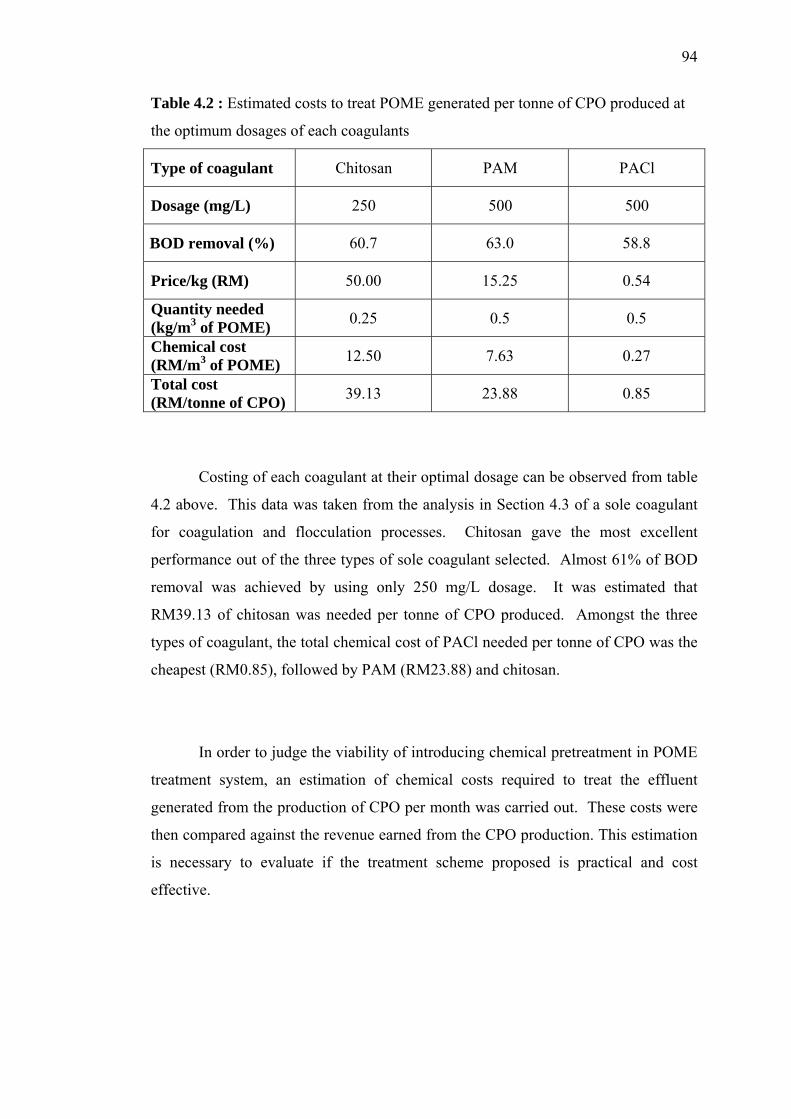
94
Table 4.2 : Estimated costs to treat POME generated per tonne of CPO produced at
the optimum dosages of each coagulants
Type of coagulant Chitosan PAM PACl
Dosage (mg/L) 250 500 500
BOD removal (%) 60.7 63.0 58.8
Price/kg (RM) 50.00 15.25 0.54
Quantity needed (kg/m3 of POME) 0.25 0.5 0.5
Chemical cost (RM/m3 of POME) 12.50 7.63 0.27
Total cost (RM/tonne of CPO) 39.13 23.88 0.85
Costing of each coagulant at their optimal dosage can be observed from table
4.2 above. This data was taken from the analysis in Section 4.3 of a sole coagulant
for coagulation and flocculation processes. Chitosan gave the most excellent
performance out of the three types of sole coagulant selected. Almost 61% of BOD
removal was achieved by using only 250 mg/L dosage. It was estimated that
RM39.13 of chitosan was needed per tonne of CPO produced. Amongst the three
types of coagulant, the total chemical cost of PACl needed per tonne of CPO was the
cheapest (RM0.85), followed by PAM (RM23.88) and chitosan.
In order to judge the viability of introducing chemical pretreatment in POME
treatment system, an estimation of chemical costs required to treat the effluent
generated from the production of CPO per month was carried out. These costs were
then compared against the revenue earned from the CPO production. This estimation
is necessary to evaluate if the treatment scheme proposed is practical and cost
effective.
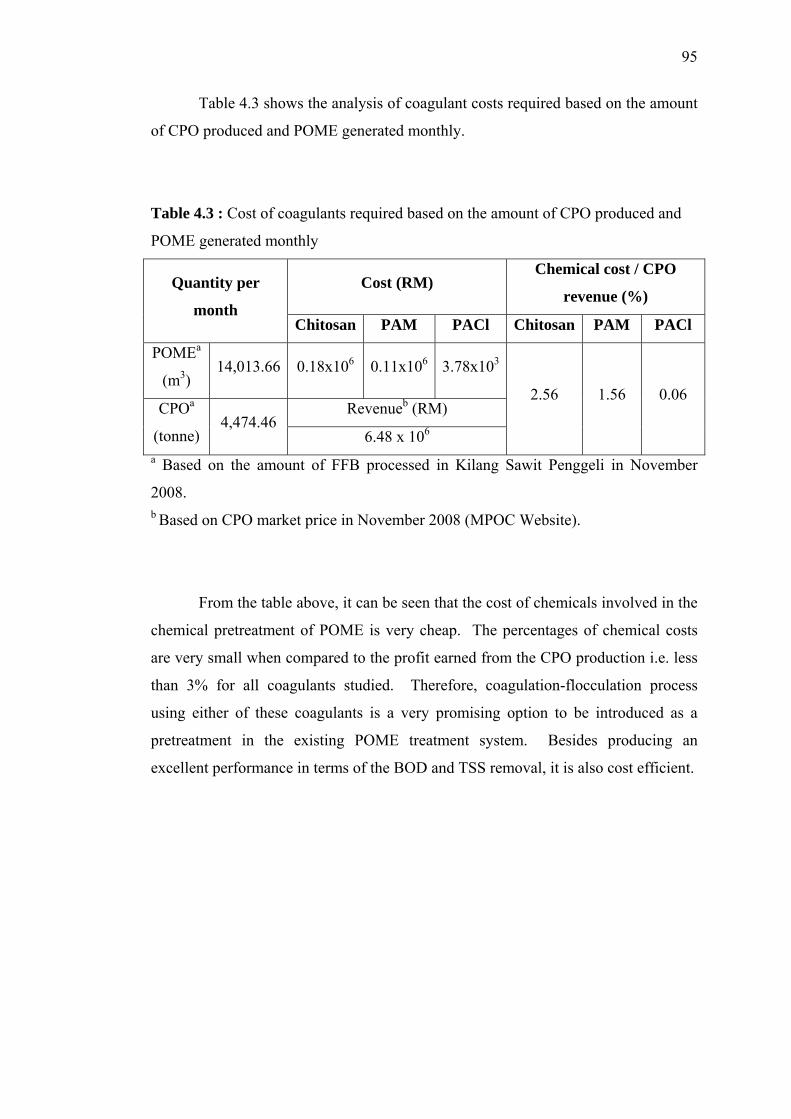
95
Table 4.3 shows the analysis of coagulant costs required based on the amount
of CPO produced and POME generated monthly.
Table 4.3 : Cost of coagulants required based on the amount of CPO produced and
POME generated monthly
Cost (RM) Chemical cost / CPO
revenue (%) Quantity per
month Chitosan PAM PACl Chitosan PAM PACl
POMEa
(m3) 14,013.66 0.18x10⁶ 0.11x10⁶ 3.78x10³
Revenueb (RM) CPOa
(tonne) 4,474.46
6.48 x 10⁶
2.56 1.56 0.06
a Based on the amount of FFB processed in Kilang Sawit Penggeli in November
2008. b Based on CPO market price in November 2008 (MPOC Website).
From the table above, it can be seen that the cost of chemicals involved in the
chemical pretreatment of POME is very cheap. The percentages of chemical costs
are very small when compared to the profit earned from the CPO production i.e. less
than 3% for all coagulants studied. Therefore, coagulation-flocculation process
using either of these coagulants is a very promising option to be introduced as a
pretreatment in the existing POME treatment system. Besides producing an
excellent performance in terms of the BOD and TSS removal, it is also cost efficient.
CHAPTER V
CONCLUSIONS AND RECOMMENDATIONS
5.1 Introduction
This chapter concludes the findings from the studies conducted. The aim,
results of this study, implications of the findings for practice and the overall
importance of the research to the field and recommendations for future research or
practices are reiterated and highlighted here.
5.2 Conclusions
The results showed that chitosan proved to be the best coagulant as it
performed exceptionally well. Chitosan showed the best removal compared to the
other coagulants for all the parameters studied. The following optimum parameters
were found necessary for the reduction of tubidity, BOD and TSS value from an
influent with a concentration of 6548 NTU, 25840 mg/L and 19340 mg/L,
respectively to 423.75 NTU (93.5% turbidity removal), 10147.5 mg/L (60.7% BOD
97
removal), and 603.25 mg/L (96.9% TSS removal), correspondingly: chitosan as the
best coagulant with a dosage of 250 mg/L; POME suspension initial pH value of 5.0;
employing a rapid mixing at 250 rpm for 3 min, slow mixing at 30 rpm for 30 min,
and sedimentation for 60 min. However, the estimated cost of chitosan needed per
tonne of CPO produced was quite high i.e. RM39.13.
For PAM and PACl, the optimum dosages were 500 mg/L, respectively,
employing a rapid mixing at 250 rpm for 3 min, slow mixing at 30 rpm for 30 min,
sedimentation for 60 min, and a pH value of 5.0 and 6.0, respectively to obtain a
comparable percentage of BOD removal as performed by chitosan. The cost of
PACl required per tonne of CPO was the cheapest i.e. RM0.85. In addition, it
resulted in an excellent TSS removal (96%) and good BOD (58.8%) and turbidity
reduction (76.3%). Although the price of PAM was also cheap, its application
resulted in average performance (63%, 94.8% and 44% removal in BOD, TSS and
turbidity value correspondingly). On the whole, in terms of performance, chitosan is
the best option in treating POME via coagulation-flocculation process, followed by
PACl and PAM.
All the coagulants showed a good potential of removal at initial pH value.
This encouraging fact could bring to a conclusion that pH adjustment on POME in
the real treatment system can be discarded in order to remove the turbidity, BOD and
TSS concentration by using any of these coagulants, thus keeping the treatment cost
lower and the quality of treated waste better compared to the conventional
coagulation.
By applying chemical pre-treatment i.e. coagulation and flocculation in the
POME treatment system, it will significantly improve the treatment system and
improve the quality of the effluent discharge from the mill. Hence, it is strongly
recommended to introduce coagulation and flocculation process as a chemical pre-
treatment in the POME treatment system.
98
5.3 Recommendations for future studies
Several recommendations for future studies are listed as follows:
First of all, it is recommended to conduct a study on integrated chemical and
biological system for treating POME so as to verify the effects the pre-chemical
treatment has in enhancing the BOD and TSS removal efficiencies which will
ultimately meet the Department of Environment Standards requirement for effluent
discharge. The anaerobic digester/ponds, facultative and algae ponds that are being
used in most mills at times fail to reduce the BOD and TSS concentration to below
100 and 400 mg/L, respectively. The study can be carried out by using the results
obtained from this research.
The suspended particles in POME will settle on its own after a period of time
even without physicochemical treatment. Thus, it is recommended to conduct the
coagulation-flocculation process on raw POME samples without the addition of
coagulants (as a control) but employing the same mixing speed and time to
investigate the effects it has on BOD, TSS and turbidity removal.
Manually operated sand and oil traps are installed as pretreatment units in
many wastewater treatment systems in palm oil mill. It is recommended to conduct
the study on samples (effluent) collected from this pretreatment unit so as to analyze
the difference between pretreated effluent and mixed raw effluent in terms of BOD,
TSS and turbidity removal.
Next, studies on coagulant dosage lower than the lowest dosage considered in
this research should also be considered to investigate if higher removal efficiency for
BOD, TSS and turbidity can be achieved at lower dosage. The samples can be
99
analyzed with different dosages of chitosan (0.01–0.1 g/l), PAM and PACl (0.05–0.5
g/l).
It is also recommended to study the effect of varying the mixing time,
sedimentation time, and mixing rate/speed in enhancing the removal efficiencies.
Effect of sedimentation time can be analyzed at different sedimentation time (5-
80min) at optimum dosage of chitosan, PAM and PACl at a fixed mixing time and
mixing rate. The effect of mixing speed can be analyzed using two different mixing
times at various mixing speed (20-200rpm) for all the coagulants with optimized
coagulant dosages, at initial pH and sedimentation time of 60 min. The effect of
mixing time can be conducted by varying the mixing time (5-60min) at a fixed
mixing rate. The sample can then let to settle for 1 h. Dosage of chitosan, PAM and
PACl should be fixed at their optimum values.
The sludge produced in the physical–chemical treatment is due to the amount
of organic matter and total solids in suspension that are removed and the compounds
formed from the coagulant used, since practically almost all of the latter will form
part of the sludge solids. In general, the amount and characteristics of the sludge
produced during the coagulation–flocculation process depend on the coagulants used
and on the operating conditions. Thus, it is recommended to determine the SVI with
the purpose of observing the volume and settling characteristics of the sludge
produced.
REFERENCES
Ahmad, A. L., Ismail, S., Ibrahim, N., and Bhatia, S. (2003a). Removal Of
Suspended Solid And Residue Oil From Palm Oil Mill Effluent. Journal Of
Chemical Technology And Biotechnology. Vol. 78: 971-978.
Ahmad, A. L., Ismail, S., and Bhatia, S. (2003b). Water Recycling From Palm Oil
Mill Effluent (POME) Using Membrane Technology. Desalination. Vol.
157: 87-95.
Ahmad, A. L., Sumathi, S., and Hameed, B. H. (2005a). Adsorption Of Residue Oil
From Palm Oil Mill Effluent Using Powder And Flake Chitosan: Equilibrium
And Kinetic Studies. Water Research. Vol. 39: 2483–2494.
Ahmad, A. L., Sumathi, S., and Hameed, B. H. (2005b). Residue Oil and Suspended
Solid Removal Using Natural Adsorbents Chitosan, Bentonite And Activated
Carbon: A Comparative Study. Chemical Engineering Journal. Vol. 108:
179-185.
Ahmad, A. L., Sumathi, S., and Hameed, B. H. (2006). Coagulation Of Residue Oil
And Suspended Solid In Palm Oil Mill Effluent By Chitosan, Alum And
PAC. Chemical Engineering Journal. Vol. 118(1-2): 99-105.
Andreasen, T. (1982). The AMINODAN System for Treatment of Palm Oil Mill
Effluent. Proceedings of Regional Workshop on Palm Oil Mill Technology
and Effluent Treatment. PORIM, Malaysia, 213–215.
101
Ariffin, A., Shatat, R. S. A., Nik Norulaini, A. R., and Mohd Omar, A. K. (2004).
Synthetic Polyelectrolytes Based On Acrylamide And Their Application as a
Flocculent in the Treatment of Palm Oil Mill Effluent. Journal of Applied
Sciences. Vol. 4(3): 393-397.
Ariffin, A., Shatat, R. S. A., Nik Norulaini, A. R., and Mohd Omar, A. K. (2005).
Synthetic Polyelectrolytes Of Varying Charge Densities But Similar Molar
Mass Based On Acrylamide And Their Application On Palm Oil Mill
Effluent Treatment. Desalination. Vol. 173: 201-208.
Barany, S. and Szepesszenentgyorgyi, A. (2004). Flocculation of Cellular
Suspensions by Polyelectrolytes. Advances in Colloid and Interface Science.
Vol. 111: 117–129.
Bhatia, S., Othman, Z., and Ahmad, A. L. (2007a). Coagulation–flocculation Process
for POME Treatment Using Moringa Oleifera Seeds Extract: Optimization
Studies. Chemical Engineering Journal. Vol. 133: 205-212.
Bhatia, S., Othman, Z., and Ahmad, A. L. (2007b). Pretreatment of Palm Oil Mill
Effluent (POME) Using Moringa Oleifera Seeds as Natural Coagulant.
Journal of Hazardous Materials. Vol. 145: 120–126.
Borja-Padilla, R. and Banks C. J. (1994). Treatment of Palm Oil Mill Effluent by
Upflow Anaerobic Filtration. Journal Of Chemical Technology And
Biotechnology. Vol. 61: 103-109.
Borja, R. (1995). Comparison of an Anaerobic Filter and an Anaerobic Fluidized Bed
Reactor Treating Palm Oil Mill Effluent. Process Biochemistry. Vol. 30(6):
511–521.
Borja, R., Banks, C., Khalfaoui, B., and Matin, A., (1996a). Performance Evaluation
of an Anaerobic Hybrid Digester Treating Palm Oil Mill Effluent. Journal of
Environmental Science and Health A. Vol. 31(6): 1379–1393.
102
Borja-Padilla, R., Banks C. J., and Sánchez, E. (1996b). Anaerobic Treatment of
Palm Oil Mill Effluent in a Two-Stage Up-Flow Anaerobic Sludge Blanket
(UASB) System. Journal Of Biotechnology. Vol. 45: 125-135.
Chan, K.S. and Chooi, C.F., (1982). Ponding System for Palm Oil Mill Effluent
Treatment. Proceedings of Regional Workshop on Palm Oil Mill Technology
and Effluent Treatment. PORIM, Malaysia, 185–192.
Chin, K. K., Lee, S. W., and Mohammad, H. H. (1996). A Study of Palm Oil Mill
Effluent Treatment Using a Pond System. Water Science and Technology.
Vol. 34(11): 119-123.
Chungsiriporn, J., Prasertsan, S., and Bunyakan, C. (2006). Minimization of Water
Consumption and Process Optimization of Palm Oil Mills. Clean Technology
Environment Policy. Vol. 8: 151–158.
Duan, J. and Gregory, J. (2003). Coagulation by Hydrolysing Metal Salts. Advances
in Colloid and Interface Science. Vol. 100 –102: 475–502.
Eckenfelder, W. W., Jr. (2000). Industrial Water Pollution Control. 3rd edition.
United State: McGraw-Hill Companies, Inc.
Faisal, M., and Unno, H. (2001). Kinetic Analysis of Palm Oil Mill Wastewater
Treatment by a Modified Anaerobic Baffled Reactor. Biochemical
Engineering Journal. Vol. 9(1): 25–31.
Gill, R.I.S. and Herrington, T.M. (1988). Floc Size Studies on Kaolin Suspensions
Flocculated with Cationic Polyacrylamides. Colloid and Surfaces. Vol. 32:
331-344.
Hassan, M. A., Yacob, S., Shirai, Y., and Hung, Y. T. (2004). Treatment of Palm Oil
Wastewater. Handbook of Industrial and Hazardous Wastes. 2nd edition.
New York, United State: Marcel Dekker, Inc.
103
Huang, C. and Pan, J. R. (2002). Coagulation Approach to Water Treatment.
Encyclopedia of Surface and Colloid Science. New York, United State:
Marcel Dekker, Inc.
Ismail, M. A. K. and Lau, L. H. (1987). The Use Of Coagulating And Polymeric
Flocculating Agent In The Treatment Of Palm Oil Mill Effluent (POME).
Biological Waste. Vol. 20: 209-218.
Jorgensen, H. K. (1982). The U.P. Decanter-Drier System for Reduction of Palm Oil
Mill Effluent. Proceedings of Regional Workshop on Palm Oil Mill
Technology and Effluent Treatment. PORIM, Malaysia, 201–212.
Lin, S. (2001). Water And Wastewater Calculations Manual. 1st edition. United
State: McGraw-Hill Companies, Inc.
Malaysia (1977). Environmental Quality (Prescribed Premises) (Crude Palm-Oil)
Regulations 1977. P.U. (A)342 1977.
Malaysian Palm Oil Board Website. http://www.mpob.gov.my. Accessed on 14 June
2008.
Malaysian Palm Oil Council Website. http://www.mpoc.org.my/main_palmoil.asp.
Accessed on 20 December 2008.
Malaysian Palm Oil Promotion Council Website. http://www.mpopc.org.my.
Accessed on 14 June 2008.
Metcalf and Eddy, Inc. (2004). Wastewater Engineering Treatment And Reuse. 4th
edition. Singapore: McGraw-Hill Companies, Inc.
Najafpour, G. D., Zinatizadeh, A. A. L., Mohamed, A. R., Hasnain Isa, M., and
Nasrollahzadeh, H. (2006). High-Rate Anaerobic Digestion of Palm Oil Mill
Effluent in an Upflow Anaerobic Sludge-Fixed Film Bioreactor. Process
Biochemistry. Vol. 41(2): 370–379.
104
Ng, W. J., Wong, K. K., and Chin, K. K. (1985). Two-Phase Anaerobic Treatment
Kinetics of Palm Oil Wastes. Water Research. Vol. 19(5): 667-669.
Ng, W. J., Goh, A. C. C., and Tay, J. H. (1987). Palm Oil Mill Effluent (POME)
Treatment – An Assesment of Coagulants Used to Aid Liquid-Solid
Separation. Biological Waste. Vol. 21: 237-248.
Nik Norulaini, N.A., Ahmad Zuhairi, A., Muhamad Hakimi, I., and Mohd Omar,
A.K. (2001). Chemical Coagulation of Settleable Solid-Free Palm Oil Mill
Effluent (POME) for Organic Load Reduction. Journal of Industrial
Technology. Vol.10: 55–72.
Osman, Z. and Arof, K. (2003). FTIR Studies of Chitosan Acetate Based Polymer
Electrolytes. Electrochimica Acta. Vol. 48 (8): 993–999.
Oswal, N., Sarma, P. M., Zinjarde, S. S., and Pant, A. (2002). Palm Oil Mill Effluent
Treatment by a Tropical Marine Yeast. Bioresource Technology. Vol. 85: 35–
37.
Pawlowski, L. (1982). Physicochemical Methods for Water And Wastewater
Treatment. Proceedings of the Third International Conference, Lublin,
Poland, 21-25 September 1981. Elsevier Scientific Publishing Company,
Amsterdam, Netherlands. Vol. 19: 13-29.
Pinotti, A., Bevilacqua, A., and Zaritzky, N. (2001). Comparison of the Performance
of Chitosan and a Cationic Polyacrylamide as Flocculants of Emulsion
Systems. Journal of Surfactants and Detergents. Vol. 4: 57-63.
Rahim, B.A., and Raj, R., (1982). Pilot Plant Study of a Biological Treatment System
for Palm Oil Mill Effluent. Proceedings of Regional Workshop on Palm Oil
Mill Technology and Effluent Treatment. PORIM, Malaysia, 163–170.
105
Roussy, J., Vooren, M.V., and Guibal, E. (2005a). Influence of Chitosan
Characteristics on Coagulation and Flocculation of Organic Suspensions.
Journal of Applied Polymer Science. Vol. 98: 2070–2079.
Roussy, J., Vooren, M.V., Dempsey, B.A., and Guibal, E. (2005b). Influence of
Chitosan Characteristics on the Coagulation and the Flocculation of Bentonite
Suspensions. Water Research. Vol. 39: 3247–3258.
Setiadi, T., Husaini, and Djajadiningrat, A. (1996). Palm Oil Mill Effluent Treatment
by Anaerobic Baffled Reactors: Recycle Effects and Biokinetic Parameters.
Water Science Technology. Vol. 34(11): 59–66.
Shammas, N. K. (2005). Physicochemical Treatment Processes. Handbook of
Environmental Engineering. Vol. 3. New Jersey, U.S.A.: Humana Press.
Sincero, A. P. and Sincero, G. A. (1996). Environmental Engineering: A Design
Approach. New Jersey, U.S.A.: Prentice Hall.
Sinnott, R. K. (1996). Chemical Engineering Design. Volume 6. 2nd edition. Oxford:
Butterworth-Heinemann.
Smith, R. (1995). Chemical Process Design. New York, U.S.A.: McGraw-Hill.
Standard Methods (2005). Standard Methods for the Examination of Water and
Wastewater. 21st edition. APHA, AWWA, WPCF, Washington, D.C., U.S.A.
Stanton, W. R. (1974). Treatment of Effluent from Palm Oil Factories. Planter.
Kuala Lumpur. Vol. 50: 382-387.
Tam, T. K., Yeow, K. H., and Poon, Y. C. (1982). Land Application of Palm Oil
Mill Effluent (POME)- H & C Experience. Proceedings of Regional
Workshop on Palm Oil Mill Technology and Effluent Treatment. PORIM,
Malaysia, 216–224.
106
Teoh, G. E., Chen, K. W., and Tan, Y. K. (1980). Handbook of Management of Palm
Oil Mill Effluent Treatment Plant. Perbadanan Kilang Felda (Felda Mills
Corporation), Kuala Lumpur.
Thanh, N. C., Muttamara, S. and Lohani, B. N. (1980). Palm Oil Wastewater
Treatment Study in Malaysia and Thailand. International Development
Research Centre. Final Report. No. 114, Asian Institute of Technology,
Thailand and Division of Environment, Ministry of Science, Technology and
Environment, Malaysia.
Tusirin, M. and Suwandi, M. S. (1982). Palm Oil Mill Effluent Treatment by
Ultrafiltration: An Economic Analysis. Proceedings of Regional Workshop
on Palm Oil Mill Technology and Effluent Treatment. PORIM, Malaysia,
157–162.
United States Environmental Protection Agency Website. http://www.epa.gov.
Accessed on 18 July 2008.
Van Benschoten, J. E. and Edzwald J. K. (1990a). Chemical Aspects of Coagulation
Using Aluminum Salts—I. Hydrolytic Reactions of Alum and Polyaluminum
Chloride. Water Research. Vol. 24(12):1519-1526.
Van Benschoten, J. E. and Edzwald J. K. (1990b). Chemical Aspects of Coagulation
Using Aluminium Salts—II. Coagulation of Fulvic Acid Using Alum and
Polyaluminium Chloride. Water Research. Vol. 24(12):1527-1535.
Vijayaraghavan, K., Ahmad, D., and Era Mayuza, E. (2006). Effect of Coagulation
on Palm Oil Mill Effluent and Subsequent Treatment of Coagulated Sludge
by Anaerobic Digestion. Journal of Chemical Technology and Biotechnology.
Vol. 81: 1652–1660.
Vijayaraghavan, K., Ahmad, D., and Ezani, M. (2007). Aerobic Treatment of Palm
Oil Mill Effluent. Journal of Environmental Management. Vol. 82: 24–31.
107
Wan Ngah, W. S. and Musa, A. (1998). Adsorption of Humic Acid Onto Chitin and
Chitosan. Journal of Applied Polymer Science. Vol. 69 (12): 2305-2310.
Wang, D. S., Sun, W., Xu, Y., Tang, H. X., and Gregory, J. (2004). Speciation
Stability of Inorganic Polymer Flocculant- PACl. Colloids and Surfaces A:
Physicochemical and Engineering Aspects. Vol. 243: 1–10.
Wong, S.S., Teng, T.T., Ahmad, A.L., Zuhairi, A. and Najafpour, G. (2006).
Treatment of Pulp and Paper Mill Wastewater by Polyacrylamide (PAM) in
Polymer Induced Flocculation. Journal of Hazardous Materials B. Vol. 135:
378–388.
Wu, X., Ge, X., Wang, D. and Tang, H. (2007). Distinct Coagulation Mechanism and
Model between Alum and High Al13-PACl. Colloids and Surfaces A:
Physicochemical Engineering Aspects. Vol. 305: 89–96.
Yacob, S., Hassan, M. A., Shirai, Y., Wakisaka, M. and Subash, S. (2005). Baseline
Study of Methane Emission from Open Digesting Tanks of Palm Oil Mill
Effluent Treatment. Chemosphere. Vol. 59: 1575–1581.
Yacob, S., Hassan, M. A., Shirai, Y., Wakisaka, M. and Subash, S. (2006a). Baseline
Study Of Methane Emission From Anaerobic Ponds Of Palm Oil Mill
Effluent Treatment. Science of the Total Environment. Vol. 366:187– 196.
Yejian, Z., Li, Y., Xiangli, Q., Lina, C., Xiangjun, N., Zhijian, M., and Zhenjia, Z.
(2008). Integration of Biological Method and Membrane Technology in
Treating POME. Journal of Environmental Sciences. Vol.20: 558–564.
Yu, J., Wang, D., Yan, M., Ye, C., Yang, M. and Ge, X. (2007). Optimized
Coagulation of High Alkalinity, Low Temperature and Particle Water: pH
Adjustment and Polyelectrolytes as Coagulant Aids. Environmental
Monitoring and Assessment. Vol. 131: 377–386.

108
Zinatizadeh, A. A. L., Salamatinia, B., Zinatizadeh, S. L., Mohamed, A. R. and
Hasnain Isa, M. (2007). Palm Oil Mill Effluent Digestion in an Up-Flow
Anaerobic Sludge Fixed Film Bioreactor. International Journal of
Environmental Research. Vol. 1(3): 264-271.
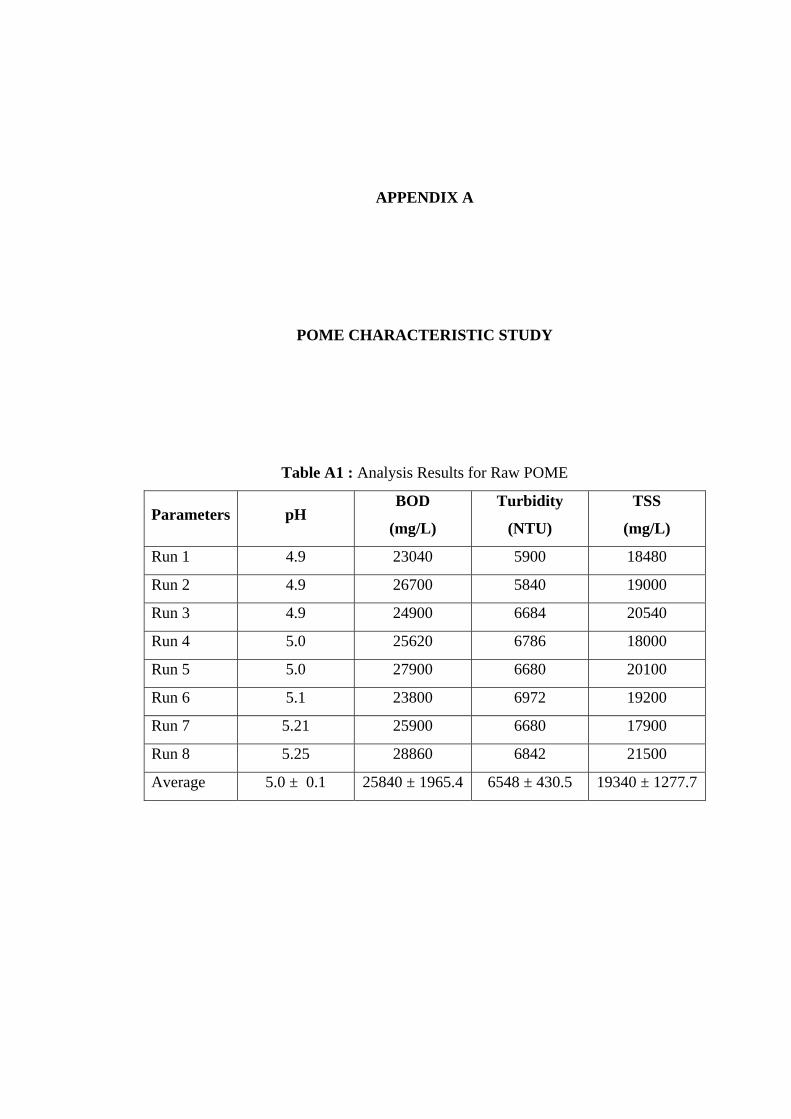
APPENDIX A
POME CHARACTERISTIC STUDY
Table A1 : Analysis Results for Raw POME
Parameters pH BOD
(mg/L)
Turbidity
(NTU)
TSS
(mg/L)
Run 1 4.9 23040 5900 18480
Run 2 4.9 26700 5840 19000
Run 3 4.9 24900 6684 20540
Run 4 5.0 25620 6786 18000
Run 5 5.0 27900 6680 20100
Run 6 5.1 23800 6972 19200
Run 7 5.21 25900 6680 17900
Run 8 5.25 28860 6842 21500
Average 5.0 ± 0.1 25840 ± 1965.4 6548 ± 430.5 19340 ± 1277.7
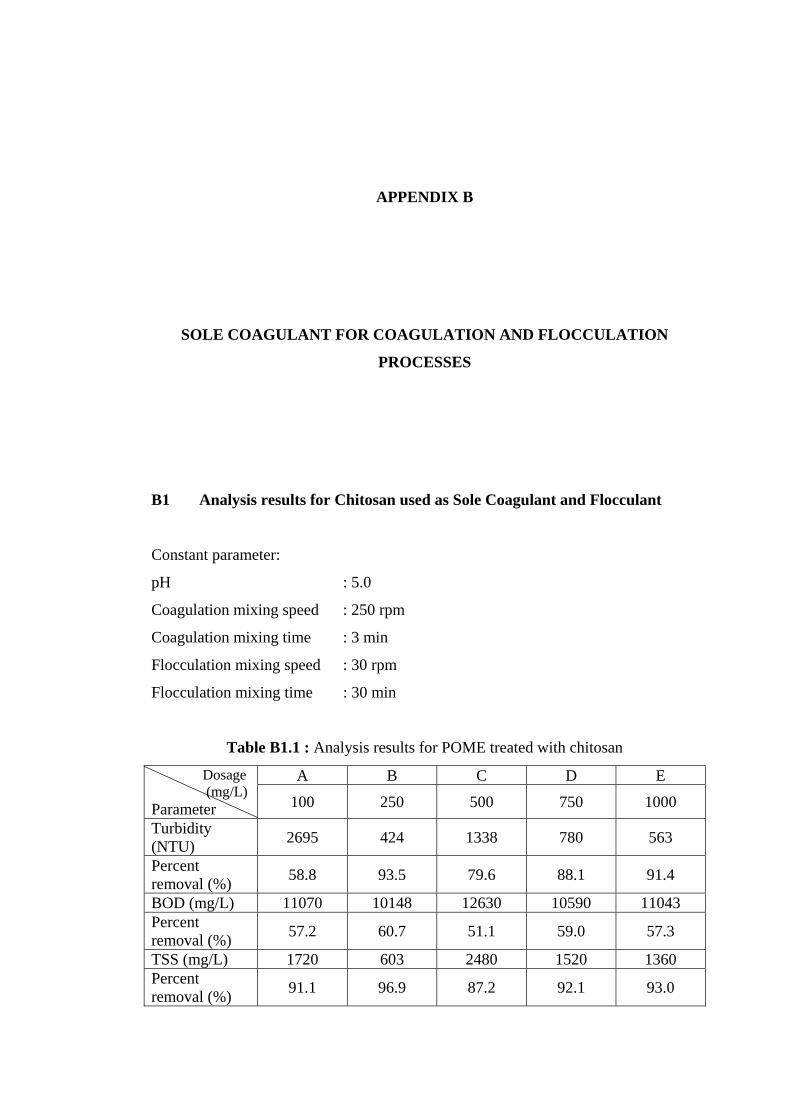
APPENDIX B
SOLE COAGULANT FOR COAGULATION AND FLOCCULATION
PROCESSES
B1 Analysis results for Chitosan used as Sole Coagulant and Flocculant
Constant parameter:
pH : 5.0
Coagulation mixing speed : 250 rpm
Coagulation mixing time : 3 min
Flocculation mixing speed : 30 rpm
Flocculation mixing time : 30 min
Table B1.1 : Analysis results for POME treated with chitosan
A B C D E Dosage (mg/L) Parameter 100 250 500 750 1000
Turbidity (NTU) 2695 424 1338 780 563
Percent removal (%) 58.8 93.5 79.6 88.1 91.4
BOD (mg/L) 11070 10148 12630 10590 11043 Percent removal (%) 57.2 60.7 51.1 59.0 57.3
TSS (mg/L) 1720 603 2480 1520 1360 Percent removal (%) 91.1 96.9 87.2 92.1 93.0
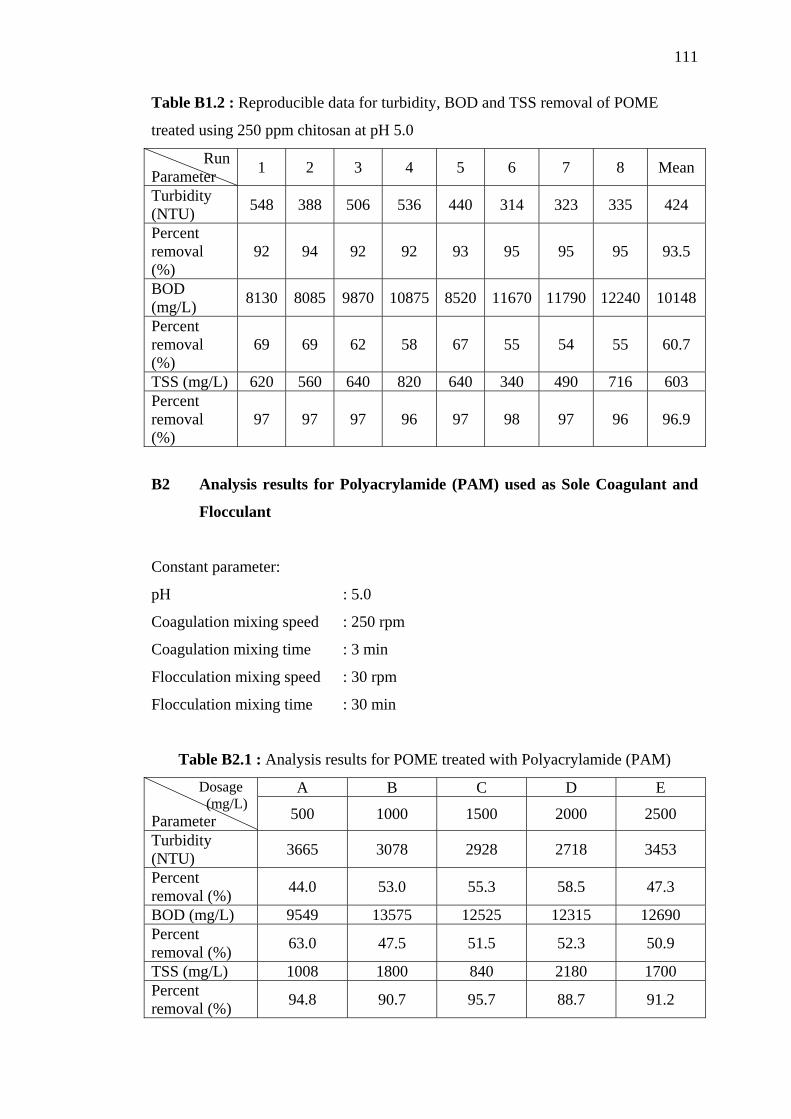
111
Table B1.2 : Reproducible data for turbidity, BOD and TSS removal of POME
treated using 250 ppm chitosan at pH 5.0
Run Parameter 1 2 3 4 5 6 7 8 Mean
Turbidity (NTU) 548 388 506 536 440 314 323 335 424
Percent removal (%)
92 94 92 92 93 95 95 95 93.5
BOD (mg/L) 8130 8085 9870 10875 8520 11670 11790 12240 10148
Percent removal (%)
69 69 62 58 67 55 54 55 60.7
TSS (mg/L) 620 560 640 820 640 340 490 716 603 Percent removal (%)
97 97 97 96 97 98 97 96 96.9
B2 Analysis results for Polyacrylamide (PAM) used as Sole Coagulant and
Flocculant
Constant parameter:
pH : 5.0
Coagulation mixing speed : 250 rpm
Coagulation mixing time : 3 min
Flocculation mixing speed : 30 rpm
Flocculation mixing time : 30 min
Table B2.1 : Analysis results for POME treated with Polyacrylamide (PAM)
A B C D E Dosage (mg/L) Parameter 500 1000 1500 2000 2500
Turbidity (NTU) 3665 3078 2928 2718 3453
Percent removal (%) 44.0 53.0 55.3 58.5 47.3
BOD (mg/L) 9549 13575 12525 12315 12690 Percent removal (%) 63.0 47.5 51.5 52.3 50.9
TSS (mg/L) 1008 1800 840 2180 1700 Percent removal (%) 94.8 90.7 95.7 88.7 91.2
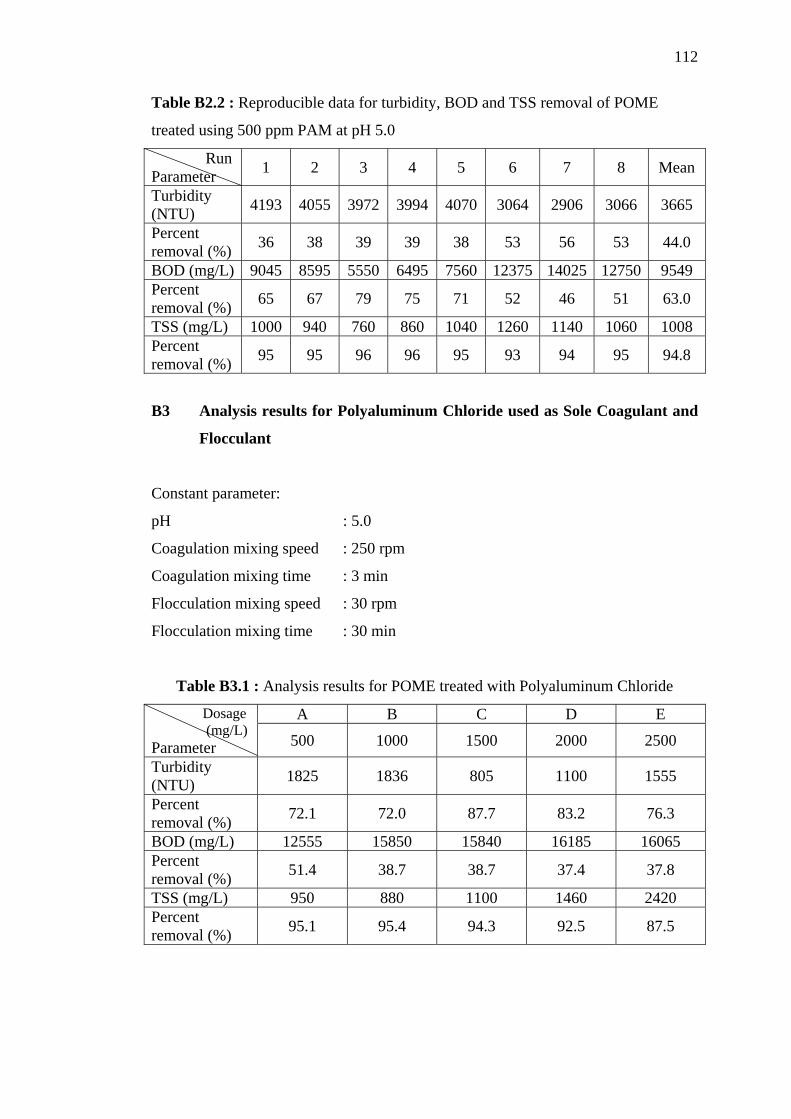
112
Table B2.2 : Reproducible data for turbidity, BOD and TSS removal of POME
treated using 500 ppm PAM at pH 5.0
Run Parameter 1 2 3 4 5 6 7 8 Mean
Turbidity (NTU) 4193 4055 3972 3994 4070 3064 2906 3066 3665
Percent removal (%) 36 38 39 39 38 53 56 53 44.0
BOD (mg/L) 9045 8595 5550 6495 7560 12375 14025 12750 9549 Percent removal (%) 65 67 79 75 71 52 46 51 63.0
TSS (mg/L) 1000 940 760 860 1040 1260 1140 1060 1008 Percent removal (%) 95 95 96 96 95 93 94 95 94.8
B3 Analysis results for Polyaluminum Chloride used as Sole Coagulant and
Flocculant
Constant parameter:
pH : 5.0
Coagulation mixing speed : 250 rpm
Coagulation mixing time : 3 min
Flocculation mixing speed : 30 rpm
Flocculation mixing time : 30 min
Table B3.1 : Analysis results for POME treated with Polyaluminum Chloride
A B C D E Dosage (mg/L) Parameter 500 1000 1500 2000 2500
Turbidity (NTU) 1825 1836 805 1100 1555
Percent removal (%) 72.1 72.0 87.7 83.2 76.3
BOD (mg/L) 12555 15850 15840 16185 16065 Percent removal (%) 51.4 38.7 38.7 37.4 37.8
TSS (mg/L) 950 880 1100 1460 2420 Percent removal (%) 95.1 95.4 94.3 92.5 87.5
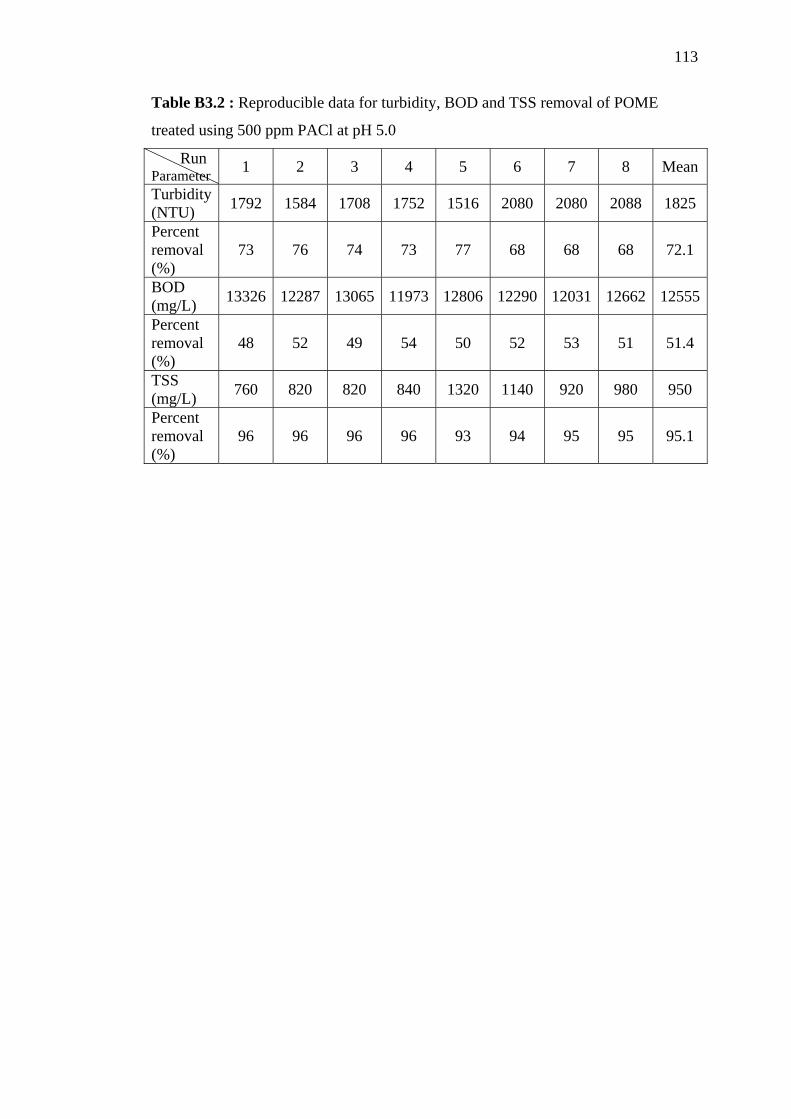
113
Table B3.2 : Reproducible data for turbidity, BOD and TSS removal of POME
treated using 500 ppm PACl at pH 5.0
Run Parameter 1 2 3 4 5 6 7 8 Mean
Turbidity (NTU) 1792 1584 1708 1752 1516 2080 2080 2088 1825
Percent removal (%)
73 76 74 73 77 68 68 68 72.1
BOD (mg/L) 13326 12287 13065 11973 12806 12290 12031 12662 12555
Percent removal (%)
48 52 49 54 50 52 53 51 51.4
TSS (mg/L) 760 820 820 840 1320 1140 920 980 950
Percent removal (%)
96 96 96 96 93 94 95 95 95.1
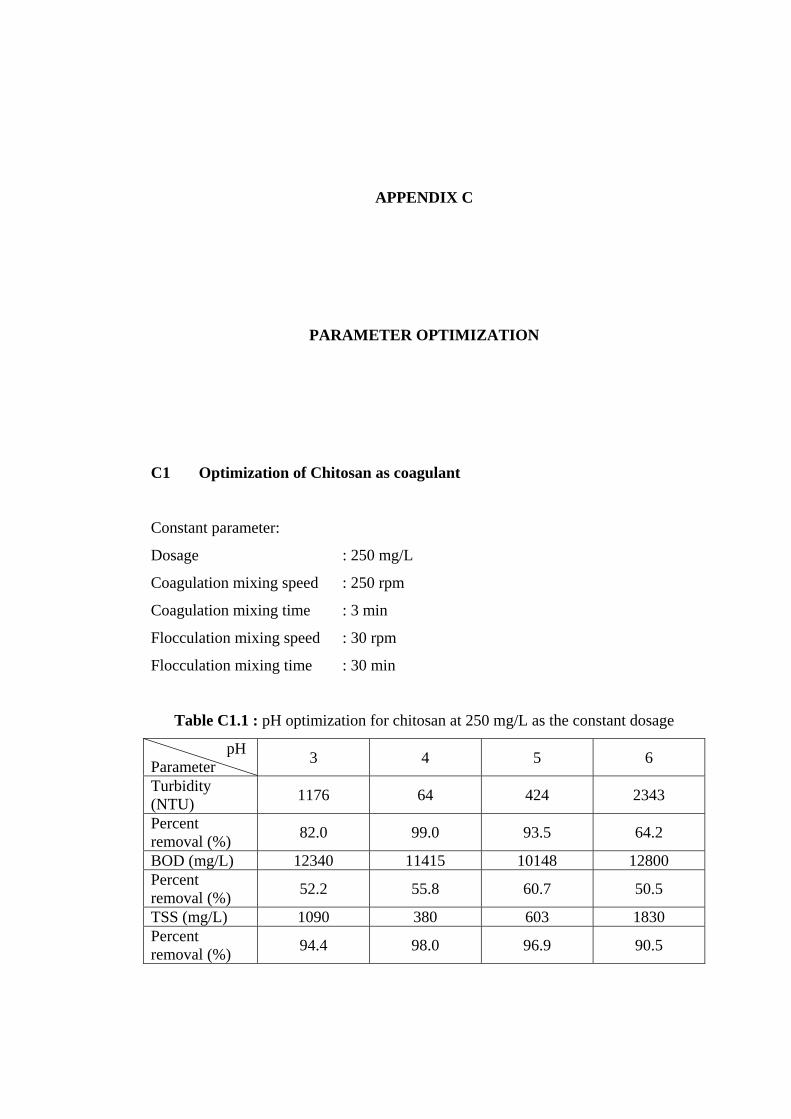
APPENDIX C
PARAMETER OPTIMIZATION
C1 Optimization of Chitosan as coagulant
Constant parameter:
Dosage : 250 mg/L
Coagulation mixing speed : 250 rpm
Coagulation mixing time : 3 min
Flocculation mixing speed : 30 rpm
Flocculation mixing time : 30 min
Table C1.1 : pH optimization for chitosan at 250 mg/L as the constant dosage
pH Parameter 3 4 5 6
Turbidity (NTU) 1176 64 424 2343
Percent removal (%) 82.0 99.0 93.5 64.2
BOD (mg/L) 12340 11415 10148 12800 Percent removal (%) 52.2 55.8 60.7 50.5
TSS (mg/L) 1090 380 603 1830 Percent removal (%) 94.4 98.0 96.9 90.5
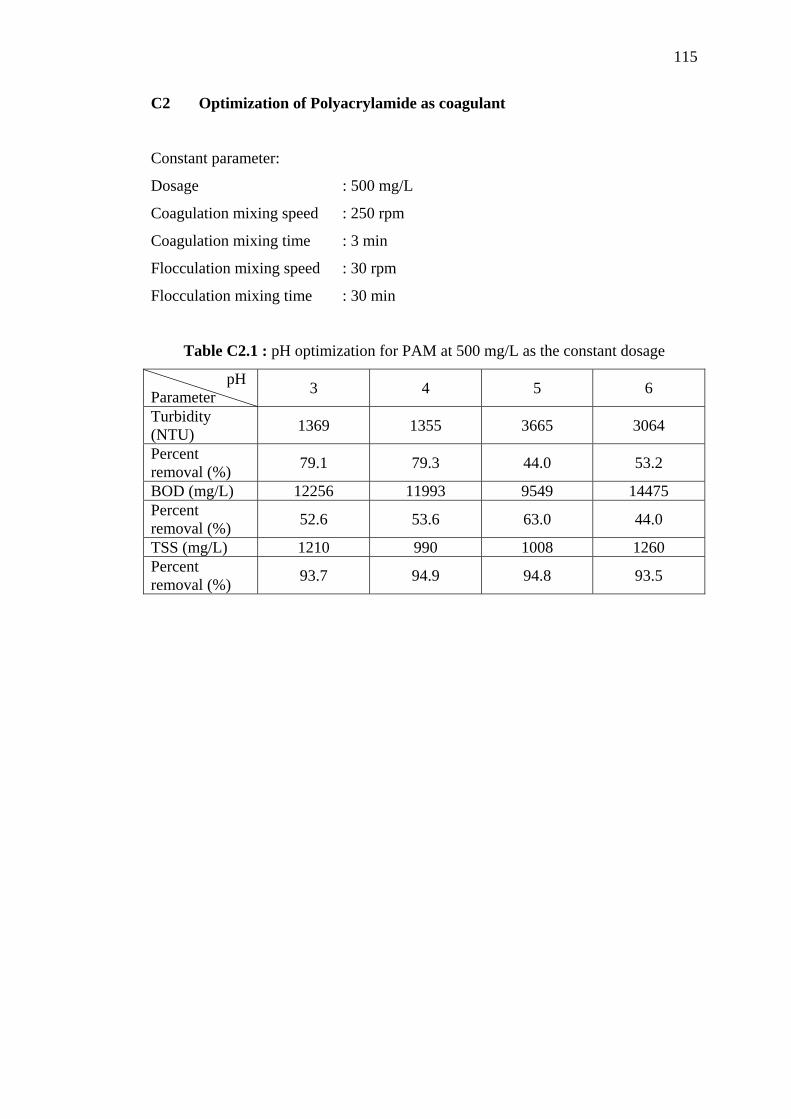
115
C2 Optimization of Polyacrylamide as coagulant
Constant parameter:
Dosage : 500 mg/L
Coagulation mixing speed : 250 rpm
Coagulation mixing time : 3 min
Flocculation mixing speed : 30 rpm
Flocculation mixing time : 30 min
Table C2.1 : pH optimization for PAM at 500 mg/L as the constant dosage
pH Parameter 3 4 5 6
Turbidity (NTU) 1369 1355 3665 3064
Percent removal (%) 79.1 79.3 44.0 53.2
BOD (mg/L) 12256 11993 9549 14475 Percent removal (%) 52.6 53.6 63.0 44.0
TSS (mg/L) 1210 990 1008 1260 Percent removal (%) 93.7 94.9 94.8 93.5
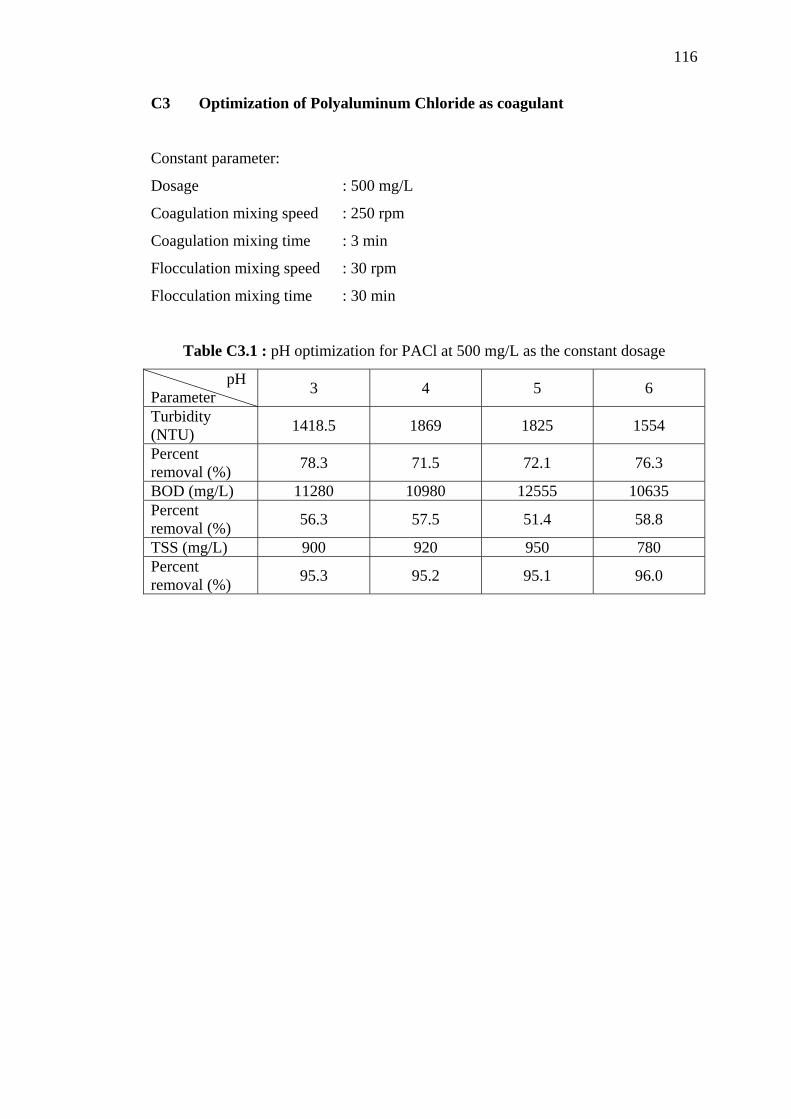
116
C3 Optimization of Polyaluminum Chloride as coagulant
Constant parameter:
Dosage : 500 mg/L
Coagulation mixing speed : 250 rpm
Coagulation mixing time : 3 min
Flocculation mixing speed : 30 rpm
Flocculation mixing time : 30 min
Table C3.1 : pH optimization for PACl at 500 mg/L as the constant dosage
pH Parameter 3 4 5 6
Turbidity (NTU) 1418.5 1869 1825 1554
Percent removal (%) 78.3 71.5 72.1 76.3
BOD (mg/L) 11280 10980 12555 10635 Percent removal (%) 56.3 57.5 51.4 58.8
TSS (mg/L) 900 920 950 780 Percent removal (%) 95.3 95.2 95.1 96.0
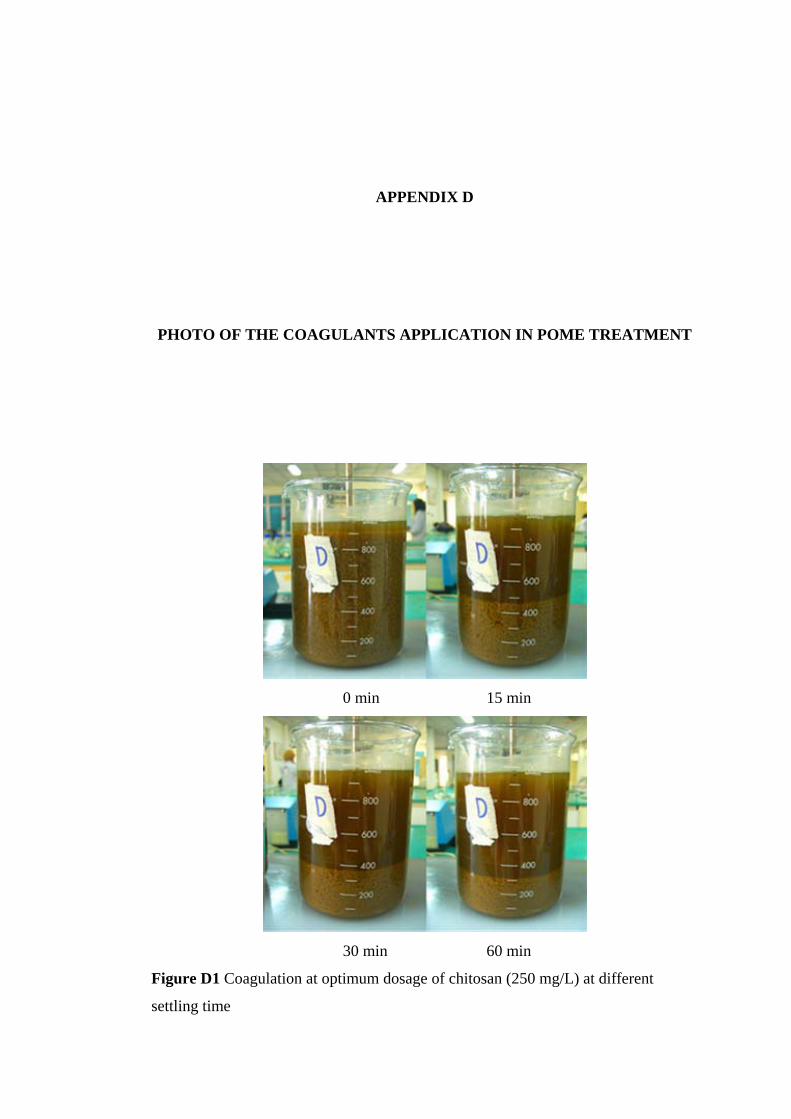
APPENDIX D
PHOTO OF THE COAGULANTS APPLICATION IN POME TREATMENT
0 min 15 min
30 min 60 min
Figure D1 Coagulation at optimum dosage of chitosan (250 mg/L) at different
settling time
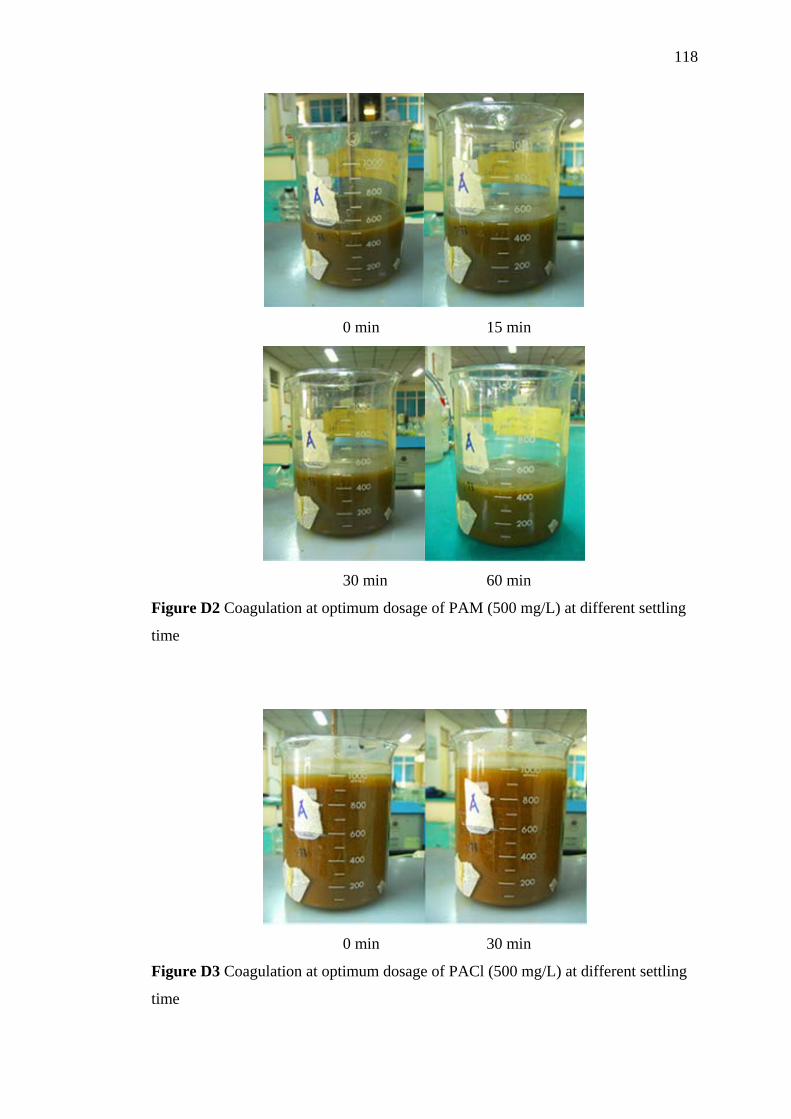
118
0 min 15 min
30 min 60 min
Figure D2 Coagulation at optimum dosage of PAM (500 mg/L) at different settling
time
0 min 30 min
Figure D3 Coagulation at optimum dosage of PACl (500 mg/L) at different settling
time
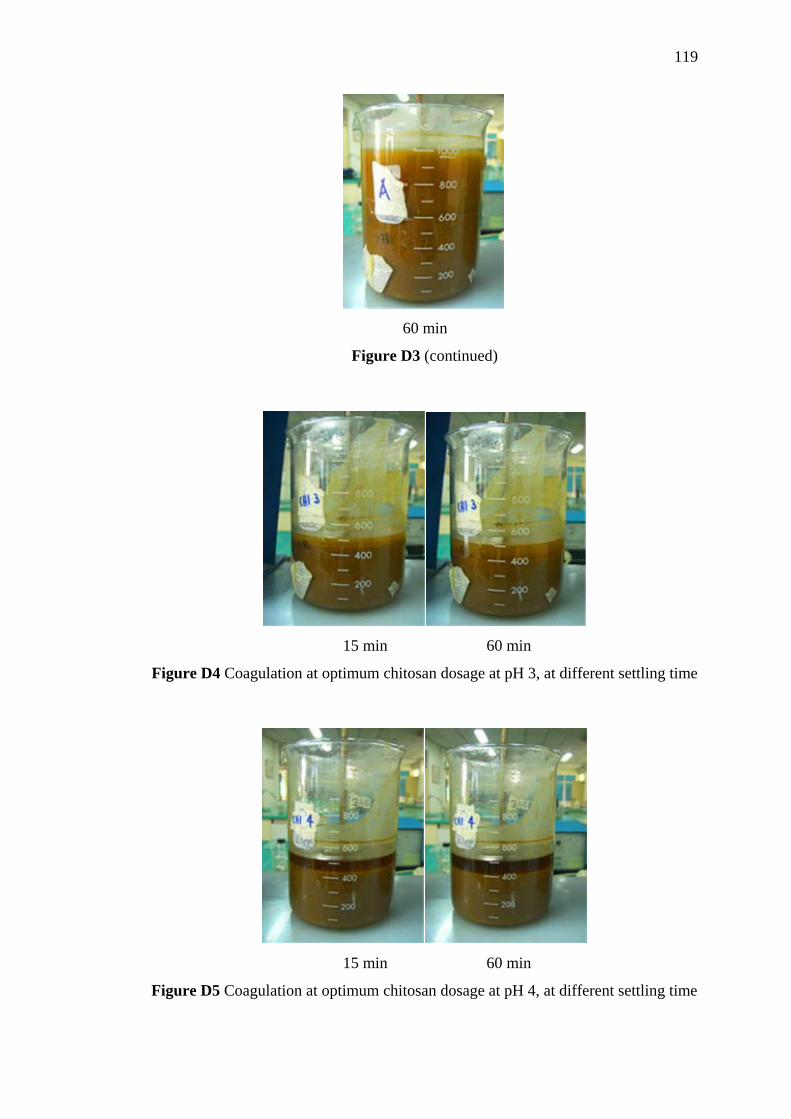
119
60 min
Figure D3 (continued)
15 min 60 min
Figure D4 Coagulation at optimum chitosan dosage at pH 3, at different settling time
15 min 60 min
Figure D5 Coagulation at optimum chitosan dosage at pH 4, at different settling time