Embed Size (px)
Citation preview

PhoCusWright's
Written and Researched by Marcello Gasdia
Edited by Colie Hoffman and Carroll Rheem
®
DESTINATION UNKNOWN: HOW U.S. AND EUROPEAN TRAVELERS DECIDE WHERE TO GO 2012

PhoCusWright’s Destination Unknown: How U.S. and European Travelers Decide Where to Go 2012 September 2012
All PhoCusWright Inc. publications are protected by copyright. It is illegal under U.S. federal law (17USC101 et seq.) to copy, fax or electronically distribute copyrighted material beyond the parameters of the license or outside of your organization
without explicit permission.
PhoCusWright Inc.1 Route 37 East, Suite 200Sherman, CT 06784-1430 USA
+1 860 350-4084+1 860 354-3112 fax
www.phocuswright.com
Philip C. Wolf Chairman
Carol Hutzelman Senior Vice President
Bruce Rosard Vice President, Sales and Marketing
Lorraine Sileo Vice President, Research
PhoCusWright’s Destination Unknown: How U.S. and European Travelers Decide Where to Go 2012 September 2012
PhoCusWright's Destination Unknown:
How U.S. and European Travelers Decide Where to Go 2012
Written and Researched by Marcello Gasdia
Edited by Colie Hoffman and Carroll Rheem
PhoCusWright's Destination Unknown: How U.S. and European Travelers Decide Where to Go 2012 is published by PhoCusWright Inc. The information contained herein is derived from a variety of sources. While every effort has been made to verify the infor-mation, the publisher assumes neither responsibility for inconsistencies or inaccuracies in the data nor liability for any damages of any type arising from errors or omissions.
©2012 PhoCusWright Inc. All Rights Reserved.

PhoCusWright’s Destination Unknown: How U.S. and European Travelers Decide Where to Go 2012 September 2012
Page iv ©2012 PhoCusWright Inc. All Rights Reserved.
PhoCusWright’s Destination Unknown: How U.S. and European Travelers Decide Where to Go 2012 September 2012
©2012 PhoCusWright Inc. All Rights Reserved. Page v
About PhoCusWright Inc.PhoCusWright is the travel industry research authority on how travelers, suppliers and intermediaries connect. Independent, rigorous and unbiased, PhoCusWright fosters smart strategic planning, tactical decision-making and organizational effectiveness.
PhoCusWright delivers qualitative and quantitative research on the evolving dynamics that influence travel, tourism and hospitality distribution. Our marketplace intelligence is the industry standard for segmentation, sizing, forecasting, trends, analysis and consumer travel planning behavior. Every day around the world, senior executives, marketers, strategists and research professionals from all segments of the industry value chain use PhoCusWright research for competitive advantage.
To complement its primary research in North and Latin America, Europe and Asia, PhoCusWright produces several high-profile conferences in the United States and Germany, and partners with conferences in China and Singapore. Industry leaders and company analysts bring this intelligence to life by debating issues, sharing ideas and defining the ever-evolving reality of travel commerce. The company is headquartered in the United States with Asia Pacific operations based in India and local analysts on five continents.
PhoCusWright is a wholly owned subsidiary of Northstar Travel Media, LLC.
www.phocuswright.com

PhoCusWright’s Destination Unknown: How U.S. and European Travelers Decide Where to Go 2012 September 2012
Contents
©2012 PhoCusWright Inc. All Rights Reserved. Page vii
Figures
Figure 1 5U.S. Lodging and Air Traveler Incidence
Figure 2 6Europe Lodging, Air, Rail Traveler Incidence
Figure 3 7U.S. Overall Traveler Statistics
Figure 4 7Germany Overall Traveler Statistics
Figure 5 8France Overall Traveler Statistics
Figure 6 8U.K. Overall Traveler Statistics
Figure 7 9Domestic and International Travel Incidence (U.S.)
Figure 8 10Domestic and International Travel Incidence (France, Germany, U.K.)
Figure 9 11Intentions for Traveling Distance, by Farthest Distance Traveled in Prior Year
Figure 10 13Leisure Destination Types (Incidence Among Travelers)
Figure 11 14Leisure Destination Types (Percentage of Total Trips)
Figure 12 15Independent Destination Selector Profile (U.S.)
Figure 13 16Independent Destination Selector Profile (France, Germany and U.K.)
Figure 14 17Motivation to Selected Destination (Last Trip)
Figure 15 18Influences on Destination Selection (Last Trip)
Figure 16 19Influences on Destination Selection, by Destination Type (Last Trip)
Figure 17 20Influences on Destination Selection, by Destination Type and Market (Last Trip)
Figure 18 21Factors Affecting Destination Selection (Last Trip)
Figure 19 22Online Information Sources Used for Destination Selection (Last Trip)
Figure 20 23Offline Information Sources Used for Destination Selection (Last Trip)
Figure 21 24Internet Usage for Destination Selection (Last Trip) and Shopping (Typical Behavior)
Figure 22 24Number of Websites Typically Used to Pick Destinations Online
Figure 23 25Websites Used for Destination Selection (Last Trip)
Figure 24 26Advance Booking Times (Relative to Planned Departure Date
Figure 25 27Advance Booking Times (Relative to Planned Departure Date), by Destination Type
Figure 26 28Online Features Used During Travel Planning (U.S.)
Figure 27 29Online Features Used During Travel Planning (France)
Figure 28 30Online Features Used During Travel Planning (Germany)
Figure 29 31Online Features Used During Travel Planning (U.K.)
Figure Listings
Section OneOverview, Methodology andResearch Highlights . . . . . .1
Section TwoGeneral Travel Behaviorand Intentions . . . . . . . . .5
Section ThreeThe Destination Decision . . 13

PhoCusWright’s Destination Unknown: How U.S. and European Travelers Decide Where to Go 2012 September 2012
©2012 PhoCusWright Inc. All Rights Reserved. Page 1
Section One
Overview
As a persistent fog of uncertainty lingers over many of the world’s economies, consum-ers have remained conscientious about their discretionary spending. As an “unnecessary” expense, leisure travel is perpetually vulner-able to weakness in consumer confidence. Nevertheless, the vast array of travel options enables consumers with the will to find a way. Travel patterns have shifted as consumers pare their trips down to match their skinny budgets. Understanding the trade-offs travel-ers make is essential for tailoring strategies to match the mood.
Of course, the mood is not the same across markets. Despite the strong connection between the U.S. and European economies, their trajectories have split off. PhoCusWright’s Destination Unknown: How U.S. and European Travelers Decide Where to Go 2012 reveals how differently traveler behavior in the U.S., France, Germany and the U.K. is progressing. In addition to outlining key trends in general travel behavior, this report explores how the process of destination selection is evolving. We track year-over-year shifts in the sources of information travelers rely on as well as their usage of online features.
Methodology
PhoCusWright’s Destination Unknown: How U.S. and European Travelers Decide Where to
Go 2012 is based on separate online surveys of U.S. and European consumers, the full results of which are published in PhoCusWright’s U.S. Consumer Travel Report Fourth Edition (CTR 4) and PhoCusWright’s European Consumer Travel Report Third Edition (ECTR 3). The methodol-ogy for each survey is detailed below. As the studies were fielded at different times, the time period examined in the results is not exactly parallel. To simplify the terminology in this report, results from the two studies are referred to as “2012” results. However, these results reflect consumer behavior over a period that spans 2011 and 2012.
Note that U.K. spend is expressed in euros in both charts and text. Where relevant, when comparing U.S. and European spend, values are converted in parentheses in the report text only. The conversion rate is based on a 12-month average ending on January 1, 2012.
Methodology for U.S. Survey and U.S. Traveler Population Projection
PhoCusWright fielded an online consumer survey January 13-23, 2012 through Global Market Insite, Inc. targeting the general U.S. adult population that has Internet access and travels for leisure.
To qualify for participation in the study, respondents had to indicate they had taken
Overview, Methodology and Research Highlights
PhoCusWright’s Destination Unknown: How U.S. and European Travelers Decide Where to Go 2012 September 2012
PhoCusWright’s Destination Unknown: How U.S. and European Travelers Decide Where to Go 2012 September 2012
Page 2 ©2012 PhoCusWright Inc. All Rights Reserved.
at least one leisure trip at least 75 miles from home in the past 12 months that included paid lodging and/or air travel. An additional screener required consumers to have played an active role in planning their leisure trips. Respondents who qualified are referred to as “U.S. travelers.” The term “lodging” is used in this report to refer to the broad range of paid accommodations including hotels and other nightly priced lodging products as well as timeshares and vacation rentals.
PhoCusWright received 2,036 qualified responses, and the weighted respondent pool can be projected with confidence to the U.S. adult population with Internet access. A total of 4,915 respondents were surveyed to obtain baseline metrics about travelers and nontravel-ers within the general online population. The error interval for analysis of the U.S. traveler population is +/-2.19% at a 95% confidence level. Significant differences noted in this report were identified at a 95% confidence level.
Based on data from the U.S. Census Bureau and Pew Research Center, PhoCusWright proj-ects the number of U.S. adults with Internet access who have taken at least one leisure trip (as previously defined) to be 115 million in 2011. These travelers represent 48% of the total U.S. population. The additional require-ment for respondents to have played an active role in travel planning further narrows the focus of the study, as 18% of travelers were consequently disqualified. CTR 4 examines travelers who played an active role in planning their trips.
Methodology for European Survey and Traveler Population Projection
PhoCusWright fielded an online consumer survey June 1-6, 2012 through Global Market Insite, Inc. targeting the general French,
German and U.K. population that has Internet access and travels for leisure.
To qualify for participation in the study, respondents had to indicate that they had taken at least one overnight leisure trip in the past 12 months that included paid accom-modations at least 100 kilometers from home, air travel and/or rail travel. An additional screener required consumers to have played an active role in planning their leisure trips. Respondents who qualified are referred to as “French/German/U.K. travelers.” Paid accom-modations include hotels and other nightly priced lodging products as well as timeshares and vacation rentals. The term “lodging” is used in this report to refer to the broad range of paid accommodations.
PhoCusWright received 2,614 qualified responses (France 878, Germany 892, U.K. 844) and the respondent pool can be projected with confidence to the adult population with Internet access. Travel incidence levels were calculated based on the responses of 5,749 adults. The error interval for analysis of the traveler population within each individual country is +/-3.4% for France and the U.K., and +/-3.3 for Germany at a 95% confidence level. Significant differences noted in this report were identified at a 95% confidence level.
Based on data from the U.S. Census Bureau International Data Base and Eurostat, PhoCusWright projects the number of adults with Internet access who have taken at least one leisure trip (as previously defined) to be 22 million in France, 31 million in Germany and 27 million in the U.K. in 2012. As ECTR focuses on travel planning, respondents were required to have played an active role in plan-ning their trips which disqualified 16% of the total traveler group. These consumers who traveled but did not plan their trips were
PhoCusWright’s Destination Unknown: How U.S. and European Travelers Decide Where to Go 2012 September 2012
©2012 PhoCusWright Inc. All Rights Reserved. Page 3
counted in the traveler incidence calculation, but are not included in any subsequent analy-sis.
Research Highlights
Leisure travel incidence holds steady across the board, but the U.S. market is stronger
■■ 2012 leisure travel incidence closely resem-bled 2011 across all four markets (U.S. 63%, France 66%, Germany 68%, U.K. 75%)
■■ Fewer travelers in all three European mar-kets paid for lodging in 2012, with the strongest drop in France, from 87% in 2011 to 78% in 2012; paid lodging incidence remained strong in the U.S. at 91%
■■ Average annual travel spend jumped by $223 in the U.S., and by €116 in the U.K. and €73 France while dropping €96 in Germany
■■ International travel incidence increased significantly in the U.S. and France, but remained flat in both the U.K and Germany
More U.S. travelers venture where they please, while more in Europe lean on friends and relatives
■■ The share of U.S. travelers who visited a destination of their choosing increased by 2% to 60%, while incidence of indepen-dent destination selection fell in all three European markets
■■ More travelers from France, Germany and the U.K. stayed with friends and relatives (VFR), in line with dropping incidence of paid lodging across the three markets
■■ Growth in VFR, as a percentage of all trips
taken in the past year, was particularly strong in France (30%) and the U.K. (26%)
U.S. travelers stick with what they know
■■ U.S. travelers are significantly more likely than all other markets to visit a destination more than once; over one third (37%) cited visiting their last destination because of a prior positive experience
■■ French travelers, however, are most likely to explore new destinations.
German travelers are destination-cen-tric compared to others
■■ German travelers have the strongest personal desires to visit specific destinations. Sixty percent selected their last destination based on a personal wish. Germany also has the largest share of independent destination selectors (75%)
Destination research trails shopping online, but not by much
■■ Among independent destination selectors, shopping for travel products online is slight-ly more prevalent than turning to the web for destination ideas. The gap is largest in France (87% versus 73%)
■■ When researching destinations online, U.S. travelers visit significantly fewer websites than their European counterparts. Across all European markets, a little over half visit 3-5 different websites, while U.S. travelers are equally likely to use 3-5 or 1-2 websites
■■ Travel review websites are popular in the U.S. (30%), France (26%) and Germany (24%) during the destination selection process. Still, U.K. travelers (42%) dwarf all other markets in their affinity for travel reviews

PhoCusWright’s Destination Unknown: How U.S. and European Travelers Decide Where to Go 2012 September 2012
Page 4 ©2012 PhoCusWright Inc. All Rights Reserved.
■■ Across markets, general search engines remain the most widely used website type for destination research, followed by online travel agencies (OTAs)
Travelers in different markets prefer dif-ferent online content
■■ For the U.S., France and Germany, interac-tive maps that display lodging and attrac-tions are most popular. Almost three quar-ters of online travel planners in Germany (72%), followed by two thirds in the U.S.
and 57% in France, referenced them while planning at least one other trip in 2012
■■ Traveler-submitted ratings and reviews are ranked highest in the U.K. (67%)
■■ French travelers favor photography. Relative to the other markets, where both profes-sional and traveler-submitted photos take a backseat to other types of online content, professional photography (48%) and travel-er-submitted photos (42%) rank second and third in France, just under interactive maps.
PhoCusWright’s Destination Unknown: How U.S. and European Travelers Decide Where to Go 2012 September 2012
©2012 PhoCusWright Inc. All Rights Reserved. Page 5
General Travel Behavior and Intentions
Section Two
Before digging into the destination selection process, it helps to begin with a general under-standing of the consumer travel trends that shape each market. The standard metrics in this section, including average annual house-hold travel expenditure, component purchas-ing trends (lodging, air and rail), international travel incidence, and intentions for travel distance in the upcoming year, provide valu-able insight into U.S. and European consumer confidence and optimism, and serve as a back-drop for understanding travel decision-making in 2012.
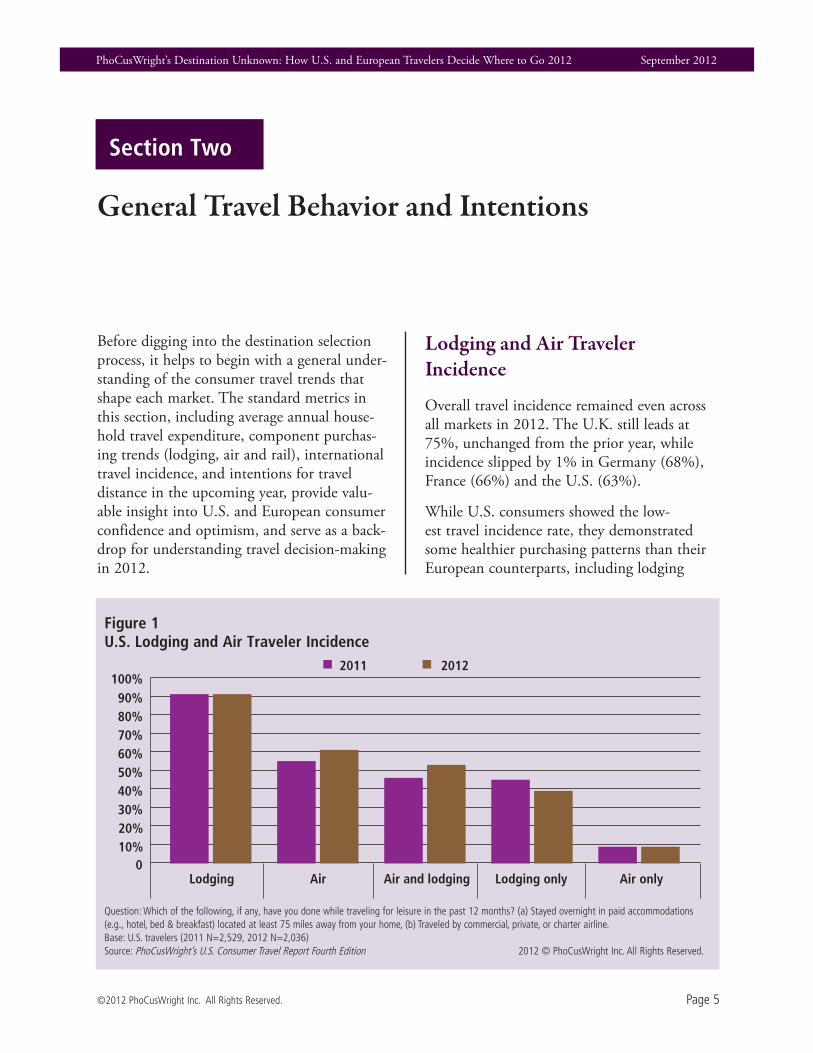
Lodging and Air Traveler Incidence
Overall travel incidence remained even across all markets in 2012. The U.K. still leads at 75%, unchanged from the prior year, while incidence slipped by 1% in Germany (68%), France (66%) and the U.S. (63%).
While U.S. consumers showed the low-est travel incidence rate, they demonstrated some healthier purchasing patterns than their European counterparts, including lodging
Figure 1U .S . Lodging and Air Traveler Incidence
Question: Which of the following, if any, have you done while traveling for leisure in the past 12 months? (a) Stayed overnight in paid accommodations (e.g., hotel, bed & breakfast) located at least 75 miles away from your home, (b) Traveled by commercial, private, or charter airline.Base: U.S. travelers (2011 N=2,529, 2012 N=2,036)Source: PhoCusWright’s U.S. Consumer Travel Report Fourth Edition 2012 © PhoCusWright Inc. All Rights Reserved.
2011 2012
Lodging Air Air and lodging Lodging only Air only0
10%20%30%40%50%60%70%80%90%
100%
PhoCusWright’s Destination Unknown: How U.S. and European Travelers Decide Where to Go 2012 September 2012
Page 6 ©2012 PhoCusWright Inc. All Rights Reserved.
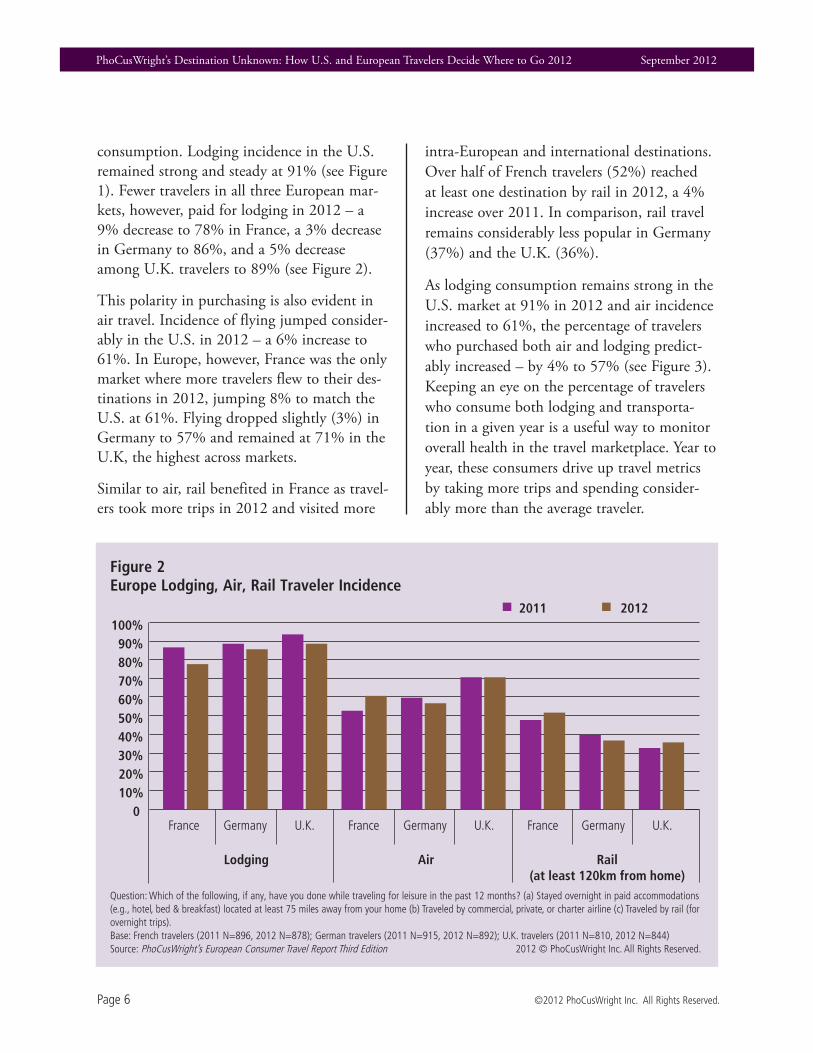
consumption. Lodging incidence in the U.S. remained strong and steady at 91% (see Figure 1). Fewer travelers in all three European mar-kets, however, paid for lodging in 2012 – a 9% decrease to 78% in France, a 3% decrease in Germany to 86%, and a 5% decrease among U.K. travelers to 89% (see Figure 2).
This polarity in purchasing is also evident in air travel. Incidence of flying jumped consider-ably in the U.S. in 2012 – a 6% increase to 61%. In Europe, however, France was the only market where more travelers flew to their des-tinations in 2012, jumping 8% to match the U.S. at 61%. Flying dropped slightly (3%) in Germany to 57% and remained at 71% in the U.K, the highest across markets.
Similar to air, rail benefited in France as travel-ers took more trips in 2012 and visited more
intra-European and international destinations. Over half of French travelers (52%) reached at least one destination by rail in 2012, a 4% increase over 2011. In comparison, rail travel remains considerably less popular in Germany (37%) and the U.K. (36%).
As lodging consumption remains strong in the U.S. market at 91% in 2012 and air incidence increased to 61%, the percentage of travelers who purchased both air and lodging predict-ably increased – by 4% to 57% (see Figure 3). Keeping an eye on the percentage of travelers who consume both lodging and transporta-tion in a given year is a useful way to monitor overall health in the travel marketplace. Year to year, these consumers drive up travel metrics by taking more trips and spending consider-ably more than the average traveler.
Figure 2Europe Lodging, Air, Rail Traveler Incidence
Question: Which of the following, if any, have you done while traveling for leisure in the past 12 months? (a) Stayed overnight in paid accommodations (e.g., hotel, bed & breakfast) located at least 75 miles away from your home (b) Traveled by commercial, private, or charter airline (c) Traveled by rail (for overnight trips).Base: French travelers (2011 N=896, 2012 N=878); German travelers (2011 N=915, 2012 N=892); U.K. travelers (2011 N=810, 2012 N=844)Source: PhoCusWright’s European Consumer Travel Report Third Edition 2012 © PhoCusWright Inc. All Rights Reserved.
France Germany U.K. France Germany U.K. France Germany U.K.
2011 2012
Lodging Air Rail(at least 120km from home)
010%20%30%40%50%60%70%80%90%
100%

PhoCusWright’s Destination Unknown: How U.S. and European Travelers Decide Where to Go 2012 September 2012
©2012 PhoCusWright Inc. All Rights Reserved. Page 7
Figure 3U .S . Overall Traveler Statistics
U.S.
Travel Metric Incidence Annual Spend Trip Frequency
2011 2012 2011 2012 2011 2012
Lodging and air 53% 57% $3,990 $4,359 3.2 3.4
Lodging only 39% 36% $1,571 $1,452 2.3 2.5
Air only 9% 8% $2,065 $1,634 2.0 1.7
Average (Total) -- -- $2,886 $3,109 2.8 3.0
Questions: Which of the following, if any, have you done while traveling for leisure in the past 12 months? (a) Stayed overnight in paid accommodations (e.g., hotel, bed & breakfast) located at least 75 miles away from your home, (b) Traveled by commercial, private, or charter airline. In the last 12 months, how many TOTAL leisure trips did you take that included paid accommodations and/or air travel? What was the total amount your household spent on travel components (including airline tickets, paid accommodations, car rental, cruise tickets, railway tickets for travel over 75 miles) for your N leisure trips in the past year?Base: U.S. travelers (2011 N=2,529, 2012 N=2,036Source: PhoCusWright’s U.S. Consumer Travel Report Fourth Edition 2012 © PhoCusWright Inc. All Rights Reserved.
Figure 4Germany Overall Traveler Statistics
Germany
Travel Metric Incidence Annual Spend Trip Frequency
2011 2012 2011 2012 2011 2012
Lodging and transportation 61% 59% €3,470 €3,489 3.1 3.1
Lodging only 24% 28% €1,525 €1,362 2.1 2.2
Transportation only 14% 13% €1,671 €1,612 1.9 1.8
Average (Total) -- -- €2,740 €2,644 2.9 2.7
Questions: Which of the following, if any, have you done while traveling for leisure in the past 12 months? (a) Stayed overnight in paid accommodations (e.g., hotel, bed & breakfast) located at least 75 miles away from your home, (b) Traveled by commercial, private, or charter airline. In the last 12 months, how many TOTAL leisure trips did you take that included paid accommodations and/or air travel? What was the total amount your household spent on travel components (including airline tickets, paid accommodations, car rental, cruise tickets, railway tickets for travel over 75 miles) for your N leisure trips in the past year?Base: German travelers (2011 N=915, 2012 N=892)Source: PhoCusWright’s European Consumer Travel Report Third Edition 2012 © PhoCusWright Inc. All Rights Reserved.

PhoCusWright’s Destination Unknown: How U.S. and European Travelers Decide Where to Go 2012 September 2012
Page 8 ©2012 PhoCusWright Inc. All Rights Reserved.
Figure 5France Overall Traveler Statistics
France
Travel Metric Incidence Annual Spend Trip Frequency
2011 2012 2011 2012 2011 2012
Lodging and transportation 55% 58% €3,036 €3,244 3.6 4.2
Lodging only 26% 20% €1,381 €1,301 2.6 2.6
Transportation only 19% 22% €2,233 €1,839 2.3 2.8
Average (Total) -- -- €2,479 €2,552 3.1 3.6
Questions: Which of the following, if any, have you done while traveling for leisure in the past 12 months? (a) Stayed overnight in paid accommodations (e.g., hotel, bed & breakfast) located at least 75 miles away from your home, (b) Traveled by commercial, private, or charter airline. In the last 12 months, how many TOTAL leisure trips did you take that included paid accommodations and/or air travel? What was the total amount your household spent on travel components (including airline tickets, paid accommodations, car rental, cruise tickets, railway tickets for travel over 75 miles) for your N leisure trips in the past year?Base: French travelers (2011 N=896, 2012 N=878)Source: PhoCusWright’s European Consumer Travel Report Third Edition 2012 © PhoCusWright Inc. All Rights Reserved.
Figure 6U .K . Overall Traveler Statistics
U.K.
Travel Metric Incidence Annual Spend Trip Frequency
2011 2012 2011 2012 2011 2012
Lodging and transportation 69% 70% €3,211 €3,233 4.0 4.4
Lodging only 19% 19% €757 €1,306 2.9 2.5
Transportation only 13% 11% €1,439 €1,435 2.3 2.3
Average (Total) -- -- €2,560 €2,676 3.6 3.8
Questions: Which of the following, if any, have you done while traveling for leisure in the past 12 months? (a) Stayed overnight in paid accommodations (e.g., hotel, bed & breakfast) located at least 75 miles away from your home, (b) Traveled by commercial, private, or charter airline. In the last 12 months, how many TOTAL leisure trips did you take that included paid accommodations and/or air travel? What was the total amount your household spent on travel components (including airline tickets, paid accommodations, car rental, cruise tickets, railway tickets for travel over 75 miles) for your N leisure trips in the past year?Base: U.K. travelers (2011 N=810, 2012 N=844) Source: PhoCusWright’s European Consumer Travel Report Third Edition 2012 © PhoCusWright Inc. All Rights Reserved.
PhoCusWright’s Destination Unknown: How U.S. and European Travelers Decide Where to Go 2012 September 2012
©2012 PhoCusWright Inc. All Rights Reserved. Page 9
The environment is a bit bleaker in Europe, particularly in Germany, where average travel spend dropped by €96 (see Figure 4). Several factors drove this trend. Unlike the other three markets where trip frequency increased in 2012, Germans took slightly fewer trips (2.7) in 2012. Also, travelers who consumed both lodging and transportation – typically the highest spenders in every market – represented a smaller share of the entire traveler pool in Germany. Conversely, the lowest-spending travelers in Germany, those who purchase lodging only, increased by 4% and spent sig-nificantly less as well.
Trip frequency increased in France more than all other markets – from 3.1 in 2011 to 3.6 in 2012 (see Figure 5). This trend offset the heavy decrease in paid lodging incidence, holding up annual household spend in the market at €2,552. Year-over-year trends changed little in the U.K.; improvements in
both travel spend and trip frequency were marginal (see Figure 6).
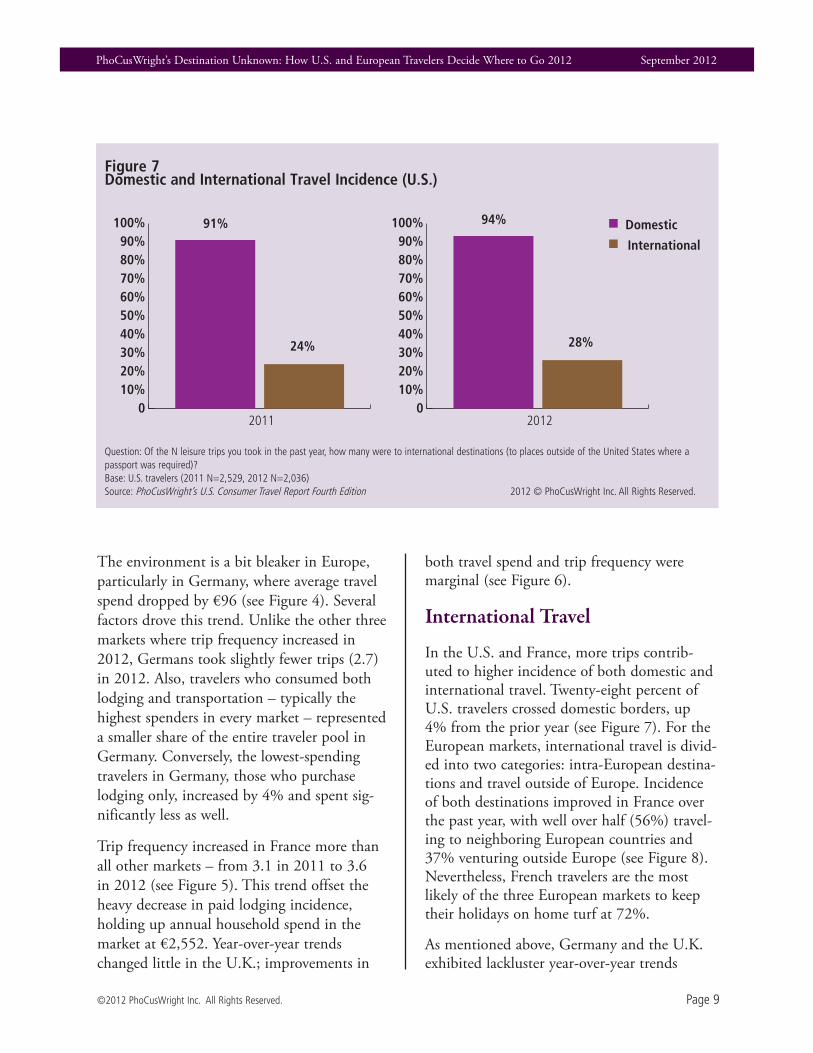
International Travel
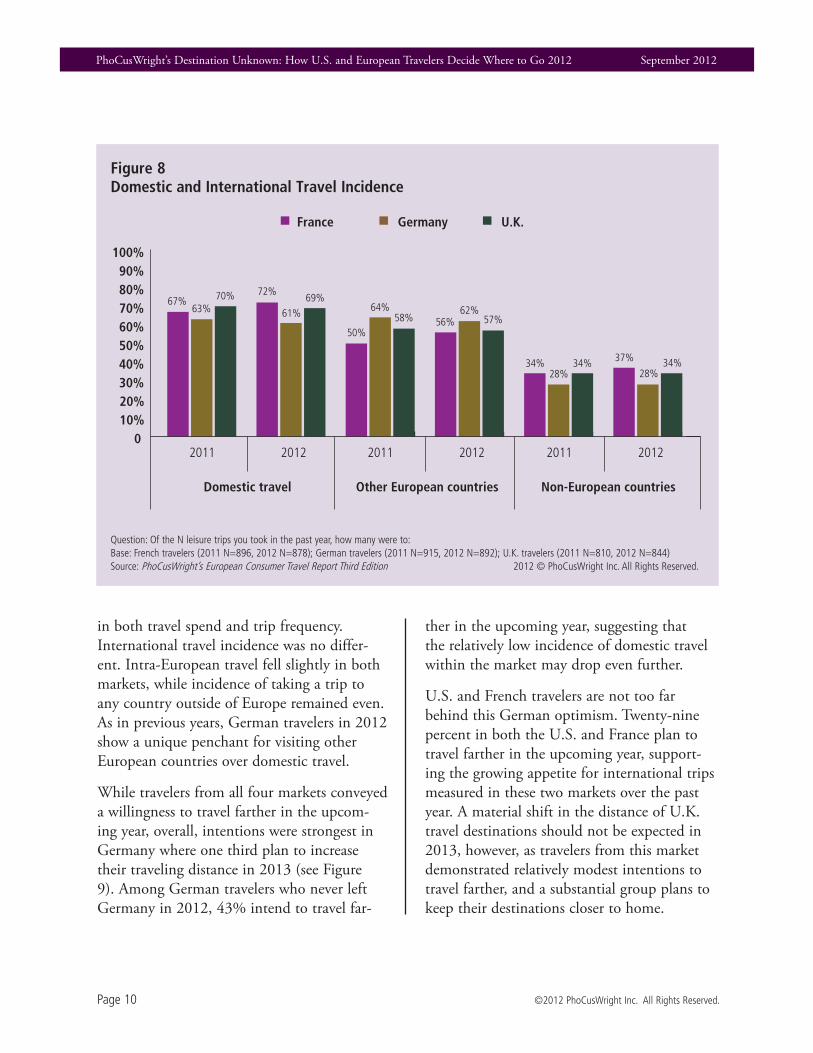
In the U.S. and France, more trips contrib-uted to higher incidence of both domestic and international travel. Twenty-eight percent of U.S. travelers crossed domestic borders, up 4% from the prior year (see Figure 7). For the European markets, international travel is divid-ed into two categories: intra-European destina-tions and travel outside of Europe. Incidence of both destinations improved in France over the past year, with well over half (56%) travel-ing to neighboring European countries and 37% venturing outside Europe (see Figure 8). Nevertheless, French travelers are the most likely of the three European markets to keep their holidays on home turf at 72%.
As mentioned above, Germany and the U.K. exhibited lackluster year-over-year trends
Figure 7Domestic and International Travel Incidence (U .S .)
Question: Of the N leisure trips you took in the past year, how many were to international destinations (to places outside of the United States where a passport was required)?Base: U.S. travelers (2011 N=2,529, 2012 N=2,036)Source: PhoCusWright’s U.S. Consumer Travel Report Fourth Edition 2012 © PhoCusWright Inc. All Rights Reserved.
2011
91%
24%
010%20%30%40%50%60%70%80%90%
100%
2012
94%
28%
010%20%30%40%50%60%70%80%90%
100% Domestic
International
PhoCusWright’s Destination Unknown: How U.S. and European Travelers Decide Where to Go 2012 September 2012
Page 10 ©2012 PhoCusWright Inc. All Rights Reserved.
in both travel spend and trip frequency. International travel incidence was no differ-ent. Intra-European travel fell slightly in both markets, while incidence of taking a trip to any country outside of Europe remained even. As in previous years, German travelers in 2012 show a unique penchant for visiting other European countries over domestic travel.
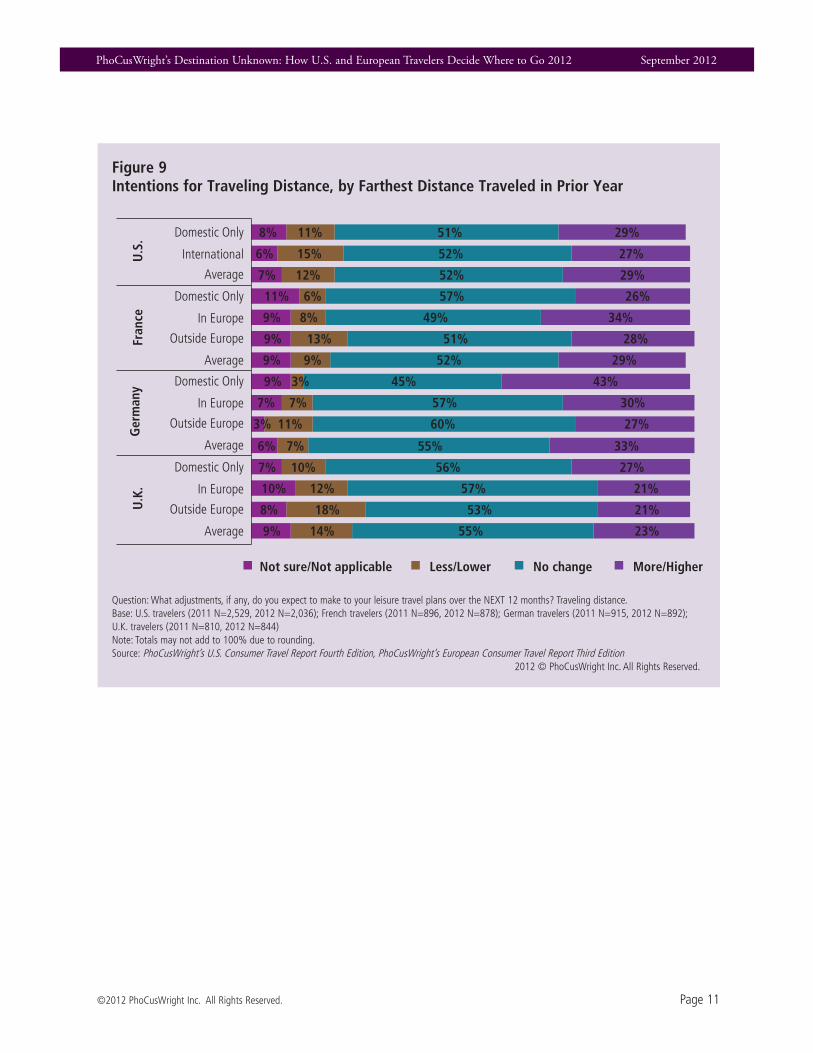
While travelers from all four markets conveyed a willingness to travel farther in the upcom-ing year, overall, intentions were strongest in Germany where one third plan to increase their traveling distance in 2013 (see Figure 9). Among German travelers who never left Germany in 2012, 43% intend to travel far-
ther in the upcoming year, suggesting that the relatively low incidence of domestic travel within the market may drop even further.
U.S. and French travelers are not too far behind this German optimism. Twenty-nine percent in both the U.S. and France plan to travel farther in the upcoming year, support-ing the growing appetite for international trips measured in these two markets over the past year. A material shift in the distance of U.K. travel destinations should not be expected in 2013, however, as travelers from this market demonstrated relatively modest intentions to travel farther, and a substantial group plans to keep their destinations closer to home.
Figure 8Domestic and International Travel Incidence
Question: Of the N leisure trips you took in the past year, how many were to:Base: French travelers (2011 N=896, 2012 N=878); German travelers (2011 N=915, 2012 N=892); U.K. travelers (2011 N=810, 2012 N=844) Source: PhoCusWright’s European Consumer Travel Report Third Edition 2012 © PhoCusWright Inc. All Rights Reserved.
2011 2012
France Germany
Domestic travel Other European countries NonEuropean countries
U.K.
2011 2012 2011 20120
10%20%30%40%50%60%70%80%90%
100%
67%63%
70% 72%
61%69%
50%
64%58% 56%
62%57%
34%28%
34% 37%
28%34%
PhoCusWright’s Destination Unknown: How U.S. and European Travelers Decide Where to Go 2012 September 2012
©2012 PhoCusWright Inc. All Rights Reserved. Page 11
Figure 9Intentions for Traveling Distance, by Farthest Distance Traveled in Prior Year
Question: What adjustments, if any, do you expect to make to your leisure travel plans over the NEXT 12 months? Traveling distance.Base: U.S. travelers (2011 N=2,529, 2012 N=2,036); French travelers (2011 N=896, 2012 N=878); German travelers (2011 N=915, 2012 N=892); U.K. travelers (2011 N=810, 2012 N=844) Note: Totals may not add to 100% due to rounding.Source: PhoCusWright’s U.S. Consumer Travel Report Fourth Edition, PhoCusWright’s European Consumer Travel Report Third Edition 2012 © PhoCusWright Inc. All Rights Reserved.
Not sure/Not applicable Less/Lower No change More/Higher
Domestic Only
International
Average
34%49%8%9%
28%51%13%9%
29%52%9%9%
43%45%3%9%
30%57%7%7%
27%60%11%3%
33%55%7%6%
27%56%10%7%
21%57%12%10%
21%53%18%8%
Domestic Only
In Europe
Outside Europe
Average
Domestic Only
In Europe
Outside Europe
Average
Domestic Only
In Europe
Outside Europe
Average
26%57%6%11%
27%52%15%6%
29%52%12%7%
29%51%11%8%
23%55%14%9%

PhoCusWright’s Destination Unknown: How U.S. and European Travelers Decide Where to Go 2012 September 2012
©2012 PhoCusWright Inc. All Rights Reserved. Page 13
The Destination Decision
Section Three
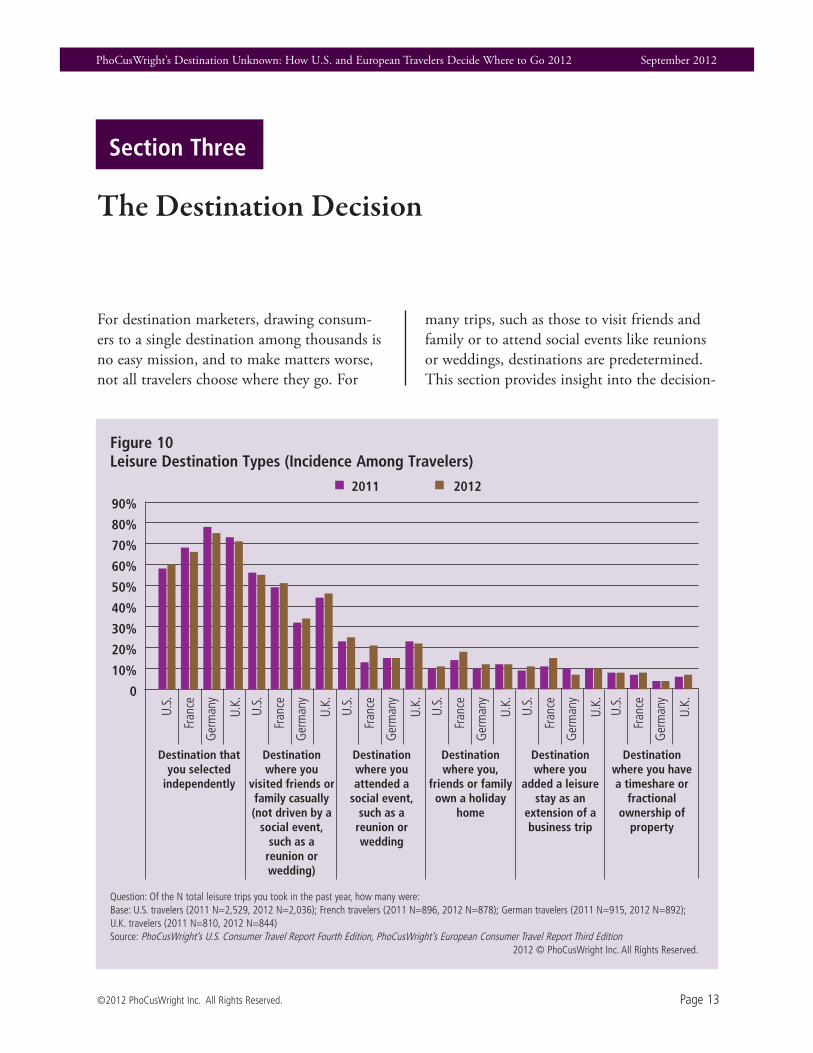
For destination marketers, drawing consum-ers to a single destination among thousands is no easy mission, and to make matters worse, not all travelers choose where they go. For
many trips, such as those to visit friends and family or to attend social events like reunions or weddings, destinations are predetermined. This section provides insight into the decision-
Figure 10Leisure Destination Types (Incidence Among Travelers)
Question: Of the N total leisure trips you took in the past year, how many were:Base: U.S. travelers (2011 N=2,529, 2012 N=2,036); French travelers (2011 N=896, 2012 N=878); German travelers (2011 N=915, 2012 N=892); U.K. travelers (2011 N=810, 2012 N=844) Source: PhoCusWright’s U.S. Consumer Travel Report Fourth Edition, PhoCusWright’s European Consumer Travel Report Third Edition 2012 © PhoCusWright Inc. All Rights Reserved.
2011 2012
0
10%
20%
30%
40%
50%
60%
70%
80%
90%
Destination that you selected
independently
Destination where you
visited friends or family casually (not driven by a
social event, such as a
reunion or wedding)
Destination where you attended a
social event, such as a
reunion or wedding
Destination where you,
friends or family own a holiday
home
Destination where you
added a leisure stay as an
extension of a business trip
Destination where you have a timeshare or
fractional ownership of
property
PhoCusWright’s Destination Unknown: How U.S. and European Travelers Decide Where to Go 2012 September 2012
Page 14 ©2012 PhoCusWright Inc. All Rights Reserved.
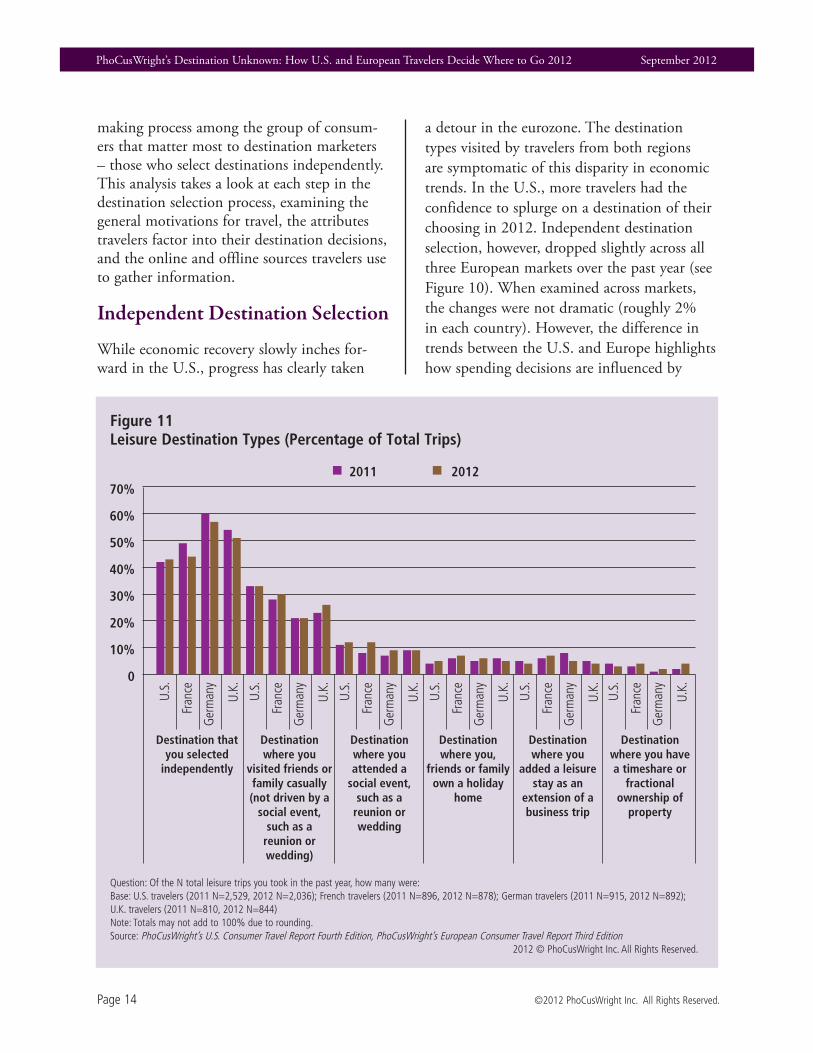
making process among the group of consum-ers that matter most to destination marketers – those who select destinations independently. This analysis takes a look at each step in the destination selection process, examining the general motivations for travel, the attributes travelers factor into their destination decisions, and the online and offline sources travelers use to gather information.
Independent Destination Selection
While economic recovery slowly inches for-ward in the U.S., progress has clearly taken
a detour in the eurozone. The destination types visited by travelers from both regions are symptomatic of this disparity in economic trends. In the U.S., more travelers had the confidence to splurge on a destination of their choosing in 2012. Independent destination selection, however, dropped slightly across all three European markets over the past year (see Figure 10). When examined across markets, the changes were not dramatic (roughly 2% in each country). However, the difference in trends between the U.S. and Europe highlights how spending decisions are influenced by
Figure 11Leisure Destination Types (Percentage of Total Trips)
Question: Of the N total leisure trips you took in the past year, how many were:Base: U.S. travelers (2011 N=2,529, 2012 N=2,036); French travelers (2011 N=896, 2012 N=878); German travelers (2011 N=915, 2012 N=892); U.K. travelers (2011 N=810, 2012 N=844) Note: Totals may not add to 100% due to rounding.Source: PhoCusWright’s U.S. Consumer Travel Report Fourth Edition, PhoCusWright’s European Consumer Travel Report Third Edition 2012 © PhoCusWright Inc. All Rights Reserved.
2011 2012
0
10%
20%
30%
40%
50%
60%
70%
Destination that you selected
independently
Destination where you
visited friends or family casually (not driven by a
social event, such as a
reunion or wedding)
Destination where you attended a
social event, such as a
reunion or wedding
Destination where you,
friends or family own a holiday
home
Destination where you
added a leisure stay as an
extension of a business trip
Destination where you have a timeshare or
fractional ownership of
property
PhoCusWright’s Destination Unknown: How U.S. and European Travelers Decide Where to Go 2012 September 2012
©2012 PhoCusWright Inc. All Rights Reserved. Page 15
macroeconomic trends, not just personal choice.
Despite the increase in U.S. travelers who took discretionary trips, the U.S. continues to lag behind all three European markets – 60% in the U.S. versus 66% in France, 75% in Germany and 71% in the U.K. Clearly, Germany has a strong lead, and this gap grows wider when examined as a percentage of all trips (see Figure 11). Of all trips taken in 2012, well over half (57%) in Germany were to a destination unconnected to social ties or events. In comparison, only 43% of all U.S. trips were independently selected within the past year.
More European travelers fit a vacation into their budgets by visiting friends and rela-tives, most likely to save on hotel expenses. Incidence of VFR increased by 2% across all
European markets – consistent with lower consumption of paid lodging across European markets. U.S. travelers, however, remain most likely to tie their trip destinations to friends and family at 55%. German travelers are least likely to do the same at 34%.
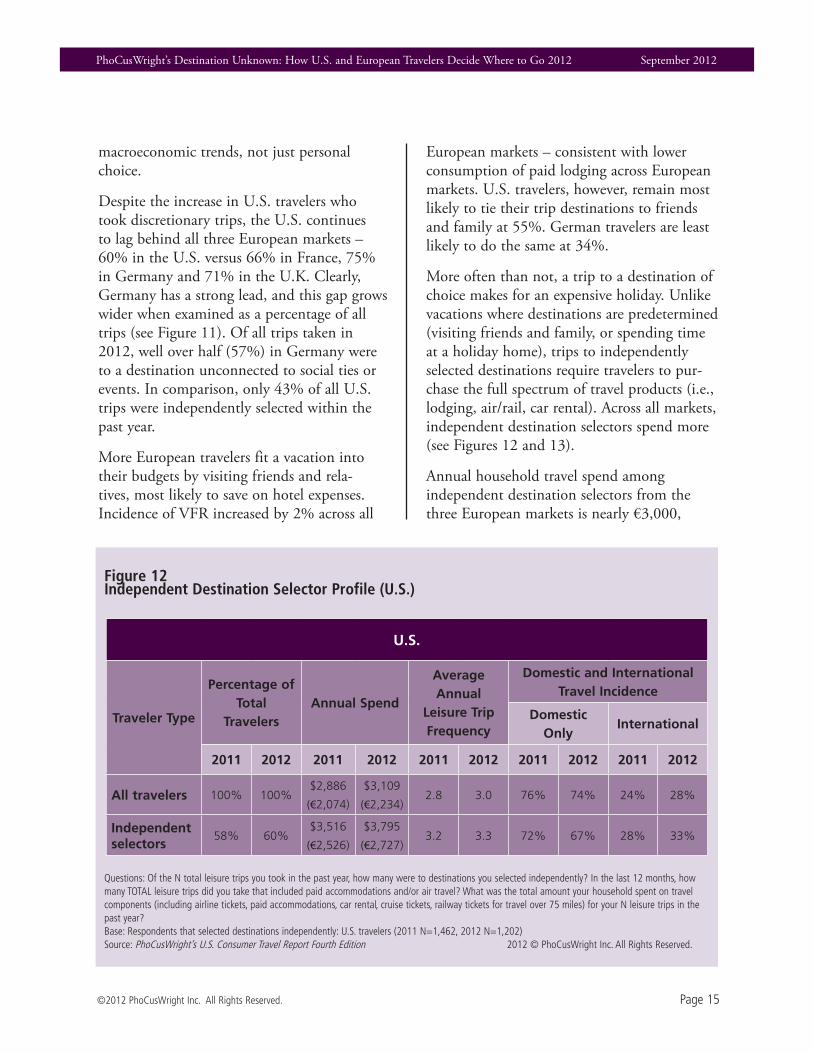
More often than not, a trip to a destination of choice makes for an expensive holiday. Unlike vacations where destinations are predetermined (visiting friends and family, or spending time at a holiday home), trips to independently selected destinations require travelers to pur-chase the full spectrum of travel products (i.e., lodging, air/rail, car rental). Across all markets, independent destination selectors spend more (see Figures 12 and 13).
Annual household travel spend among independent destination selectors from the three European markets is nearly €3,000,
Figure 12Independent Destination Selector Profile (U .S .)
U.S.
Traveler Type
Percentage of Total
TravelersAnnual Spend
Average Annual
Leisure Trip Frequency
Domestic and International Travel Incidence
Domestic Only
International
2011 2012 2011 2012 2011 2012 2011 2012 2011 2012
All travelers 100% 100%$2,886
(€2,074)
$3,109
(€2,234)2.8 3.0 76% 74% 24% 28%
Independent selectors
58% 60%$3,516
(€2,526)
$3,795
(€2,727)3.2 3.3 72% 67% 28% 33%
Questions: Of the N total leisure trips you took in the past year, how many were to destinations you selected independently? In the last 12 months, how many TOTAL leisure trips did you take that included paid accommodations and/or air travel? What was the total amount your household spent on travel components (including airline tickets, paid accommodations, car rental, cruise tickets, railway tickets for travel over 75 miles) for your N leisure trips in the past year? Base: Respondents that selected destinations independently: U.S. travelers (2011 N=1,462, 2012 N=1,202)Source: PhoCusWright’s U.S. Consumer Travel Report Fourth Edition 2012 © PhoCusWright Inc. All Rights Reserved.

PhoCusWright’s Destination Unknown: How U.S. and European Travelers Decide Where to Go 2012 September 2012
Page 16 ©2012 PhoCusWright Inc. All Rights Reserved.
Figure 13Independent Destination Selector Profile (France, Germany and U .K .)
France
Traveler Type
Percentage of
Total Travelers
Annual Spend
Average Annual
Leisure Trip Frequency
Domestic and International Travel Incidence
DomesticOther
EuropeanOutside Europe
2011 2012 2011 2012 2011 2012 2011 2012 2011 2012 2011 2012
All travelers 100% 100% €2,479 €2,552 3.1 3.6 67% 72% 50% 56% 34% 37%
Independent selectors
68% 66% €2,873 €2,977 3.3 3.9 66% 70% 56% 61% 38% 42%
Germany
Traveler Type
Percentage of
Total Travelers
Annual Spend
Average Annual
Leisure Trip Frequency
Domestic and International Travel Incidence
DomesticOther
EuropeanOutside Europe
2011 2012 2011 2012 2011 2012 2011 2012 2011 2012 2011 2012
All travelers 100% 100% €2,740 €2,644 2.9 2.7 63% 61% 64% 62% 28% 28%
Independent selectors
78% 75% €3,076 €2,944 2.8 2.7 61% 59% 70% 67% 31% 29%
U.K.
Traveler Type
Percentage of
Total Travelers
Annual Spend
Average Annual
Leisure Trip Frequency
Domestic and International Travel Incidence
DomesticOther
EuropeanOutside Europe
2011 2012 2011 2012 2011 2012 2011 2012 2011 2012 2011 2012
All travelers 100% 100% €2,560 €2,676 3.6 3.8 70% 69% 58% 57% 34% 34%
Independent selectors
73% 71% €3,050 €2,998 3.9 4.0 70% 71% 62% 63% 38% 35%
Questions: Of the N total leisure trips you took in the past year, how many were to destinations you selected independently? In the last 12 months, how many TOTAL leisure trips did you take that included paid accommodations and/or air travel? What was the total amount your household spent on travel components (including airline tickets, paid accommodations, car rental, cruise tickets, railway tickets for travel over 75 miles) for your N leisure trips in the past year?Base: Respondents who selected destinations independently: French travelers (2011 N=607, 2012 N=583); German travelers (2011 N=710, 2012 N=665); U.K. travelers (2011 N=592, 2012 N=603) Source: PhoCusWright’s European Consumer Travel Report Third Edition 2012 © PhoCusWright Inc. All Rights Reserved.
PhoCusWright’s Destination Unknown: How U.S. and European Travelers Decide Where to Go 2012 September 2012
©2012 PhoCusWright Inc. All Rights Reserved. Page 17
whereas the average European traveler spends much closer to €2,500. Spend drops slightly among independent selectors in the U.S. ($3,795/€2,727), but still exceeds average U.S. traveler spend ($3,109/€2,234).
In 2012, annual spend among independent destination selectors increased significantly in the U.S. (+$279) and France (+€104), while slipping slightly in the U.K. (-€52) and Germany (-€132). A large driver of this trend is international travel. More independent des-tination selectors picked international holiday destinations in the U.S. and France, while international travel incidence fell across the
same group in the U.K. and Germany.
Sources of Influence
Picking a destination is the first of many deci-sions consumers make while navigating a travel planning process that includes multiple phases: 1) destination selection, 2) shopping, 3) booking and 4) sharing travel experiences. Considering destination selection’s lead posi-tion in the decision chain, it often influences travelers’ subsequent behavior, including what travel products they need to purchase, where they shop, and how they book. Understanding the sources of influence that shape this ini-
Figure 14Motivation to Selected Destination (Last Trip)
Question: What motivated you to take this trip? Select all that apply.Base: Respondents who selected destinations independently: U.S. travelers (2011 N=1,462, 2012 N=1,202); French travelers (2011 N=607, 2012 N=583); German travelers (2011 N=710, 2012 N=665); U.K. travelers (2011 N=592, 2012 N=603) Source: PhoCusWright’s U.S. Consumer Travel Report Fourth Edition, PhoCusWright’s European Consumer Travel Report Third Edition 2012 © PhoCusWright Inc. All Rights Reserved.
France Germany
Desire to get away/take a break
Desire to spend time away with friends/family
Set holiday time from work
Set holiday time off from work/school
Celebration of an occasion, such as honeymoon, birthday or anniversary
To attend a specific event, such as a concert or sporting event
Extra money/gift/bonus
Loyalty program miles/points redemption
Other
U.S. U.K.
% 10% 20% 30% 40% 50% 60% 70%
PhoCusWright’s Destination Unknown: How U.S. and European Travelers Decide Where to Go 2012 September 2012
Page 18 ©2012 PhoCusWright Inc. All Rights Reserved.
tial phase of travel planning is therefore critical for gaining insight into the full gamut of travel behavior. In PhoCusWright’s U.S. Consumer Travel Report Fourth Edition and PhoCusWright’s European Consumer Travel Report Third Edition, independent destination selectors were taken through a series of ques-tions regarding their last trip.
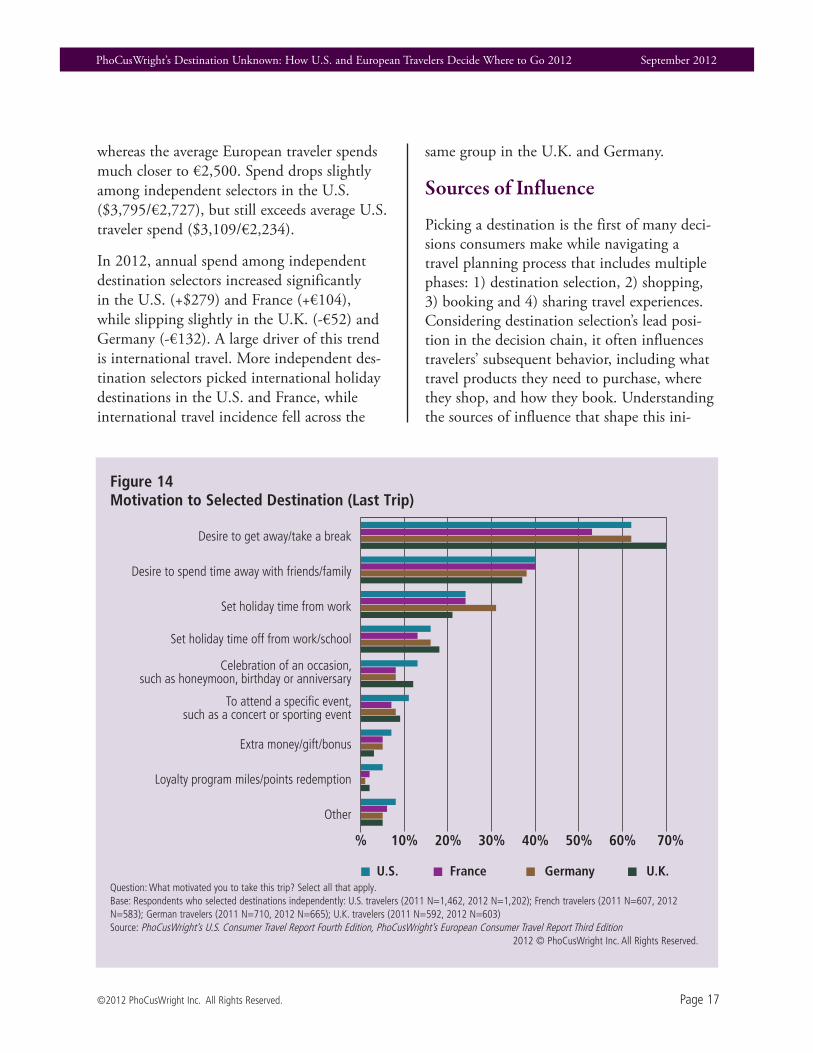
Even before they pick a location, travelers need at least a general motivation to initiate the planning process. Naturally, year after year, the strongest motivation to travel – the desire to get away/take a break – is not likely to change.
However, the strength of this motivator var-ies significantly by market. Seventy percent of U.K. travelers stated the desire to get away/take a break as a motivation to take their last trip, while only 53% in France said the same. The U.S. and Germany lie in the middle, both at 62% (see Figure 14). The desire to spend time away with friends and family is the sec-ond most popular motivation for travel, with little variation across the markets. Available holiday time from work and set holiday time off from work/school come in third and fourth place, respectively.
Figure 15Influences on Destination Selection (Last Trip)
Question: What influenced you to select your specific destination(s) for this particular trip? Select all that apply.Base: Respondents who selected destinations independently: U.S. travelers (2011 N=1,462, 2012 N=1,202); French travelers (2011 N=607, 2012 N=583); German travelers (2011 N=710, 2012 N=665); U.K. travelers (2011 N=592, 2012 N=603) Source: PhoCusWright’s U.S. Consumer Travel Report Fourth Edition, PhoCusWright’s European Consumer Travel Report Third Edition 2012 © PhoCusWright Inc. All Rights Reserved.
France Germany
Personal wish to visit the destination
Prior experience (enjoyed a previous trip there)
Climate
Cultural attractions (e.g., museums, historical landmarks
Appeal of hotel/lodging amenities
Available activities (e.g., snorkeling, skiing, gaming)
Proximity
Recommendation by friends/family
Affordability of dining and shopping
Other
Fit with travel dates
Special event, such as a concert or sporting event
Price of hotel/lodging
Price of airline ticket
U.S. U.K.
0 10% 20% 30% 40% 50% 60% 70%
PhoCusWright’s Destination Unknown: How U.S. and European Travelers Decide Where to Go 2012 September 2012
©2012 PhoCusWright Inc. All Rights Reserved. Page 19
Figure 16Influences on Destination Selection, by Destination Type (Last Trip)
Question: What influenced you to select your specific destination(s) for this particular trip? Select all that apply.Base: Respondents who selected destinations independently: U.S. travelers (2012 N=1,202)Source: PhoCusWright’s U.S. Consumer Travel Report Fourth Edition 2012 © PhoCusWright Inc. All Rights Reserved.
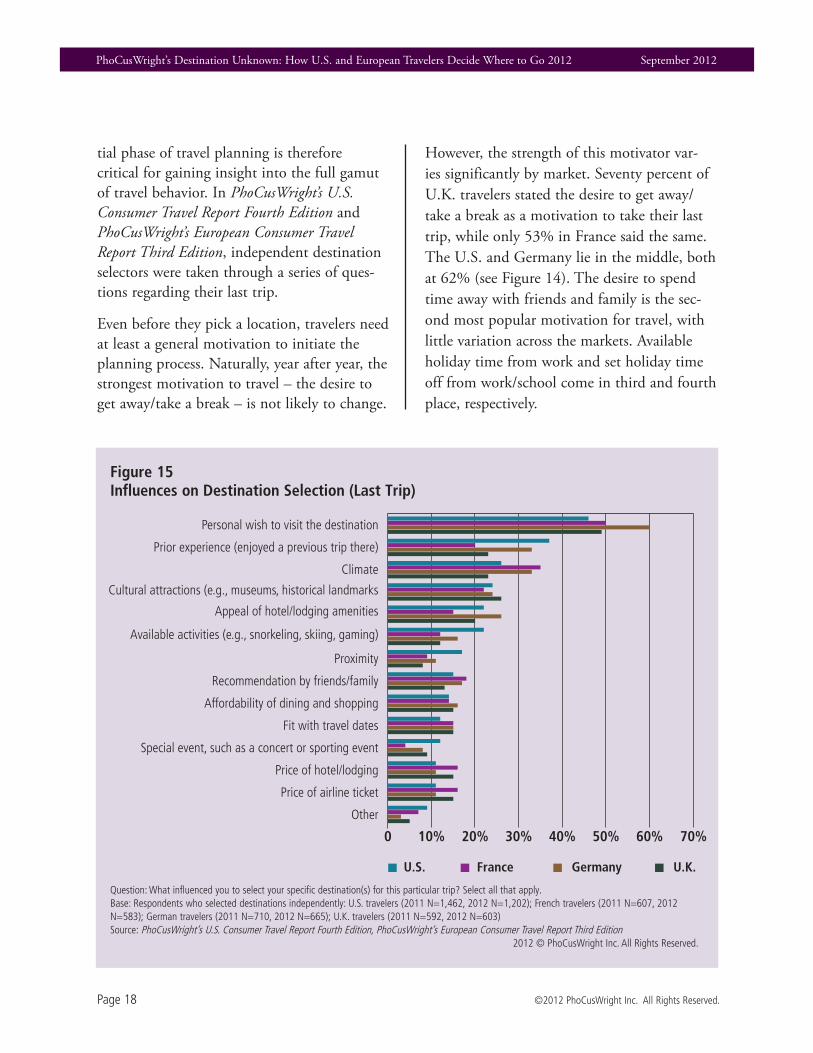
From tropical climates and beaches to cultural attractions and in-destination activities, travel-ers have countless reasons for visiting specific destinations. Year after year, however, the same influencer rises to the top of the list – a per-sonal wish to visit the destination (see Figure 15). Of course, this is a very general justifica-tion that most likely encompasses many of the specific reasons detailed in Figure 15. In relation to these specific reasons, the markets differ considerably.
Ahead of other markets, U.S. travelers often choose destinations based on prior visits (37%), making them the most likely in the four markets to be repeat visitors to a destina-tion. While they also weigh in heavily on cli-
mate and cultural attractions, they distinguish themselves from other markets with their prioritization of in-destination activities, such as snorkeling, skiing and gaming. Over one in five (22%) cited that available destination activities influenced their destination decision for their last trip.
Both climate and prior experience rank high in Germany at 33% each, and German travel-ers are the most likely of the four markets to factor the appeal of hotel/lodging amenities in to their destination decisions (26%). Climate is especially important for French travelers, as 35% cited it as an influential factor in destina-tion selection. U.K. travelers are most likely of the four markets to base their final decisions
International
Personal wish to visit the destination
Prior experience
Price of hotel/lodging
Available activities
Appeal of hotel/lodging amenities
Climate
Proximity
Cultural attractions
Special event
Other
Recommended by friends/family
Fit with travel dates
Affordability of dining/shopping
Price of airline ticket
Domestic only
% 10% 20% 30% 40% 50% 60% 70%

PhoCusWright’s Destination Unknown: How U.S. and European Travelers Decide Where to Go 2012 September 2012
Page 20 ©2012 PhoCusWright Inc. All Rights Reserved.
on cultural attractions.
Travelers consider a different set of criteria for picking domestic destinations versus interna-tional ones. Respondents were segmented into groups based on the location of their last trip – either domestic or international destinations. Among U.S. international travelers, three sources of influence rose to the top – per-sonal wish (57%), climate (38%) and cultural attractions (34%) (see Figure 16). Compared to U.S. consumers who traveled domestically, international travelers were much more likely to factor recommendations from friends and
family, scheduling and transportation costs in to their destination decisions.
European travelers were separated into three groups based on the location of their last trip – domestic destinations, other European desti-nations and those outside of Europe. Like the U.S., favorable climates and personal desire remain highly influential for picking interna-tional destinations, especially among German travelers, where over half (52%) visit destina-tions outside of Europe because of climate (see Figure 17). In the U.K., travelers are strongly influenced by hotel prices for domestic trips,
Figure 17Influences on Destination Selection, by Destination Type and Market (Last Trip)
Question: What influenced you to select your specific destination(s) for this particular trip? Select all that apply.Base: Respondents who selected destinations independently: French travelers (2011 N=607, 2012 N=583); German travelers (2011 N=710, 2012 N=665); U.K. travelers (2011 N=592, 2012 N=603) Source: PhoCusWright’s European Consumer Travel Report Third Edition 2012 © PhoCusWright Inc. All Rights Reserved.
Domestic only Other European Outside Europe
10% 30% 50% 70% 10% 30% 50% 70% 10% 30% 50% 70%
France Germany U.K.
Personal wish to visit the destination
Prior experience
Price of hotel/lodging
Available activities
Appeal of hotel/lodging amenities
Climate
Proximity
Cultural attractions
Special event
Other
Recommended by friends/family
Fit with travel dates
Affordability of dining/shopping
Price of airline ticket
PhoCusWright’s Destination Unknown: How U.S. and European Travelers Decide Where to Go 2012 September 2012
©2012 PhoCusWright Inc. All Rights Reserved. Page 21
but this factor loses relative importance for international vacations.
Information Sources
While the impulse to get away/take a break and the desire to spend time with loved ones are top motivations for traveling in general, the appeal of the destination itself often acts as a catalyst or a main driver to begin trip plan-ning. By the time travelers start getting serious about planning their vacations, however, it is often too late for destination marketers to
influence decisions. Many consumers (more than half in each market) already have a specif-ic destination in mind when they begin plan-ning a trip, while the rest remain at least some-what flexible (see Figure 18). Travelers, how-ever, do not develop a desire to visit a specific location out of the blue. Destination marketers must therefore strategize for the long term rather than rely on quick fixes. While direct response marketing campaigns are important for all marketers, destination marketers must also devote funds for campaigns that support overall branding efforts.
Figure 18Factors Affecting Destination Selection (Last Trip)
Question: Which of the following statements best describes the circumstances of this trip? Select one.Base: Respondents who selected destinations independently: U.S. travelers (2011 N=1,462, 2012 N=1,202); French travelers (2011 N=607, 2012 N=583); German travelers (2011 N=710, 2012 N=665); U.K. travelers (2011 N=592, 2012 N=603) Source: PhoCusWright’s U.S. Consumer Travel Report Fourth Edition, PhoCusWright’s European Consumer Travel Report Third Edition 2012 © PhoCusWright Inc. All Rights Reserved.
0
10%
20%
30%
40%
50%
60%
70%
I had the specific destination in
mind and planned this trip around it
I had a few places in mind when I
started researching destinations
I had no specific destinations in
mind until I started
researching and planning
I hadn't been thinking about taking this trip, but saw a good
deal for this destination and
decided to book it
Other
PhoCusWright’s Destination Unknown: How U.S. and European Travelers Decide Where to Go 2012 September 2012
Page 22 ©2012 PhoCusWright Inc. All Rights Reserved.
Figure 19Online Information Sources Used for Destination Selection (Last Trip)
Question: What sources of information did you use to help you select the destination(s) for this trip? Select all that apply. Base: Respondents who selected destinations independently: U.S. travelers (2011 N=1,462, 2012 N=1,202); French travelers (2011 N=607, 2012 N=583); German travelers (2011 N=710, 2012 N=665); U.K. travelers (2011 N=592, 2012 N=603) Source: PhoCusWright’s U.S. Consumer Travel Report Fourth Edition, PhoCusWright’s European Consumer Travel Report Third Edition 2012 © PhoCusWright Inc. All Rights Reserved.
Information sources used in destination selec-tion are broken down into online and offline channels. Across digital and traditional chan-nels, no single source of information com-mands more attention than the desktop web (see Figure 19). Roughly 60% of independent destination selectors in each market research destinations using laptops and desktops; U.K. travelers lead at 67%. A substantially larger proportion of U.S. travelers (60%) looked for destination information via this channel in 2012, a 6% increase over 2011.
Other digital channels, namely online advertis-ing/email campaigns and the mobile web, have a greater reach over U.S. travelers compared to those in Europe. Seventeen percent of inde-pendent destination selectors in the U.S. used online advertising and emails from travel com-panies as sources of destination information
within the past year, compared to only 5% in France, 9% in Germany and 10% in the U.K. Conducting destination research via mobile devices is slightly more popular in the U.S. (16%) than in Europe.
However important the web has become for consumers, offline channels should not be dis-counted, especially for certain markets within Europe. For example, despite lower usage lev-els in 2012, German travelers widely reference print sources when picking where to go (see Figure 20). More than one in five (21%) read travel guidebooks and almost as many (19%) reference other types of print publications, articles and brochures. Overall, however, the audience for print media shrank considerably in every European market besides the U.K. and remains the smallest in the U.S.
2011 2012
Websites via computer Online advertising/email Websites/apps via mobile device
0
10%
20%
30%
40%
50%
60%
70%
80%
PhoCusWright’s Destination Unknown: How U.S. and European Travelers Decide Where to Go 2012 September 2012
©2012 PhoCusWright Inc. All Rights Reserved. Page 23
While personal recommendations are the most influential non-digital source of information across markets, U.S. and German travel-ers remain slightly more likely than those in France and the U.K. to consider input from friends and family, at 31% and 30%, respectively. More than in the other markets, a significant portion of travelers in Germany and U.K. – roughly one in 10 – rely on travel agents for destination advice.
Across all markets, travelers who pick their
destinations independently remain more likely to use the web to shop for travel products than to research destinations1 (see Figure 21). The biggest gap occurs in France, where 87% shopped for travel products on the web, while only 73% went online during the destination selection process.
While a comparable number of U.S. and European travelers look to the web for destina-tion information, both groups have consider-ably different online research habits. Just over
Figure 20Offline Information Sources Used for Destination Selection (Last Trip)
Questions: What sources of information did you use to help you select the destination(s) for this trip? Select all that apply. Base: Respondents who selected destinations independently: U.S. travelers (2011 N=1,462, 2012 N=1,202); French travelers (2011 N=607, 2012 N=583); German travelers (2011 N=710, 2012 N=665); U.K. travelers (2011 N=592, 2012 N=603) Source: PhoCusWright’s U.S. Consumer Travel Report Fourth Edition, PhoCusWright’s European Consumer Travel Report Third Edition 2012 © PhoCusWright Inc. All Rights Reserved.
1 Online destination research includes the use of at least one online source of information during destination selection, including websites via computer, the mobile web or online advertising/email.
2011 2012
0
5%
10%
15%
20%
25%
30%
35%
Personal recommendations
from friends/family
Information in printed travel guidebooks
Printed publications,
articles or brochures
Calls/visits to travel
professionals/travel agents
Calls/visits to local destina
tion or national tourism offices
Calls to travel providers, such as airlines and
hotel companies

PhoCusWright’s Destination Unknown: How U.S. and European Travelers Decide Where to Go 2012 September 2012
Page 24 ©2012 PhoCusWright Inc. All Rights Reserved.
Figure 21Internet Usage for Destination Selection (Last Trip) and Shopping (Typical Behavior)
Questions: What sources of information/media did you reference when selecting the destination(s) for this trip? Select all that apply. What sources of information/media do you typically reference when comparing and choosing leisure travel products, such as airline tickets or hotel rooms? Select all that apply.Base: Respondents who selected destinations independently: U.S. travelers (2011 N=1,462, 2012 N=1,202); French travelers (2011 N=607, 2012 N=583); German travelers (2011 N=710, 2012 N=665); U.K. travelers (2011 N=592, 2012 N=603) Source: PhoCusWright’s U.S. Consumer Travel Report Fourth Edition, PhoCusWright’s European Consumer Travel Report Third Edition 2012 © PhoCusWright Inc. All Rights Reserved.
Figure 22Number of Websites Typically Used to Pick Destinations Online*
*Excludes travelers who use zero websitesQuestion: When traveling for leisure, how many websites, if any, do you typically visit when doing the following? Selecting a destination.Base: U.S. travelers (2011 N=2,529; 2012 N=2,036); French travelers (2011 N=896, 2012 N=878); German travelers (2011 N=915, 2012 N=892); U.K. travelers (2011 N=810, 2012 N=844) Source: PhoCusWright’s U.S. Consumer Travel Report Fourth Edition, PhoCusWright’s European Consumer Travel Report Third Edition 2012 © PhoCusWright Inc. All Rights Reserved.
2011 2012
Destination Selection Shopping
010%20%30%40%50%60%70%80%90%
100%
12 websites 35 websites
2011
44% 46%
11%
37%
51%
13%
22%
59%
20%
34%
48%
18%
45%46%
9%
36%
53%
11%
26%
53%
20%
35%
52%
13%
6+ websites
2012

PhoCusWright’s Destination Unknown: How U.S. and European Travelers Decide Where to Go 2012 September 2012
©2012 PhoCusWright Inc. All Rights Reserved. Page 25
half in France, Germany and the U.K. visit 3-5 different websites when picking destina-tions online, with much fewer using more or less. A considerable percentage of U.S. travel-ers (45%), however, only scan one or two dif-ferent sites (see Figure 22). Just over half in France, Germany and the U.K. visit 3-5 differ-ent websites, with many fewer using more or less. A considerable percentage of U.S. travel-ers (44%), however, only scan one or two dif-ferent sites.
In 2012, a considerable shift occurred among the types of websites travelers visited to find destination information. Among independent
destination selectors who used online sources of information, general search engines remain the most widely used across the four markets, and their popularity increased among U.S. travelers (57%) but fell in Germany by 6% in 2012 to 53% (see Figure 23). Overall, half of online destination selectors in Europe refer-ence search engines during destination selec-tion.
OTAs are second on the list in all markets except the U.K., and like search, more U.S. travelers used them in 2012 (42%) than in 2011, while use in Germany dropped 3% to 37%. The phenomenal growth of trav-
Figure 23Websites Used for Destination Selection (Last Trip)
Question: What type(s) of websites did you use? Select all that apply. Base: Travelers who selected leisure destinations independently and used websites as information sources: U.S. travelers (2011 N=874, 2012 N=793); French travelers (2011 N=420, 2012 N=421); German travelers (2011 N=464, 2012 N=470); U.K. travelers (2011 N=420, 2012 N=433) Source: PhoCusWright’s U.S. Consumer Travel Report Fourth Edition 2012 © PhoCusWright Inc. All Rights Reserved.
2011 2012
0
10%
20%
30%
40%
50%
60%
70%
General search
engines
Online travel agency
websites
Traveler review
websites
Traveler provider websites
Travel search
engines
Destination websites
Travel guide
websites
Deals newsletters/
websites
Magazine/ newspaper websites
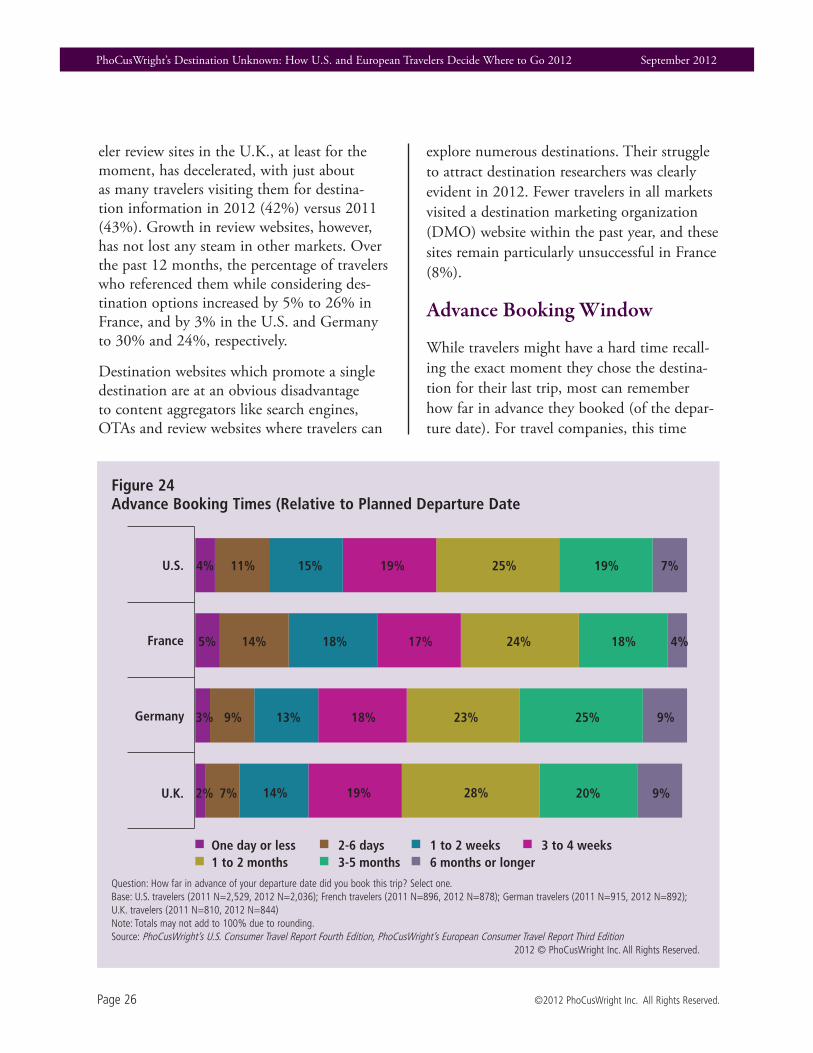
PhoCusWright’s Destination Unknown: How U.S. and European Travelers Decide Where to Go 2012 September 2012
Page 26 ©2012 PhoCusWright Inc. All Rights Reserved.
eler review sites in the U.K., at least for the moment, has decelerated, with just about as many travelers visiting them for destina-tion information in 2012 (42%) versus 2011 (43%). Growth in review websites, however, has not lost any steam in other markets. Over the past 12 months, the percentage of travelers who referenced them while considering des-tination options increased by 5% to 26% in France, and by 3% in the U.S. and Germany to 30% and 24%, respectively.
Destination websites which promote a single destination are at an obvious disadvantage to content aggregators like search engines, OTAs and review websites where travelers can
explore numerous destinations. Their struggle to attract destination researchers was clearly evident in 2012. Fewer travelers in all markets visited a destination marketing organization (DMO) website within the past year, and these sites remain particularly unsuccessful in France (8%).
Advance Booking Window
While travelers might have a hard time recall-ing the exact moment they chose the destina-tion for their last trip, most can remember how far in advance they booked (of the depar-ture date). For travel companies, this time
Figure 24Advance Booking Times (Relative to Planned Departure Date
Question: How far in advance of your departure date did you book this trip? Select one.Base: U.S. travelers (2011 N=2,529, 2012 N=2,036); French travelers (2011 N=896, 2012 N=878); German travelers (2011 N=915, 2012 N=892); U.K. travelers (2011 N=810, 2012 N=844) Note: Totals may not add to 100% due to rounding.Source: PhoCusWright’s U.S. Consumer Travel Report Fourth Edition, PhoCusWright’s European Consumer Travel Report Third Edition 2012 © PhoCusWright Inc. All Rights Reserved.
25% 19% 7%19%15%11%4%
24% 18% 4%17%18%14%5%
23% 25% 9%18%13%9%3%
28% 20% 9%19%14%7%2%
France
U.S.
Germany
U.K.
One day or less 26 days 1 to 2 weeks 3 to 4 weeks1 to 2 months 35 months 6 months or longer
PhoCusWright’s Destination Unknown: How U.S. and European Travelers Decide Where to Go 2012 September 2012
©2012 PhoCusWright Inc. All Rights Reserved. Page 27
window is critical because it represents a fixed point where potential influence over consum-ers is lost. The window closes latest in France, where over half of travelers (54%) book their trips within a month before departure (see Figure 24). Travelers in the U.K. and Germany typically book further in advance, with only 42% and 43% booking within a month, respectively. Almost half (49%) U.S. travel-ers purchase within a month, comparable to France at 54%.
One driver for the shorter planning window in France and the U.S. is the types of vacations travelers took in 2012. Thirty percent of all trips taken in France – and 33% in the U.S. – were to visit friends and family, and these visits typically require only transportation (rather than both lodging and transportation). VFR,
as a percentage of all trips, was considerably lower in Germany (21%) and the U.K (26%). Since VFR requires less complexity and invest-ment, travelers are less inclined to plan well in advance.
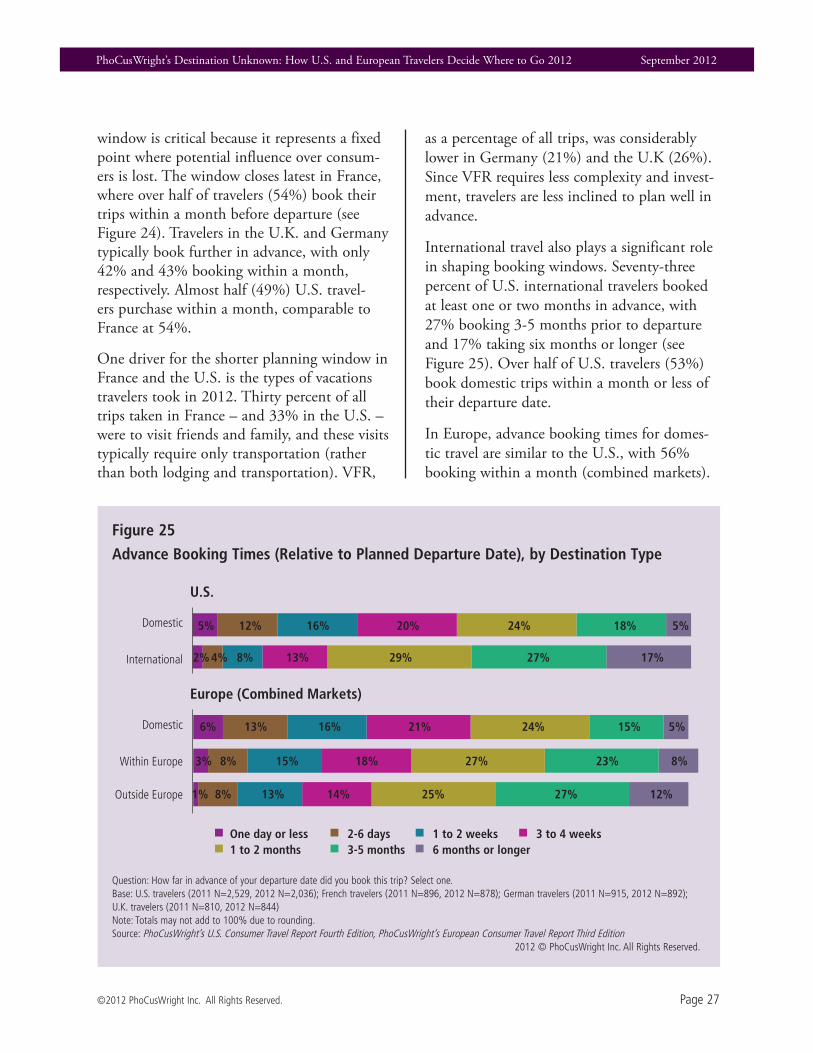
International travel also plays a significant role in shaping booking windows. Seventy-three percent of U.S. international travelers booked at least one or two months in advance, with 27% booking 3-5 months prior to departure and 17% taking six months or longer (see Figure 25). Over half of U.S. travelers (53%) book domestic trips within a month or less of their departure date.
In Europe, advance booking times for domes-tic travel are similar to the U.S., with 56% booking within a month (combined markets).
Figure 25
Advance Booking Times (Relative to Planned Departure Date), by Destination Type
Question: How far in advance of your departure date did you book this trip? Select one.Base: U.S. travelers (2011 N=2,529, 2012 N=2,036); French travelers (2011 N=896, 2012 N=878); German travelers (2011 N=915, 2012 N=892); U.K. travelers (2011 N=810, 2012 N=844) Note: Totals may not add to 100% due to rounding.Source: PhoCusWright’s U.S. Consumer Travel Report Fourth Edition, PhoCusWright’s European Consumer Travel Report Third Edition 2012 © PhoCusWright Inc. All Rights Reserved.
Domestic
Within Europe
Outside Europe
Europe (Combined Markets)
Domestic
International
U.S.
20% 24% 18% 5%16%12%5%
13% 29% 27% 17%8%4%2%
One day or less 26 days 1 to 2 weeks 3 to 4 weeks1 to 2 months 35 months 6 months or longer
21% 24% 15% 5%16%13%6%
18% 27% 23% 8%15%8%3%
14% 25% 27% 12%13%8%1%

PhoCusWright’s Destination Unknown: How U.S. and European Travelers Decide Where to Go 2012 September 2012
Page 28 ©2012 PhoCusWright Inc. All Rights Reserved.
European travelers also book earlier as travel-ing distance increases. For destinations within Europe, 58% book at least 1-2 months in advance, and 31% book at least 3-5 months prior. These figures grow to 64% and 39%, respectively, for destinations outside of Europe.
Influence of Online Features
In 2012, over seven out of 10 U.S. and European travelers researched travel destina-tions on the web. Travelers from each market, however, vary according to the types of online
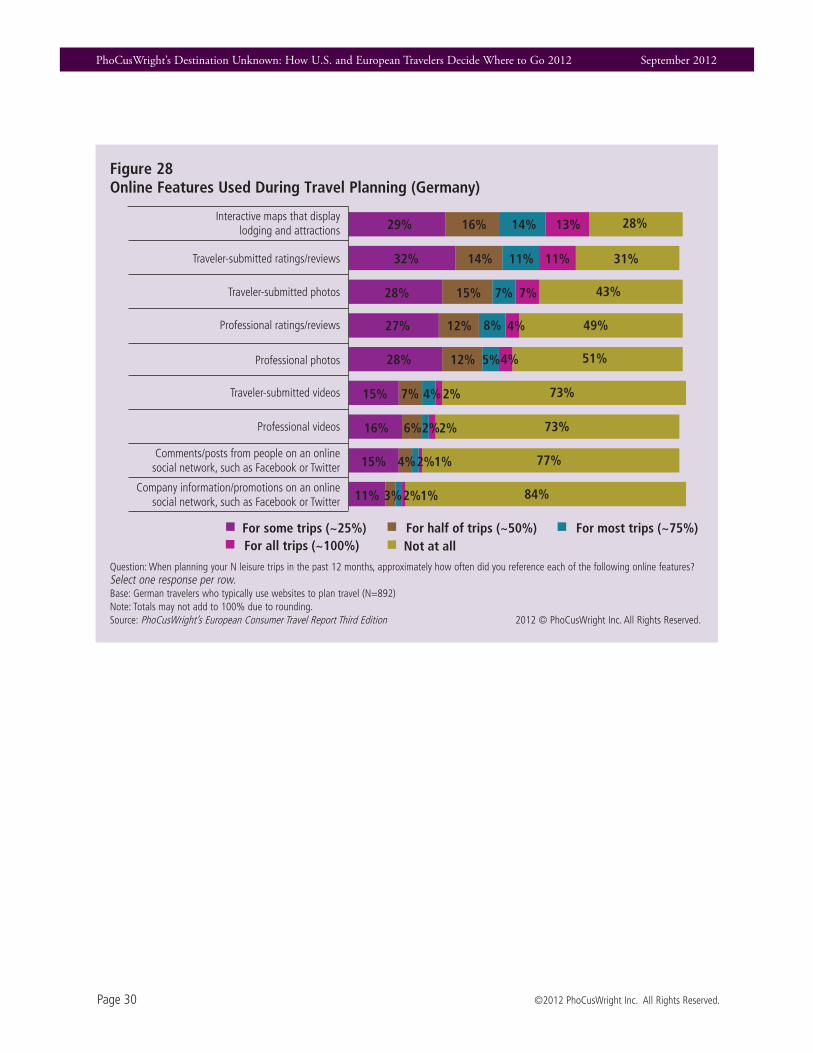
content and features they seek out and in how often they take advantage of them. For travel-ers in the U.S., France and Germany, interac-tive maps that display lodging and attractions are most popular (see Figures 26-29). Almost three quarters of online travel planners2 in Germany (72%), followed by two thirds in the U.S. and 57% in France, referenced them while planning at least one trip in 2012. Usage is heaviest in Germany, as 43% use maps to plan half their trips or more.
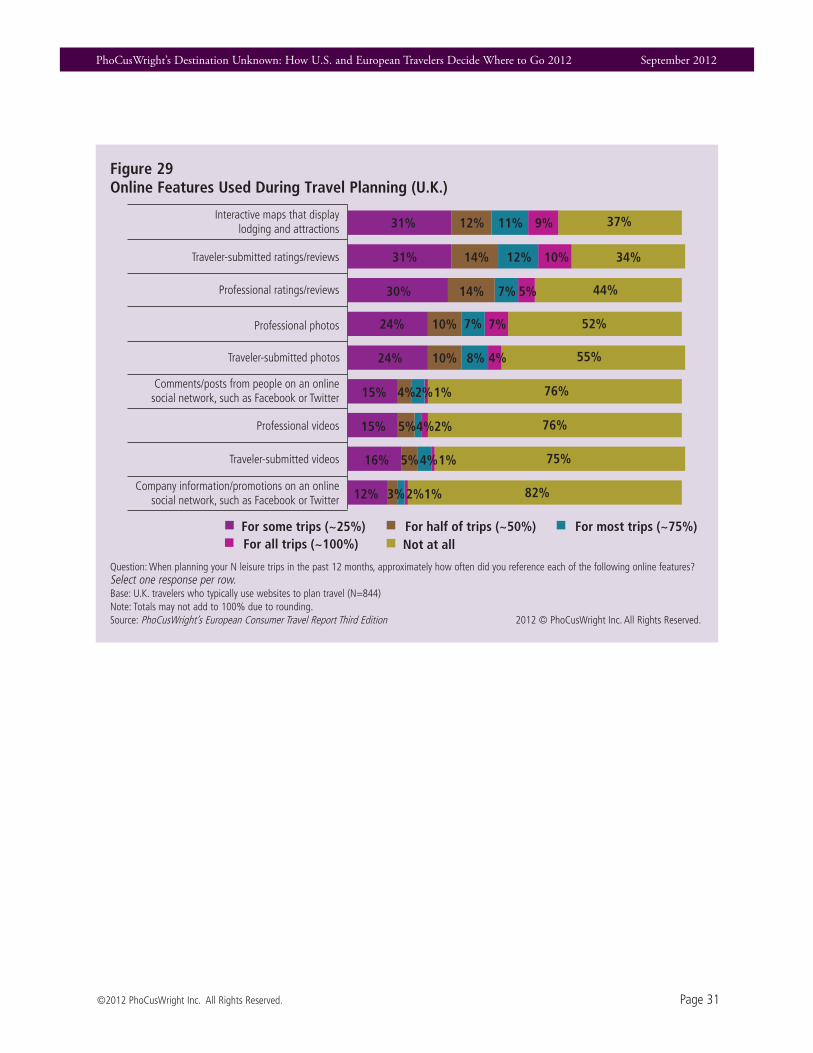
While interactive maps are used by well over half of U.K. (63%) online travel planners,
Figure 26Online Features Used During Travel Planning (U .S .)
Question: Please indicate how influential each online feature is to you when planning leisure travel.Base: U.S. travelers who typically use websites to plan travel (N=1,860)Note: Totals may not add to 100% due to rounding. Source: PhoCusWright’s U.S. Consumer Travel Report Fourth Edition 2012 © PhoCusWright Inc. All Rights Reserved.
2 “Online travel planners” are travelers who referenced any online channel during the destination selection, shopping or booking process.
10%11%16% 34%29%
8%10%14% 38%29%
5%9%14% 48%24%
6%6%13% 53%23%
4%6%10% 59%22%
2%4%6% 71%18%
1%2%6% 74%16%
1%3%6% 77%14%
1%2%4% 80%13%
Interactive maps that display lodging and attractions
Traveler-submitted ratings/reviews
Professional ratings/reviews
Professional photos
Traveler-submitted photos
Comments/posts from people on an online social network, such as Facebook or Twitter
Professional videos
Traveler-submitted videos
Company information/promotions on an online social network, such as Facebook or Twitter
For some trips (~25%) For half of trips (~50%) For most trips (~75%)For all trips (~100%) Not at all

PhoCusWright’s Destination Unknown: How U.S. and European Travelers Decide Where to Go 2012 September 2012
©2012 PhoCusWright Inc. All Rights Reserved. Page 29
traveler-submitted ratings and reviews take the number one spot in this market, at 66%. Over one third (36%) of online travel planners in the U.K. read traveler-submitted reviews for half their trips or more.
French travelers demonstrate an affinity for photography. Unlike the other markets where both professional and traveler-submitted pho-tos take a backseat to other types of online content, professional photography (48%) and traveler-submitted photos (42%) rank second and third in France, just under interactive maps. Overall, French online travel planners are not heavy users of any particular kind of online feature. French consumers who plan
travel online typically rely on a wider range of content types – even travel videos (both professional and traveler-submitted) and social networks, which are both considerably less popular in other markets.
Traveler-submitted ratings and reviews rank second in all markets besides France (61% U.S., 68% Germany and 67% U.K.). While a considerable portion of online travel planners in these markets reference reviews to plan their trips, what is perhaps more important is how many will not book a single trip without read-ing them (8% in the U.S., 11% in Germany, and 10% in the U.K.).
Figure 27Online Features Used During Travel Planning (France)
Question: When planning your N leisure trips in the past 12 months, approximately how often did you reference each of the following online features? Select one response per row.Base: French travelers who typically use websites to plan travel (N=877)Note: Totals may not add to 100% due to rounding. Source: PhoCusWright’s European Consumer Travel Report Third Edition 2012 © PhoCusWright Inc. All Rights Reserved.
6%7%15% 42%29%
2%5%10% 53%31%
4%6%10% 59%22%
2%3%6% 65%24%
2%4%8% 67%20%
2%2%6% 68%22%
3%3%6% 71%17%
1%3%6% 71%19%
1%3%5% 81%10%
Interactive maps that display lodging and attractions
Traveler-submitted ratings/reviews
Professional ratings/reviews
Professional photos
Traveler-submitted photos
Comments/posts from people on an online social network, such as Facebook or Twitter
Professional videos
Traveler-submitted videos
Company information/promotions on an online social network, such as Facebook or Twitter
For some trips (~25%) For half of trips (~50%) For most trips (~75%)For all trips (~100%) Not at all
PhoCusWright’s Destination Unknown: How U.S. and European Travelers Decide Where to Go 2012 September 2012
Page 30 ©2012 PhoCusWright Inc. All Rights Reserved.
Figure 28Online Features Used During Travel Planning (Germany)
Question: When planning your N leisure trips in the past 12 months, approximately how often did you reference each of the following online features? Select one response per row.Base: German travelers who typically use websites to plan travel (N=892)Note: Totals may not add to 100% due to rounding. Source: PhoCusWright’s European Consumer Travel Report Third Edition 2012 © PhoCusWright Inc. All Rights Reserved.
13%14%16% 28%29%
11%11%14% 31%32%
7%7%15% 43%28%
4%8%12% 49%27%
4%5%12% 51%28%
2%4%7% 73%15%
2%2%6% 73%16%
1%2%4% 77%15%
1%2%3% 84%11%
Interactive maps that display lodging and attractions
Traveler-submitted ratings/reviews
Professional ratings/reviews
Professional photos
Traveler-submitted photos
Comments/posts from people on an online social network, such as Facebook or Twitter
Professional videos
Traveler-submitted videos
Company information/promotions on an online social network, such as Facebook or Twitter
For some trips (~25%) For half of trips (~50%) For most trips (~75%)For all trips (~100%) Not at all
PhoCusWright’s Destination Unknown: How U.S. and European Travelers Decide Where to Go 2012 September 2012
©2012 PhoCusWright Inc. All Rights Reserved. Page 31
Figure 29Online Features Used During Travel Planning (U .K .)
Question: When planning your N leisure trips in the past 12 months, approximately how often did you reference each of the following online features? Select one response per row.Base: U.K. travelers who typically use websites to plan travel (N=844)Note: Totals may not add to 100% due to rounding. Source: PhoCusWright’s European Consumer Travel Report Third Edition 2012 © PhoCusWright Inc. All Rights Reserved.
9%11%12% 37%31%
10%12%14% 34%31%
5%7%14% 44%30%
7%7%10% 52%24%
4%8%10% 55%24%
1%2%4% 76%15%
2%4%5% 76%15%
1%4%5% 75%16%
1%2%3% 82%12%
Interactive maps that display lodging and attractions
Traveler-submitted ratings/reviews
Professional ratings/reviews
Professional photos
Traveler-submitted photos
Comments/posts from people on an online social network, such as Facebook or Twitter
Professional videos
Traveler-submitted videos
Company information/promotions on an online social network, such as Facebook or Twitter
For some trips (~25%) For half of trips (~50%) For most trips (~75%)For all trips (~100%) Not at all

PhoCusWright Inc.1 Route 37 East, Suite 200
Sherman, CT 06784-1430 USA+1 860 350-4084
+1 860 354-3112 fax
www.phocuswright.com