Embed Size (px)
Citation preview

Pt
AJa
b
c
d
a
ARRAA
KAMMTP
1
coitmatccfictft
0d
Journal of Alloys and Compounds 504 (2010) 462–467
Contents lists available at ScienceDirect
Journal of Alloys and Compounds
journa l homepage: www.e lsev ier .com/ locate / ja l l com
hase transformations of Fe73.5Cu1Nb3Si15.5B7 amorphous alloy upon thermalreatment
leksandra Gavrilovic a, Dusan M. Minic b, Lidija D. Rafailovic a,c, Paul Angerera,aroslaw Wosika, Aleksa Maricic b, Dragica M. Minicd,∗
CEST Centre of Electrochemical Surface Technology, A-2700 Wiener Neustadt, AustriaTechnical Faculty of Cacak, University of Kragujevac, 32000 Cacak, SerbiaPhysics of Nanostructured Materials, Faculty of Physics, University of Vienna, A-1090 Vienna, AustriaFaculty of Physical Chemistry, University of Belgrade, 11001 Belgrade, Serbia
r t i c l e i n f o
rticle history:eceived 6 November 2009eceived in revised form 21 May 2010ccepted 29 May 2010vailable online 11 June 2010
eywords:morphous materials
a b s t r a c t
The structural transformations of Fe73.5Cu1Nb3Si15.5B7 amorphous alloy under non-isothermal as well asisothermal conditions were studied. Differential scanning calorimetry (DSC) showed that slow heatingrates induce a series of stepwise structural transformations consisting of endothermic peaks and morepronounced exothermic peaks in the broad temperature range from 350 to 970 K. Over this range thesystem changed from an as-deposited amorphous alloy of higher excess free energy to an annealed sampleexhibiting lower excess of free energy. X-ray diffraction (XRD) analysis found that primary crystallizationstarted with formation of a face-centred Fe3Si phase in an amorphous matrix. At higher temperatures
etallic glassesetals and alloys
hermal analysishase transition
(between 780 and 920 K) we detected, in addition to the Fe3Si phase, which reached an almost constantvalue of 85 wt%, three new phases, FeCu4, Fe16Nb6Si7 and Fe2B. Further annealing above 923 K led to,with Si initially migrating from the Fe–Si phase to the Nb-rich grain boundaries, formation of two newphases, Fe5Si3 and Nb5Si3. The Fe content in the cubic Fe–Si phase was estimated by means of a changein lattice parameter. Below 923 K the size of crystallites for the major Fe3Si phase was less than 10 nm. Itwas shown that further heating induced rapid crystallite growth, reaching a size greater than 500 nm at
1123 K.. Introduction
The soft magnetic amorphous materials (metallic glasses) areonsidered the future of magnetic materials in power electronicsn account of their marvellous magnetic properties. The major-ty of metallic glasses are materials which are kinetically andhermodynamically metastable. The structure of some of these
aterials may change spontaneously with time, but most of themre stable at room temperature and can be transformed directlyo polycrystalline materials at higher temperatures [1,2]. The poly-rystalline soft magnetic materials with grain size less than 100 nm,alled nanocrystalline, possess superior soft magnetic properties,or example, “Finemet®” and “Nanoperm®” alloys and their mod-fications [3–9]. These materials generally contain two structural
omponents: one consisting of periodically positioned atoms insidehe crystallites and the other with all atoms located in the inter-acial regions, having strongly distorted structures [10]. Owing tohe small grain size, the local magneto-crystalline anisotropy is∗ Corresponding author. Tel.: +381 11 3336 689; fax: +381 11 2187 133.E-mail addresses: [email protected], [email protected] (D.M. Minic).
925-8388/$ – see front matter © 2010 Elsevier B.V. All rights reserved.oi:10.1016/j.jallcom.2010.05.145
© 2010 Elsevier B.V. All rights reserved.
averaged out by exchange interactions leading to low or vanishingsaturation magnetostriction [11].
The nanocrystalline soft magnetic materials can be obtained bycrystallization of amorphous alloys when the nucleation rate ishigh and crystal growth rate low. In addition to the control of heattreatment conditions such as heating rate, specific annealing tem-perature and time, the addition of small quantities of elements suchas Cu and Nb, favours the formation of a nanocrystalline structurein these materials [1,12].
The Fe-based nanocrystalline soft magnetic alloys such as“Finemet” (Fe73.5Cu1Nb3Si13.5B9) contain small amounts of Cuwhich is immiscible with Fe and Nb [5,13]. The Cu, despite its lowcontent, affects the crystallization process and is responsible forthe formation of nanostructured materials. Due to its very limitedsolubility in Fe, Cu forms small clusters which serve as sites forheterogeneous nucleation of �-Fe–Si crystallites, increasing theirnumber in amorphous matrix. Furthermore, Nb, which is rejected
from the crystal phase into the amorphous matrix, decreases thecrystal growth because of its relatively low diffusivity [14].The extensive application of nanostructural metallic alloys ofthis type is primarily due to their unique soft magnetic proper-ties, which make them suitable for use in sensors. It was shown
ys and Compounds 504 (2010) 462–467 463
tmmap
ctmwmv
oataa
2
rc2caa9
2abhmah
aaisc
t
(gs5r
3
asbtagi(t7tffarr
temperatures (chosen in accordance with the DSC analysis) wasperformed in water at room temperature.
Fig. 3 shows the XRD patterns of an as-prepared alloy sample aswell as samples of the material subjected to annealing, during 1 h,
A. Gavrilovic et al. / Journal of Allo
hat two main phases exist in Fe–Cu–Nb–Si–B alloys with optimumagnetic properties, one of them being the nanocrystalline ferro-agnetic �-Fe–Si solid phase (volume fraction 60–65%) with an
verage grain size typically of 10–15 nm embedded in an amor-hous ferromagnetic matrix [15].
Since soft magnetic materials can possess very attractive physi-al properties, great efforts have been made to predict and controlhe crystallization processes of metallic glasses [16]. The formed
icrostructures are very sensitive to annealing temperature asell as the thermal history of the materials; therefore a study oficrostructure evolution of the nano-magnetic materials can pro-
ide good guidance for tailoring desired properties [17,18].The objective of this work was to conduct a detailed study
f the crystallization process of amorphous Fe73.5Cu1Nb3Si15.5B7lloy in the temperature range 273–1123 K. Our main interest washe behaviour of the alloy at high temperatures. Therefore, specialttention was paid to samples of alloy annealed at temperaturesbove 873 K.
. Experimental procedures
By means of the standard procedure of rapid quenching of the melt on aotating disc (melt-spinning method), amorphous ribbon samples with a stoi-hiometric composition Fe73.5Cu1Nb3Si15.5B7 (Vitroperm®) and with dimensions of.5 cm width and 35 �m thicknesses were prepared. Composition analysis by EDXonfirmed that the expected elements were present in the amorphous alloy. Themorphous ribbon samples were sealed in quartz tubes under technical vacuumnd isothermally annealed for 1 h at temperatures of 693, 753, 773, 813, 873, 923,73, 1023, 1073, and 1123 K, respectively.
Differential thermal calorimetry of the samples was conducted using a DSC-04 C device (Netzsch, Germany) in the temperature range 298–973 K under an Artmosphere at a constant heating rate of 4 K min−1. A uniform temperature distri-ution was insured by using sample of reduced mass (approximately 5 mg). A sloweating rate of 4 K min−1 increased the sensitivity for detection of smaller exother-ic and endothermic changes in DSC. Two heating runs were employed to obtainbaseline; the first heating run was with an as-prepared sample and the secondeating run was conducted after cooling the sample to ambient temperature [19].
XRD experiments were performed on an X-Pert powder diffractometer (PAN-lytical, Netherlands) using CuK� radiation in Bragg–Brentano geometry at 40 kVnd 30 mA. The measurements were conducted in a step scan mode in 0.05◦ (2�)ntervals with a measuring time of 30 s/step. This diffractometer is equipped with aecondary graphite monochromator, automatic divergence slits, and a scintillationounter.
The TOPAS V3 general profile and structure analysis software for powder diffrac-ion data was used for the Rietveld refinement procedure [20].
Microstructural examination was performed by scanning electron microscopeSEM). An XL 30 ESEM-FEG (environmental scanning microscope with field emissionun, manufactured by FEI, Netherlands) device equipped with an energy disper-ive X-ray spectrometer from EDAX was used. The samples were inspected using, 10 and 20 kV acceleration voltages at magnifications of 20,000× and 10,000×,espectively.
. Results and discussion
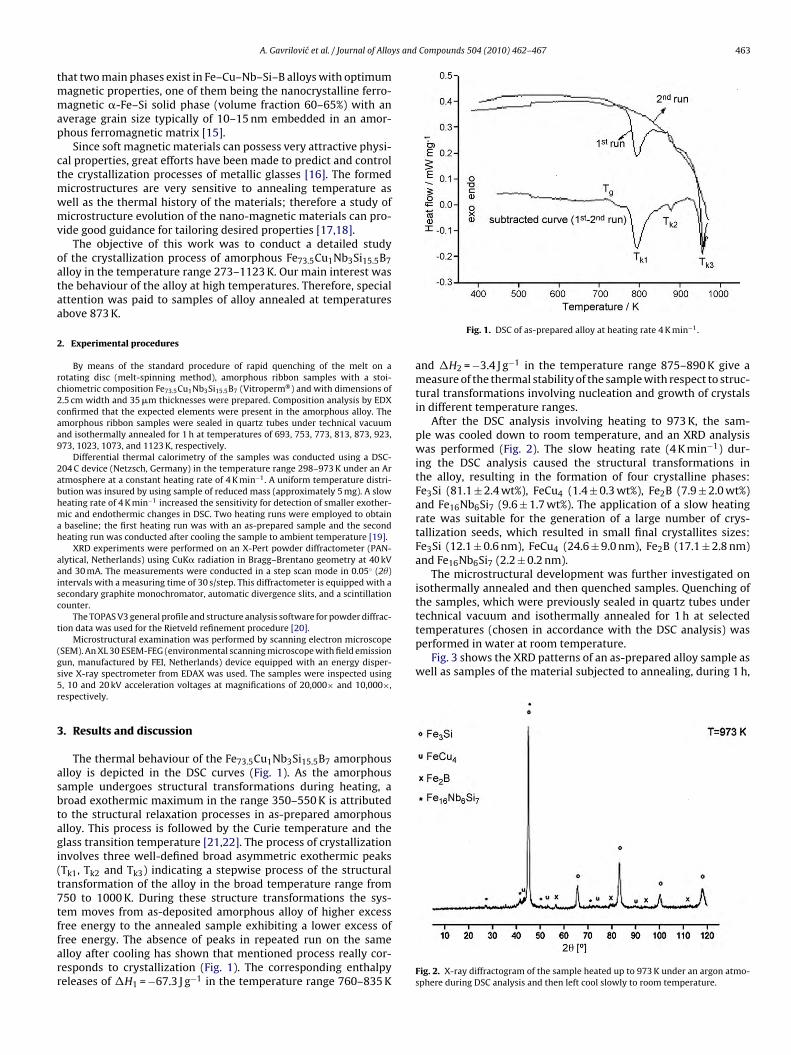
The thermal behaviour of the Fe73.5Cu1Nb3Si15.5B7 amorphouslloy is depicted in the DSC curves (Fig. 1). As the amorphousample undergoes structural transformations during heating, aroad exothermic maximum in the range 350–550 K is attributedo the structural relaxation processes in as-prepared amorphouslloy. This process is followed by the Curie temperature and thelass transition temperature [21,22]. The process of crystallizationnvolves three well-defined broad asymmetric exothermic peaksTk1, Tk2 and Tk3) indicating a stepwise process of the structuralransformation of the alloy in the broad temperature range from50 to 1000 K. During these structure transformations the sys-em moves from as-deposited amorphous alloy of higher excess
ree energy to the annealed sample exhibiting a lower excess ofree energy. The absence of peaks in repeated run on the samelloy after cooling has shown that mentioned process really cor-esponds to crystallization (Fig. 1). The corresponding enthalpyeleases of �H1 = −67.3 J g−1 in the temperature range 760–835 KFig. 1. DSC of as-prepared alloy at heating rate 4 K min−1.
and �H2 = −3.4 J g−1 in the temperature range 875–890 K give ameasure of the thermal stability of the sample with respect to struc-tural transformations involving nucleation and growth of crystalsin different temperature ranges.
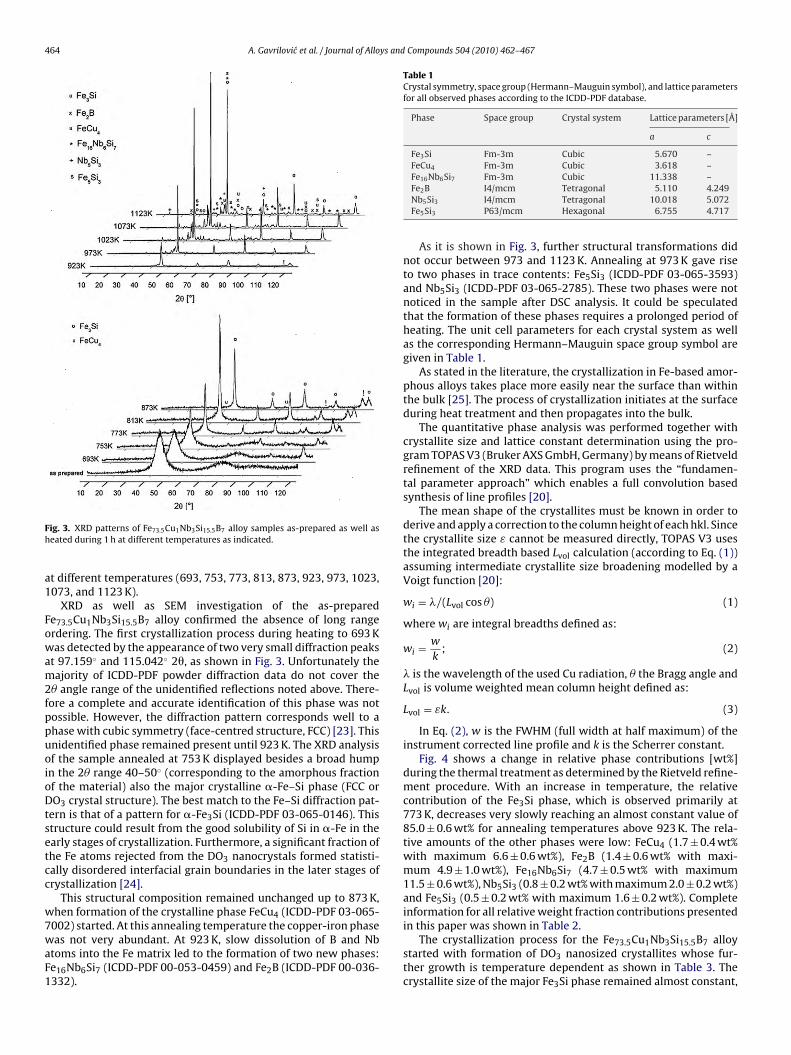
After the DSC analysis involving heating to 973 K, the sam-ple was cooled down to room temperature, and an XRD analysiswas performed (Fig. 2). The slow heating rate (4 K min−1) dur-ing the DSC analysis caused the structural transformations inthe alloy, resulting in the formation of four crystalline phases:Fe3Si (81.1 ± 2.4 wt%), FeCu4 (1.4 ± 0.3 wt%), Fe2B (7.9 ± 2.0 wt%)and Fe16Nb6Si7 (9.6 ± 1.7 wt%). The application of a slow heatingrate was suitable for the generation of a large number of crys-tallization seeds, which resulted in small final crystallites sizes:Fe3Si (12.1 ± 0.6 nm), FeCu4 (24.6 ± 9.0 nm), Fe2B (17.1 ± 2.8 nm)and Fe16Nb6Si7 (2.2 ± 0.2 nm).
The microstructural development was further investigated onisothermally annealed and then quenched samples. Quenching ofthe samples, which were previously sealed in quartz tubes undertechnical vacuum and isothermally annealed for 1 h at selected
Fig. 2. X-ray diffractogram of the sample heated up to 973 K under an argon atmo-sphere during DSC analysis and then left cool slowly to room temperature.
464 A. Gavrilovic et al. / Journal of Alloys and Compounds 504 (2010) 462–467
Fh
a1
Fowam2fppuoioDtsetcc
w7waF1
Table 1Crystal symmetry, space group (Hermann–Mauguin symbol), and lattice parametersfor all observed phases according to the ICDD-PDF database.
Phase Space group Crystal system Lattice parameters [Å]
a c
Fe3Si Fm-3m Cubic 5.670 –FeCu4 Fm-3m Cubic 3.618 –
in this paper was shown in Table 2.
ig. 3. XRD patterns of Fe73.5Cu1Nb3Si15.5B7 alloy samples as-prepared as well aseated during 1 h at different temperatures as indicated.
t different temperatures (693, 753, 773, 813, 873, 923, 973, 1023,073, and 1123 K).
XRD as well as SEM investigation of the as-preparede73.5Cu1Nb3Si15.5B7 alloy confirmed the absence of long rangerdering. The first crystallization process during heating to 693 Kas detected by the appearance of two very small diffraction peaks
t 97.159◦ and 115.042◦ 2�, as shown in Fig. 3. Unfortunately theajority of ICDD-PDF powder diffraction data do not cover the
� angle range of the unidentified reflections noted above. There-ore a complete and accurate identification of this phase was notossible. However, the diffraction pattern corresponds well to ahase with cubic symmetry (face-centred structure, FCC) [23]. Thisnidentified phase remained present until 923 K. The XRD analysisf the sample annealed at 753 K displayed besides a broad humpn the 2� range 40–50◦ (corresponding to the amorphous fractionf the material) also the major crystalline �-Fe–Si phase (FCC orO3 crystal structure). The best match to the Fe–Si diffraction pat-
ern is that of a pattern for �-Fe3Si (ICDD-PDF 03-065-0146). Thistructure could result from the good solubility of Si in �-Fe in thearly stages of crystallization. Furthermore, a significant fraction ofhe Fe atoms rejected from the DO3 nanocrystals formed statisti-ally disordered interfacial grain boundaries in the later stages ofrystallization [24].
This structural composition remained unchanged up to 873 K,hen formation of the crystalline phase FeCu4 (ICDD-PDF 03-065-
002) started. At this annealing temperature the copper-iron phase
as not very abundant. At 923 K, slow dissolution of B and Nbtoms into the Fe matrix led to the formation of two new phases:e16Nb6Si7 (ICDD-PDF 00-053-0459) and Fe2B (ICDD-PDF 00-036-332).
Fe16Nb6Si7 Fm-3m Cubic 11.338 –Fe2B I4/mcm Tetragonal 5.110 4.249Nb5Si3 I4/mcm Tetragonal 10.018 5.072Fe5Si3 P63/mcm Hexagonal 6.755 4.717
As it is shown in Fig. 3, further structural transformations didnot occur between 973 and 1123 K. Annealing at 973 K gave riseto two phases in trace contents: Fe5Si3 (ICDD-PDF 03-065-3593)and Nb5Si3 (ICDD-PDF 03-065-2785). These two phases were notnoticed in the sample after DSC analysis. It could be speculatedthat the formation of these phases requires a prolonged period ofheating. The unit cell parameters for each crystal system as wellas the corresponding Hermann–Mauguin space group symbol aregiven in Table 1.
As stated in the literature, the crystallization in Fe-based amor-phous alloys takes place more easily near the surface than withinthe bulk [25]. The process of crystallization initiates at the surfaceduring heat treatment and then propagates into the bulk.
The quantitative phase analysis was performed together withcrystallite size and lattice constant determination using the pro-gram TOPAS V3 (Bruker AXS GmbH, Germany) by means of Rietveldrefinement of the XRD data. This program uses the “fundamen-tal parameter approach” which enables a full convolution basedsynthesis of line profiles [20].
The mean shape of the crystallites must be known in order toderive and apply a correction to the column height of each hkl. Sincethe crystallite size ε cannot be measured directly, TOPAS V3 usesthe integrated breadth based Lvol calculation (according to Eq. (1))assuming intermediate crystallite size broadening modelled by aVoigt function [20]:
wi = �/(Lvol cos �) (1)
where wi are integral breadths defined as:
wi = w
k; (2)
� is the wavelength of the used Cu radiation, � the Bragg angle andLvol is volume weighted mean column height defined as:
Lvol = εk. (3)
In Eq. (2), w is the FWHM (full width at half maximum) of theinstrument corrected line profile and k is the Scherrer constant.
Fig. 4 shows a change in relative phase contributions [wt%]during the thermal treatment as determined by the Rietveld refine-ment procedure. With an increase in temperature, the relativecontribution of the Fe3Si phase, which is observed primarily at773 K, decreases very slowly reaching an almost constant value of85.0 ± 0.6 wt% for annealing temperatures above 923 K. The rela-tive amounts of the other phases were low: FeCu4 (1.7 ± 0.4 wt%with maximum 6.6 ± 0.6 wt%), Fe2B (1.4 ± 0.6 wt% with maxi-mum 4.9 ± 1.0 wt%), Fe16Nb6Si7 (4.7 ± 0.5 wt% with maximum11.5 ± 0.6 wt%), Nb5Si3 (0.8 ± 0.2 wt% with maximum 2.0 ± 0.2 wt%)and Fe5Si3 (0.5 ± 0.2 wt% with maximum 1.6 ± 0.2 wt%). Completeinformation for all relative weight fraction contributions presented
The crystallization process for the Fe73.5Cu1Nb3Si15.5B7 alloystarted with formation of DO3 nanosized crystallites whose fur-ther growth is temperature dependent as shown in Table 3. Thecrystallite size of the major Fe3Si phase remained almost constant,

A. Gavrilovic et al. / Journal of Alloys and Compounds 504 (2010) 462–467 465
Table 2Relative weight fractions (wt%) corresponding to each phase and for different heating conditions presented in this paper.
Temperature [K] Annealing time [h] Fe3Si FeCu4 Fe16Nb6Si7 Fe2B Nb5Si3 Fe5Si3
Relative weight fraction [wt%]
773 1 100 – – – – –813 1 100 – – – – –873 1 96.4 ± 1.3 3.6 ± 1.3 – – – –923 1 80.6 ± 1.1 3.0 ± 0.3 11.5 ± 0.6 4.9 ± 1. – –973 1 84.2 ± 0.9 6.6 ± 0.6 4.7 ± 0.5 2.1 ± 0.6 0.8 ± 0.2 1.6 ± 0.2
1023 1 86.9 ± 0.7 2.3 ± 0.4 6.5 ± 0.4 2.6 ± 0.4 1.1 ± 0.2 0.6 ± 0.21073 1 86.9 ± 0.8 1.7 ± 0.4 7.5 ± 0.3 1.4 ± 0.6 2.0 ± 0.2 0.5 ± 0.21123 1 85.0 ± 0.6 2.8 ± 0.3 7.6 ± 0.3 2.6 ± 0.4 1.5 ± 0.2 0.5 ± 0.11123a 24 87.1 ± 0.4 3.3 ± 0.3 5.4 ± 0.3 2.7 ± 0.4 0.9 ± 0.2 0.6 ± 0.1
973b – 81.1 ± 2.4 1.4 ± 0.3 9.6 ± 1.7 7.9 ± 2.0 – –
a The sample was analysed after annealing at 1123 during 24 h.b The sample was analysed by DSC technique in the temperature range of 298–973 K in an argon atmosphere with a constant heating rate of 4 K min−1.
Table 3Crystallite sizes for the observed phases upon heating at different temperatures.
Temperature [K] Annealing time [h] Fe3Si FeCu4 Fe16Nb6Si7 Fe2B Nb5Si3 Fe5Si3
Crystallite size [nm]
773 1 9.0 ± 1.3 – – – – –813 1 9.6 ± 1.2 – – – – –873 1 9.4 ± 1.2 4.0 ± 1.5 – – – –923 1 18.5 ± 1.5 7.7 ± 1.9 5.3 ± 1.5 4.5 ± 1.6 – –973 1 75.8 ± 2.6 5.9 ± 3.8 20.3 ± 2.1 22.7 ± 1.5 31.4 ± 1.8 11.6 ± 2.7
1023 1 244.2 ± 2.9 22.6 ± 1.6 25.3 ± 2.9 27.5 ± 2.8 44.8 ± 2.2 54.4 ± 2.11073 1 463.9 ± 2.9 36.8 ± 2.4 49.7 ± 5.6 44.8 ± 5.2 46.8 ± 2.2 57.0 ± 2.51123 1 523.8 ± 3.9 40.4 ± 3.0 64.8 ± 7.9 54.4 ± 5.3 44.8 ± 7.7 115.5 ± 6.61123a 24 600.0 ± 5.1 69.4 ± 4.5 93.3 ± 2.0 61.0 ± 4.5 59.6 ± 3.4 115.9 ± 7.9
± 9.0
3 K in
aabl9
tf
Ftct
973b – 12.1 ± 0.6 24.6
a The sample was analysed after annealing at 1123 during 24 h.b The sample was analysed by DSC technique in the temperature range of 298–97
bout 9 nm, after annealing for 1 h at temperatures between 773nd 873 K. In this temperature range, Nb in the amorphous grainoundaries significantly restricts the growth of the Fe3Si crystal-
ites. Furthermore, the crystallite growth increases rapidly above23 K. This coincides well with formation of the Fe16Nb6Si7 phase.
The sample annealed at 1123 K for 24 h (Fig. 5) displayed besideshe Fe–Si phase only minor contributions of other phases (rangingrom 0.5 to 7.6 wt% for each phase).
ig. 4. Relative weight fractions of the observed crystalline phases as determined byhe Rietveld refinement method. The left ordinate corresponds to the relative phaseontribution of the Fe3Si during thermal treatment; the right ordinate is related tohe relative phase contributions of each of the other phases.
2.2 ± 0.2 17.1 ± 2.8 – –
an argon atmosphere with a constant heating rate of 4 K min−1.
The resulting diffraction pattern (Fig. 5) reveals very sharp andintense peaks belonging to the major, well crystallized, Fe3Si phase.This indicates, as the Rietveld refinement confirmed, that furthergrain growth occured during heating treatment. The final valueof the crystallite size (24 h dwell) for the major phase reached600.0 ± 5.1 nm with 87.1 ± 0.4 wt% relative phase contribution.
Evolution of the lattice constant a for the Fe–Si phase (DO3 struc-
ture) as determined by the Rietveld procedure is displayed in Fig. 6.According to the relation derived in our former work [26] we cal-culated the Fe content in the Fe–Si phase, (right ordinate scale inFig. 6). It is most likely that during crystallization Si initially diffusesFig. 5. XRD pattern of the Fe73.5Cu1Nb3Si15.5B7 alloy sample heated for 24 h at1123 K.

466 A. Gavrilovic et al. / Journal of Alloys and Compounds 504 (2010) 462–467
Fp
fwFpabcb
2dfsssgl
tttg8
npd
t
than for the DSC sample (12.1 ± 0.6 nm). It is most likely that
TD
ig. 6. Lattice constant a of the cubic Fe–Si phase and corresponding content of Fe,lotted as a function of the heating temperature.
rom the crystalline Fe–Si phase to Nb-rich grain boundaries andith rise the temperature (above 923 K) forms two new phases,
e5Si3 and Nb5Si3. As a consequence, the Fe content in the Fe–Sihase increases from 75% to 80% with an increase in temperature,nd the cell parameter increases from 5.676 to 5.692 Å. It shoulde noted, that minor changes of the lattice constant could also beaused by minor incorporation of Nb and B into the Fe–Si phase,ut this effect should be significantly smaller.
SEM micrograph of the sample surface after heat treatment for4 h at 1123 K (cf. Fig. 7) shows the presence of crystal grains ofifferent shapes and shadings corresponding to the different phasesound by X-ray analysis. The corresponding EDX analysis showedignificant variations in composition. The black rifts in the sampleurface are enriched with Si, Nb and Fe. The white, large and almostpherical particles contain Cu exclusively. EDX analysis of the dark-rey, basic area shows mainly Si and Fe content while in the needle-ike particles Nb is predominant.
The addition of small amounts of Nb to the Fe–Cu–Si–B sys-em leads to generation of atomic pairs (Nb–Fe, Nb–B), leading tohe formation of a highly dense amorphous random packed struc-ure, which results in high microhardness. Fe–Cu–Nb–Si–B metalliclasses are well known as very hard (Vickers hardness higher than00 HV), but brittle materials [27].
Annealing of the amorphous material at 753 K leads to the begin-ing of crystallization. As a result of the atomic rearrangement a
artially crystalline material was formed with a large number ofislocations, accompanied by a reduction in ductility.The dislocation density decreases with the increase of annealingemperature, as it can be seen from Table 4. This is strongly related
able 4islocation density for the Fe73.5Cu1Nb3Si15.5B7 alloy after heat treatment (experimental
Temperature [K] Fe3Si FeCu4 Fe16N
Dislocation density [m−2]
773 3.70 × 10¹⁶ – –813 3.26 × 10¹⁶ – –873 3.40 × 10¹⁶ 1.88 × 10¹⁷ –923 8.77 × 10¹⁵ 5.06 × 10¹⁶ 1.07 ×973 5.22 × 10¹⁴ 8.62 × 10¹⁶ 7.28 ×
1023 5.03 × 10¹³ 5.87 × 10¹⁵ 4.69 ×1073 1.39 × 10¹³ 2.22 × 10¹⁵ 1.21 ×1123 1.09 × 10¹³ 1.84 × 10¹⁵ 7.14 ×1123a 8.33 × 10¹² 6.23 × 10¹⁴ 3.45 ×
973b – 2.05 × 10¹⁶ 4.96 ×a The sample was analysed after annealing at 1123 during 24 h.b The sample was analysed by DSC technique in the temperature range of 298–973 K in
Fig. 7. SEM micrograph of surface, after heat treatment at 1123 K for 24 h.
to the crystallite size growth and the total crystalline to amorphousphase volume ratio, leading to the decrease of the mechanical hard-ness and the increase of ductility of alloy.
4. Conclusions
During the structural transformations of theFe73.5Cu1Nb3Si15.5B7 alloy, the system changed from an as-deposited amorphous alloy to an annealed material exhibitinglower excess of free energy. The primary crystallization started byformation of Fe3Si phase (face-centred structure) in an amorphousmatrix. At higher temperatures (above 920 K) the content of Fe3Siphase is almost constant, accounting for 85 wt% of the crystallinephases. Additionally, new phases FeCu4, Fe16Nb6Si7 and Fe2Bwere detected. With further annealing above 923 K, Si diffusesfrom the Fe–Si phase to the Nb-rich grain boundaries, and hasbeen involved in formation of the new minor phases Fe5Si3 andNb5Si3. The sample of alloy annealed for 1 h under vacuum, at973 K, and then quenched at room temperature, was comparedwith the sample of alloy annealed by heating up to 973 K underAr at a constant heating rate of 4 K min−1 during DSC analysis. Itwas found that in both cases the dominant phase was Fe3Si (morethan 80 wt% content). However, the crystallite size of this phasefor the annealed sample was significantly larger (75.8 ± 2.6 nm)
the duration of the thermal treatment as well as the annealingatmosphere affected the final crystallite size. The slow heatingduring DSC analysis induced a large number of crystallizationseeds, which resulted in a smaller final crystallite size. The size
conditions as given in Table 3).
b6Si7 Fe2B Nb5Si3 Fe5Si3
– – –– – –– – –
1017 1.48 × 10¹⁷ – –1015 5.82 × 10¹⁵ 3.04 × 10¹⁵ 2.23 × 10¹⁶
1015 3.97 × 10¹⁵ 1.49 × 10¹⁵ 1.01 × 10¹⁵
1015 1.49 × 10¹⁵ 1.37 × 10¹⁵ 9.23 × 10¹⁴
1014 1.01 × 10¹⁵ 1.49 × 10¹⁵ 2.25 × 10¹⁴
1014 8.06 × 10¹⁴ 8.45 × 10¹⁴ 2.23 × 10¹⁴
1015 1.03 × 10¹⁶ – –
an argon atmosphere with a constant heating rate of 4 K min−1.

ys and
oadavi
A
eTAfA
R
[
[[[[
[[[
[[
[
[[
[
[24] Y. Swilem, Physica B 371 (2006) 182–186.
A. Gavrilovic et al. / Journal of Allo
f the Fe3Si crystallites for the quenched samples (initially beinground 10 nm) increased with the increase of temperature and theuration of thermal treatment, reaching more than 500 nm whennnealed for 1 h at 1123 K. The samples annealed in technicalacuum underwent surface crystallization, with the final grain sizencreased by expansion into the bulk.
cknowledgements
The investigation was partially supported by the Ministry of Sci-nce and Environmental Protection of Serbia, the Project 142025.he work at CEST was supported within the COMET program by theustrian Research Promotion Agency (Österreichische Forschungs-
örderungsgesellschaft, FFG) and the government of Lowerustria.
eferences
[1] T. Kulik, J. Non-Cryst. Solids 287 (2001) 145–161.[2] I. Skorvánek, J. Marcin, J. Turcanová, J. Kovác, P. Svec, J. Alloys Compd. (2010),
doi:10.1016/j.jallcom.2010.04.033.
[3] H.F. Li, D.E. Laughlin, R.V. Ramanujan, Philos. Mag. 86 (2006) 1355–1372.[4] M.E. McHenry, M.A. Willard, D.E. Laughlin, Prog. Mater. Sci. 44 (1999) 291.[5] T. Gloriant, S. Surinach, M.D. Baró, J. Non-Cryst. Solids 333 (2004) 320–326.[6] R. Brzozowski, M. Wasiak, H. Piekarski, P. Sovak, P. Uznanski, M.E. Moneta, J.Alloys Compd. 470 (2009) 5–11.[7] A. Kolano-Burian, R. Kolano, L.K. Varga, J. Alloys Compd. 483 (2009) 560–562.
[[
[
Compounds 504 (2010) 462–467 467
[8] H.A. Shivaee, H.R.M. Hosseini, E.M. Lotfabad, S. Roostaie, J. Alloys Compd. 491(2010) 487–494.
[9] A. Puszkarz, M. Wasiak, A. Rózanski, P. Sovak, M. Moneta, J. Alloys Compd. 491(2010) 495–498.
10] Ch. Polak, M. Knobel, R. Grössinger, R. Sato Turtelli, J. Magn. Magn. Mater. 134(1994) 1–12.
11] G. Herzer, J. Magn. Magn. Mater. 133 (1994) 248–250.12] Y.R. Zhang, R.V. Ramanujan, Intermetallics 14 (2006) 710–714.13] Y. Yoshiyawa, S. Oguma, K. Yamauchi, J. Appl. Phys. 64 (1988) 6044.14] H. Hermann, A. Heinemann, N. Mattern, A. Weidenmann, Europhys. Lett. 51
(2000) 127.15] T. Liu, Z.X. Xu, R.Z. Ma, J. Magn. Magn. Mater. 152 (1996) 365–369.16] D.R. dos Santos, D.S. dos Santos, Mater. Res. 4 (2001) 47–51.17] M.L. Sui, K.Y. He, L.Y. Xiong, Y. Liu, J. Zhu, Mater. Sci. Eng. A181/A182 (1994)
1405–1409.18] S.W. Du, R.V. Ramanujan, J. Non-Cryst. Solids 351 (2005) 3105–3113.19] L.D. Rafailovic, W. Artner, G.E. Nauer, D.M. Minic, Thermochim. Acta 496 (2009)
110.20] Bruker AXS, TOPAS V3. General profile and structure analysis software for pow-
der diffraction data, Karlsruhe, 2005.21] F.F. Marzo, A.R. Pierna, A. Altube, J. Non-Cryst. Solids 287 (2001) 349–354.22] C. Miguel, S. Kaloshkin, J. Gonzalez, A. Zhukov, J. Non-Cryst. Solids 329 (2003)
63–66.23] D.M. Minic, A. Gavrilovic, P. Angerer, D.G. Minic, A. Maricic, J. Alloys Compd.
482 (2009) 502–507.
25] A.K. Panda, M. Manimaran, A. Mitra, S. Basu, Appl. Surf. Sci. 235 (2004) 475–486.26] D.M. Minic, A. Gavrilovic, P. Angerer, D.G. Minic, A. Maricic, J. Alloys Compd.
476 (2009) 705–709.27] W. Martienssen, H. Warlimont, Springer Handbook of Condensed Matter and
Materials Data, first ed., Springer, Berlin, Heidelberg, 2005.