Embed Size (px)
Citation preview

This article was downloaded by: [McGill University Library]On: 28 November 2012, At: 14:07Publisher: Taylor & FrancisInforma Ltd Registered in England and Wales Registered Number: 1072954Registered office: Mortimer House, 37-41 Mortimer Street, London W1T 3JH,UK
High Pressure Research: AnInternational JournalPublication details, including instructions forauthors and subscription information:http://www.tandfonline.com/loi/ghpr20
Phase transformations of theamorphous Zn-Sb alloy underhigh pressuresV. E. Antonov a , O. I. Barkalov a , M. Calvo-Dahlborgb , U. Dahlborg b , V. F. Fedotov a , A. I. Harkunov a ,T. Hansen c , E. G. Ponyatovsky a & M. Winzenick da Institute of Solid State Physics RAS, 142432,Chernogolovka, Moscow District, Russiab LSG2M, CNRS UMR 7584, Ecole des Mines, Pare deSaurupt, 54042, Nancy, Cedex, Francec Institute Laue- Langevin, B.P. 156, F-38042,Grenoble, Cedex 9, Franced Fachbereich Physik, Universtat-GH-Paderborn,D-33095, Paderborn, GermanyVersion of record first published: 01 Dec 2006.
To cite this article: V. E. Antonov, O. I. Barkalov, M. Calvo-Dahlborg, U. Dahlborg, V.F. Fedotov, A. I. Harkunov, T. Hansen, E. G. Ponyatovsky & M. Winzenick (2000): Phasetransformations of the amorphous Zn-Sb alloy under high pressures, High PressureResearch: An International Journal, 17:3-6, 261-272
To link to this article: http://dx.doi.org/10.1080/08957950008245914
PLEASE SCROLL DOWN FOR ARTICLE
Full terms and conditions of use: http://www.tandfonline.com/page/terms-and-conditions

This article may be used for research, teaching, and private study purposes.Any substantial or systematic reproduction, redistribution, reselling, loan,sub-licensing, systematic supply, or distribution in any form to anyone isexpressly forbidden.
The publisher does not give any warranty express or implied or make anyrepresentation that the contents will be complete or accurate or up todate. The accuracy of any instructions, formulae, and drug doses should beindependently verified with primary sources. The publisher shall not be liablefor any loss, actions, claims, proceedings, demand, or costs or damageswhatsoever or howsoever caused arising directly or indirectly in connectionwith or arising out of the use of this material.
Dow
nloa
ded
by [
McG
ill U
nive
rsity
Lib
rary
] at
14:
07 2
8 N
ovem
ber
2012

High Pressure Research, 2000, Vol. 17, pp. 261 -272 Reprints available directly from the publisher Photocopying permitted by license only
0 2000 OPA (Overseas Publishers Association) N.V. Published by license under
the Gordon and Breach Science Publishers imprint.
Printed in Malaysia.
PHASE TRANSFORMATIONS OF THE AMORPHOUS Zn - Sb
ALLOY UNDER HIGH PRESSURES
V. E. ANTONOV",*, 0. I. BARKALOV",
V. F. FEDOTOV", A. I. HARKUNOV", T. HANSEN', E. G. PONYATOVSKYa and M. WINZENICKd
M. CALVO-DAHLBORG~, u. DAHLBORG~,
a Z n s t i t u t e of Solid State Physics RAS, 142432 C h e r n o g o l o v k a , Moscow District, Russia; bLSG2M, CNRS UMR 7584, Ecole a h Mines, Pare de Saurupt, 54042 Nancy Cedex, France; CZnst i tu te h u e - L a n g e v i n ,
B.P. 156, F-38042 Grenoble Cedex 9, France; dFachbereich Physik, Universtat-GH-Paderborn, 0-33095 Paderborn, Germany
(Received I October 1999)
Phase transformations occurring in initially amorphous Znd1 SbSs semiconductor at pressures to 10GPa and temperatures to 350°C were studied using the measurement of electrical resistance, in situ energy dispersive X-ray diffraction and neutron diffraction on quenched high-pressure phases at ambient pressure. The studied T- P region involves the regions of reversible and irreversible crystallisation and phase transitions between the equilibrium crystalline low-pressure and high-pressure phases.
Keywords: Amorphization; Pressure; X-ray diffraction; Neutron diffraction
1. INTRODUCTION
In the Zn- Sb system, a crystalline metallic 6-Zn41Sb59 phase with a yet undetermined crystal structure is formed at pressures above 7 GPa and temperatures above 250°C [l]. This phase can be retained at ambient pressure if previously quenched under a high pressure to
*Corresponding author. e-mail: [email protected]
26 1
Dow
nloa
ded
by [
McG
ill U
nive
rsity
Lib
rary
] at
14:
07 2
8 N
ovem
ber
2012

262 V. E. ANTONOV et al.
liquid nitrogen temperature. On heating at ambient pressure to room temperature, 6-Zn41Sb59 transforms to amorphous state, the am1 phase [1,2]. Placed under a high pressure again, the aml phase at room temperature undergoes a reversible first order phase transition to another amorphous phase, am2, at about 1 GPa [3]. The um2 phase transforms to a crystalline y-Zn41Sb59 phase with a simple hexagonal lattice at about 6 GPa [4]. Phase transformations of initially amor- phous Zn4*SbS9 at elevated temperatures were studied within the T-P region of 1 atm to 6GPa and 17°C to 200°C [5] . This region in- volves the crystallisation line descending from 180°C at ambient pres- sure to 80°C at 5 GPa and the nearly vertical line of the aml c-) am2 transformation terminating in a critical point at about 100°C, see Figure 1.
In the present study of Zn41Sb59, the T - P region is extended to 10 GPa and 350°C in order to include the line of the y --+ 6 transition and the lines of transitions between the high-pressure 6-phase and the
P [GPa]
FIGURE 1 T-P phase diagram for initially amorphous Zn4,SbS9. am, and am2 are the low- and high-pressure amorphous semiconductor phases, y and 6 are the high-pressure semi-metal and metal phase. The solid and open circles and diamonds indicate revers- ible transitions between corresponding states at increasing and decreasing pressure, respectively. The right and left arrows show the pressure intervals of the am + y and y + am transitions according to the X-ray data of Figure 3. The asterisks indicate the positions of the irreversible transitions of the om and y phases to a mixture of ZnSb+ Sb at increasing temperature; the open triangles indicate the irreversible 7 -+ 6 transitions. The star marks the position of the critical point of the am, ++ umz equilibrium line. The vertical dashed line at 3.3 GPa shows the tentative position of the line of the urn2 tt y metastable equilibrium.
Dow
nloa
ded
by [
McG
ill U
nive
rsity
Lib
rary
] at
14:
07 2
8 N
ovem
ber
2012

AMORPHOUS Zn- Sb ALLOY UNDER HIGH PRESSURES 263
mixture of ZnSb compound and antimony stable at low pressures. The transition lines are constructed using the electrical resistance measurement. The crystal structures of the y-phase and 6-phase are examined by X-ray diffraction at high pressures using a diamond anvil cell and synchrotron radiation. The structure of the quenched 6-phase is also studied by neutron diffraction at ambient pressure and lOOK using samples made of Sb alloyed with Zn of the natural isotopic composition and with 67Zn isotope.
2. EXPERIMENTAL
A pellet of amorphous Zn41Sb59 7.5mm in diameter and 3mm thick was prepared by the same procedure as previously [5]. The electrical resistance was measured with the samples 5-8mm long and 1 x 1 mm across cut from this pellet. The sample was placed in a Toroid-type high-pressure chamber using hexagonal BN as pressure transmitting medium and the resistance was measured by a d. c. four-probe method with copper electrodes pressed against the sample. The temperature and pressure were determined accurate to within f 7°C and f 0.3 GPa, respectively.
Energy dispersive X-ray diffraction (EDXD) was performed with synchrotron radiation and diamond anvil cells in HASYLAB at DESY, Hamburg. A piece from a pellet of amorphous Zn41Sb59 of nearly 150 pm diameter and around 20 pm thickness was loaded with white mineral oil and a few ruby grains into the central hole of the Inconel gasket [6]. The spectra were recorded by a Ge detector over periods of 10min in the course of the step-wise changes in pressure, which was measured by the ruby luminescence technique with an accuracy of f 0.1 GPa. The diffraction angle was 26 = 9.7174" or 1 1.5666" for minimum overlap of the antimony fluorescence lines with the diffraction halos of the amorphous phases and with the diffraction lines of the crystalline phases, respectively.
The samples of the 6-phase with natural Zn and with 67Zn were studied by neutron diffraction at 100 K with neutrons of a wavelength of X = 2.41 A using the D20 instrument at the ILL, Grenoble. The samples weighing about 1 g each were produced by exposing powdered and pelletised mixture of ZnSb and Sb to 8 GPa and 325°C for 24 h.
Dow
nloa
ded
by [
McG
ill U
nive
rsity
Lib
rary
] at
14:
07 2
8 N
ovem
ber
2012

264 V. E. ANTONOV et al.
The background was determined in a separate empty-can measure- ment and subtracted from the measured diffraction patterns.
3. RESULTS AND DISCUSSION
Figure 1 presents the T - P diagram of Zn41Sb59 that combines the data of Ref. [5] and the present work. Figure 2 shows representative dependences of the electrical resistance used in the present work to construct the lines of transitions involving the &phase.
To measure the p(P) isotherms in the region of the ZnSb+Sb H S transformation (Fig. 2a), the amorphous Zn41Sb59 samples were first crystallised to a mixture of ZnSb+Sb by heating at a low pressure. According to the phase rule, the transition between the thermo- dynamically equilibrium two-phase ZnSb + Sb state and single 6 state should be a complex multi-step process. However, judging by the presence of only one step in the p(P) isotherms, the pressure intervals of the intermediate transitions significantly overlap. Therefore, only midpoints of the steps in the p(P) dependences were plotted in Figure 1.
FIGURE 2 The isotherms (a) and isobars (b) of the electrical resistivity, p, of Zn4,Sb5g measured on a step-wise increase (solid circles) and decrease (open circles) in pressure and temperature, respectively.
Dow
nloa
ded
by [
McG
ill U
nive
rsity
Lib
rary
] at
14:
07 2
8 N
ovem
ber
2012

AMORPHOUS Zn-Sb ALLOY UNDER HIGH PRESSURES 265
The midpoints of the steps in the p(T) isobars (Fig. 2b) measured at increasing temperature were taken as the temperatures of crystal- lisation of amorphous Zn4,Sbs9. The product of crystallisation, either the &phase or a ZnSb + Sb mixture at lower pressures, was identified by X-ray diffraction on quenched samples at ambient pressure (DRON-2.0 diffractometer, CuK, radiation, 100 K). The results agree with the position of the ZnSb + Sb H 6 equilibrium line at P = 7.1 GPa shown by the vertical dashed line in Figure 1.
The elements of the T-P diagram positioned below the crystal- lisation line in Figure 1 refer to metastable equilibria between the phases with one and the same composition Zn41Sb59. Figure 3 presents the room-temperature X-ray patterns demonstrating a reversible transformation between the crystalline y-phase and the amorphous phase characterised by two broad diffraction halos. Partial crystal- lisation of the am2-phase to the equilibrium ZnSb+ Sb mixture occurred at pressures of 5 to 6GPa because of the too slow pressure increase in this pressure interval where the amorphous state is most thermally unstable. No such crystallisation was observed in other our experiments. The label ‘ZnSb+Sb’ in Figure 3 marks the peak com- posed of the strongest diffraction lines of ZnSb and Sb.
T = 23% P [GPo]
0
0 41
1 do
- - 740
6 30 5 4 0
amorph 0 - - 0 EL- i-11 FL
I . , . , . , . , .
10 20 30 40 50 60 EtKeVl
3
FIGURE 3 The EDXD spectra of the initially amorphous Zh1Sb59 alloy measured at room temperature and different pressures in the course of a stepwise pressure increase and further decrease (the sequence is from the bottom of the figure upwards) using a dif- fraction angle of28 = 9.7174”. The fluorescence lines have been subtracted; their positions (FL) and the positions of the escape lines (EL) are indicated with solid vertical bars.
Dow
nloa
ded
by [
McG
ill U
nive
rsity
Lib
rary
] at
14:
07 2
8 N
ovem
ber
2012
266 V. E. ANTONOV et al.
In agreement with Ref. [4], diffraction patterns of the y-phase can be indexed with a simple hexagonal cell, space group P6 (No. 168). As seen from Figure 4, the cell parameters vary with pressure ap- proximately linearly. Their values at 8 GPa are ahex = 3.018A and chex = 2.742 A. Linear extrapolation to ambient pressure gives ahex = 3.068 A, chex = 2.793 A and the atomic volume V, = 22.76 A3/ atom; the compressibility is EE, = - (l/V,)(8VU/8P) = 0.0069 GPa-I. For comparison: the atomic volume of the amI-phase under ambient conditions is 27.2A3/atom [5], Z E , ~ ~ = 0.026 GPa- ', zam2 = 0.016 GPa- and the volume decrease accompanying the aml -+ am2 transi- tion at room temperature is 0.8% [3]. The volume effect of the am2 H y transformation calculated using these data is about 12% at a pres- sure of 3.3 GPa, the centre of the hysteresis interval of the am2 H y transformation at room temperature. The effect is large and therefore the slope of the line of the am2 H y metastable equilibrium must also be large according to Clapeyron equation. This line is schematically shown in Figure 1 by the vertical dashed line erected at 3.3 GPa.
Relative intensities and widths of diffraction lines of the y-phase were well reproduced in 5 our EDXD experiments with different pieces of the initial amorphous Zn4,SbS9. This suggests the small grain size and the absence of significant texture in the samples. However, as seen
2.70 0 2 4 6 6 1 0
P IGPal
FIGURE 4 The lattice arameters, q,ex and chcx, of the simple hexagonal cell and the atomic volume V, = (JiP/2)u&,q,e, for the ?-phase as a function of increasing (solid circles) and decreasing (open arcles) pressure at room temperature. The crosses show the atomic volumes V, = ao,&,fihcorth/2 of the &phase with an orthorhombic pseudosell.
Dow
nloa
ded
by [
McG
ill U
nive
rsity
Lib
rary
] at
14:
07 2
8 N
ovem
ber
2012
AMORPHOUS Zn- Sb ALLOY UNDER HIGH PRESSURES 267
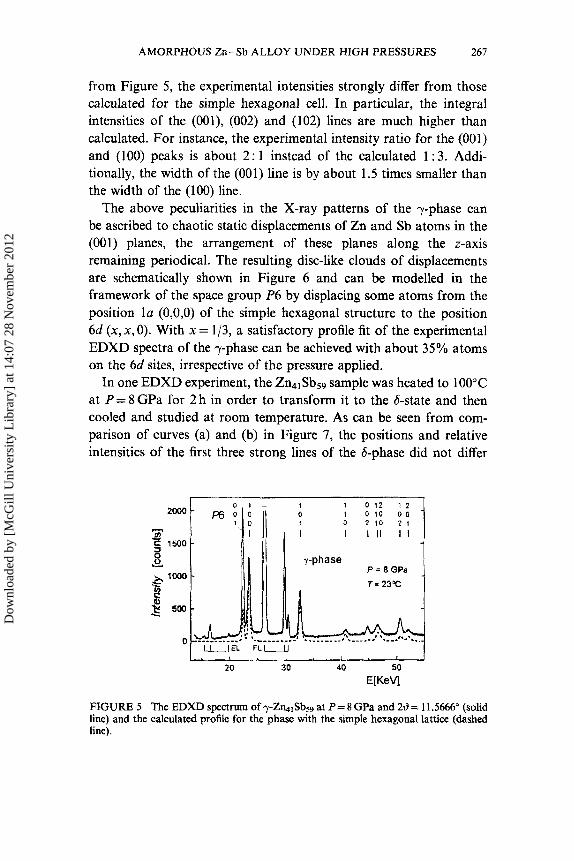
from Figure 5 , the experimental intensities strongly differ from those calculated for the simple hexagonal cell. In particular, the integral intensities of the (OOl), (002) and (102) lines are much higher than calculated. For instance, the experimental intensity ratio for the (001) and (100) peaks is about 2: 1 instead of the calculated 1 : 3. Addi- tionally, the width of the (001) line is by about 1.5 times smaller than the width of the (100) line.
The above peculiarities in the X-ray patterns of the y-phase can be ascribed to chaotic static displacements of Zn and Sb atoms in the (001) planes, the arrangement of these planes along the z-axis remaining periodical. The resulting disc-like clouds of displacements are schematically shown in Figure 6 and can be modelled in the framework of the space group P6 by displacing some atoms from the position l a (O,O,O) of the simple hexagonal structure to the position 6d (x, x, 0). With x = 1/3, a satisfactory profile fit of the experimental EDXD spectra of the y-phase can be achieved with about 35% atoms on the 6d sites, irrespective of the pressure applied.
In one EDXD experiment, the Zn41Sb59 sample was heated to 100°C at P = 8 GPa for 2 h in order to transform it to the 6-state and then cooled and studied at room temperature. As can be seen from com- parison of curves (a) and (b) in Figure 7, the positions and relative intensities of the first three strong lines of the &phase did not differ
0 1 - --I
FIGURE 5 The EDXD spectrum of y-Zn&b59 at P = 8 GPa and 219 = 11 5666" (solid line) and the calculated profile for the phase with the simple hexagonal lattice (dashed line).
Dow
nloa
ded
by [
McG
ill U
nive
rsity
Lib
rary
] at
14:
07 2
8 N
ovem
ber
2012

268 V. E. ANTONOV et al.
u-phase: born= aorn 43 &phase: bo&c aom 43
FIGURE 6 Schematic plots of the (001) planes in the unit cells of the y- and 6-phase formed at high pressures at room temperature. The dashed circles and ellipses illustrate the symmetry of distribution of static displacements of atoms in these planes. &.x and bhcx are the parameters of the simple hexagonal cell, aofih and berth of the orthorhombic cells.
I J I I I / I l l 1 1 1 1 1 -- I#; 1 0 2 1 0 2 2 1 0102 I 2 0 3 0023 4122 f
C
0 3 0.4 0.5 3.6 0.7 08 01 d-' [A*']
FIGURE 7 The EDXD spectra of the y-phase (a) and &phase (b) measured at a pressure of 8 GPa and room temperature using a diffraction angle of 26= 11.5666", and the neutron diffraction spectrum of the quenched &phase (c) measured at ambient pressure and 100K. The x-axis is in units of reciprocal inter-planar distances d - ' . The spectrum of the simple hexagonal y-phase, curve (a), is indexed based on an ortho- rhombic unit cell for easier comparison with the spectra of the &phase.
much from those of the y-phase, so the structures of these phases should be closely related. At the same time, the widths of the first three intensive peaks of curve (b) are by about 1.5 times smaller than in
Dow
nloa
ded
by [
McG
ill U
nive
rsity
Lib
rary
] at
14:
07 2
8 N
ovem
ber
2012

AMORPHOUS Zn- Sb ALLOY UNDER HIGH PRESSURES 269
curve (a), the positions of the fourth intensive peaks of these curves, connected with the dashed line in Figure 7, are significantly different and curve (b) contains new weak lines. This suggests a higher degree of order and a lower symmetry of the crystal structure of the 6-phase.
The structure of the 6-phase is too complex to be determined in full from powder diffraction data. However, as seen from Figure 7, the main peaks in the EDXD spectrum of the 6-phase can be indexed with a rather small base-centred orthorhombic cell, space group Cmmm (No. 65). The parameters of the cell at room temperature are aoflh/
borth/Corth = 3.156/4.971/2.757A at P= 8 GPa and 3.206/5.017/2.7918, at P= 1.4GPa. The corresponding values of atomic volumes are indicated in Figure 4 by crosses. Within the experimental error they coincide with those of the y-phase at the same pressures.
The simple hexagonal structure of the y-phase can be formally re- presented using a base-centred orthorhombic cell with the x- and y- axis chosen as shown in Figure 6 and the ratio of borth /aod = fi. For the y-phase at 8 GPa this gives Uorth/bofih/Cofih = 3.018/5.227/2.742 pi. Comparison with the data for the &phase at this pressure shows that the y + 6 transition is accompanied by an increase in and a decrease in bofih, while the value of Corth changes only slightly. The ratio of borthlaorth decreases to &GEi that effectively lifts the ‘degeneracy’ of the diffraction lines in the spectrum of the y-phase resulting from their indexing with an orthorhombic unit cell, compare curves (a) and (b) in Figure 7.
Analysis of the line intensities shows that the 6-phase partly inherited the defect structure of the y-phase. In the EDXD spectrum of the 6-phase, the lines with a large index k, such as (020), (021), (130) and (1 3 l), have much lower intensities than calculated for the defect- free orthorhombic structure. This can be ascribed to chaotic static displacements of Zn and Sb atoms predominantly along the y-axis. As schematically shown in Figure 6, the disc-like clouds of atomic displacements in the y-phase thus transform to the anisotropic ellipse- like clouds in the &phase. In the framework of the space group Cmmm, the latter can be modelled by displacing some atoms from the position 2a (O,O,O) to 8p (x, y , 0). With x = 0.1 and y = 1/4, about 35% atoms should be placed on the 8p sites to describe qualitatively the intensities of the main diffraction lines of the &phase.
Dow
nloa
ded
by [
McG
ill U
nive
rsity
Lib
rary
] at
14:
07 2
8 N
ovem
ber
2012

270 V. E. ANTONOV et al.
The y-phase seems to be a highly metastable state of the Zn4,Sb59 alloy and at P = 1 atm it gets amorphous at temperatures below 100 K. Noticeable amorphization of the 6-phase at ambient pressure begins only on heating above 170 K [3]. Two quenched samples of the 6-phase were studied in the present work by neutron diffraction (ND) at ambient pressure and 100K. The results are presented in Figures 7 and 8.
The ND pattern of the quenched 6-phase contained the same set of diffraction lines as the EDXD pattern, compare curves (b) and (c) in Figure 7, but the intensities of the main lines were changed drastically and the intensities of the additional lines were significantly higher. As seen from Figure 8, the intensities of the main lines of the quenched 6- phase can be satisfactorily described with the defect-free orthorhombic unit cell. This corroborates the interpretation of the line intensities in the EDXD spectra of the &phase as being strongly affected by Iattice defects: The quenched sample was prepared at higher temperature (325°C instead of 100°C) and exposed to th s temperature for a longer time (24h vs. 2h) that should have lead to a better annealing of defects.
x103
0
0 1 0 1 0 2 1 0 2 2 1 1: 0 3 00 2 3
-Cmmrn 1 1 0 0 2 1 0 1
1 I I I l l 1
20 40 60 80 100 120 140
29 [degrees]
FIGURE 8 The neutron diffraction spectrum of the quenched 6-ZQ1Sbsg sample measured at ambient pressure and 100 K (dots), the profile fit of the main peaks of this spectrum shown by the solid line (a) and the difference between the experimental and calculated spectrum (b). Curve (c) is the difference between the experimental spectra of the 6-phase with natural Zn (dots) and with 67Zn isotope. For both samples ao,.&ofih/
conh = 3.205/5.016/2.790 8,.
Dow
nloa
ded
by [
McG
ill U
nive
rsity
Lib
rary
] at
14:
07 2
8 N
ovem
ber
2012
AMORPHOUS Zn- Sb ALLOY UNDER HIGH PRESSURES 271
The high-pressure phases of Zn41Sb~~ belong to a family of Hume- Rothery phases- usually exhibiting no chemical order. Nevertheless, the investigation of the quenched samples of the 6-phase with natural Zn and with 67Zn isotope revealed significant differences in their ND patterns (curve (c) in Fig. 8) that is possible only for chemically ordered structures.
Furthermore, the neutron scattering lengths of antimony and zinc do not differ much: bSb = 5.57 fm, bZn = 5.69 fm, bZn-67 = 7.59 fm [7]. The difference between the scattering lengths of Zn and 67Zn is too little for the strong isotopic dependence of the intensities of the main lines (OOl), (110) and (111) can be ascribed to any ordered arrange- ment of Sb and Zn atoms over crystallographxally equivalent sites. The process of chemical ordering in therefore must be accompanied by significant displacements of the atoms from their positions in the base-centred orthorhombic lattice and the unit cell of the ordered structure is large and has lower symmetry. Note, that complex crystal structures are characteristic of low-pressure Zn- Sb phases as well [8].
Acknowledgements
This work was supported by the Grants Nos. 99-02-17007 and 96-15- 96806 from the Russian Foundation for Basic Research, by the Grant No. 34-1997 for young scientists from the Russian Academy of Sciences and by the Project No. 4069 of CNRS-RAS collaboration. One of the authors (OIB) thanks the Alexander von Humboldt Found- ation for a Research Fellowship and thanks HASYLAB for financial support and the hospitality during his stay at DESY, Hamburg. Financial support by the German Ministry of Research and Technol- ogy under contract No. 05647PPA is gratefully acknowledged. The authors are grateful to Prof. W. B. Holzapfel for helpful discussions and would like to thank W. Brockling for technical assistance.
References
[I] Belash, I. T. and Ponyatovsky, E. G. (1977). High Temp.-High Press., 9, 651. [2] Belash, I. T., Degtyareva, V. F., Ponyatovskii, E. G. and Rashchupkin, V. I. (1987).
Sov. Phys. Solid State, 29, 1028.
Dow
nloa
ded
by [
McG
ill U
nive
rsity
Lib
rary
] at
14:
07 2
8 N
ovem
ber
2012

272 V. E. ANTONOV et al.
Antonov, V. E., Arakelyan, A. E., Barkalov, 0. I., Gurov, A. F., Ponyatovsky, E. G., Rashupkin, V. I. and Teplinsky, V. M. (1993). J. Alloys Compds., 194, 279. Degtyareva, V. F., Bdikin, I. K. and Khasanov, S. S. (1997). Sov. Phys. Solid State, 39, 1341. Antonov, V. E., Barkalov, 0. I., Fedotov, V. K., Harkunov, A. I., Kolyubakin, A. I., Ponyatovsky, E. G. and Winzenick, M., Phys. Rev. B, in press. Holzapfel, W. B. (1978). In: High Pressure Chemistry, Kelm, H. (Ed.). [Reidel, Boston], p. 177. Koester, L., Rauch, H. and Seymann, E. (1991). Atomic Data and Nuclear Data Tables, 49, 65. Hansen, M. and Anderko, K. (1958). Constitution of Binary Alloys [McGraw-Hill, New York].
Dow
nloa
ded
by [
McG
ill U
nive
rsity
Lib
rary
] at
14:
07 2
8 N
ovem
ber
2012
![Journal of Alloys and Compoundslmms.xjtu.edu.cn/__local/E/0D/81/0A8E4E3173DCCF31A8465E...mature shear band (SB) formation and propagation in amorphous materials [5,6]. To solve this](https://img.dokumen.tips/doc/110x75/60f745be9af9f75ada100220/journal-of-alloys-and-mature-shear-band-sb-formation-and-propagation-in-amorphous.jpg)
![anský zákoník [47/92 Sb.] - zn 40/1964 Sb. ZÁKON Ob ze dne ... · 87/1990 Sb., č. 105/1990 Sb., č. 116/1990 Sb., č. 87/1991 Sb., ... Právnická osoba se zrušuje dohodou,](https://img.dokumen.tips/doc/110x75/5c7ba53609d3f20c548c2add/ansky-zakonik-4792-sb-zn-401964-sb-zakon-ob-ze-dne-871990-sb.jpg)