Embed Size (px)
Citation preview

PHARMACOMETRIC BENCHMARKING: QUANTITATIVE METHODS TO
ASSESS THE PREDICTIVE PERFORMANCE OF POPULATION
PHARMACOKINETIC MODELING PROGRAMS
by
Chris Stockmann
A dissertation submitted to the faculty of The University of Utah
in partial fulfillment of the requirements for the degree of
Doctor of Philosophy
Department of Pharmacology and Toxicology
The University of Utah
May 2016

Copyright © Chris Stockmann 2016
All Rights Reserved
T h e U n i v e r s i t y o f U t a h G r a d u a t e S c h o o l
STATEMENT OF DISSERTATION APPROVAL
The dissertation of Chris Stockmann
has been approved by the following supervisory committee members:
Christopher A. Reilly , Co-Chair 10/27/2015
Date Approved
Catherine M. Sherwin , Co-Chair 11/30/2015
Date Approved
Misty D. Smith , Member 11/19/2015
Date Approved
John M. Veranth , Member 11/19/2015
Date Approved
Philip Moos , Member 10/27/2015
Date Approved
and by Karen Wilcox , Chair/Dean of
the Department/College/School of Pharmacology and Toxicology
and by David B. Kieda, Dean of The Graduate School.
ABSTRACT
Throughout much of history, safe and effective drug doses have been discovered
through trial-and-error and validated via anecdote. Such approaches are limited in their
ability to define how a drug’s safety and effectiveness are influenced by the addition of
other co-administered medications and the presence of other acute and/or chronic diseases.
Consideration of all these pharmacological and pathophysiological factors is impractical
given the complexity of the many interactions that may occur.
To further advance clinical pharmacology, it has become necessary to leverage the
increasing speed and storage capacity of computers. Developments in mathematics,
statistics, and computer science have revolutionized the field of clinical pharmacology by
making computers far more than glorified calculators. Today, sophisticated algorithms can
be used to interrogate and learn from pharmacological datasets and make informed
predictions about the safety and effectiveness of drug dosing regimens. The goal of these
population pharmacokinetic analyses is to yield accurate predictions of clinically-relevant
pharmacokinetic parameters and improve our understanding of the biological processes
that mediate drug disposition.
In this dissertation, we present the results of three pharmacokinetic studies that
demonstrate the clinical utility of population pharmacokinetic modelling, along the way
challenging conventional dosing strategies for vancomycin in preterm neonates and
zolpidem among severely burned children. Additionally, we developed a simulation-based

iv
parameter estimation algorithms. This work lays the foundation for a transparent dialogue
regarding the relative strengths and weaknesses of individual algorithms, which heretofore
has not been possible. We conclude with a discussion of the additional unanswered
questions that may now be investigated using the benchmarking framework developed
here.
The results of the studies described in this dissertation underscore the importance
of enhancing the clinical adoption of population pharmacokinetic models. However, these
models must be rigorously evaluated to ensure that they are unbiased and precise. In
simulations, three of the most commonly used pharmacokinetic parameter estimation
algorithms differentiated themselves when they were applied in different clinical scenarios.
This finding highlights an intriguing practical fact that algorithm selection should be
guided by the clinical question at hand.

TABLE OF CONTENTS
ABSTRACT ....................................................................................................................... iii
LIST OF TABLES ............................................................................................................. ix
LIST OF FIGURES .............................................................................................................x
LIST OF ABBREVIATIONS ........................................................................................... xii
ACKNOWLEDGEMENTS ............................................................................................. xiv
Chapters
1. POPULATION PHARMACOKINETIC MODELING ................................................1
The Relationship between Clinical Trials and Population Pharmacokinetics ...............1 Individual vs. Population Pharmacokinetics ..................................................................2 History of Population Pharmacokinetics .......................................................................3 General Mathematical Formulation ...............................................................................4 Methodological Approaches Employed in Population Pharmacokinetic Analyses .......6 Applications of Population Pharmacokinetics ...............................................................8 Dosing Optimization ......................................................................................................9 Statement of Objectives ...............................................................................................10 References ....................................................................................................................12
2. VANCOMYCIN PHARMACOKINETIC MODELS: INFORMING THE CLINICAL
MANAGEMENT OF DRUG-RESISTANT BACTERIAL INFECTIONS................15
Abstract ........................................................................................................................15 Background ..................................................................................................................16 Pharmacokinetic Profile ...............................................................................................18
Absorption..............................................................................................................18 Distribution ............................................................................................................20 Metabolism ............................................................................................................22 Elimination .............................................................................................................22 Considerations for Pharmacokinetic Modeling .....................................................23
Pharmacodynamic Profile ............................................................................................28 Exposure-Response Profiles ..................................................................................28

vi
Pharmacokinetic / Pharmacodynamic Indices .......................................................28 Antibiotic Susceptibility Testing ...........................................................................29Considerations for Pharmacodynamic Modeling...................................................31
Dosing Optimization ....................................................................................................34 AUC / MIC Targets ...............................................................................................34 Trough Concentration Targets ...............................................................................35 Empiric and Definitive Dosing Regimens .............................................................36 Continuous Infusion ...............................................................................................37
Special Populations ......................................................................................................38 Neonates and Infants ..............................................................................................38Children and Adolescents ......................................................................................40 The Elderly.............................................................................................................42 Obese Patients ........................................................................................................43 Patients with Cancer ..............................................................................................45 Continuous Renal Replacement Therapy...............................................................46 Patients with Cystic Fibrosis ..................................................................................48 Critically Ill Patients ..............................................................................................48
Expert Commentary and Five-Year View ...................................................................50 References ....................................................................................................................52
3. POPULATION PHARMACOKINETICS OF INTERMITTENT VANCOMYCIN IN
CHILDREN WITH CYSTIC FIBROSIS ....................................................................67 Abstract ........................................................................................................................67 Background ..................................................................................................................68 Methods........................................................................................................................70
Setting and Study Population .................................................................................70 Drug Administration and Sample Collection .........................................................70 Vancomycin Assay ................................................................................................71 Pharmacokinetic Analysis ......................................................................................71 Covariate Analysis .................................................................................................73 Model Evaluation ...................................................................................................74
Results ..........................................................................................................................75 Patients and Pharmacokinetics ...............................................................................75 Population Pharmacokinetic Models .....................................................................75 Model Evaluation ...................................................................................................77
Discussion ....................................................................................................................79 Acknowledgments........................................................................................................87 References ....................................................................................................................87
4. PREDICTIVE PERFORMANCE OF A VANCOMYCIN POPULATION PHARMACOKINETIC MODEL IN NEONATES ....................................................92 Abstract ........................................................................................................................92 Introduction ..................................................................................................................93 Methods........................................................................................................................95

vii
Validation Cohort...................................................................................................95 Model Evaluation ...................................................................................................96 Trough Concentrations and AUC24 Relationship ..................................................98
Results ..........................................................................................................................99 External Validation Cohort ....................................................................................99 Model Evaluation ...................................................................................................99 Trough Concentrations and AUC24 Relationship ................................................100
Discussion ..................................................................................................................106 Conclusions ................................................................................................................111 References ..................................................................................................................112
5. PRELIMINARY ASSESSMENT OF ZOLPIDEM PHARMACOKINETICS IN PEDIATRIC BURN PATIENTS ...............................................................................114 Abstract ......................................................................................................................114 Introduction ................................................................................................................115 Materials and Methods ...............................................................................................117
Subjects and Study Design...................................................................................117 Drug Administration ............................................................................................117 Sample Collection ................................................................................................118 Analytical Assay ..................................................................................................118 Pharmacokinetic Analysis ....................................................................................120 Base Model Development ....................................................................................122 Covariate Analysis ...............................................................................................122 Model Evaluation .................................................................................................123
Results ........................................................................................................................123 Subjects and Pharmacokinetics ............................................................................123 Population Pharmacokinetic Models ...................................................................124 Covariate Models .................................................................................................124 Model Evaluation .................................................................................................126
Discussion ..................................................................................................................126 Conclusions ................................................................................................................135 Acknowledgments......................................................................................................135 References ..................................................................................................................136
6. SIMULATION-BASED PHARMACOMETRIC BENCHMARKING OF MONOLIX, NONMEM, AND PMETRICS .............................................................139
Introduction ................................................................................................................139 Materials and Methods ...............................................................................................140
Experimental Design ............................................................................................140 Software Programs Tested ...................................................................................141 Model Implementation .........................................................................................143 Statistical Analysis ...............................................................................................144
Results ........................................................................................................................145 Correctly-Specified Models with Covariates .......................................................145

viii
Incorrectly-Specified Models without Covariates ...............................................150 Discussion ..................................................................................................................156 References ..................................................................................................................159
7. CONCLUSIONS........................................................................................................161
Conclusions ................................................................................................................161 References ..................................................................................................................166
Appendices
A. VANCOMYCIN POPULATION PHARMACOKINETIC ANALYSIS CODE ...................................................................................................................167
B. ZOLPIDEM POPULATION PHARMACOKINETIC ANALYSIS CODE .......170
C. RELATIONSHIP BETWEEN ZOLPIDEM CONCENTRATIONS AND SLEEP PARAMETERS IN PEDIATRIC BURN PATIENTS ........................................173
D. POPULATION PHARMACOKINETIC BENCHMARKING DATASETS ......182

LIST OF TABLES
Table Page
2.1. A comparison of adult vancomycin population pharmacokinetic studies ................24 3.1. Demographic characteristics among children with cystic fibrosis who received
vancomycin for the treatment of an acute pulmonary exacerbation .........................76 3.2. Vancomycin pharmacokinetic parameter estimates and bootstrap estimates from the
final one-compartment covariate model across the entire study population .............78 4.1. Demographic and clinical characteristics of neonates who received vancomycin and
had therapeutic drug monitoring performed ...........................................................100 4.2. Timing of 734 neonatal vancomycin concentrations relative to the end of the most
recent 1-h infusion ..................................................................................................101 4.3. Predictive performance of the neonatal population pharmacokinetic model in the
external validation cohort .......................................................................................104 4.4. Predictive performance of the neonatal population pharmacokinetic model in the
external validation cohort after incorporating patient drug concentrations in predictions (e.g., IPRED method) ...........................................................................105
5.1. Demographic and clinical characteristics of severely burned children who received
zolpidem as a sleep-enhancing agent ......................................................................119 5.2. Zolpidem population pharmacokinetic parameter estimates from the final two-
compartment covariate model .................................................................................128 6.1. Bias and precision of the estimated population pharmacokinetic parameter values
obtained using Monolix, NONMEM, and Pmetrics for correctly-specified models with covariates ........................................................................................................149
6.2. Bias and precision of the estimated population pharmacokinetic parameter values
obtained using Monolix, NONMEM, and Pmetrics for the incorrectly-specified models without covariates ......................................................................................154

LIST OF FIGURES
Figure Page 2.1. Chemical and molecular structures of the glycopeptide antibiotic vancomycin ......19 2.2. Vancomycin concentration versus bacterial activity relationship ............................30 2.3. Probability distribution for a hypothetical population of patients receiving
vancomycin ...............................................................................................................33 3.1. Diagnostic plots of the final model ...........................................................................80 3.2. Visual predictive check for the final covariate model ..............................................83 4.1. An external evaluation of the predictive performance of a previously published
neonatal vancomycin population pharmacokinetic model ......................................102 4.2. Assessment of the predictive performance of the neonatal vancomycin population
pharmacokinetic model ...........................................................................................106 4.3. The association between vancomycin trough concentrations and the extent of drug
exposure, as measured by the 24-h area under the curve (AUC24) .........................107 5.1. Zolpidem concentration versus time curves ...........................................................125 5.2. Zolpidem final covariate model observed versus population-predicted concentrations
and individual-predicted concentrations .................................................................127 5.3. Zolpidem final covariate model conditional weighted residuals versus time and
population-predicted concentrations and normalized prediction distribution errors as a function of time and population-predicted concentrations ...................................129
5.4. Visual predictive check for observed zolpidem concentrations using the final
covariate pharmacokinetic model ...........................................................................131 6.1. Simulated drug concentration vs. time profiles.......................................................146

xi
6.2. Clearance and volume of distribution parameter estimates using correctly-specified covariate models .....................................................................................................147
6.3. Precision of the population pharmacokinetic parameter estimates as a function of
sample size and the number of concentrations obtained from each subject with 20% and 80% error, using correctly-specified covariate models ....................................151
6.4. Clearance and volume of distribution parameter estimates using incorrectly-specified
models without covariates.......................................................................................152 6.5. Precision of the population pharmacokinetic parameter estimates as a function of
sample size and the number of concentrations obtained from each subject with 20% and 80% error, using incorrectly-specified models without covariates ..................155

LIST OF ABBREVIATIONS
AIC Akaike information criterion APGAR Newborn scale based on appearance, pulse, grimace, activity, and
respiration AUC Area under the concentration versus time curve AUC24 24 hour area under the concentration versus time curve BMI Body mass index BSV Between subject variability CDC United States Centers for Disease Control and Prevention CF Cystic fibrosis CFU Colony forming units CI Confidence interval CL Clearance CL/F Apparent clearance Cmax Maximum concentration Cmin Minimum concentration Cr Serum creatinine CRRT Continuous renal replacement therapy CV Coefficient of variation df Degrees of freedom EM Expectation maximization EMA European Medicines Agency FDA United States Food and Drug Administration GFR Glomerular filtration rate IPRED Individual predicted concentration IQR Interquartile range Ka Absorption rate MIC Minimum inhibitory concentration MRSA Methicillin-resistant Staphylococcus aureus
MSSA Methicillin-sensitive Staphylococcus aureus
NICU Neonatal intensive care unit NONMEM Nonlinear mixed effects models NPAG Nonparametric adaptive grid NPDE Normalized prediction distribution error OFV Objective function value PCH Primary Children’s Hospital PMA Postmenstrual agePRED Predicted concentration

xiii
Q Intercompartmental clearance Q / F Apparent intercompartmental clearance RSE Relative standard error RUV Residual unexplained variability SAEM Stochastic approximation expectation maximization TBSAB Cumulative percentage of the total burned body surface area V Volume of distribution Vc / F Apparent central volume of distribution Vd Volume of distribution Vd / F Apparent volume of distribution Vp / F Apparent peripheral volume of distribution V1 Central volume of distribution V2 Peripheral volume of distribution WT Body weight θ Population pharmacokinetic parameter typical value ε Residual variability η Between subject variability σ Residual variability standard deviation ω Between subject variability standard deviation ω2 Between subject variability variance Ω Variance-covariance matrices for η Σ Variance-covariance matrices for ε

ACKNOWLEDGEMENTS
The work described in this dissertation was completed in the Division of Clinical
Pharmacology in the Department of Pediatrics at the University of Utah under the
supervision and mentorship of Dr. Catherine Sherwin. Without her unending support, the
work featured here would not have been possible.
Additionally, I owe a debt of gratitude to Dr. Christopher Reilly who has been my
mentor and friend for nearly a decade. He encouraged me despite my utter ineptitude in the
laboratory and has been an exemplary mentor in our more recent translational
collaborations.
Lastly, I would like to thank Drs. Misty Smith, John Veranth, and Philip Moos, all
of whom gave freely of their scientific and professional advice. It has been a pleasure to
work with all of you—the members of my dissertation committee—over the last few years
and I look forward to many more productive collaborations in the years to come.

CHAPTER 1
POPULATION PHARMACOKINETIC MODELING
The Relationship between Clinical Trials and Population Pharmacokinetics
Confirmatory clinical trials aim to reject the null hypothesis that the treatment
regimen under investigation has no effect.[1] By design, these trials study a limited number
of doses in relatively homogeneous patient populations.[2] Unfortunately, these trials often
only answer the very first question of interest to clinicians – is my patient likely to benefit
from this therapy? If the answer is yes, then several other practical questions must also be
asked, including:
1) What is an appropriate initial dose for my patient?
2) How soon will beneficial (and potentially harmful) effects start?
3) How long will the beneficial (and potentially harmful) effects last?
4) Will tolerance develop?
5) What is the likelihood that the initial dose will need to be changed?
6) What metrics should be used to determine if the dosing regimen needs to be
changed?
7) At what point should the dosing regimen be changed, and is a large or a small
change appropriate?

2
Sheiner raised these questions several years ago to illustrate the difference between
confirmatory clinical trials and population pharmacokinetic studies.[2] Population
pharmacokinetic analyses are well suited to the types of questions described above as they
allow us to quantify and understand the variability in drug responses among a population
of patients, which then makes it possible to develop personalized dosing regimens after
establishing how an individual patient differs from the population at large.[3]
Individual vs. Population Pharmacokinetics
Traditionally, pharmacokinetic studies have involved intensive serial blood
sampling performed in a limited number of healthy, male, adult volunteers.[4-6] These
studies allow the investigator to estimate the variability in plasma drug concentrations
between individuals following the administration of a certain dose. In contrast, the
population pharmacokinetic approach allows the investigator to characterize the
pharmacokinetics of the drug of interest using fewer blood samples by treating all of the
individuals in the study as a random sample from a larger population. From these data, it
is then possible to estimate measures of central tendency for the pharmacokinetic
parameters of the entire population, while simultaneously estimating within and between
subject variability and quantifying the amount of residual, unexplained variability.[7] This
improves the population mean and variance estimates and improves accuracy when
selecting an initial dosing regimen or adjusting a dosing regimen in response to therapeutic
drug monitoring data.
3
History of Population Pharmacokinetics
Historically, pharmacokinetic analyses were conducted using a two-stage
procedure in which each individual’s pharmacokinetic parameters were calculated using
nonlinear regression methods. The parameters calculated for each individual were then
averaged together to yield summary descriptive statistics for the population, including
estimates of the mean pharmacokinetic parameter values and their variances. Similarly,
other factors that influence the drug’s concentration-time profile were identified using
classical statistical approaches (e.g., linear regression or covariance analysis). Although
this approach has been shown to yield unbiased pharmacokinetic parameter estimates for
the population mean, the variance and covariance are often overestimated.[8-11]
To better meet the needs of individual patients, Sheiner, Rosenberg, and Melmon
developed a ‘conceptual scheme and associated statistical methodology designed to
provide the basis for a clinically useful computer program to suggest optimal dosing
regimens for a number of drugs’ in 1972.[12] This conceptual scheme and statistical
methodology was purpose built to perform well in clinical scenarios with sparse amounts
of data, where the traditional two-stage procedure failed. The principal factor that
differentiates this approach is that it considers the cohort of patients being treated (the
‘population’) as the unit of analysis, rather than the individual. Consequently, estimation
of the pharmacokinetic parameters can be performed despite the use of sparse, unbalanced,
or fragmented data, as compared with the two-stage procedure that required rigid, intensive
sampling designs akin to those observed in prospective randomized controlled trials.
Additionally, the nonlinear mixed effects modeling approach outlined by Sheiner,
Rosenberg, and Melmon models the mean pharmacokinetic parameter values for the

4
population (derived from fixed effects terms) as well as the variability within the
population (derived from random effects terms). For the remainder of this dissertation, this
approach shall be interchangeably referred to as ‘population pharmacokinetic modeling’
and ‘nonlinear mixed effects modeling’.
Building from their population pharmacokinetic conceptual framework, Sheiner
and Beal developed the first version of NONMEM (nonlinear mixed effects modeling) in
1980, which employed a first-order parameter estimation algorithm.[13, 14]
Independently, in 1986, Mallet et al. developed the first nonparametric pharmacokinetic
parameter estimation algorithm.[15] In 1990, Lindstrom and Bates developed the first-
order conditional estimation algorithm for nonlinear mixed effects models with repeated
measures data.[16] Shortly thereafter, Schumitzky developed a nonparametric expectation
maximization algorithm in 1991.[17] More recently, stochastic approximation expectation
maximization algorithms were developed and simulations with interaction terms were
conducted, which demonstrated their superiority over traditional first-order conditional
estimation methods.[18-20] Additional details regarding the statistical methodologies
employed in each of these iterative advancements in pharmacokinetic parameter estimation
algorithms are described below.
General Mathematical Formulation
Population pharmacokinetic models involve the fitting of nonlinear mixed effects
models to drug concentration data collected from multiple patients with the purpose of
simultaneously estimating: (1) the pharmacokinetic parameters for the typical individual
in the population; (2) the variability within the population; and (3) the unexplained

5
variability that may result from measurement error or a poorly specified model.[13] The
general mathematical formulation for a nonlinear mixed effects model is:
𝑦𝑖𝑗 = 𝑓 (𝑡𝑖𝑗 , 𝑔(𝜃, 𝜂𝑖, 𝑥𝑖, 𝑧𝑖)) + ℎ(𝑡𝑖𝑗, 𝑔(𝜃, 𝜂𝑖 , 𝑥𝑖, 𝑧𝑖), 𝜀𝑖𝑗) (1.1)
where 𝑓() is the function used to describe the structure of the model and ℎ() is the function
used to describe the residual error model. 𝑡𝑖𝑗 represents the drug concentration measured
for individual 𝑖 at time 𝑗. 𝑔() is a vector function that defines the 𝑖th individual’s
pharmacokinetic parameters given the vector of typical value parameters 𝜃, the 𝑖th
individual’s random effects 𝜂𝑖, the 𝑖th individual’s vector of study design variables 𝑥𝑖 (e.g.,
the dosing regimen), and 𝑧𝑖, the 𝑖th individual’s covariate vector (e.g., body weight,
postmenstrual age, creatinine clearance, etc.).
It is unlikely that the pharmacokinetic parameters of the 𝑖th individual will perfectly
match the typical pharmacokinetic parameter values for the population (𝜃); therefore, the
individual pharmacokinetic parameters are said to deviate from 𝜃 by a vector of random
effects terms of the same length as the number of pharmacokinetic parameters being
estimated for the 𝑖th individual (𝜂𝑖), where 𝜂𝑖~𝑁(0, Ω). Here Ω is a covariance matrix that
reflects the correlations between the individual pharmacokinetic parameters. The diagonal
components of Ω reflect the between subject variability for each pharmacokinetic
parameter.
The residual error model (𝜀𝑖𝑗) describes the difference between the individual
predicted concentration and the measured drug concentration, which is assumed to follow
a normal distribution of the form 𝜀𝑖𝑗~𝑁(0, Σ). 𝜀𝑖𝑗 is a vector of residual error terms and Σ
is the covariance matrix that reflects the correlations between the 𝜀𝑖𝑗 terms.

6
Methodological Approaches Employed in Population Pharmacokinetic Analyses
To derive estimates of the population pharmacokinetic parameters maximum
likelihood estimation methods are used. The maximum likelihood method specifies the
probability density function for individual 𝑖 that optimizes the pharmacokinetic parameter
estimates needed to maximize the likelihood of observing the vector of measured drug
concentrations given the patient’s dosing record and covariate vectors. The joint
probability distribution for 𝑦𝑖 and 𝜂𝑖 can be expressed as:
𝑝(𝑦𝑖, 𝜂𝑖|𝜓) = 𝐿𝑖(𝜓|𝑦𝑖, 𝜂𝑖) = 𝑝(𝑦𝑖|𝜓, 𝜂𝑖) ∗ 𝑝(𝜂𝑖|𝜓) (1.2)
in which 𝐿𝑖 is the 𝑖th individual’s likelihood given 𝑦𝑖 and 𝜂𝑖. 𝜓 is the vector of the typical
parameter values (𝜃) and the variance-covariance matrices (Ω and Σ). 𝑝(𝑦𝑖|𝜓, 𝜂𝑖) is the
conditional probability density of the measured drug concentrations (𝑦𝑖) given 𝜓 and 𝜂𝑖.
Lastly, 𝑝(𝜂𝑖|𝜓) is the conditional probability density of 𝜂𝑖 given 𝜓; however, since 𝜂𝑖
cannot be measured experimentally the marginal distribution of the measured drug
concentrations (𝑦𝑖) is reformulated to yield the following likelihood function:
𝐿(𝑦|𝜓) = ∫ 𝑝(𝑦𝑖|𝜂𝑖, 𝜓) ∙ 𝑝(𝜂𝑖, 𝜓) 𝑑𝜂𝑖 (1.3)
where 𝑝(𝑦𝑖|𝜂𝑖 , 𝜓) is the conditional probability of the measured drug concentrations (𝑦𝑖)
given the vector of random effects (𝜂𝑖) and 𝜓. 𝑝(𝜂𝑖, 𝜓) denotes the joint population
parameter density of the individual random effects.
For nonlinear functions, the likelihood cannot be maximized with a closed form
solution. Therefore, several specialized software programs have been developed to
approximate the maximum likelihood estimation. The most commonly used is the
nonlinear mixed effects modeling program NONMEM (ICON Development Solutions,
Ellicott Bay, MD, United States), which approximates the integrand and yields a closed

7
form expression for 𝐿(𝑦|𝜓) that is computationally tractable.[21] Initially, NONMEM
utilized a first-order algorithm, which is known to result in biased parameter estimates with
high between subject variability.[22] More recently, NONMEM has adopted a first-order
conditional estimation algorithm in which the individual random effects estimates from the
current iteration of the model are conditionally estimated from the random effects estimates
obtained from the previous iteration of the linearized model.[23]
An alternative pharmacokinetic parameter estimation algorithm is employed in the
software program Monolix (Lixoft, Orsay, France), which uses expectation maximization
(EM) methods that integrate the posterior density by performing Monte Carlo sampling
over all possible individual parameters during the expectation step, which is then followed
by a single iteration maximization step that moves the pharmacokinetic parameter value
closer toward the maximum likelihood.[24] Delyon et al. demonstrated that the EM
algorithm converges under very general conditions and Kuhn and Lavielle further
established that the coupling of the EM algorithm with the Markov Chain Monte Carlo
procedure rapidly converses toward the maximum likelihood estimate.[25, 26]
Pmetrics is another commonly used population pharmacokinetic modeling program
that makes no assumptions regarding the distribution of the density function.[17] Pmetrics
uses a nonparametric adaptive grid algorithm that performs no formal numerical
optimization; rather it quasi-Monte Carlo methods to generate a grid of Faure points that
can be rapidly tested to assess whether they improve the likelihood beyond the grid
consisting of points derived from the model’s initial estimates.[27] More specifically, this
deterministic set of Faure points is used to approximate the integration featured in Equation
1.3.[27] This process is iteratively repeated to yield a final, discrete nonparametric

8
distribution of pharmacokinetic parameter estimates.[27] This algorithm has the advantage
of appropriately identifying sub-populations with different pharmacokinetic profiles (e.g.,
varying hepatic formation clearances of CYP3A-metabolized drugs due to genetic
polymorphisms that affect the level of CYP3A expression).[28]
As noted above, several specialized population pharmacokinetic modeling
programs have emerged over the last 30 years that employ different pharmacokinetic
parameter estimation algorithms, which have the potential to lead to dramatically different
results.[21, 24] For this reason, benchmarks are needed to experimentally assess the
strengths and weaknesses of current population pharmacokinetic modeling programs. The
accuracy and precision of these estimates may impact clinical decisions and lead to
alterations in medical management, such that the selection of a pharmacokinetic parameter
estimation method with lower bias and higher precision is desirable.
Applications of Population Pharmacokinetics
The drug development process involves several iterative stages in which
compounds are evaluated to confirm their safety and efficacy prior to regulatory approval,
marketing, and widespread use.[29] Population pharmacokinetic modeling is used to
increase our understanding of the quantitative relationships between drug dosing regimens,
patient characteristics, and drug pharmacokinetics. Today, the use of population
pharmacokinetic modeling is actively encouraged by the United States Food and Drug
Administration (FDA) and the European Medicines Agency (EMA).[29, 30] Despite the
widespread acceptance of population pharmacokinetic methods in the drug approval
process, relatively few population pharmacokinetics studies have been conducted among

9
children. Rectifying this scarcity of pediatric-specific population pharmacokinetic data has
the potential to: (1) result in optimized dosing regimens that improve therapeutic
effectiveness across the pediatric age spectrum from neonates to adolescents; (2) reduce
the incidence of adverse drug reactions; and (3) generate substantial cost savings to the
healthcare system.[31]
Dosing Optimization
Deriving the ‘optimal’ individualized dose that is neither ineffective nor toxic is the
ultimate goal of many physicians, pharmacologists, regulatory agencies, and
pharmaceutical companies.[32] Achieving this goal is challenging for many drugs due to
pharmacokinetic variability within and between patients. For drugs with narrow
therapeutic windows (a small margin separates sub-therapeutic from toxic concentrations),
it is necessary to conduct population pharmacokinetic studies to determine whether
predictable factors (covariates) can be identified that influence the extent and peak of drug
exposure.[33] If substantial variability remains after such investigations and a target
concentration range has been established, then it may be prudent to measure drug
concentrations in each patient (a practice known as therapeutic drug monitoring).[34, 35]
Drug concentration measurements obtained from therapeutic drug monitoring can then be
used to refine the model’s pharmacokinetic parameter predictions for that patient in a
Bayesian manner.[36]

10
Statement of Objectives
The objective of this dissertation is to demonstrate the clinical utility of population
pharmacokinetic models and to assess the predictive performance of several population
pharmacokinetic modeling programs that are commonly used in evaluating drug
concentration time profiles and the response to therapy.
The specific aims are as follows:
1) Define the population pharmacokinetics of two drugs belonging to
different drug classes in a selection of rarely-studied pediatric patient
populations. These analyses include an evaluation of the population
pharmacokinetics of:
Vancomycin among children with invasive methicillin-
resistant Staphylococcus aureus (MRSA) infections; and
Zolpidem among children with severe burn injuries.
2) Assess the performance of several commonly used population
pharmacokinetic software programs in establishing precise and
unbiased pharmacokinetic parameter estimates with varying: amounts
of error / noise, sample sizes, and numbers of samples from each
patient.
The foundation for the first specific aim is outlined in Chapter 2. Chapters 3 and 4
discuss two clinical applications of vancomycin population pharmacokinetic models
among children with cystic fibrosis and neonates with invasive bacterial infections,
respectively. Chapter 5 describes a population pharmacokinetic study involving the
sedative agent zolpidem, which was administered in an effort to restore normal sleep

11
architecture among a cohort of severely burned children. Chapter 6 describes a simulation-
based approach to benchmarking population pharmacokinetic software programs and is
under preparation for submission. Publications that have stemmed directly from this work
include:
Stockmann C, Roberts JK, Yu T, et al. Vancomycin pharmacokinetic models:
informing the clinical management of drug-resistant bacterial infections. Expert
Review of Anti-infective Therapy 2014; 12(11): 1371-88.
Stockmann C, Sherwin CM, Zobell JT, et al. Population pharmacokinetics of
intermittent vancomycin in children with cystic fibrosis. Pharmacotherapy
2013; 33(12): 1288-96.
Stockmann C, Hersh AL, Roberts JK, et al. Predictive performance of a
vancomycin population pharmacokinetic model in neonates. Infectious
Diseases and Therapy 2015; 4(2): 187-98.
Stockmann C, Sherwin CM, Buterbaugh W, et al. Preliminary assessment of
zolpidem pharmacokinetics in pediatric burn patients. Therapeutic Drug
Monitoring 2014; 36(3): 295-301.
Stockmann C, Gottschlich M, Healy D, et al. Relationship between zolpidem
concentrations and sleep parameters in pediatric burn patients. Journal of Burn
Care and Research 2014; 36(1):137-44.
During the course of this dissertation, several fruitful collaborations have also led
to publications that are not discussed within this dissertation, which are featured in
Appendix A.

12
References
1. Bretz F, Schmidli H, Konig F, Racine A, Maurer W. Confirmatory seamless phase
II/III clinical trials with hypotheses selection at interim: general concepts.
Biometrical Journal Biometrische Zeitschrift. 2006 Aug;48(4):623-34.
2. Sheiner LB. Learning versus confirming in clinical drug development. Clinical
Pharmacology and Therapeutics. 1997 Mar;61(3):275-91.
3. Ette EI, Williams PJ. Population pharmacokinetics I: background, concepts, and
models. The Annals of Pharmacotherapy. 2004 Oct;38(10):1702-6.
4. Jenner P, Konen-Bergmann M, Schepers C, Haertter S. Pharmacokinetics of a once-
daily extended-release formulation of pramipexole in healthy male volunteers:
three studies. Clinical Therapeutics. 2009 Nov;31(11):2698-711.
5. Rashid A, Ahmad M, Minhas MU, Hassan IJ, Malik MZ. Pharmacokinetic studies
of metformin and glibenclamide in normal human volunteers. Pakistan Journal of
Pharmaceutical Sciences. 2014 Jan;27(1):153-9.
6. Depre M, van Hecken A, Verbesselt R, Tjandra-Maga TB, Gerin M, de Schepper
PJ. Tolerance and pharmacokinetics of propacetamol, a paracetamol formulation
for intravenous use. Fundamental & Clinical Pharmacology. 1992;6(6):259-62.
7. Mould DR, Upton RN. Basic concepts in population modeling, simulation, and
model-based drug development-part 2: introduction to pharmacokinetic modeling
methods. CPT: Pharmacometrics & Systems Pharmacology. 2013;2:e38.
8. Sheiner LB, Beal SL. Evaluation of methods for estimating population
pharmacokinetics parameters. I. Michaelis-Menten model: routine clinical
pharmacokinetic data. Journal of Pharmacokinetics and Biopharmaceutics. 1980
Dec;8(6):553-71.
9. Sheiner LB, Beal SL. Evaluation of methods for estimating population
pharmacokinetic parameters. II. Biexponential model and experimental
pharmacokinetic data. Journal of Pharmacokinetics and Biopharmaceutics. 1981
Oct;9(5):635-51.
10. Sheiner LB, Beal SL. Evaluation of methods for estimating population
pharmacokinetic parameters. III. Monoexponential model: routine clinical
pharmacokinetic data. Journal of Pharmacokinetics and Biopharmaceutics. 1983
Jun;11(3):303-19.
11. Steimer JL, Mallet A, Golmard JL, Boisvieux JF. Alternative approaches to
estimation of population pharmacokinetic parameters: comparison with the
nonlinear mixed-effect model. Drug Metabolism Reviews. 1984;15(1-2):265-92.

13
12. Sheiner LB, Rosenberg B, Melmon KL. Modelling of individual pharmacokinetics
for computer-aided drug dosage. Computers and Biomedical Research. 1972
Oct;5(5):411-59.
13. Sheiner LB, Rosenberg B, Marathe VV. Estimation of population characteristics of
pharmacokinetic parameters from routine clinical data. Journal of
Pharmacokinetics and Biopharmaceutics. 1977 Oct;5(5):445-79.
14. Beal SJ, Sheiner, S. The NONMEM system. American Statistician. 1980;34:118-
9.
15. Mallet A. A maximum likelihood estimation method for random coefficient
regression models. Biometrika. 1986;73:645-56.
16. Lindstrom ML, Bates DM. Nonlinear mixed effects models for repeated measures
data. Biometrics. 1990 Sep;46(3):673-87.
17. Schumitzky A. Nonparametric EM algorithms for estimating prior distributions.
Appl Math Comp. 1991;45:143-57.
18. Gu MG, Kong FH. A stochastic approximation algorithm with Markov chain
Monte-carlo method for incomplete data estimation problems. Proceedings of the
National Academy of Sciences of the United States of America. 1998 Jun
23;95(13):7270-4.
19. Wahlby U, Jonsson EN, Karlsson MO. Assessment of actual significance levels for
covariate effects in NONMEM. Journal of Pharmacokinetics and
Pharmacodynamics. 2001 Jun;28(3):231-52.
20. Kuhn E, Lavielle M. Maximum likelihood estimation in nonlinear mixed effects
models. Comp Stat Data Anal. 2005;49:1020-38.
21. Beal SL, Sheiner LB, Boeckmann AJ, and Bauer RJ (eds). NONMEM 7.2.0 users
guides. (1989–2011). Icon Development Solutions, Ellicott City.
ftp://nonmem.iconplc.com/Public/nonmem720/guides.
22. Funatogawa T, Funatogawa I. The bayesian bias correction method of the first-
order approximation of nonlinear mixed-effects models for population
pharmacokinetics. Journal of Biopharmaceutical Statistics. 2007;17(3):381-92.
23. Wang Y. Derivation of various NONMEM estimation methods. Journal of
Pharmacokinetics and Pharmacodynamics. 2007 Oct;34(5):575-93.
24. Lavielle, M. Monolix version 4.3.2 users guide. Lixoft, Orsay, France.
http://www.lixoft.eu/wp-content/resources/docs/UsersGuide.pdf.
25. Delyon B, Lavielle M, Moulines E. Convergence of a stochastic approximation
version of the EM algorithm. Ann Stat. 1999;27(1):94-128.

14
26. Kuhn E, Lavielle M. Coupling a stochastic approximation version of EM with an
MCMC procedure. ESAIM Prob Stat. 2004;8:115-31.
27. Tatarinova T, Neely M, Bartroff J, van Guilder M, Yamada W, Bayard D, et al.
Two general methods for population pharmacokinetic modeling: non-parametric
adaptive grid and non-parametric Bayesian. Journal of Pharmacokinetics and
Pharmacodynamics. 2013 Apr;40(2):189-99.
28. Chen M, Ma L, Drusano GL, Bertino JS, Jr., Nafziger AN. Sex differences in
CYP3A activity using intravenous and oral midazolam. Clinical Pharmacology and
Therapeutics. 2006 Nov;80(5):531-8.
29. Administration USFaD. FDA guidance for industry-population pharmacokinetics:
Tech. rep., Food and Drug Administration; 1999.
30. European Medicines Agency. Guideline on Reporting the Results of Population
Pharmacokinetic Analyses. London: EMA; 2007.
31. United States Food and Drug Admnistration. Guidance for Industy: General
Clinical Pharmacology Considerations for Pediatric Studies for Drugs and
Biological Products. Silver Spring, MD: Center for Drug Evaluation and Research,
FDA; 2014.
32. Samara E, Granneman R. Role of population pharmacokinetics in drug
development. A pharmaceutical industry perspective. Clinical Pharmacokinetics.
1997 Apr;32(4):294-312.
33. Wahlby U, Jonsson EN, Karlsson MO. Comparison of stepwise covariate model
building strategies in population pharmacokinetic-pharmacodynamic analysis.
AAPS PharmSci. 2002;4(4):E27.
34. Smith J, Andes D. Therapeutic drug monitoring of antifungals: pharmacokinetic
and pharmacodynamic considerations. Therapeutic Drug Monitoring. 2008
Apr;30(2):167-72.
35. MacDonald A, Scarola J, Burke JT, Zimmerman JJ. Clinical pharmacokinetics and
therapeutic drug monitoring of sirolimus. Clinical Therapeutics. 2000;22 Suppl
B:B101-21.
36. Dansirikul C, Morris RG, Tett SE, Duffull SB. A Bayesian approach for population
pharmacokinetic modelling of sirolimus. British Journal of Clinical Pharmacology.
2006 Oct;62(4):420-34.

Reprinted with permission from Stockmann C, Roberts JK, Yu T, Constance JE,
Knibbe CA, Spigarelli MG, et al. Vancomycin pharmacokinetic models: informing the
clinical management of drug-resistant bacterial infections. Expert Review of Anti-infective
Therapy. 2014 Nov;12(11):1371-88. Copyright 2014 Informa Healthcare.
CHAPTER 2
VANCOMYCIN PHARMACOKINETIC MODELS: INFORMING
THE CLINICAL MANAGEMENT OF DRUG-RESISTANT
BACTERIAL INFECTIONS
Abstract
This review aims to critically evaluate the pharmacokinetic literature describing the
use of vancomycin in the treatment of methicillin-resistant Staphylococcus aureus (MRSA)
infections. Guidelines recommend that trough concentrations be used to guide vancomycin
dosing for the treatment of MRSA infections; however, numerous in vitro, animal model,
and clinical studies have demonstrated that the therapeutic effectiveness of vancomycin is
best described by the area under the concentration versus time curve (AUC) divided by the
minimum inhibitory concentration (MIC) of the infecting organism (AUC/MIC). Among
patients with lower respiratory tract infections, an AUC/MIC≥400 was associated with a
superior clinical and bacteriological response. Similarly, patients with MRSA bacteremia
who achieved an Etest AUC/MIC≥320 within 48 hours were 50% less likely to experience
treatment failure. For other patient populations and different clinical syndromes (e.g.,

16
children, the elderly, patients with osteomyelitis, etc.) pharmacokinetic/pharmacodynamic
studies and prospective clinical trials are needed to establish appropriate therapeutic
targets.
Background
Vancomycin was first approved for use by the United States Food and Drug
Administration (FDA) in 1958.[1] Despite more than 50 years of experience with this
antibiotic, uncertainty remains regarding the most appropriate vancomycin dosing
strategy.[2] This is primarily attributable to its variable pharmacokinetic profile, the
emergence of vancomycin resistance, and its toxic effects.[3] Currently, intravenous
vancomycin is reserved nearly exclusively for the treatment of methicillin-resistant
Staphylococcus aureus (MRSA) infections, which until the late 1970s and early 1980s were
extremely rare and confined to a few large hospitals.[4] More recently, other factors, such
as the controversial ‘MIC creep’ phenomenon and a heightened awareness of the potential
for sub-therapeutic dosing have further complicated vancomycin dosing. At the level of an
individual patient, high between subject variability complicates efforts to develop
simplified or standardized vancomycin dosing regimens.[5] Despite these challenges,
pharmacokinetic and pharmacodynamic modeling techniques may be used to inform
vancomycin dosing, even for adult populations, for which large amounts of data exist.[2]
Over the last 10 years, vancomycin dosing regimens have shifted toward larger,
more frequent doses.[6] This has likely occurred in response to in vitro studies, which
demonstrated that low vancomycin concentrations exert a selective pressure that drives the
emergence of more resistant S. aureus isolates.[7] To prevent such occurrences,

17
professional society guidelines have increased vancomycin exposure targets in an effort to
more rapidly achieve and maintain therapeutic concentrations.[8] Consequently, many
patients who receive vancomycin today are being maintained at concentrations that are
closer to levels associated with nephrotoxicity than ever before, which makes therapeutic
drug monitoring imperative.[9] Simultaneously, there has been an increase in the incidence
of hospital- and community-associated MRSA.[10] In 2003, nearly 60% of S. aureus
isolates obtained from patients in the intensive care unit were methicillin-resistant.[11, 12]
More recently, the US Centers for Disease Control and Prevention (CDC) estimated that
the incidence of MRSA infections declined 31% from 2007 to 2012.[13] Although the
reasons for this decline are unclear, the continued widespread use of vancomycin in the
context of fewer invasive MRSA infections poses substantial risks and must be evaluated
in light of the potential for promoting vancomycin resistance.
The safe and effective administration of vancomycin at the level of the individual
patient, especially in light of current practice patterns, may require more sophisticated
techniques than merely dosing by total body weight and estimated renal function.[14]
Population pharmacokinetic models, which leverage data from a population of patients to
derive an optimal population-specific dosing strategy, are one such example.[15] When
applied to direct patient care, the purpose of population pharmacokinetic modeling is to
provide quantitative and semi-quantitative guidelines for dose optimization. Unlike
traditional pharmacokinetic evaluations, the population pharmacokinetic approach is
unique in that it: (1) derives pharmacokinetic parameter estimates that are representative
of the population being treated; (2) recognizes sources of variability (e.g., between subject,
intra-subject, and inter-occasion variability); (3) identifies factors that influence the

18
pharmacokinetic behavior of the drug; and (4) quantitatively expresses the magnitude of
the unexplained variability within the patient population being treated.[15] For patients
requiring antibiotic therapy for the treatment of drug-resistant bacterial infections it is
critical to quickly establish an effective and safe dosing regimen. Consequently, the
purpose of this review is to critically evaluate the vancomycin pharmacokinetic literature
with respect to its use in the treatment of MRSA infections. A secondary objective is to
identify special patient populations who may require alternative vancomycin dosing
regimens as a consequence of their demographic factors, physiologic status, or co-morbid
conditions. The patient populations investigated in this review include: neonates and
infants, children and adolescents, the elderly, obese patients, cancer patients, patients
requiring continuous renal replacement therapy, patients with cystic fibrosis, and the
critically ill. Emphasis will be placed on the integration of vancomycin population
pharmacokinetic models into clinical care and the role that vancomycin therapeutic drug
monitoring plays in preserving the utility of this antibiotic, as few suitable alternatives
exist.
Pharmacokinetic Profile
The chemical structure of vancomycin is presented in Figure 2.1.
Absorption
Vancomycin is not well absorbed through the gastrointestinal tract and therefore
achieves high colonic concentrations, which have been reported to range from 500-1000
mcg/mL following oral doses of 500 mg every 6 hours.[16] Due to this unique absorption

19
Figure 2.1. Chemical (A) and molecular (B) structures of the glycopeptide antibiotic
vancomycin.

20
profile, vancomycin is recommended for the treatment of Clostridium difficile
infections.[17] However, it must be noted that patients with bowel inflammation can have
increased absorption following oral vancomycin administration.[18] Moreover, patients
with severe renal disease and inflammatory bowel disease have the potential to reach toxic
serum concentrations.[18, 19] Other modes of administration, such as intraperitoneal,
intraventricular, and intrathecal dosing, have been rarely reported. Bunk et al. compared a
single 10 mg/kg dose of vancomycin administered intravenously to a 10 mg/kg dose given
intraperitoneally and noted that 65% of the intraperitoneal dose was absorbed, which
yielded a peak plasma concentration of 6.3 mcg/mL.[20] They suggested that therapeutic
plasma concentrations in excess of 10 mcg/mL could be reached with an intraperitoneal
dose of 30 mg/kg followed by 1-5 mg/kg in each peritoneal exchange for patients in chronic
renal failure. Intraventricular and intrathecal dosing have been described in several case
reports, all of which reported high cerebrospinal fluid (CSF) concentrations without
evidence of high serum concentrations.[21, 22] For the treatment of MRSA infections,
vancomycin is commonly administered intravenously due to its poor oral bioavailability
and extreme pain associated with intramuscular administration.[23] Therefore, the
remainder of this review will focus on the intravenous use of vancomycin, which is
delivered as a slow intravenous infusion with a standard infusion time of approximately 1
hour for a 1 g dose to avoid red man syndrome.[24-26]
Distribution
Vancomycin time-versus-concentration profiles have been reported as mono-, bi-,
or triphasic, though the majority of the literature suggests a biphasic process after
intravenous administration.[4, 27-30] The α-distribution phase ranges from 0.5-1 hr and

21
the β-elimination half-life is between 6-12 hrs in adults with normal renal function, which
demonstrates its high between subject variability.[4, 28-31] After a single administration
of the recommended dose of 15 mg/kg, peak serum concentrations at 2 hrs after infusion
reach approximately 25 mcg/mL.[32, 33] Vancomycin is highly hydrophilic, with a volume
of distribution at steady state comparable to that of total body water.[34, 35] The volume
of distribution has been reported to range from 0.39-2.04 L/kg at steady state and is
influenced by age, gender, and body weight.[4, 28-31, 36] The volume of the central
compartment is approximately 10% of the volume of distribution, which is similar to the
total volume of blood.[31] Protein binding in the serum is moderate, with most reports
ranging from 50-55%.[37, 38] Due to its large volume of distribution, vancomycin readily
crosses into ascitic, pericardial, synovial, and pleural fluids.[39] In addition, concentrations
in abscess fluid are similar to those in serum.[40] Very low concentrations of vancomycin
cross the blood brain barrier (0-0.18 CSF to serum ratios), unless the meninges are
inflamed, which can then result in CSF to serum ratios of 0.36-0.48.[41, 42]
Concentrations in lung tissue range from 5-50% of serum concentrations and have an
overall blood to epithelial lining fluid ratio of 6:1 in critically ill patients.[43-46]
Vancomycin concentrations in the bone are approximately 10% of serum concentrations,
though this increases to 20-30% in infected bone.[47] An exploratory analysis of the
pharmacokinetics and tissue penetration of vancomycin administered via continuous
infusion as prophylaxis for vascular surgery found that vancomycin concentrations in the
arterial wall were approximately 50% of those found in the serum; however, penetration
into fat was lower at 22%.[48]

22
Metabolism
Early pharmacokinetic studies indicated that vancomycin is not efficiently
metabolized.[32, 49] However, more recent studies have suggested that hepatic clearance
may occur to a small degree, although these reports failed to find evidence of a prolonged
vancomycin half-life among patients with impaired hepatic function.[29, 30] In addition,
it is estimated that non-renal clearance may account for between 5-30% of total
clearance.[24, 50]
Elimination
Up to 90% of the vancomycin dose is excreted unchanged within 24 hrs.[25] Renal
excretion occurs primarily through glomerular filtration.[31] Nielsen et al. reported a
vancomycin clearance to creatinine clearance ratio of 0.53 ± 0.11.[51] Similarly, Krogstad
et al. reported a mean vancomycin clearance to creatinine clearance ratio of 0.68 ±
0.07.[31] These discrepancies may be suggestive of renal tubular reabsorption; however,
no definitive reports have documented renal tubular reabsorption in humans and this
discrepancy may be explained by moderate serum protein binding.[39] In adult population
pharmacokinetic models, vancomycin clearance has been found to be highly correlated
with creatinine clearance, weight, and age.[52-58] If creatinine clearance is not measured
directly, the Cockroft-Gault equation may be used, which includes body weight, sex, age,
and serum creatinine concentrations, to estimate creatinine clearance.[59]
23
Considerations for Pharmacokinetic Modeling
Many vancomycin population pharmacokinetic models have been published for
adults in the last 20 years. In this section of the review, we will focus on studies that
evaluated adults with serious drug-resistant bacterial infections. In coming sections, studies
evaluating patients with renal impairment and other pathophysiologic process and co-
morbidities will be discussed at length.
Seven seminal adult vancomycin pharmacokinetic modeling studies are presented
in Table 2.1. The age ranges across these studies varied from 17-95 years.[52-54, 56-58]
With regard to the development of the vancomycin structural model, several used one-
compartment models and several others used two-compartment models. Vancomycin is
well-known to feature a biphasic distribution and elimination phase, which is revealing as
studies that involved intensive sampling often fit a two-compartment model; whereas
sparse sampling schemes often could only fit a one-compartment model. Between subject
variability was modeled using an exponential,[53, 55, 57, 58] a combined,[52] a
proportional,[54] and an additive error model.[56] The between subject variability ranged
from 19.8-38.5% and 18.2-36.4% for clearance and volume of distribution, respectively.
Residual unexplained variability was modeled as an additive,[53, 56] combined,[52, 54,
55] and an exponential error model.[57, 58] Residual variability for the exponential and
additive models ranged from 12.7-24.9% and 1.6-18.5%, respectively. The estimates for
clearance ranged from 0.031-0.086 L/hr/kg in adults.[52-58] Estimates reported for the
volume of distribution from the central compartment were quite variable, ranging from
0.39-2.04 L/kg.[57, 60] The majority of the population pharmacokinetic studies reported
an effect of creatinine clearance or the rate of glomerular filtration on clearance.[2, 52] In

24
Table 2.1. A comparison of adult vancomycin population pharmacokinetic studies.
Study (Year) Ref.
Revilla et al.
(2010)
Patient population Intensive care unit patients 53
Number of patients studied 191
Age, years (median
[range],
mean ± standard deviation)
61.1 ± 16.3 [18-85]
Number of compartments One
Final model (central
compartment)
CL = θ1 x CLCR + Ageθ2
V = θ3 x θ4A, where A = 0 if
SCr ≤1 mg/dL and A = 1 if SCr
>1 mg/dL
Clearance 0.67 mL/min/kg
Volume of distribution 0.82 L/kg
Between subject variability
model
Exponential
Residual variability model Additive
Validation External
Thomson et al.
(2009)
Patient population Adults who received
vancomycin
82
Number of patients studied 398
Age, years (median
[range],
mean ± standard deviation)
66 [16-97]
Number of compartments Two
Final model CL = θ1 x CLCR
V1 = θ3 x Total body weight
Q = θ4
V2 = θ5 x Total body weight
Clearance CL = 2.99 L/hr
Q = 2.28 L/hr
Volume of distribution V1 = 0.675 L/kg
V2 = 0.732 L/kg
Between subject variability
model
Exponential
Residual variability model Combined
Validation External

25
Table 2.1. Continued.
Staatz et al.
(2006)
Patient population Cardiothoracic surgery wound
infections
55
Number of patients studied 102
Age, years (median
[range],
mean ± standard deviation)
66 [17-81]
Number of compartments One
Final model (central
compartment)
CL = θ1 x (1 + θ2 x (CLCR –
CLCR, median))
V = θ3
Clearance 2.97 L/hr
Volume of distribution 1.24 L/kg
Between subject variability
model
Exponential
Residual variability model Combined
Validation External
Tanaka et al.
(2010)
Patient population MRSA infections 56
Number of patients studied 164
Age, years (median
[range],
mean ± standard deviation)
74 [17-94]
Number of compartments One
Final model (central
compartment)
CL = θ1 x GFR
V = θ2
Clearance 0.88 L/hr
Volume of distribution 0.86 L/kg
Between subject variability
model
Additive
Residual variability model Additive
Validation Internal
Llopis-Salvia
and Jimenez-
Torres (2006)
Patient population Intensive care unit patients 52

26
Table 2.1. Continued.
Number of patients studied 50
Age, years (median
[range],
mean ± standard deviation)
60 [18-81]
Number of compartments Two
Final model (central
compartment)
CL = θ1 + θ2 x CLCR
V = θ3 x WT
Clearance 0.03 L/hr
Volume of distribution 0.41 L/kg
Between subject variability
model
Combined
Residual variability model Combined
Validation Internal
Sanchez et al.
(2010)
Patient population Adults who received
vancomycin
54
Number of patients studied 141
Age, years (median
[range],
mean ± standard deviation)
55 ± 14.6
Number of compartments Two
Final model (central
compartment)
CL = θ1 + θ2 x CLCR
V = θ3 x WT
Clearance 0.16 L/hr
Volume of distribution 0.28 L
Between subject variability
model
Proportional
Residual variability model Combined
Validation External
Yamamoto et
al. (2009)
Patient population Gram-positive infections 57
Number of patients studied 100
Age, years (median
[range],
mean ± standard deviation)
65.4 ± 15.1 [25.8-99.7]

27
Table 2.1. Continued.
Number of compartments Two
Final model (central
compartment)
CL = θ1
V = θ4 x WT
Clearance 3.83 L/hr
Volume of distribution 0.48 L
Between subject variability
model
Exponential
Residual variability model Exponential
Validation Internal
Yasuhara et al.
(1998)
Patient population MRSA infections 58
Number of patients studied 190
Age, years (median
[range],
mean ± standard deviation)
64.3 ± 13.8 [19.3-89.6]
Number of compartments Two
Final model (central
compartment)
CL = θ1
V = θ3
Clearance 3.51 L/hr
Volume of distribution 60.7 L (steady state)
Between subject variability
model
Exponential
Residual variability model Exponential
Validation None

28
addition, weight and age were the most common covariates that affected the volume of
distribution. No categorical covariates had a significant effect on clearance or the volume
of distribution. Model evaluations were evenly distributed between internal (bootstrap or
visual predictive check)[52, 56, 57] and external validation procedures.[53-55]
Pharmacodynamic Profile
The vast majority of vancomycin pharmacodynamic studies have been conducted
in vitro. However, in the last decade a few in vivo pharmacodynamic studies have been
conducted, many of which will be discussed at length in this section of the review.
Exposure-Response Profiles
When evaluating the exposure-response profile of an antibiotic it is necessary to
consider the magnitude of the drug exposure and its potency against a specific bacterial
pathogen.[61] In developing exposure-response profiles, both of these may be
quantitatively expressed as a ratio of the drug exposure (e.g., maximum concentration or
the area under the concentration time curve [AUC]) and its potency (expressed as the
minimum inhibitory concentration [MIC]).[61] As a consequence of the wide range of
MICs among different pathogenic microorganisms, these pharmacokinetic /
pharmacodynamic ratios have a broader range when compared to those that include a single
measure of drug exposure or potency alone.[61]

29
Pharmacokinetic / Pharmacodynamic Indices
In vivo antibacterial activity may be predicted from two factors: (1) the antibiotic
concentration at the effect site and (2) the duration of time that the pathogen is exposed to
the antibiotic.[62] Consequently, numerous in vitro and animal studies have been
conducted to evaluate which pharmacokinetic / pharmacodynamic index best predicts
vancomycin antibacterial activity.[63-65] These studies demonstrated that the relationship
between vancomycin concentrations and bacterial killing is best described by the AUC
divided by the MIC of the infecting pathogen (AUC / MIC) (Figure 2.2).[64, 66] In murine
infection models, the vancomycin AUC / MIC was the best predictor of bacterial killing
against MSSA, MRSA, and vancomycin intermediate S. aureus (VISA).[67, 68]
Antibiotic Susceptibility Testing
Antibiotic susceptibility testing results range from quantitative (e.g., actual MIC
values) to qualitative (e.g., susceptible, intermediate, resistant).[62] For the latter, it is
critical to determine whether the MIC breakpoints are chosen to detect drug resistance or
to predict the antibacterial activity of a drug for a patient receiving a typical dose of the
antibiotic.[69] These are two fundamentally different questions that are often not clarified
when breakpoint MICs are selected. For the purpose of conducting pharmacokinetic /
pharmacodynamic analyses, it is preferable to use actual MIC values and establish MIC
breakpoints (if needed) based upon the intended goals of the analysis.
In seeking to predict whether a given vancomycin regimen is likely to be effective
for an individual patient there are several factors that must be considered, including the
variability in vancomycin pharmacokinetics and the range of MICs encountered in clinical

30
Fig
ure
2.2
. V
anco
myc
in c
once
ntr
ati
on v
ersu
s b
act
eria
l act
ivit
y re
lati
on
ship
. (A
) M
RS
A
kil
ling kin
etic
s as
a
funct
ion of
tim
e an
d th
e ra
tio of
the
van
com
yci
n ar
ea under
th
e
conce
ntr
atio
n v
ersu
s ti
me
curv
e to
MIC
(A
UC
/MIC
). (
B)
Min
imal
nu
mber
of
surv
ivin
g
bac
teri
a (l
og C
FU
/mL
) as
a f
unct
ion o
f th
e van
com
yci
n A
UC
/MIC
rat
io.
(C)
Rel
atio
nsh
ip
bet
wee
n t
he
area
bet
wee
n t
he
contr
ol
gro
wth
curv
e an
d t
he
kil
ling /
reg
row
th c
urv
e as
a
funct
ion o
f th
e van
com
yci
n A
UC
/MIC
rat
io. D
ata
adap
ted f
rom
Cui
et a
l.7
1

31
practice. Reliable predictions are challenging to develop as MIC-based vancomycin
susceptibility tests are based primarily on the in vitro determination of the inhibition of
growth for standardized low inocula (105-106), exponential-phase staphylococci.[3] As
such, the MIC does not take into account the effects of vancomycin on higher inocula, such
as those seen in the setting of critical illness.[70-73] Additionally, the effects of biofilm
formation and stationary-phase growth are not taken into account with current vancomycin
susceptibility testing methods.[73] Consequently, others have suggested that alternative
pharmacokinetic / pharmacodynamic indices, such as the time above a multiple of the MIC,
the time above the stationary-phase maximum bactericidal concentration, or the time above
an inoculum-corrected MIC may be more accurate predictors of vancomycin efficacy in
clinical practice.[3] However, these targets have not been evaluated in clinical trials yet
and the AUC / MIC ratio remains the most widely accepted vancomycin pharmacokinetic
/ pharmacodynamic index.
Considerations for Pharmacodynamic Modeling
To optimize antibacterial activity and improve patient safety, vancomycin
therapeutic drug monitoring is recommended for patients with invasive MRSA infections
by the Infectious Diseases Society of America.[74] This practice involves the collection of
serum samples that are assayed to determine the concentration of vancomycin at specified
time-points.[75] These data may then be used in combination with MIC data to derive
optimal patient-specific vancomycin dosing regimens.[75] Although this approach
represents a major advance in the field of personalized medicine several limitations hinder
its widespread adoption, including: the requirement for collecting multiple blood samples,

32
rapid determination of the MIC, and the need for sophisticated modeling software to
integrate the pharmacokinetic / pharmacodynamic data and provide individualized dosing
recommendations.[62]
Population pharmacokinetic / pharmacodynamic modeling leverages historical data
describing the variability in vancomycin pharmacokinetics and the range of bacterial MICs
encountered in clinical practice to derive probability density functions for the likelihood of
achieving specific pharmacokinetic / pharmacodynamic targets (Figure 2.3).[76] Monte
Carlo simulations are commonly used for this purpose.[77] In the case of invasive MRSA
infections, a local hospital may establish its range of MICs using data from previous years
and develop a probability density function that describes the likelihood that an MRSA
isolate will have an MIC <1, 1-2, or ≥2 mcg/mL. Additionally, historical data may be used
to establish the likelihood that a patient treated with a typical dose of vancomycin will have
an AUC <200, 200-400, or >400 mcg*hr/mL. These distributions may then be used as
inputs to develop a large number of computer simulations exploring possible AUC / MIC
ratios. For each simulation, a single random AUC value is chosen along with a random
MIC value, in accordance with their respective probabilities. As the simulation proceeds,
large numbers of AUC and MIC pairs are developed allowing one to summarize the
resulting AUC / MIC ratios as a function of their probability distribution. It is then possible
to set a desired target (e.g., AUC / MIC >400) and calculate the probability of achieving
that target.

33
Figure 2.3. Probability distribution for a hypothetical population of patients receiving
vancomycin. In this example, (A) a compartmental model is used to describe vancomycin
pharmacokinetics, which allows the AUC to be determined by dividing the dose by the
estimated clearance rate. (B) The distribution of methicillin-resistant Staphylococcus
aureus MIC values is used to define the range of MICs observed in the hypothetical
population of patients. (C) The AUC / MIC ratio may be determined using Monte Carlo
simulation, which in this example yields a 26.7% probability of achieve an AUC / MIC
ratio ≥400.

34
Dosing Optimization
AUC/MIC Targets
Vancomycin dosing guidelines recommend that pharmacokinetic /
pharmacodynamic targets be used to guide the clinical management of MRSA
infections.[75] These guidelines rely heavily upon a study by Moise-Broder et al. that
evaluated 108 patients hospitalized with S. aureus lower respiratory tract infections who
required vancomycin treatment.[78] In this study, the authors found that the clinical and
bacteriological response was superior among patients with an AUC / MIC ≥400. Moreover,
an AUC / MIC ≥400 was associated with a decreased time to bacterial eradication and a
decrease in the time to improved pneumonia scores. In contrast, no relationship was defined
between the time above the MIC and the clinical response to therapy. It should be noted
that MICs were determined using the broth microdilution method in this study, which has
been recently shown to result in higher AUC / MIC targets when compared to the Etest
method.[2, 78] Additionally, the vancomycin AUC was not calculated from measured
vancomycin concentrations but was instead predicted from renal function (creatinine
clearance).
Following the publication of consensus recommendations from several leading
professional societies that endorsed a vancomycin AUC / MIC ≥400 target for all serious
MRSA infections, Holmes et al. evaluated this target among 182 patients with S. aureus
bacteremia (77% MRSA).[79] The authors found that a broth microdilution AUC / MIC
≥400 was not associated with lower 30-day all-cause or attributable mortality from S.
aureus bacteremia. However, using classification and regression tree methods, it was found
that an AUC / MIC >373 within the first 96 hours of therapy was associated with a
35
reduction in mortality, following adjustment for potential confounders. This effect
persisted in subgroup analyses limited comparing cases of MRSA versus MSSA and low
versus high MICs (defined as an Etest MIC value >1.5 mcg/mL).
Several recent studies have suggested that the AUC / MIC ≥400 target may not be
universally applicable for all MRSA-associated clinical syndromes.[80, 81] Brown et al.
found that an AUC / MIC <211 was associated with increased mortality among patients
with MRSA bacteremia and infective endocarditis.[80] Additionally, Gawronski et al.
investigated the association between AUC / MIC ratios and the time to microbiological
clearance in patients with MRSA bacteremia and osteomyelitis.[81] The authors used the
classification and regression tree method to determine that an AUC / MIC >293 yielded
the greatest difference in the time to microbiological clearance. For patients with an AUC
/ MIC >293 the mean time to clearance was two days shorter (4 vs. 6 days of bacteremia).
Additional prospective clinical trials are warranted to confirm these findings.
Trough Concentration Targets
Historically, vancomycin trough concentrations have been used as a marker of
vancomycin exposure.[74] Current clinical practice guidelines recommend that a minimum
trough concentration of 10 mcg/mL is recommended to achieve antibacterial activity and
to avoid promoting bacterial resistance.[74] For invasive MRSA infections, a therapeutic
trough concentration target of 15-20 mcg/mL is recommended, which was predictive of an
AUC / MIC >400 among adults with S. aureus lower respiratory tract infections.[78]
However, Gawronski et al. found that trough concentrations did not correlate with AUC /
MIC ratios among patients with MRSA bacteremia and osteomyelitis.[81] Consequently,

36
the authors recommended that total drug exposure be estimated by measuring the AUC /
MIC for each patient to ensure optimal dosing.
Empiric and Definitive Dosing Regimens
Vancomycin is frequently prescribed empirically for the treatment of presumed
MRSA infections. Conventional dosages (1 g every 12 hrs or 15-20 mg/kg actual body
weight every 8-12 hrs) are recommended for adult patients with normal renal function.[75]
However, to reliably achieve a vancomycin trough concentration of 10-15 mcg/mL or an
AUC / MIC > 400, Thomson et al. demonstrated that alternative dosing strategies may be
needed.[82] The authors developed a population pharmacokinetic model using data from
398 patients with a median age of 66 years (range 16-97) who received vancomycin from
1991-2004 and subsequently evaluated its performance using data from 100 patients
(median age 71 years [range 22-91]) treated with vancomycin from 2004-2007. Using
conventional dosing guidelines 19% of patients achieved a trough within 10-15 mcg/mL.
The authors then used the population pharmacokinetic parameter estimates derived from
their model to predict vancomycin trough concentrations in a simulated dataset of 110
patients with varying weights (40-120 kg) and creatinine clearance (15-125 mL/min).
Revised dosing recommendations were then generated by examining the likelihood of
achieving a target trough concentration of 10-15 mcg/mL at doses with fixed increments
of 250 mg administered at intervals of 12, 24, and 48 hours. This process was repeated
until the authors established a series of dosing recommendations that resulted in 55% of
patients in the simulated dataset achieving the target trough concentration of 10-15

37
mcg/mL. Using these dosing recommendations, 87% of the simulated patients were
predicted to achieve an AUC / MIC >400.
For MRSA isolates with an MIC equal to 1 mcg/mL, definitive vancomycin doses
should be maintained at a higher level (60 mg/kg/day) to achieve trough concentrations of
15-20 mcg/mL.[8] Despite the use of larger doses, however, Patel and colleagues used
Monte Carlo simulation techniques and found that the probability of achieving an AUC /
MIC >400 was only 57% with an aggressive dosing regimen of 2 g every 12 hrs when the
MIC was equal to 2 mcg/mL; in contrast to approximately 100% target attainment when
MICs were ≤1 mcg/mL.[14] A similar trend was noticed by Gawronski et al., in which
only 9% of patients were able to reach an AUC / MIC >400 with MICs >1 mcg/mL.[81]
Based on these findings, alternative antibiotics (e.g., linezolid) should be considered for
MRSA isolates with MICs >1 mcg/mL.
Continuous Infusion
Continuous infusion of vancomycin features several practical advantages,
including lower costs, decreased pharmacokinetic variability, and increased ease of
monitoring when compared to intermittent infusion.[83, 84] A recent meta-analysis
evaluated one randomized controlled trial and five observational studies and found that
continuous infusion was associated with a lower risk of nephrotoxicity and no difference
in mortality.[85] This finding is in agreement with a study by Hutschala et al., which found
that critically ill patients undergoing cardiac surgery had a lower incidence of acute renal
failure requiring venovenous hemofiltration after vancomycin was administered via
continuous infusion as compared to intermittent infusion.[86] Roberts et al. evaluated the

38
population pharmacokinetics of vancomycin administered via continuous infusion and
found that high loading (35 mg/kg) and maintenance (35 mg/kg/day) doses were needed to
rapidly achieve therapeutic vancomycin concentrations of 20 mcg/mL among critically ill
patients.[87] Additional studies are needed to determine whether larger doses of
vancomycin administered via continuous infusion affect mortality or the time to clinical
and microbiological response. However, a report by Ingram et al. suggests that there may
be an upper limit for steady-state vancomycin concentrations (≥28 mcg/mL) beyond which
toxicity was frequently noted.[88]
Special Populations
Neonates and Infants
Establishing appropriate vancomycin dosing regimens for neonates and infants is
challenging due to physiological and developmental factors that contribute to high
pharmacokinetic variability.[89] For example, neonates have a high proportion of water by
weight and rapidly changing renal function in the post-natal period, all of which have the
potential to alter vancomycin pharmacokinetics.[90] These factors change most rapidly
during the first week of life.[90]
Although many studies have investigated vancomycin pharmacokinetics in
neonates and infants, an optimal dosing regimen has not yet been evaluated clinically.[34,
90] Variation in vancomycin clearance among pre-term (gestational age <37 weeks) and
term (≥37 weeks gestation) neonates has been shown to be influenced by weight, post-
menstrual age, and renal function.[91-94] This is reflected in the wide range of vancomycin
half-lives (2-12 hours) reported among neonates.[90, 95] Population pharmacokinetic

39
studies have been reported to improve the likelihood of achieving target vancomycin
concentrations among neonates.[96] Although two-compartment models with a long
distribution phase best reflect vancomycin pharmacokinetics, one-compartment models
perform reasonably well in providing individual pharmacokinetic parameter estimates that
may be used for the purpose of developing individualized neonatal dosing regimens.[89,
97] An added advantage of this approach is the ability to determine vancomycin
pharmacokinetic parameters while obtaining relatively few blood samples.[89] Post-hoc
dose adjustments are frequently required to achieve target concentrations due to
unexplained pharmacokinetic variability, which continues to make therapeutic drug
monitoring essential despite advances in neonatal-specific population pharmacokinetic
models.[90, 96]
Few studies have been able to link neonatal vancomycin pharmacokinetic /
pharmacodynamic targets with positive clinical outcomes.[98] Currently, neonatal dosing
is based on trough concentration targets derived from studies involving adults receiving
treatment for MRSA infections.[98] Translation of these targets to neonatal medicine is
challenging due to the fact that MRSA infections are relatively rare.[97, 99] In this patient
population, coagulase-negative S. aureus is the most commonly identified infectious
organism, which may require alternative vancomycin dosing regimens and the use of
different pharmacokinetic / pharmacodynamic targets.[97, 99]
Recently, Zhao et al. evaluated vancomycin continuous infusion regimens for
neonates and found that the regimens used varied widely, presumably owing to a paucity
of pharmacokinetic data.[100] To address this need, the authors evaluated 116 neonates
who received vancomycin via continuous infusion and found that 41% had therapeutic

40
vancomycin concentrations (15-25 mcg/mL). Moreover, the distribution of observed
concentrations varied widely (range 5.1-61.5 mcg/mL). Using a one-compartment
population pharmacokinetic model, the authors developed an optimized dosing regimen
incorporating birth weight, current weight, postnatal age, and serum creatinine. In a
prospective evaluation of this optimized regimen, 71% of the 58 neonates evaluated
achieved the target range of 15-25 mcg/mL. However, the proportion that achieved an AUC
/ MIC > 400 is unknown.
Children and Adolescents
Similar to adults, the emergence of MRSA has led to a significant increase in the
use of vancomycin among children.[101] Therapeutic target trough concentrations have
rapidly evolved over the last decade.[8] Although treatment failure is rare, sub-therapeutic
vancomycin trough concentrations (<5 mcg/mL) have been reported to be associated with
a heightened risk for treatment failure.[102-104] Collectively, reports of rare treatment
failures, inconsistent target attainment rates, and the absence of a clear causal relationship
between vancomycin concentrations and toxicity in pediatric patients has led to upward
revisions in pediatric dosing recommendations from several leading professional
societies.[105-107]
After two years of age, without allometric scaling, weight-related vancomycin
clearance declines with increasing age and serum creatinine concentration.[108] Dosing
regimens that account for the influence of age, serum creatinine, and the susceptibility of
the target organism (e.g., MIC) have been reported to improve target attainment rates
among children.[108] This is particularly true for children <12 years of age, for which

41
higher doses are typically required, and also for critically ill children who require
admission to the pediatric intensive care unit.[107, 109]
Pediatric therapeutic drug monitoring is common and is primarily based on trough
concentration targets.[8] Current guideline recommendations suggest targeting steady state
troughs >10 mcg/mL, with 15-20 mcg/mL recommended for the treatment of invasive
MRSA infections.[8] These targets reflect a change in the primary motivation for
vancomycin therapeutic drug monitoring, which is now less focused on detecting toxicity
and more focused on ensuring that vancomycin concentrations are likely to be
therapeutic.[110] It must be noted, however, that these targets are extrapolated from adult
studies and may not directly correlate with pediatric outcomes.[110] Consequently, several
institutions are in the process of re-evaluating their pediatric vancomycin therapeutic drug
monitoring practices and are shifting away from the use of troughs exclusively in an effort
to establish AUC-based dosing regimens, which have the potential to better describe
vancomycin exposure over the entire dosing interval.[111] Frymoyer et al. determined that
between 75-90% of children with vancomycin trough concentrations of approximately 7-
10 mcg/mL achieve an AUC / MIC >400 when the MIC is ≤1 mcg/mL.[101, 109]
However, no studies have evaluated the rate of treatment failure among children with
MRSA infections with trough concentrations of 7-10 mcg/mL and MICs ≤1 mcg/mL,
which has led to wide variations in pediatric therapeutic drug monitoring and vancomycin
dosing practices.[112, 113]

42
The Elderly
The clinical pharmacokinetics of many antimicrobials, including vancomycin, are
altered among the elderly.[114] This occurs principally due to a decrease in renal clearance
that occurs with increasing age and is characterized by a prolonged half-life and increased
AUC.[114] These changes may be amplified among patients with severe infections who
are prescribed nephrotoxic agents.
In a study by Cutler et al., the pharmacokinetics of vancomycin were investigated
in six healthy elderly men (61-77 years of age) and six healthy, young men (20-26 years of
age).[115] It was reported that these individuals had an increased volume of distribution,
increased tissue binding (calculated indirectly), an increased half-life, and significantly
reduced vancomycin clearance.[115] However, the coefficients of variation for the derived
pharmacokinetic parameters were relatively low (14-16%), suggesting that this relatively
homogeneous population may not accurately reflect the true variability in vancomycin
pharmacokinetics among elderly patients who are receiving vancomycin for the treatment
of invasive MRSA infections. Guay et al. evaluated 148 elderly patients (≥60 years of age)
who received vancomycin for the treatment of suspected or documented gram-positive or
mixed infections.[116] The authors observed a significant increase in the volume of
distribution, half-life, and a decreased rate of vancomycin clearance when compared to
younger adults. In their population pharmacokinetic model, it was determined that
advanced age was a strong predictor of vancomycin clearance, half-life, and volume of
distribution. Due to these effects, it was established that elderly patients with normal renal
function (serum creatinine values ≤1.5 mg/dL) require smaller daily doses as compared

43
with younger patients (18-59 years) to maintain similar target peak and trough
concentrations (18.2 ± 5.8 vs. 25.2 ± 7.8 mg/kg/day).
Recently, Mizokami et al. studied 94 elderly patients (75-99 years) with hospital-
acquired MRSA pneumonia and compared their clinical outcomes using trough- and AUC-
based vancomycin therapeutic drug monitoring methods.[117] The authors found that
trough concentrations were not predictive of 28-day mortality, whereas an AUC <250 or
>450 mcg*hr/mL was strongly associated with an increased risk of death (odds ratio 23.2,
95% confidence interval 6.8-78.7). However, the authors did not report the method used to
identify these thresholds (e.g., classification and regression tree analysis). Additionally,
this retrospective study had a relatively small number of survivors with an AUC / MIC
>450 (n = 11) and those who did not survive had more severe infections, which makes it
difficult to determine whether a target AUC / MIC of 250-450 mcg*hr/mL improves
treatment outcomes for elderly patients with hospital-acquired MRSA pneumonia.
Obese Patients
A limited number of studies have investigated vancomycin pharmacokinetics
among morbidly obese individuals. Bauer et al. evaluated morbidly obese and non-obese
individuals and found that vancomycin clearance rates were similar (1.2 mL/min/kg vs. 1.1
mL/min/kg, respectively).[118] The authors recommended that the total daily dose of 30
mg/kg total bodyweight be divided every 6 or 8 hrs.[118] Similarly, Blouin et al. found no
difference with respect to vancomycin clearance when clearance was expressed per kg of
total bodyweight.[28] Additionally, they recommended that the total daily dose should be
divided every 4 or 6 hrs to prevent high peak concentrations, which are associated with a

44
heightened risk for nephrotoxicity.[28] In accordance with these results, Vance-Bryan et
al. reported that total bodyweight had a significant influence upon vancomycin clearance
and volume of distribution in a study cohort in which 47% of the patients were obese.[119]
As a consequence of the lack of difference in clearance per kg bodyweight, all reports have
concluded that vancomycin should be dosed on total bodyweight with total daily doses
varying from 20-30 mg/kg.
Review articles evaluating vancomycin dosing in obese individuals have primarily
summarized the above mentioned clinical studies, all of which emphasize the need for
dosing regimens to be based upon total bodyweight and for dosing three or more times per
day.[120-123] As vancomycin target concentrations are now higher than those targeted at
the time that these studies were published it seems reasonable that obese individuals should
now receive a total daily dose of at least 37.5 mg/kg divided three times per day to prevent
potentially toxic high peak concentrations. When individual doses exceed 1 g (e.g., 1.5 and
2 g), the infusion period should be extended to 1.5-2 hrs.[75] If vancomycin is administered
by continuous infusion, a dose of 30 mg/kg/day is expected to result in exposures similar
to those achieved with three intermittent infusion doses of 12.5 mg/kg. To rapidly reach
steady state, a loading dose of 25 mg/kg may be considered.[75] Therapeutic drug
monitoring is recommended for all morbidly obese individuals, even when there is no
evidence of renal insufficiency. Prospective clinical studies are needed to evaluate these
dosing proposals for morbidly obese individuals in light of the increased target vancomycin
concentrations that are currently aimed for.

45
Patients with Cancer
Patients with cancer frequently receive empiric vancomycin for episodes of febrile
neutropenia and courses of definitive therapy for the treatment of infections caused by
gram-positive organisms.[124] As patterns of vancomycin use have adapted to relatively
recent recommendations that target higher pharmacokinetic / pharmacodynamic targets,
patients with cancer are at a disadvantage owing to their more rapid clearance when
compared to adults, children, and elderly patients without cancer.[8, 125-131] In a
vancomycin pharmacokinetic / pharmacodynamic study conducted among adults with
hematologic malignancies, it was found that only patients with normal renal function who
received a standard 2 g/day dose achieved therapeutic vancomycin concentrations.[132]
Among children with cancer, Krivoy et al. reported an increase in vancomycin clearance
and lower trough concentrations when compared to children without cancer.[130] On the
basis of these findings, high vancomycin doses are recommended for patients with
cancer.[124]
Large vancomycin doses are required to achieve therapeutic concentrations for
patients with cancer; however, patients with cancer are at an elevated risk for
nephrotoxicity and warrant close monitoring.[133] Recognition of the potential for additive
nephrotoxicity due to the use of vancomycin and the co-prescribing of other nephrotoxic
agents (e.g., chemotherapy, cyclosporine, aminoglycosides, etc.) often leads to the use of
low vancomycin doses (e.g., 1 g every 12 hrs for adults), which increases the risk for
treatment failure and the emergence of resistance.[133] Moreover, patients with cancer are
more likely to have less susceptible S. aureus isolates.[134] Rolston et al. tested the in vitro
activity of vancomycin against 392 gram-positive isolates from patients with cancer and

46
found that 100% of the MRSA isolates and 98% of the MSSA isolates had MICs ≥1
mcg/mL, which has been strongly associated with treatment failure.[134]
There are major limitations associated with extrapolations from small, retrospective
analyses often based solely on vancomycin trough concentrations. Consequently, there is
a need for prospective, disease-specific population pharmacokinetic / pharmacodynamic
studies to determine whether patients with cancer have an altered vancomycin
pharmacokinetic profile. Currently, therapeutic drug monitoring is essential to
individualize vancomycin therapy, thereby balancing therapeutic efficacy with the
potential for developing toxicity among patients with cancer.
Continuous Renal Replacement Therapy
Multiple studies have examined the effect of continuous renal replacement therapy
(CRRT) on vancomycin pharmacokinetics in critically ill patients.[87, 135-138] Many of
these arrived at conflicting results regarding the influence of CRRT on vancomycin
clearance and volume of distribution. DelDot et al. evaluated 10 critically ill patients
receiving continuous venovenous hemodiafiltration (CVVHDF) and found that the mean
total body clearance of vancomycin was 2.5 ± 0.7 L/hr, whilst that cleared by CVVHDF
was 1.8 ± 0.4 L/hr (76% of total body clearance).[135] Another vancomycin
pharmacokinetics study conducted among patients undergoing continuous venovenous
hemofiltration (CVVH) found that CVVH represented approximately 50% of total
vancomycin clearance.[139] Additionally, varying volume of distribution estimates have
been reported.[87, 136] Theoretically, it is expected that the pathophysiology of acute
kidney injury would result in impaired water and solute excretion, which would result in a

47
larger extracellular fluid compartment and lead to an increase in the volume of
distribution.[140] In one of the largest studies to date this was not found to occur; however,
the authors acknowledge that they were unable to account for fluid maintenance in the
intensive care unit, which likely represents a critical covariate needed to accurately model
vancomycin pharmacokinetics for this patient population.[136]
In a recent study, Covajes et al. evaluated 85 patients requiring CRRT and
determined that higher vancomycin doses were needed for patients with the highest CRRT
intensity (>40 mL/kg/hr).[141] The authors targeted a steady state concentration of 20-30
mcg/mL and reported that the two significant factors that influenced vancomycin target
attainment rates within the first three days of therapy were the daily dosage amount and
the intensity of CRRT. On day one of therapy, 51% of patients had adequate steady state
vancomycin concentrations, 20% had supra-therapeutic concentrations, and 29% had sub-
therapeutic concentrations. The majority of patients with adequate steady state vancomycin
concentrations received a daily dose of 16-35 mg/kg. Due to the rapid evolution of acute
kidney injury and the potential for rapid deterioration, therapeutic drug monitoring should
be performed as early as 6 hours after administration of the first vancomycin dose, with
maintenance dosing established after additional samples have been drawn.[142] This is
especially critical as up to 49% of patients undergoing CRRT have been reported to have
sub-therapeutic vancomycin concentrations.[143] Moreover, as the duration of CRRT
increases non-renal clearance decreases, eventually approaching vancomycin clearance
rates observed in patients with chronic renal failure.[50] Due to high variability in non-
renal clearance over time, individualized vancomycin dosing regimens are essential for
patients with acute renal failure.[50]

48
Patients with Cystic Fibrosis
The prevalence of pulmonary MRSA infections has increased among patients with
cystic fibrosis.[144, 145] In 2008, the Cystic Fibrosis Foundation reported that 50% of
patients with cystic fibrosis were infected with S. aureus and 23% were infected with
MRSA. Among patients with cystic fibrosis, MRSA is primarily isolated from children
and young adults.[147]
Pleasants et al. evaluated vancomycin pharmacokinetics among 10 adults with
acute pulmonary exacerbations of cystic fibrosis.[148] The volume of distribution, total
body clearance, and terminal elimination rate were similar among patients with cystic
fibrosis when compared to previous pharmacokinetic parameter estimates derived from
studies with healthy adult volunteers.[148, 149] However, Stockmann et al. found that
vancomycin clearance was slower among children with cystic fibrosis (0.08 L/hr/kg) when
compared to children without cystic fibrosis (0.10-0.16 L/hr/kg).[150-153] It is unclear
whether lower vancomycin doses are needed to accommodate the decreased clearance
among children with cystic fibrosis; however, vancomycin may be dosed similarly for
adults with and without cystic fibrosis. As for all patients, therapeutic drug monitoring is
highly recommended to prevent sub-therapeutic dosing and toxicity.[8]
Critically Ill Patients
Critically ill patients are an inherently heterogeneous population with varying
extents of organ dysfunction, often requiring mechanical support for failing organ systems,
and the administration of many life-saving medications.[52] All of these factors may
modify the pharmacokinetic profile of vancomycin.

49
Llopis-Salvia et al. conducted a population pharmacokinetic study among 50
critically ill adults who required vancomycin for the treatment of suspected or proven
gram-positive infections.[52] The authors used a two-compartment model and determined
that the total body clearance for a 60 kg patient was 60 mL/min, with approximately 28%
occurring via non-renal mechanisms. The volume of distribution in the central and
peripheral compartments were estimated as 0.41 and 1.32 L/kg, respectively, and were
linearly related to total body weight. In contrast, Rodvold et al. reported a volume of
distribution in the central compartment of 0.21-0.24 L/kg in a population of patients with
renal dysfunction.[154] The increased volume of distribution among critically ill patients
may be explained, at least in part, by the physiologic changes in body compartments that
occur as a consequence of fluid overload and/or from the accumulation of fluid in the third
space due to tissue edema.[155]
A Bayesian pharmacokinetic approach has been proposed to feature excellent
predictive performance in evaluating vancomycin dosing regimens for critically ill
patients.[52, 156] Ito et al. developed a two compartment vancomycin infusion algorithm
that resulted in a mean bias of 7.7 ± 7.6 mcg/mL and a mean precision of 8.9 ± 6.2 mcg/mL
for estimating vancomycin trough concentrations.[156] More recently, Llopis-Salvia et al.
established a Bayesian model that yielded improved predictive performance with regard to
both the trough bias (-0.2 mcg/mL) and precision (3.9 mcg/mL).[52]
Current guidelines recommend that vancomycin be administered via intermittent
infusion; however, some investigators prefer continuous infusion, particularly for critically
ill patients.[74, 157, 158] For septic patients with a large volume of distribution continuous
infusion may be preferable.[52, 159, 160] Saugel et al. retrospectively evaluated 164 adults

50
admitted to their medical intensive care unit and reported that a vancomycin continuous
infusion regimen with a median daily dose of 960 (95% confidence interval 526-1723) mg
resulted in a median vancomycin concentration of 19.8 (9.8-29.4) mcg/mL.[161] Using a
target of 15-25 mcg/mL, the authors found that serum vancomycin concentrations were
frequently sub-therapeutic on day one (44%), day two (29%), and day three (23%). These
findings suggest that therapeutic drug monitoring is essential to ensure attainment of
therapeutic vancomycin concentrations. Moreover, it may be speculated that higher doses
may be necessary for critically ill patients.
Expert Commentary and Five-Year View
More than 50 years after the discovery of vancomycin, dosing regimens continue
to evolve. Historically, pharmacokinetic / pharmacodynamic targets have been based on
the use of trough concentrations, which are crude surrogates that are unable to capture the
overall shape and extent of drug exposure over the entire dosing interval.[102] Within the
last five years there has been a movement toward AUC-based therapeutic drug monitoring,
which is a more accurate representation of vancomycin exposure.[75] Over the next five
years, we expect that pharmacokinetic and pharmacodynamic models will continue to be
vital tools used to establish targets for the treatment of invasive MRSA-associated
bacteremia, osteomyelitis, skin and soft tissue infections, and meningitis. Moreover, we
expect that studies will evaluate the AUC/MIC >400 target that is currently recommended
for adults with MRSA-associated lower respiratory tract infections in other patient
populations, which may feature altered vancomycin pharmacokinetic profiles.[74]

51
In addition to their utility in establishing therapeutic targets, these pharmacokinetic
/ pharmacodynamic models may be used to evaluate the efficacy and safety of alternative
vancomycin administration methods. Currently, fewer than 50% of neonates reach
therapeutic vancomycin concentrations with guideline-recommended intermittent dosing
regimens.[97, 162] The reasons for this are likely to be multifactorial and may include:
uncertainties regarding an appropriate therapeutic concentration; developmental
considerations related to the acquisition of renal function; differences in the etiological
agents of neonatal sepsis; unknown vancomycin concentrations at the site of action; and an
unclear mechanism for vancomycin-induced nephrotoxicity, all of which contribute to the
need for prospective, clinical trials guided by population pharmacokinetic /
pharmacodynamic modeling.[98]
Continuous infusion of vancomycin is increasingly being used for adults with
invasive MRSA infections; however, many studies report differing vancomycin target
concentrations.[85] Further research is needed to establish a link between clinical outcomes
and steady state vancomycin concentrations achieved with continuous infusion regimens.
With such data, it would be possible to develop pharmacokinetic / pharmacodynamic
models to identify optimal dosing regimens that would be likely to achieve positive clinical
outcomes by maximizing the likelihood of attaining desired vancomycin target
concentrations. In the event that this occurs within the next five years, it will be critical to
evaluate whether such dosing regimens are appropriate for other patient populations, for
which limited data currently exist.

52
References
1. Hazlewood KA, Brouse SD, Pitcher WD, Hall RG. Vancomycin-associated
nephrotoxicity: grave concern or death by character assassination? The American
Journal of Medicine. 2010 Feb;123(2):182 e1-7.
2. Lodise TP, Drusano GL, Zasowski E, Dihmess A, Lazariu V, Cosler L, et al.
Vancomycin Exposure in Patients With Methicillin-Resistant Staphylococcus
aureus Bloodstream Infections: How Much Is Enough? Clinical Infectious
Diseases. 2014 Sep 1;59(5):666-75.
3. Vandecasteele SJ, De Vriese AS, Tacconelli E. The pharmacokinetics and
pharmacodynamics of vancomycin in clinical practice: evidence and uncertainties.
The Journal of Antimicrobial Chemotherapy. 2013 Apr;68(4):743-8.
4. Matzke GR, McGory RW, Halstenson CE, Keane WF. Pharmacokinetics of
vancomycin in patients with various degrees of renal function. Antimicrobial
Agents and Chemotherapy. 1984 Apr;25(4):433-7.
5. Avent ML, Vaska VL, Rogers BA, Cheng AC, van Hal SJ, Holmes NE, et al.
Vancomycin therapeutics and monitoring: a contemporary approach. Internal
Medicine Journal. 2013 Feb;43(2):110-9.
6. Neely MN, Youn G, Jones B, Jelliffe RW, Drusano GL, Rodvold KA, et al. Are
vancomycin trough concentrations adequate for optimal dosing? Antimicrobial
Agents and Chemotherapy. 2014;58(1):309-16.
7. Dhand A, Sakoulas G. Reduced vancomycin susceptibility among clinical
Staphylococcus aureus isolates ('the MIC Creep'): implications for therapy. F1000
Medicine Reports. 2012;4:4.
8. Liu C, Bayer A, Cosgrove SE, Daum RS, Fridkin SK, Gorwitz RJ, et al. Clinical
practice guidelines by the infectious diseases society of america for the treatment
of methicillin-resistant Staphylococcus aureus infections in adults and children.
Clinical Infectious Diseases. 2011 Feb 1;52(3):e18-55.
9. Giuliano C, Haase KK, Hall R. Use of vancomycin pharmacokinetic-
pharmacodynamic properties in the treatment of MRSA infections. Expert Review
of Anti-infective Therapy. 2010 Jan;8(1):95-106.
10. Barriere SL, Stryjewski ME, Corey GR, Genter FC, Rubinstein E. Effect of
vancomycin serum trough levels on outcomes in patients with nosocomial
pneumonia due to Staphylococcus aureus: a retrospective, post hoc, subgroup
analysis of the Phase 3 ATTAIN studies. BMC Infectious Diseases. 2014;14:183.
11. National Nosocomial Infections Surveillance System. National Nosocomial
Infections Surveillance (NNIS) System report, data summary from January 1992
through June 2004, issued October 2004. Am J Infect Control 2004;32:470-85.

53
12. Stryjewski ME, Szczech LA, Benjamin DK, Jr., Inrig JK, Kanafani ZA, Engemann
JJ, et al. Use of vancomycin or first-generation cephalosporins for the treatment of
hemodialysis-dependent patients with methicillin-susceptible Staphylococcus
aureus bacteremia. Clinical Infectious Diseases. 2007 Jan 15;44(2):190-6.
13. U.S. Centers for Disease Control and Prevention (CDC). Antibiotic Resistance
Threats in the United States, 2013. Available from:
www.cdc.gov/drugresistance/threat-report-2013/pdf/ar-threats-2013-508.pdf [Last
accessed 7 October 2014].
14. Patel N, Pai MP, Rodvold KA, Lomaestro B, Drusano GL, Lodise TP.
Vancomycin: we can't get there from here. Clinical Infectious Diseases. 2011 Apr
15;52(8):969-74.
15. Ette EI, Williams PJ. Population pharmacokinetics I: background, concepts, and
models. The Annals of Pharmacotherapy. 2004 Oct;38(10):1702-6.
16. Bartlett JG. Narrative review: the new epidemic of Clostridium difficile-associated
enteric disease. Annals of Internal Medicine. 2006 Nov 21;145(10):758-64.
17. Bartlett JG. The case for vancomycin as the preferred drug for treatment of
Clostridium difficile infection. Clinical Infectious Diseases. 2008 May
15;46(10):1489-92.
18. Spitzer PG, Eliopoulos GM. Systemic absorption of enteral vancomycin in a patient
with pseudomembranous colitis. Annals of Internal Medicine. 1984
Apr;100(4):533-4.
19. Thompson CM, Jr., Long SS, Gilligan PH, Prebis JW. Absorption of oral
vancomycin - possible associated toxicity. The International Journal of Pediatric
Nephrology. 1983 Mar;4(1):1-4.
20. Bunke CM, Aronoff GR, Brier ME, Sloan RS, Luft FC. Vancomycin kinetics
during continuous ambulatory peritoneal dialysis. Clinical Pharmacology and
Therapeutics. 1983 Nov;34(5):631-7.
21. Arroyo JC, Quindlen EA. Accumulation of vancomycin after intraventricular
infusions. Southern Medical Journal. 1983 Dec;76(12):1554-5.
22. Sutherland GE, Palitang EG, Marr JJ, Luedke SL. Sterilization of Ommaya
reservoir by instillation of vancomycin. The American Journal of Medicine. 1981
Dec;71(6):1068-70.
23. Kirby WM, Divelbiss CL. Vancomycin; clinical and laboratory studies. Antibiotics
Annual. 1956:107-17.
24. Matzke GR, Zhanel GG, Guay DR. Clinical pharmacokinetics of vancomycin.
Clinical Pharmacokinetics. 1986 Jul-Aug;11(4):257-82.

54
25. Ingerman MJ, Santoro J. Vancomycin. A new old agent. Infectious Disease Clinics
of North America. 1989 Sep;3(3):641-51.
26. Polk RE, Healy DP, Schwartz LB, Rock DT, Garson ML, Roller K. Vancomycin
and the red-man syndrome: pharmacodynamics of histamine release. The Journal
of Infectious Diseases. 1988 Mar;157(3):502-7.
27. Geraci JE, Heilman FR, Nichols DR, Wellman EW, Ross GT. Some laboratory and
clinical experiences with a new antibiotic, vancomycin. Antibiotics Annual.
1956:90-106.
28. Blouin RA, Bauer LA, Miller DD, Record KE, Griffen WO, Jr. Vancomycin
pharmacokinetics in normal and morbidly obese subjects. Antimicrobial Agents
and Chemotherapy. 1982 Apr;21(4):575-80.
29. Brown N, Ho DH, Fong KL, Bogerd L, Maksymiuk A, Bolivar R, et al. Effects of
hepatic function on vancomycin clinical pharmacology. Antimicrobial Agents and
Chemotherapy. 1983 Apr;23(4):603-9.
30. Rotschafer JC, Crossley K, Zaske DE, Mead K, Sawchuk RJ, Solem LD.
Pharmacokinetics of vancomycin: observations in 28 patients and dosage
recommendations. Antimicrobial Agents and Chemotherapy. 1982 Sep;22(3):391-
4.
31. Krogstad DJ, Moellering RC, Jr., Greenblatt DJ. Single-dose kinetics of
intravenous vancomycin. Journal of Clinical Pharmacology. 1980 Apr;20(4 Pt
1):197-201.
32. Kirby WM, Divelbiss CL. Vancomycin; clinical and laboratory studies. Antibiotics
Annual. 1956:107-17.
33. Vancomycin [package insert]. New York, NY: Pfizer; 2010.
34. Kendrick JG, Carr RR, Ensom MH. Pharmacokinetics and drug dosing in obese
children. The journal of Pediatric Pharmacology and Therapeutics. 2010
Apr;15(2):94-109.
35. Moffett BS, Kim S, Edwards MS. Vancomycin dosing in obese pediatric patients.
Clinical Pediatrics. 2011 May;50(5):442-6.
36. Ducharme MP, Slaughter RL, Edwards DJ. Vancomycin pharmacokinetics in a
patient population: effect of age, gender, and body weight. Therapeutic Drug
Monitoring. 1994 Oct;16(5):513-8.
37. Ackerman BH, Taylor EH, Olsen KM, Abdel-Malak W, Pappas AA. Vancomycin
serum protein binding determination by ultrafiltration. Drug Intelligence & Clinical
Pharmacy. 1988 Apr;22(4):300-3.

55
38. Albrecht LM, Rybak MJ, Warbasse LH, Edwards DJ. Vancomycin protein binding
in patients with infections caused by Staphylococcus aureus. DICP. 1991 Jul-
Aug;25(7-8):713-5.
39. Wilhelm MP, Estes L. Symposium on antimicrobial agents--Part XII. Vancomycin.
Mayo Clinic Proceedings. 1999 Sep;74(9):928-35.
40. Torres JR, Sanders CV, Lewis AC. Vancomycin concentration in human tissues--
preliminary report. The Journal of Antimicrobial Chemotherapy. 1979
Jul;5(4):475-7.
41. Cooper GL, Given DB. Vancomycin: A Comprehensive Review of 30 Years of
Clinical Experience. New York: Park Row Publishers, Inc, 1986.
42. Albanese J, Leone M, Bruguerolle B, Ayem ML, Lacarelle B, Martin C.
Cerebrospinal fluid penetration and pharmacokinetics of vancomycin administered
by continuous infusion to mechanically ventilated patients in an intensive care unit.
Antimicrobial Agents and Chemotherapy. 2000 May;44(5):1356-8.
43. Cruciani M, Gatti G, Lazzarini L, Furlan G, Broccali G, Malena M, et al.
Penetration of vancomycin into human lung tissue. The Journal of Antimicrobial
Chemotherapy. 1996 Nov;38(5):865-9.
44. Georges H, Leroy O, Alfandari S, Guery B, Roussel-Delvallez M, Dhennain C, et
al. Pulmonary disposition of vancomycin in critically ill patients. European Journal
of Clinical Microbiology & Infectious Diseases. 1997 May;16(5):385-8.
45. Lodise TP, Drusano GL, Butterfield JM, Scoville J, Gotfried M, Rodvold KA.
Penetration of vancomycin into epithelial lining fluid in healthy volunteers.
Antimicrobial Agents and Chemotherapy. 2011 Dec;55(12):5507-11.
46. Lamer C, de Beco V, Soler P, Calvat S, Fagon JY, Dombret MC, et al. Analysis of
vancomycin entry into pulmonary lining fluid by bronchoalveolar lavage in
critically ill patients. Antimicrobial Agents and Chemotherapy. 1993
Feb;37(2):281-6.
47. Graziani AL, Lawson LA, Gibson GA, Steinberg MA, MacGregor RR.
Vancomycin concentrations in infected and noninfected human bone.
Antimicrobial Agents and Chemotherapy. 1988 Sep;32(9):1320-2.
48. Payne CJ, Thomson AH, Stearns AT, Watson DG, Zhang T, Kingsmore DB, et al.
Pharmacokinetics and tissue penetration of vancomycin continuous infusion as
prophylaxis for vascular surgery. The Journal of Antimicrobial Chemotherapy.
2011 Nov;66(11):2624-7.
49. Lee CC, Anderson RC, Chen KK. Vancomycin, a new antibiotic. V. Distribution,
excretion, and renal clearance. Antibiotics Annual. 1956:82-9.

56
50. Macias WL, Mueller BA, Scarim SK. Vancomycin pharmacokinetics in acute renal
failure: preservation of nonrenal clearance. Clinical Pharmacology and
Therapeutics. 1991 Dec;50(6):688-94.
51. Nielsen HE, Hansen, H.E., Korsager, B., Skov, P.E. Renal excretion of vancomycin
in kidney disease. Journal of Internal Medicine. 1975;197(1-6):261-4.
52. Llopis-Salvia P, Jimenez-Torres NV. Population pharmacokinetic parameters of
vancomycin in critically ill patients. Journal of Clinical Pharmacy and
Therapeutics. 2006 Oct;31(5):447-54.
53. Revilla N, Martin-Suarez A, Perez MP, Gonzalez FM, Fernandez de Gatta Mdel
M. Vancomycin dosing assessment in intensive care unit patients based on a
population pharmacokinetic/pharmacodynamic simulation. British Journal of
Clinical Pharmacology. 2010 Aug;70(2):201-12.
54. Sanchez JL, Dominguez AR, Lane JR, Anderson PO, Capparelli EV, Cornejo-
Bravo JM. Population pharmacokinetics of vancomycin in adult and geriatric
patients: comparison of eleven approaches. International Journal of Clinical
Pharmacology and Therapeutics. 2010 Aug;48(8):525-33.
55. Staatz CE, Byrne C, Thomson AH. Population pharmacokinetic modelling of
gentamicin and vancomycin in patients with unstable renal function following
cardiothoracic surgery. British Journal of Clinical Pharmacology. 2006
Feb;61(2):164-76.
56. Tanaka A, Aiba T, Otsuka T, Suemaru K, Nishimiya T, Inoue T, et al. Population
pharmacokinetic analysis of vancomycin using serum cystatin C as a marker of
renal function. Antimicrobial Agents and Chemotherapy. 2010 Feb;54(2):778-82.
57. Yamamoto M, Kuzuya T, Baba H, Yamada K, Nabeshima T. Population
pharmacokinetic analysis of vancomycin in patients with gram-positive infections
and the influence of infectious disease type. Journal of Clinical Pharmacy and
Therapeutics. 2009 Aug;34(4):473-83.
58. Yasuhara M, Iga T, Zenda H, Okumura K, Oguma T, Yano Y, et al. Population
pharmacokinetics of vancomycin in Japanese pediatric patients. Therapeutic Drug
Monitoring. 1998 Dec;20(6):612-8.
59. Cockcroft DW, Gault MH. Prediction of creatinine clearance from serum
creatinine. Nephron. 1976;16(1):31-41.
60. Burnie J, Matthews R, Jiman-Fatami A, Gottardello P, Hodgetts S, D'Arcy S.
Analysis of 42 cases of septicemia caused by an epidemic strain of methicillin-
resistant Staphylococcus aureus: evidence of resistance to vancomycin. Clinical
Infectious Diseases. 2000 Sep;31(3):684-9.

57
61. Preston SL, Drusano GL, Berman AL, Fowler CL, Chow AT, Dornseif B, et al.
Pharmacodynamics of levofloxacin: a new paradigm for early clinical trials.
JAMA. 1998 Jan 14;279(2):125-9.
62. Dudley MN, Ambrose PG. Pharmacodynamics in the study of drug resistance and
establishing in vitro susceptibility breakpoints: ready for prime time. Current
Opinion in Microbiology. 2000 Oct;3(5):515-21.
63. Lowdin E, Odenholt I, Cars O. In vitro studies of pharmacodynamic properties of
vancomycin against Staphylococcus aureus and Staphylococcus epidermidis.
Antimicrobial Agents and Chemotherapy. 1998 Oct;42(10):2739-44.
64. Larsson AJ, Walker KJ, Raddatz JK, Rotschafer JC. The concentration-
independent effect of monoexponential and biexponential decay in vancomycin
concentrations on the killing of Staphylococcus aureus under aerobic and anaerobic
conditions. The Journal of Antimicrobial Chemotherapy. 1996 Oct;38(4):589-97.
65. Ebert S. In vivo cidal activity and pharmacokinetic parameters for vancomycin
against methicillin-susceptible and -resistant S. aureus [abstract 439]. In: Program
and abstracts of the 27th Interscience Conference on Antimicrobial Agents and
Chemotherapy (New York). Washington, DC: American Society for Microbiology,
1987:173.
66. Smirnova MV, Lubenko IY, Portnoy YA, Zinner SH, Firsov AA. Concentration-
response relationships as a basis for choice of the optimal endpoints of the
antimicrobial effect: daptomycin and vancomycin pharmacodynamics with
staphylococci in an in vitro dynamic model. International Journal of Antimicrobial
Agents. 2007 Feb;29(2):165-9.
67. Rybak MJ. The pharmacokinetic and pharmacodynamic properties of vancomycin.
Clinical Infectious Diseases. 2006 Jan 1;42 Suppl 1:S35-9.
68. Craig WA. Basic pharmacodynamics of antibacterials with clinical applications to
the use of beta-lactams, glycopeptides, and linezolid. Infectious Disease Clinics of
North America. 2003 Sep;17(3):479-501.
69. Sanders CC. ARTs versus ASTs: where are we going? The Journal of Antimicrobial
Chemotherapy. 1991 Nov;28(5):621-3.
70. Chuard C, Lucet JC, Rohner P, Herrmann M, Auckenthaler R, Waldvogel FA, et
al. Resistance of Staphylococcus aureus recovered from infected foreign body in
vivo to killing by antimicrobials. The Journal of Infectious Diseases. 1991
Jun;163(6):1369-73.
71. Cui L, Iwamoto A, Lian JQ, Neoh HM, Maruyama T, Horikawa Y, et al. Novel
mechanism of antibiotic resistance originating in vancomycin-intermediate
Staphylococcus aureus. Antimicrobial Agents and Chemotherapy. 2006
Feb;50(2):428-38.

58
72. LaPlante KL, Rybak MJ. Impact of high-inoculum Staphylococcus aureus on the
activities of nafcillin, vancomycin, linezolid, and daptomycin, alone and in
combination with gentamicin, in an in vitro pharmacodynamic model.
Antimicrobial Agents and Chemotherapy. 2004 Dec;48(12):4665-72.
73. LaPlante KL, Woodmansee S. Activities of daptomycin and vancomycin alone and
in combination with rifampin and gentamicin against biofilm-forming methicillin-
resistant Staphylococcus aureus isolates in an experimental model of endocarditis.
Antimicrobial Agents and Chemotherapy. 2009 Sep;53(9):3880-6.
74. Rybak MJ, Lomaestro BM, Rotschafer JC, Moellering RC, Craig WA, Billeter M,
et al. Vancomycin therapeutic guidelines: a summary of consensus
recommendations from the infectious diseases Society of America, the American
Society of Health-System Pharmacists, and the Society of Infectious Diseases
Pharmacists. Clinical Infectious Diseases. 2009 Aug 1;49(3):325-7.
75. Rybak M, Lomaestro B, Rotschafer JC, Moellering R, Jr., Craig W, Billeter M, et
al. Therapeutic monitoring of vancomycin in adult patients: a consensus review of
the American Society of Health-System Pharmacists, the Infectious Diseases
Society of America, and the Society of Infectious Diseases Pharmacists. American
Journal of Health-System Pharmacy. 2009 Jan 1;66(1):82-98.
76. Ambrose PG, Quintiliani R. Limitations of single point pharmacodynamic analysis.
The Pediatric Infectious Disease Journal. 2000 Aug;19(8):769.
77. Bradley JS, Dudley MN, Drusano GL. Predicting efficacy of antiinfectives with
pharmacodynamics and Monte Carlo simulation. The Pediatric Infectious Disease
Journal. 2003 Nov;22(11):982-92; quiz 93-5.
78. Moise-Broder PA, Forrest A, Birmingham MC, Schentag JJ. Pharmacodynamics
of vancomycin and other antimicrobials in patients with Staphylococcus aureus
lower respiratory tract infections. Clinical Pharmacokinetics. 2004;43(13):925-42.
79. Holmes NE, Turnidge JD, Munckhof WJ, Robinson JO, Korman TM, O'Sullivan
MV, et al. Vancomycin AUC/MIC ratio and 30-day mortality in patients with
Staphylococcus aureus bacteremia. Antimicrobial Agents and Chemotherapy. 2013
Apr;57(4):1654-63.
80. Brown J, Brown K, Forrest A. Vancomycin AUC24/MIC ratio in patients with
complicated bacteremia and infective endocarditis due to methicillin-resistant
Staphylococcus aureus and its association with attributable mortality during
hospitalization. Antimicrobial Agents and Chemotherapy. 2012 Feb;56(2):634-8.
81. Gawronski KM, Goff DA, Brown J, Khadem TM, Bauer KA. A stewardship
program's retrospective evaluation of vancomycin AUC24/MIC and time to
microbiological clearance in patients with methicillin-resistant Staphylococcus
aureus bacteremia and osteomyelitis. Clinical Therapeutics. 2013 Jun;35(6):772-9.

59
82. Thomson AH, Staatz CE, Tobin CM, Gall M, Lovering AM. Development and
evaluation of vancomycin dosage guidelines designed to achieve new target
concentrations. The Journal of Antimicrobial Chemotherapy. 2009
May;63(5):1050-7.
83. Van Herendael B, Jeurissen A, Tulkens PM, Vlieghe E, Verbrugghe W, Jorens PG,
et al. Continuous infusion of antibiotics in the critically ill: The new holy grail for
beta-lactams and vancomycin? Annals of Intensive Care. 2012;2(1):22.
84. Jeurissen A, Sluyts I, Rutsaert R. A higher dose of vancomycin in continuous
infusion is needed in critically ill patients. International Journal of Antimicrobial
Agents. 2011 Jan;37(1):75-7.
85. Cataldo MA, Tacconelli E, Grilli E, Pea F, Petrosillo N. Continuous versus
intermittent infusion of vancomycin for the treatment of Gram-positive infections:
systematic review and meta-analysis. The Journal of Antimicrobial Chemotherapy.
2012 Jan;67(1):17-24.
86. Hutschala D, Kinstner C, Skhirdladze K, Thalhammer F, Muller M, Tschernko E.
Influence of vancomycin on renal function in critically ill patients after cardiac
surgery: continuous versus intermittent infusion. Anesthesiology. 2009
Aug;111(2):356-65.
87. Roberts JA, Taccone FS, Udy AA, Vincent JL, Jacobs F, Lipman J. Vancomycin
dosing in critically ill patients: robust methods for improved continuous-infusion
regimens. Antimicrobial Agents and Chemotherapy. 2011 Jun;55(6):2704-9.
88. Ingram PR, Lye DC, Tambyah PA, Goh WP, Tam VH, Fisher DA. Risk factors for
nephrotoxicity associated with continuous vancomycin infusion in outpatient
parenteral antibiotic therapy. The Journal of Antimicrobial Chemotherapy. 2008
Jul;62(1):168-71.
89. van den Anker JN. Getting the dose of vancomycin right in the neonate.
International Journal of Clinical Pharmacology and Therapeutics. 2011
Apr;49(4):247-9.
90. Jacqz-Aigrain E, Zhao W, Sharland M, van den Anker JN. Use of antibacterial
agents in the neonate: 50 years of experience with vancomycin administration.
Seminars in Fetal & Neonatal Medicine. 2013 Feb;18(1):28-34.
91. Anderson BJ, Allegaert K, Van den Anker JN, Cossey V, Holford NH. Vancomycin
pharmacokinetics in preterm neonates and the prediction of adult clearance. British
Journal of Clinical Pharmacology. 2007 Jan;63(1):75-84.
92. Smits A, Kulo A, de Hoon JN, Allegaert K. Pharmacokinetics of Drugs in
Neonates: Pattern Recognition Beyond Compound Specific Observations. Current
Pharmaceutical Design. 2012 Feb 27.

60
93. James A, Koren G, Milliken J, Soldin S, Prober C. Vancomycin pharmacokinetics
and dose recommendations for preterm infants. Antimicrobial Agents and
Chemotherapy. 1987 Jan;31(1):52-4.
94. Oudin C, Vialet R, Boulamery A, Martin C, Simon N. Vancomycin prescription in
neonates and young infants: toward a simplified dosage. Archives of Disease in
Childhood Fetal and Neonatal Edition. 2011 Sep;96(5):F365-70.
95. Rodvold KA, Everett JA, Pryka RD, Kraus DM. Pharmacokinetics and
administration regimens of vancomycin in neonates, infants and children. Clinical
Pharmacokinetics. 1997 Jul;33(1):32-51.
96. Marsot A, Boulamery A, Bruguerolle B, Simon N. Vancomycin: a review of
population pharmacokinetic analyses. Clinical Pharmacokinetics. 2012 Jan
1;51(1):1-13.
97. de Hoog M, Mouton JW, van den Anker JN. Vancomycin: pharmacokinetics and
administration regimens in neonates. Clinical Pharmacokinetics. 2004;43(7):417-
40.
98. Ward RM, Allegaert K, de Groot R, van den Anker JN. Commentary: Continuous
infusion of vancomycin in neonates: to use or not to use remains the question. The
Pediatric Infectious Disease Journal. 2014 Jun;33(6):606-7.
99. Venkatesh MP, Placencia F, Weisman LE. Coagulase-negative staphylococcal
infections in the neonate and child: an update. Seminars in Pediatric Infectious
Diseases. 2006 Jul;17(3):120-7.
100. Zhao W, Lopez E, Biran V, Durrmeyer X, Fakhoury M, Jacqz-Aigrain E.
Vancomycin continuous infusion in neonates: dosing optimisation and therapeutic
drug monitoring. Archives of Disease in Childhood. 2013 Jun;98(6):449-53.
101. Frymoyer A, Guglielmo BJ, Hersh AL. Desired vancomycin trough serum
concentration for treating invasive methicillin-resistant Staphylococcal infections.
The Pediatric Infectious Disease Journal. 2013 Oct;32(10):1077-9.
102. Frymoyer A, Hersh AL, Benet LZ, Guglielmo BJ. Current recommended dosing of
vancomycin for children with invasive methicillin-resistant Staphylococcus aureus
infections is inadequate. The Pediatric Infectious Disease Journal. 2009
May;28(5):398-402.
103. Welsh KJ, Abbott AN, Lewis EM, Gardiner JM, Kruzel MC, Lewis CT, et al.
Clinical characteristics, outcomes, and microbiologic features associated with
methicillin-resistant Staphylococcus aureus bacteremia in pediatric patients treated
with vancomycin. Journal of Clinical Microbiology. 2010 Mar;48(3):894-9.

61
104. Marques-Minana MR, Saadeddin A, Peris JE. Population pharmacokinetic analysis
of vancomycin in neonates. A new proposal of initial dosage guideline. British
Journal of Clinical Pharmacology. 2010 Nov;70(5):713-20.
105. Eiland LS, English TM, Eiland EH, 3rd. Assessment of vancomycin dosing and
subsequent serum concentrations in pediatric patients. The Annals of
Pharmacotherapy. 2011 May;45(5):582-9.
106. Frymoyer A, Guglielmo BJ, Wilson SD, Scarpace SB, Benet LZ, Hersh AL. Impact
of a hospitalwide increase in empiric pediatric vancomycin dosing on initial trough
concentrations. Pharmacotherapy. 2011 Sep;31(9):871-6.
107. Broome L, So TY. An evaluation of initial vancomycin dosing in infants, children,
and adolescents. International Journal of Pediatrics. 2011;2011:470364.
108. Le J, Bradley JS, Murray W, Romanowski GL, Tran TT, Nguyen N, et al. Improved
vancomycin dosing in children using area under the curve exposure. The Pediatric
Infectious Disease Journal. 2013 Apr;32(4):e155-63.
109. Glover ML, Cole E, Wolfsdorf J. Vancomycin dosage requirements among
pediatric intensive care unit patients with normal renal function. Journal of Critical
Care. 2000 Mar;15(1):1-4.
110. Gordon CL, Thompson C, Carapetis JR, Turnidge J, Kilburn C, Currie BJ. Trough
concentrations of vancomycin: adult therapeutic targets are not appropriate for
children. The Pediatric Infectious Disease Journal. 2012 Dec;31(12):1269-71.
111. Le J, Ngu B, Bradley JS, Murray W, Nguyen A, Nguyen L, et al. Vancomycin
Monitoring in Children Using Bayesian Estimation. Therapeutic Drug Monitoring.
2014 Jan 21.
112. Lasky T, Greenspan J, Ernst FR, Gonzalez L. Pediatric vancomycin use in 421
hospitals in the United States, 2008. PLoS One. 2012;7(8):e43258.
113. Kadambari S, Heath PT, Sharland M, Lewis S, Nichols A, Turner MA. Variation
in gentamicin and vancomycin dosage and monitoring in UK neonatal units. The
Journal of Antimicrobial Chemotherapy. 2011 Nov;66(11):2647-50.
114. Meyers BR, Wilkinson P. Clinical pharmacokinetics of antibacterial drugs in the
elderly. Implications for selection and dosage. Clinical Pharmacokinetics. 1989
Dec;17(6):385-95.
115. Cutler NR, Narang PK, Lesko LJ, Ninos M, Power M. Vancomycin disposition:
the importance of age. Clinical Pharmacology and Therapeutics. 1984
Dec;36(6):803-10.

62
116. Guay DR, Vance-Bryan K, Gilliland S, Rodvold K, Rotschafer J. Comparison of
vancomycin pharmacokinetics in hospitalized elderly and young patients using a
Bayesian forecaster. Journal of Clinical Pharmacology. 1993 Oct;33(10):918-22.
117. Mizokami F, Shibasaki M, Yoshizue Y, Noro T, Mizuno T, Furuta K.
Pharmacodynamics of vancomycin in elderly patients aged 75 years or older with
methicillin-resistant Staphylococcus aureus hospital-acquired pneumonia. Clinical
Interventions in Aging. 2013;8:1015-21.
118. Bauer LA, Black DJ, Lill JS. Vancomycin dosing in morbidly obese patients.
European Journal of Clinical Pharmacology. 1998 Oct;54(8):621-5.
119. Vance-Bryan K, Guay DR, Gilliland SS, Rodvold KA, Rotschafer JC. Effect of
obesity on vancomycin pharmacokinetic parameters as determined by using a
Bayesian forecasting technique. Antimicrobial Agents and Chemotherapy. 1993
Mar;37(3):436-40.
120. Pai MP, Bearden DT. Antimicrobial dosing considerations in obese adult patients.
Pharmacotherapy. 2007 Aug;27(8):1081-91.
121. Wurtz R, Itokazu G, Rodvold K. Antimicrobial dosing in obese patients. Clinical
Infectious Diseases. 1997 Jul;25(1):112-8.
122. Cheymol G. Effects of obesity on pharmacokinetics implications for drug therapy.
Clinical Pharmacokinetics. 2000 Sep;39(3):215-31.
123. Bearden DT, Rodvold KA. Dosage adjustments for antibacterials in obese patients:
applying clinical pharmacokinetics. Clinical Pharmacokinetics. 2000
May;38(5):415-26.
124. Lortholary O, Lefort A, Tod M, Chomat AM, Darras-Joly C, Cordonnier C.
Pharmacodynamics and pharmacokinetics of antibacterial drugs in the management
of febrile neutropenia. The Lancet Infectious Diseases. 2008 Oct;8(10):612-20.
125. Le Normand Y, Milpied N, Kergueris MF, Harousseau JL. Pharmacokinetic
parameters of vancomycin for therapeutic regimens in neutropenic adult patients.
International Journal of Bio-medical Computing. 1994 Jun;36(1-2):121-5.
126. Buelga DS, del Mar Fernandez de Gatta M, Herrera EV, Dominguez-Gil A, Garcia
MJ. Population pharmacokinetic analysis of vancomycin in patients with
hematological malignancies. Antimicrobial Agents and Chemotherapy. 2005
Dec;49(12):4934-41.
127. Omote S, Yano Y, Hashida T, Masuda S, Yano I, Katsura T, et al. A retrospective
analysis of vancomycin pharmacokinetics in Japanese cancer and non-cancer
patients based on routine trough monitoring data. Biological & Pharmaceutical
Bulletin. 2009 Jan;32(1):99-104.

63
128. Al-Kofide H, Zaghloul I, Al-Naim L. Pharmacokinetics of vancomycin in adult
cancer patients. Journal of Oncology Pharmacy Practice. 2010 Dec;16(4):245-50.
129. Zhao W, Zhang D, Fakhoury M, Fahd M, Duquesne F, Storme T, et al. Population
Pharmacokinetics and Dosing Optimization of Vancomycin in Children with
Malignant Hematological Disease. Antimicrobial Agents and Chemotherapy. 2014
Jun;58(6):3191-9.
130. Krivoy N, Peleg S, Postovsky S, Ben Arush MW. Pharmacokinetic analysis of
vancomycin in steady state in pediatric cancer patients. Pediatric Hematology and
Oncology. 1998 Jul-Aug;15(4):333-8.
131. Sadoh S, Tsuji Y, Tsukamoto K. [Correlation of pharmacokinetic parameters with
serum vancomycin concentration in elderly patients with malignancies]. Yakugaku
Zasshi. 2010 Jan;130(1):69-73.
132. Fernandez de Gatta Mdel M, Santos Buelga D, Sanchez Navarro A, Dominguez-
Gil A, Garcia MJ. Vancomycin dosage optimization in patients with malignant
haematological disease by pharmacokinetic/pharmacodynamic analysis. Clinical
Pharmacokinetics. 2009;48(4):273-80.
133. Ghehi MT, Rezaee S, Hayatshahi A, Hadjibabaie M, Gholami K, Javadi M, et al.
Vancomycin Pharmacokinetic Parameters in Patients Undergoing Hematopoietic
Stem Cell Transplantation (HSCT). International Journal of Hematology-Oncology
and Stem Cell Research. 2013;7(4):1-9.
134. Rolston KV. Challenges in the treatment of infections caused by gram-positive and
gram-negative bacteria in patients with cancer and neutropenia. Clinical Infectious
Diseases. 2005 Apr 1;40 Suppl 4:S246-52.
135. DelDot ME, Lipman J, Tett SE. Vancomycin pharmacokinetics in critically ill
patients receiving continuous venovenous haemodiafiltration. British Journal of
Clinical Pharmacology. 2004 Sep;58(3):259-68.
136. Udy AA, Covajes C, Taccone FS, Jacobs F, Vincent JL, Lipman J, et al. Can
population pharmacokinetic modelling guide vancomycin dosing during
continuous renal replacement therapy in critically ill patients? International Journal
of Antimicrobial Agents. 2013 Jun;41(6):564-8.
137. van de Vijsel LM, Walker SA, Walker SE, Yamashita S, Simor A, Hladunewich
M. Initial vancomycin dosing recommendations for critically ill patients
undergoing continuous venovenous hemodialysis. The Canadian Journal of
Hospital Pharmacy. 2010 May;63(3):196-206.
138. Beumier M, Roberts JA, Kabtouri H, Hites M, Cotton F, Wolff F, et al. A new
regimen for continuous infusion of vancomycin during continuous renal
replacement therapy. The Journal of Antimicrobial Chemotherapy. 2013
Dec;68(12):2859-65.

64
139. Chaijamorn W, Jitsurong A, Wiwattanawongsa K, Wanakamanee U, Dandecha P.
Vancomycin clearance during continuous venovenous haemofiltration in critically
ill patients. International Journal of Antimicrobial Agents. 2011 Aug;38(2):152-6.
140. Roberts JA, Lipman J. Pharmacokinetic issues for antibiotics in the critically ill
patient. Critical Care Medicine. 2009 Mar;37(3):840-51; quiz 59.
141. Covajes C, Scolletta S, Penaccini L, Ocampos-Martinez E, Abdelhadii A, Beumier
M, et al. Continuous infusion of vancomycin in septic patients receiving continuous
renal replacement therapy. International Journal of Antimicrobial Agents. 2013
Mar;41(3):261-6.
142. Petejova N, Martinek A, Zahalkova J, Duricova J, Brozmannova H, Urbanek K, et
al. Vancomycin pharmacokinetics during high-volume continuous venovenous
hemofiltration in critically ill septic patients. Biomedical papers of the Medical
Faculty of the University Palacky, Olomouc, Czechoslovakia. 2014 Apr;158(1):65-
72.
143. Wilson FP, Berns JS. Vancomycin levels are frequently subtherapeutic during
continuous venovenous hemodialysis (CVVHD). Clinical Nephrology. 2012
Apr;77(4):329-31.
144. Thomas S, Cantrill S, Waghorn DJ, McIntyre A. The role of screening and
antibiotic prophylaxis in the prevention of percutaneous gastrostomy site infection
caused by methicillin-resistant Staphylococcus aureus. Alimentary Pharmacology
& Therapeutics. 2007 Mar 1;25(5):593-7.
145. Solis A, Brown D, Hughes J, Van Saene HK, Heaf DP. Methicillin-resistant
Staphylococcus aureus in children with cystic fibrosis: An eradication protocol.
Pediatr Pulmonol. 2003 Sep;36(3):189-95.
146. Cystic Fibrosis Foundation. Patient Registry 2008 annual report. Bethesda, MD:
Cystic Fibrosis Foundation; 2009.
147. Dasenbrook EC, Merlo CA, Diener-West M, Lechtzin N, Boyle MP. Persistent
methicillin-resistant Staphylococcus aureus and rate of FEV1 decline in cystic
fibrosis. American Journal of Respiratory and Critical Care Medicine. 2008 Oct
15;178(8):814-21.
148. Pleasants RA, Michalets EL, Williams DM, Samuelson WM, Rehm JR, Knowles
MR. Pharmacokinetics of vancomycin in adult cystic fibrosis patients.
Antimicrobial Agents and Chemotherapy. 1996 Jan;40(1):186-90.
149. Healy DP, Polk RE, Garson ML, Rock DT, Comstock TJ. Comparison of steady-
state pharmacokinetics of two dosage regimens of vancomycin in normal
volunteers. Antimicrobial Agents and Chemotherapy. 1987 Mar;31(3):393-7.

65
150. Naqvi SH, Keenan WJ, Reichley RM, Fortune KP. Vancomycin pharmacokinetics
in small, seriously ill infants. Am J Dis Child. 1986 Feb;140(2):107-10.
151. Chang D. Influence of malignancy on the pharmacokinetics of vancomycin in
infants and children. The Pediatric Infectious Disease Journal. 1995
Aug;14(8):667-73.
152. Lamarre P, Lebel D, Ducharme MP. A population pharmacokinetic model for
vancomycin in pediatric patients and its predictive value in a naive population.
Antimicrobial Agents and Chemotherapy. 2000 Feb;44(2):278-82.
153. Stockmann C, Sherwin CM, Zobell JT, Lubsch L, Young DC, Olson J, et al.
Population pharmacokinetics of intermittent vancomycin in children with cystic
fibrosis. Pharmacotherapy. 2013 Dec;33(12):1288-96.
154. Rodvold KA, Blum RA, Fischer JH, Zokufa HZ, Rotschafer JC, Crossley KB, et
al. Vancomycin pharmacokinetics in patients with various degrees of renal
function. Antimicrobial Agents and Chemotherapy. 1988 Jun;32(6):848-52.
155. Polard E, Le Bouquin V, Le Corre P, Kerebel C, Trout H, Feuillu A, et al. Non
steady state and steady state PKS Bayesian forecasting and vancomycin
pharmacokinetics in ICU adult patients. Therapeutic Drug Monitoring. 1999
Aug;21(4):395-403.
156. Ito MK, Duren LL, Simonian JS, Dreyfus-Vigil SD, Cookson TL. Computer dosing
program for the initiation of vancomycin therapy. Clinical Pharmacy. 1993
Feb;12(2):126-30.
157. Roberts JA, Lipman J, Blot S, Rello J. Better outcomes through continuous infusion
of time-dependent antibiotics to critically ill patients? Current Opinion in Critical
Care. 2008 Aug;14(4):390-6.
158. Pea F, Furlanut M, Negri C, Pavan F, Crapis M, Cristini F, et al. Prospectively
validated dosing nomograms for maximizing the pharmacodynamics of
vancomycin administered by continuous infusion in critically ill patients.
Antimicrobial Agents and Chemotherapy. 2009 May;53(5):1863-7.
159. Chua K, Howden BP. Treating Gram-positive infections: vancomycin update and
the whys, wherefores and evidence base for continuous infusion of anti-Gram-
positive antibiotics. Current Opinion in Infectious Diseases. 2009 Dec;22(6):525-
34.
160. McKenzie C. Antibiotic dosing in critical illness. The Journal of Antimicrobial
Chemotherapy. 2011 Apr;66 Suppl 2:ii25-31.
161. Saugel B, Nowack MC, Hapfelmeier A, Umgelter A, Schultheiss C, Thies P, et al.
Continuous intravenous administration of vancomycin in medical intensive care
unit patients. Journal of Critical Care. 2013 Feb;28(1):9-13.

66
162. Schaible DH, Rocci ML, Jr., Alpert GA, Campos JM, Paul MH, Polin RA, et al.
Vancomycin pharmacokinetics in infants: relationships to indices of maturation.
Pediatric Infectious Disease. 1986 May-Jun;5(3):304-8.

Reprinted with permission from Stockmann C, Sherwin CM, Zobell JT, Lubsch L,
Young DC, Olson J, et al. Population pharmacokinetics of intermittent vancomycin in
children with cystic fibrosis. Pharmacotherapy. 2013 Dec;33(12):1288-96. Copyright 2013
John Wiley & Sons, Inc.
CHAPTER 3
POPULATION PHARMACOKINETICS OF INTERMITTENT
VANCOMYCIN IN CHILDREN
WITH CYSTIC FIBROSIS
Abstract
Background: Vancomycin is the drug-of-choice for the treatment of methicillin-
resistant Staphylococcus aureus (MRSA) infections in children with cystic fibrosis.
However, no studies have characterized the pharmacokinetic profile of vancomycin among
pediatric cystic fibrosis patients.
Objective: To evaluate the pharmacokinetics of intermittent vancomycin
administration in children with cystic fibrosis and identify covariates that significantly
influence vancomycin efficacy and safety.
Methods: Therapeutic drug monitoring data were obtained from two cystic fibrosis
care centers that identified children <18 years who received vancomycin treatment for an
acute pulmonary exacerbation from 2005-2010. Trough and peak serum concentrations
were determined before and after the third or fourth dose. Nonlinear mixed effects models

68
were developed to evaluate the population pharmacokinetics of vancomycin.
Results: Among the 67 children (mean age 12.1+5.3 years), the mean vancomycin
dose was 17.4+4.4 mg/kg. The mean trough concentration (Cmin) was 10.3+3.8 mg/L. The
mean daily area under the serum concentration time curve (AUC24) was 282.5+816.9
mg*hr/L. A one-compartment model with first-order elimination best described the data.
Weight significantly influenced vancomycin clearance (P<0.001). In the final model,
clearance was estimated as 5.57 L/hr/70 kg, and the volume of distribution was 44.1 L/70
kg. The between subject variabilities for clearance and volume of distribution were 27%
and 40%, respectively.
Conclusions: Using a one-compartment model to evaluate the pharmacokinetic
properties of vancomycin in children with cystic fibrosis, clearance increased with body
weight. Pharmacodynamic studies are needed to establish an optimal vancomycin dosing
regimen for the treatment of pediatric exacerbations of cystic fibrosis.
Background
Vancomycin is commonly used to treat severe methicillin-resistant Staphylococcus
aureus (MRSA) infections and has been widely studied in adults.[2] The prevalence of
MRSA lower respiratory tract infections in patients with cystic fibrosis (CF) is
increasing.[3-5] From 1996 to 2006, the proportion of patients with CF who had one or
more positive culture(s) for MRSA increased from 2% to 19%. According to the 2008
Cystic Fibrosis Foundation (CFF) Patient Registry, more than 50% of patients with CF are
infected with S. aureus, and 23% are infected with MRSA.6,7 Among patients with CF,
MRSA is primarily isolated from children and young adults.[8]

69
The importance of proper vancomycin dosing has been highlighted in a consensus
national guideline endorsed by several leading professional societies.[2] Guideline
recommendations were supported by data from adults without CF. Pharmacokinetic data
to guide the optimal dosing of vancomycin in patients with CF are limited across all age
groups. A small pharmacokinetic analysis of vancomycin in 10 adults with CF was
published in 1996.[9] This study found that the disposition and pharmacokinetics of
vancomycin were similar in adults with CF and healthy adult volunteers. However, there
is a critical shortage of pharmacometric data for children and young adults with CF, who
are most frequently infected with MRSA.
Although MRSA possesses virulence factors that can damage host tissue, the
clinical consequences of MRSA infection in children with CF are poorly understood.[10,
11] In a large observational study, Ren et al. reported that patients who were culture-
positive for MRSA had greater airway obstruction compared with patients with methicillin-
sensitive S. aureus (MSSA).[12] A follow-up study found that despite greater airway
obstruction, aggressive treatment with antibiotics, and more frequent hospitalizations, the
rate of lung function decline was not significantly different for patients with MRSA or
MSSA.[13] However, Dasenbrook and colleagues retrospectively examined 19,833
patients with CF and found evidence of an increased risk of death among patients with
MRSA infection versus patients with MSSA infection.[14]
The objective of this study was to characterize the pharmacokinetic parameters of
vancomycin in a population of children recruited from two CF care centers. Potential
covariates were assessed for their effect upon vancomycin pharmacokinetic parameters.

70
Methods
Setting and Study Population
This retrospective study consisted of 67 pediatric patients who received
vancomycin for treatment of a CF pulmonary exacerbation. Children who received
treatment at Intermountain Primary Children’s Medical Center, Salt Lake City, Utah and
Cardinal Glennon Children’s Medical Center, St. Louis, Missouri from January 1, 2005
through December 31, 2010 were eligible for inclusion. Patient demographics, including
age, sex, weight, height, and serum creatinine were recorded through a combination of
electronic and manual abstraction from the medical record. This study was reviewed,
approved, and granted a waiver of informed consent by Institutional Review Boards at both
study sites.
Drug Administration and Sample Collection
Intermountain Primary Children’s Medical Center and Cardinal Glennon
Children’s Medical Center routinely evaluate for evidence of MRSA infection among
children with CF undergoing treatment for an acute pulmonary exacerbation. Vancomycin
is used as the first-line therapy for MRSA at both study sites.[15] All patients received a
60-minute infusion of vancomycin using a syringe pump at doses of 15-20 mg/kg
administered 2, 3, or 4 times daily. The mean dose was 16.5 + 4.2 mg/kg for patients
treated at Intermountain Primary Children’s Medical Center and 17.9 + 4.5 mg/kg for
patients treated at Cardinal Glennon Children’s Medical Center. Dosing adjustments were
made for peak concentrations less than 20 mg/L, peak concentrations greater than 40 mg/L,
and trough concentrations greater than 20 mg/L.

71
Blood samples were collected from all patients for therapeutic drug monitoring as
part of routine medical care. Samples were drawn within 30 minutes before the dose
(trough concentration) and 30 minutes after the end of the intravenous infusion (peak
concentration). Treatment duration was typically 10 to 14 days, based on clinical status and
pulmonary function testing results.
Vancomycin Assay
Serum drug concentrations were measured using a fluorescence polarization
immunoassay (Abbott AxSYM, Abbott Park, IL).[16] Assay validation was performed for
clinical purposes. The lower and upper limits of quantification were 2.0 mg/L and 100.0
mg/L, respectively. At Cardinal Glennon Children’s Medical Center, the intra-day relative
standard deviation (a measure of precision) ranged from 3.5-4.3% and the inter-day relative
standard deviation ranged from 0.6-0.9%. The relative error (a measure of accuracy) ranged
from 2.9-4.3%. At Primary Children’s Medical Center, the intra-day and inter-day relative
standard deviations ranged from 4.7-7.1%.
Pharmacokinetic Analysis
Vancomycin pharmacokinetic parameters were evaluated using NONMEM 7.2
(non-linear mixed effects modeling; ICON Development Solutions, Ellicott City, MD).
Data from the two centers were initially assessed separately. Results were found to be
comparable, and the data were pooled for all further analyses. Pooled data were fitted with
one- and two-compartment first-order conditional estimation with interaction models. The
one-compartment model estimated vancomycin clearance (CL) and the volume of

72
distribution (VD).
Structural models were selected for further assessment using the Akaike
information criterion (AIC) and the Schwarz Bayesian criterion (SBC).[17] Diagnostic
plots were used to visually inspect the model’s fit, including observed vs. population
predicted vancomycin concentrations and observed vs. individual predicted vancomycin
concentrations. Residuals and conditional weighted residuals (CWRES) were also plotted
vs. time or population predicted vancomycin concentrations. Models were further
compared by assessing the precision of the parameter estimates, measures of variability,
and the objective function value (OFV). A reduction in the OFV of more than 5.99 (-2 log
likelihood difference) was considered to be statistically significant with two degrees of
freedom and a P<0.05.[18]
Model variability and random effects were classified as one of two types of error:
1) between-subject variability (BSV) and 2) residual unexplained variability (RUV). BSV
is the variability inherent between different patients and was assumed to be log-normally
distributed according to an exponential equation of the form:
𝑃𝑖 = 𝜃𝑝𝑜𝑝 ∗ exp(𝜂𝑖𝜃) ; 𝜂𝑖
𝜃 i. i. d. ~ N(0, ω𝜃2 ) (3.1)
where Pi is the value of the pharmacokinetic parameter for the ith individual, θpop is the
population mean for P, and ηiθ represents the between subject random effect for the ith
individual on θ, each of which are independent and identically distributed with a mean of
zero and a variance of ω2.[19]
The RUV was the second source of variability and reflects the difference between
the model prediction for the individual and the measured observation. This includes the
error in the assay, errors in drug dose, errors in the time of measurement, etc.[20] During

73
model development, RUV was evaluated using additive, proportional, and combined error
models. A combined residual error model resulted in the greatest improvement in the OFV.
The equation for the combined error model was:
𝑌𝑖𝑗 = 𝑌𝑚𝑖𝑗(1 + 𝜀𝑖𝑗) + 𝜀𝑖𝑗 (3.2)
where Yij is the observed concentration for the ith individual at time j, Ymij is the model
prediction, and εij is a normally-distributed random error with a mean of zero and a variance
of σ2.
The area under the plasma concentration vs. time curve over a day (AUC24) for
vancomycin was calculated for each patient using the following equation:
𝐴𝑈𝐶24 =𝐷𝑎𝑖𝑙𝑦 𝑣𝑎𝑛𝑐𝑜𝑚𝑦𝑐𝑖𝑛 𝑑𝑜𝑠𝑒
𝑉𝑎𝑛𝑐𝑜𝑚𝑦𝑐𝑖𝑛 𝑐𝑙𝑒𝑎𝑟𝑎𝑛𝑐𝑒
(3.3)
Covariate Analysis
Potential covariates were initially identified through generalized additive modeling.
Further testing was performed by evaluating potential covariates using stepwise forward
addition and then stepwise backward elimination procedures. A reduction in the OFV of
>5.99 (P<0.05) was required to retain covariates in the forward addition step. In the
backward elimination step, covariates were retained if they resulted in a reduction in the
OFV of >9.21 (P<0.01).
Age, weight, height, sex, and serum creatinine were included in the covariate
analysis. To adjust for differences in body size and metabolic rate, allometric scaling was
applied to standardize body weight between the parameter estimates determined for this
pediatric population and values reported for a typical 70 kg adult by fixing the exponents
in the allometric model to 0.75 for clearance (equation 3) and to 1 for the VD.[21]

74
𝐶𝐿𝑖 = (𝐶𝐿𝑝𝑜𝑝 ∗ (𝐵𝑊70⁄ )
𝜃) ∗ exp(𝜂𝐶𝐿)
(3.4)
where CLi is the individual clearance in the ith individual, CLpop is the estimate of the
population clearance, 𝜂𝐶𝐿 is the random between subject variability, θ is the shift parameter
describing the systematic dependence of clearance on individual body weight, and BW is
the body weight of the ith individual.
Model Evaluation
Models were evaluated and selected based on the goodness of fit and unstable
models were excluded from the model building process. The stability of the models was
assessed by changing the number of significant digits and the initial parameter estimates
for CL and VD. Models were also compared using the Akaike information criterion (AIC)
and Schwarz information criterion (SIC) to discriminate between non-hierarchical models
as part of the model selection criteria.[17] Nonparametric bootstrapping techniques were
utilized to evaluate the stability of the final pharmacokinetic model and to quantify the
uncertainty in parameter estimates.[22] PDx-Pop was used to derive 1000 bootstrap runs
by randomly sampling with replacement from the original dataset. Standard errors were
computed for both the estimated population parameters and random effect error models.
Model stability was further assessed by generating visual predictive checks, in which the
90% confidence interval from the measured vancomycin concentrations were compared to
the results obtained from 100 simulated vancomycin datasets.

75
Results
Patients and Pharmacokinetics
The median age of the study population was 13.9 years (interquartile range: 8-17),
and a majority of patients were female (60%). The mean body weight of the patients was
40.6 + 19.5 kg. Additional demographic characteristics are summarized in Table 3.1. From
these 67 patients, there were 227 unique hospitalizations. Cardinal Glennon contributed
337 vancomycin concentration measurements (mean 7.9 + 9.6 concentrations per patient),
and Intermountain Primary Children’s Medical Center contributed 149 (mean 6.3 + 6.8
concentrations per patient). The mean peak (Cmax) and trough (Cmin) vancomycin
concentrations were 25.4 + 11.0 mg/L and 10.1 + 3.8 mg/L, respectively. The mean AUC24
was 282.5 + 816.9 mg*hr/L.
Population Pharmacokinetic Models
Several structural models were explored to determine the model that best fit the
vancomycin concentration data. One-compartment and two-compartment structural
models with first-order elimination were assessed with additive, proportional, and
combined error models. Structural models also incorporated the rate and duration of the
IV infusion for each subject.
A one-compartment model was used to describe the serum concentrations of
vancomycin in this patient population. The base model was a one-compartment model with
first-order elimination, which was selected as the initial base model on the basis of the
OFV, AIC, and SBC. Base model parameter estimates for CL were similar for the Cardinal
Glennon and Intermountain Primary Children’s models, 2.38 and 3.24 L/hr, respectively.

76
Table 3.1. Demographic characteristics among children with cystic fibrosis who received
vancomycin for the treatment of an acute pulmonary exacerbation.
Characteristic
Cardinal Glennon
Number (%)
(n=43)
Primary Childrens
Number (%)
(n=24)
Combined
Number (%)
(n=67)
Age, yrs
Median 14 12.5 13.9
Interquartile range 9 – 17 7.1 – 15.5 8 – 17
Sex
Male 19 (44) 8 (33) 27 (40)
Female 24 (56) 16 (67) 40 (60)
Weight, kg
Median 43.2 36.6 41.2
Interquartile range 27.1 – 59.9 23.1 – 46.8 25.5 – 56.8
Height, cm
Median 154 140 150
Interquartile range 108 – 163 124 – 159 118.5 – 159.5

77
Similarly, the base model estimates for VD were 46.6 and 18.6 L for the Cardinal Glennon
and Intermountain Primary Children’s data, respectively. Due to the similarity of these
estimates, data from the two centers were combined for a pooled analysis. The base model
estimated CL as 2.70 L/hr and VD as 44.8 L for the pooled analysis.
A covariate analysis was undertaken in which each covariate was added to the
model. Following univariate analyses, weight (P<0.001) and serum creatinine (P<0.05)
were identified as having a significant influence on vancomycin pharmacokinetics.
However, in multivariate analyses accounting for weight, serum creatinine had no
significant influence. The inclusion of allometric scaling significantly improved the OFV
(P<0.001). This model determined that vancomycin clearance increased with increasing
weight.
The final covariate model was chosen as it produced the most significant
minimization of the OFV (Δ 37.9), reduced the BSV, and decreased the RUV. The
parameter estimates derived from the final covariate model are shown in Table 3.2. Also
presented are several metrics used to assess the stability and robustness of the final model
including standard errors, coefficients of variation, 95% confidence intervals, and
bootstrapped estimates (n=1000). The 95% confidence interval surrounding the
bootstrapped point estimate for the BSV in VD includes 0.
Model Evaluation
Diagnostic plots were generated for assessing model fit between observed
vancomycin concentrations versus population predicted and individual predicted values
(Figure 3.1). Plots of the conditional weighted residuals (based on the first-order

78
95%
CI
Ph
arm
aco
kin
etic
para
met
ers
4.9
1-6
.06
35.4
-56.2
Bet
wee
n s
ubje
ct v
ari
abil
ity
(BS
V)
0.0
2-0
.18
0.0
0-0
.37
Res
idu
al
un
expla
ined
vari
ab
ilit
y (R
UV
)
0.0
4-0
.13
0.0
0-2
0.6
Boost
rap
Mea
n
(n=
1000)
5.5
2
44.2
0.0
8
0.1
6
0.0
8
12.2
95%
CI
5.1
1-6
.03
38.5
-49.7
0.0
2-0
.12
0.0
1-0
.31
0.0
5-0
.11
4.8
7-1
9.7
%
CV
--
--
26.9
39.9
0.2
9
351
%
RS
E
4.2
4
6.5
3
35.5
47.5
18.2
30.8
Para
met
er
Est
imate
s
5.5
7
44.1
0.0
7
0.1
6
0.0
8
12.3
Para
met
ers
Cle
aran
ce (
CL
), L
/hr
Volu
me
of
dis
trib
uti
on
(V
D),
L
BS
V (
ω)
– c
lear
ance
(C
L)
BS
V (
ω)
– v
olu
me
of
dis
trib
uti
on (
VD)
RU
V (
σ)
– p
roport
ional
err
or
(%)
RU
V (
σ)
– a
ddit
ive
erro
r (m
g/L
)
Table
3.2
. V
anco
myc
in p
harm
aco
kinet
ic p
ara
met
er e
stim
ate
s and b
oo
tstr
ap e
stim
ate
s fr
om
the
final
one-
com
part
men
t co
vari
ate
model
acr
oss
the
enti
re s
tudy
popula
tion.

79
conditional estimation method) versus the population predicted vancomycin concentrations
were also examined (Figure 3.1). In aggregate, visual inspection revealed that the final
covariate model fit the data more tightly than the initial base model, indicating superior
performance.
Bootstrapping techniques were also used to assess the robustness of the final
covariate model. Mean estimates from the 1000 bootstrap runs were similar to the
population estimates derived from the final covariate model. Bootstraps were successfully
generated 88% of the time for the pooled data from both Cardinal Glennon and
Intermountain Primary Children’s Medical Center. Simulations from the final covariate
model were derived from the observed vancomycin data in an effort to reveal evidence of
model misspecification, which is not easily detected by other methods.[23] Visual
predictive checks (VPC) present a graphical comparison of the observed vancomycin data
and simulated data and are shown in Figure 3.2, with the median simulated value compared
to the 5th, 10th, 90th, and 95th quantiles. Of the 48,600 simulated observations 93% fell
within the 90% confidence interval of the observed vancomycin concentrations,
demonstrating reasonable model stability and agreement.
Discussion
Monitoring of vancomycin concentrations is common to prevent sub-therapeutic
dosing and toxicity.[24] Despite extensive study among other patient populations,[25-27]
vancomycin population pharmacokinetics have not been described for children with CF.
In this study, vancomycin CL and VD were estimated using a one-compartment model with
data derived from children with CF from two centers. Vancomycin CL increased with

80
Figure 3.1. Diagnostic plots of the final model. (A) Observed versus population-predicted
vancomycin concentrations; (B) observed versus individual-predicted vancomycin
concentrations; (C) conditional weighted residuals versus population-predicted
vancomycin concentrations; and (D) conditional weighted residuals versus the time after
dose. (Solid black lines indicate regression lines and dashed black lines represent lines of
identity.)

81
A)
B)

82
Figure 3.1. Continued.
C)
D)

83
Fig
ure
3.2
. V
isual
pre
dic
tive
ch
eck
for
the
final
cova
riate
m
odel
. O
bse
rved
v
anco
myci
n
conce
ntr
atio
ns
are
com
par
ed w
ith t
he
10
th,
50
th,
and 9
0th
per
centi
les
for
100 s
imula
ted d
atas
ets.
Com
par
ison o
f m
edia
n (
soli
d b
lue
line)
and t
he
10
-90
th p
erce
nti
le i
nte
rval
(das
hed
red
lin
es).

84
increasing weight and is an important covariate that merits consideration in establishing
initial dosing regimens for children with acute pulmonary exacerbations of CF.
The pathophysiology of CF affects the pharmacokinetics of many antibacterials
prescribed for the treatment of acute pulmonary exacerbations.[28, 29] To evaluate
whether vancomycin dosage requirements differ between patients with CF and those
without, Pleasants et al. evaluated the pharmacokinetics of vancomycin among 10 adults
with CF.[9] The authors reported pharmacokinetic parameter estimates that were similar
to earlier studies among healthy adult volunteers. In an earlier study that evaluated
vancomycin pharmacokinetics among adults with burn injuries, CL was estimated as 5.3
L/hr/70 kg.[30] This compares favorably with our CL estimate of 5.57 L/hr/70 kg. Among
56 adults with varying levels of renal impairment, the mean VD at steady-state was 0.72
L/kg.[31] The mean VD among our cohort of pediatric patients with CF was 0.63 L/kg.
These findings suggest that vancomycin pharmacokinetics in children are not substantially
different from values that have been reported in adult populations with normal to minor
renal impairment. In contrast, vancomycin CL among children without CF has been
reported to range from 0.10 to 0.16 L/hr/kg.[32-34] It is possible that the relatively young
ages of the children included in these studies (mean ages of 3.9, 5.6, and 7.6 years,
respectively) or the pathophysiologic changes that result from CF may account for the
difference between the CL estimate of 0.08 L/hr/kg reported here among a population of
slightly older children (mean age of 12.1 years). Despite this, the mean VD in the present
population was 0.63 L/kg, which is similar to estimates obtained in several earlier studies
conducted among different populations of children without CF.[32-35] In aggregate, these
data support the notion that vancomycin CL among older children with CF may more

85
closely resemble adult CL estimates, while the VD of vancomycin is similar to values
reported among healthy children.
In the present study, current body weight was an important covariate that influenced
vancomycin clearance among children with CF. Previous studies in both children and
adults without CF have also identified current weight as an important determinant of
vancomycin pharmacokinetics.[36, 37]
Controversy exists as to whether a one-compartment or a two-compartment model
is more appropriate for characterizing vancomycin pharmacokinetics.[38] Albrecht et al.
reported that the half-life of vancomycin ranged from 0.2 to 0.8 hours.[39] This led the
authors to conclude that a one-compartment model using two serum concentrations is
acceptable for pharmacokinetic modeling studies.[39] In evaluating a Bayesian approach,
Pryka et al. assessed the relative predictive utility of one- and two-compartment models
and determined that a two-compartment model was more precise and less biased.[40]
However, Rosell et al. proposed that it is difficult to ethically-justify the number of serum
concentrations needed to rigorously evaluate a two-compartment model.[41] In clinical
practice, post-distributive vancomycin concentrations are frequently obtained, which allow
the use of one-compartment model equations to describe the pharmacokinetics of a two-
compartment drug.[42] This study utilized data that were collected during routine
therapeutic drug monitoring and therefore featured a limited number of vancomycin
concentrations for each patient. With the limited data available, we found that a one-
compartment model tended to under-predict low vancomycin concentrations and over-
predict high concentrations among children with CF. It is likely that more frequent
sampling may have supported the use of a two-compartment model.

86
Interpretation of these findings is subject to several limitations. Data were collected
during routine therapeutic drug monitoring, and a limited number of vancomycin
concentrations were measured for each patient. Additionally, this study was not designed
to correlate vancomycin pharmacokinetics with clinical efficacy, although trough
concentrations of <10 mg/L have been associated with treatment failure, which may be due
to poor tissue penetration and selection of vancomycin-heteroresistant S. aureus.[43] This
emphasizes the importance of achieving appropriate vancomycin serum concentrations for
each patient, which requires individualized dosing and knowledge of important covariates
that influence vancomycin pharmacokinetics.
The pathophysiology of CF has been reported to alter aminoglycoside
pharmacokinetics, making it difficult to establish dosing regimens that optimize
antibacterial efficacy and safety.[44] As the prevalence of MRSA has increased over the
last 30 years, vancomycin use has also increased.[45, 46] Despite this, relatively little is
known about the pharmacokinetics of vancomycin in children with CF. In this study,
vancomycin pharmacokinetics were adequately described with a one-compartment first-
order elimination model. Vancomycin CL was lower than has been reported among studies
of younger children without CF. Clearance was also significantly influenced by current
body weight. The VD was similar among children with CF, healthy children, and
heterogeneous adult populations. Future pharmacodynamic studies are needed to establish
markers of efficacy and safety, which may be used to develop an optimal vancomycin
dosing regimen for the treatment of acute pulmonary exacerbations of CF among children.

87
Acknowledgments
The authors would like to thank Brandon Edwards, Pharm.D., Ashton Hullett,
Pharm.D., Theresa Matoushek, Pharm.D., Ed Weiler, Pharm.D., and Barbara Chatfield,
M.D. for their contributions to this project.
References
1. Red book 29th edition. Report of the Committee on Infectious Diseases. The
American Academy of Pediatrics; 2009.
2. Rybak M, Lomaestro B, Rotschafer JC, Moellering R, Jr., Craig W, Billeter M, et
al. Therapeutic monitoring of vancomycin in adult patients: a consensus review of
the American Society of Health-System Pharmacists, the Infectious Diseases
Society of America, and the Society of Infectious Diseases Pharmacists. American
Journal of Health-System Pharmacy. 2009 Jan 1;66(1):82-98.
3. Thomas S, Cantrill S, Waghorn DJ, McIntyre A. The role of screening and
antibiotic prophylaxis in the prevention of percutaneous gastrostomy site infection
caused by methicillin-resistant Staphylococcus aureus. Alimentary Pharmacology
& Therapeutics. 2007 Mar 1;25(5):593-7.
4. Solis A, Brown D, Hughes J, Van Saene HK, Heaf DP. Methicillin-resistant
Staphylococcus aureus in children with cystic fibrosis: An eradication protocol.
Pediatr Pulmonol. 2003 Sep;36(3):189-95.
5. Miall LS, McGinley NT, Brownlee KG, Conway SP. Methicillin resistant
Staphylococcus aureus (MRSA) infection in cystic fibrosis. Archives of Disease in
Childhood. 2001 Feb;84(2):160-2.
6. Cystic Fibrosis Foundation. Patient Registry 2006 annual report. Bethesda, MD:
Cystic Fibrosis Foundation; 2007.
7. Cystic Fibrosis Foundation. Patient Registry 2008 annual report. Bethesda, MD:
Cystic Fibrosis Foundation; 2009.
8. Dasenbrook EC, Merlo CA, Diener-West M, Lechtzin N, Boyle MP. Persistent
methicillin-resistant Staphylococcus aureus and rate of FEV1 decline in cystic
fibrosis. American Journal of Respiratory and Critical Care Medicine. 2008 Oct
15;178(8):814-21.
9. Pleasants RA, Michalets EL, Williams DM, Samuelson WM, Rehm JR, Knowles
MR. Pharmacokinetics of vancomycin in adult cystic fibrosis patients.
Antimicrobial Agents and Chemotherapy. 1996 Jan;40(1):186-90.

88
10. Boyle M, Ross T, Goldberg, JD, Podliska MZ, Cai M, Mogayzel PJ, et al.
Molecular epidemiology of MRSA infection in cystic fibrosis and its clinical
implications. Pediatric Pulmonology. 2005;Suppl 28(288):Abstract 286.
11. Elizur A, Orscheln RC, Ferkol TW, Atkinson JJ, Dunne WM, Jr., Buller RS, et al.
Panton-Valentine Leukocidin-positive methicillin-resistant Staphylococcus aureus
lung infection in patients with cystic fibrosis. Chest. 2007 Jun;131(6):1718-25.
12. Ren CL, Morgan WJ, Konstan MW, Schechter MS, Wagener JS, Fisher KA, et al.
Presence of methicillin resistant Staphylococcus aureus in respiratory cultures from
cystic fibrosis patients is associated with lower lung function. Pediatr Pulmonol.
2007 Jun;42(6):513-8.
13. Sawicki GS, Rasouliyan L, Pasta DJ, Regelmann WE, Wagener JS, Waltz DA, et
al. The impact of incident methicillin resistant Staphylococcus aureus detection on
pulmonary function in cystic fibrosis. Pediatr Pulmonol. 2008 Nov;43(11):1117-
23.
14. Dasenbrook EC, Checkley W, Merlo CA, Konstan MW, Lechtzin N, Boyle MP.
Association between respiratory tract methicillin-resistant Staphylococcus aureus
and survival in cystic fibrosis. JAMA. 2010 Jun 16;303(23):2386-92.
15. Gibson RL, Burns JL, Ramsey BW. Pathophysiology and management of
pulmonary infections in cystic fibrosis. American Journal of Respiratory and
Critical Care Medicine. 2003 Oct 15;168(8):918-51.
16. Adamczyk M, Brate, E.M., Chiapetta, E.G., Ginsburg, S., Hoffman, E., Klein, C.,
Perkowitz, M.M., Rege, S.D., Chou, P.P., Costantino, A.G. Development of a
quantitative vancomycin immunoassay for the Abbott AxSYM analyzer.
Therapeutic Drug Monitoring. 1997;19(5):571.
17. Ludden TM, Beal SL, Sheiner LB. Comparison of the Akaike Information
Criterion, the Schwarz criterion and the F test as guides to model selection. Journal
of Pharmacokinetics and Biopharmaceutics. 1994 Oct;22(5):431-45.
18. Karlsson KE, Grahnen A, Karlsson MO, Jonsson EN. Randomized exposure-
controlled trials; impact of randomization and analysis strategies. British Journal of
Clinical Pharmacology. 2007 Sep;64(3):266-77.
19. Ette EI, Ludden TM. Population pharmacokinetic modeling: the importance of
informative graphics. Pharmaceutical Research. 1995 Dec;12(12):1845-55.
20. Ette EI, Williams PJ. Population pharmacokinetics I: background, concepts, and
models. The Annals of Pharmacotherapy. 2004 Oct;38(10):1702-6.
21. Boxenbaum H. Interspecies scaling, allometry, physiological time, and the ground
plan of pharmacokinetics. Journal of Pharmacokinetics and Biopharmaceutics.
1982 Apr;10(2):201-27.

89
22. Ette EI. Stability and performance of a population pharmacokinetic model. Journal
of Clinical Pharmacology. 1997 Jun;37(6):486-95.
23. Karlsson MO, Savic RM. Diagnosing model diagnostics. Clinical Pharmacology
and Therapeutics. 2007 Jul;82(1):17-20.
24. Liu C, Bayer A, Cosgrove SE, Daum RS, Fridkin SK, Gorwitz RJ, et al. Clinical
practice guidelines by the infectious diseases society of america for the treatment
of methicillin-resistant Staphylococcus aureus infections in adults and children.
Clinical Infectious Diseases. 2011 Feb 1;52(3):e18-55.
25. Blouin RA, Bauer LA, Miller DD, Record KE, Griffen WO, Jr. Vancomycin
pharmacokinetics in normal and morbidly obese subjects. Antimicrobial Agents
and Chemotherapy. 1982 Apr;21(4):575-80.
26. Rodvold KA, Blum RA, Fischer JH, Zokufa HZ, Rotschafer JC, Crossley KB, et
al. Vancomycin pharmacokinetics in patients with various degrees of renal
function. Antimicrobial Agents and Chemotherapy. 1988 Jun;32(6):848-52.
27. Rybak MJ, Albrecht LM, Berman JR, Warbasse LH, Svensson CK. Vancomycin
pharmacokinetics in burn patients and intravenous drug abusers. Antimicrobial
Agents and Chemotherapy. 1990 May;34(5):792-5.
28. Zobell JT, Young DC, Waters CD, Stockmann C, Ampofo K, Sherwin CM, et al.
Optimization of anti-pseudomonal antibiotics for cystic fibrosis pulmonary
exacerbations: I. aztreonam and carbapenems. Pediatr Pulmonol. 2012 Aug 21.
29. Zobell JT, Waters CD, Young DC, Stockmann C, Ampofo K, Sherwin CM, et al.
Optimization of anti-pseudomonal antibiotics for cystic fibrosis pulmonary
exacerbations: II. cephalosporins and penicillins. Pediatr Pulmonol. 2012 Sep 4.
30. Rotschafer JC, Crossley K, Zaske DE, Mead K, Sawchuk RJ, Solem LD.
Pharmacokinetics of vancomycin: observations in 28 patients and dosage
recommendations. Antimicrobial Agents and Chemotherapy. 1982 Sep;22(3):391-
4.
31. Matzke GR, McGory RW, Halstenson CE, Keane WF. Pharmacokinetics of
vancomycin in patients with various degrees of renal function. Antimicrobial
Agents and Chemotherapy. 1984 Apr;25(4):433-7.
32. Naqvi SH, Keenan WJ, Reichley RM, Fortune KP. Vancomycin pharmacokinetics
in small, seriously ill infants. Am J Dis Child. 1986 Feb;140(2):107-10.
33. Chang D. Influence of malignancy on the pharmacokinetics of vancomycin in
infants and children. The Pediatric Infectious Disease Journal. 1995
Aug;14(8):667-73.
90
34. Lamarre P, Lebel D, Ducharme MP. A population pharmacokinetic model for
vancomycin in pediatric patients and its predictive value in a naive population.
Antimicrobial Agents and Chemotherapy. 2000 Feb;44(2):278-82.
35. Wrishko RE, Levine M, Khoo D, Abbott P, Hamilton D. Vancomycin
pharmacokinetics and Bayesian estimation in pediatric patients. Therapeutic Drug
Monitoring. 2000 Oct;22(5):522-31.
36. Eiland LS, English TM, Eiland EH, 3rd. Assessment of vancomycin dosing and
subsequent serum concentrations in pediatric patients. The Annals of
Pharmacotherapy. 2011 May;45(5):582-9.
37. Vance-Bryan K, Guay DR, Gilliland SS, Rodvold KA, Rotschafer JC. Effect of
obesity on vancomycin pharmacokinetic parameters as determined by using a
Bayesian forecasting technique. Antimicrobial Agents and Chemotherapy. 1993
Mar;37(3):436-40.
38. Leader WG, Chandler MH, Castiglia M. Pharmacokinetic optimisation of
vancomycin therapy. Clinical Pharmacokinetics. 1995 Apr;28(4):327-42.
39. Albrecht LM, Rybak MJ, Boike SC, Pancorbo S. Comparison of serum sampling
methods for determining vancomycin dosage regimens. Therapeutic Drug
Monitoring. 1988;10(1):85-90.
40. Pryka RD, Rodvold KA, Garrison M, Rotschafer JC. Individualizing vancomycin
dosage regimens: one- versus two-compartment Bayesian models. Therapeutic
Drug Monitoring. 1989;11(4):450-4.
41. Pou L, Rosell M, Lopez R, Pascual C. Changes in vancomycin pharmacokinetics
during treatment. Therapeutic Drug Monitoring. 1996 Apr;18(2):149-53.
42. DeRyke C, Alexander, DP. Optimizing vancomycin dosing through
pharmacodynamic assessment targeting area under the concentration-time
curve/minimum inhibitory concentration. Hospital Pharmacy. 2009;44(9):751-65.
43. Charles PG, Ward PB, Johnson PD, Howden BP, Grayson ML. Clinical features
associated with bacteremia due to heterogeneous vancomycin-intermediate
Staphylococcus aureus. Clinical Infectious Diseases. 2004 Feb 1;38(3):448-51.
44. Kearns GL, Hilman BC, Wilson JT. Dosing implications of altered gentamicin
disposition in patients with cystic fibrosis. The Journal of Pediatrics. 1982
Feb;100(2):312-8.
45. Boxerbaum B, Jacobs MR, Cechner RL. Prevalence and significance of methicillin-
resistant Staphylococcus aureus in patients with cystic fibrosis. Pediatr Pulmonol.
1988;4(3):159-63.

91
46. Kirst HA, Thompson DG, Nicas TI. Historical yearly usage of vancomycin.
Antimicrobial Agents and Chemotherapy. 1998 May;42(5):1303-4.
Reprinted with permission from Stockmann C, Hersh AL, Roberts JK,
Bhongsatiern J, Korgenski EK, Spigarelli MG, et al. Predictive Performance of a
Vancomycin Population Pharmacokinetic Model in Neonates. Infectious Diseases and
Therapy. 2015 Jun;4(2):187-98. Copyright 2015 Springer.
CHAPTER 4
PREDICTIVE PERFORMANCE OF A VANCOMYCIN
POPULATION PHARMACOKINETIC
MODEL IN NEONATES
Abstract
Introduction: The pharmacokinetics of vancomycin are highly variable among
neonates, which makes dosing challenging in this population. However, adequate drug
exposure is critical, especially when treating methicillin-resistant Staphylococcus aureus
(MRSA) infections. Utilization of population pharmacokinetic models and Bayesian
methods offers the potential for developing individualized therapeutic approaches. To meet
this need, a neonatal vancomycin population pharmacokinetic model was recently
published. The current study sought to externally evaluate the predictive performance and
generalizability of this model.
Methods: A retrospective chart review of neonates who received vancomycin and
had ≥1 peak and ≥1 trough concentrations at five Intermountain Healthcare neonatal
intensive care units from 2006-2013 was performed and served as the external validation

93
cohort. The published population pharmacokinetic model was implemented in NONMEM
7.2 with the structural and variance parameter values set equal to the estimates reported
previously. The model was then used to predict the first peak and trough concentration for
each neonate in the validation cohort and the model prediction error and absolute prediction
error were calculated. Normalized prediction distribution errors (NPDE) were also
evaluated.
Results: A total of 243 neonates were studied with a median postmenstrual age of
33 (interquartile range [IQR]: 28-39) weeks and a median weight of 1.6 (IQR: 1.0-2.9)
kg. The model predicted the observed vancomycin concentrations with reasonable
precision. For all vancomycin concentrations, the median prediction error was -0.8 (95%
CI: -1.4 to -0.4) mg/L and the median absolute prediction error was 3.0 (95% CI: 2.7 to
3.5) mg/L. No trends in NPDE across weight, postmenstrual age, serum creatinine or time
after dose were observed.
Conclusions: An evaluation of a recently published neonatal vancomycin
population pharmacokinetic model in a large external dataset supported the predictive
performance and generalizability of the model. This model may be useful in evaluating
neonatal vancomycin dosing regimens and estimating the extent of drug exposure.
Introduction
Optimizing vancomycin dosing to rapidly achieve adequate drug exposure is
imperative in treating neonatal sepsis, particularly when treating invasive methicillin-
resistant Staphylococcus aureus (MRSA) infections.[1] However, this has been
challenging in neonates as the pharmacokinetics of vancomycin are highly variable among

94
neonates due to developmental and pathophysiological changes.[2, 3] Recent studies have
shown that standard neonatal vancomycin dosing strategies, such as those outlined in
NeoFax®, do not reliably achieve trough concentrations >10 mg/L.[4, 5] In addition, the
ratio of the 24-hour area under the concentration-time curve (AUC24) to the minimum
inhibitory concentration (MIC) – the best predictor of successful outcomes when treating
invasive MRSA infections – is not routinely utilized to assess the appropriateness of
vancomycin dosing in neonates, presumably due to practical limitations associated with
calculating the AUC24.
Innovative vancomycin dosing strategies are therefore needed in neonates that 1)
incorporate known patient-specific determinants of vancomycin pharmacokinetics such as
size, maturation, and renal function in the dose selection and 2) allow for assessment of
AUC24 based on the dosing history and vancomycin concentration(s) measured as part of
routine therapeutic drug monitoring.[3, 6, 7] To develop such an individualized therapeutic
approach in neonates, utilization of population pharmacokinetic models and Bayesian
methods will be essential.[8-11] We recently developed a neonatal vancomycin population
pharmacokinetic model that capitalized on patient data readily available in the electronic
medical record: weight (an indicator of size), postmenstrual age (an indicator of
maturation), and serum creatinine (an indicator of renal function).[7] The model has the
potential to improve our ability to define vancomycin dosing regimens that reliably achieve
recommended exposure targets; however, it is critical to first evaluate whether this model
and its findings are generalizable to neonates outside of the original population used to
develop the model. The objective of the current study was to conduct an external evaluation

95
of this published pharmacokinetic model and to enhance our understanding of the
relationship between vancomycin trough concentration and AUC24 in neonates.
Methods
Validation Cohort
Approval to conduct this study was granted by the University of Utah and Primary
Children’s Hospital (PCH) Institutional Review Boards. PCH is a freestanding children’s
hospital with a level IV neonatal intensive care unit that is staffed by University of Utah
neonatologists. PCH is owned and operated by Intermountain Healthcare, which is a large,
not-for-profit, vertically-integrated healthcare delivery system that serves Utah, Idaho,
Wyoming, Nevada, and Montana. In addition to PCH, four other level II-III neonatal
intensive care units operated by Intermountain Healthcare were included in this study.
A retrospective chart review was conducted for all neonates who had vancomycin
therapeutic drug monitoring performed from 2006-2013 at five Intermountain Healthcare
neonatal intensive care units. Neonates were included if they were <54 weeks
postmenstrual age and had ≥2 doses of vancomycin, ≥1 peak concentration, ≥1 trough
concentration, and ≥1 serum creatinine level. Vancomycin concentrations were quantified
using a particle-enhanced turbidimetric inhibition immunoassay on an Abbott Architect
cSystem platform (Abbott Laboratories, Abbott Park, Illinois). Vancomycin concentrations
were defined based on their temporal relationship to dosing records. Trough concentrations
were defined as concentrations obtained within three hours of the next vancomycin dose
and peak concentrations were defined as concentrations obtained within three hours of the
preceding dose. Serum creatinine levels collected within ±48 hours of vancomycin dosing

96
and concentration records were carried forward and backward and were used in the
analyses. To account for the known difference in measured serum creatinine concentrations
between the Jaffe method (used in the original model derivation cohort) and the enzymatic
method (used in the current external validation cohort), a previously described linear
conversion factor was applied to all of the enzymatic serum creatinine concentrations
included in this external validation (𝑒𝑛𝑧𝑦𝑚𝑎𝑡𝑖𝑐 𝑐𝑜𝑛𝑐𝑒𝑛𝑡𝑟𝑎𝑡𝑖𝑜𝑛 = 1.050 ∗
𝐽𝑎𝑓𝑓𝑒 𝑚𝑒𝑡ℎ𝑜𝑑 𝑐𝑜𝑛𝑐𝑒𝑛𝑡𝑟𝑎𝑡𝑖𝑜𝑛 − 0.122).[12] Exclusion criteria included a diagnosis of
congenital kidney disease, major congenital heart disease (other than ventricular septal
defect, atrial septal defect, or patent ductus arteriosus), or extracorporeal membrane
oxygenation (ECMO) during the vancomycin course.
Model Evaluation
The published neonatal vancomycin population pharmacokinetic model was
implemented in the non-linear mixed effects modeling software NONMEM 7.2 (ICON
Development Solutions, Ellicott City, MD) as previously described.[7] Briefly, a one
compartment model with first-order elimination was used to describe vancomycin
pharmacokinetics. Clearance (CL) was predicted by weight (an indicator of size),
postmenstrual age (PMA; an indicator of maturation) and serum creatinine (Cr; an indicator
of renal function) according to the following equation:
𝐶𝐿 (𝐿/ℎ) = 0.345 ∙ (𝑊𝑒𝑖𝑔ℎ𝑡
2.9 𝑘𝑔)0.75 ∙
1
1 + (𝑃𝑀𝐴𝑤𝑒𝑒𝑘𝑠
34.8 )−4.53 ∙ (
1
𝐶𝑟𝑚𝑔/𝑑𝐿)0.267 (4.1)
Volume of distribution (V) was predicted by weight:

97
𝑉 (𝐿) = 1.75 ∙ (𝑊𝑒𝑖𝑔ℎ𝑡
2.9 𝑘𝑔) (4.2)
After accounting for known predictors, the remaining variation between neonates
was described by an exponential error model for both CL (% coefficient of variation [%
CV] 21.6%) and V (% CV 10.9%). Residual variability (a measure of the difference
between the model predicted concentration for a neonate and the observed concentration
in that neonate) was captured using a combined proportional (% CV 20.5%) and additive
error model (standard deviation [SD] ± 1.3 mg/L).
For each neonate in the external validation cohort, vancomycin concentrations were
then predicted by using the parameters of the population pharmacokinetic model and
simulating the actual dosing regimen given to the neonate (using the NONMEM
MAXEVAL=0 POSTHOC command). Only concentrations at times for which a neonate
had therapeutic drug monitoring performed were simulated. Model-predicted vancomycin
concentrations (PRED from the NONMEM output) were then compared with the
corresponding observed vancomycin concentrations. As described by Sheiner and
Beal,[13] the bias and precision of the model were assessed by calculating the median
prediction error and median absolute prediction error for the first trough and peak
concentration according to the following formulas:
Prediction error (bias): (𝐶𝑜𝑛𝑐𝑝𝑟𝑒𝑑−𝐶𝑜𝑛𝑐𝑜𝑏𝑠
𝐶𝑜𝑛𝑐𝑜𝑏𝑠) (4.3)
Absolute prediction error (precision): (|𝐶𝑜𝑛𝑐𝑝𝑟𝑒𝑑−𝐶𝑜𝑛𝑐𝑜𝑏𝑠|
𝐶𝑜𝑛𝑐𝑜𝑏𝑠) (4.4)
where Concpred refers to the model-predicted vancomycin concentration and Concobs refers
to the observed vancomycin concentration. Model predicted vancomycin concentrations
calculated using each patient’s individual Bayesian estimate of CL and V (i.e. the IPRED

98
from the NONMEM output which incorporates the patient’s drug concentrations in
addition to the fixed covariate effects in the model predictions) were also evaluated using
the same approach.
The predictive performance of the model was further evaluated using simulation-
based diagnostic methods. Normalized prediction distribution errors (NPDE) were
calculated by simulating 1000 datasets and comparing the predicted concentrations to the
observed concentrations using the NPDE command in NONMEM.[14, 15] The NPDE
should follow a normal distribution with a theoretical mean of 0 and variance equal to
1.[14]
Trough Concentration and AUC24 Relationship
Following model evaluation, the relationship between trough concentration and
AUC24 was examined. Bayesian estimates of CL for each neonate from the population
pharmacokinetic model were used to calculate AUC24 at the time that vancomycin trough
concentrations were collected.[8] AUC24 was calculated as the daily dose ÷ CL. For a given
trough concentration, the proportion of neonates with that trough concentration who
achieved an AUC24 ≥400 was calculated. An AUC24 ≥400 mg*hr/L would predict an
AUC24/MIC ≥400 for an MIC of ≤1 mg/L. AUC24 calculations, descriptive statistics, and
graphical analyses were performed in R 3.1.1 (R Foundation for Statistical Computing,
Vienna, Austria).

99
Results
External Validation Cohort
Overall, 243 neonates had vancomycin dose and concentration data available and
served as the external validation cohort. The median dose was 15.5 mg/kg (interquartile
range [IQR]: 13.9-19.3) and the median dosing interval was 11.5 hrs (IQR: 8.0-12.5 hrs).
Demographic and clinical characteristics of the neonates in the external validation cohort
are shown in Table 4.1. For comparison, demographic and clinical characteristics of the
neonates in the cohort used to develop the original published pharmacokinetic model are
also shown. Overall, the validation cohort was of lower weight and age and had higher
serum creatinine concentrations.
In the external validation cohort, a total of 734 vancomycin concentrations were
available for analysis. Each neonate contributed a mean of 3.0 (± 1.8) vancomycin
concentrations. The time of vancomycin concentration collection relative to the previous
dose is shown in Table 4.2. All neonates had at least one concentration measured within
three hours of the end of the vancomycin infusion. No concentrations were below the lower
limit of quantitation.
Model Evaluation
The vancomycin pharmacokinetic model adequately described the observed
vancomycin concentrations in the external cohort of neonates (Figure 4.1A). Model
predicted vancomycin concentrations (PRED) were slightly lower than the observed
concentrations (median prediction error -0.8 [95% CI: -1.4 to -0.4] mg/L). The precision
of the model was reasonable with a median absolute prediction error of 3.1 (95% CI: 2.7

100
Table 4.1. Demographic and clinical characteristics of neonates who received vancomycin
and had therapeutic drug monitoring performed.
Characteristic
Model Development Cohort
(n=249) a External Validation Cohort
(n=243) b
Median / No. Range Median / No. Range
Female, n (%) 121 (49%) -- 103 (42%) --
Gestational
age, weeks 34 23 – 42 30 22 – 41
Birthweight,
kg 2.0 0.4 – 4.4 1.3 0.5 – 5.1
Weight, kg 2.9 0.5 – 6.3 1.6 0.4 – 6.8
Postnatal age,
days 19 0 – 173 12 0 – 196
Postmenstrual
age, weeks 39 24 – 53 33 23 – 54
APGAR at 5
minutes 8 1 – 10 8 1 – 10
Serum
creatinine,
mg/dL d
0.4 0.1 – 2.7 0.6 0.3 – 1.5
a Patient characteristics of the 249 neonates used to develop the neonatal vancomycin
population pharmacokinetic model described by Frymoyer et al.[7] b Patient characteristics of the 243 neonates used in the current external validation. c The serum creatinine concentration in the model derivation cohort was measured
using the Jaffe method. The serum creatinine concentration in the external validation
cohort was measured using the enzymatic method and was converted to a Jaffe-
standardized equivalent using a linear equation described by Srivastava et al.[12]
Converted values are presented in the table above.
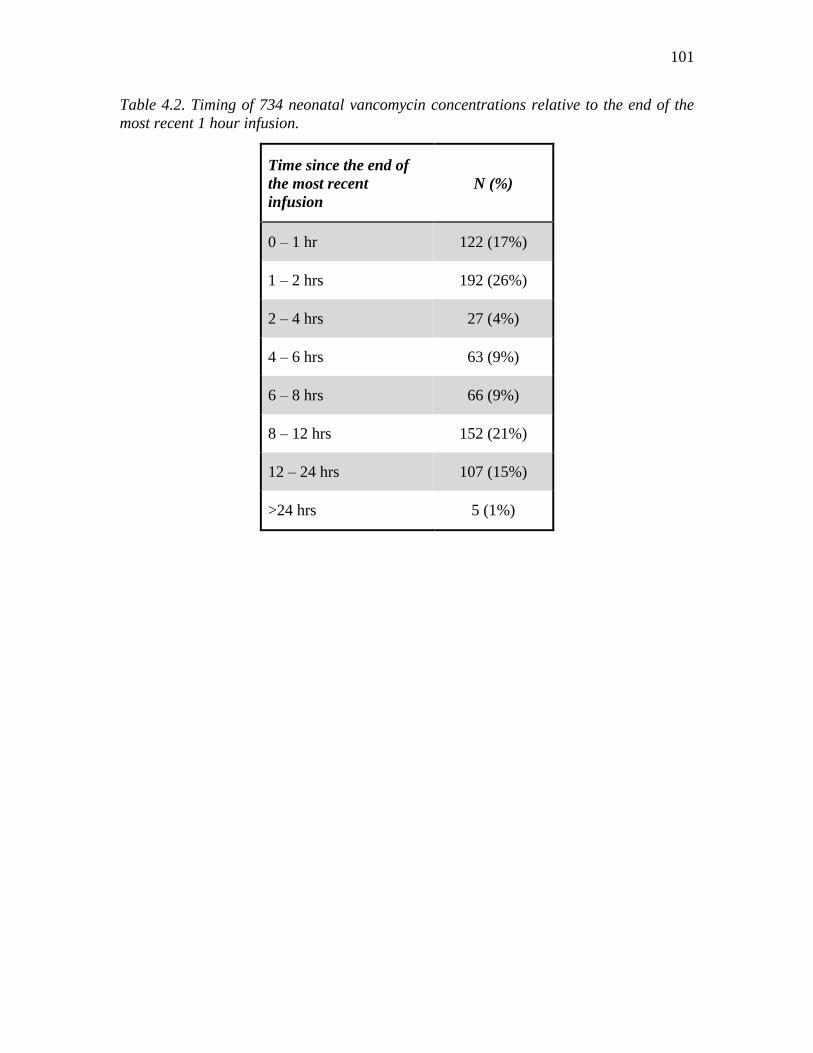
101
Table 4.2. Timing of 734 neonatal vancomycin concentrations relative to the end of the
most recent 1 hour infusion.
Time since the end of
the most recent
infusion
N (%)
0 – 1 hr 122 (17%)
1 – 2 hrs 192 (26%)
2 – 4 hrs 27 (4%)
4 – 6 hrs 63 (9%)
6 – 8 hrs 66 (9%)
8 – 12 hrs 152 (21%)
12 – 24 hrs 107 (15%)
>24 hrs 5 (1%)

102
Figure 4.1. An external evaluation of the predictive performance of a previously published
neonatal vancomycin population pharmacokinetic model. (A) Diagnostic plot depicting the
model fit for observed versus population-predicted vancomycin concentrations. The
dashed black line represents the locally weighted scatterplot smoothed fit of the data. (B)
Kernel density plot of the normalized prediction distribution errors with a histogram
depicting a normal, Gaussian distribution overlaid for comparative purposes.

103
to 3.2 mg/L). The predictive performance of the model for peak and trough concentrations
is featured in Table 4.3. When incorporating patient concentrations to obtain Bayesian
estimates of PK parameters for each neonate, the precision of the model predicted
vancomycin concentrations (IPRED) improved (Table 4.4). For example, the median
absolute prediction error of IPRED was 1.7 (95% CI: 1.5 to 1.8) mg/L.
Simulation based diagnostics of the vancomycin pharmacokinetic model
demonstrated a mean NPDE of 0.05 and a variance of 0.96, indicating no bias and an ability
of the model to reasonably capture the underlying variability in the external validation
cohort. Additionally, there were no trends in NPDE across weight, postmenstrual age,
serum creatinine, or time after dose (Figure 4.2).
Trough Concentration and AUC24 Relationship
A linear relationship between increased AUC24 and higher trough concentrations
was observed in the external validation cohort (r2 = 0.60; Figure 4.3A). AUC24 was highly
variable at a given trough concentration (i.e., a 2 to 3 fold range of AUC24 was achieved at
a given trough concentration), and therefore, AUC24 could not be precisely predicted for
an individual neonate based on a trough concentration alone. However, a trough
concentration of 11 mg/L predicted the achievement of an AUC24 ≥400 in 93% of neonates
(Figure 4.3B). The median (range) AUC24 at this trough concentration was 542 (308 to
649) mg*hr/L.

104
Table 4.3. Predictive performance of the neonatal population pharmacokinetic model in
the external validation cohort.
All
concentrations First peak First trough
Prediction error
Median -0.8 -2.0 -0.1
95% confidence interval -1.4 to -0.4 -2.9 to -1.4 -0.5 to 0.2
Percent prediction error
Median -4.5% -7.5% -1.5%
95% confidence interval -7.2% to -2.2% -9.4% to -4.9% -4.5% to 2.7%
Absolute prediction error
Median 3.0 3.9 2.1
95% confidence interval 2.7 to 3.5 3.4 to 4.1 1.7 to 2.7
Absolute percent prediction error
Median 15.2% 12.6% 20.1%
95% confidence interval 14.1% to 17.3% 10.9% to 14.4% 16.8% to 24.0%

105
Table 4.4. Predictive performance of the neonatal population pharmacokinetic model in
the external validation cohort after incorporating patient drug concentrations in
predictions (e.g., IPRED method).
All
concentrations First peak First trough
Prediction error
Median -0.7 -1.7 -0.2
95% confidence interval -0.9 to -0.5 -2.2 to -1.4 -0.4 to 0.1
Percent prediction error
Median -3.8% -5.8% -1.7%
95% confidence interval -4.9% to -3.2% -7.5% to -4.6% -3.4% to 0.6%
Absolute prediction error
Median 1.7 2.7 0.9
95% confidence interval 1.5 to 1.8 2.1 to 3.1 0.7 to 1.1
Absolute percent prediction error
Median 8.8% 8.4% 9.1%
95% confidence interval 8.1% to 9.7% 7.3% to 9.6% 7.3% to 10.8%

106
Figure 4.2. Assessment of the predictive performance of the neonatal vancomycin
population pharmacokinetic model. (A) Normalized prediction distribution errors versus
weight, measured in kilograms. (B) Normalized prediction distribution errors versus the
time elapsed since the last vancomycin dose, measured in hours. (C) Normalized prediction
distribution errors versus postmenstrual age, measured in weeks. (D) Normalized
prediction distribution errors versus serum creatinine concentrations, measured in
milligrams per deciliter. The dashed black lines represent locally weighted scatterplot
smoother fits of the data.

107
Figure 4.3. The association between vancomycin trough concentrations and the extent of
drug exposure, as measured by the 24-hour area under the curve (AUC24). (A) Higher
vancomycin trough concentrations were associated with higher AUC24 values, although
substantial variability was noted. (B) The probability of achieving a pharmacokinetic /
pharmacodynamic target associated with clinical and microbiological success for invasive
methicillin-resistant Staphylococcus aureus infections (an AUC24 ≥400) increased with
higher vancomycin trough concentrations. All neonates with a trough ≥12 mg/L had an
AUC24 ≥400, although many neonates achieved the AUC24 target with lower trough
concentrations.

108
Discussion
External validation of a population pharmacokinetic model is described by the
United States Food and Drug Administration (FDA) as “the most stringent method for
testing a developed model”.[16] Yet, external validation is performed in <10% of published
pharmacokinetic models and concerns about the clinical utility of the model often
remain.[17] The external validation performed in the current study strengthens a previously
published neonatal vancomycin population pharmacokinetic model. Namely, we found the
pharmacokinetic model to be unbiased across the largest cohort of neonates used in a
validation study to date. The precision of the model when utilizing only a neonate’s
postmenstrual age, weight, and serum creatinine was 12.6% for peak concentrations and
20.1% for trough concentrations. When a neonate’s drug concentrations are incorporated
into the model (such as would occur after therapeutic drug monitoring in the NICU), the
precision further improved to 8.4% and 9.1% for peak and trough concentrations,
respectively. This level of precision suggests that the model may be useful in evaluating
vancomycin dosing regimens and estimating the extent of drug exposure in the clinical
setting.
A recent clinical study by Ringenberg et al. highlights the current challenges with
vancomycin dosing in neonates. In a multicenter retrospective evaluation, vancomycin
dosing guidelines from Neofax resulted in only 25% of the neonates studied achieving a
target trough concentration of 10-20 mg/L with empiric dosing.[4] Moreover, the authors
reported that 20% of the neonates included in their study had a trough concentration <5
mg/L (Theresa Ringenberg personal communication, April 15, 2015). Even after
therapeutic drug monitoring and dose-adjustment, only 45% of neonates achieved the goal

109
trough concentration of 10-20 mg/L at any point during their course of therapy. This study
clearly reveals the significant clinical challenge associated with reliably achieving
therapeutic and safe vancomycin concentrations in this highly variable patient
population.[4] More innovative vancomycin dosing strategies and approaches are needed
in neonates that can help providers personalize empiric dose selection, interpret therapeutic
drug monitoring data, and adjust dosing so that exposure targets are achieved.
Population pharmacokinetic models are a powerful tool that can aid clinicians and
help inform dosing decisions.[18, 19] By incorporating patient-specific characteristics,
dosing information, drug concentrations, and consideration of the variability between
patients, population pharmacokinetic models offer the opportunity to provide a more
personalized approach to therapeutic decision making. This is especially valuable in a
highly variable population, such as neonates, receiving a narrow therapeutic window drug
such as vancomycin.
In adults, Bayesian approaches utilizing population pharmacokinetic models have
already been shown to have the potential to help support vancomycin dosing decisions.[19,
20] Advancement of similar approaches in neonates is needed. The development and
external validation of a neonatal vancomycin population pharmacokinetic model lays the
foundation for this future work. For example, our group is currently developing a model-
based approach to individualize the empiric dose in neonates that incorporates the
predictors of weight, postmenstrual age, and serum creatinine. Using a simulation
framework, the vancomycin dose for a given neonate that is most likely to achieve an
AUC24 >400 while still maintaining a trough concentration <20 mg/L is calculated. A user-
friendly, web-based application is currently being developed to facilitate the adoption of

110
this model in our neonatal intensive care units, including integration into the electronic
health record. In addition, the ability to estimate AUC24 and assist providers with dose
adjustment within the clinical workflow would be of high value.
Until more robust clinical dosing support tools are developed, clinicians will
continue to rely on trough concentration monitoring to help guide vancomycin dosing in
neonates. Our findings reinforce the large variability observed in vancomycin trough
concentrations among neonates and the inability of a trough concentration alone to reliably
predict an individual neonate’s AUC24. Targeting an AUC24/MIC ≥400 is recommended
by the Infectious Disease Society of America when treating invasive MRSA infections,
and a trough concentration of 15-20 mg/L is suggested in adults to achieve this target.[1,
21] The current study provides further support that in neonates a vancomycin trough
concentration of 15-20 mg/L is unnecessary to achieve an AUC24/MIC ≥400 with an MIC
≤1 mg/L and that lower trough concentrations are likely adequate based on AUC24
considerations.[7] Accordingly, a trough concentration of approximately 10 mg/L is likely
a reasonable first-line target that will provide adequate exposure for invasive MRSA while
also appropriately covering for coagulase negative staphylococcal infections. Further dose
adjustment and individualization of the therapeutic approach should be guided by the
specific pathogen identified, susceptibility testing, clinical status, etc. For example, for
MRSA infections with MICs ≥2 mg/L, an alternative to vancomycin may be necessary
since an AUC24/MIC ≥400 will not be achieved in neonates even at trough concentrations
of 15-20 mg/L.[7] Lastly, the extent to which the target AUC24/MIC ≥400 is generalizable
to neonates is unclear and requires further study.
111
Conclusions
In summary, an evaluation of a recently published neonatal vancomycin population
pharmacokinetic model in a large external dataset supported the predictive performance
and generalizability of the model. The model may be useful in evaluating vancomycin
dosing regimens and estimating the extent of drug exposure in neonates.

112
References
1. Liu C, Bayer A, Cosgrove SE, Daum RS, Fridkin SK, Gorwitz RJ, et al. Clinical
practice guidelines by the infectious diseases society of america for the treatment
of methicillin-resistant Staphylococcus aureus infections in adults and children.
Clinical Infectious Diseases. 2011 Feb 1;52(3):e18-55.
2. Kearns GL, Abdel-Rahman SM, Alander SW, Blowey DL, Leeder JS, Kauffman
RE. Developmental pharmacology--drug disposition, action, and therapy in
infants and children. The New England Journal of Medicine. 2003 Sep
18;349(12):1157-67.
3. Stockmann C, Roberts JK, Yu T, Constance JE, Knibbe CA, Spigarelli MG, et al.
Vancomycin pharmacokinetic models: informing the clinical management of
drug-resistant bacterial infections. Expert Review of Anti-infective Therapy. 2014
Nov;12(11):1371-88.
4. Ringenberg T, Robinson C, Meyers R, Degnan L, Shah P, Siu A, et al.
Achievement of Therapeutic Vancomycin Trough Serum Concentrations with
Empiric Dosing in Neonatal Intensive Care Unit Patients. The Pediatric Infectious
Disease Journal. 2015 Jan 27.
5. Vandendriessche A, Allegaert K, Cossey V, Naulaers G, Saegeman V, Smits A.
Prospective validation of neonatal vancomycin dosing regimens is urgently
needed. Current Therapeutic Research, Clinical and Experimental. 2014
Dec;76:51-7.
6. Jacqz-Aigrain E, Zhao W, Sharland M, van den Anker JN. Use of antibacterial
agents in the neonate: 50 years of experience with vancomycin administration.
Seminars in Fetal & Neonatal mMedicine. 2013 Feb;18(1):28-34.
7. Frymoyer A, Hersh AL, El-Komy MH, Gaskari S, Su F, Drover DR, et al.
Association Between Vancomycin Trough Concentration and AUC in Neonates.
Antimicrobial Agents and Chemotherapy. 2014 Aug 18.
8. Sheiner LB, Beal S, Rosenberg B, Marathe VV. Forecasting individual
pharmacokinetics. Clinical Pharmacology and Therapeutics. 1979 Sep;26(3):294-
305.
9. Sheiner LB, Rosenberg B, Melmon KL. Modelling of individual
pharmacokinetics for computer-aided drug dosage. Computers and Biomedical
Research, an International Journal. 1972 Oct;5(5):411-59.
10. Sheiner LB, Beal SL. Bayesian individualization of pharmacokinetics: simple
implementation and comparison with non-Bayesian methods. Journal of
Pharmaceutical Sciences. 1982 Dec;71(12):1344-8.

113
11. Schumacher GE, Barr JT. Bayesian approaches in pharmacokinetic decision
making. Clinical Pharmacy. 1984 Sep-Oct;3(5):525-30.
12. Srivastava T, Alon US, Althahabi R, Garg U. Impact of standardization of
creatinine methodology on the assessment of glomerular filtration rate in children.
Pediatric Research. 2009 Jan;65(1):113-6.
13. Sheiner LB, Beal SL. Some suggestions for measuring predictive performance.
Journal of Pharmacokinetics and Biopharmaceutics. 1981 Aug;9(4):503-12.
14. Brendel K, Comets E, Laffont C, Laveille C, Mentre F. Metrics for external
model evaluation with an application to the population pharmacokinetics of
gliclazide. Pharmaceutical Research. 2006 Sep;23(9):2036-49.
15. Brendel K, Comets E, Laffont C, Mentre F. Evaluation of different tests based on
observations for external model evaluation of population analyses. Journal of
Pharmacokinetics and Pharmacodynamics. 2010 Feb;37(1):49-65.
16. US FDA. Guidance for industry: population pharmacokinetics [online]. Available
from URL: http://www.fda.gov/downloads/Drugs/Guidances/UCM072137.pdf.
[Accessed 2014 Sep 18].
17. Brendel K, Dartois C, Comets E, Lemenuel-Diot A, Laveille C, Tranchand B, et
al. Are population pharmacokinetic and/or pharmacodynamic models adequately
evaluated? A survey of the literature from 2002 to 2004. Clinical
Pharmacokinetics. 2007;46(3):221-34.
18. Lee JY, Garnett CE, Gobburu JV, Bhattaram VA, Brar S, Earp JC, et al. Impact of
pharmacometric analyses on new drug approval and labelling decisions: a review
of 198 submissions between 2000 and 2008. Clinical Pharmacokinetics. 2011
Oct;50(10):627-35.
19. Neely MN, Youn G, Jones B, Jelliffe RW, Drusano GL, Rodvold KA, et al. Are
vancomycin trough concentrations adequate for optimal dosing? Antimicrobial
Agents and Chemotherapy. 2014;58(1):309-16.
20. Nunn MO, Corallo CE, Aubron C, Poole S, Dooley MJ, Cheng AC. Vancomycin
dosing: assessment of time to therapeutic concentration and predictive accuracy of
pharmacokinetic modeling software. The Annals of Pharmacotherapy. 2011
Jun;45(6):757-63.
21. Rybak MJ, Lomaestro BM, Rotschafer JC, Moellering RC, Craig WA, Billeter M,
et al. Vancomycin therapeutic guidelines: a summary of consensus
recommendations from the infectious diseases Society of America, the American
Society of Health-System Pharmacists, and the Society of Infectious Diseases
Pharmacists. Clinical Infectious Diseases. 2009 Aug 1;49(3):325-7.

Reprinted with permission from Stockmann C, Sherwin CM, Buterbaugh W,
Spigarelli MG, Gottschlich MM, Healy D, et al. Preliminary assessment of zolpidem
pharmacokinetics in pediatric burn patients. Therapeutic Drug Monitoring. 2014
Jun;36(3):295-301. Copyright 2014 Lippincott Williams & Wilkins.
CHAPTER 5
PRELIMINARY ASSESSMENT OF ZOLPIDEM
PHARMACOKINETICS IN PEDIATRIC
BURN PATIENTS
Abstract
Purpose: Severely burned patients frequently experience sleep fragmentation and
insomnia. This study evaluated the population pharmacokinetics of the sleep-enhancing
agent zolpidem among burned children.
Methods: Zolpidem was administered according to the following age-based dosing
schedule: 2-4 years, 2.5 mg/dose; 5-10 years, 5.0 mg/dose; and >10 years, 10 mg/dose.
Serum samples were collected pre-dose, 1, 2, 4, 5, 6, and 8 hours post-dose. The population
pharmacokinetic analysis modelled zolpidem concentrations using non-linear mixed
effects models.
Results: Eleven patients with a mean (+SD) age of 8.3+4.0 years and a mean total
burn surface area of 56+22% were recruited. Seventy-three zolpidem concentrations were

115
measured with a mean Cmax of 291+140 ng/mL. A two-compartment model with first-order
absorption best described the data. Zolpidem clearance was estimated at 0.03 L/hr/kg
(relative standard error, 55%) and increased with body weight (P<0.05). The central
compartment volume of distribution was estimated at 0.05 L/kg (relative standard error,
25%), which was inversely related to the proportion of the body surface with third degree
burns (P<0.001).
Conclusions: A population pharmacokinetic model has been developed that reliably
characterized the pharmacokinetic parameters of zolpidem when used as a sleep-enhancing
agent among pediatric burn patients. Further studies are needed to link this
pharmacokinetic model with pharmacodynamic data, which may include an assessment of
the effects of higher zolpidem doses and/or more frequent administration upon sleep
architecture.
Introduction
Zolpidem tartrate is an imidazopyridine sedative and hypnotic agent that is rapidly
absorbed, metabolized, and eliminated.[1] In studies among adult subjects, zolpidem has
been shown to decrease the number of night-time awakenings, decrease the time required
to fall asleep, increase total sleep time, and improve sleep quality among insomniacs.[2]
Zolpidem has been used for the management of sleep disorders for more than 20 years and
has been reported to be safe and effective for a variety of sleep-related complaints.[3, 4]
Burn injuries are marked by a dramatic catabolic phase that is characterized by an
increase in energy expenditure, protein catabolism, and cachexia.[5, 6] Alterations in sleep
patterns have been shown to be independent risk factors for poor pain tolerance in adults

116
with severe burn injuries.[7] Among burn patients, restorative sleep may be impaired due
to physiological, psychological, environmental, and treatment-related stimuli that interfere
with normal sleep patterns.[8-10] These detrimental effects suggest that sleep-enhancing
agents, such as zolpidem, may be useful for improving burn survival and recovery.[11]
In a recent study, children with severe burn injuries were randomized to receive
zolpidem or haloperidol and had continuous polysomnographic recordings obtained to
evaluate the effects of these agents on sleep architecture.[12] Forty patients were enrolled
in this blinded crossover study, in which each patient alternately received zolpidem one
week and haloperidol the next. Zolpidem was found to have a small, but significant, effect
in improving the proportion of stage 3 and rapid eye movement sleep (0.8 vs. 0.6 hours),
but did not affect the total duration of sleep. In contrast, haloperidol increased total sleep
time (5.3 vs. 4.3 hours) and increased stage 2 sleep (3.3 vs. 2.4 hours). The authors
concluded that sleep was marginally improved with both drugs and there were no
significant differences between the two therapeutic agents. It was noted, however, that the
relatively short half-life of zolpidem (mean 2.5 hours) may have attenuated its beneficial
effects upon sleep architecture. To date, no studies have examined zolpidem
pharmacokinetics in burn patients; however, drug metabolism is generally thought to be
elevated as a consequence of the pathophysiology of burn injuries, including: altered
protein binding, bioavailability, and tissue blood flow; heightened renal clearance; and a
higher volume of distribution.[13, 14] As a consequence of these pharmacokinetic changes
and the relatively short half-life of zolpidem, it is possible that this agent may fail to prevent
sleep fragmentation as it wears off, thereby decreasing the amount of restorative sleep
among burn patients.

117
The primary aim of this study was to develop a population pharmacokinetic model
to explore the pharmacokinetics of zolpidem among children with severe burn injuries.
Materials and Methods
Subjects and Study Design
This study was conducted as an open-label inpatient pharmacokinetic study that
involved pediatric burn patients who consented to receive zolpidem tartrate for use as a
sleep-enhancing agent over four consecutive days. Acutely burned children were screened
at the time of their admission to the burn unit for enrollment into this prospective
pharmacokinetic study. Inclusion criteria included a total burn surface area (TBSA) greater
than 20%, age between 3 and 18 years, and admission within 5 days of the burn injury.
Children were excluded from enrollment if there were pre-existing neurological, sleep or
psychiatric disorders; a history of brain injury; endocrine disease; questionable 72 hour
survival; severe obesity (body mass index >97th percentile); or if administration of other
sleep-inducing agents was planned within 24 hours. Demographic data were collected for
all study participants.
This study was reviewed and approved by the University of Cincinnati Institutional
Review Board. Parental permission and informed assent (when appropriate) were obtained
prior to the performance of any study-related procedures.
Drug Administration
Historically, zolpidem dosing was based upon the age of the child. In this study,
we aimed to examine the pharmacokinetics of zolpidem when dosed according to routine

118
clinical practice. Dose amounts for each child are presented in Table 5.1. Two pilot subjects
received a single 5 mg night-time dose of zolpidem at 2200 hours. Nine subsequent patients
received a second dose at 0200 hours in an attempt to maintain sleep throughout the night.
Zolpidem was administered as a crushed tablet that was dissolved in 5 mL of water and
was given via a nasoenteric Frederick-Miller feeding tube, followed by a 5 mL flush.
Sample Collection
Zolpidem concentration-time data were prospectively collected for each enrolled
subject. On the fourth and final day of zolpidem therapy, blood samples were collected
over an 8-hour period from an indwelling catheter. Samples were drawn in non-heparinized
tubes immediately prior to the first dose and at 1, 2, 4, 5, 6, and 8 hours post-dose. The
total amount of blood drawn at each sampling interval did not exceed 3.0 mL. Whole blood
samples were centrifuged at 1500 g (approximately 3000 rev/min) for 10 min at 4°C.
Centrifuged samples were then stored at -80°C prior to pharmacokinetic analysis.
Analytical Assay
Zolpidem serum concentrations were analyzed using a validated high-performance
liquid chromatography (HPLC) assay tethered to a fluorescence detector.[15] The assay
was linear over the range from 25-1000 ng/mL. Intra- and inter-day coefficients of
variation were less than 8.2%.

119
Dose
am
ou
nt,
mg
5
5
2.5
2.5
5
10
5
5
10
20
8
7.1
±
5.0
No. of
dose
s
1
1
2
2
2
2
2
2
2
2
2
--
Days
aft
er
bu
rn
44
14
16
8
14
16
11
15
11
19
30
18.0
±
10.3
Th
ird
-
deg
ree
bu
rn, %
83
43
51
82
74
25
23
29
19
22
46
45.2
±
24.5
TB
SA
B,
%
85
43
51
83
78
50
28
35
31
83
54
56.4
±
22.0
BM
I,
kg/m
2
18
19
23
16
16
16
15
18
15
21
19
17.8
±
2.5
Wei
gh
t,
kg
34
20
28
17
25
45
23
35
22
60
45
32.1
±
13.2
Age,
yrs
7
4
4
4
8
12
8
8
7
17
12
8.3
±
4.0
Sex
Mal
e
Mal
e
Mal
e
Mal
e
Mal
e
Fem
ale
Mal
e
Fem
ale
Mal
e
Fem
ale
Mal
e
Pati
ent
nu
mb
er
1
2
3
4
5
6
7
8
9
10
11
Mea
n ±
SD
Table
5.1
. D
emogra
phic
and c
linic
al
chara
cter
isti
cs o
f se
vere
ly b
urn
ed c
hil
dre
n w
ho r
ecei
ved z
olp
idem
as
a
slee
p-e
nhan
cing a
gen
t.

120
Pharmacokinetic Analysis
Zolpidem pharmacokinetic parameters were estimated using Monolix 4.2 (Lixoft,
Orsay, France), interfaced through Matlab R2012b (The Mathworks Inc., Natick, MA,
United States). Monolix employs a stochastic approximation expectation maximization
parameters without approximating the statistical model.[16] The consistency and minimum
variance of the estimates have been optimized in the Monolix SAEM implementation.[17]
Furthermore, Markov Chain Monte Carlo (MCMC) simulations were performed in
Monolix using a simulated annealing procedure to accelerate the algorithm’s convergence
toward a solution. Descriptive statistics were used to characterize the study population with
Stata 11.2 (StataCorp, College Station, TX, United States) and R version 2.15.1 (Cran.R-
project.org).
One- and two-compartment structural models were fitted to the naïve pooled data
with and without lags. All compartmental models were parameterized to give estimates of
zolpidem clearance (CL/F) and the apparent volume of distribution (Vd/F). Models were
evaluated and selected based on the goodness of fit. Unstable models were excluded from
the model building process, as well as models that produced non-physiological results (e.g.,
negative clearance). Model stability was assessed by changing the initial estimates for CL/F
and Vd/F.
Selection of structural models was facilitated using the Akaike information
criterion (AIC) and the Bayesian information criterion (BIC).[18] During model
development several diagnostic plots were used to visually assess the model’s fit, including
observed versus population predicted zolpidem concentrations and observed versus
individual predicted zolpidem concentrations. Plots of the residuals and conditional

121
weighted residuals (CWRES) versus time or population predicted zolpidem concentrations
were also visually inspected. Models were also compared by examining the precision of
parameter estimates, measures of variability, and the objective function value (OFV).
Model fit was based on minimization of the OFV. A reduction of more than 3.84 (-2 log
likelihood difference) was considered statistically significant with P<0.05 and one degree
of freedom.
A mixed effects model was built to incorporate intra- and inter-individual
variability and residual unexplained variability (RUV). Inter-individual variability was
assumed to be log-normally distributed and was assessed using an exponential equation of
the form:
𝐶𝐿𝑖/𝐹 = 𝜃𝑝𝑜𝑝 ∗ exp(𝜂𝑖) (5.1)
where CLi/F is the clearance value parameter for the ith individual, θpop is the population
mean for zolpidem CL, and η represents the inter-individual random effect with a mean of
zero and a variance of ω2.
During model development, RUV was evaluated using a combined additive and
constant coefficient of variation error model. This followed the form of:
Y = IPRED ∗ (1 + 𝜀prop) + 𝜀add (5.2)
where Y is the observed zolpidem concentration, IPRED is the individual predicted
concentration, and εprop and εadd are the RUV terms for the additive and proportion error
models.

122
Base Model Development
The base model was developed using an empirical approach that focused on
assessing several structural models. An evaluation of multiple absorption models was
performed to identify the model that best described zolpidem absorption in the dataset. Lag
time and absorption rate constants (Ka) were also assessed to determine if they improved
estimations of the zolpidem absorption process.
Covariate Analysis
Several demographic and clinical characteristics were investigated for their
influence upon zolpidem pharmacokinetics. Patient age, gender, race, ethnicity, type and
extent of burn injury, elapsed time since the burn injury, current body weight, height, and
body mass index (BMI), C-reactive protein (CRP), and serum creatinine were evaluated.
An exploratory analysis was performed to identify relationships between zolpidem
pharmacokinetic parameters and the above characteristics. The empirical Bayesian
estimates from the individual parameters obtained from the base model were plotted
against the covariate values and were compared by visual inspection.
To correct for differences in body size and metabolic rate, allometric scaling was
applied to zolpidem CL/F and Vd/F, which were standardized to a body weight of 70
kg.[19] After the initial analysis, final covariates were selected for inclusion within the
model following a stepwise inclusion approach. Covariates were added within the model
until there was no further decrease in the OFV. A backward stepwise approach was used
to remove covariates from the model.

123
Model Evaluation
Model performance was assessed numerically and graphically, in which observed
drug concentrations were visually inspected for their correlation with predicted
concentrations. As described by Goobie et al., conditional weighted residual plots were
constructed and assessed using the empirical -2 to +2 region criterion, in the absence of
any serial correlation or heteroscedasticity.[20] Standard errors were assessed for both the
estimated population parameters and random effects error models. Goodness-of-fit plots
and visual predictive checks were used to evaluate model fit. The final covariate model
was also assessed by generating numeric and visual predictive checks. Further, the final
model was also assessed with plots of the normalized prediction distribution error (NPDE)
as a function of time and population predicted zolpidem concentrations.[21]
Results
Subjects and Pharmacokinetics
Data were collected from 11 children with acute burn injuries, 8 of whom were
male and 3 were female. The mean age of the subjects included in this study was 8.3 + 4.0
years. Additional demographic characteristics of the study cohort are featured in Table 5.1.
The extent of the mean TBSA burn was 56% + 22%. All 11 children had thermal burn
injuries and 2 (18%) patients also suffered an inhalation injury.
Two pilot subjects received a single dose of zolpidem just prior to sleep onset
(10:00 p.m.). Nine subjects also received a second dose of zolpidem 4 hours after the first
dose (2:00 a.m.). There were 73 zolpidem serum concentrations measured with a median
of 7 (range 5-7) per patient.

124
Initial exploratory analysis of the data revealed characteristic concentration-time
profiles for all subjects. Figure 5.1A displays the raw zolpidem concentration data at each
sample time for the two pilot patients who received a single dose of zolpidem. Figure 5.1B
presents the raw zolpidem concentration data for the subsequent nine patients who received
two doses. For these patients, the mean peak serum concentration was 291 + 140 ng/mL.
Population Pharmacokinetic Models
The population pharmacokinetic analysis included all 73 measured zolpidem
concentrations from the 11 study participants. A two-compartment model with first order
absorption was identified as the base model that best described the data, as assessed by the
OFV, AIC, and BIC. This model was utilized for subsequent covariate model development.
Covariate Models
Inclusion of body weight in the initial covariate analysis revealed that
allometrically-scaled body weight exerted a substantial influence upon zolpidem CL/F.
Additionally, the volume of distribution in the central compartment (Vc/F) was inversely
associated with the proportion of the body surface with third degree burns. None of the
other covariates (e.g., age, gender, race, ethnicity, type of burn injury, total body burn
surface area, elapsed time since the burn injury, CRP, and serum creatinine) influenced
zolpidem pharmacokinetic parameter estimates.
The final covariate model was selected as it produced the most significant reduction
of the OFV (Δ 13.5), reduced the inter-individual variability, and decreased the RUV.
Additionally, visual inspection of the diagnostic plots was used to confirm the selection of

125
Figure 5.1. Zolpidem concentration versus time curves. (A) Two pilot subjects received a
single dose of zolpidem and (B) nine subjects received an additional dose of zolpidem four
hours after receiving their first dose.

126
the final model (Figure 5.2). The parameter estimates derived from the final covariate
model are featured in Table 5.2.
Model Evaluation
Diagnostic plots of the population and individually predicted zolpidem
concentrations were compared against the observed concentrations for all patients (Figure
5.2). Conditional weighted residuals and NPDE metrics revealed a random distribution
around 0, with nearly all values within the -2 to +2 range (Figure 5.3). Simulations from
the observed zolpidem concentration data are presented in Figure 5.4 using a visual
predictive check, with the median value compared to the 10th and 90th percentiles.
Approximately 94% of the simulated observations fell within the 90% prediction interval,
demonstrating reasonable agreement between the observed and simulated zolpidem
concentration data.
Discussion
This is the first study to evaluate the pharmacokinetics of zolpidem when used as a
sleep-enhancing agent among children with severe burn injuries. Zolpidem
pharmacokinetics are strongly influenced by both body weight and the extent of third
degree burn injuries. Due to the relatively short half-life of zolpidem, a single dose failed
to result in sleep that persisted throughout the night for two pilot subjects. The remaining
nine participants received a second dose administered 4 hours later, which improved the
duration of sleep throughout the latter half of the night.

127
Figure 5.2. Zolpidem final covariate model observed versus (A) population-predicted
concentrations and (B) individual-predicted concentrations. The line of identity is shown
as a solid black line. The dashed gray line represents the spline of the data.

128
Table 5.2. Zolpidem population pharmacokinetic parameter estimates from the final two-
compartment covariate model.
Parameters
Mean
Parameter
Estimate
Standard
Error % RSE
Θ – Pharmacokinetic Parameters
Ka - Absorption rate (hr-1) 0.18 (fixed) -- --
CL/F - Clearance (L/hr/kg) 0.03 0.015 55
Vc/F - Volume of distribution in the
central compartment (L/kg) 0.05 0.012 25
Q/F - Intercompartmental clearance
(L/hr/kg) 0.04 0.020 47
Vp/F - Volume of distribution in the
peripheral compartment (L/kg) 0.69 2.9 421
ω – Between-Subject Variability
CL/F - Clearance 0.25 0.26 103
Vc/F - Volume of distribution in the
central compartment 0.37 0.09 26
Q/F - Intercompartmental clearance 0.96 0.28 30
Vp/F - Volume of distribution in the
peripheral compartment 4.3 3.2 75
ε – Residual Unexplained Variability 28 3.1 11

129
Figure 5.3. Zolpidem final covariate model (A) conditional weighted residuals versus time
and population-predicted concentrations and (B) normalized prediction distribution errors
as a function of time and population-predicted concentrations.

130
Figure 5.3. Continued.

131
Fig
ure
5.4
. V
isual
pre
dic
tive
ch
eck
for
obse
rved
zo
lpid
em
conce
ntr
ati
ons
usi
ng
th
e fi
nal
cova
riate
pharm
aco
kinet
ic m
od
el.

132
Few studies have established therapeutic dosage regimens for sleep-enhancing
agents among children.[22] The only other pediatric zolpidem pharmacokinetic study was
conducted by Blumer et al., which utilised a single dose escalation design to evaluate three
zolpidem dosage regimens (0.125, 0.25, and 0.5 mg/kg) among otherwise healthy children
with insomnia.[23] The authors found that zolpidem doses of >0.25 mg/kg (maximum of
10 mg/day) were safe, well tolerated, and potentially efficacious. However, the
appropriateness of this dosing regimen for children with severe burn injuries is unknown.
Burn injuries evolve over time and can profoundly impact the pharmacokinetics and
pharmacodynamics of many drugs.[24] A few days after the burn injury, patients enter a
hypermetabolic state with high blood flow to the liver and kidneys, increased α1-acid-
glycoprotein concentrations, and loss of the drug due to exudate leakage – all of which
contribute to altered protein binding, drug distribution, and clearance.[25] Clinically, many
hypermetabolic burn patients eliminate drugs rapidly, necessitating higher doses and/or
shorter dosing intervals to maintain therapeutic serum concentrations. In a previous study,
we evaluated the effects of a single zolpidem dose of 0.5 mg/kg upon sleep duration and
architecture among burned children.[12] The authors found that this dose was ineffective
in restoring normal sleep architecture and speculated that sleep fragmentation may have
occurred later in the night as a consequence of sub-therapeutic serum concentrations.
Further pharmacodynamic assessments are needed to assess whether a second dose
administered 4 hours after the first improves sleep quality in this critically-ill pediatric
population.
In the previously mentioned study conducted by Blumer et al., the
pharmacokinetics of zolpidem were evaluated among otherwise healthy children suffering

133
from insomnia.[23] Age was found to significantly influence the zolpidem area under the
concentration time curve, half-life, and mean residence time. In this study, body weight
was significantly associated with zolpidem clearance, which likely reflects the cachexia
associated with severe burn injuries. Additionally, the extent of third degree burn injuries
was inversely associated with the volume of distribution in the central compartment. As a
consequence, the children enrolled in this study achieved higher serum zolpidem
concentrations than have been previously reported among healthy children.[23] This may
be at least partially attributable to pathophysiologic changes in the volume of distribution
among burn patients, which strongly affect hydrophilic drugs such as zolpidem tartrate.[26]
Despite the relatively high zolpidem concentrations measured in this study, it was noted by
clinical investigators that with two doses each night sleep quantity and quality were still
suboptimal. Future studies are warranted to define the relationship between the sleep-
enhancing effects of zolpidem (pharmacodynamics) and measured serum concentrations.
Defining this relationship will be critical to ensure that a therapeutic range is developed for
children with severe burn injuries.
Recently, the U.S. Food and Drug Administration (FDA) approved new labelling
changes, which advocate a lowering of the recommended initial dose of immediate- and
extended-release zolpidem formulations.[27, 28] These changes were made to decrease the
risk of next-day driving impairment among adults; however, the appropriateness of this
recommendation for pediatric patients is not known. In this study, two pilot subjects who
received a single 5 mg dose of zolpidem failed to sustain sleep throughout the night. The
next nine subjects received a second dose of zolpidem during the latter half of the night,
which was found to improve sleep duration. According to recent FDA guidelines,[27] the

134
recommended initial dose of the immediate-release formulation of zolpidem is now 5 mg
for women and 5 or 10 mg for men. The gender-specific difference in dosing
recommendations is a function of adult pharmacokinetic studies conducted among healthy
volunteers, which reported that women clear zolpidem at a slower rate than men.[29] Sex
was not identified as a significant covariate in this pediatric burns study; however, the
limited sample size may have obscured our ability to detect a subtle variation in zolpidem
clearance between male and female participants.
Interpretation of these findings warrants the consideration of several limitations.
First, the association between zolpidem pharmacokinetics and pharmacodynamic
endpoints, including changes in sleep architecture, remains unknown for pediatric burn
patients. Further research is needed to link zolpidem dosing with polysomnographic
evidence of clinical efficacy. Second, children in this study were enrolled at a mean of 18
days post-burn. As such, the findings described herein may not generalize to children in
the hypermetabolic stage immediately following their burn injury nor after significant
wound healing and convalescence has occurred. Third, this study featured a limited number
of serum samples from eleven children with severe burn injuries. This relatively small
sample size limits our ability to precisely define the covariates that influence the disposition
of zolpidem tartrate; however, this is the first study to date that has sought to systematically
evaluate the pharmacokinetics of this drug in this unique patient population. Lastly,
inadequate pain control in the burn population has been associated with poor sleep
quality.[8] In this study, it was not possible to correlate pain control with sleep
disturbances, although this may be an important component of future pharmacodynamic
studies.

135
Conclusions
The current study characterized the pharmacokinetic parameters of zolpidem when
used as a sleep-enhancing agent among children with severe burn injuries. Assessments
from the clinical team treating the first two pilot subjects suggested that a single 5 mg dose
of zolpidem was insufficient to achieve sustained sleep throughout the night. Nine
subsequent patients received a second dose 4 hours after the first, which increased the
duration of sleep through the latter half of the night. These findings suggest that future
clinical trials should investigate higher doses and/or more frequent dosing for children with
acute burn injuries. Recent FDA recommendations to decrease adult zolpidem doses are
not likely to be appropriate for severely burned children. Further studies are needed to
define the target zolpidem concentration required to improve sleep architecture among
burned children. Additionally, pharmacodynamic studies and simulations may be helpful
in developing appropriate dosing regimens for this vulnerable population.
Acknowledgments
The authors recognize the contributions of Chris Allgeier, DTR, Theresa Mayes,
RD, Jane Khoury, PhD, and the departments of clinical research, pharmacy, laboratory
medicine, nursing, and the medical staff of the participating hospitals for their invaluable
assistance with this study.

136
References
1. Holm KJ, Goa KL. Zolpidem: an update of its pharmacology, therapeutic efficacy
and tolerability in the treatment of insomnia. Drugs. 2000 Apr;59(4):865-89.
2. Roth T, Roehrs T, Vogel G. Zolpidem in the treatment of transient insomnia: a
double-blind, randomized comparison with placebo. Sleep. 1995 May;18(4):246-
51.
3. Maarek L, Cramer P, Attali P, Coquelin JP, Morselli PL. The safety and efficacy
of zolpidem in insomniac patients: a long-term open study in general practice.
The Journal of International Medical Research. 1992 Apr;20(2):162-70.
4. Hajak G, Bandelow B. Safety and tolerance of zolpidem in the treatment of
disturbed sleep: a post-marketing surveillance of 16944 cases. International
Clinical Psychopharmacology. 1998 Jul;13(4):157-67.
5. Herndon DN, Tompkins RG. Support of the metabolic response to burn injury.
Lancet. 2004 Jun 5;363(9424):1895-902.
6. Wilmore DW, Aulick LH. Metabolic changes in burned patients. The Surgical
Clinics of North America. 1978 Dec;58(6):1173-87.
7. Raymond I, Nielsen TA, Lavigne G, Manzini C, Choiniere M. Quality of sleep
and its daily relationship to pain intensity in hospitalized adult burn patients. Pain.
2001 Jun;92(3):381-8.
8. Onen SH, Onen F, Courpron P, Dubray C. How pain and analgesics disturb sleep.
The Clinical Journal of Pain. 2005 Sep-Oct;21(5):422-31.
9. Low JF, Dyster-Aas J, Willebrand M, Kildal M, Gerdin B, Ekselius L. Chronic
nightmares after severe burns: risk factors and implications for treatment. The
Journal of Burn Care & Rehabilitation. 2003 Jul-Aug;24(4):260-7; discussion 59.
10. Rose M, Sanford A, Thomas C, Opp MR. Factors altering the sleep of burned
children. Sleep. 2001 Feb 1;24(1):45-51.
11. Jaffe SE, Patterson DR. Treating sleep problems in patients with burn injuries:
practical considerations. The Journal of Burn Care & Rehabilitation. 2004 May-
Jun;25(3):294-305.
12. Armour A, Gottschlich MM, Khoury J, Warden GD, Kagan RJ. A randomized,
controlled prospective trial of zolpidem and haloperidol for use as sleeping agents
in pediatric burn patients. Journal of Burn Care & Research. 2008 Jan-
Feb;29(1):238-47.
13. Jaehde U, Sorgel F. Clinical pharmacokinetics in patients with burns. Clinical
Pharmacokinetics. 1995 Jul;29(1):15-28.

137
14. Bonate PL. Pathophysiology and pharmacokinetics following burn injury. Clinical
Pharmacokinetics. 1990 Feb;18(2):118-30.
15. Ring PR, Bostick JM. Validation of a method for the determination of zolpidem
in human plasma using LC with fluorescence detection. Journal of Pharmaceutical
and Biomedical Analysis. 2000 Apr;22(3):495-504.
16. Kuhn E, Lavielle, M. Maximum Likelihood Estimation in Nonlinear Mixed
Effects Models. Comput Stat Data Anal. 2005;49:1020-38.
17. Chan PL, Jacqmin P, Lavielle M, McFadyen L, Weatherley B. The use of the
SAEM algorithm in MONOLIX software for estimation of population
pharmacokinetic-pharmacodynamic-viral dynamics parameters of maraviroc in
asymptomatic HIV subjects. Journal of Pharmacokinetics and
Pharmacodynamics. 2011 Feb;38(1):41-61.
18. Ludden TM, Beal SL, Sheiner LB. Comparison of the Akaike Information
Criterion, the Schwarz criterion and the F test as guides to model selection.
Journal of Pharmacokinetics and Biopharmaceutics. 1994 Oct;22(5):431-45.
19. Boxenbaum H. Interspecies scaling, allometry, physiological time, and the ground
plan of pharmacokinetics. Journal of Pharmacokinetics and Biopharmaceutics.
1982 Apr;10(2):201-27.
20. Goobie SM, Meier PM, Sethna NF, Soriano SG, Zurakowski D, Samant S, et al.
Population Pharmacokinetics of Tranexamic Acid in Paediatric Patients
Undergoing Craniosynostosis Surgery. Clinical Pharmacokinetics. 2013 Feb 1.
21. Comets E, Brendel K, Mentre F. Computing normalised prediction distribution
errors to evaluate nonlinear mixed-effect models: the npde add-on package for R.
Computer Methods and Programs in Biomedicine. 2008 May;90(2):154-66.
22. Owens JA, Babcock D, Blumer J, Chervin R, Ferber R, Goetting M, et al. The use
of pharmacotherapy in the treatment of pediatric insomnia in primary care:
rational approaches. A consensus meeting summary. Journal of Clinical Sleep
Medicine. 2005 Jan 15;1(1):49-59.
23. Blumer JL, Reed MD, Steinberg F, O'Riordan MA, Rosen CL, Springer MA, et
al. Potential pharmacokinetic basis for zolpidem dosing in children with sleep
difficulties. Clinical Pharmacology and Therapeutics. 2008 Apr;83(4):551-8.
24. JAJ M. Clinical pharmacology and therapeutics in burns. In: JAJ M, editor. Acute
management of the burned patient. Philadelphia, PA: WB Saunders; 1990. p. 180-
200.
25. Blanchet B, Jullien V, Vinsonneau C, Tod M. Influence of burns on
pharmacokinetics and pharmacodynamics of drugs used in the care of burn
patients. Clinical Pharmacokinetics. 2008;47(10):635-54.

138
26. Roth T, Hull SG, Lankford DA, Rosenberg R, Scharf MB. Low-dose sublingual
zolpidem tartrate is associated with dose-related improvement in sleep onset and
duration in insomnia characterized by middle-of-the-night (MOTN) awakenings.
Sleep. 2008 Sep;31(9):1277-84.
27. U.S. Food and Drug Administration. FDA Drug Safety Communication: FDA
approves new label changes and dosing for zolpidem products and a
recommendation to avoid driving the day after using Ambien CR. MedWatch;
Rockville, MD. 2013.
28. Kuehn BM. FDA warning: Driving may be impaired the morning following
sleeping pill use. JAMA. 2013 Feb 20;309(7):645-6.
29. Greenblatt DJ, Harmatz JS, von Moltke LL, Wright CE, Durol AL, Harrel-Joseph
LM, et al. Comparative kinetics and response to the benzodiazepine agonists
triazolam and zolpidem: evaluation of sex-dependent differences. The Journal of
Pharmacology and Experimental Therapeutics. 2000 May;293(2):435-43.

CHAPTER 6
SIMULATION-BASED PHARMACOMETRIC
BENCHMARKING OF MONOLIX,
NONMEM, AND PMETRICS
Introduction
Pharmacometric models can be used to quantify the variability in drug
concentrations over time by fitting mathematical equations to clinical data. Population
pharmacokinetic analyses involve the fitting of nonlinear mixed effects models to dosing
and concentration data from multiple subjects at multiple points in time.[1-4] Mixed effects
modeling involves the simultaneous quantification of the effects of random variability
(between subject and residual variability) and fixed effects (such as weight, age, or renal
function) on plasma drug concentrations.[5] These models are useful in then defining
influential sources and correlates of variability in drug concentrations among patients,
which can be used to derive personalized dosing regimens.[6]
Multiple software platforms have emerged over the last 30 years for conducting
population pharmacokinetic analyses, many of which feature different parameter
estimation methods that have the potential to lead to different results when the same
structural model is fit to the same dataset.[2, 3] For this reason, benchmarks are needed to

140
experimentally assess the strengths and weaknesses of current pharmacometric modeling
programs and their estimation methods. The accuracy and precision of these
pharmacokinetic parameter estimates may impact clinical decisions and lead to alterations
in medical management, such that the selection of a pharmacokinetic parameter estimation
method with lower bias and higher precision is desirable. Additionally, it is unknown
whether the selection of the optimal modeling program and parameter estimation method
differs based on the design of the clinical trial. The objective of this study was to assess the
predictive performance of three of the most commonly used population pharmacokinetic
modeling programs and their parameter estimation algorithms when applied to simulated
data under a variety of clinical trial designs with varying amounts of error, varying sample
sizes, and varying numbers of concentrations obtained from each subject.
Methods
Experimental Design
This study was designed to assess the predictive performance of three commonly
used population pharmacokinetic modeling programs when their respective
pharmacokinetic parameter estimation algorithms were applied to simulated datasets.
Construction of the simulated one compartment datasets was performed using a structural
model of the form:
One-compartment model: 𝑑𝐴1𝑑𝑡
= −𝑘𝑒𝑙 ∗ 𝐴1 (6.1)
Initially, a dataset was simulated with 160 neonatal subjects, each of whom received a
single 140 mg/kg dose of the drug and had a total of 10 plasma concentrations measured at
5, 15, 30, 45, 60, 90, 120, 180, 360, and 540 minutes post-dose.

141
To assess the impact of varying the amount of error on the predictive performance
of each software program, new datasets were constructed in which each concentration was
randomly permuted by 20%, 40%, 60%, and 80%. Additionally, to assess the influence of
the study design parameters on the predictive performance of the software programs, the
number of subjects (n = 10, 20, 40, 80, and 160) and the number of concentrations obtained
from each subject (n = 2, 4, 6, 8, and 10) was varied. These permutations of the original
simulated dataset resulted in the generation of 100 datasets due to the creation of unique
datasets with each combination of the error, sample size, and number of concentration
terms (4 error terms * 5 sample size terms * 5 concentration number terms = 100 unique
datasets). A survey of the literature was performed to confirm the sample size, number of
concentrations per subject, and error terms included in the simulations covered a sufficient
range of values that may be reasonably expected to be feasible when designing a
prospective clinical trial.[6-8] These datasets are included in Appendix C.
The 100 simulated datasets were generated by MGS and CMTS and were labeled
with coded identifiers, such that the investigator performing the analysis (CS) was blinded
to the true values used to initialize the simulation and to the amount of error included in
each dataset.
Software Programs Tested
Three population pharmacokinetic modeling programs were employed in this
benchmarking study. Each of these software programs allows the user the opportunity to
employ different estimation algorithms, which are discussed separately in the following
paragraphs:
1) Monolix (Lixoft, Orsay, France): Monolix uses expectation maximization (EM)

142
methods to integrate the posterior density by performing Monte Carlo sampling
over all possible individual parameters during the expectation step, followed by a
single iteration maximization step that moves the fixed-effect parameter values
closer toward the maximum likelihood.[9, 10] Monte Carlo-based methods have
the advantage of not using a linearized approximation to the integral and are
theoretically less biased.[9] EM algorithms are inherently stochastic and are
therefore less likely to be forced into a local minimum but they may yield less
precise results.[11]
2) NONMEM (nonlinear mixed effects modelling; ICON Development Solutions,
Ellicott City, MD, USA): NONMEM uses the Broyden-Fletcher-Goldfarb-Shanno
(BFGS) quasi-Newton algorithm to maximize the approximated likelihood.[12]
With the first-order conditional estimation with interaction (FOCEI) method, the
likelihood is linearized with respect to the random effects using a first-order Taylor
series expansion.[2] The integration step is performed by assuming that the
posterior density can be approximated by a multivariate normal density with respect
to the individual parameters.[2]
3) Pmetrics (Laboratory of Applied Pharmacokinetics and Bioinformatics, University
of Southern California, Los Angeles, CA, USA): Pmetrics uses a nonparametric
adaptive grid (NPAG) algorithm to estimate the unknown probability distribution
(F) of the pharmacokinetic model parameter values using a set of discrete
distributions with the same number of support points as the number of subjects
included in the study.[13] To define F, a large grid of potential support points (G0)
is laid out on the surface of F. To determine probabilities of the support points and

143
the corresponding likelihood, a primal-dual interior point method is used.[14, 15]
The vast majority of the support points have exceedingly low probabilities (<10-12),
which are then deleted from the grid yielding a smaller grid (G1). New support
points are then added around each of the remaining support points, which leads to
a new expanded grid (G2) with an improved likelihood. This process is iteratively
repeated thereby giving rise to Gk grids with larger likelihoods. When the difference
between the previous grid and the current grid is extremely small, the model is said
to have converged.
Model Implementation
The simulated datasets featured a strong influence of weight (kg) on the
pharmacokinetic parameters of clearance and volume of distribution. As an additional
sensitivity analysis, the parameter estimates obtained from the three population
pharmacokinetic modeling programs were compared using incorrectly-specified one-
compartment models that did not account for the influence of weight on clearance or the
volume of distribution. Correctly-specified models that incorporate the influence of weight
on clearance and the volume of distribution were also tested to assess the sensitivity of
these software programs to model misspecification. The influence of weight on clearance
and the volume of distribution was modeled with an estimated power function of the form:
𝜃𝑖 = 𝜃𝑝𝑜𝑝 ∗ 𝑊𝑇𝑖𝜃𝑐𝑜𝑣 ∗ 𝑒𝜂𝑖 (6.2)
where θi is the individual model-predicted pharmacokinetic parameter (e.g., clearance or
volume of distribution) for individual i with a weight of WTi (kg), θpop is the population
mean pharmacokinetic parameter θ, θcov is the effect of the weight covariate, and ηi is the

144
between-subject random effect on the pharmacokinetic parameter θ with a mean of 0 and
a variance of Ω. The initial estimates for the fixed effects in each model script were
uniformly set equal to 1.
A proportional error model was used to describe the residual variability, which took
the form:
𝑌𝑖𝑗 = ��𝑖𝑗 + (��𝑖𝑗 ∗ 𝜀𝑖𝑗) (6.3)
where Yij is the measured drug concentration for the ith individual at time j, Yij is the model-
predicted drug concentration, and εij is a normally-distributed random error term with a
mean of 0 and a variance of Σ.
Statistical Analysis
The predictive performance of Monolix, NONMEM, and Pmetrics’ respective
pharmacokinetic parameter estimation algorithms was compared with the true clearance
and volume of distribution values used to develop the simulated one-compartment
pharmacokinetic datasets. As described by Sheiner and Beal,[16] the performance of each
algorithm was assessed by computing its relative bias and precision according to the
following equations:
Percent prediction error (bias): 100 ∗ (𝜃𝑒𝑠𝑡−𝜃𝑡𝑟𝑢𝑒𝜃𝑡𝑟𝑢𝑒
) (6.4)
Absolute percent prediction error (precision): 100 ∗ (|𝜃𝑒𝑠𝑡−𝜃𝑡𝑟𝑢𝑒|𝜃𝑡𝑟𝑢𝑒
) (6.5)
The bias and precision were calculated for both clearance and the volume of
distribution estimates derived from each of the population pharmacokinetic modeling
programs. Analyses were performed globally with the results of all of the datasets pooled
together, which were then followed by sub-analyses that were stratified by the error, sample

145
size, and number of concentrations per subject terms. Descriptive statistics were calculated
and the bias and precision were compared for each of the population pharmacokinetic
modeling programs using the nonparametric Wilcoxon-Mann-Whitney test. All statistical
analyses were performed in R 3.1.3 (R Foundation for Statistical Computing, Vienna,
Austria) with a two-tailed alpha of 0.05.
Results
Across the 100 datasets, there were a total of 37,200 simulated concentrations. The
simulated concentration-time profiles for these simulated neonatal subjects are featured in
Figure 6.1. The median postmenstrual age of the simulated study population was 38.0
(interquartile range [IQR]: 37.1-39.0) weeks and the median current body weight was 2.17
(IQR: 1.23-3.42) kg.
Correctly-Specified Models with Covariates
The median parameter estimates and the IQR of the parameter estimates for all
estimated parameters for the correctly-specified models that incorporated the influence of
current body weight on clearance and the volume of distribution are featured in Figures
6.2A and 6.2B, respectively, for each of the population pharmacokinetic modeling
programs. In this figure, the values of the parameters were normalized by dividing the
model-estimated parameter value by the known, true value. The solid gray horizontal line
corresponds to the true value of each pharmacokinetic parameter. The x-axis features each
of the three population pharmacokinetic modeling programs that were tested. The heavy
solid black horizontal line within each box plot denotes the median normalized value of
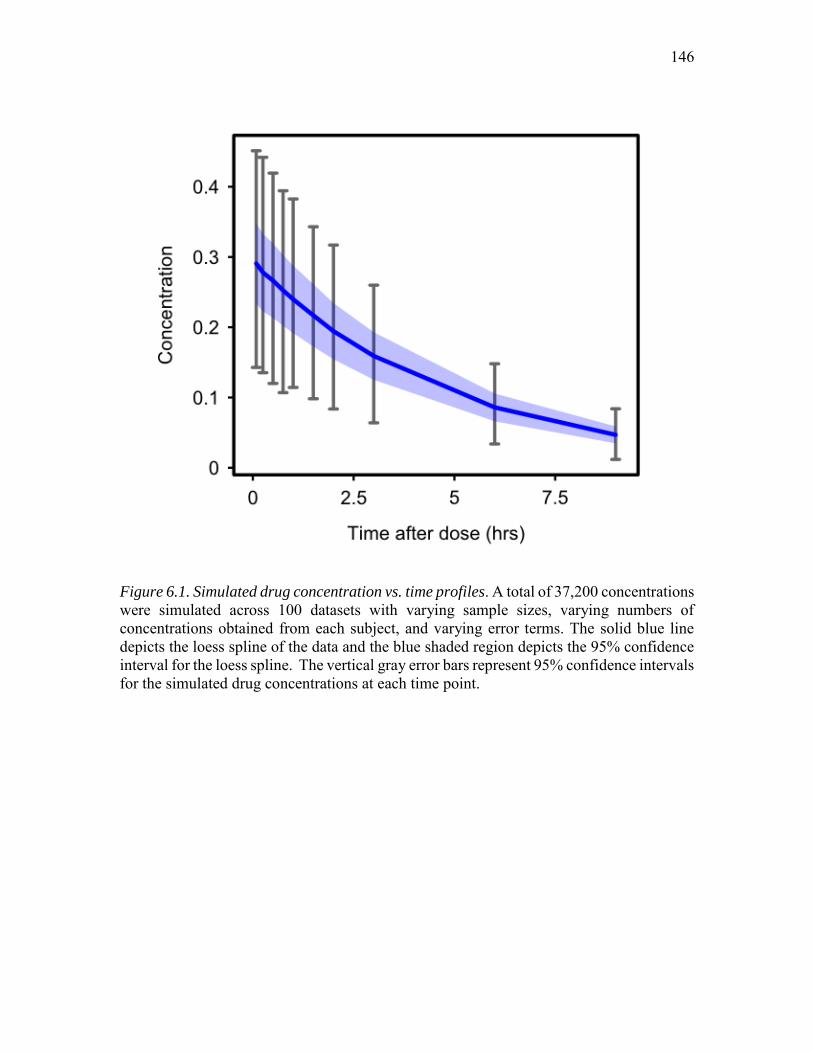
146
Figure 6.1. Simulated drug concentration vs. time profiles. A total of 37,200 concentrations were simulated across 100 datasets with varying sample sizes, varying numbers of concentrations obtained from each subject, and varying error terms. The solid blue line depicts the loess spline of the data and the blue shaded region depicts the 95% confidence interval for the loess spline. The vertical gray error bars represent 95% confidence intervals for the simulated drug concentrations at each time point.

147
Figure 6.2. Clearance (A) and volume of distribution (B) parameter estimates using
correctly-specified covariate models. For each parameter, the estimated value was normalized by the true value. The gray horizontal line depicts the true normalized values (equal to 1). The box plots depict the 25th, 50th, and 75th percentiles. The vertical lines extending from each boxplot extend to 1.5 times the interquartile range, with values beyond this point denoted by unfilled circles.

148
the pharmacokinetic parameters and the lighter weight solid black lines forming the box
denote the 25th and 75th percentiles. The whiskers extending from each box plot extend to
1.5 times the IQR. Observations beyond the whiskers are presented as unfilled circles.
Generally, clearance estimates were biased slightly higher than their true values with both
Monolix and NONMEM, whereas the volume of distribution estimates were very close to
their true values with both of these programs. In contrast, clearance estimates were
generally unbiased with Pmetrics, whereas volume of distribution estimates were biased
slightly lower than their true values. Notably, the range of normalized values was
considerably larger for Pmetrics than Monolix, which was in turn slightly larger than that
observed with NONMEM.
The bias of the population pharmacokinetic modeling programs was tested with a
20% error applied to the pharmacokinetic parameters with varying sample sizes and
numbers of concentrations from each subject. For all three programs, bias decreased with
larger numbers of concentrations from each subject (P<0.001) and larger sample sizes
(P=0.005). However, the pharmacokinetic parameter estimates were biased for all three
population pharmacokinetic modeling programs. As seen in Table 6.1, pharmacokinetic
parameter estimates obtained from both Monolix and NONMEM were positively biased,
whereas the estimates obtained from Pmetrics were negatively biased. Monolix was less
biased than NONMEM, which was less biased than Pmetrics (P<0.001 for all
comparisons).
The precision of the population pharmacokinetic parameters was tested with 20%
error (Figure 6.3A and Table 6.1). In simulations with larger numbers of concentrations
from each subject, the percent absolute prediction error decreased with Monolix,

149
Table 6.1. Bias and precision of the estimated population pharmacokinetic parameter
values obtained using Monolix, NONMEM, and Pmetrics for the correctly-specified
models with covariates.
Monolix NONMEM Pmetrics
Simulated with 20% error
Median percent prediction error (IQR)a
8.9% (-1.1% to 64.4%)
19.1% (0.0% to 67.5%)
-27.8% (-44.0% to 1.4%)
Median percent absolute prediction error (IQR)b
40.6% (3.8% to 65.5%)
21.5% (0.5% to 67.5%)
37.3% (22.7% to 60.7%)
Simulated with 40% error
Median percent prediction error (IQR)a
13.2% (-1.7% to 62.8%)
22.7% (0.1% to 67.8%)
-33.1% (-59.7% to -8.0%)
Median percent absolute prediction error (IQR)b
35.8% (5.7% to 64.2%)
22.8% (0.9% to 67.8%)
40.5% (26.7% to 63.3%)
Simulated with 60% error
Median percent prediction error (IQR)a
16.9% (-2.4% to 61.4%)
26.1% (0.5% to 66.9%)
-32.9% (-60.4% to -11.4%)
Median percent absolute prediction error (IQR)b
37.1% (7.1% to 63.5%)
26.1% (0.9% to 66.9%)
41.8% (26.7% to 62.8%)
Simulated with 80% error
Median percent prediction error (IQR)a
18.2% (-3.6% to 60.8%)
20.9% (-0.5% to 66.2%)
-43.2% (-62.8% to -28.2%)
Median percent absolute prediction error (IQR)b
37.8% (8.2% to 62.5%)
26.6% (1.9% to 66.2%)
49.6% (30.9% to 63.6%)
a Percent prediction error is a measure of bias. b Percent absolute prediction error is a measure of precision.

150
NONMEM, and Pmetrics (P<0.001). In contrast, increasing sample sizes had a negligible
effect on percent absolute prediction errors (P=0.3). Overall, with 20% error and varying
sample sizes and numbers of concentrations from each subject, percent absolute prediction
errors were lowest for NONMEM, followed by Pmetrics, and then Monolix (P<0.001 for
all comparisons).
When the modeling programs were tested with datasets that featured 80% error,
bias increased and precision decreased (Figure 6.3B and Table 6.1). Pharmacokinetic
parameter estimates were positively biased for both Monolix and NONMEM, whilst
Pmetrics pharmacokinetic parameter estimates were negatively biased (P<0.001 for all
comparisons). Increasing the number of concentrations from each subject decreased
percent absolute prediction errors (P<0.001). Additionally, increasing the number of
subjects slightly decreased percent absolute prediction errors (P=0.05). With 80% error,
percent absolute prediction errors were lowest for NONMEM, followed by Monolix, and
then Pmetrics (P<0.001 for all comparisons).
Incorrectly-Specified Models without Covariates
In Figures 6.4A and 6.4B the normalized values of the pharmacokinetic parameter
estimates are presented for incorrectly-specified models that did not incorporate the
influence of weight on clearance or the volume of distribution. Monolix, NONMEM, and
Pmetrics clearance estimates were positively biased, whereas the volume of distribution
estimates were unbiased. Notably however, the range of normalized values for Pmetrics
was considerably larger than that observed for Monolix and NONMEM, which may be
interpreted as evidence of model misspecification.

151
Fig
ure
6.3
. P
reci
sion o
f th
e popula
tion p
harm
aco
kinet
ic p
ara
met
er e
stim
ate
s as
a f
unct
ion o
f
sam
ple
siz
e and t
he
num
ber
of
conce
ntr
ati
ons
obta
ined
fro
m e
ach
subje
ct w
ith 2
0%
err
or
(A)
and 8
0%
err
or
(B),
usi
ng
corr
ectl
y-sp
ecif
ied c
ova
riate
model
s.

152
Figure 6.4. Clearance (A) and volume of distribution (B) parameter estimates using
incorrectly-specified models without covariates. For each parameter, the estimated value was normalized by the true value. The gray horizontal line depicts the true normalized values (equal to 1). The box plots depict the 25th, 50th, and 75th percentiles. The vertical lines extending from each boxplot extend to 1.5 times the interquartile range, with values beyond this point denoted by unfilled circles.

153
When the incorrectly-specified models were applied to simulated datasets with 20%
error, the results of all three modeling programs were significantly biased (P<0.001 for
all). Neither increasing the number of concentrations per subject (P=0.2) nor increasing
the sample size (P=0.3) reduced the bias. As seen in Table 6.2, the magnitude of the bias
was comparable among all three modeling programs (P>0.1 for all comparisons).
Similarly, increasing the number of concentrations per subject (P=0.7) and increasing the
sample size (P=0.2) did not improve the precision of the parameter estimates. The precision
of the pharmacokinetic parameter estimates was slightly higher for NONMEM than for
Monolix (P=0.02) (Figure 6.5A); however, the precision of the pharmacokinetic parameter
estimates obtained with Pmetrics was substantially higher than that observed with
NONMEM and Monolix (P<0.001 for both).
Similar to the findings observed with 20% error, when the incorrectly-specified
models were applied to datasets with 80% error, all three modeling programs yielded
significantly biased pharmacokinetic parameter estimates (P<0.001 for all). Larger sample
sizes (P<0.001) and increased numbers of samples obtained from each subject (P=0.01)
were associated with increased bias. Pmetrics was substantially more biased than both
NONMEM and Monolix (P<0.001 for both); however, NONMEM was slightly more
biased than Monolix (P=0.002). The precision of the pharmacokinetic parameter estimates
was not affected by changes in the number of samples obtained from each subject (P=0.7).
In contrast, precision decreased with larger sample sizes (P<0.001). With the incorrectly-
specified models, the median percent absolute prediction error was highest for Pmetrics,
followed by NONMEM, and then Monolix (Figure 6.5B).

154
Table 6.2. Bias and precision of the estimated population pharmacokinetic parameter
values obtained using Monolix, NONMEM, and Pmetrics for the incorrectly-specified
models without covariates.
Monolix NONMEM Pmetrics
Simulated with 20% error
Median percent prediction error (IQR) a
16.4% (0.6% to 31.7%)
17.2% (0.1% to 67.3%)
29.9% (-5.8% to 90.7%)
Median percent absolute prediction error (IQR) b
16.5% (3.9% to 64.1%)
17.3% (3.8% to 67.3%)
32.7% (13.8% to 90.7%)
Simulated with 40% error
Median percent prediction error (IQR) a
16.9% (0.0% to 62.1%)
19.7% (-0.4% to 67.4%)
24.8% (-6.3% to 90.4%)
Median percent absolute prediction error (IQR) b
19.6% (5.9% to 62.1%)
23.0% (5.8% to 67.4%)
34.5% (14.8% to 90.4%)
Simulated with 60% error
Median percent prediction error (IQR) a
18.6% (-0.8% to 58.0%)
21.2% (-1.0% to 66.5%)
31.2% (-2.9% to 101.5%)
Median percent absolute prediction error (IQR) b
21.9% (7.5% to 58.0%)
25.1% (7.7% to 66.6%)
38.3% (16.3% to 101.5%)
Simulated with 80% error
Median percent prediction error (IQR) a
18.3% (-1.9% to 55.4%)
20.0% (-2.3% to 66.2%)
38.3% (-0.2% to 114.9%)
Median percent absolute prediction error (IQR) b
22.4% (8.5% to 55.4%)
26.7% (8.9% to 66.2%)
42.6% (17.5% to 114.9%)
a Percent prediction error is a measure of bias. b Percent absolute prediction error is a measure of precision.

155
Fig
ure
6.5
. P
reci
sion o
f th
e popula
tion p
harm
aco
kinet
ic p
ara
met
er e
stim
ate
s as
a f
unct
ion o
f
sam
ple
siz
e and t
he
num
ber
of
conce
ntr
ati
ons
obta
ined
fro
m e
ach
subje
ct w
ith 2
0%
err
or
(A)
and
80%
err
or
(B),
usi
ng i
nco
rrec
tly-
spec
ifie
d m
odel
s w
ithou
t co
vari
ate
s.

156
Discussion
Across a wide range of simulated error terms, sample sizes, and varying numbers
of concentrations obtained from each subject, with correctly-specified covariate models,
the three population pharmacokinetic modeling programs tested were modestly biased
(median percent prediction error of 32%) and imprecise (median percent absolute
prediction error of 37%). Several consistent themes emerged for all three population
pharmacokinetic modeling programs, including a decrease in bias with larger numbers of
concentrations obtained from each subject and a more modest decrease in bias with larger
sample sizes for correctly-specified models. Additionally, increasing the number of
concentrations obtained from each subject, but not larger sample sizes, improved the
precision of the pharmacokinetic parameter estimates. Despite these consistent findings
across all three population pharmacokinetic modeling programs, relative strengths and
weaknesses were also identified with each of the modeling programs parameter estimation
algorithms tested.
As expected, the stochastic approximation EM algorithm implemented in Monolix
yielded less biased parameter estimates than those obtained with the FOCEI method in
NONMEM and the NPAG method in Pmetrics, with the correctly-specified covariate
model. Also as expected, Monolix pharmacokinetic parameter estimates were less precise
than those obtained with the FOCEI method implemented in NONMEM. Monolix
performed equally as well as NONMEM but considerably worse than Pmetrics at
identifying model misspecification, as evidenced by relatively low percent prediction and
percent absolute prediction errors with the incorrectly-specified model. Nevertheless,
Monolix is freely available to students and academics and features a user-friendly graphical

157
interface.
The FOCEI algorithm implemented in NONMEM was more precise than the EM
algorithm implemented in Monolix and the NPAG algorithm implemented in Pmetrics.
Additionally, NONMEM’s FOCEI algorithm was less biased than Pmetrics’ NPAG
algorithm when applied to correctly-specified models. Similar to Monolix, NONMEM
struggled to identify misspecified models; however, unlike Monolix, NONMEM requires
an annual license and does not come packaged with a graphical interface.
The NPAG algorithm implemented in Pmetrics yielded more biased and imprecise
pharmacokinetic parameter estimates than both Monolix and NONMEM when applied to
incorrectly-specified models that did not incorporate the influence of weight on clearance
or the volume of distribution. However, when the NPAG algorithm was applied to
correctly-specified models, the pharmacokinetic parameter estimates were more biased
than those obtained with Monolix and NONMEM. With correctly-specified models,
similar precision was achieved with Pmetrics and Monolix; however, Pmetrics’ NPAG
algorithm yielded less precise parameter estimates when compared with NONMEM’s
FOCEI algorithm. As with Monolix, Pmetrics is available at no cost to students and
academics. Although Pmetrics is not bundled with a standalone graphical interface, it is
interfaced through the open source statistical software program R.
This study is limited by its use of simulated drug concentration time profiles, which
cannot possibly capture the breadth of biological processes involved in human
pharmacokinetic studies. Nevertheless, this simulation-based design was adopted so that it
would be possible to compare the pharmacokinetic modeling programs’ results with
known, true values, which are unknowable in clinical pharmacokinetic studies.

158
Additionally, the metrics used to benchmark these population pharmacokinetic modeling
programs included the percent prediction error and the percent absolute prediction error;
however, alternative metrics exist. Nevertheless, the percent prediction error and the
percent absolute prediction error were used as they provide a cogent way to simultaneously
compare the results of different pharmacokinetic parameter estimation algorithms
employed in different modeling programs across a wide range of study designs. A further
limitation of this study is that the length of time required to run the models was not
captured; however, no modeling program took longer than 1 hr to run a single model.
In pharmacokinetic simulations with study designs mimicking those observed in
previously published clinical trials, the bias and precision of three of the most commonly
used population pharmacokinetic modeling programs was approximately 30-35%. This
suggests that additional efforts are needed to develop less biased and more precise
pharmacokinetic parameter estimation algorithms. However, these simulations revealed
relative strengths and weaknesses of Monolix, NONMEM, and Pmetrics, which should be
considered when attempting to identify the most appropriate estimation algorithm and
modeling program for each project. Across all three population pharmacokinetic modeling
programs, bias was found to decrease substantially with the collection of additional
concentrations from each subject, and to a lesser degree with increasing sample sizes. In
contrast, precision was found to improve only with a greater number of concentrations
collected from each subject.

159
References
1. Gibiansky L, Gibiansky E, Bauer R. Comparison of Nonmem 7.2 estimation methods and parallel processing efficiency on a target-mediated drug disposition model. Journal of Pharmacokinetics and Pharmacodynamics. 2012 Feb;39(1):17-35.
2. Beal SL, Sheiner LB, Boeckmann AJ, and Bauer RJ (eds). NONMEM 7.2.0 users guides. (1989–2011). Icon Development Solutions, Ellicott City. ftp://nonmem.iconplc.com/Public/nonmem720/guides.
3. Lavielle, M. Monolix version 4.3.2 users guide. Lixoft, Orsay, France. http://www.lixoft.eu/wp-content/resources/docs/UsersGuide.pdf.
4. Pedersen PV. Curve fitting and modeling in pharmacokinetics and some practical experiences with NONLIN and a new program FUNFIT. Journal of Pharmacokinetics and Biopharmaceutics. 1977 Oct;5(5):513-31.
5. Pinheiro J, Bates D. Mixed effects models in S and S-PLUS. New York, NY: Springer-Verlag; 2000.
6. Frymoyer A, Hersh AL, El-Komy MH, Gaskari S, Su F, Drover DR, et al. Association between vancomycin trough concentration and area under the concentration-time curve in neonates. Antimicrobial Agents and Chemotherapy. 2014 Nov;58(11):6454-61.
7. Tatarinova T, Neely M, Bartroff J, van Guilder M, Yamada W, Bayard D, et al. Two general methods for population pharmacokinetic modeling: non-parametric adaptive grid and non-parametric Bayesian. Journal of Pharmacokinetics and Pharmacodynamics. 2013 Apr;40(2):189-99.
8. Neely MN, Youn G, Jones B, Jelliffe RW, Drusano GL, Rodvold KA, et al. Are vancomycin trough concentrations adequate for optimal dosing? Antimicrobial Agents and Chemotherapy. 2014;58(1):309-16.
9. Kuhn E, Lavielle M. Coupling a stochastic approximation version of EM with an MCMC procedure. ESAIM Prob Stat. 2004;8:115-31.
10. Kuhn E, Lavielle M. Maximum likelihood estimation in nonlinear mixed effects models. Comp Stat Data Anal. 2005;49:1020-38.
11. Delyon B, Lavielle M, Moulines E. Convergence of a stochastic approximation version of the EM algorithm. Ann Stat. 1999;27(1):94-128.
12. Johansson AM, Ueckert S, Plan EL, Hooker AC, Karlsson MO. Evaluation of bias, precision, robustness and runtime for estimation methods in NONMEM 7. Journal of Pharmacokinetics and Pharmacodynamics. 2014 Jun;41(3):223-38.

160
13. Schumitzky A. Nonparametric EM algorithms for estimating prior distributions. Appl Math Comp. 1991;45:143-57.
14. Lindsay B. The geometry of mixture models: a general theory. Ann Stat. 1983;11:86-94.
15. Mallet A. A maximum likelihood estimation method for random coefficient regression models. Biometrika. 1986;73:645-56.
16. Sheiner LB, Beal SL. Some suggestions for measuring predictive performance. Journal of Pharmacokinetics and Biopharmaceutics. 1981 Aug;9(4):503-12.

CHAPTER 7
CONCLUSIONS
By and large, clinical pharmacology – and population pharmacokinetics in
particular – remains a field that is ripe for investigation as many questions are still
unanswered despite decades of experience using well-established methods and modeling
programs. In this dissertation, we revisited the clinical utility of population
pharmacokinetic modeling, along the way challenging conventional dosing strategies for
vancomycin in preterm neonates and zolpidem among severely burned children, in an effort
to shed light on the importance of conducting clinical pharmacokinetics studies.
Ideally, population pharmacokinetic studies should be designed to reflect clinical
practice and involve participants who are similar to those for whom the study’s results are
intended to be applied to. Unfortunately, there is a dearth of well-designed pediatric
population pharmacokinetic studies, which has hampered the development of safe and
effective dosing regimens for many medications that are used in children’s hospitals around
the world.[1] Although multiple factors likely underlie the shortage of pediatric population
pharmacokinetic studies, the perception that pediatric studies are costly, time consuming,
and logistically challenging is likely one of the leading factors.[2] To dispel this fallacy,
we leveraged vancomycin therapeutic drug monitoring data from two vulnerable pediatric

162
populations to provide evidence supporting the safety and effectiveness of current dosing
regimens for children with cystic fibrosis and validated new dosing regimens that more
reliably achieve therapeutic targets for preterm neonates with invasive bacterial
infections.[3, 4] Additionally, we identified evidence of sub-therapeutic dosing among
severely burned children treated with the sleep-enhancing agent zolpidem in a prospective
clinical trial.[5]
It is of equal – if not more – importance to also assess the validity of population
pharmacokinetic modeling programs against a true gold standard, thereby ensuring that the
recommendations that are developed from population pharmacokinetic studies are
unbiased and accurate. Toward this effort, we developed a simulation-based framework for
benchmarking the bias and accuracy of population pharmacokinetic parameter estimates
and confirmed the average bias and precision of three of the most commonly used
population pharmacokinetic modeling programs to be approximately 30-35%. This finding
suggests that although these models may perform adequately for drugs with wide
therapeutic windows, additional research is needed to improve the predictive performance
of the pharmacokinetic parameter estimation algorithms employed in these programs,
particularly when they will be applied to characterize the pharmacokinetic properties of
drugs with narrow therapeutic windows.
The main contribution of our simulation-based benchmarking paradigm was
identification of the relative strengths and weaknesses of the pharmacokinetic parameter
estimation algorithms implemented in the three modeling programs we studied. These
differences in the performance characteristics of the estimation algorithms ought to be
considered when designing population pharmacokinetic studies. For first-in-human studies

163
or trials involving patient populations in which the investigational drug has not been
studied before, gaining insight into the factors that influence the drug’s pharmacokinetics
may be more important than predictive accuracy. In cases such as these, one might
consider using the NPAG algorithm implemented in Pmetrics, as it performed best in
identifying ill-specified covariate models. Conversely, for clinical use (e.g., therapeutic
drug monitoring), the correct covariate-model structure has likely already been defined
previously and the goal is instead to accurately predict a patient’s pharmacokinetic
parameters, for which Monolix’s EM algorithm or NONMEM’s FOCEI algorithm may be
preferred.
This preliminary work sets the stage for many additional directions of future
investigation, including those of a practical and a theoretical nature. We are currently
recruiting participants as part of a clinical trial that will compare target rates of treatment
failure and nephrotoxicity among neonates who are dosed according to the vancomycin
model described in Chapter 4 as compared with historical controls at the University of Utah
and Stanford University. Additionally, we submitted a grant requesting funding to perform
a pharmacokinetic-guided dosing study of zolpidem among children with severe burn
injuries who are cared for in the Shriners’ network of children’s hospitals. From a more
theoretical standpoint, we believe that the simulation-based framework for benchmarking
population pharmacokinetic parameter estimation algorithms described in this dissertation
can be applied to many additional interesting questions, which include (but are not limited
to):
1) Do the same patterns identified in Chapter 6 hold true with more complex
pharmacokinetic models (e.g., transit absorption compartments, enterohepatic

164
recirculation, etc.)?
2) Which algorithms perform best for pharmacodynamic analyses? What are the
influential factors in pharmacodynamic analyses that affect bias and precision
and to what extent can these be controlled for with optimal clinical trial design?
3) Which algorithms perform best for mixture models? Under what circumstances
is bias minimized and precision maximized?
4) How much of an effect do date and time errors in dosing and concentration
records have on pharmacokinetic parameter estimates? Does the effect vary
with different estimation algorithms?
Overall, this dissertation lays the foundation for a permanent re-assessment of the
role of population pharmacokinetic analyses in drug development and clinical practice.
The clinical utility demonstrated in the three real-world case studies presented in Chapters
3, 4, and 5 should foster the development of new pharmacokinetic parameter estimation
algorithms that can further improve the predictive accuracy and interpretability of
population pharmacokinetic analyses. Additionally, the novel simulation-based
benchmarking framework that we developed here can easily be extended to provide a true
gold standard to guide the development of new algorithms. With clinical impact driving
the development of these new algorithms, it should be understood that these models cannot
be thought of as ‘black boxes’, but rather they must be thought of as rational tools that can
provide insights into the underlying biology and pharmacology hidden within the data,
whilst simultaneously yielding accurate pharmacokinetic predictions that may be used to
guide drug dosing.

165
As we look to the future and consider the situations in which population
pharmacokinetic models may be most useful, it is worth noting that the factors influencing
pharmacokinetic variability differ between drugs, disease states, and the presence / absence
of other co-prescribed medications. Many drugs feature wide therapeutic windows for
which a single well-designed population pharmacokinetic study may be sufficient to
establish an effective and safe range of exposures. For drugs such as these, population
pharmacokinetic modeling can facilitate the development of dosing regimens designed to
reliably achieve the target exposure range for the vast majority of patients.
The situation is more complicated for medications that are used in the hospital
setting as these often feature narrow therapeutic windows and may be administered to
critically-ill patients. In situations such as these, a one size fits all approach to dosing is
unlikely to be maximally efficacious and safe. Instead, collection of one or two samples to
measure drug concentrations from an individual patient may be performed to develop a
personalized pharmacokinetic model. Moreover, these additional concentrations can be
leveraged to better inform the dosing recommendations for the population at large via
Bayesian updating of the population pharmacokinetic model.

166
References
1. Adamson PC. Unintended consequences of regulatory initiatives in childhood cancer drug development. JAMA Pediatrics. 2013 Oct;167(10):886-7.
2. Caldwell PH, Murphy SB, Butow PN, Craig JC. Clinical trials in children. Lancet. 2004 Aug 28-Sep 3;364(9436):803-11.
3. Stockmann C, Sherwin CM, Zobell JT, Lubsch L, Young DC, Olson J, et al. Population pharmacokinetics of intermittent vancomycin in children with cystic fibrosis. Pharmacotherapy. 2013 Dec;33(12):1288-96.
4. Stockmann C, Hersh AL, Roberts JK, Bhongsatiern J, Korgenski EK, Spigarelli MG, et al. Predictive Performance of a Vancomycin Population Pharmacokinetic Model in Neonates. Infectious Diseases and Therapy. 2015 Jun;4(2):187-98.
5. Stockmann C, Sherwin CM, Buterbaugh W, Spigarelli MG, Gottschlich MM, Healy D, et al. Preliminary assessment of zolpidem pharmacokinetics in pediatric burn patients. Therapeutic Drug Monitoring. 2014 Jun;36(3):295-301.

APPENDIX A
VANCOMYCIN POPULATION PHARMACOKINETIC
ANALYSIS CODE

168
$PROBLEM Neonatal vancomycin population pharmacokinetic model $INPUT C ID TIME AMT DV MDV RATE WT SCR JSCR PMA PNA TYPE
DOSE
; ID = Subject identifier ; TIME = Time (measured in hours) ; AMT = Dose amount (mg) ; DV = Drug concentration (mg/L) ; MDV = Missing dependent variable ; RATE = Infusion rate (mg/hr) ; WT = Weight (kg) ; SCR = Serum creatinine concentration (mg/dL) ; JSCR = Linear conversion of enzymatic SCr to
the Jaffe method ; PMA = Postmenstrual age (weeks) ; PNA = Postnatal age (days) ; TYPE = Drug concentration type (0 = trough,
1 = peak) ; DOSE = Daily dose (mg/day) $DATA NEONATAL_VANCO_DATA.CSV IGNORE=C $SUB ADVAN1 TRANS2 $PK TH1 = THETA(1) TVCL = TH1 * (WT/2.9)**0.75 *
(1/(1+(PMA/THETA(3))**(-(THETA(4))))) * (1/JSCR)**(THETA(5))
CL = TVCL * EXP(ETA(1)) TH2 = THETA(2) TVV = TH2 * (WT/2.9)**1.0 V = TVV * EXP(ETA(2)) TM50 = THETA(3) HILL = THETA(4) CR = THETA(5) S1 = V AUC = DOSE / CL IF(AMT.GT.0) THEN TDOS = TIME TAD = 0 ENDIF IF(AMT.EQ.0) THEN TAD = TIME - TDOS

169
ENDIF $THETA 0.345 FIXED ; Population clearance 1.75 FIXED ; Population volume of distribution 34.8 FIXED ; TM50 4.53 FIXED ; Hill coefficient 0.267 FIXED ; Creatinine effect $OMEGA BLOCK(2) FIXED 0.0465 0.00734 0.0119 $SIGMA 0.0421 FIXED ; Proportional error 1.168 FIXED ; Additive error $ERROR A1 = A(1) Y = F + F * ERR(1) + ERR(2) IPRED = F $ESTIMATION METHOD = 1 INTERACTION MAXEVAL = 0 POSTHOC $TABLE ID TIME DV MDV CL V TH1 TH2 TM50 HILL CR WT PMA JSCR AUC TYPE IPRED NOPRINT ONEHEADER FILE = neonatal_vanco.fit

APPENDIX B
ZOLPIDEM POPULATION PHARMACOKINETIC
ANALYSIS CODE

171
DESCRIPTION: ambien_final.mlxtran DATA: path = "%MLXPROJECT%/", file = "zolpidem_data.csv",
headers = {ID, TIME, Y, MDV, AMT, COV, COV}, columnDelimiter = "," VARIABLES: THIR [use = cov], WT, t_WT = log(WT) [use = cov, centeredBy = mean] INDIVIDUAL: Cl = {distribution = logNormal, covariate = t_WT, iiv = yes}, Q = {distribution = logNormal, iiv = yes}, V1 = {distribution = logNormal, covariate = THIR, iiv = yes}, V2 = {distribution = logNormal, iiv = yes}, ka = {distribution = logNormal, iiv = yes} STRUCTURAL_MODEL: file = "oral1_2cpt_kaClV1QV2", path = "%MLXPATH%/libraries/PKLibrary", output = {Cc} OBSERVATIONS: y1 = {type = continuous, prediction = Cc, error = combined1} TASKS: ; settings globalSettings = { withVariance = no, settingsGraphics = "%MLXPROJECT%/ambien_final_graphics.xmlx",
settingsAlgorithms = "%MLXPROJECT%/ambien_final_algorithms.xmlx",
resultFolder = "%MLXPROJECT%/ambien_final"}, ; workflow estimatePopulationParameters( initialValues = { pop_Cl = 1, beta_{Cl,t_WT} = 0.75 [method = FIXED], pop_Q = 1, pop_V1 = 1, beta_{V1,THIR} = 0, pop_V2 = 1,

172
pop_ka = 0.18 [method = FIXED], a_y1 = 1, b_y1 = 0.3, omega_Cl = 1, omega_Q = 1, omega_V1 = 1, omega_V2 = 1, omega_ka = 1 }), estimateFisherInformationMatrix(method = {linearization}), estimateIndividualParameters(method = {conditionalMode}), estimateLogLikelihood(method = {linearization}), displayGraphics(),

Reprinted with permission from Stockmann, C. et al. Relationship Between Zolpidem Concentrations and Sleep Parameters in Pediatric Burn Patients. Journal of Burn
Care & Research 36, 137-144, doi:10.1097/BCR.0000000000000164 (2014). Copyright 2014 Wolters Kluwer Health, Inc.
APPENDIX C
RELATIONSHIP BETWEEN ZOLPIDEM
CONCENTRATIONS AND SLEEP
PARAMETERS IN PEDIATRIC
BURN PATIENTS

174

175

176

177

178

179

180
181
APPENDIX D
POPULATION PHARMACOKINETIC
BENCHMARKING DATASETS

183
DRUG CONCENTRATIONS AT X
MINUTES POST DOSE
540
0.03
7
0.03
4
360
0.11
7
0.10
8
180
0.15
7
0.15
9
0.15
1
0.16
7
0.17
4
0.17
4
0.1
0.16
1
0.16
3
0.18
1
0.12
9
0.21
7
120
0.18
0.25
3
90
0.23
5
0.16
9
60
0.15
5
0.34
3
45
0.25
2
0.38
4
30
0.31
4
0.25
4
0.24
9
0.23
2
0.28
8
0.30
4
0.23
8
0.30
5
0.30
2
0.26
5
0.16
4
0.39
5
15
0.15
2
0.42
1
5
0.26
9
0.28
1
DOSE
524.
8
467.
5
445.
7
268.
1
208.
3
537.
6
54.6
515.
6
618.
3
303.
9
273.
9
555.
2
AGE_WKS
39.7
14
39.4
29
39.1
43
37.7
14
37.2
86
39
36.4
29
38.8
57
39.5
71
38.1
43
38
39.4
29
WT_KG
3.74
9
3.33
9
3.18
4
1.91
5
1.48
8
3.84
0.39
3.68
3
4.41
7
2.17
1
1.95
6
3.96
6
ID
1 2 3 4 5 6 7 8 9 10
1 2
NUM
a2
a2
a2
a2
a2
a2
a2
a2
a2
a2
e1
e1
ERROR
20
20
20
20
20
20
20
20
20
20
80
80
A re
pres
enta
tive
sam
ple
of th
e po
pula
tion
phar
mac
okin
etic
dat
aset
s is i
nclu
ded
in th
e ta
ble
belo
w. T
o ob
tain
acc
ess t
o al
l of
the
data
sets
use
d in
Cha
pter
6 p
leas
e co
ntac
t Chr
is.S
tock
man
n@hs
c.ut
ah.e
du.

184
DRUG CONCENTRATIONS AT X
MINUTES POST DOSE
540
0.03
1
0.06
2
0.06
6
0.06
2
0.06
5
0.06
8
0.05
2
0.03
1
0.02
0.05
2
0.05
8
0.05
8
0.07
0.04
4
0.06
5
360
0.08
5
0.10
8
0.09
3
0.06
5
0.05
6
0.11
8
0.07
3
0.07
8
0.06
4
0.14
8
0.04
8
0.07
6
0.05
5
0.04
9
0.10
7
180
0.25
9
0.10
2
0.24
2
0.20
8
0.09
9
0.12
8
0.16
0.16
2
0.12
2
0.21
2
0.15
2
0.09
6
0.17
6
0.12
9
0.09
6
120
0.22
0.21
1
0.24
4
0.17
0.10
9
0.24
1
0.25
7
0.22
7
0.16
1
0.22
2
0.22
1
0.10
9
0.15
7
0.17
7
0.12
7
90
0.22
2
0.18
5
0.26
9
0.28
1
0.23
4
0.16
6
0.15
0.27
0.23
7
0.25
2
0.19
1
0.15
1
0.33
5
0.14
6
0.15
3
60
0.26
9
0.23
5
0.18
0.27
7
0.20
6
0.35
8
0.28
5
0.22
9
0.27
6
0.34
8
0.22
2
0.13
2
0.3
0.29
3
0.15
45
0.27
4
0.23
1
0.28
0.24
7
0.26
0.18
6
0.17
4
0.28
3
0.15
7
0.23
2
0.33
0.29
4
0.28
6
0.19
2
0.22
6
30
0.27
8
0.16
8
0.18
9
0.16
3
0.31
7
0.24
2
0.29
3
0.16
6
0.28
2
0.23
4
0.32
5
0.25
5
0.20
5
0.28
4
0.22
6
15
0.26
1
0.21
3
0.29
7
0.21
4
0.37
8
0.34
5
0.23
4
0.14
4
0.21
9
0.42
9
0.21
6
0.21
0.36
6
0.32
7
0.27
4
5
0.40
6
0.20
4
0.33
7
0.35
8
0.35
9
0.29
6
0.37
1
0.24
1
0.19
5
0.39
1
0.30
2
0.35
7
0.32
3
0.19
0.34
7
DOSE
597.
6
336.
9
343.
3
560.
2
341.
8
534.
8
569.
2
170.
9
69.4
560
628.
5
303
566
154.
8
228.
4
AGE_WKS
39.4
29
38
38.2
86
39.5
71
38.1
43
39
39.7
14
37.1
43
36.5
71
39.1
43
40
37.7
14
39.2
86
37.1
43
37.4
29
WT_KG
4.26
9
2.40
7
2.45
2
4.00
1
2.44
2
3.82
4.06
6
1.22
0.49
6
4 4.49
2.16
5
4.04
3
1.10
6
1.63
2
ID
3 4 5 6 7 8 9 10
11
12
13
14
15
16
17
NUM
e1
e1
e1
e1
e1
e1
e1
e1
e1
e1
e1
e1
e1
e1
e1
ERROR
80
80
80
80
80
80
80
80
80
80
80
80
80
80
80
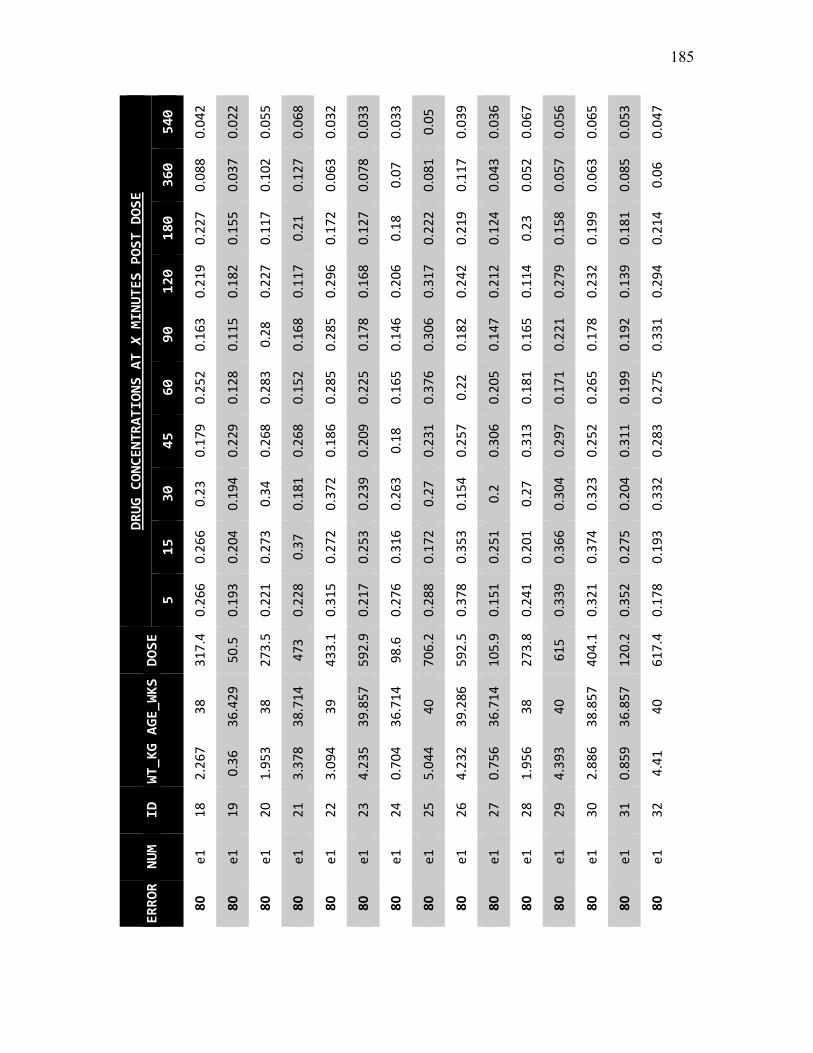
185
DRUG CONCENTRATIONS AT X
MINUTES POST DOSE
540
0.04
2
0.02
2
0.05
5
0.06
8
0.03
2
0.03
3
0.03
3
0.05
0.03
9
0.03
6
0.06
7
0.05
6
0.06
5
0.05
3
0.04
7
360
0.08
8
0.03
7
0.10
2
0.12
7
0.06
3
0.07
8
0.07
0.08
1
0.11
7
0.04
3
0.05
2
0.05
7
0.06
3
0.08
5
0.06
180
0.22
7
0.15
5
0.11
7
0.21
0.17
2
0.12
7
0.18
0.22
2
0.21
9
0.12
4
0.23
0.15
8
0.19
9
0.18
1
0.21
4
120
0.21
9
0.18
2
0.22
7
0.11
7
0.29
6
0.16
8
0.20
6
0.31
7
0.24
2
0.21
2
0.11
4
0.27
9
0.23
2
0.13
9
0.29
4
90
0.16
3
0.11
5
0.28
0.16
8
0.28
5
0.17
8
0.14
6
0.30
6
0.18
2
0.14
7
0.16
5
0.22
1
0.17
8
0.19
2
0.33
1
60
0.25
2
0.12
8
0.28
3
0.15
2
0.28
5
0.22
5
0.16
5
0.37
6
0.22
0.20
5
0.18
1
0.17
1
0.26
5
0.19
9
0.27
5
45
0.17
9
0.22
9
0.26
8
0.26
8
0.18
6
0.20
9
0.18
0.23
1
0.25
7
0.30
6
0.31
3
0.29
7
0.25
2
0.31
1
0.28
3
30
0.23
0.19
4
0.34
0.18
1
0.37
2
0.23
9
0.26
3
0.27
0.15
4
0.2
0.27
0.30
4
0.32
3
0.20
4
0.33
2
15
0.26
6
0.20
4
0.27
3
0.37
0.27
2
0.25
3
0.31
6
0.17
2
0.35
3
0.25
1
0.20
1
0.36
6
0.37
4
0.27
5
0.19
3
5
0.26
6
0.19
3
0.22
1
0.22
8
0.31
5
0.21
7
0.27
6
0.28
8
0.37
8
0.15
1
0.24
1
0.33
9
0.32
1
0.35
2
0.17
8
DOSE
317.
4
50.5
273.
5
473
433.
1
592.
9
98.6
706.
2
592.
5
105.
9
273.
8
615
404.
1
120.
2
617.
4
AGE_WKS
38
36.4
29
38
38.7
14
39
39.8
57
36.7
14
40
39.2
86
36.7
14
38
40
38.8
57
36.8
57
40
WT_KG
2.26
7
0.36
1.95
3
3.37
8
3.09
4
4.23
5
0.70
4
5.04
4
4.23
2
0.75
6
1.95
6
4.39
3
2.88
6
0.85
9
4.41
ID
18
19
20
21
22
23
24
25
26
27
28
29
30
31
32
NUM
e1
e1
e1
e1
e1
e1
e1
e1
e1
e1
e1
e1
e1
e1
e1
ERROR
80
80
80
80
80
80
80
80
80
80
80
80
80
80
80

186
DRUG CONCENTRATIONS AT X
MINUTES POST DOSE
540
0.05
8
0.02
5
0.06
8
0.07
1
0.02
9
0.04
6
0.08
0.06
1
0.04
1
0.04
7
0.06
5
0.02
7
0.03
0.04
2
0.05
4
360
0.11
8
0.11
3
0.11
7
0.08
4
0.12
4
0.06
9
0.13
7
0.05
7
0.06
9
0.09
9
0.08
8
0.08
4
0.08
3
0.09
5
0.07
7
180
0.15
9
0.16
9
0.16
5
0.13
6
0.19
7
0.18
8
0.21
2
0.16
5
0.16
1
0.15
2
0.18
4
0.11
0.16
7
0.16
3
0.18
120
0.24
4
0.14
5
0.16
2
0.13
7
0.18
4
0.17
7
0.18
6
0.25
3
0.20
6
0.21
2
0.13
4
0.16
7
0.23
0.15
8
0.23
9
90
0.30
4
0.13
4
0.17
0.19
0.28
3
0.23
5
0.24
2
0.30
7
0.29
4
0.24
7
0.15
8
0.17
7
0.22
9
0.22
5
0.20
9
60
0.27
4
0.17
4
0.15
3
0.18
3
0.2
0.14
8
0.29
5
0.22
1
0.27
0.14
6
0.14
2
0.26
5
0.13
7
0.19
0.12
6
45
0.23
8
0.14
7
0.29
3
0.28
5
0.19
6
0.21
8
0.21
4
0.19
9
0.23
1
0.19
8
0.25
2
0.30
1
0.26
6
0.27
3
0.24
6
30
0.24
4
0.19
9
0.34
3
0.23
7
0.32
2
0.17
3
0.26
1
0.26
6
0.31
4
0.28
7
0.19
8
0.23
4
0.33
4
0.16
3
0.26
3
15
0.31
5
0.30
2
0.22
8
0.32
5
0.36
4
0.17
2
0.22
4
0.15
7
0.28
6
0.24
9
0.23
0.13
8
0.24
9
0.16
9
0.15
6
5
0.36
8
0.36
2
0.29
4
0.18
5
0.22
4
0.44
2
0.38
6
0.17
5
0.33
4
0.40
9
0.32
7
0.33
2
0.32
9
0.29
2
0.18
2
DOSE
317.
5
315
555.
2
374
618.
9
478.
5
437.
8
297.
6
272.
6
318.
5
570
72.9
91.6
79.5
222.
9
AGE_WKS
38.1
43
37.8
57
39.5
71
38.2
86
39.8
57
39.1
43
38.5
71
38.1
43
37.8
57
38.1
43
39.5
71
36.5
71
36.7
14
36.5
71
37.5
71
WT_KG
2.26
8
2.25
3.96
6
2.67
1
4.42
1
3.41
8
3.12
7
2.12
6
1.94
7
2.27
5
4.07
1
0.52
1
0.65
4
0.56
8
1.59
2
ID
33
34
35
36
37
38
39
40
41
42
43
44
45
46
47
NUM
e1
e1
e1
e1
e1
e1
e1
e1
e1
e1
e1
e1
e1
e1
e1
ERROR
80
80
80
80
80
80
80
80
80
80
80
80
80
80
80

187
DRUG CONCENTRATIONS AT X
MINUTES POST DOSE
540
0.04
2
0.06
0.04
0.03
1
0.02
7
0.05
3
0.06
7
0.05
0.03
2
0.03
5
0.03
6
0.06
5
0.04
5
0.03
6
0.03
9
360
0.08
8
0.12
4
0.10
3
0.07
7
0.07
9
0.13
4
0.07
7
0.06
3
0.11
3
0.06
0.07
9
0.06
2
0.10
3
0.07
5
0.08
4
180
0.11
1
0.18
1
0.11
5
0.24
0.07
3
0.11
6
0.16
7
0.15
8
0.11
1
0.10
7
0.13
1
0.25
0.18
0.23
4
0.15
2
120
0.22
8
0.27
4
0.23
7
0.24
2
0.15
6
0.31
4
0.26
9
0.14
0.16
3
0.16
9
0.19
0.26
9
0.15
4
0.28
8
0.15
7
90
0.19
6
0.26
5
0.17
1
0.17
4
0.23
2
0.30
8
0.17
8
0.32
3
0.22
0.22
3
0.16
0.31
6
0.24
4
0.22
3
0.29
4
60
0.18
2
0.18
6
0.22
5
0.16
4
0.26
7
0.30
8
0.15
0.31
2
0.33
2
0.25
7
0.29
7
0.33
4
0.26
4
0.35
9
0.28
6
45
0.18
5
0.32
4
0.24
4
0.31
1
0.20
5
0.19
7
0.25
8
0.38
3
0.29
8
0.31
9
0.23
0.27
0.38
0.22
7
0.35
8
30
0.32
9
0.22
9
0.39
5
0.25
4
0.32
2
0.41
7
0.26
3
0.36
1
0.15
9
0.15
9
0.20
8
0.26
7
0.19
8
0.36
5
0.15
4
15
0.16
3
0.34
4
0.33
7
0.23
6
0.18
0.35
6
0.20
2
0.26
0.23
4
0.17
5
0.29
3
0.29
5
0.18
9
0.21
0.28
2
5
0.19
4
0.25
3
0.38
0.22
4
0.31
9
0.32
5
0.31
6
0.29
1
0.34
4
0.23
1
0.38
7
0.30
4
0.39
0.33
0.35
7
DOSE
277.
4
561.
9
361.
8
605.
8
60.6
606.
4
218.
2
436.
6
304.
2
271.
6
154.
8
487.
3
570.
2
393.
5
218.
7
AGE_WKS
38
40
38.5
71
39.5
71
36.4
29
39.8
57
37.5
71
38.8
57
37.7
14
37.5
71
37
38.7
14
39.7
14
38.4
29
37.2
86
WT_KG
1.98
1
4.01
3
2.58
5
4.32
7
0.43
3
4.33
1
1.55
8
3.11
9
2.17
3
1.94
1.10
5
3.48
4.07
3
2.81
1
1.56
2
ID
48
49
50
51
52
53
54
55
56
57
58
59
60
61
62
NUM
e1
e1
e1
e1
e1
e1
e1
e1
e1
e1
e1
e1
e1
e1
e1
ERROR
80
80
80
80
80
80
80
80
80
80
80
80
80
80
80

188
DRUG CONCENTRATIONS AT X
MINUTES POST DOSE
540
0.04
1
0.05
9
0.05
6
0.04
0.03
5
0.05
1
0.04
2
0.05
0.03
3
0.02
7
0.06
7
0.05
0.06
3
0.03
3
0.02
6
360
0.04
5
0.09
2
0.09
4
0.08
0.08
5
0.11
9
0.11
9
0.11
8
0.06
4
0.09
1
0.07
5
0.07
1
0.09
1
0.09
6
0.07
8
180
0.08
9
0.15
7
0.17
2
0.12
7
0.15
9
0.18
3
0.19
6
0.23
6
0.20
9
0.16
9
0.22
0.09
2
0.17
1
0.13
9
0.18
5
120
0.21
9
0.27
4
0.19
2
0.15
9
0.09
3
0.13
3
0.19
5
0.28
5
0.11
8
0.21
9
0.28
0.14
8
0.23
3
0.21
2
0.22
4
90
0.16
3
0.24
9
0.19
3
0.14
1
0.19
9
0.28
7
0.17
5
0.27
4
0.14
6
0.19
7
0.3
0.27
8
0.31
5
0.26
3
0.16
4
60
0.22
4
0.14
5
0.23
9
0.15
0.23
7
0.22
1
0.20
1
0.22
1
0.29
3
0.28
6
0.26
3
0.17
6
0.30
3
0.35
3
0.18
2
45
0.20
9
0.25
3
0.20
6
0.19
1
0.29
6
0.20
5
0.31
2
0.23
0.21
1
0.14
0.16
2
0.32
3
0.28
7
0.18
3
0.27
6
30
0.19
7
0.22
0.23
7
0.16
6
0.30
4
0.19
5
0.30
1
0.18
2
0.23
7
0.34
0.32
9
0.34
5
0.35
8
0.33
4
0.16
4
15
0.30
6
0.36
5
0.37
5
0.27
5
0.26
4
0.22
6
0.22
7
0.33
1
0.26
8
0.13
8
0.36
6
0.20
9
0.22
3
0.31
5
0.30
7
5
0.29
4
0.28
1
0.36
2
0.36
8
0.28
2
0.34
4
0.23
5
0.15
9
0.28
7
0.17
5
0.31
7
0.33
7
0.28
5
0.41
8
0.26
DOSE
70.7
403.
7
647.
1
122.
4
65.3
290.
7
419.
2
346.
7
302.
4
114.
2
363.
6
162
299.
8
418.
6
77.3
AGE_WKS
36.5
71
38.2
86
40
36.8
57
36.4
29
38
38.5
71
38.1
43
38.1
43
36.7
14
38.7
14
37.1
43
38.1
43
38.4
29
36.5
71
WT_KG
0.50
5
2.88
3
4.62
2
0.87
4
0.46
7
2.07
6
2.99
4
2.47
6
2.16
0.81
6
2.59
7
1.15
7
2.14
1
2.99
0.55
2
ID
63
64
65
66
67
68
69
70
71
72
73
74
75
76
77
NUM
e1
e1
e1
e1
e1
e1
e1
e1
e1
e1
e1
e1
e1
e1
e1
ERROR
80
80
80
80
80
80
80
80
80
80
80
80
80
80
80

189
DRUG CONCENTRATIONS AT X
MINUTES POST DOSE
540
0.06
3
0.04
3
0.02
9
0.04
3
0.03
8
0.02
4
0.06
3
0.04
6
0.04
7
0.02
1
0.06
2
0.05
5
0.03
5
0.05
8
0.03
360
0.08
9
0.11
3
0.08
4
0.08
2
0.04
9
0.08
4
0.12
6
0.13
3
0.06
0.12
6
0.07
1
0.06
7
0.07
0.13
7
0.09
8
180
0.12
0.13
8
0.20
6
0.11
6
0.16
5
0.13
6
0.19
5
0.11
3
0.12
6
0.19
6
0.13
3
0.13
2
0.12
4
0.13
4
0.14
8
120
0.22
2
0.26
2
0.14
9
0.18
2
0.19
3
0.11
5
0.14
2
0.29
2
0.14
5
0.27
1
0.23
6
0.28
1
0.11
3
0.16
7
0.25
7
90
0.25
5
0.20
5
0.17
6
0.18
7
0.21
3
0.15
4
0.24
2
0.29
7
0.20
2
0.24
6
0.3
0.23
1
0.12
3
0.32
2
0.15
8
60
0.24
2
0.22
5
0.27
1
0.14
6
0.30
2
0.22
9
0.27
4
0.31
8
0.28
5
0.18
7
0.22
9
0.29
0.23
9
0.28
8
0.18
4
45
0.24
9
0.18
9
0.29
3
0.27
7
0.27
5
0.23
2
0.37
9
0.34
1
0.22
3
0.24
1
0.28
6
0.31
8
0.19
6
0.26
2
0.34
4
30
0.31
2
0.30
6
0.29
5
0.24
8
0.19
5
0.33
5
0.38
5
0.38
7
0.13
8
0.33
4
0.31
0.31
0.21
3
0.27
0.31
7
15
0.17
0.21
0.19
1
0.33
5
0.35
2
0.15
0.17
9
0.16
6
0.34
9
0.38
5
0.24
8
0.35
4
0.21
0.24
8
0.27
6
5 0.2
0.24
6
0.34
7
0.34
6
0.17
2
0.16
0.29
8
0.32
8
0.28
9
0.19
7
0.28
3
0.16
2
0.31
5
0.19
1
0.34
6
DOSE
458.
7
223.
8
170.
6
83
199.
5
167.
4
540.
7
515.
1
142.
4
268.
8
631.
2
271.
6
82.8
546.
6
171.
8
AGE_WKS
39
37.5
71
37
36.5
71
37.4
29
37.1
43
40
39.1
43
36.8
57
37.7
14
39.5
71
37.5
71
36.5
71
39.2
86
37
WT_KG
3.27
6
1.59
9
1.21
9
0.59
3
1.42
5
1.19
6
3.86
2
3.67
9
1.01
7
1.92
4.50
8
1.94
0.59
1
3.90
4
1.22
7
ID
78
79
80
81
82
83
84
85
86
87
88
89
90
91
92
NUM
e1
e1
e1
e1
e1
e1
e1
e1
e1
e1
e1
e1
e1
e1
e1
ERROR
80
80
80
80
80
80
80
80
80
80
80
80
80
80
80

190
DRUG CONCENTRATIONS AT X
MINUTES POST DOSE
540
0.06
0.03
2
0.04
0.05
4
0.05
6
0.05
9
0.06
5
0.05
6
0.03
9
0.06
0.04
8
0.04
3
0.03
1
0.05
7
0.04
7
360
0.07
8
0.13
3
0.05
1
0.06
6
0.05
8
0.10
2
0.07
0.10
3
0.10
7
0.11
6
0.11
1
0.11
2
0.07
6
0.05
9
0.11
5
180
0.11
4
0.19
0.17
7
0.11
7
0.23
7
0.11
3
0.19
4
0.20
2
0.12
2
0.10
9
0.20
6
0.11
9
0.13
4
0.21
4
0.16
2
120
0.21
3
0.22
4
0.18
5
0.28
8
0.25
7
0.12
0.12
9
0.17
4
0.21
4
0.18
8
0.16
4
0.25
7
0.22
1
0.22
7
0.23
6
90
0.12
7
0.15
7
0.21
1
0.32
2
0.30
5
0.25
4
0.26
3
0.28
5
0.28
5
0.24
9
0.26
5
0.20
3
0.22
4
0.24
2
0.19
60
0.22
4
0.17
4
0.20
5
0.32
5
0.17
5
0.34
1
0.16
3
0.26
7
0.25
9
0.19
9
0.31
0.23
8
0.12
1
0.28
4
0.17
7
45
0.31
8
0.3
0.13
9
0.21
8
0.20
6
0.31
7
0.16
4
0.31
7
0.19
0.20
3
0.26
3
0.31
7
0.14
1
0.33
0.22
3
30
0.23
2
0.28
8
0.16
5
0.33
1
0.16
6
0.19
8
0.37
3
0.19
7
0.15
2
0.23
1
0.23
3
0.18
3
0.16
2
0.19
0.14
9
15
0.27
3
0.25
3
0.28
5
0.22
8
0.41
5
0.20
5
0.33
5
0.22
8
0.29
8
0.33
9
0.41
9
0.23
7
0.20
5
0.31
3
0.38
5
0.17
8
0.38
0.21
2
0.23
0.23
6
0.40
2
0.37
0.17
5
0.36
7
0.18
5
0.36
1
0.19
3
0.26
1
0.37
6
0.21
5
DOSE
337.
7
491.
2
175.
5
335.
3
625.
8
399.
6
361.
7
428.
9
179.
3
543.
8
486.
5
173.
5
56.1
218.
6
187.
9
AGE_WKS
38.4
29
39.2
86
37.1
43
38
40
38.2
86
38.2
86
38.8
57
37.1
43
39.4
29
39.4
29
37.1
43
36.4
29
37.5
71
37.2
86
WT_KG
2.41
2
3.50
8
1.25
4
2.39
5
4.47
2.85
5
2.58
3
3.06
4
1.28
3.88
4
3.47
5
1.23
9
0.40
1
1.56
1
1.34
2
ID
93
94
95
96
97
98
99
100
101
102
103
104
105
106
107
NUM
e1
e1
e1
e1
e1
e1
e1
e1
e1
e1
e1
e1
e1
e1
e1
ERROR
80
80
80
80
80
80
80
80
80
80
80
80
80
80
80

191
DRUG CONCENTRATIONS AT X
MINUTES POST DOSE
540
0.03
4
0.02
6
0.02
0.04
6
0.04
1
0.03
1
0.05
1
0.01
9
0.05
1
0.06
3
0.06
4
0.06
1
0.02
2
0.05
0.04
360
0.10
2
0.08
3
0.06
3
0.03
8
0.05
9
0.11
8
0.10
6
0.07
7
0.07
0.10
3
0.05
3
0.11
5
0.03
6
0.08
8
0.07
3
180
0.09
7
0.20
9
0.22
6
0.16
0.21
0.14
7
0.17
0.15
4
0.2
0.19
1
0.23
4
0.19
9
0.09
2
0.18
2
0.14
2
120
0.23
9
0.25
3
0.19
5
0.10
6
0.20
2
0.21
9
0.14
8
0.13
0.15
7
0.23
4
0.22
7
0.20
1
0.18
3
0.20
6
0.15
8
90
0.26
9
0.13
2
0.16
4
0.18
4
0.12
6
0.19
9
0.12
9
0.20
8
0.14
0.22
7
0.20
7
0.19
0.14
6
0.24
5
0.14
7
60
0.17
6
0.21
8
0.29
8
0.23
2
0.17
4
0.31
8
0.32
4
0.14
8
0.23
9
0.26
0.14
8
0.20
3
0.14
3
0.18
4
0.18
2
45
0.27
8
0.17
4
0.30
6
0.17
5
0.23
5
0.24
3
0.20
1
0.10
7
0.13
1
0.35
7
0.20
4
0.35
1
0.19
6
0.25
0.30
9
30
0.34
1
0.29
9
0.24
9
0.34
9
0.37
7
0.19
9
0.34
6
0.14
6
0.35
9
0.30
4
0.37
0.28
0.14
2
0.29
5
0.31
3
15
0.25
0.33
9
0.37
1
0.27
3
0.37
1
0.38
5
0.19
2
0.32
8
0.37
3
0.26
3
0.35
9
0.34
4
0.31
4
0.23
9
0.19
7
5
0.20
3
0.36
9
0.37
5
0.17
2
0.38
2
0.31
4
0.41
0.21
0.19
3
0.37
8
0.39
9
0.28
7
0.14
3
0.36
7
0.29
9
DOSE
129.
6
530.
1
265.
2
127.
8
267.
1
265.
6
363.
3
52.7
198.
9
464.
6
384.
7
575.
7
51.1
161
171.
8
AGE_WKS
36.8
57
39.4
29
37.8
57
37
37.7
14
38
38.2
86
36.4
29
37.2
86
38.5
71
38.4
29
39.2
86
36.4
29
37
37
WT_KG
0.92
6
3.78
6
1.89
5
0.91
3
1.90
8
1.89
7
2.59
5
0.37
6
1.42
3.31
8
2.74
8
4.11
2
0.36
5
1.15
1.22
7
ID
108
109
110
111
112
113
114
115
116
117
118
119
120
121
122
NUM
e1
e1
e1
e1
e1
e1
e1
e1
e1
e1
e1
e1
e1
e1
e1
ERROR
80
80
80
80
80
80
80
80
80
80
80
80
80
80
80

192
DRUG CONCENTRATIONS AT X
MINUTES POST DOSE
540
0.04
7
0.04
5
0.03
4
0.04
0.05
0.05
3
0.03
5
0.04
5
0.05
4
0.04
1
0.05
1
0.04
9
0.03
5
0.06
2
0.03
3
360
0.06
9
0.09
0.10
9
0.1
0.10
6
0.07
6
0.08
9
0.08
2
0.11
7
0.06
2
0.09
0.07
2
0.04
4
0.13
3
0.05
7
180
0.22
7
0.11
8
0.12
8
0.17
0.16
6
0.09
2
0.21
2
0.16
7
0.20
1
0.19
5
0.21
6
0.16
5
0.16
7
0.22
4
0.12
6
120
0.25
8
0.09
0.12
2
0.12
3
0.25
0.17
0.14
5
0.17
2
0.26
9
0.13
0.13
1
0.16
0.14
1
0.20
8
0.18
6
90
0.30
1
0.11
9
0.29
0.19
3
0.14
9
0.30
7
0.21
6
0.19
0.26
2
0.18
4
0.16
1
0.18
8
0.24
2
0.12
7
0.12
3
60
0.16
3
0.12
5
0.13
5
0.21
2
0.29
8
0.32
4
0.15
3
0.20
1
0.17
2
0.18
9
0.31
6
0.28
8
0.13
2
0.21
5
0.21
45
0.36
1
0.13
0.28
5
0.35
5
0.24
7
0.15
9
0.28
3
0.19
4
0.20
5
0.20
5
0.17
1
0.28
5
0.16
8
0.36
0.16
5
30
0.39
5
0.29
5
0.27
6
0.22
0.18
4
0.19
9
0.32
1
0.25
8
0.29
1
0.24
3
0.23
8
0.31
0.28
4
0.20
2
0.20
7
15
0.29
8
0.22
1
0.38
2
0.17
0.32
1
0.22
5
0.27
4
0.43
5
0.21
5
0.16
6
0.30
5
0.21
8
0.21
2
0.20
4
0.21
4
5
0.36
2
0.17
8
0.15
6
0.34
9
0.17
4
0.24
2
0.41
1
0.25
0.19
8
0.28
2
0.35
2
0.39
9
0.31
1
0.45
1
0.35
7
DOSE
416.
4
71.4
221.
5
619.
9
258.
8
292.
9
305.
3
558.
2
478
216.
2
489.
9
363.
6
53.8
530.
3
160.
7
AGE_WKS
38.5
71
36.5
71
37.4
29
40
37.8
57
38.1
43
38.2
86
39.5
71
38.8
57
37.5
71
38.7
14
38.7
14
36.4
29
39.2
86
37
WT_KG
2.97
5
0.51
1.58
2
4.42
8
1.84
9
2.09
2
2.18
1
3.98
7
3.41
4
1.54
4
3.49
9
2.59
7
0.38
4
3.78
8
1.14
8
ID
123
124
125
126
127
128
129
130
131
132
133
134
135
136
137
NUM
e1
e1
e1
e1
e1
e1
e1
e1
e1
e1
e1
e1
e1
e1
e1
ERROR
80
80
80
80
80
80
80
80
80
80
80
80
80
80
80

193
DRUG CONCENTRATIONS AT X
MINUTES POST DOSE
540
0.04
3
0.05
6
0.05
4
0.06
6
0.04
4
0.06
3
0.05
9
0.04
7
0.06
1
0.05
8
0.04
9
0.03
0.05
0.02
9
0.03
2
360
0.10
8
0.14
7
0.08
1
0.07
1
0.12
4
0.11
2
0.09
6
0.10
8
0.12
3
0.10
4
0.07
6
0.07
2
0.05
5
0.05
3
0.11
5
180
0.22
2
0.10
6
0.13
9
0.17
0.15
8
0.2
0.12
2
0.16
9
0.10
8
0.18
6
0.10
2
0.07
5
0.19
5
0.10
7
0.17
5
120
0.21
8
0.12
7
0.3
0.14
5
0.13
9
0.14
2
0.12
6
0.16
0.12
2
0.25
8
0.20
1
0.14
9
0.24
3
0.12
7
0.11
5
90
0.26
4
0.16
3
0.34
2
0.31
4
0.20
2
0.24
6
0.20
9
0.21
2
0.29
3
0.13
9
0.22
4
0.25
0.13
8
0.17
7
0.20
8
60
0.24
2
0.22
0.36
6
0.19
2
0.19
8
0.30
2
0.30
4
0.22
6
0.21
8
0.21
6
0.21
9
0.16
8
0.25
5
0.27
7
0.29
5
45
0.32
6
0.21
7
0.15
2
0.35
4
0.26
5
0.25
7
0.31
8
0.22
7
0.26
7
0.31
1
0.14
8
0.17
8
0.17
9
0.28
9
0.35
6
30
0.14
8
0.31
6
0.21
0.14
9
0.29
0.30
9
0.22
0.17
2
0.26
3
0.32
6
0.28
7
0.23
1
0.17
2
0.15
9
0.21
2
15
0.23
3
0.31
9
0.22
8
0.28
9
0.20
4
0.25
7
0.25
4
0.22
2
0.22
9
0.26
0.16
4
0.31
5
0.38
6
0.26
2
0.29
6
5
0.26
3
0.22
0.31
2
0.35
3
0.21
3
0.30
7
0.17
2
0.26
4
0.28
4
0.30
8
0.34
8
0.21
7
0.33
5
0.27
9
0.21
7
DOSE
425.
9
605.
9
635.
8
300.
4
449.
4
551.
6
415.
8
244.
9
277.
3
193.
6
115.
9
85.9
347.
6
111.
8
287.
2
AGE_WKS
39.1
43
39.5
71
39.8
57
37.7
14
39.1
43
39.4
29
38.7
14
37.5
71
38
37.2
86
36.7
14
36.5
71
38.4
29
36.7
14
37.7
14
WT_KG
3.04
2
4.32
8
4.54
2
2.14
6
3.21
3.94
2.97
1.74
9
1.98
1
1.38
3
0.82
8
0.61
4
2.48
3
0.79
8
2.05
1
ID
138
139
140
141
142
143
144
145
146
147
148
149
150
151
152
NUM
e1
e1
e1
e1
e1
e1
e1
e1
e1
e1
e1
e1
e1
e1
e1
ERROR
80
80
80
80
80
80
80
80
80
80
80
80
80
80
80

194
DRUG CONCENTRATIONS AT X
MINUTES POST DOSE
540
0.03
8
0.07
7
0.03
3
0.04
9
0.03
1
0.03
6
0.01
9
0.07
9
360
0.08
2
0.04
8
0.07
4
0.07
3
0.07
7
0.04
4
0.07
7
0.08
180
0.14
5
0.24
2
0.16
6
0.07
4
0.16
0.18
1
0.07
7
0.24
120
0.24
8
0.23
7
0.24
6
0.17
5
0.20
6
0.24
2
0.19
2
0.22
3
90
0.15
8
0.17
0.27
2
0.18
2
0.28
6
0.14
8
0.12
7
0.20
5
60
0.14
6
0.27
8
0.26
9
0.18
7
0.22
6
0.17
7
0.18
1
0.17
7
45
0.27
1
0.21
3
0.27
2
0.21
1
0.16
0.27
3
0.29
4
0.32
4
30
0.27
4
0.29
4
0.28
9
0.31
8
0.29
4
0.23
4
0.29
9
0.36
6
15
0.27
5
0.35
7
0.15
5
0.18
9
0.37
6
0.35
2
0.24
7
0.29
6
5
0.14
3
0.42
1
0.16
2
0.22
9
0.20
2
0.29
7
0.20
2
0.28
1
DOSE
117.
6
385.
5
114
104.
6
256.
9
136.
3
61.2
408.
1
AGE_WKS
36.7
14
38.4
29
36.7
14
36.7
14
37.5
71
36.8
57
36.4
29
38.4
29
WT_KG
0.84
2.75
3
0.81
4
0.74
7
1.83
5
0.97
4
0.43
7
2.91
5
ID
153
154
155
156
157
158
159
160
NUM
e1
e1
e1
e1
e1
e1
e1
e1
ERROR
80
80
80
80
80
80
80
80