Embed Size (px)
Citation preview

Pharmacology of integrase inhibitors
Laura Waters
CNWL, Mortimer Market Centre
London, UK
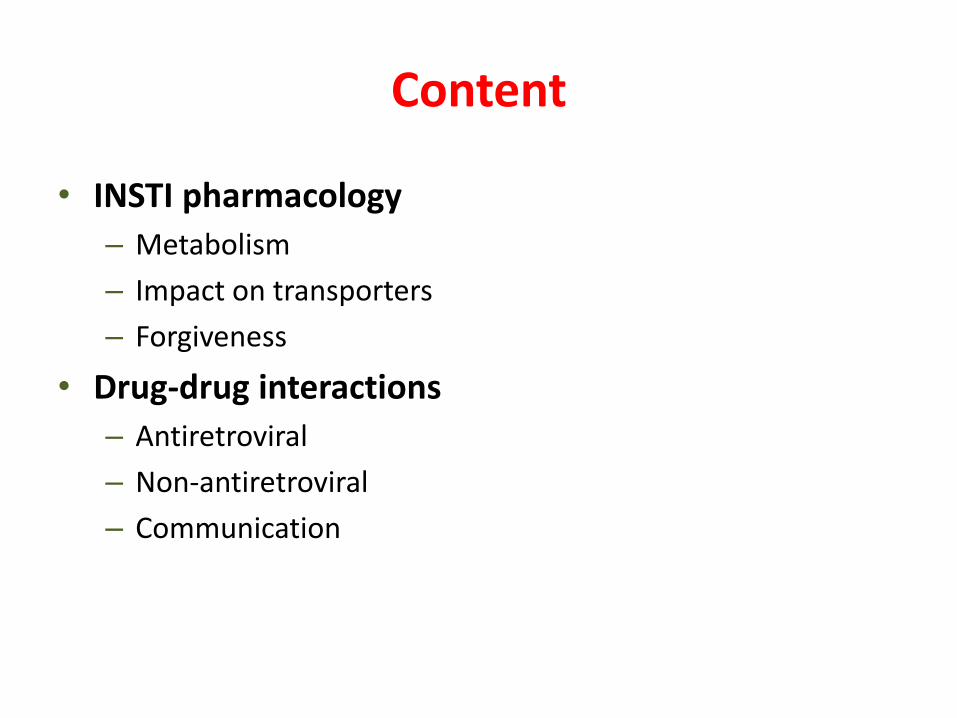
Content
• INSTI pharmacology
– Metabolism
– Impact on transporters
– Forgiveness
• Drug-drug interactions
– Antiretroviral
– Non-antiretroviral
– Communication

Apology
DRUG PHARMACOLOGY BASICS

Absorption from gut:includes passive diffusion & diffusion or pumping via transporters
Distribution: in plasma & other compartments; depends on molecule size,
protein binding & other characteristics
Metabolism: mainly liver & usually to less active/inactive
affected by enzyme induction/inhibition, genetics, age, gender, liver disease
Excretion: mainly renal (glomerular filtration, active tubular secretion)
affected by age, transporter competition/inhibition

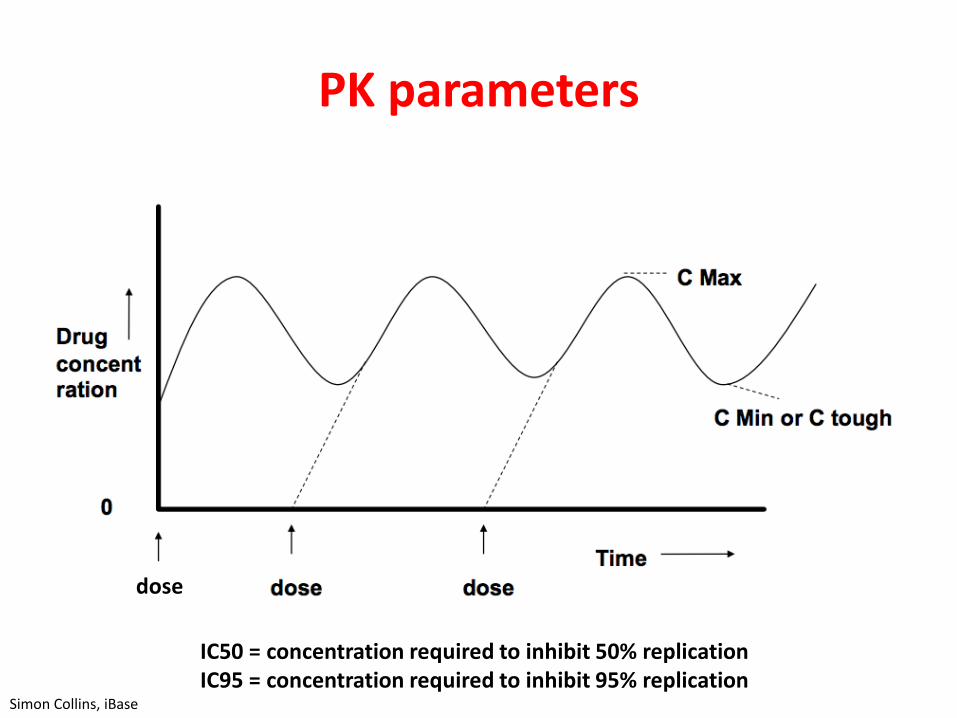
PK parameters
Simon Collins, iBase
PK parameters
dose
Simon Collins, iBase
IC50 = concentration required to inhibit 50% replicationIC95 = concentration required to inhibit 95% replication

PK parameters
Simon Collins, iBase

PHARMACOLOGY OF INSTI

RALTEGRAVIR ELVITEGRAVIR DOLUTEGRAVIR BICTEGRAVIR
Clinical dose 400 mg BID OR 1200 mg QD
150 mg QD boosted with cobi+ FTC/TDF or TAF
50 mg QD (INI-naïve), BID (INI-resistant)
50 mg QD with FTC/TAF
Metabolism and Excretion
UGT1A1renal elimination
~ 9%
CYP3A (major), UGT1A1/3
(minor), renal elimination ~7%
UGT1A1 (major), CYP3A (minor),
renal elimination <1%.
UGT1A1 and CYP3A (equal)
renal elimination <1%.
Renal transporters
Weak inhibition OCT2
COBI inhibits MATE-1
Inhibition of OCT2 & MATE-1
Limited inhibition of OCT2 & MATE-
1
Half Life t1/2 ~9 hours ~12.9 hours (boosted)
~14 hours ~18 hours
DDI Potential Least Highest Slightly greater than RAL
Moderate
1. Tivicay SmPC updated October 2015. 2. Min S, et al. Antimicrob Agents Chemother 2010;54:254–8. 3. Min S, et al. AIDS 2011;25:1737–45.4. Isentress SmPC July 2015; 5. Stribild SmPC updated June 2015); 6. Ramanathan S, et al. Clin Pharmacokinet 2011;50:229–44.
Clinical Pharmacology Profile of InSTI

Raltegravir OD vs BD
Rizk ML at al. AAC 2012: 56(6): 3101-3106
QDMRKfailure to achieve VL<50 mainly at
high baseline VL in both arms also associated with lower Ctrough
in the 800-mg-QD arm

Raltegravir 600mg vs 400mg
• 600mg has higher relative bioavailability vs 400 mg
– likely due, at least in part, to improvements in tablet disintegration/dissolution
• Once absorbed, both forms show similar pharmacokinetics:
– Steady-state in around two days
– Little to no accumulation with multiple doses
• Food had no clinically relevant effect on raltegravir exposure
https://www.sps.nhs.uk/wp-content/uploads/2018/03/Raltegravir-600-mg-once-daily-Final-Feb-2018.pdf accessed 3rd October 2018
ONCEMRK
RAL 1200 OD non-inferior to 400 BD

It’s not just plasma half-life….
• Once the INSTI it binds to the integrase enzyme & the speed the drug unbinds = dissociation half-life
White K et al. CROI 2017

Impact of food on drug absorption
• Food may have no effect or may change the rate or extent of drug absorption by following mechanisms:
– Altered pH
– Altered gastric emptying
– Stimulation of gastro-intestinal secretions
– Altered drug bioavailability
– Increased blood flow
– Competition for transporters
– Increased viscosity of gastric contents
– Complex formation between drug & food components

Why is this important?
• Counselling patients
• Utilising data to alter exposure:
– Overcoming resistance
– Managing side effects????

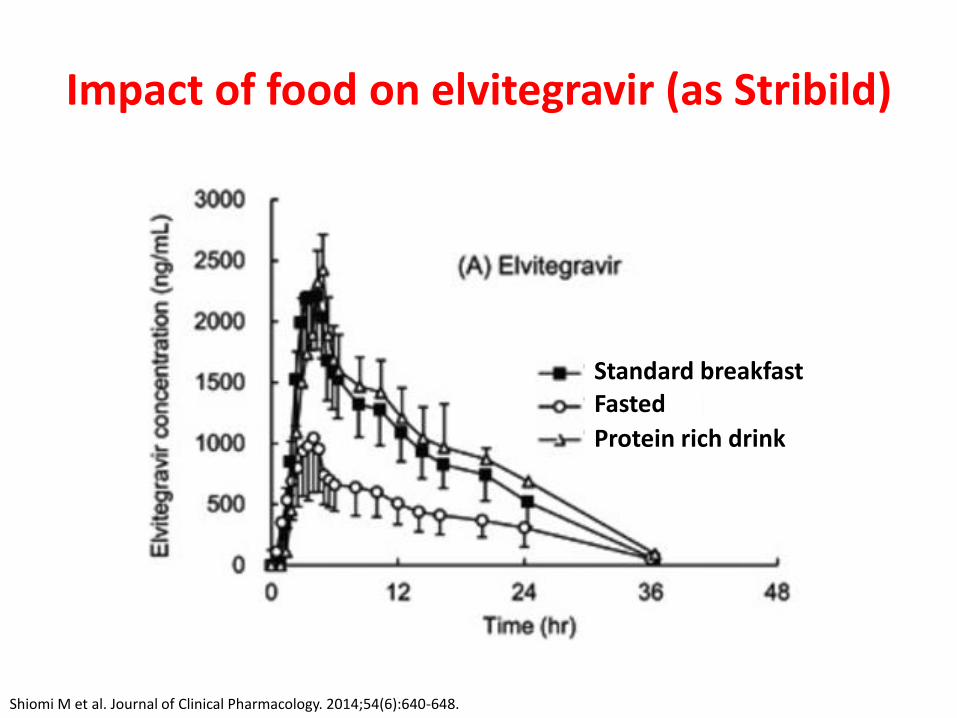
Impact of food on elvitegravir (as Stribild)
Effect of Food on Pharmacokinetics of Elvitegravir, Emtricitabine, Tenofovir DF and the
Pharmacoenhancer GS-9350 as a Fixed- Dose Combination Tablet
P German,1 D Warren,1 L Wei,1 L Zhong,1 J Hui,2 and BP Kearney1
1Gilead Sciences, Inc., Foster City, CA, USA; 2Gilead Sciences, Inc., Durham, NC, USA
EVG exposures were increased with •
food vs. fasted state
GS-9350 exposures were lower with high calorie/ •
high fat meal relative to light meal or fasted
administration
Lower GS-9350 exposures with high calorie/ –
high fat meal did not adversely affect EVG
exposures
TFV and FTC PK were consistent with their •
established profi les
FTC exposures were bioequivalent –
TFV exposures were slightly higher with food –
vs. fasted state
EVG/FTC/TDF/GS-9350 FDC should be •
administered with food to provide desired EVG
exposures
49th Interscience Conference on
Antimicrobial Agents and Chemotherapy (ICAAC)
September 12-15, 2009
San Francisco, CA USA
Poster Number
A1-1300
Conclusions
References
Gilead’s investigational HIV-1 integrase inhibitor, elvitegravir •
(EVG), is primarily metabolized by CYP3A enzymes
GS-9350 lacks antiretroviral activity and is in development as •
a pharmacoenhancer (booster) to increase the systemic levels
of coadministered CYP3A substrates, such as EVG and HIV
protease inhibitors (PIs)
GS-9350 may be an alternative to ritonavir (R TV) as the •
pharmacoenhancer of EVG
Administration of a single unboosted 400 mg EVG dose results in •
Cmax
and AUCinf
increases of 3.3-fold and 2.7-fold, respectively in
the fed (575 kcal, 33% fat) versus fasted state 1
The current dosing recommendation for RTV-boosted EVG is •
administration with a meal to improve pharmacokinetics (PK) and
tolerability and due to its concurrent administration with R TV-
boosted PIs
HIV-1 uninfected healthy subjects (N=24) were randomized to •
receive single doses of FDC fasted, with a light meal (373 kcal,
20% fat), and with a high fat meal (800 kcal, 50% fat)
Each treatment was followed by a 1-week washout•
Blood was collected over 48 hours post-dosing for the evaluation •
of EVG, FTC, TFV, and GS-9350 PK
Plasma concentrations were measured by validated LC/MS/MS•
PK parameters were estimated via non-compartmental analysis •
using WinNonlin™ 5.2 (Pharsight Corporation, Mountain V iew,
CA, USA)
Geometric least-squares means ratios and 90% CIs for •
AUCinf
, AUClast
and Cmax
were estimated using ANOVA with PK
equivalence boundaries of 80-125%
Primary:
To evaluate the pharmacokinetics of EVG, FTC, TFV and GS-9350, •
administered as a fi xed-dose combination tablet (EVG/FTC/TDF/
GS-9350 [FDC]) under fasted and fed (light and high calorie/high fat)
conditions
Secondary:
To evaluate the safety and tolerability of administration of the •
EVG/FTC/TDF/GS-9350 fi xed-dose combination tablet under fed and
fasted conditions
The fi xed-dose combination of emtricitabine (FTC)/ tenofovir DF •
(TDF), is a preferred agent for the treatment of antiretroviral- naïve
HIV patients2
FTC pharmacokinetics is unaffected by food• 3
Tenofovir (TFV) exposure (AUC• inf
) is modestly increased (~ 40%) with
a high fat meal4
Methods
Results
Introduction
Background
Objectives
Internal Gilead Data on fi le.1.
Guidelines for the Use of Antiretroviral Agents in HIV-1-Infected Adults and 2.
Adolescents. January 29, 2008 .
Truvada US Prescribing Information. May 2005.3.
Viread US Prescribing Information. October 2003.4.
Gilead Sciences, Inc.
333 Lakeside Drive
Foster City, CA 94404
Tel: (650) 522-2990
Fax: (650) 522-5801
Results (cont’d)
Table 1. EVG Plasma Pharmacokinetic Parameters
Table 2. GS-9350 Plasma Pharmacokinetic Parameters Figure 1. EVG Plasma Concentration-Time Profi les Figure 4. FTC Plasma Concentration-Time Profi les
Figure 2. GS-9350 Plasma Concentration-Time Profi les
Figure 3. TFV Plasma Concentration-Time Profi les
Table 3. TFV Plasma Pharmacokinetic Parameters
Table 4. FTC Plasma Pharmacokinetic Parameters
Demographics
24 subjects enrolled and completed the study•
12 females, 12 males –
Mean age: 35 years (range: 21 to 45 years) –
Mean weight: 73 kg (range: 61 to 91 kg) –
Safety
No Grade 3/4 adverse events or serious adverse events (AEs)•
No discontinuations due to adverse events•
Treatment emergent drug-related adverse events:•
1 subject: nausea (light meal) –
1 subject: headache, dizziness (high calorie/high fat meal) –
N=24C
max
(ng/ml)
AUClast
(ng·hr/ml)
AUCinf
(ng·hr/ml)
Fasted 1490 (40.3) 15600 (40.2) 16400 (38.6)
Light Meal 1760 (31.5) 20400 (28.0) 21100 (27.5)
HC/HF Meal 2230 (27.1) 28000 (22.6) 28800 (21.6)
GMR (90% CI) %
Light Meal vs.
Fasted122 (108, 138) 136 (121, 154) 134 (119, 151)
HC/HF Meal vs.
Fasted156 (138, 176) 191 (170, 216) 187 (166, 210)
HC/HF Meal vs.
Light Meal128 (114, 145) 140 (124, 158) 139 (123, 157)
N=24C
max
(ng/ml)
AUClast
(ng·hr/ml)
AUCinf
(ng·hr/ml)
Fasted 1190 (34.5) 8290 (49.5) 8370 (49.7)
Light Meal 1240 (35.5) 8010 (44.4) 8090 (44.5)
HC/HF Meal 944 (43.9) 6570 (49.1) 6680 (49.5)
GMR (90% CI) %
Light Meal vs.
Fasted104 (93.6,114) 103 (89.6,118) 103 (89.9,117)
HC/HF Meal vs.
Fasted75.7 (68.4, 83.6) 82.4 (71.9, 94.4) 82.9 (72.5, 94.7)
HC/HF Meal vs.
Light Meal73.1 (66.1, 80.8) 80.2 (70.0, 91.9) 80.7 (70.6, 92.2)
N=24C
max
(ng/ml)
AUClast
(ng·hr/ml)
AUCinf
(ng·hr/ml)
Fasted 326 (33.4) 2240 (24.4) 2580 (24.2)
Light Meal 386 (29.2) 2770 (17.1) 3140 (17.2)
HC/HF Meal 356 (45.7) 2780 (19.7) 3140 (18.9)
GMR (90% CI) %
Light Meal vs.
Fasted120 (104, 139) 125 (119, 131) 124 (118, 130)
HC/HF Meal vs.
Fasted103 (89.4, 120) 125 (119, 131) 123 (117, 129)
HC/HF Meal vs.
Light Meal86.1 (74.5, 99.7) 99.9 (95.2, 105) 99.7 (94.8, 105)
N=24C
max
(ng/ml)
AUClast
(ng·hr/ml)
AUCinf
(ng·hr/ml)
Fasted 1910 (29.1) 11000 (21.8) 11300 (21.0)
Light Meal 1810 (28.8) 10300 (19.6) 10700 (18.6)
HC/HF Meal 1820 (26.5) 10400 (19.1) 10800 (18.8)
GMR (90% CI) %
Light Meal vs.
Fasted95.4 (86.5, 105) 94.3 (90.3, 98.6) 95.3 (91.2, 99.6)
HC/HF Meal vs.
Fasted96.2 (87.2, 106) 95.6 (91.5, 99.9) 95.7 (91.6, 100)
HC/HF Meal vs.
Light Meal101 (91.4, 111) 101 (97.0, 106) 100 (96.1, 105)Data presented as arithmetic mean (%CV); GMR: Geometric Least-Squares Means
Ratio; CI: Confi dence Interval; HC/HF- high calorie/high fat
Data presented as arithmetic mean (%CV); GMR: Geometric Least-Squares Means
Ratio; CI: Confi dence Interval; HC/HF- high calorie/high fat
Data presented as arithmetic mean (%CV); GMR: Geometric Least-Squares Means
Ratio; CI: Confi dence Interval; HC/HF- high calorie/high fat
Data presented as arithmetic mean (%CV); GMR: Geometric Least-Squares Means
Ratio; CI: Confi dence Interval; HC/HF- high calorie/high fat
1 subject had a measurable concentration
value at 48 hours in HC/HF group
GS-9350
0 6 12 18 24 30 36 42 480.1
1
10
100
1000
10000
time (hr)
___ Fasted Administration;
___ Light Meal (373 kcal, 20% fat);
High Calorie/High fat (800 kcal, 50% fat)
pla
sm
a c
on
ce
ntr
ati
on
(n
g/m
l)
EVG
0 6 12 18 24 30 36 42 480.1
1
10
100
1000
10000
time (hr)
pla
sm
a c
on
ce
ntr
ati
on
(n
g/m
l)
___ Fasted Administration;
___ Light Meal (373 kcal, 20% fat);
High Calorie/High fat (800 kcal, 50% fat
TFV
0 6 12 18 24 30 36 42 481
10
100
1000
time (hr)
pla
sm
a c
on
ce
ntr
ati
on
(n
g/m
l)
___ Fasted Administration;
___ Light Meal (373 kcal, 20% fat);
High Calorie/High fat (800 kcal, 50% fat)
FTC
0 6 12 18 24 30 36 42 4810
100
1000
10000
time (hr)
pla
sm
a c
on
ce
ntr
ati
on
(n
g/m
l)
___ Fasted Administration;
___ Light Meal (373 kcal, 20% fat);
High Calorie/High fat (800 kcal, 50% fat)
German P. 49th ICAAC 2009; poster A1-1300
Impact of food on elvitegravir (as Stribild)
Standard breakfastFasted
Protein rich drink
Shiomi M et al. Journal of Clinical Pharmacology. 2014;54(6):640-648.

Food effect on dolutegravir
In the presence of integrase resistance, DTG should
preferably be taken with food to enhance exposure (particularly with Q148)
1. Song I et al. Antimicrobial Agents and Chemotherapy. 2012;56(3):1627-1629. 2. Tivicay SPC accessed 2nd October 2018
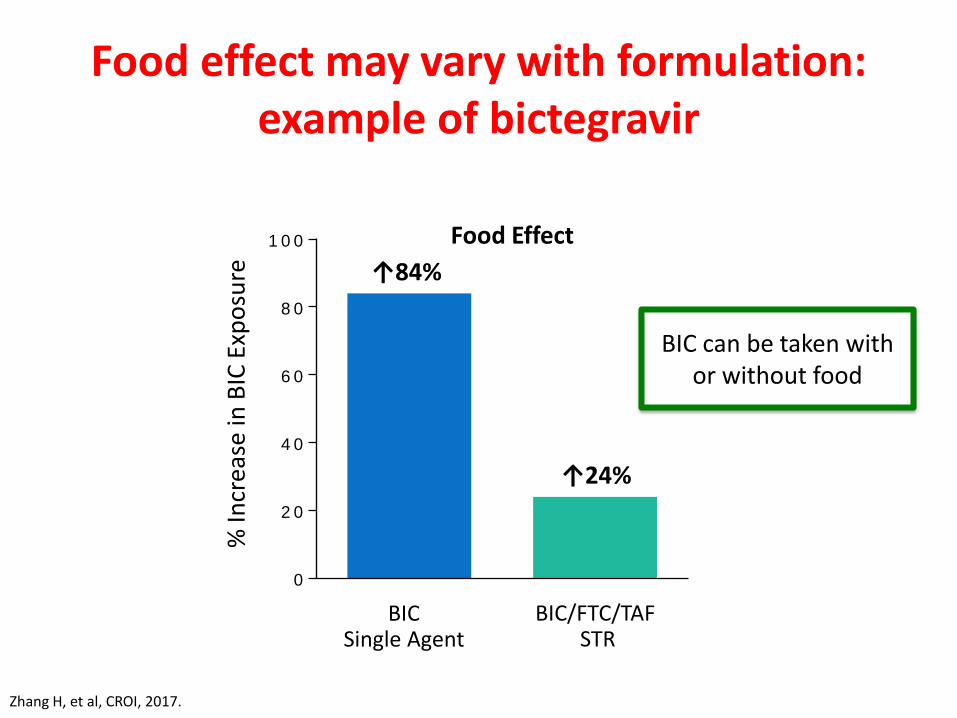
Food effect may vary with formulation: example of bictegravir
0
2 0
4 0
6 0
8 0
1 0 0%
Incr
ease
in B
IC E
xpo
sure ↑84%
↑24%
BICSingle Agent
BIC/FTC/TAF STR
Food Effect
Zhang H, et al, CROI, 2017.
BIC can be taken withor without food
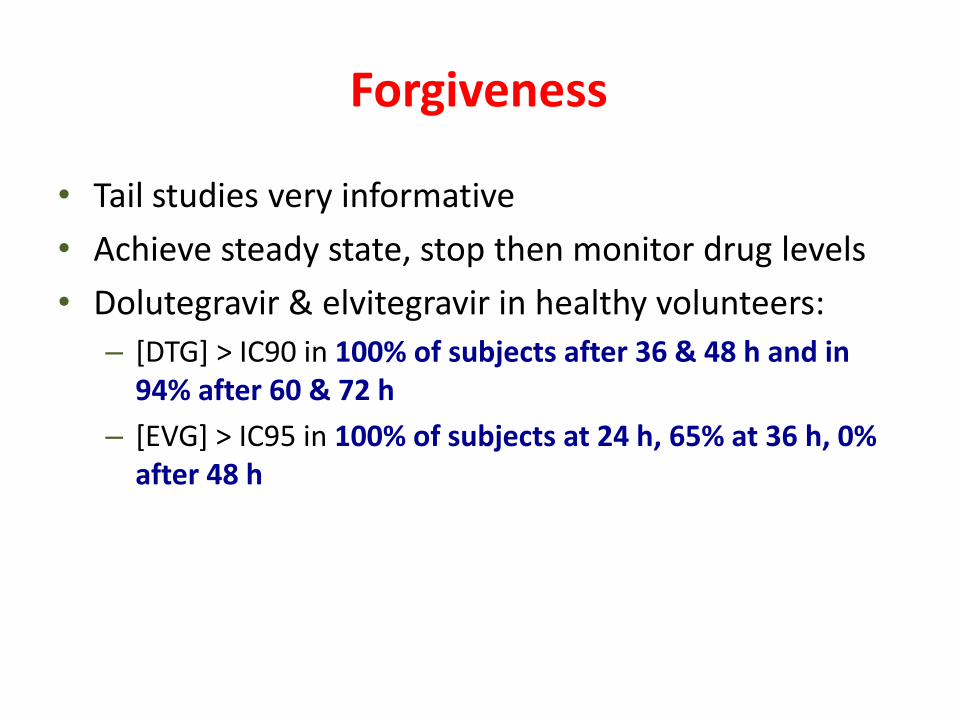
Forgiveness
• Tail studies very informative
• Achieve steady state, stop then monitor drug levels
• Dolutegravir & elvitegravir in healthy volunteers:
– [DTG] > IC90 in 100% of subjects after 36 & 48 h and in 94% after 60 & 72 h
– [EVG] > IC95 in 100% of subjects at 24 h, 65% at 36 h, 0% after 48 h

Renal transporters
Yombi JC et al. AIDS 2014, 28:621–632
May result in reduced uptake
from blood
May result in reduced excretion

Two main consequences?
• Impact on creatinine secretion
• Impact on drug secretion

Blood UrineActive Tubular Secretion
OCT2
MATE1
Inhibition by:Dolutegravir
TrimethoprimRitonavirCobicistatBictegravirRaltegravir
Inhibition by: Rilpivirine
DolutegravirBictegravir
Creatinine
Creatinine
Slide courtesy of Marta Boffito; adapted from Lepist EI, et al. 51st ICAAC 2011. Abstract A1-1724
Renal tubular cell
Renal Transporters and Creatinine Clearance

DRUG-DRUG INTERACTIONS

Mechanisms of drug interactions
HEPATIC CLEARANCE
RENAL CLEARANCE
ABSORPTION
• Chelation• pH effects• Gut enzymes &
transporters
• Enzymes/transporters• Liver disease• Pharmacogenetics
• Renal transporters• Renal disease
UGT1A1*28 polymorphism increases [RAL] which correlates
with fatigue

Pharmacokinetic consequences of drug-drug interactions
1. Increased exposure to one/both drugs
– Risk of toxicity
2. Decreased exposure to one/both drugs
– Lack of efficacy

Inhibition of hepatic CYP: increased systemic exposure
Drug
10
1
Time
Co
nce
ntr
atio
n
Time
10
1C
on
cen
trat
ion
Drug
Inhibitor blocks the function of the CYP
enzymeCYP
CYP
AUC 2
A. Drug alone
B. Drug + inhibitorAUC 5
Cobicistat & ritonavir

Perpetrator vs victim
• Any individual drug can be one or the other, or both
• Example = dolutegravir
– Perpetrator: increased metformin concentrations
– Victim: concentrations reduced by cations
– Victim: of strong enzyme inducers
Adapted from Back DJ & Kiser J. ICAAC September 2014.

Values shown are GLS mean ratio (90% CI)
Zong et al 2014
Effect of DTG on metforminDose adjustment of metformin may be considered
Regimen Cmax (μg/mL) AUC0– (µgh/mL) t1/2 (h)
Metformin + DTG (50 mg q24h) vs
metformin alone1.66 (1.53, 1.81) 1.79 (1.65, 1.93) 1.09 (0.954, 1.24)
Metformin + DTG (50 mg q12h) vs
metformin alone2.11 (1.91, 2.33) 2.45 (2.25, 2.66) 1.14 (1.00, 1.29)

Patel et al 2011
Chelation of InSTI by polyvalent cations
0 10 20 30 40 50 8060 70
2.0
1.8
1.6
1.4
1.2
1.0
0.8
0.6
0.4
0.2
0
Me
an
DT
G c
on
ce
ntr
ation
(µ
g/m
L)
Time (h)
DTG + antacid 2 hours later
DTG alone
DTG + antacid
Mg2+
Mg2+
InSTI
Tivicay SPC; Song et al 2011; Song et al 2011; Dooley et al 2013
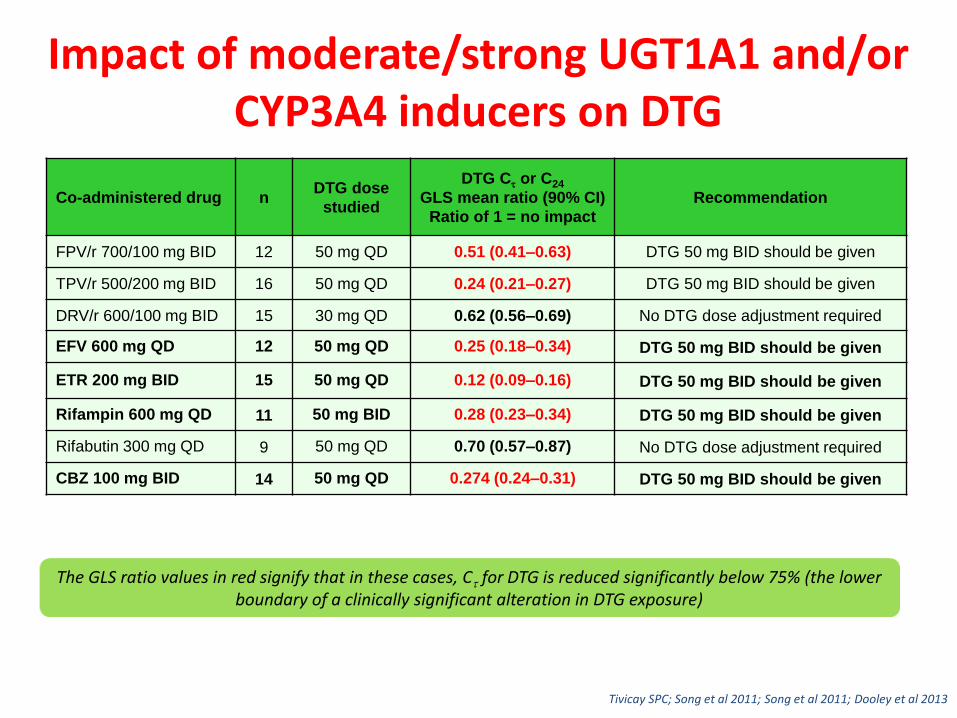
Impact of moderate/strong UGT1A1 and/or CYP3A4 inducers on DTG
Co-administered drug nDTG dose
studied
DTG C or C24
GLS mean ratio (90% CI)
Ratio of 1 = no impact
Recommendation
FPV/r 700/100 mg BID 12 50 mg QD 0.51 (0.41–0.63) DTG 50 mg BID should be given
TPV/r 500/200 mg BID 16 50 mg QD 0.24 (0.21–0.27) DTG 50 mg BID should be given
DRV/r 600/100 mg BID 15 30 mg QD 0.62 (0.56–0.69) No DTG dose adjustment required
EFV 600 mg QD 12 50 mg QD 0.25 (0.18–0.34) DTG 50 mg BID should be given
ETR 200 mg BID 15 50 mg QD 0.12 (0.09–0.16) DTG 50 mg BID should be given
Rifampin 600 mg QD 11 50 mg BID 0.28 (0.23–0.34) DTG 50 mg BID should be given
Rifabutin 300 mg QD 9 50 mg QD 0.70 (0.57–0.87) No DTG dose adjustment required
CBZ 100 mg BID 14 50 mg QD 0.274 (0.24–0.31) DTG 50 mg BID should be given
The GLS ratio values in red signify that in these cases, C for DTG is reduced significantly below 75% (the lower boundary of a clinically significant alteration in DTG exposure)
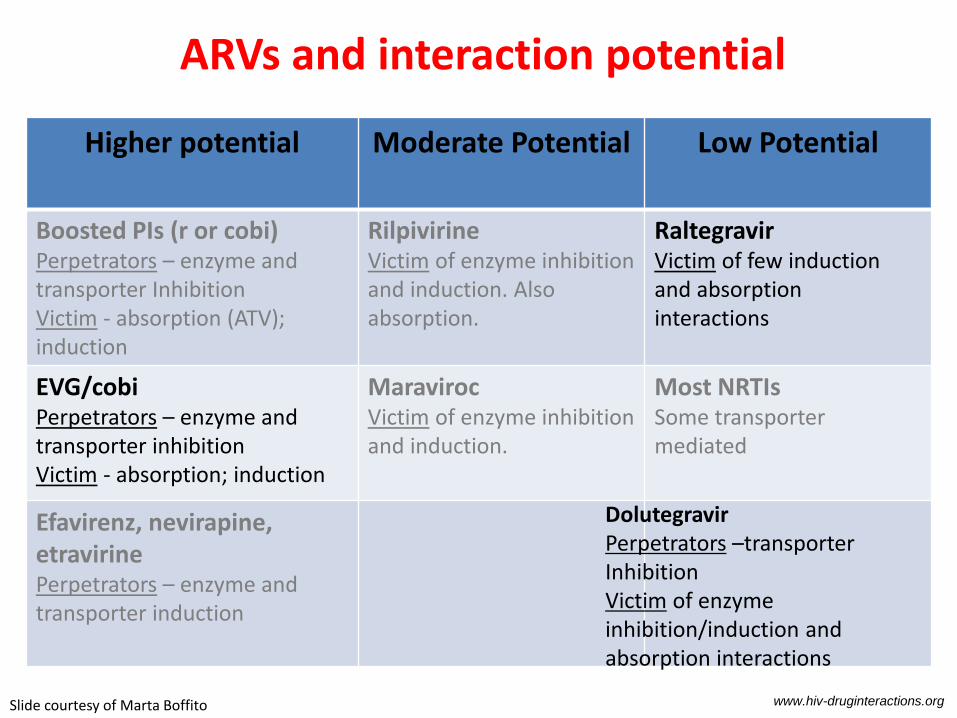
Higher potential Moderate Potential Low Potential
Boosted PIs (r or cobi)Perpetrators – enzyme and transporter InhibitionVictim - absorption (ATV); induction
RilpivirineVictim of enzyme inhibition and induction. Also absorption.
RaltegravirVictim of few induction and absorption interactions
EVG/cobiPerpetrators – enzyme andtransporter inhibitionVictim - absorption; induction
MaravirocVictim of enzyme inhibition and induction.
Most NRTIsSome transporter mediated
Efavirenz, nevirapine, etravirinePerpetrators – enzyme and transporter induction
ARVs and interaction potential
www.hiv-druginteractions.org
DolutegravirPerpetrators –transporter InhibitionVictim of enzyme inhibition/induction and absorption interactions
Slide courtesy of Marta Boffito

BIC Drug–Drug Interaction Profile
• Perpetrator? Low potential (OCT2/metformin)
• Victim? Low potential (or moderate?)
– INSTIs are affected by cation-containing antacids
• BIC administration with antacids should be staggered (± 2 hours)
• Fasted administration 2 hours before or 2 hours after antacid resulted in a decrease in BIC exposures of 13% and 52%, respectively
– BIC is a substrate of CYP3A4 and UGT1A1
• Inhibition of both CYP3A4 and UGT1A1 needed for substantial increase in exposure
• Potent induction reduces exposure to a clinically significant extent
Zhang, et al. CROI 2017
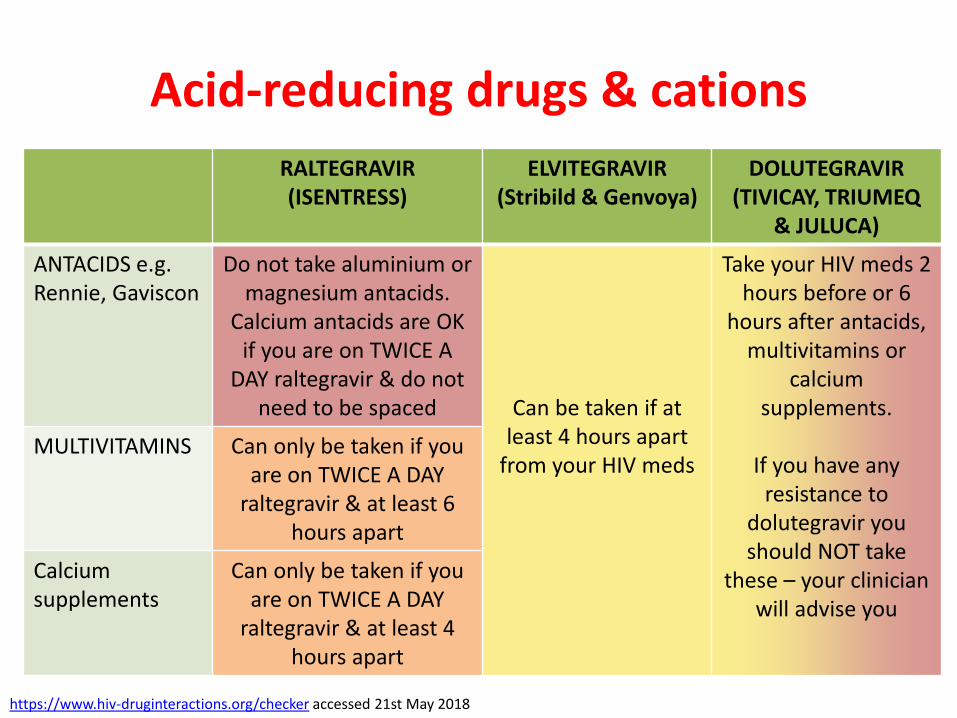
Acid-reducing drugs & cations
RALTEGRAVIR(ISENTRESS)
ELVITEGRAVIR (Stribild & Genvoya)
DOLUTEGRAVIR(TIVICAY, TRIUMEQ
& JULUCA)
ANTACIDS e.g. Rennie, Gaviscon
Do not take aluminium or magnesium antacids.
Calcium antacids are OK if you are on TWICE A
DAY raltegravir & do not need to be spaced Can be taken if at
least 4 hours apart from your HIV meds
Take your HIV meds 2 hours before or 6
hours after antacids, multivitamins or
calcium supplements.
If you have any resistance to
dolutegravir you should NOT take
these – your clinician will advise you
MULTIVITAMINS Can only be taken if you are on TWICE A DAY
raltegravir & at least 6 hours apart
Calcium supplements
Can only be taken if you are on TWICE A DAY
raltegravir & at least 4 hours apart
https://www.hiv-druginteractions.org/checker accessed 21st May 2018

ART & contraception
Oral DMPAa Implanonb
RAL No dose adjustment No dose adjustment
No dose adjustment
DTG No dose adjustment* Likely fine Likely fine
Stribild & Genvoya
NG: AUC ↑126%, Cmin ↑167%, Cmax ↑ 108%
EE: AUC ↓25%, Cmin ↓44%, Cmax
At least 30mcg EE. If prog other than norgestimate, use
alternativec
Likely fine Likely fine
BIC Small increases in ethinyloestradiol & norgestimate
Likely fine Likely fine
Coloured boxes: European SPC advice; grey boxes: my opinion NR = not recommended)
a) DMPA: clearance = hepatic blood flow, inducers unlikely to impact efficacyb) Implanon: failures on EFV & AED; SPC says efficacy may be affected by enzyme inducersc) Long-term effects of substantial increases in progesterone exposure are unknown
*no impact on LH or FSH
COMMUNICATION

Dear Doctor,
RE: Mr X
I saw this gentlemn with HIV…..he is onStribild. Please note there is a risk of druginteractoins (see footer). He needs anualflu vaccination and a pneumococcalvaccine.
Your sincerely
Dr L Waters
Blurb about vaccinations and drug interactions in general – I’m sure no-one actually bothers to read it so that’s why I type importantinteractions in myself. I wonder if you’ll read this? Will you??

What we do now
• GP and referral letter templates a section at the top of the letter which we delete as appropriate:
– Please note there is a significant risk of drug-drug interactions between HIV therapy and other drugs, e.g:
– Ritonavir/cobicistat is a potent inhibitor of CYP3A4; important interactions include simvastatin (risk of rhabdomyolysis) and several inhaled/intranasal/injected steroids such as fluticasone and triamcinolone (risk of iatrogenic Cushing’s)
– Rilpivirine has significant interactions with acid-reducing agents; PPI are contra-indicated; H2A and antacids require careful dose spacing

Patient information
• If you find yourself repeating the same messages
Make an information card!!

Patient information card: handed out in consultations, website

Conclusions
• Understanding pharmacology important
• The main clinical implications:– Food advice
– Advice about late/missed doses
– Drug-drug interactions
• Ensure advice to patients and other health care professionals is:– Clear
– Accessible
– Relevant

Acknowledgements
• Marta Boffito – Queen of PGP

Carluccio’s