Embed Size (px)
Citation preview

Polish Academy of Sciences Institute of Physics
Ph. D. Dissertation
Theory of magnetic properties based on atomic p-orbitals in perfect and defected solid s
Oksana Volnianska
Supervisor Prof. Piotr Bogusławski
Warsaw 2009
1
ACKNOWLEDGEMENTS
I would like to thank my supervisor, Prof. Piotr Bogusławski for his help during this
work.
The calculations computations were partially performed at ICM at Interdisciplinary
Center for Mathematical and Computational Modeling, Warsaw University.
The research was supported by Program of Fellowships under the Polish National
Commission for UNESCO (2009), Grant № 758, and by of Polish Ministry of Science, Grant
№ 202103036 and Grant № 202 172935.

2
Contents
Part I. Introduction………………………………………………………………………..3 1.1. Ferromagnetic bulk solids without transition metal atoms……………………....3 1.2. Magnetism in non-magnetic hosts with non-magnetic defects or dopants………4 1.2.1 Impurity-induced magnetism…………………………………………5
1.2.2 Magnetism in organic materials………………………………………7 1.2.3 High-spin state of vacancies…………………………………………..7
1.3. The plan of Thesis………………………………………………………………..8
Part II. Methodology………………………………………………………………………9 2.1. Density functional theory………………………………………………………9 2.2. Local Spin Density Approximation and Generalized Gradient Approximation.11 2.3. “Ab-initio” pseudopotentials…………………………………………………..13 2.4. Plane wave based total energy calculation…………………………………….14 2.5. Details of calculations…………………………………………………………15 Part III. Magnetism of II A-V compounds……………………………………………….17 3.1. Magnetic properties and electronic structure of IIA-V compounds……………17 3.1.1. Hund’s rule. Magnetic moments of isolated atoms………………….21 3.1.2. Energy bands and magnetic moments at equilibrium………………..23 3.1.3. Electronic structure at high pressures………………………………..31 3.2. Structural stability of IIA-V compounds ………………………………………37 Part IV. Magnetism of monoclinic SrN………………………………………………….43 4.1. The crystal structure of SrN and SrN2................................................................43 4.2. Magnetic properties of m-SrN…………………………………………………45 4.3. Origin of magnetism of m-SrN………………………………………………...48 4.4. Magnetic properties of t-SrN2…………………………………………………49 Part V. High-spin configuration of cation vacancies……………………………………51 5.1. Electronic structure and spin states of neutral vacancies………………………52 5.1.1. Neutral Vcation in zinc-blende III-V semiconductors………………....53 5.1.2. Neutral Vcation in wurtzite III-V semiconductors……………………..54 5.1.3. Neutral VZn in w-ZnO and VBe in w-BeO……………………………..56 5.1.4. Spin density of cation vacancies……………………………………..57 5.2. Spin states of charged vacancies……………………………………………….59 5.3. The exchange splitting of TVB………………………………………………...64 5.4. The energy of spin polarization of vacancy vs exchange splitting…………….65 5.5. Details of calculation. The effect of relaxation of structure…………………...66 Part VI. Summary…………………………………………………………………………70 Bibliography……………………………………………………………………………….73
3
Part I
Introduction
In 1928 Heisenberg postulated that magnetism in solids is due to the presence of
transition metal or rare earth atoms with partially filled and spin-polarized d or f electronic
shells. Indeed, practically all magnetic systems studied or applied in devices contain transition
metal or rare earth ions. Recently however, this paradigm was questioned. In fact, magnetism
was experimentally observed or theoretically predicted to exist in a number of systems
containing only s and p electrons. These systems can be divided into two classes. In the first
one, spin moments are provided by host atoms that form an ideal bulk crystal. In the second
class, spin moments are provided by defects, typically vacancies, or (non-magnetic) dopants
in a non-magnetic host. My thesis deals with both ideal bulk crystals that exhibit magnetism
of either atomic or molecular origin and with some aspects of the local spin polarization
related with vacancies. This is because one of the main goals of this Thesis is to demonstrate
that the physical origin of both effects is the same, and consists in the strong spin polarization
of p orbitals of light atoms from the second row of the periodic table. Below, a review of the
results related directly to this Thesis is given. Since this field is already vast and rapidly
growing, the results obtained for other systems are also mentioned, but the given literature is
not exhaustive.
1.1. Ferromagnetic bulk solids without transition metal atoms
The class includes the defect-free bulk materials containing atoms with partially filled
p orbitals [1-5]. In Ref. [1] Kukasabe et al. have theoretically analyzed CaP, CaAs, and CaSb
in the zinc-blende (zb) structure by first-principles calculations, and found that they are half-
metals with a total spin polarization of holes in the valence band. (Half-metals are metals with
a total spin polarization of free carriers on the Fermi level.) Properties of several IIA-V
compounds have been further explored in Refs. [2, 3] where it was shown that a number of
IIA-V crystals can be half-metals. Similar results were obtained for the zb phase of II-C
carbides [6]. However, the zb structure analyzed in detail in Refs. [1-3] is not the stable
crystalline phase of these compounds. The question therefore arises what are the stable

4
phases, and whether the spin polarization persists in these structures. In fact, II-V compounds
crystallize in variety of structures, the most common being Zn3P2 or a more complex Zn3As2
phases [7]. Magnetic IITM-V compounds (where IITM is a transition metal ion) usually
crystallize in the NiAs structure [8, 9]. SrN has been observed both in the rock salt (rs) [10]
and in the monoclinic structure [11, 12]. In fact, it was shown that the rs phase is more stable
than zb [4, 5], and CaN, SrN, and BaN in this structure are ferromagnetic.
The explanation of the presence of non-vanishing spin polarization in various IIA-V
compounds have been provided in Ref. [4], and the details are given in Part III. The effect
originates in the strong spin polarization of light atoms from the second row of the Periodic
Table [4], in which a strong Hund’s coupling take place. The spin polarization is not
destroyed by the formation of bonds in the crystal. In other words, the atomic polarization is
stronger that hybridization effects.
Magnetism in ideal bulk compounds can also occur in systems containing O2 or N2
dimers in the appropriate charge state, in which the magnetic moments of dimers are not zero.
A prototype case is that of molecular magnetism in solid O2 at low temperature [13], which
orders antiferromagnetically with the Neel temperature of 24 K. In fact, this is one of very few
cases in which magnetism without transition metal or rare earth ions exists. Recently,
magnetism of molecular origin was predicted for Rb4O6 that contains O2 molecules [14-16].
Experiment [16] shows that the effective magnetic moment per hyperoxide unit in Rb2O6,
1.83 µB, is in a reasonable agreement with the predicted 2 µB [14, 15], and the crystal exhibits
a frustrated magnetic order [16]. In Ref. [17] we showed that similar molecular magnetism
takes place in bulk monoclinic m-SrN, in which one half of N ions form N2 dimers. Magnetic
properties of m-SrN are analyzed in detailed in Part IV.
1.2. Magnetism in non-magnetic hosts with non-magnetic defects or dopants
A second class of materials in which magnetism can exist without transition metal
atoms are crystals, in which spin moments are provided either by dopants or defects. In fact,
impurities and defects such as vacancies in insulators typically introduce deep levels in the
band gap, and electrons that occupy these levels form states with total spin 0 or 1/2. In the

5
latter case, magnetic phases are possible provided that the defect concentration is high enough
to enable for the magnetic coupling between defects.
1.2.1. Impurity-induced magnetism
This case comprises II-VI (ZnO, MgO, CaO, SrO) and III-V compounds (GaN) doped
by light atoms (C, N), and by Cu ions that nominally are non-magnetic because of their
closed-shell d10 configuration. The first experimental observation of FM in a doped
semiconductor was performed by Pan et al. [18] They analyzed ZnO containing 1-5 % of C,
and found FM at room temperature with the magnetic moment of about 1 µB per C atom.
Their theoretical results showed that FM is due to the spin polarization of electrons in the C-
induced impurity band, and that the presence of additional holes can enhance FM. Indeed, Ye
et al. observed that co-doping with nitrogen enhances magnetism of ZnO:C powder and their
results indicated that magnetism mediated by itinerant electrons may explain the
ferromagnetic nature of ZnO:C [19]. Room-temperature FM was also reported for N-doped
ZnO [20]. Finally, experimental results showed that a substitution of nitrogen for oxygen in
nonmagnetic SrO oxide leads to a holes in p(N) states that form local magnetic moments [21].
The nitrogen 1s core-level XPS was used to examine the spin polarization. For SrO0.75N0.25
the observed energy separation between singlet and triplet peaks is 1.6 eV, which is consistent
with 1.5 eV found in NO which has a spin ½ localized mainly on N.
The mechanism of ferromagnetism in nitrogen-doped ZnO was analyzed by first
principle calculations Shen et al. [22]. The long-range magnetic coupling was attributed to p-p
coupling involving holes (similar to the p-d exchange coupling), which is derived from the
similar symmetry and wave function between the impurity (p-like t2) and valence p states.
Kenmochi et al. have proposed that such an effect takes place also in other oxides doped with
carbon [23]. According to their calculations, MgO, CaO, and SrO containing a few per cent of
C, which is a double acceptor when substituting O, is ferromagnetic due to the spin
polarization of carriers in the C-induced impurity band. Thus, the driving force for FM in
these systems is the same as in the case of II-V and II-C ideal crystals.
Finally, I note that magnetic 3d transition-metal doped diluted magnetic
semiconductors based on III-V and II-VI hosts also have been extensively studied due to their
potential application in spintronics [24, 25]. Recently, however, FM was also observed in

6
ZnO doped with Cu [26-34] and in Cu-doped in GaN [35, 36]. These results are unexpected
because Cu ions, which have 3d10 electrons in the closed-shell configuration, are nominally
non-magnetic [30, 31, 33].
From the theoretical side, first studies found that ZnO:Cu (25 %) is nonmagnetic [26].
However, calculations for lower doping levels indicated ZnO doped with 6.25 % [27] and
3.125 % Cu [28] should be ferromagnetic. The influence of defect charge state on the
magnetism ZnO:Cu as well as the Cu defects clustering were investigated by first-principles
calculations by D. Huang et al. [37]. It was demonstrated that p-type ZnO:Cu is expected to
be ferromagnetic, but in n-type ZnO:Cu the magnetic moment of Cu vanishes. Furthermore,
neutral substitutional Cu impurities are found to have a tendency to clustering, which
maintains the FM ordering. And finally, Ye et al. [38] and Huang et al. [39] both found that
ZnO:Cu is FM.
In parallel, intensive experimental research started in this field, but the present
situation is confusing. The magnetic circular dichroism spectra of ZnO:Cu (0.3 %) suggested
that it is a diluted magnetic semiconductor [29]. Additionally, a saturable component of the
magnetization was observed in M-H curves of ZnO powders doped with 2 % and 5 % Cu and
was interpreted as ferromagnetism [30]. Buchholz et al. grown a series of ZnO:Cu films by
pulsed-laser deposition [31]. They showed that ZnO:Cu (1%) film has the Curie temperature
of about 390 K, and the saturation magnetization at 200 K corresponds to a magnetic moment
of 0.4 µB per copper atom. Keavney et al. [32] has reported X-ray absorption spectroscopy
(XAS) and magnetic circular dichroism (XMCD) studies of the films like in Ref. [31].
Surprisingly, however, authors find that the ferromagnetic spin polarization does not reside on
the Cu 3d, O 2p, Zn 4s, or Zn 3d states. They find a small paramagnetic contribution on the
Cu 3d states which is more pronounced at the surface of the films. Keavney et al. found FM in
p-type ZnO:Cu but not in n-type ZnO:Cu sample. Next, ZnO films with 0.12 % Cu were
prepared by Q. Xu et al. [33], but no clear ferromagnetism was observed. Recently,
ferromagnetism in CuO-ZnO multilayers was observed at 300 K, and it depends on the CuO
particle size, but not on the CuO-ZnO interfacial area [40].
Finally, magnetic properties related with Cu impurities in GaN were analyzed both
theoretically by Wu et al. [35] and experimentally by Lee et al. [36]. In the latter work, room-
temperature ferromagnetism of GaN implanted with Cu was observed after annealing.
7
1.2.2. Magnetism in organic materials
Ferromagnetism was also observed in several organic materials, which are out of scope of
my Thesis, but are mentioned here for the sake of completeness. In particular, experiments
demonstrated the presence of ferromagnetic-like features in irradiated pyrolityc graphite [41,
42], or carbon thin films [43], and after implantation of C and N to carbon nanosized particles
[44]. Several works reported ferromagnetism in C60-based polymers [45-47]. In particular
azafulleren C59N, which is formed by replacing a single carbon atom of the C60 by a nitrogen
atom [48-50] and N-C60 molecule [51, 52] have magnetic moments. Ferromagnetism in these
systems is weak, since typical Curie temperatures TC do not exceed 15 K. On the other hand,
carbon nano-particles produced by a pulsed arc submerged in ethanol demonstrates a
ferromagnetic behavior with a critical temperature much higher than 300 K [53].
Possible origins of FM are local moments at lattice defects or the presence of hydrogen
[54]. In particular, theoretical results indicate that FM may be induced by spin moments
localized on the dangling bonds of vacancies [55-57]. In proton-irradiated graphite,
magnetization increases with the increasing irradiation [42], which can be connected with the
increasing concentration of defects [55]. Authors noted that vacancy has spin ≈ 1 µB, and spin
density is localized on broken bond of carbon. Similarly, the presences of strongly coupled
dangling bonds at the edges of carbon nano-ribbons lead to their FM spin polarization [58].
However, it is necessary to stress that the origin of magnetic properties of organic materials
are still under debate.
1.2.3. High-spin state of vacancies
Magnetism induced by vacancies was first considered for Ca vacancies in CaO in Ref.
[59]. This paper deals with two issues relevant for my Thesis. The first one, discussed above
for the impurities, is the fact that sufficiently high concentrations of vacancies in CaO may
lead to a FM phase. This issue was examined in Ref. [60], where it was shown that typical
concentrations of vacancies are too low to allow for ferromagnetism. However, in a recent
paper Peng et al. proposes that a high concentration of holes in a ZnO quantum well may
mediate the magnetic coupling between the defects and result in FM [61].
The second important issue is the observation that in CaO the Ca vacancy may be in
the high-spin state, i.e., its spin is higher than 0 or 1/2. The authors show that the effect results

8
from a strong effective Hund’s rule coupling between the electrons that occupy the vacancy-
induced states. The first observation of a vacancy in the high-spin state was performed for a
neutral gallium vacancy, VGa, in the irradiated GaP [62]. Analysis of ESR spectra showed that
VGa is in the high-spin S=3/2 state (3 µB). The high-spin state of vacancies was also observed
in MgO [63, 64], ZnO [65, 66] and in proton-irradiated SiC [67]. In the latter case it was
shown that the negatively charged silicon vacancy has a high-spin configuration with spin 3/2.
Later, it was shown by L. Torpo et al. [68] that in the neutral, singly and doubly negative
charge states of VSi in SiC a strong exchange coupling, which prefers parallel electron spin
configuration, overcomes the Jahn-Teller energy. In other charge states, the ground state of VSi
has a low spin configuration. Subsequent theoretical calculations predicted that neutral cation
vacancies in III-N nitrides [69-71] and VZn in ZnO [61, 69]. Analysis of the results, given in
Part 5, demonstrates that the physical origin of two effects that seem to be distinct, i.e., the
spontaneous magnetization of bulk II-V crystals and the high-spin configuration of vacancies,
is the same and consists in the strong spin polarization N and O atoms.
1.3. The plan of Thesis
The basics of methodology, i.e., of the Density Functional Theory (DFT) and of the
exchange-correlation functionals in the Local Spin Density Approximation (LSDA) and
General Gradient Approximation (GGA), together with the details of calculations, are
summarized in Part II. In Part III the electronic, magnetic, and structural properties of several
IIA-V compounds are analyzed. I consider four crystal structures: zb, NiAs, rs, and Zn3P2. Our
results indicate that IIA-V nitrides in the rock salt phase are (meta)stable ferromagnetic half-
metals. Part IV is devoted to monoclinic SrN, which is expected to be a molecular
antiferromagnet. In Part V, formation and stability of high-spin states of vacancies are
analyzed. Cation vacancies in BN, AlN, GaN, GaP, ZnO, BeO were considered. The
calculations demonstrated that in these cases the exchange coupling is strong enough to
induce high-spin (i. e., spin-polarized) local configurations, which are related with s and p
rather than with d atomic orbitals. In contrast, in 'classical' semiconductors like GaAs, VGa is
found in the low-spin state, in agreement with experiment. Part VI summarizes the work.

9
Part 2
Methodology
The fundamental property of density functional theory (DFT) is that any property of
system of many interacting particles can be viewed as a functional of the ground state electron
density )(0 rnr
. In this Part I summarize the methodology of DFT. Section 2.1 describes the
Kohn-Sham independent-particle equation in a general form useful for all calculations.
Section 2.2 deals with widely used Local Spin Density Approximation (LSDA) and General
Gradient Approximation (GGA) for the exchange-correlation functional. Section 2.3 is
devoted to the plane wave pseudopotential method, which has been used in our calculation. In
Section 2.4 I consider the problem of a choice of the pseudopotentials. In section 2.5 I discuss
the details our calculations.
2.1. Density functional theory
The general idea of DFT is that all properties of the ground state of a system can be
considered to be functional of the ground state density of particles [72-74].
The Hamiltonian of N electrons in an external potential )(rVext
r can be written as:
,2
1)(
2ˆ
22
2
∑∑∑≠ −
++∇−=ji ji
i
N
iext
N
ii
rr
erV
mH rr
rh (1)
where, the first term is a sum operator of kinetic energy of electrons, the second term is a sum
of )(rVext
r, where in the case of a crystal ∑
≠ −−=
M
ji ji
jiext
Rr
ZerV rrr
2
)( is a potential of Coulomb
interaction of i-electron with nuclei, and the third term is the Coulomb electron-electron
interaction.
DFT is based upon two theorems formulated by Hohenberg and Kohn [72].
Theorem 1. The expectation value of any observable is a unique functional of the exact
ground state electron density )(0 rnr
. All ground state properties can thus be extracted from the
exact electron density. The problem is now only how to find this density. The second theorem
is helpful in this matter.

10
Theorem 2. For a given external potential, the true density )(0 rnr
minimizes the total energy
functional. This reduces the very complex problem of finding all physical properties of a
system to finding the minimum of the energy with respect to the electron density (which still
is not trivial since )(0 rnr
is function in three-dimensional space).
Therefore, the total energy of the systems is a functional of electron density and can be
written as:
[ ] [ ] ( )[ ] ( )[ ] ( )[ ]rnErnErnErnTrnE xceeextetot
rrvrr +++= )()( , (2)
where ( )[ ]rnTr
is the total kinetic energy of a system of non-interacting electrons with density
)(rnr
, ( )[ ] ( ) rdrnrVrnEV
extext3)(
rrr
∫= describes the electron-nuclei interaction, the so-called
Hartree term, ( )[ ] rrddrr
rnrnernEV
ee ′′−′
= ∫∫332 )()(
2 rr
rrr
, is the classical energy of the Coulomb
electron-electron interaction, and ( )[ ] [ ] rdrnrVrnEV
xcxc3)(,
rrr
∫= is the exchange-correlation
energy functional which compensates for the electron-electron interaction being described
only by the Hartree term ( )][ rnEee
r.
These theorems show is that a unique mapping between the ground state density and the
ground state energy in principle exists. However, they do not provide any guidance how the
functional that delivers the ground state energy should be constructed. In fact, in (2) only eeE
is known, while the explicit forms of the other contributions are unknown. Kohn and Sham
invented an ingenious indirect approach to the kinetic-energy functional, which rests on two
assumption: [73] (1) the exact ground state density can be represented by ground state density
of an auxiliary system of non-interacting electrons, and (2) the Hamiltonian is chosen to have
the usual kinetic operator and an effective local potential acting on an electron of spin s at
point rr
.
The density of the auxiliary system is given by sums of squares of the wave function of
electrons:
- without spin: ( ) ( ) 2
∑=µ
µψ rrnrr
, (3)
- with spin: ( ) ( ) ( )2
, ∑∑∑ ==µ
µψ rsrnrn s
ss
rrr. (4)

11
For [ ])(rEetot
rµψ to be a minimum, it is necessary that
)(* r
Eetotr
µδψδ
=0 with leads to the Kohn-
Sham equations:
)()()](,[)(
)(2
3
2
222
rrrnrVrdrr
rerV
m ixc
iext
rrrrrr
rrh
µµµ ψεψψ
=
+′
′−′
++∇− ∑∫ . (5)
Here µε are Lagrange multipliers for the constraints ( ) ( ) µννµ δψψ =∫ rdrr 3* rr, and are
interpreted as one-electron energies. )(
];[];[
rn
nrEnrV xc
xc r
rr
∂∂
≡ is the exchange-correlation
potential. These equations are nonlinear, self-consistent, and must be solved iteratively. Total
energy of the ground state depends on µε and the wave function )(rr
µψ of the one-electron
states:
( ) ( ) ( ) rdrnnrVrrddrr
rnrneE xctot
3332
);(4
1
2
rrrr
rr
∫∑ ∫ −′′−′
−=µ
µε . (6)
2.2. Local Spin Density Approximation and Generalized Gradient
Approximation
In Section 2.1 the Kohn-Sham formalism was introduced what allows for an exact
treatment of most of the contributions to the total energy, including the major fraction of the
kinetic energy. All remaining and unknown parts are collectively folded into the exchange-
correlation functional xcE . In this Section I summarize the commonly used approximate
forms of functional for xcE .
Local Density Approximation
The local density approximation (LDA) consist in the assumption
that ( ))();( rnVnrV hxcxc
rr ≅ . Here ( ))( rnV hxc
ris the exchange-correlation potential of a
homogeneous electron gas of density n. xcE is the exchange-correlation energy per particle of
a uniform electron gas of density n. The quantity ( )][ rnExc
rcan be further split into exchange

12
and correlation contributions: [ ] [ ] [ ])()()( rnErnErnE cxxc
rrr += . The exchange energy of an
electron in a uniform electron gas is [75]: ( ) 3/43/12 3
4
3][ rn
enEh
x
r
−=π
. (7)
The correlation energy of the homogeneous gas was calculated by accurate numerical
quantum Monte-Carlo simulations performed by Ceperly and Alder [76]. These results have
been fitted by analytic forms for [ ])(rnEc
r by Perdew and Zunger [77]. The correlation
potential is given as ( ) ( )s
scsscsc dr
rdErrErV
3
)(−= , (8)
where the parameter 3/1)4/3( nrs π= is the radius of a sphere containing one electron. The
expression given in Ref. [77] reads:
( )
>++−
<+−+−=
.1),3334.09529.11/(1423.0
.1),ln(*0020.00116.0)ln(*031.00480.02/1
sss
sssss
spz
crrr
rrrrrrE (9)
Generalized Gradient Approximation
The GGA can be formulated in terms of either two spin densities )(rnr↑ and )(rn
r↓ , or
total density )(rnr
and the fractional spin polarization defined as ( ) ( ) ( )( )rn
rnrnr r
rrr
↓↑ −=ξ . For
unpolarized systems ( ) ( ) ( ) 2/rnrnrnrrr == ↓↑ .
The GGA uses not only the density ( )rnr
at a particular point, but also its gradient ( )rnr∇ , in
order to account for the non-homogeneity of the true electron density. It is convenient to
define the functional in a generalized form [78-80]:
[ ] ( ) ( )≡∇∇= ↓↑↓↑↓↑∫ ,...)(,)(),(),(, 3 rnrnrnrnErrndnnE xc
GGAxc
rrrrr
( ) ( ) ( ),...)(,)(),(),()(3 rnrnrnrnFrnErrnd xchx
rrrrrr ↓↑↓↑ ∇∇≡ ∫ . (10)
Here xcF is function of the density and the density gradient, and ][nEhx is given by (7).
The exact exchange energy obeys the spin-scaling relationship:
[ ] 2/])2[]2[(, ↓↑↓↑ += nEnEnnE xcxcxc .
For exchange one can consider only ))(,( nnFx ∇ . Various forms for ),( snFx have been
proposed, for example by Perdew, Burke, and Enzerhof (PBE) [80], where

13
s
s
r
r
rn
rns
3/13/4 )3/2(2)(
)(
π∇
=∇
= r
r
is a scaled density gradient. It assumes large values not only for
large gradients, but also in regions of small densities, such as the exponential tails far from the
nuclei. The form of functional for exchange was proposed in Ref. [80] as
)/1/(1)( 2 kskksFx µ+−+= , where k = 0.804, and µ =0.21951 is the effective gradient
coefficient for exchange, cancels that for correlation. For this form 1)0( ==sFx and Fx→
const at large s.
The form for correlation is expressed as the local correlation plus an additive term,
both of which depend upon the gradients and the spin polarization:
[ ] ( ) ( ) ( )( )[ ]trrHrrErrndnnE sshc
PBEc ,,),(, 3 rrr ξξ += ∫
↓↑ , (11)
where nk
nt
sφ2
∇= is a dimensionless gradient. Here 2/))1()1(( 3/23/2 ξξφ −++= is a spin-
scaling factor and 0/4 akk Fs π= is the Thomas-Fermi screening wave number. In Ref. [80]
were constructed the gradient contribution as
++++=
422
223
0
2
1
11log),,(
tAAt
Att
a
etrH s γ
βγφξ . The function A is given
by 10
23 ]1)//[exp(/ −−−= aeEA hc γφγβ , where β =0.066725, and γ =0.025.
2.3. “Ab-initio” pseudopotentials
In this section I consider the problem of a choice of the potential Vext. Most of physical
and chemical properties of crystals depend to a good approximation only on the distribution of
the valence electrons. The core electrons do not participate in the chemical bond. They are
strongly localized around the nucleus, and their wave functions overlap only very little with
the core electrons from neighboring atoms. Thus, one might combine the Hartree potential of
the core electrons with the Coulomb potential of the nucleus to an ionic core potential.
However, this is not very useful since the valence wave functions still have to maintain their
nodal structure in order to be orthogonal to the core states. Thus, the idea of the
pseudopotential is the replace of the strong Coulomb potential of the nucleus and the effects
of the core electrons by an effective ionic potential acting on the valence electrons.

14
Pseudopotentials generated based of DFT calculations of atomic-like states are termed
“ab-initio”. The list of requirements for a pseudopotential is given in Ref. [81]. For r≥Rcut,
where Rcut is radius cutoff, one requires that: (i) )()( rrrr Φ=ψ and (ii)
r
r
r
r
∂Φ∂=
∂∂ )()(
rrψ. Here
)(rrψ and )(r
rΦ are the all-electron and pseudo wavefunctions respectively.
It is useful to separate the ionic pseudopotential into a local, i.e. independent, on the angular
momentum of electron part of the potential plus non-local (l-depended) term:
( ) ( )rVrVRrVrV lnonlocallocalil
M
iext
rrrrr,
1
)()( δ+=−=∑=
.
Since the eigenvalues and orbitals are required to be equal for pseudo and the all-electron case
for r>Rcut, each potential ( )rVl
r equals the local all-electron potential, and ( )
r
ZrV ion
l −→r for
∞→r . Thus ( ) 0, =rV lnonlocal
rδ for r >Rcut and all the long-range effects of the Coulomb
potential are included in ( )rVlocal
r. As it has been shown by Vanderbilt, [82] it is also possible
to construct a fully nonlocal potential directly from atomic all–electron calculations. Very
difficult to treat within a pseudopotential scheme are all elements with nodeless valence
states, in particular those with 2p valence electrons for nitrogen. For those elements the
pseudo and all-electron wave functions are almost identical. Since these valence electrons are
strongly localized in the ionic core region, many plane waves are required for a representation
of their wave function which often makes calculations for such elements prohibitively
expensive. Vanderbit has introduced ultrasoft pseudopotentials, in which the normconserving
requirement has been relaxed [82].
2.4. Plane wave based total energy calculation
In this section the basic expressions for plane wave based total energy calculations are
given. Plane waves are especially appropriate for fast Fourier transforms for periodic crystals.
In the periodic crystal, the wave functions of electrons are Bloch functions:
( ) ( ) ( )Gkri
G
eGkrrrr
r
rrr ++=∑ µµ ψψ , where Gr
is reciprocal lattice vector.
The Kohn-Sham equations can be written as:

15
( ) ( ) ( )GkGkVGkmG
GGGG
rrrrrrh
r
rrr +=′+
+′+∑
′′′ µµµ
µ ψεψδ,
22
2. (12)
Here ( ) ( ) ( ) ( )
+−′−′+−′+−′= ∑ ′++′′l
GkGkllocalxcCoulGGVGGVGGSGGVGGVV rrrrrr
rrrrrrvr
,,,µ , where
( ) ( )2
24
G
GneGVCoul
rr π= , ( ) ( )∑
=
=M
iiRGi
MGS
1
exp1 rrr
is the structure factor for each species kr
, thus
( ) 00 ==GVCoul
r, ( ) 00 ==GVlocal
r, ( ) 10 ==GS
r. )()()( GnGVGGV xcxc
rrrr=−′ ;
( ) ( ) ( ) ( ) ( )( )γπcos12
4 2
,, llllGkGklPrdrrGkjrGkjrVl
V
MV
rrrrrrrrrrrr ′+++≡ ∫′++ , where V- is volume of
unit cell, ( )Gkj l
rr+ are spherical Bessel functions,
( )( ) |]}|][|/[|]][{[cos GkGkGkGkPP ll ′++′++=rrrrrrrr
γ are the Legendre’s polynomials. Thus:
( ) ( ) ( ) ( ) ( ) ( ) ( )
++
+−=
→∑ ∑∑ GnGVGnGV
M
VGEGnGV
M
VE localCoul
GG GxcCoultot
rrrrrrr
rr r 2
1lim
2
10µ
µε
2.5. Details of calculations
In our calculations the exchange and correlation effects have been treated using both
the generalized gradient PBE [80] and the local spin density PZ [77] approximations. Most of
the calculations were performed within GGA, which typically is more accurate for magnetic
systems. Test LSDA calculations were performed for several cases, and quantitatively similar
results were obtained using the two approximations for both structural parameters and spin
polarization energies. I have employed ESPRESSO code [83], and ultrasoft atomic
pseudopotentials [82]. The orbitals that were chosen as valence orbitals for pseudopotentials:
Be- 2s, 2p, Mg-3s, 3p, Ca-3s, 3p, 4s, 3d, Sr-4s, 4p, 4d, 5s, 5p, Ba-5s, 5p, 5d, 6s, 6p, N-2s, 2p,
P-3s, 3p, As-4s, 4p, Sb-5s, 5p, B-2s, 2p, Al-3s, 3p, Ga-3d, 4s, 4p, C-2s, 2p, Si-3s, 3p, Zn-3d,
4s, and O-2s, 2p. I also used the plane wave basis with the kinetic energy cutoff of 35 Ry
( cutEkG ≤+2
2
1 r). Brillouin zone integrations were performed using a regular mesh of
(12×12×12) k-points for zb and rs structures, and equivalent meshes for other structures. The
general expression for k-point mesh proposed by Monkhorst and Pack is
ii i
iinnn G
N
Nnk
rr
∑−−
≡3
,, 2
12321
, where iGr
are the primitive vectors of the reciprocal lattice [84].

16
The relaxation of atomic positions was performed until the forces acting in atoms were
smaller than 0.01 eV/Å. The convergence with respect to Ecut and k-point sampling was tested.
In the Part V I used the supercell approximation method. In the supercell
approximation one repeats periodically a finite unite cell containing the desired defect plus
neighboring host atoms. In the calculations it is important that extended states of the defect
are represented well. This can be obtained if the size and shape of the supercell are
appropriate. A good description of defect states requires that the interaction between
periodically repeated defects is weak. Otherwise, if the defect-defect distance is not large
enough, the electronic structure of the defect is distorted because the levels in the band gap
form energy bands with a finite dispersion. The small size of the supercell can also restrict the
atomic relaxations around the defect. For these reasons in our calculation the large periodic
supercell with 64, 216 or 512 atoms for zb structure, and with supercell containing 72 or 128
atoms for w structure were used. Calculations for the supercells have been done using 2×2×2
Monckhorst- Pack k-mesh for vacancies in 64, 72, 128, 216-atom supercells, and Γ-point for
512-atom supercells. The calculations showed that the appropriated results only in 128 and
512- atom supercell take place, except zb-GaP, it is appropriates in 216 – atom supercell.

17
Part 3
Magnetism of IIA-V compounds
As it was summarized in Part 1, several IIA-V group materials are predicted to be half-
metals with a total spin polarization of holes in the valence band [1-4]. In this Part I analyze in
detail stability of the ferromagnetic phase of bulk IIA-V materials for various crystal
structures. In fact, in contrast to III-V or II-VI compounds that typically crystallize in the zb
structure, II-V compounds crystallize in variety of structures [7-11, 85-97]. Consequently, I
consider here four structures: zinc blende (zb), rock salt (rs), NiAs, and Zn3P2. A detailed
analysis is performed for the most interesting rs phase, since according to the obtained results
the rs-IIA-V nitrides are FM. Finally, I identify the mechanism of stabilization of spin
polarization in both the rs- and zb-IIA-V nitrides.
3.1. Magnetic properties and electronic structure of II A-V compounds
In this Section, I analyze the magnetic structure of a number of IIA-V compounds,
namely: MgP, MgAs, CaN, CaP, CaAs, CaSb, SrN, SrP, SrAs, BaN, and BaAs. The analysis
is based on the calculation of the total energies, magnetic moments, charge densities, spin
densities, and density of states (DOS) of these compounds. The value of the lattice parameter
a corresponding to the minimum of total energy is the equilibrium lattice constant aeq of the
given phase. For the hexagonal structure, the lattice constants are obtained by minimizing the
total energy with respect to both a, c/a and the internal displacement parameter. I begin with
zb-CaP as example. Total energies of ferromagnetic (spinpolarized) FM and paramagnetic
(unpolarized) PM phases as functions of lattice constant are shown in Fig. 3.1. It is found that
the FM state is the ground state of zb-CaP.

18
CaP
6.6 6.8 7.0 7.2 7.4
-15.43
-15.42
-15.41
FM
PM
tota
l ene
rgy
(Ry)
lattice constant (Å)
CaP
6.6 6.8 7.0 7.2 7.4
-15.43
-15.42
-15.41
FM
PM
tota
l ene
rgy
(Ry)
lattice constant (Å)
Fig. 3.1. Dependence of the total energy on the lattice constant value of non magnetic (PM) and ferromagnetic (FM) phases for zb-CaP. Arrows indicate the equilibrium lattice constants aeq.
Table 3.1. Energies of spin polarization ∆EFM-PM and ∆EFM-AFM (in meV per 2 atoms) for rs, NiAs, and zb structures, (in meV per 2 atoms). Last column gives energies of spin polarization of isolated group-V atoms (in eV).
∆EFM-PM (crystal) ∆EFM-AFM (crystal) ∆EFM-PM (anion)
rs NiAs zb rs zb
BaN −90 −105 −125 −5 −45
SrN −135 −205 −185 −35 −50
CaN −140 −125 −195 −65 −50 −2.45
CaP −3 0 −55 0 −1.37
CaAs 0 0 −40 −1.24
CaSb 0 0 −5 −1.02
The stability of the spin-polarized (FM) case relative to the non-polarized (PM)
situation is given by the energy difference ∆EFM-PM = EFM-EPM. We also calculated the
difference in energies of FM and antiferromagnetic of I type (AFM) phases, ∆EFM-AFM. The
calculated magnetic properties of the considered compounds at equilibrium are summarized in
Table 3.1.

19
First, one can see that the spin polarization of the considered compounds in the zb
structure is non-vanishing. This result holds for SrAs and BaAs as well. The smallest values
are fared for zb- MgN (∆EFM-PM = -6 meV). On the other hand, zb-MgP, zb-MgAs, and all zb-
Be-V [3] crystals are paramagnetic, i.e. ∆EFM-PM = 0. Second, the energy of spin polarization
increased with a decrease of atomic number of an element of group IIA (a cation). For
example, ∆EFM-PM is -125, -185, and -195 meV for BaN, SrN, and CaN, respectively. For Ca-
V materials ∆EFM-PM increased with the decrease of atomic number of an element of anion.
So, ∆EFM-PM is -5, -40, -55, and -195 meV for CaSb, CaAs, CaP, and CaN, respectively. In
more details we shall consider it in the Section 3.1.2. Next, as it follows from the Table 3.1, in
both the rs and the NiAs structure only the IIA-nitrides are FM. Regarding ∆EFM-PM as a rough
estimate of the Curie temperature we observe that ∆EFM-PM of about 100 meV corresponds to
about 1000 K. Consequently, one may expect IIA-nitrides in rs phase to be FM at temperatures
of the order of 100 K.
Finally, independent of the crystal structure, the calculated magnetic moment per two
atoms µ is always equal to 1 µB in the spin polarized phase. A borderline case is rs-CaP, for
which the very small ∆EFM-PM = -3 meV is practically vanishing within our numerical
accuracy, consistently with its small magnetic moment, 0.2 µB. In contrast, Ca3N2, Sr3N2,
Ba3N2 in the Zn3P2 structure are paramagnetic.
I have also investigated the relative stability of FM and AFM phases. The calculations
were performed only for the most interesting cases of rs and zb phases of IIA-N nitrides. (This
is because the NiAs structure is less stable than rs, see Section 3.2, and spin polarization of
other rs-IIA-V crystals vanishes.). To this end I considered the type-I AFM ordering, in which
spins of anions in every (001) plane are parallel, but the sign of the polarization of consecutive
planes alternates [98]. The calculated differences between energies of FM and AFM phases,
∆EFM-AFM, are given in Table 3.1. The results show that in all crystals the FM phase is the
ground state magnetic order. Furthermore, the absolute values of energy of spin polarization
(∆EFM-PM) are higher than those of ∆EFM-AFM. This shows that with the increasing temperature
spin polarization should vanish as a result of the disordering of the magnetic moments, and
not of their disappearance. Like with the ∆EFM-PM energy ∆EFM-AFM increases with the
decreasing atomic number of the cation: ∆EFM-AFM is -5, -35, and -65 meV for BaN, SrN, and
CaN, respectively.

20
4 6 8 10 12 14 16-15.0
-14.8
-14.6
-14.4
-14.2
tota
l en
ergy
(R
y)
lattice constant (Å)
ABC
zb -CaAs
4 6 8 10 12 14 160
1
2
3
mag
netic
mom
ent
( µµ µµB)
lattice constant (Å)
ABC
zb-CaAs
2 4 6 8 10 12 14 16
-15.4
-15.2
-15.0
-14.8
-14.6
C B
tota
l en
ergy
(R
y)
lattice constant (Å)
A
zb-CaP
2 4 6 8 10 12 14 160
1
2
3
C B
mag
netic
mom
ent
( µµ µµB
)
lattice constant (Å)
A
zb-CaP
4 6 8 10 12 14-94.6-94.4-94.2-94.0-93.8-93.6-93.4 zb- CaN
tota
l ene
rgy
(Ry)
lattice constant (Å)
ABC
4 6 8 10 12 140
1
2
3zb- CaN
mag
netic
mom
ent
( µµ µµB
)
lattice constant ( Å)
ABC
4 6 8 10 12 14
-94.6
-94.4
-94.2
-94.0
-93.8 rs- CaN
tota
l ene
rgy
(Ry)
lattice constant ( Å)
ABC
4 6 8 10 12 140
1
2
3
rs- CaN
mag
netic
mom
ent
( µµ µµB
)
lattice constant ( Å)
ABC
Fig. 3.2. Total energy and total magnetic moment per unit cell as function of the lattice constant of CaAs, CaP, and CaN. Arrows indicate the equilibrium lattice constants aeq.

21
In order to understand the calculated magnetic properties we will follow the formation
of an IIA-V crystal beginning from the case of isolated atoms, and ending with the case of a
compressed solid. The calculated total energies and the magnetic moments of zb-CaAs, CaP,
CaN, and rs- CaN are shown in Fig. 3.2. These results are typical for all the considered IIA-V
crystals. One may see that there are three ranges of lattice constants characterized by
qualitatively different properties, for which the magnetic moment per unit cell is 3, 1, and 0
µB, and denoted as A, B, and C, respectively.
3.1.1. Hund’s rule. Magnetic moments of isolated atoms
I shall now discuss the obtained results beginning with the case of large lattice
constants, i. e., region A in Fig. 3.2. This case corresponds to the situation of “isolated” atoms.
The “band structure” of CaAs at 15 Å is show in Fig. 3.3. From Fig. 3.3 one can see that in
this case band are not formed. The total energy of this “compound” is the superposition of
atomic energies of cation and anion. Similarly, the total magnetic moment is the superposition
of magnetic moment of Ca and As. The total magnetic moment per cell is 3 µB. This stems
from the fact that Ca (and other group- IIA atoms) has 2 valence electrons with opposite spins
on the s orbital, and its magnetic moment vanishes, while N (and other group-V atoms) has 5
valence electrons, three of them from the p orbital have parallel spins according to Hund's
rule, and the magnetic moment of N is 3 µB (Fig. 3.3).
"isolated atoms"
EF
-14
-12
-10
-8
-6
-4
-2
0
XΓL
Ene
rgy
(eV
)
-14
-12
-10
-8
-6
-4
-2
0
Γ XL
E
s(As)s(As)
p(Asp(Asp(Asp(As))))s(Ca) s(Ca)
p(Asp(Asp(Asp(As))))
spin up spin down "isolated atoms"
EF
-14
-12
-10
-8
-6
-4
-2
0
-14
-12
-10
-8
-6
-4
-2
0
XΓL
Ene
rgy
(eV
)
-14
-12
-10
-8
-6
-4
-2
0
Γ XL
E
s(As)s(As)
p(Asp(Asp(Asp(As))))s(Ca) s(Ca)
p(Asp(Asp(Asp(As))))
spin up spin down
Fig. 3.3. “Band structure” and the electronic levels scheme of CaAs at a = 15 Å.

22
By the same arguments, magnetic moment of GaAs (Fig. 3.15) is 4 µB per unit cell
(when the spins of Ga and As are parallel).
It is known that spin moments of electrons in an atom or an ion give rise to their
magnetic properties. The relative orientations of spins are determined by the interactions
between the electrons together with the Pauli exclusion requirement. In the ground state the
electronic configuration of an atom is determined by the first Hund’s rule. In our calculations
we neglect the spin-orbit interactions, and thus, the third Hund’s rule does not apply. Below,
briefly summarize the physical interpretation of the first Hund’s rule because the spin
polarization energy obtained in calculations by LSDA (or GGA) is equivalent of Hund's first
rule energy.
The first Hund’s rule asserts that, within a given configuration of one-electron orbitals,
the ground state of isolated atom has largest value of the total spin. A reason for the increased
stability of high multiplicity states is that the different occupied spatial orbitals create a larger
average distance between electrons, reducing electron-electron repulsion energy. It has been
shown that the actual reason behind the increased stability is a decrease in the screening of
electron-nuclear attractions. To understand the effect of the exchange (spin-spin) interaction
usually considers as example an atom of carbon, i.e., the case of two electrons on p-orbitals.
In this case, the state with spins in parallel (triplet) state lower in the energy than the state
with spins in antiparallel (singlet) state. The fact that the spins are parallel makes the spin part
of the wavefunction to be symmetric, and forces the spatial part to be antisymmetric. An
antisymmetric spatial wavefunction for two electrons implies a larger average distance
between them than a symmetric function. The electron location probability is squared
wavefunction, and the squared antisymmetric function vanishing when |r1-r2|= 0. This is called
the exchange hole effect [99]. In general, probability for a small separation between two
electrons is smaller for a symmetric spatial wavefunction than for the antisymmetric one. In
parallel, a second effect takes place: if electrons are on average further from each other, then
there will be less shielding of the nucleus for another electron, so a given electron will
therefore be more exposed to the nucleus. This implies that it is more tightly bounded and
lowers in energy. In short, p electrons if, e.g., As have the same kinetic energy, and the same
potential energy of the nucleus. Parallel-spin electrons avoid each other more effectively
because the exchange hole effect takes place and increase the attraction by the nucleus.
Hund’s first rule follows.

23
So, when there is choice of putting either two unpaired electrons in two different
degenerate orbitals of p subshells, or two paired electrons in the same orbital, Hund's rule
indicates that the former arrangement is of lower energy. For example, if there are three
available p orbitals (px, py, pz) the first three electrons will fill these one at a time, each with
the same spin. When the fourth electron is added, it will enter the px orbital and will adopt the
opposite spin since this is a lower energy configuration.
3.1.2. Energy bands and magnetic moments at equilibrium
With the decreasing lattice constant the atoms begin to interact and form bonds. This
leads to a decrease of the total energy and to a drop of the magnetic moment from 3 to 1 µB.
Fig. 3.2 shows that the onset of formation of bonds (displayed by the decrease of the total
energy) is correlated with the drop of magnetization, which occurs at ~9 Å for zb-CaN, and
~8.5 Å for rs-CaN. The magnetic moment is then constant for 4.5 Å < a < 9 Å for the zb, or
3.7 Å < a < 8.5 Å for the rs phase, respectively. The drop of the magnetic moment is due to
the changes in the electronic structure and charge transfer effects induced by formation of
bonds. A detailed analysis of the electronic structure is presented below.
Atomic origin of spin polarization
I begin with the most important question, which is the origin of the ferromagnetism
found for several IIA-V crystals. I identify it by analyzing their electronic structure. The
emerging picture is particularly clear for the zinc blende phase. Considering the series of Ca
compounds (CaN, CaP, CaAs, CaSb) one can see from Table 3.1 that ∆EFM-PM is the largest
for CaN, −195 meV, it decreases with the increasing atomic number of the anion, and it
almost vanishes for CaSb. This suggests that anions play a dominant role in determining the
spin polarization of crystals. In fact, as it clearly follows from Fig. 3.4, this trend found for
crystals is in full agreement with the trend exhibited by the calculated energies of spin
polarization of isolated anions, which decrease from −2.45 eV for N to −1.02 eV for Sb.
Moreover, the spin polarization energy is about twice higher for N than for the remaining
anions. This fact explains not only the presence of the FM order in zb SrN and BaN, but also
the pronounced stabilization of spin polarization found for both the NiAs and the rs structures

24
of the nitrides, see Table 3.1. This result suggests that the driving force of ferromagnetism of
IIA-V compounds is the spin polarization of partially occupied p(anion) orbitals.
-200
-100
0
-2
-1
∆EF
M-P
M(e
V)
∆EF
M-P
M(m
eV)
zb
rs
SbAsPN
CaSbCaAsCaP
CaN
atom
Fig. 3.4. Difference in energies of FM and PM phases ∆EFM-PM for CaX compounds in the rs and zb structures, together with those for isolated anions. The lines are to guide the eye.
This hypothesis is confirmed by the analysis of the density of states (DOS) and of
projection of the wave function on atomic orbitals shown in Figs. 3.5 -3.8 for zb-CaN, CaAs
and SrN, CaN, CaP, and CaAs in the rs structure.
Fig. 3.5 shows the calculated spin-resolved total and partial densities of states (DOSs)
of zb-CaN at its equilibrium lattice constant. We see that the states of majority-spin electrons
on Fermi level are filled. These states are formed mainly by the 3(p) N states with a very
small contribution (< 8 %) from Ca states. For the minority-spin chancel, the states on Fermi
level also originate mainly from the 3p(N) states, but in this case the Fermi level crosses the
bands. The lowest valence states (<-6 eV) for both up and down spin channels are formed by
the 3s(N) states, and the conduction bands in both spin channels are mainly of 4d(Ca)
character. The very small contribution (< 0.6 %) from 5s(Ca) states to valence and conduction
bands.

25
-8 -4 0 4 8 12 16
-3-2-10123 zb-CaN
D
OS
(st
ates
/eV
) total
-8 -4 0 4 8 12 16
-0.08
-0.04
0.00
0.04
0.08 4p(Ca) zb-CaN
-8 -4 0 4 8 12 16-2.4-1.6-0.80.00.81.62.4
4d(Ca) zb-CaN
-8 -4 0 4 8 12 16
-0.16
-0.08
0.00
0.08
0.16 5s(Ca) zb-CaN
DO
S (
stat
es/e
V)
energy(eV)
-8 -4 0 4 8 12 16-1.6
-0.8
0.0
0.8
1.63s(N) zb-CaN
energy(eV)
-8 -4 0 4 8 12 16-3-2-10123 zb-CaN
energy(eV)
3p(N)
Fig. 3.5. Density of states per unit cell of zb-CaN. Both the total DOS and the contributions of p and d orbitals are given. Vertical lines show the Fermi energy. Positive and negative values of DOS hold for spin-up and spin-down states, respectively.
Very similar results are obtained for the zb phase of all IIA-V compounds in spite of
differences in the detailed dispersions of energy bands.
In all considered rs-IIA-V compounds (see Fig. 3.6) the top of the valence band also is
mainly formed from the p orbitals of anions, which contribute about 75 per cent. The
contribution of d orbitals of cations to the valence bands is at least five times smaller. These
orbitals (which are the lowest excited states of cations) contribute mainly to the higher
conduction states. In particular, they give rise to a d(Ca)-derived bands at about 4-8 eV above
the bottom of the conduction band. The spin polarization of SrN and CaN is visible; one may
also see a very weak polarization in CaP, while that of CaAs vanishes.

26
-4 0 4 8 12 16-3,2-2,4-1,6-0,80,00,81,62,43,2
spin
spin
totalrs-SrN
DO
S [s
tate
s/eV
]
-4 0 4 8 12 16
-2,4-1,6-0,80,00,81,62,4
spin
totalrs-CaN
spin
-4 0 4 8 12 16-2,4
-1,6
-0,8
0,0
0,8
1,6
2,4totalrs-CaP
-4 0 4 8 12 16
-2,4-1,6-0,80,00,81,62,4 totalrs-CaAs
-4 0 4 8 12 16-3,2-2,4-1,6-0,80,00,81,62,43,2
rs-SrN 2p (N)
DO
S [s
tate
s/eV
]
-4 0 4 8 12 16
-2,4-1,6-0,80,00,81,62,4 rs-CaN
2p (N)
-4 0 4 8 12 16-2,4
-1,6
-0,8
0,0
0,8
1,6
2,4 3p (P)rs-CaP
-4 0 4 8 12 16-2,4-1,6-0,80,00,81,62,4
4p (As)rs-CaAs
-4 0 4 8 12 16
-1,2-0,8-0,40,00,40,81,2 rs-SrN
4d (Sr)
DO
S [s
tate
s/eV
]
energy(eV)
-4 0 4 8 12 16
-2,4-1,6-0,80,00,81,62,4 rs-CaN
energy(eV)
3d (Ca)
-4 0 4 8 12 16-2,4
-1,6
-0,8
0,0
0,8
1,6
2,4
3d (Ca)
rs-CaP
energy (eV)
-4 0 4 8 12 16-2,4-1,6-0,80,00,81,62,4
3d (Ca)rs-CaAs
energy (eV)
Fig. 3.6. Density of states per unit cell of SrN, CaN, CaP, and CaAs in the rs structure. Both the total DOS and the contributions of p and d orbitals are given.
Figs. 3.7 and 3.8 confirm the conclusion that the spin polarization of crystals results
from the spin polarization of the p(anion) states. A plot of the charge and spin density of CaAs
is shown in Fig. 3.8. One can see that the spin density is well localized at the As site. From the
plot of charge density can see that the charge density is strong localized at the atoms and it’s
the spherical form. Therefore, zb-CaAs is ionic compounds. Quite probably, that ionicity of
the compound plays an important role for magnetism.
The contour plot of the spin density displayed in Fig. 3.8 for both zb and rs-CaN also
shows that the spin polarization is strongly localized in the vicinity of N atoms. In accord with
Fig. 3.7, the contribution of Ca states is visible, but small. Qualitatively identical results are
obtained for BaN and SrN. Finally, we note that a large contribution of the d(Ca) states to the
valence bands could in principle explain the magnetism of II-V compounds, which would then
have an origin similar to that in systems containing transition metal atoms. This explanation
was suggested by Kukasabe et al. [1]. However, the obtained results show that this is not the
case.

27
Fig. 3.7. Contour plots of the calculated charge (left panel) and spin (right panel) densities for zb-CaAs in the (110) plane.
Fig. 3.8. Contour plots of the calculated spin density for zb-CaN in the (110) plane (left panel), and rs-CaN in the (001) plane (right panel).
Energy bands and magnetic moments at equilibrium
The spin-polarized band structures of ferromagnetic zb-Ca-V compounds at
equilibrium lattice constants are shown in Fig. 3.9. Figure 3.10 shows the band structure of
the NiAs-CaN. And finally the calculated band structures of CaN, CaP, CaAs, SrN, and BaN
in the rs phase at equilibrium are shown in Fig. 3.11 (energy bands of CaSb are similar to
these of CaAs).
With the decreasing lattice constant from the case A of isolated atoms to the case B,
the electrons begin to form chemical bonds. In particular, for CaN the bonding combination of
p(N) with Ca orbitals decreases in energy and forms the Γ15 top of the valence bands, while
the antibonding combination of s(Ca) with s(N) and p(N) orbitals rises in energy and forms

28
the bottom of the conduction band, see Figs. 3.9-3.11. Consequently, 2 electrons are
transferred form s(Ca)-derived to spin-down p(N)-derived states, reducing the magnetic
moment from 3 to 1.
I begin with an analysis of the band structure of zb phase (see Fig. 3.9). In all cases, in
these materials two spin bands show a completely different behavior. While the minority spin
band (referred to as spin-down band) electrons exhibit metallic character, the majority-spin
(referred to as spin-up band) channel exhibits a semiconducting behavior with an energy gap
at the Fermi level. Therefore zb-IIA-V compounds are half-metals with the full spin
polarization of holes in Fermi level. For CaSb both the spin up and spin down electrons show
metallic character. This is the reason for which the energy of spin polarization is small (-5
meV) in this case.
-8
-4
0
4
8
12
ener
gy (
eV)
EF
ΓL X
zb-CaN
-8
-4
0
4
8
12
ΓL X
zb-CaN
-8
-4
0
4
8
Γ XL
ΕΕΕΕF
zb-CaP
-8
-4
0
4
8
Γ XL
zb-CaP
-8
-4
0
4
8
XΓΓΓΓ
ener
gy (
eV)
L
zb-CaAs
-8
-4
0
4
8
XΓΓΓΓ
L
zb-CaAs
-8
-4
0
4
8
Γ XL
zb-CaSb
-8
-4
0
4
8
zb-CaSb
L XΓ
Fig. 3.9. Band structures of zb-CaN, CaP, CaAs, and CaSb at equilibrium.
29
-12
-8
-4
0
4
8
ener
gy (
eV)
E F
Γ
NiAs-CaN
K A
-12
-8
-4
0
4
8
Γ
NiAs-CaN
K A
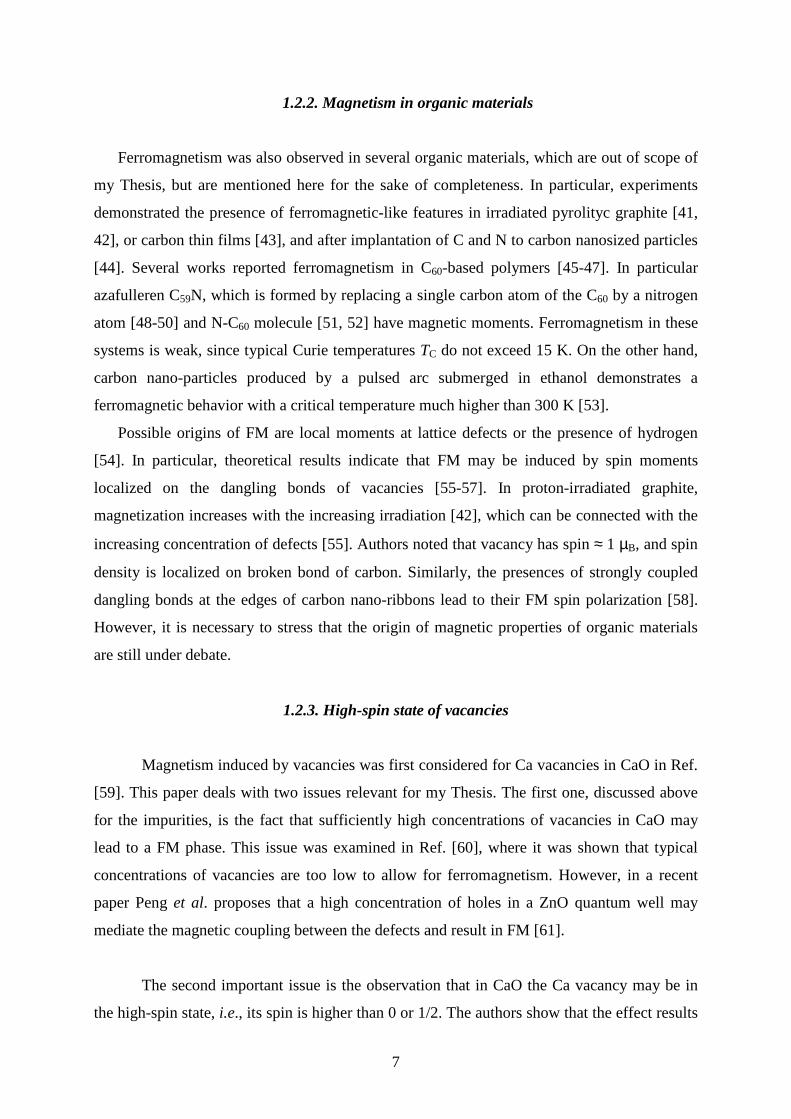
Fig. 3.10. Band structure of NiAs-CaN at equilibrium for spin-up and spin-down states.
I now turn to the NiAs structure (see Fig. 3.10). Below we find that this phase is more
stable than zb for all the considered compounds. However, from the Table 3.1 it follows that
in the NiAs structure only IIA-nitrides are ferromagnetic at equilibrium. The typical complex
band structure of NiAs-CaN is shown in Fig. 3.10; we see that the system is a half-metal.
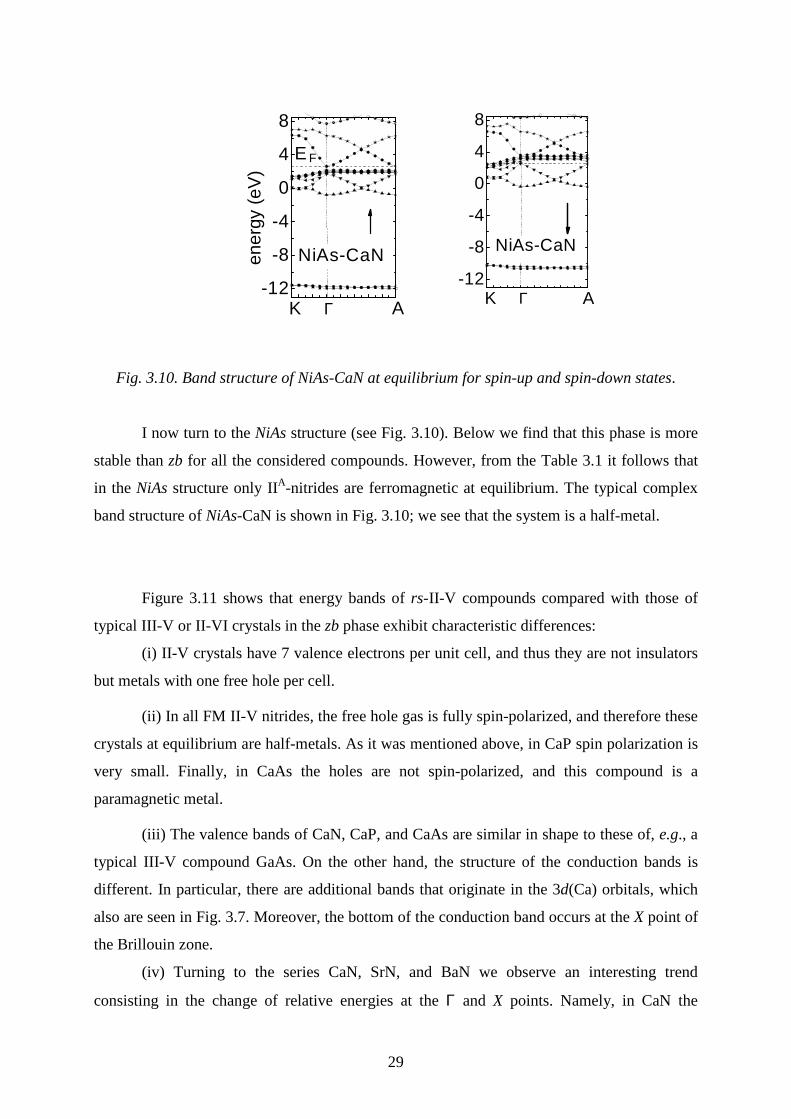
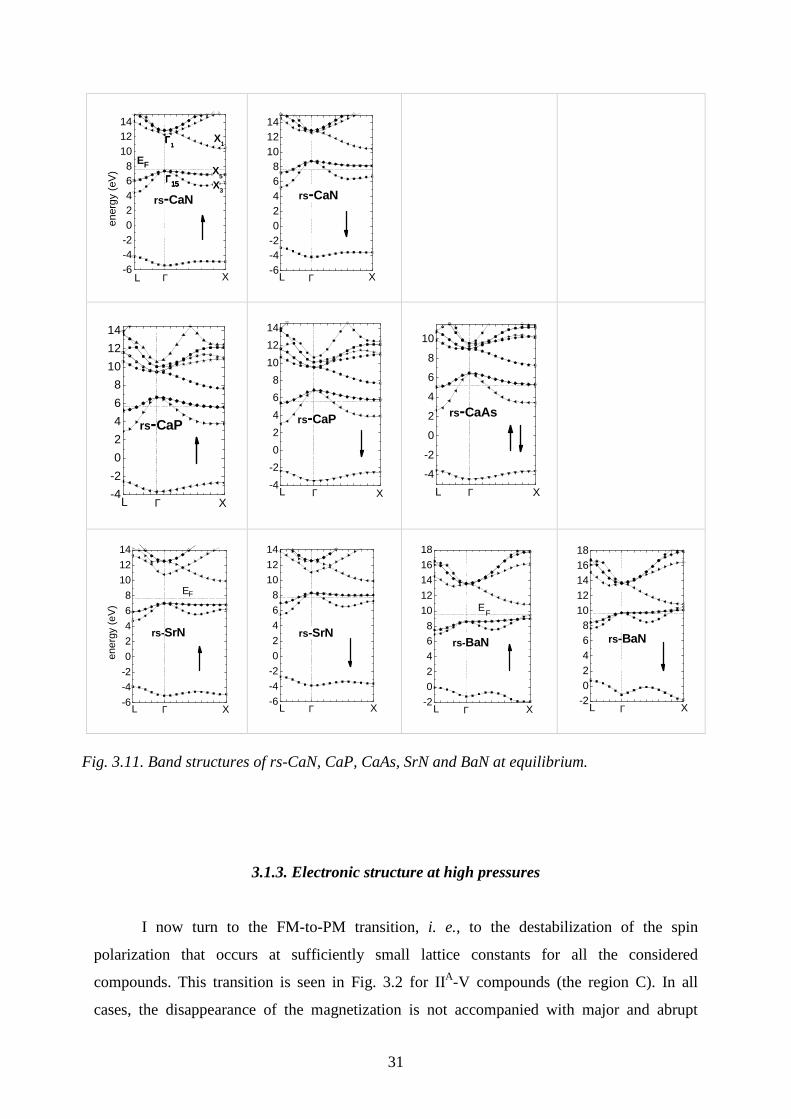
Figure 3.11 shows that energy bands of rs-II-V compounds compared with those of
typical III-V or II-VI crystals in the zb phase exhibit characteristic differences:
(i) II-V crystals have 7 valence electrons per unit cell, and thus they are not insulators
but metals with one free hole per cell.
(ii) In all FM II-V nitrides, the free hole gas is fully spin-polarized, and therefore these
crystals at equilibrium are half-metals. As it was mentioned above, in CaP spin polarization is
very small. Finally, in CaAs the holes are not spin-polarized, and this compound is a
paramagnetic metal.
(iii) The valence bands of CaN, CaP, and CaAs are similar in shape to these of, e.g., a
typical III-V compound GaAs. On the other hand, the structure of the conduction bands is
different. In particular, there are additional bands that originate in the 3d(Ca) orbitals, which
also are seen in Fig. 3.7. Moreover, the bottom of the conduction band occurs at the X point of
the Brillouin zone.
(iv) Turning to the series CaN, SrN, and BaN we observe an interesting trend
consisting in the change of relative energies at the Γ and X points. Namely, in CaN the

30
curvature of the highest valence bands along the Γ-X direction is small, but the maximum of
this band occurs at Γ. In the case of both SrN and BaN, the band maximum is shifted from Γ
to X. Consequently, in these two compounds the gap has a direct character, but the gap
minimum occurs at the X point. Moreover, the minimum of the lower valence band situated
about 10-12 eV below the top of the valence band is shifted from Γ to X. The small
dispersions and atypical shapes of the valence bands result mainly from the large values of the
lattice constant due to the large atomic radii of the heavy Ca, Sr, and Ba cations. Moreover,
since the top of valence band is mainly formed from p(N) orbitals that have a small atomic
radius, the overlap between cations, i. e., second neighbors, may play an important role in
determining the actual dispersion of these bands.
According to the obtained results, rs-II-N nitrides are half-metals. Nevertheless, the
flatness of the upper valence band may suggest that these systems are magnetic Mott-Hubbard
insulators, similarly to several transition metal oxides in which strong electron correlations
play a critical role. This possibility may be verified by calculations beyond LSDA that use
methods appropriate for highly correlated systems. However, even if this would be the case,
the main physical effect on which we focus here, i. e., the magnetism based on partially filled
p (and not d or f) atomic shell, would remain valid.
Finally, the band structure of IIA-V compounds in Zn3P2 phase is complex and
'obscure' due to the fact that the unit cell contains 40 atoms with 128 valence electrons, which
occupy 64 bands spanning an energy range of about 10 eV. For this reason we do not show it.
The most important result that should be pointed out is that Ca3N2, Sr3N2, and Ba3N2 are all
insulators with the calculated band gaps of about 0.5 eV. The insulating character of these
compounds follows in particular from the fact that there is an even number of electrons per
unit cell. Consequently, there are no free holes and the spin polarization is zero
31
-6-4-202468
101214
rs-CaN
ΓΓΓΓ1111
ener
gy (
eV)
EF
ΓL X
ΓΓΓΓ15151515
X1
X5
X3
-6-4-202468
101214
ΓL X
rs-CaN
-4
-2
0
2
4
6
8
10
12
14
rs-CaP
L XΓ
-4
-2
0
2
4
6
8
10
12
14
rs-CaP
XΓL
-4
-2
0
2
4
6
8
10
rs-CaAs
L Γ X
-6
-4
-2
0
2
4
6
8
10
12
14
ener
gy (
eV)
ΓL X
EF
rs-SrN
-6
-4
-2
0
2
4
6
8
10
12
14
ΓL X
rs-SrN
-2
0
2
4
6
8
10
12
14
16
18
ΓL X
EF
rs-BaN
-202468
1012141618
ΓL X
rs-BaN
Fig. 3.11. Band structures of rs-CaN, CaP, CaAs, SrN and BaN at equilibrium.
3.1.3. Electronic structure at high pressures
I now turn to the FM-to-PM transition, i. e., to the destabilization of the spin
polarization that occurs at sufficiently small lattice constants for all the considered
compounds. This transition is seen in Fig. 3.2 for IIA-V compounds (the region C). In all
cases, the disappearance of the magnetization is not accompanied with major and abrupt

32
changes of the band structure, and the decreasing lattice constant induces a progressive
decrease of the spin splitting, as well as an increase of the width of the valence bands. In this
Section we point out that independently of the actual origin of spin polarization, the kinetic
energy and its increase with the decreasing atomic volume under hydrostatic pressure always
play an important role in destabilizing the FM phase. The pressure-induced disappearance of
the spin polarization may qualitatively be understood based on the Stoner criterion [100]. This
criterion indicates that the stability of spin polarization is favored by large magnetic
susceptibility, which is proportional the density of states at the Fermi level, and is destabilized
by kinetic energy Ekin at high electron densities. We briefly discuss these factors.
Previously, the dependence of the magnetic ordering on the external pressure (which is
equivalent to the change of the lattice constant, or the change of the electron density) has been
considered for two types of systems. The first one is the model case of free electron gas,
analyzed within both the Hartree-Fock approximation, and by extensive quantum Monte Carlo
calculations [76,101,102]. Second, the FM-to-PM transition induced by the increasing
hydrostatic pressure has been observed for a number of real compounds containing transition
metals, such as MnN. In both cases, the origin of spin polarization and the mechanism of
transition to the paramagnetic phase are different. Below, we discuss both cases, and show
that II-V do not belong to either case.
In the case of MnN, both the origin of magnetism and the reason of its disappearance
at high pressures are different. Magnetism is due to the presence of transition metal Mn ions,
which have a non-vanishing spin moment. However, at high pressures the crystal field
splitting of the half-filled d(Mn) shell exceeds the exchange splitting onto e doublet and t2
triplet states, which induces transfer of electrons from the spin-up t2 states to the spin-down e
states, reducing the magnetic moment to zero [97].

33
Fig. 3.12. Electronic level scheme for the FM and PM states.
I now turn to the case of free electrons. Within the Hartree-Fock approximation, free
electrons at sufficiently low electron densities are spin polarized due to the exchange
coupling. Magnetic properties of free electrons have been analyzed in a much more exact way
by quantum Monte Carlo calculations [76, 102], which include electronic correlations. It was
found that the FM phase induced by the exchange interaction is stable in the density range
6×10¹⁸ < n < 2×1020 cm-3. At higher densities the FM phase is destabilized by the increasing
role of the kinetic energy [76]. In particular, with the increasing electron density the
difference between kinetic energies of the FM and PM phases increases. To illustrate this
factor we note that in the simplest case of the total spin polarization twice more k-states are
occupied in the FM phase (with 1 electron per k-vector) than in the PM phase (with 2
electrons per k-vector). Consequently, the corresponding Fermi wave vectors
obey PMF
FMF kk 312= , and the transition to the PM state lowers the kinetic energy by 22/3 (see
Fig. 3.12.). Therefore, the difference between the kinetic energies of FM and PM phases
is */17.0 22 mkFh , which obviously increases with the increasing electron density, i.e., with the
decreasing lattice constant.
One can also consider a more realistic model of a band with a sinusoidal dispersion,
which is a good approximation of the valence bands in of II-V compounds in the zb-phase
(Fig. 3.10), i.e., E(k)= 2ε0 sin (kA), with ε0=εF/2. In this case,
ferromagnetic E
kF(FM)
paramagnetic E
kF(PM)

34
( ) ( )
( )−−
−−+−=∆ −
)sin()2sin(2
)cos()2cos(22
)sin()2sin(2
3/12
3/13/13/13/22
0
AkAkA
AkAkA
kAkAkk
AnE
FF
FFF
FFFcrit
PMFM
πε
where the first and the second term correspond to the Hartree-Fock energy of ferromagnetic
and of paramagnetic situation, respectively. This expression allows one to find the critical
concentration of free holes, crn , at which PMFME −∆ vanishes. This occurs at the critical lattice
constant acrit, for which3/1
24
=
critnA
π, and ( ) 3/123 critF nk π= . Significantly, the calculated
values PMFME −∆ using this simple model and the equilibrium lattice constants of zb-II-V
crystals agree to within ~15% with the values PMFME −∆ from Table 3.1.
These arguments explain the disappearance of the magnetic moment at small lattice
constants. Moreover, they may explain the lack of FM in zb-Be-V [3] and zb-Mg-V
compounds, which have lattice constants smaller than the corresponding compounds of Ca,
Sr, and Ba. Both zb-MgP and MgAs at equilibrium are paramagnetic because their lattice
constants are smaller, and thus Ekin are larger, compared with these of CaP and CaAs,
respectively, see Fig. 3.13.
In crystals, the destabilizing role played by Ekin is further enhanced by a second factor,
which is the decrease of the effective mass m* of free carriers with the decreasing lattice
constant. This effect originates in the increase of the band widths due to stronger interatomic
interactions. These arguments hold in IIA-V crystals with the zinc-blende structure, where the
valence bands have sinusoidal-like shapes to a good approximation.

35
4 5 6 7 8
4
5
6
7
8PM
Crit
ical
latti
ce c
onst
ant (
Å)
Equilibrium lattice constant (Å)
CaN
CaP
CaAs
CaSbBaAs
SrAsMgAs
MgP
acr=aeq
GaAs
FM
SrNBaN
Fig. 3.13. Relation between the equilibrium aeq and the critical acrit lattice constants for zb –IIA-V
compounds.
On the other hand, the energy bands in rs-II-V nitrides have a more complex topology. As
an example we show in Fig. 3.14 both the band structure and the DOS for rs-CaN at the critical
lattice constant acrit for which the spin polarization vanishes. (The values of acrit are given in
Table II below). In this case there is an overlap of the conduction and valence states. In the spirit
of the Stoner criterion, the relevant quantity is the DOS at the Fermi level. The comparison of the
results from Figs. 3.12 and 3.14 illustrate well this point, since the DOS at the Fermi level
decreases almost three times when the lattice constant decreases from aeq = 5.0 to acrit = 3.7 Å,
driving the destabilization of the FM phase.
8
12
16
20
24
28
32
36
Ene
rgy
(eV
)
ΓL X
EF
rs-CaN
8 12 16 20 24 28 32 360,0
0,2
0,4
0,6
0,8
1,0rs- CaN
DO
S [s
tate
s/eV
]
Energy (eV)
total
8 12 16 20 24 28 32 360,0
0,1
0,2
0,3
0,4
0,5
0,6rs- CaN 2p (N)
Energy (eV)
8 12 16 20 24 28 32 360,0
0,1
0,2
0,3
0,4
0,5
0,6 rs- CaN 3d (Ca)
Energy (eV)
Fig. 3.14. Band structure of rs-CaN, and the total and partial densities of states at the critical lattice constant acrit = 3.7 Å. Dashed lines indicate the Fermi energy.
36
The above discussion of role of the kinetic energy is general in character, and to a large
degree independent of the crystal structure. In particular, it explains qualitatively the weaker
stability of FM in the rs-II-V crystals, which follows from the smaller equilibrium atomic
volumes found for this structure (and thus higher kinetic energies) as compared with the zb
structure. In fact, the atomic volumes in the rs phase are smaller by about 15% compared to the
zb phase.
In a broader perspective, the obtained results lead to a general question: why solids like Si
or GaAs, made out of atoms that carry magnetic moments, are non-magnetic? In fact, the atoms
constituting these crystals, Si, Ga, or As, have non-vanishing spin polarization according to the
Hund's rule, and in a naïve picture one may expect that these crystals should be magnetic as well.
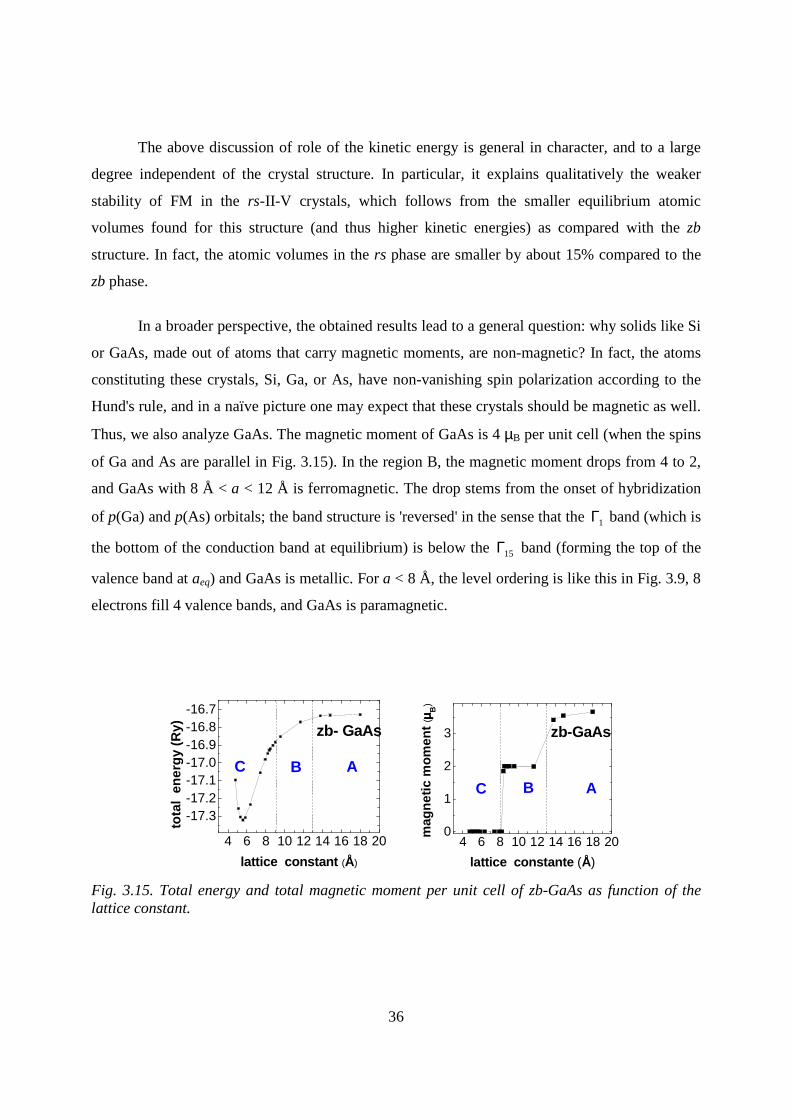
Thus, we also analyze GaAs. The magnetic moment of GaAs is 4 µB per unit cell (when the spins
of Ga and As are parallel in Fig. 3.15). In the region B, the magnetic moment drops from 4 to 2,
and GaAs with 8 Å < a < 12 Å is ferromagnetic. The drop stems from the onset of hybridization
of p(Ga) and p(As) orbitals; the band structure is 'reversed' in the sense that the 1Γ band (which is
the bottom of the conduction band at equilibrium) is below the 15Γ band (forming the top of the
valence band at aeq) and GaAs is metallic. For a < 8 Å, the level ordering is like this in Fig. 3.9, 8
electrons fill 4 valence bands, and GaAs is paramagnetic.
4 6 8 10 12 14 16 18 20
-17.3-17.2-17.1-17.0-16.9-16.8-16.7
tota
l en
ergy
(R
y)
lattice constant (Å)
zb- GaAs
ABC
4 6 8 10 12 14 16 18 200
1
2
3
mag
netic
mom
ent
( µµ µµB
)
lattice constante (Å)
zb-GaAs
ABC
Fig. 3.15. Total energy and total magnetic moment per unit cell of zb-GaAs as function of the lattice constant.

37
3.2. Structural stability of IIA-V compounds
In contrast to III-V or II-VI compounds that typically crystallize in the zb structure, II-V
compounds crystallize in variety of structures. Several II-V compounds assume the Zn3P2 phase,
which is a primitive tetragonal lattice with 40 atoms in the unit cell, or a more complex Zn3As2,
which is a body-center tetragonal structure with 160 atoms in the unit cell [7]. Materials with
these structures are not magnetic. SrN has been observed in two phases, namely rs [10] and
monoclinic [11, 12]. Magnetic IITM-V compounds usually crystallize in the NiAs structure. This is
the case of NiAs, CrAs, CrSb [8], and also of FM α-MnAs that crystallizes in the NiAs structure
with alternating hexagonal planes of Mn and As atoms [9]. However, it is important to notice that
with the help of epitaxial techniques of growth it is possible to synthesize these compounds in
other structures that are metastable. For example, CrAs [85] and CrSb [86] layers have been
fabricated in the metastable zb structure by molecular beam epitaxy in spite of the fact that the
calculated total energy of this phase is at least 0.4 eV/atom higher than that of the ground state
NiAs phase [87]. Turning to the case of IITM-V nitrides we observe that the early transition metal
mononitrides TiN and VN crystallize in the rock salt structure [88]. In particular, rs-ScN [89], rs-
CeN [90], and rs-CrN [91] were grown by sputter deposition on MgO(001) substrates. Finally,
the ground state phase of MnN is the rock salt structure with a weak tetragonal distortion [92, 93]
and AFM ordering, reproduced by first principles calculations [94, 95]. The AFM ordering has
also been found both for the zb [96] and for the wurtzite [97] metastable structures of MnN.
Because of the variety of possible structures of IIA-V compounds, it is important to establish their
low-energy phases. To this end we investigate here four structures, namely zb, NiAs, Zn3P2, and
rs. We do not consider the wurtzite structure since its energy typically differs from that of zb by a
few meV/atom only. Thu unit cells of the consider structure are shown in Fig. 3.16.
The calculated total energy as a function of the atomic volume for zb, rs, and the NiAs
phases of CaN is presented in Fig. 3.17. We note that it is not possible to present Etot of CaN in
the Zn3P2 structure in this Figure because of the different stoichiometry of this phase. Figure 3.17
shows that the most stable phase is rs, while the zb phase is higher in energy by 0.75 eV/atom.

38
These results characterize other IIA-V compounds as well, see Table 3.2., and are similar to these
obtained for ScN [103] and CaAs [3].
Fig. 3.16. These unit cells of NiAs and Zn3P2 structures.
24 32 40 48-94.7
-94.6
-94.5
-94.4
-94.3
-94.2
-94.1
tota
l ene
rgy
(Ry)
atomic volume (Å3)
CaN
zb
NiAs
rs
Fig. 3.17. Total energy (in Ry/2 atoms) as a function of the atomic volume for three structures of CaN.

39
The calculated lattice parameters are given in Table 3.2., along with cohesive energies per
two atoms defined as
( ) ( )VIIVat
VIIat
IIVIItot
VIIcoh nnEnEnEE +−−= −− /2 . (3.1)
Here VIItotE − is the total energy per unit cell of the considered compound, Eat is the energy of
isolated atom, and nII and nV are number of atoms of groups II and V in the unit cell, respectively.
Considering first the simple structures we find that for all compounds (except BaN) the zb phase
is the less stable, NiAs is intermediate and rs is the most stable one.
Since we expect the magnetism to be the most stable for the II-V nitrides (see Section
3.1), I have also considered the computationally more demanding Zn3P2 phase for these
compounds. For both BaN and CaN the Zn3P2 phase is more stable than the rs, with the difference
in cohesive energies between the two phases of 0.032 and 0.075 eV/atom, respectively. In
contrast, SrN in the rs phase is more stable by 0.055 eV/atom. The calculated cohesive energies
of II-V nitrides are large compared to, e.g., VIIcohE − of Ca, which is -3.68 eV/2 atoms. This
indicates that after being formed, the II-N crystals are expected to be stable due to the high
energies of II-N bonds.
A second aspect of stability of a compound is displayed by its heat of formation 0fH∆ ,
which indicates stability with respect to decomposition into bulk constituents. The heat of
formation at T=0 K is obtained by considering the reaction to form (or decompose) a crystalline
bulk II-nitride from (or into) its components, and is defined as
( ) ( )VIINbind
NIIcoh
IIVIIcohf nnEnEnEH ++−=∆ − /2/20 , (3.2)
where VIIcohE − and II
cohE are the cohesive energy per atom of the considered nitrides and of the
group-II metal in its equilibrium structure, respectively, and 2NbindE is the binding energy of the N2
dimer. The obtained results forIIcohE are -1.80, -1.62, and -1.85 eV/atom for Ca, Sr, and Ba in their
equilibrium structures (fcc, fcc, and bcc, respectively). We also find that 2NbindE is −4.9 eV/atom, in
reasonable agreement with experimental data. Note that according to this definition a negative
0fH∆ implies that the compound is stable against decomposition into bulk constituents. The

40
calculated values of VIIcohE − and 0
fH∆ are given in Table 3.2. The results for BaN, SrN, and CaN
show that the Zn3P2 structure is energetically more favorable than the rs phase, since its 0fH∆ is
lower. From Table 3.2 it follows that the difference between 0fH∆ of the Zn3P2 and the rs
structure is 0.77, 0.55, and 0.68 eV for CaN, SrN, and BaN, respectively. However, we stress that
not only the Zn3P2 but also the rs phase is thermodynamically stable, which follows from the
negative 0fH∆ . Since the stoichiometries of these structures are different, the formation of one of
them should critically depend on the conditions of growth. The rs structure is metastable, since
the corresponding heats of formation are somewhat higher than those of the Zn3P2 phase. The
energies of both the zb and the NiAs phases are about 0.3 eV/atom higher. Consequently, the
relative stability of the rs phase of IIA-V nitrides justifies the analysis of their magnetic properties
in Section 3.1. Finally, the calculated 0fH∆ are relatively low, similar to those of the recently
synthesized PtN2 crystals [104].
In Table 3.2 I also give the calculated equilibrium lattice parameters. For all crystals we
find that the NiAs phase is strongly distorted, i.e., the c/a ratio is considerably larger than the ideal
value 1.63. This distortion plays an important role in determining the magnetic properties: for the
ideal value of c/a most of the systems are found to be FM, while the inclusion of the tetragonal
distortion destroys the FM order, and the crystals are paramagnetic. Considering the Zn3P2
structure we find that the c/a ratio is very close to ideal value 1.41, but the internal atomic
displacements inside the unit cell are large
Since IIA-V compounds in the rs phase are metallic (see Section 3.1) and have the high
cubic symmetry, one may expect that the cooperative Jahn-Teller effect takes place and lowers
the crystal energy. In order to check the stability with respect to the Jahn-Teller effect I have
considered three types of distortions of the rs structure, namely (i) a typical tetragonal distortion
in the [001] direction (which takes place, e.g., in MnN) [92, 93], (ii) a pseudo-cubic distortion in
the (110) orientation after which the lattice parameters are a = b = c = aeq (rs-phase) and α ≠β, γ
= 90° , and (iii) a distortion of the nitrogen sublattice only, in which the N-N distances are
reduced from the ideal value aeq(rs-phase)/√2 (which is 3.8 Å in SrN) to 1.1 Å, which is the
equilibrium bond length of the N2 molecule. I investigated 8, 16, 32, 64- atoms supercells of

41
structure rock salt. I have taken into account this distortion because in several nitrides, such as
SrN2 [11,12] or HfN2 [104], N atoms form nearest neighbor pairs. According to our results the
ideal rs phase is stable with respect to all these symmetry-lowering distortions.
Table 3.2. Calculated equilibrium lattice parameters, critical lattice constant acrit (in Å), cohesive energies, and heats of formation of IIA-V compounds. For hexagonal phases we give the values of both aeq (in Å) and of c/a in two consecutive lines.
Phase BaN SrN CaN CaP CaAs CaSb
lattice parameters at equilibrium
zb 5.92 5.82 5.40 6.88 7.14 7.41
3.81 3.65 3.49 4.02 4.13 4.23 NiAs
1.73 1.93 1.83 2.13 2.13 2.23
8.99 8.73 8.20 Zn3P2
1.41 1.41 1.41
rs 5.55 5.40 5.0 6.24 6.35 6.66
critical lattice constant
zb 4.8 4.87 4.5 5.3 5.8 6.88
rs 5.18 4.34 3.7 5.9 6.35 7.4
cohesive energy (eV/2 atoms)
zb −6.85 −6.16 −6.74 −5.38 −5.12 −4.71
NiAs −6.82 −6.17 −6.89 −5.92 −5.73 −5.41
Zn3P2 −7.19 −6.67 −7.63
rs −7.12 −6.78 −7.48 −6.20 −5.95 −5.53
heat of formation (eV/atom)
Zn3P2 −1.05 −0.81 −1.55
rs −0.37 −0.26 −0.78
Finally, I comment on the possibility of growing FM II A-N nitrides. In most cases, the
Zn3P2 phase is more stable than the rs. However, the different stoichiometries of the two phases
imply that the formation of one of them, and in particular of the FM rock salt phase, should

42
strongly depend on the conditions of growth such as relative flux intensities. Moreover, in
epitaxial growth the substrate and its structure play an important role and determine the structure
of the epilayer. Consequently, the choice of appropriate epitaxial conditions should allow
obtaining rs-IIA-V nitrides. More specifically, the lattice constants of rs CaN, SrN, and BaN (5.0,
5.4, and 5.55 Å.) are close to these of zb-InN (4.98 Å) [105], zb-GaP (5.45 Å), and zb-GaAs,
(5.65 Å) respectively, which suggests their use as appropriate substrates. Also the aeq of rs-CaP
(6.24 Å) about only 4 % smaller than that of zb-InSb (6.47 Å). The possibility of synthesis of rs-
II A-V nitrides is supported by the growth of metastable phases by molecular beam epitaxy. This is
the case of cubic MnTe or GaN, zb-CrAs [85] and zb-CrSb [86], to quote a few examples.
In this Part I have studied magnetic and electronic structures of a number of IIA-V
compounds. Four crystal structures were considered: zinc-blende, NiAs, rock salt, and Zn3P2. In
the zb structure, all the considered crystals are characterized by the total spin polarization of free
holes. However, the energy of this structure higher than that of the rs phase, in which only II-V
nitrides are spin-polarized. In order to understand the properties of the investigated crystals I have
considered a very broad range of lattice constants, beginning from the case of almost separated
atoms, and ending with this of highly compressed solids. A detailed analysis of the electronic
structure and density of states revealed that the calculated spin polarization has the origin in the
spin polarization of isolated group-V anions. At small lattice constants the magnetization
vanishes because of two factors. First, the kinetic energy favors the non-polarized configuration
of the electron gas, and the role of this effect increases with the increasing electron density. The
second factor destabilizing magnetization at small lattice const.ants is the decreasing density of
states at the Fermi level. Structural stability of the IIA-V compounds was analyzed by calculating
both their cohesive energies and heats of formation. In most cases, the Zn3P2 phase is more stable
than the rs, and in the Zn3P2 phase the spin polarization vanishes. However, the possibility of
synthesis of rs-IIA-V nitrides is supported by the growth of metastable phases.

43
Part IV
Magnetism of monoclinic SrN
This part is devoted to molecular magnetism of SrN. In Part III, magnetic properties of the
zb, NiAs, Zn3P2 and rs structures of SrN were studied. However, SrN and SrN2 were recently
synthesized, and their crystals structures are monoclinic and tetragonal for SrN and SrN2,
respectively [11, 12]. In this Part, magnetic properties of the experimentally determined structures
are examined.
4.1. The crystal structure of SrN and SrN2
The crystal structure of SrN is monoclinic (m) [11] that of SrN2 is tetragonal (t) [11].
These structures are shown in Fig. 4.1. The monoclinic phase of SrN has 16 atoms per unit cell, 8
atoms of strontium and 8 atoms of nitrogen. The unit cell of tetragonal SrN2 comprises 2 atoms of
Sr and 4 atoms of N. In both structures the Sr ions form octahedra. In SrN2, all N ions form
dimers, which are a characteristic feature of dinitrides such as IrN2 or PtN2 [106,107]. In SrN,
only half of N ions (denoted by Ndim) form dimers, while the remaining ions (denoted by Niso)
occupy centers of Sr octahedra with a coordination characteristic for the rock-salt phase. As a
result of the different coordinations, the two types of N ions, Ndim and Niso, are in different charge
states, and SrN is a mixed valence compound.
In the calculations, Brillouin zone integrations were performed using a (2×6×4) k-point
grid for m-SrN, and a (12×12×10) grid for t-SrN2. I used the experimental lattice parameters a =
13.472 Å, b = 3.8121 Å, c = 6.7284 Å, and β = 94.72°, [11] because as a rule GGA reproduces
well the structural properties. Moreover, optimization of the parameters of this complex structure
would require a substantial computational effort. To partially verify this assumption, the positions
of all atoms in the unit cell were relaxed. Relaxation energy is 0.03 eV/atom and displacements of
atoms from the experimental coordinates are minor. The largest displacements are found for Sr
atoms, about 0.2 Å, and the bonds of the two N2 dimers are longer by 6 % than the experimental

44
ones. The consistency between experiment and theory confirms both the identification of the
structure and the expected accuracy of GGA. In the case of t-SrN2, the calculations reproduce the
experimental lattice parameters (a=3.8136 Å, c= 6.2855 Å) [11] to within 0.5 % and the energy of
relaxation is very small (0.007 eV/atom).
.
Fig. 4.1. Crystal structure of (a) m-SrN and (b) t-SrN2. Big blue dots denote Sr and small red ones denote N. N ions forming dimers and isolated N ions are indicated by Ndim and Niso, respectively.
Table 4.1. Calculated cohesive energies and heats of formation (eV/atom) of m-SrN and t-SrN2.
m-SrN t-SrN2 Ecoh -3.7 -4.3
0fH∆ -0.88 -0.49
To analyze structural stability I calculated cohesive energy Ecoh and heat formation 0fH∆
of m-SrN and t-SrN2 using Eqs. 3.1 and 3.2. The results are given in Table 4.1. The negative
values of 0fH∆ show that m-SrN and t-SrN2 are stable with respect to decomposition. Moreover,
0fH∆ of m-SrN, -0.88 eV, is lower then that of the rock salt SrN, -0.26 eV. This agrees with
experiment, and shows that rock salt phase is only metastable.

45
4.2. Magnetic properties of m-SrN
I first analyze electronic structure of m-SrN. The different coordinations of the two types
of N ions in m-SrN, Ndim and Niso, result in their different properties reflected in charge and spin
densities. Contour plot of electron density, Fig. 4.2.a, shows the molecular bond of N2, while the
spherical shape of charge density around both Niso and Sr indicates the ionic character of bonds
between Niso and its Sr neighbors.
Fig. 4.2. Contour plot of (a) the charge density, and (b) the spin density of m-SrN unit cell in the y=0 plane. Sr and N atoms are presented by red and white dots, respectively. N-N dimer is in the middle of the unit cell.
This situation is confirmed by the total density of states (Fig. 4.3.a) and the density
projected on individual atoms shown in Figs. 4.3.b-d. Hybridization between Sr and N orbitals is
weak, and the lower valence bands are predominantly formed by one kind of atomic or molecular
orbitals. Thus the ionic character of m-SrN the valence bands shown in Fig. 4.3 are relatively
narrow, about 2.5 eV. The highest valence band is formed by 3 kinds of orbitals (p orbitals of
isolated ions of nitrogen, p orbitals of dimmers N2, and d orbitals of Sr). First, the states at about
1 eV below the Fermi energy EF originate in p(Niso) orbitals (Fig. 4.3.b) occupied with 6
electrons. This implies that Niso are in the closed-shell 3- charge state, which follows from the
symmetric of DOS’s for up and down spins. The second contribution originates in 3d orbitals of
Sr, and this contribution is not spin-polarized to a good approximation, see Fig. 4.3.d 3d(Sr)
orbitals mainly form conduction bands. Fig. 4.3.c shows that the largest and spin-polarized
contribution to DOS at the Fermi energy comes from the p states of N2 dimers. Fig. 4.3.c shows a
contribution to DOS of one ion of nitrogen that fours N2 dimer, which amounts to about 0.6

46
states/eV. The unit cell contains 4 N ions. Total DOS at Fermi level is about 3 states/eV in
agreement with the contribution from 2 dimers, 4* 0.6 ≈ 2.4 states/eV. Finally, the non-vanishing
DOS at EF indicates the metallic character of m-SrN.
-8 -6 -4 -2 0 2 4-16-12
-8-4048
1216 (a)E
FSrN:total
DO
S (
stat
es\e
V)
energy (eV)
-6 -4 -2 0 2 4
-2.4-1.6-0.80.00.81.62.4 (b)SrN:
2p(Niso )
DO
S (
stat
es\e
V)
energy (eV)
-8 -6 -4 -2 0 2 4
-1.8-1.2-0.60.00.61.21.8 (c)SrN:
2p(Ndim )
DO
S (
stat
es\e
V)
energy (eV)
-2 0 2 4-0.6-0.4-0.20.00.20.40.6 (d)
SrN:
3d(Sr)
DO
S (
stat
es\e
V)
energy (eV)
Fig. 4.3. Total density of states of FM m-SrN, and its projection on Niso, Ndim, and Sr orbitals (a, b, c, and d, respectively). Arrows denote the spin-up and spin-down channels, and vertical dashed lines indicate the Fermi energy.
I now turn to magnetic properties of m-SrN. To find the ground state, several initial spin
configurations were tried. In all cases, spin polarization of final configurations was non-
vanishing, which demonstrates the presence of stable magnetic moments. These moments are
strongly localized on N2 dimers, Fig. 4.2.b, and may take on FM or AFM order. Those results
shown in Fig. 4.3 hold for the FM phase, with different spin-up and spin-down DOS. Magnetic
couplings between N2 dimers were found using a unit cell doubled in the y-direction, i.e.,
containing 32-atoms and shown in Fig. 4.4.a. This supercell allows studying both FM and 3
AFM configurations with various relative orientations of spins (Fig. 4.4.b). In m-SrN, each N2
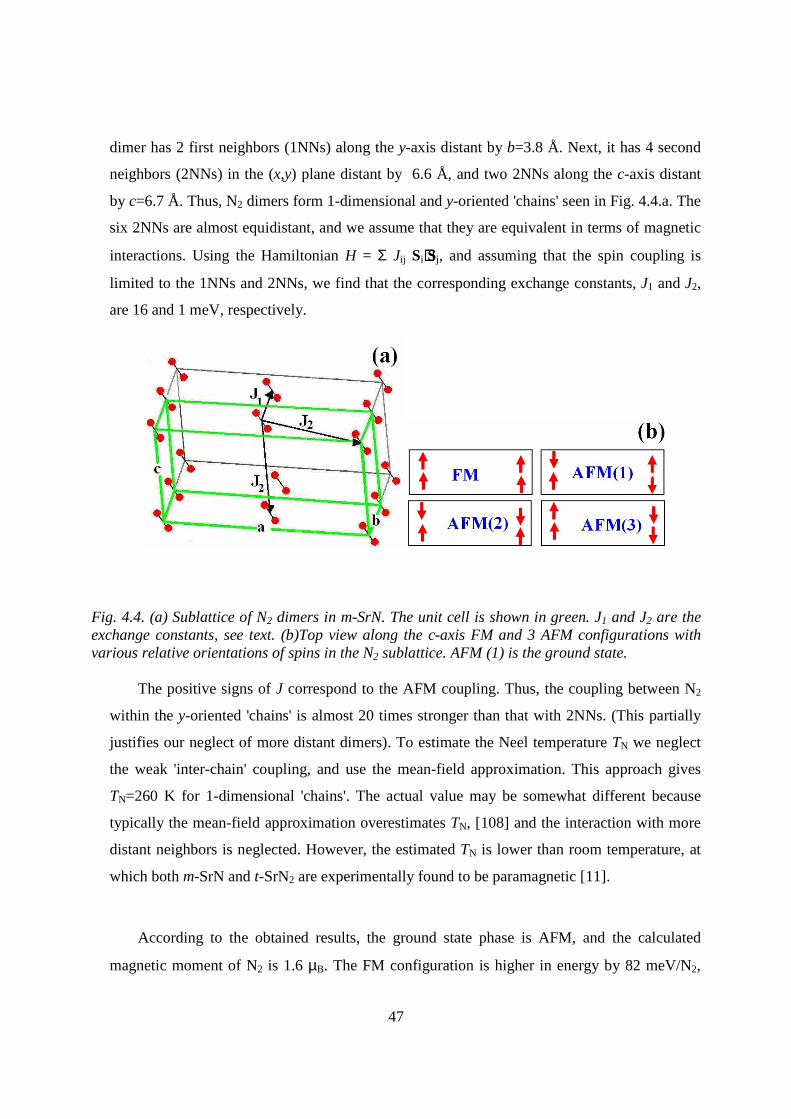
47
dimer has 2 first neighbors (1NNs) along the y-axis distant by b=3.8 Å. Next, it has 4 second
neighbors (2NNs) in the (x,y) plane distant by 6.6 Å, and two 2NNs along the c-axis distant
by c=6.7 Å. Thus, N2 dimers form 1-dimensional and y-oriented 'chains' seen in Fig. 4.4.a. The
six 2NNs are almost equidistant, and we assume that they are equivalent in terms of magnetic
interactions. Using the Hamiltonian H = Σ Jij Si⋅⋅⋅⋅Sj, and assuming that the spin coupling is
limited to the 1NNs and 2NNs, we find that the corresponding exchange constants, J1 and J2,
are 16 and 1 meV, respectively.
Fig. 4.4. (a) Sublattice of N2 dimers in m-SrN. The unit cell is shown in green. J1 and J2 are the exchange constants, see text. (b)Top view along the c-axis FM and 3 AFM configurations with various relative orientations of spins in the N2 sublattice. AFM (1) is the ground state.
The positive signs of J correspond to the AFM coupling. Thus, the coupling between N2
within the y-oriented 'chains' is almost 20 times stronger than that with 2NNs. (This partially
justifies our neglect of more distant dimers). To estimate the Neel temperature TN we neglect
the weak 'inter-chain' coupling, and use the mean-field approximation. This approach gives
TN=260 K for 1-dimensional 'chains'. The actual value may be somewhat different because
typically the mean-field approximation overestimates TN, [108] and the interaction with more
distant neighbors is neglected. However, the estimated TN is lower than room temperature, at
which both m-SrN and t-SrN2 are experimentally found to be paramagnetic [11].
According to the obtained results, the ground state phase is AFM, and the calculated
magnetic moment of N2 is 1.6 µB. The FM configuration is higher in energy by 82 meV/N2,

48
and the N2 dimers have a smaller the same magnetic moment, 1.2 µB. Finally, energy of the
paramagnetic, i.e., non-polarized, configuration is 117 meV/N2 higher than that of AFM case.
Localization of the magnetic moments on N2 dimers may suggest that the magnetic order
is determined by the dipole-dipole coupling, which is not included in the DFT calculations.
The contribution of the dipole-dipole coupling was calculated for FM and AFM(1) phases
using the corresponding theoretical magnetic moments of N2, 1.6 µB for AFM and 1.2 µB for
FM. Thus, the magnetic moment of N2 is higher in AFM than in FM. Since Hamiltonian H~S2
(S is the total spin), then it explains that the phase with highest magnetic moment will be more
stable [97]. Results show that the energy of AFM is lower by 18 meV/N2 than that of FM. This
is about 4 times smaller than 82 meV/N2 obtained from the calculations, which indicates that
the dominant magnetic coupling is mediated by delocalized states from the vicinity of the
Fermi level, and that dipole-dipole interaction provides only an additional contribution
stabilizing the AFM order.
4.3. Origin of magnetism of m-SrN
Electronic and magnetic structures of m-SrN can be interpreted based on energies of
orbitals of an isolated N2 molecule that are shown in Fig. 4.5. In a neutral N2 molecule, the σ
and π bonding combinations of p(N) orbitals are occupied. These orbitals give rise to the
valence bands, with two resolved peaks, at about −6 eV below EF, which are shown in Fig.
4.3.a. In the 2− charge state, the lowest antibonding orbital, π*, is occupied with 2 electrons,
and σ* is about 1 eV higher in energy. The most important feature of this configuration is the
stabilization of the high-spin state of the two electrons by the strong exchange coupling.
Consequently, the magnetic moment of −22N is 2 µB, with the same electronic configuration
and magnetic moment as those of a neutral O2 molecule. In m-SrN, the π* and σ* molecular
states of N2 are broadened by hybridization with neighbors, and the spin-up and spin-down
states overlap, see Fig. 4.3.d. The Fermi energy falls within the overlap region. This implies
that there is a transfer of electrons from spin-up to spin-down states, which reduces the spin

49
moment per N2 from 2 to 1.6 µB in the AFM and 1.2 µB in the FM phase. Finally, the magnetic
moments of Niso ions vanish because of their closed-shell configuration in the 3− charge state.
Fig. 4.5. Scheme of the electronic structure of an N2 molecule in the neutral and in the 2� charge state.
4.4. Magnetic properties of t-SrN2
Density of states of the second investigated nitride, SrN2, is shown in Figs. 4.6.a and
4.6.b. Energy bands derived from orbitals of N2 dimers are similar to those in SrN.
Stochiometry of SrN2 implies that N2 dimers are in the 2- charge state, as in SrN, and therefore
one could expect that magnetic moments of the dimers are similar in both compounds.
However, the calculated spin polarization of SrN2 vanishes. This is attributed to the fact that
the atomic volume of SrN2 is smaller that that of SrN. More precisely, the distances between a
N ion and its Sr neighbors are 2.61 and 2.94 Å in SrN, while in SrN2 they are 2.53 and 2.76
Å, where the shorter distance corresponds to the N-Sr bond along the dimer axis. Shorter
bonds imply a higher degree of hybridization of quasi-molecular N2 orbitals and broader
bands. Both factors counter-act the spin polarization of N2 dimers. In fact, the π∗-derived peak
in the upper valence band, well-resolved in SrN, is smeared out in SrN2, see Figs. 4.3.c and
4.6.b. This in turn implies a higher overlap between spin-up and spin-down states. In other
words, in SrN2 hybridization dominates the exchange splitting. This conclusion is confirmed
by the fact that an increase of the lattice constant by 8 % from equilibrium induces a non-
vanishing spin polarization in SrN2.
π(pyz)
σ(px)
π∗(pyz)
σ∗(px)
π(pyz)
σ(px)
π∗(pyz)
σ∗(px)

50
-10 -8 -6 -4 -2 0 2 4
-4
-2
0
2
4(a)SrN2: total
DO
S (
stat
es/e
V)
energy (eV)
-8 -6 -4 -2 0 2 4-1.2
-0.8
-0.4
0.0
0.4
0.8
1.2 (b)SrN2:
2p(Ndim )
DO
S (
stat
es/e
V)
energy (eV)
Fig. 4.6. (a) Total density of states of SrN2. (b) Its projection on p (Ndim) are shown in and. Arrows denote the spin-up and spin-down channels and vertical dashed lines indicate the Fermi energy.
The results obtained here and in Part III allow pointing out conditions that favor non-
vanishing spin polarization in a bulk crystal without magnetic ions. First, the crystal should
contain species with partially filled open-shell orbitals. These orbitals may be of quasi-atomic
character, which is the case of rs-SrN, or quasi-molecular ones in Rb2O6 [14] or in m-SrN.
Second, only light atoms from the second row of the periodic table (i.e., C, N, O, and F) should
lead to magnetization. This is because the compactness of their valence p shells induces high
energies of spin polarization. The third critical factor is the atomic volume (or the lengths of
bonds between N and its neighbors), which should be large enough to prevent a high
hybridization of spin-polarized orbitals with surrounding. In the opposite case, the broadening of
bands is larger than the exchange splitting, and the spin polarization vanishes. This is the case of
SrN2.
Summarizing, GGA calculations of the magnetic structure of the recently synthesized m-
SrN indicate that this compound is a molecular antiferromagnet. Magnetic moments are localized
on N2 dimers. This stems from the occupation of the π*(N2) antibonding orbitals with 2 electrons
in the high-spin configuration, which is not destroyed by hybridization with Sr neighbors. On the
other hand, t-SrN2 is paramagnetic since stronger hybridization dominates spin polarization
effects.

51
Part V
High-spin configuration of cation vacancies
Here I theoretically investigate the prospects of high-spin configuration of cation
vacancies in zb-GaAs, GaP, GaN, AlN, and BN, and w-GaN, AlN, BN, ZnO, and BeO.
Formation of a cation vacancy, Vcation, results in formation of 4 dangling bonds of the 4
anion neighbors of the vacancy, Fig. 5.1. They combine into a non-degenerate level a1 and a
triply degenerate level t2, which is higher in energy. Energies of a1 and t2 relative to the top of the
valence band (TVB) depend on the type of vacancy, and on the crystal. Typically, for Vcation in
most III-V and II-VI semiconductors, a1 is fully occupied and is a resonance with the valence
band, and t2 is in the band gap and is occupied by three or four electrons for neutral Vcation in III-
V or II-VI compounds, respectively. Moreover, as it was pointed out in Part I, in some cases
electrons assume high-spin configurations, i.e., their spins are arranged parallel in accord with the
Hund's rule.
Fig. 5.1. Typical electronic structure of a cation vacancy in zb-III-V semiconductors. Four sp3 orbitals of four neighbor’s anions (a) introduce four energy levels, a singlet a1 and a triplet t2 (b). Filled and empty circles in (b) indicate occupied and empty states, respectively.
In the case of a spin-polarized vacancy, t2 splits into spin-up (t2↑) and spin-down (t2↓)
states by the exchange coupling by ∆εex = t2↓-t2↑. In this case, also a1 splits into spin-up (a2↑) and
t2
a1
(b)

52
spin-down (a2↓) states. In the case when t2↑ is a resonance state, ∆εex is defined as 2*(t2↓-t2)
because the energy t2↑ is not possible to be exactly defined.
To study the stability of various spin configurations of vacancies we calculate the spin
polarization energies ∆EFM-PM. ∆EFM-PM is defined as the difference between the total energies of
the vacancy in the high-spin and spin-non-polarized configuration. The high-spin state is stable if
∆EFM-PM <0 and ∆εex≠ 0. The calculated electronic and magnetic properties of the vacancies are
given in Tables 5.1-5.7, and in Figures 5.2-5.4, 5.7-5.10.
5.1. Electronic structure and spin states of neutral vacancies
In this Section I analyze the electronic structure of neutral cation vacancies. Charged
vacancies are discussed in Section 5.2.
5.1.1. Neutral Vcation in zinc-blende III-V semiconductors
I start by summarizing the electronic structure of neutral cation vacancies in zb-III-V
semiconductors. The calculated electronic structures of Vcation are shown in Fig. 5.2. Additionally,
the calculated parameters are given in Table 5.1.
(i) VGa in GaAs. Vacancy-induced singlet a1 is a resonance with the valence band. The
energy of t2 is 0.4 eV above the top of the valence band. In GaAs, the high-spin state is unstable,
∆εex is zero, and the triplet state is occupied by 2 electrons with parallel spins and one electron
with opposite spin. In this case, the initially imposed high-spin configuration decays into the low-
spin state. Thus, VGa in GaAs has a low-spin configuration with the total spin S=½.
(ii) VGa in GaP. Here t2 is 0.3 eV above TVB. However, in this case the high-spin state is
stable, with ∆EFM-PM= -0.06 eV, and t2 is split into spin-up and spin-down states by the exchange
∆εex equal to 0.19 eV. So, t2↓ is empty and t2↑ is occupied by 3 electrons, and VGa in GaP has a
high-spin configuration with total magnetic moment µtot is 3 µB, see Table 5.1. This fact agrees
with the known experimental data [62].

53
Table 5.1. Electronic and magnetic characteristics of Vcation in zb-III-V semiconductors (∆EFM-PM, ∆εex, t2, and ∆TVB in eV; µtot and µabs in µB).
GaAs
(216 at) GaP
(216 at) GaN
(512 at) AlN
(512 at) BN
(512 at) ∆EFM-PM 0 -0.06 -0.69 -0.93 -0.82
∆ε ex 0 0.19 0.78 1.3 0.92
t2 0.41 0.31 0.22 0.54 0.52
µtot 0 3.0 3.0 3.0 3.0
µabs 0 3.21 3.47 3.3 3.36
∆TVB 0.16 -0.01 -0.01 -0.07
(iii) VGa in GaN introduces t2 in the band gap at 0.22 eV above the TVB. The high-spin
state is stable with ∆EFM-PM= -0.69 eV. The exchange-induced spin splitting of t2 into t2↑ and t2↓ is
large, about 0.78 eV. Consequently, and in contrast to GaP, the energy of t2↑ is a resonance
degenerate with the valence band and t2↑ is occupied with 3 electrons, while t2↓ is 0.6 eV above
the TVB and is empty. Thus, VGa in GaN has a high-spin configuration with the total spin 3/2.
(iv) VAl in AlN . t2 is 0.54 eV above TVB. The high-spin state is stable with the ∆EFM-PM=
-0.93 eV, which is larger than in GaN. Also ∆εex, 1.3 eV, is larger than in GaN. t2↑ is a resonance
occupied by 3 electrons with parallel spins, and VAl in AlN is in a high-spin state with the total
spin 3/2. Next, in AlN the a1 singlet is in the valence band for non-polarized calculation but close
to the TVB, inclusion of spin polarization causes that a1 is spin-split as well, and a1↓ is in the
band gap at 0.25 eV above TVB (see Fig. 5.2). a1↓-t2↓ splitting is 0.95 eV.
(v) In the case of VB in BN, t2 is 0.52 eV above TVB, ∆εex = 0.92 eV, and ∆EFM-PM= -0.82
eV, thus, similar to the VGa and VAl, VB has a stable high-spin state with S=3/2. In this case, t2↑ is
very close to the top of the valence band.

54
Fig. 5.2. Electronic structures of neutral Vcation in zb-III-V semiconductors. t and a denote the t2 and a1 states, respectively. The numbers give the calculated energies relatively on TVB, in eV. Conduction band is shown only schematically, and does not reflect the actual value of the band gap. Spins of electrons are indicated by arrows, empty spheres indicate unoccupied states.
Summarizing, in all considered cases Vcation introduces t2 in the band gap at about 0.3 eV
above TVB. In GaAs, both the spin polarization and the exchange-induced spin splitting ∆εex
vanish. In contrast, the high-spin state is stable for VGa in GaP, with ∆EFM-PM= -0.06 eV and ∆εex
= 0.19 eV. Stability of the high-spin state is much more pronounced in the nitrides, since ∆EFM-PM
is one order of magnitude higher and ∆εex is about 4 times larger than in GaP.
5.1.2. Neutral Vcation in wurtzite III-V semiconductors
I now turn to cation vacancies in III-N nitrides in the wurtzite structure. In general, the
results for zb and w structures are similar in terms of spin polarization energies and position of
vacancy levels, as expected. Differences are partially due to the smaller size of the supercell used
for the wurtzite structure. Due to hexagonal symmetry of wurtzite, the triplet t2 is split into a
doublet e and a singlet a with a splitting energy of 0.15, 0.05, and 0.3 eV for vacancies in GaN,
AlN, and BN, respectively.
∆∆∆∆εεεεex
t↑↑↑↑
S=3/2 S=3/2 S=1/2
GaN GaP GaAs
0.61
0.22
t t
t↓↓↓↓
0. 41
0.31
t
0.21
0.41
S=3/2
AlN
1.19
0.54
0.25 ∆∆∆∆εεεεex
t
a
a↓↓↓↓
S=3/2
0.99
0.52 t
BN
t↑↑↑↑

55
Table 5.2. Electronic and magnetic characteristics of Vcation in w-III-V semiconductors.
GaN (128 at)
AlN (128 at)
BN (128 at)
∆EFM-PM -0.63 -0.85 -0.54
∆ε ex 1.14 1.4 0.94
e 0.28 0.45 0.45
µtot 3.0 3.0 3.0
µabs 3.38 3.27 3.31
∆TVB -0.02 -0.01 -0.2
Fig. 5.3. Electronic structure of neutral Vcation in w-III-N nitrides. Conduction band is shown only schematically, and does not reflect the actual value of the band gaps. Spins of electrons are indicated by arrows, empty spheres indicate unoccupied states.
The calculated electronic structures are shown in Fig. 5.3, where a singlet and a doublet
(bold lines) states show by green lines e, is 0.28, 0.45, and 0.45 eV for VGa, VAl, and VB,
respectively (see Table 5.2). The high-spin states are stable for vacancies in w-nitrides because
∆EFM-PM are negative, and are -0.65, -0.85, and -0.55 eV for VGa, VAl, and VB, respectively, and
corresponding exchange-induced spin splittings ∆εex are 1.15, 1.4, and 0.95 eV. Consequently, in
all cases, the t2↑-derived e↑ and a↑ levels are resonances and have 3 electrons with parallel spins,
and vacancies in w-III-N nitrides have high-spin configuration with the total spin S=3/2. Next,
similar to zb-AlN, VAl in w-AlN introduces a1↓ very close to TVB. The a1↓-e2↓ splitting is 1.1 eV.
S=3/2 S=3/2 S=3/2
AlN BN GaN
0.82
e↓↓↓↓
1.15
∆∆∆∆εεεεex
a
0.85
0.28
e
0.7
a
a↓↓↓↓ e a
0.45
0.52
0.45
a↓↓↓↓ 0.05

56
5.1.3. Neutral VZn in w-ZnO and VBe in w-BeO
I also considered cation vacancies in wurtzite ZnO and BeO. In these cases, the states of
the vacancy are built from the oxygen p orbitals and are occupied by 6 electrons. The vacancy
introduces a singlet a1 inside the valence band and triplet t2 in the band gap close to TVB. The
triplet t2 is split by the wurtzite crystal field into a doublet and a singlet states with a small
splitting energy of ~0.1 eV. The calculated energy levels are shown in Fig. 5.4. In the spin-
nonpolarized case, t2 is 0.22 and 0.36 eV above TVB in ZnO and BeO, respectively. In both
crystals, the triplet is spin-split by the exchange interaction, however t2↑ are not resonances,
because ∆ε ex are smaller than for III-V nitrides, and amount to 0.11 and 0.44 eV for VZn and VBe,
respectively. ∆EFM-PM = -0.04 eV in ZnO and -0.2 eV in BeO. Thus, in both crystals the vacancies
have stable high-spin states with S=1 and total magnetic moment is 2 µB (see Table 5.3) because
t2↑ is occupied by 3 electrons, and t2↓ by 1 electron.
The calculated higher stability of the spin polarization in BeO can be ascribed to its
smaller lattice constant (a=2.7 Å, c= 4.38 Å) than that of ZnO (a=3.25 Å, c=5.2 Å), which should
lead to a stronger electron-electron coupling.
Table 5.3. Electronic and magnetic characteristics of VZn in w-ZnO and VBe in w-BeO.
ZnO (128 at)
BeO (128 at)
∆EFM-PM -0.04 -0.2
∆εex 0.11 0.44
t2 0.22 0.36
µtot 2.0 2.0
µabs 2.1 2.17
∆TVB -0.11 -0.1

57
Fig. 5.4. Energy level diagram VZn in w-ZnO, and VBe in w-BeO. The small hexagonal splittings are not shown. Conduction band is shown only schematically, and does not reflect the actual value of the band gap. Spins of electrons are indicated by arrows, empty spheres indicate unoccupied states.
Finally, for the take of completeness, we also analyzed VSi in zb-SiC. In this case we used
only a 64-atom supercell. It was shown that VSi has stable high-spin state with S=1. Our results
agreement with these of Refs. [67, 68], where a detailed analysis of VSi in zb-SiC is given.
5.1.4. Spin density of cation vacancies
Figures 5.5 and 5.6 display the spin density of vacancies in the considered crystals. One
can see that the main contribution is given by the orbitals of the neighbors of the vacancy. This
contribution is strongly localized in the case of VGa in GaP and VSi in SiC. In contrast, in the III-
V nitrides the vacancy-induced triplet state t2↑ is a resonance in the valence band. In this case, in
agreement with the resonant character of the vacancy-induced levels, the spin polarization is not
strongly localized on sp3 orbitals of the vacancy neighbors, but is fairly long-ranged. This feature
is highlighted in Fig. 5.5.c. The electrons from the t2↑ level are hybridized with the states from the
upper part of the valence band, which are mainly formed from the p(N) orbitals. Spin polarization
of not only the nearest neighbors of the vacancy but also of the more distant N ions is clearly
visible in Fig. 5.5.c. However, the dominant contribution of the localized part of the wave
function explains why the spin polarization persists even in the case when t2 is a resonance. A
situation similar to that in GaN takes place in both ZnO and BeO, where the t2 level is very close
in energy to the TVB and has the same symmetry. The resulting hybridization is reflected in the
fairly delocalized character of the spin density in Fig. 5.6.c.
S=1 S=1
BeO ZnO
0.58
0.36
∆∆∆∆εεεεex t
t↑↑↑↑
t↓↓↓↓
0. 28 0.22 t
0.16 0.14

58
Moreover, we calculated total magnetic moment of system (µtot is the sum of projections
an axis of spin magnetic moments) and absolute magnetic moment of system (µabs is the sum of
absolute values of spin magnetic moments). In all cases the total magnetic moment is not equal to
the absolute magnetic moment, see Tables 5.1-5.7. For example, Vcation in zb-III-N nitrides have
µtot =3 µB, but µabs is about 3.4 µB. The difference between µabs and µtot is small, about 10 %, but
it shows that the spin polarization has an oscillatory behavior, and is due to the spin polarization
of the states from the top of the valence band induced by the magnetic moment of the vacancy.
Fig. 5.5. Spin density of (a) VSi in zb-SiC, (b) VGa in zb-GaP and (c) VGa in zb-GaN.
Fig. 5.6. Spin density of cation vacancy in (a) w- AlN, (b) w- GaN, and (c) w-ZnO.
Finally, the spin polarization reflects the symmetry of the crystal: in the zb structure the
spin polarization of vacancy has an isotropic character (Fig. 5.5.c), but in the wurtzite structure it
is anisotropic, and only the “in plane” spin polarization takes place, see Fig. 5.6.

59
Due to the long-range tail of the spin polarization, there is a possibility of magnetic
coupling between vacancies, which may lead to their magnetic order. But this possibility is an
open question and may occur only for high concentrations of vacancies [60].
5.2. Spin states of charged vacancies
Here I turn to the dependence of the spin polarization and electronic structure of vacancies
on the charge state.
(i) Charged VGa in GaP. Fig. 5.7 illustrates the results for three occupations of the triplet
states of VGa in GaP that range from q=1+ to q=1-. As discussed previously, the exchange
coupling induces a high-spin state for a neutral vacancy with the total spin 3/2. In contrast, for the
positively and negatively charged vacancies we find that ∆EFM-PM =0, and the exchange splitting
of triplet states vanish (see Table 5.4). Thus, in those cases the vacancies have the low-spin
configurations with the vanishing total spins, and indeed the high-spin configurations other than
3/2 have not been observed.
Fig. 5.7. Energy level diagram of charged VGa in GaP. Conduction band is shown only schematically, and does not reflect the actual value of the band gap. Spins of electrons are indicated by arrows, empty spheres indicate unoccupied states.
S=0 S=3/2 S=0
q=1- q=0 q=1+
∆∆∆∆εεεεex t
t↑↑↑↑
t↓↓↓↓ 0. 41
0.31 t
0.21 0.24
0.42
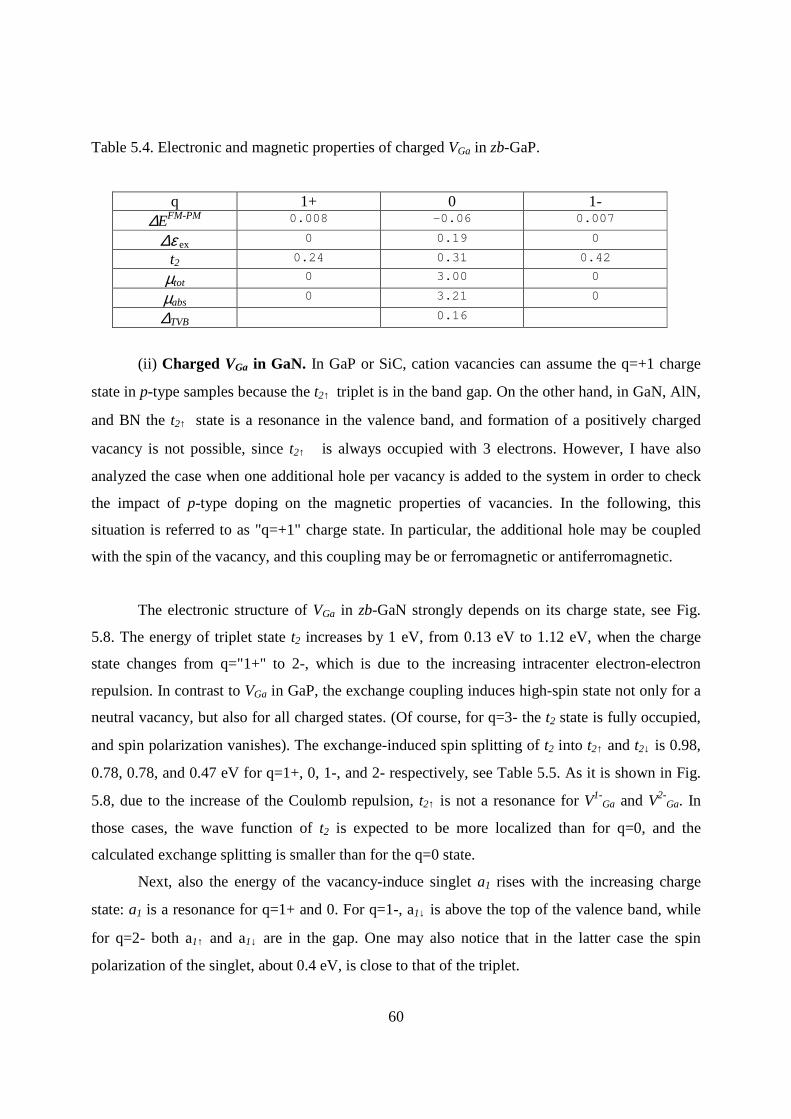
60
Table 5.4. Electronic and magnetic properties of charged VGa in zb-GaP.
q 1+ 0 1- ∆EFM-PM 0.008 -0.06 0.007
∆ε ex 0 0.19 0
t2 0.24 0.31 0.42
µtot 0 3.00 0
µabs 0 3.21 0
∆TVB 0.16
(ii) Charged VGa in GaN. In GaP or SiC, cation vacancies can assume the q=+1 charge
state in p-type samples because the t2↑ triplet is in the band gap. On the other hand, in GaN, AlN,
and BN the t2↑ state is a resonance in the valence band, and formation of a positively charged
vacancy is not possible, since t2↑ is always occupied with 3 electrons. However, I have also
analyzed the case when one additional hole per vacancy is added to the system in order to check
the impact of p-type doping on the magnetic properties of vacancies. In the following, this
situation is referred to as "q=+1" charge state. In particular, the additional hole may be coupled
with the spin of the vacancy, and this coupling may be or ferromagnetic or antiferromagnetic.
The electronic structure of VGa in zb-GaN strongly depends on its charge state, see Fig.
5.8. The energy of triplet state t2 increases by 1 eV, from 0.13 eV to 1.12 eV, when the charge
state changes from q="1+" to 2-, which is due to the increasing intracenter electron-electron
repulsion. In contrast to VGa in GaP, the exchange coupling induces high-spin state not only for a
neutral vacancy, but also for all charged states. (Of course, for q=3- the t2 state is fully occupied,
and spin polarization vanishes). The exchange-induced spin splitting of t2 into t2↑ and t2↓ is 0.98,
0.78, 0.78, and 0.47 eV for q=1+, 0, 1-, and 2- respectively, see Table 5.5. As it is shown in Fig.
5.8, due to the increase of the Coulomb repulsion, t2↑ is not a resonance for V1-Ga and V2-
Ga. In
those cases, the wave function of t2 is expected to be more localized than for q=0, and the
calculated exchange splitting is smaller than for the q=0 state.
Next, also the energy of the vacancy-induce singlet a1 rises with the increasing charge
state: a1 is a resonance for q=1+ and 0. For q=1-, a1↓ is above the top of the valence band, while
for q=2- both a1↑ and a1↓ are in the gap. One may also notice that in the latter case the spin
polarization of the singlet, about 0.4 eV, is close to that of the triplet.
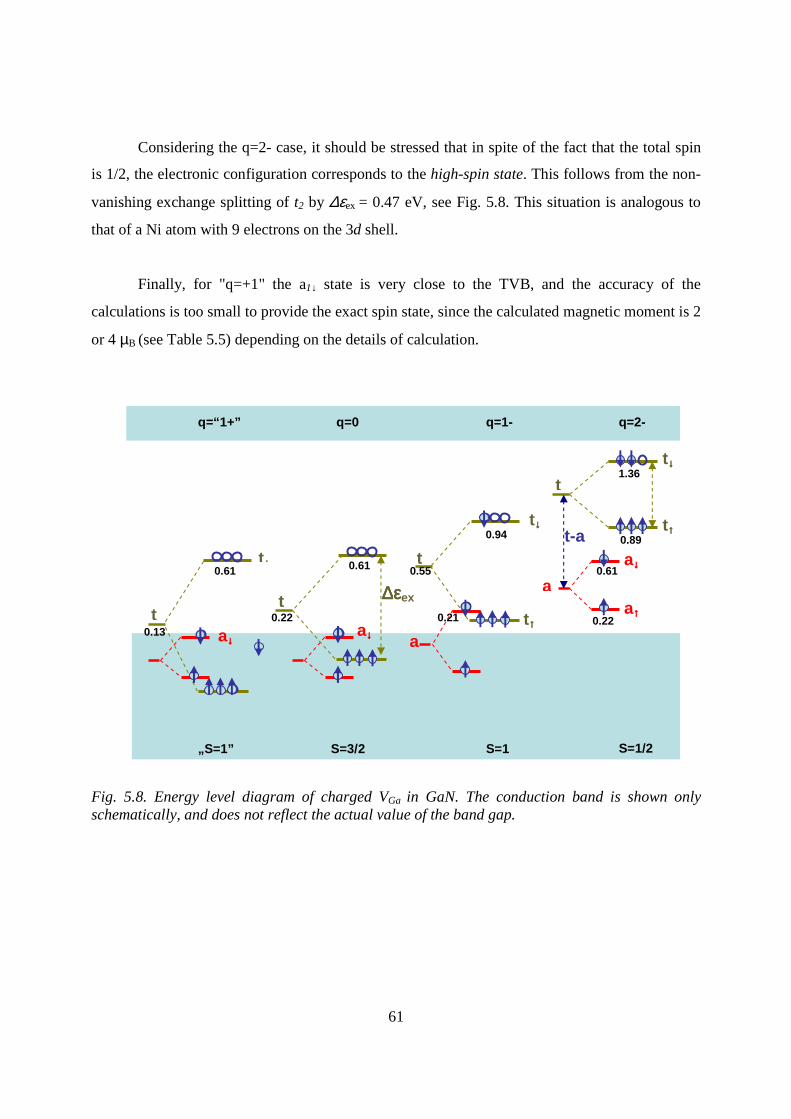
61
Considering the q=2- case, it should be stressed that in spite of the fact that the total spin
is 1/2, the electronic configuration corresponds to the high-spin state. This follows from the non-
vanishing exchange splitting of t2 by ∆εex = 0.47 eV, see Fig. 5.8. This situation is analogous to
that of a Ni atom with 9 electrons on the 3d shell.
Finally, for "q=+1" the a1↓ state is very close to the TVB, and the accuracy of the
calculations is too small to provide the exact spin state, since the calculated magnetic moment is 2
or 4 µB (see Table 5.5) depending on the details of calculation.
Fig. 5.8. Energy level diagram of charged VGa in GaN. The conduction band is shown only schematically, and does not reflect the actual value of the band gap.
S=3/2 S=1 „S=1”
q=1- q=0 q=“1+”
t↓↓↓↓
t↑↑↑↑
0.61 0.61
0.22 0.13
0.55
0.94
∆∆∆∆εεεεex t
t
t t↓↓↓↓
0.21
a
a↑↑↑↑
a↓↓↓↓
a↓↓↓↓ a↓↓↓↓
a
t
t-a
t↓↓↓↓
t↑↑↑↑
q=2-
S=1/2
0.22
0.61
0.89
1.36

62
Table 5.5. Magnetic properties of charged VGa in zb-GaN.
(iii) Charged VAl in AlN. The electronic structure of charged VAl shown in Fig. 5.9 is very
similarly to that of VGa in GaN. For all charge states the high-spin state is stable since ∆EFM-PM
are negative, see Table 5.6, but the absolute values are somewhat higher than in GaN, which is
indicative of the higher stability of spin polarization. The energy of the vacancy-induced a1
singlet is higher than in GaN. Interestingly, for all charge states cases a1↓ is in the band gap, and
the t2↓-a1↓ splitting is about 0.95 eV.
Fig. 5.9. Energy level diagram of charged VAl in AlN. The conduction band is show only schematically, and does not reflect the actual value of the band gap.
” 1+” 0 1- 2- ∆EFM-PM -0.65 -0.69 -0.39
∆εex 0.98 0.78 0.78 0.47
t2 0.13 0.22 0.55 1.12
µtot ”2.0”/”4.0” 3.0 2.0 1.0
µabs ”4.26” 3.44 2.31 1.17
∆TVB -0.01 -0.01 0.04 0.03
S=3/2 S=1 S=2
q=1- q=0 “q=1+”
t↓↓↓↓
t↑↑↑↑ 0.98 1.19
0.54
0.14
1.21
1.69
0.25 0.37
0. 73 ∆∆∆∆εεεεex
t
t
t t↑↑↑↑
a a
a↓↓↓↓
a↑↑↑↑ a↓↓↓↓
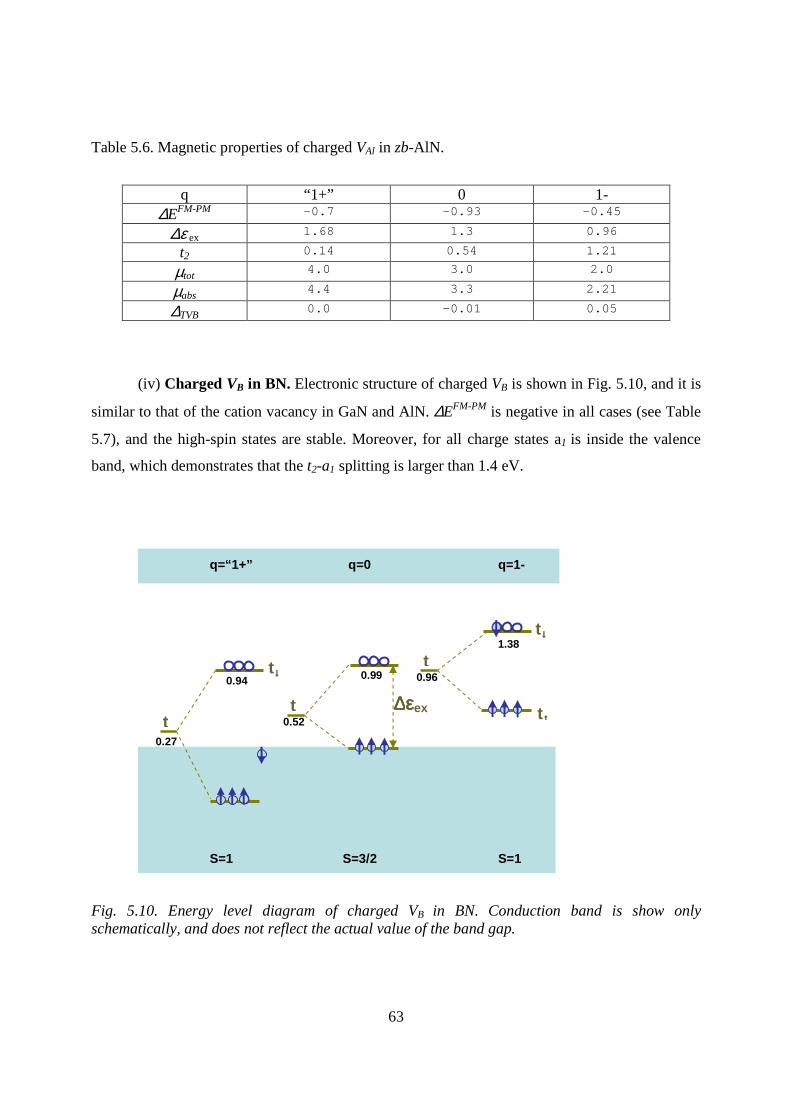
63
Table 5.6. Magnetic properties of charged VAl in zb-AlN.
(iv) Charged VB in BN. Electronic structure of charged VB is shown in Fig. 5.10, and it is
similar to that of the cation vacancy in GaN and AlN. ∆EFM-PM is negative in all cases (see Table
5.7), and the high-spin states are stable. Moreover, for all charge states a1 is inside the valence
band, which demonstrates that the t2-a1 splitting is larger than 1.4 eV.
Fig. 5.10. Energy level diagram of charged VB in BN. Conduction band is show only schematically, and does not reflect the actual value of the band gap.
q “1+” 0 1- ∆EFM-PM -0.7 -0.93 -0.45
∆ε ex 1.68 1.3 0.96
t2 0.14 0.54 1.21
µtot 4.0 3.0 2.0
µabs 4.4 3.3 2.21
∆TVB 0.0 -0.01 0.05
S=3/2 S=1 S=1
q=1- q=0 q=“1+”
t↓↓↓↓
t↑↑↑↑
0.94 0.99
0.52
0.27
0.96
1.38
∆∆∆∆εεεεex t
t
t t↓↓↓↓

64
Table 5.7. Magnetic properties of charged VB in zb-BN.
“1+” 0 1- ∆EFM-PM -0.51 -0.82 -0.39
∆ε ex 1.34 0.94 0.84
t2 0.27 0.52 0.96
µtot 2.05 3.0 2.0
µabs 3.49 3.36 2.23
5.3. The exchange splitting of TVB
The obtained results show that the TVB splits into spin up εTVB↑ and spin down εTVB↓
levels by the energy ∆TVB, which is given in Tables 5.1-5.7. The effect results from the coupling
between the vacancy-induced t2 level and the states from the top of the valence band. This
coupling, or 'quantum repulsion', is possible because both states have the same symmetry, and is
illustrated in Fig. 5.11. The absolute values of the splitting ∆TVB are in general small, i.e., they do
not exceed 0.1 eV, and ∆TVB is the highest in GaP and BN. The sign of ∆TVB stems from the
relative energies of t2 and the TVB. When t2↑ is in the gap, the highest state of valence electrons
is the spin-down state, i.e., spin of a free hole is parallel to that of t2 and the vacancy-hole
coupling in ferromagnetic. An opposite situation holds when t2↑ is a resonance, since in this case
the sign of the splitting of the TVB changes, see Fig. 5.11. In other words, the sign of the p-p
exchange interaction between the vacancy and the free holes changes. This effect is analogous to
that of the p-d exchange coupling between Mn ion and holes, which has the opposite sign in
GaAs:Mn and in GaN:Mn.
Fig. 5.11. The dependence of sign of the splitting of the TVB on the energy of the triplet state.
t2
t2
∆∆∆∆TVB

65
5.4. The energy of spin polarization of vacancy vs exchange splitting
Figure 5.12 summarizes the calculated values of ∆EFM-PM and ∆ε ex for all the considered
cases. The figure shows that ∆EFM-PM correlates with the exchange splitting ∆εex, since ∆EFM-PM
increases with the increasing ∆εex. This correlation takes place because the energy gain ∆EFM-PM
induced by the formation of the high-spin state is partially provided by the energy gain of the
electronic contribution to the total energy. This mechanism is illustrated in Fig. 5.12.
0.0 0.2 0.4 0.6 0.8 1.0 1.2 1.4 1.60.0
0.2
0.4
0.6
0.8
1.0
q=1-q=1+
zb-AlNzb-GaN
zb-BN
zb-AlNzb-GaN
zb-BN
∆EP
M-F
M, e
V
∆εex, eV
zb-BN
zb-GaP
w-BeO
w-ZnO
zb-GaN
w-AlN
w-GaN
w-BN
zb-GaAs
zb-AlNq=0
Fig. 5.12. The dependence of the energy of spin polarization of vacancies on exchange splitting of t2 levels for various charge states.
In particular, Fig. 5.13 explains why the calculated energy gains ∆EFM-PM are the highest
when the t2 state is occupied with 3 electrons, while for other occupations the high-spin state is
less stable, or it vanishes like in GaP. This argument also accounts for the lower energy of spin
polarization of a neutral vacancy in ZnO and BeO (where t2 is occupied with 4 electrons) than
that of a neutral vacancy in III-V nitrides (where t2 is occupied with 3 electrons).

66
If this mechanism would account for entire energy of spin polarization, the relation ∆EFM-
PM = (3/2)∆εex should be obeyed for neutral Vcation in III-V systems. However, from my results it
follows that this mechanism accounts for about one half of ∆EFM-PM (for both neutral and charged
states), which indicates that other factors play an important role.
Fig. 5.13. The scheme explaining the energy gain from the electronic contribution of triplet state to the spin polarization of the vacancy.
5.5. Details of calculation. The effect of relaxation of structure
To verify the convergence of the results with respect to the size of the supercell, the
calculations were performed for cells with 64, 216, and 512 atoms for zb structure, and 72 and
128 for the wurtzite structure. The results for zb are given in Table 5.8. The calculations showed
that in the case of GaP convergent results are obtained for the supercell with 64 atoms because of
the localized character of the t2 state. In the remaining cases, the t2 level is a fairly delocalized
resonance, and thus only the results obtained with 512-atom supercells are expected to be
converged due to the interaction of vacancy-induced states from the neighboring supercells. For
technical reasons, in the case of the wurtzite structure I was not able to use supercells larger than
128 atoms.
S=3/2
∆∆∆∆εεεεex
without spin polarization
with spin polarization
t2
t2↑↑↑↑

67
Table 5.8. Electronic and magnetic characteristics of Vcation in zb-III-V semiconductors (∆EFM-PM, ∆εex, t2 in eV; µtot and µabs in µB). GaAs GaP
GaN
AlN BN
512 atom supercell ( zb)
∆EFM-PM -0.69 -0.93 -0.82
∆εex 0.78 1.3 0.92
t2 0.22 0.54 0.52
µtot 3.0 3.0 3.0
µabs 3.47 3.3 3.36
216 atom supercell ( zb)
∆EFM-PM 0 -0.06 -0.85
∆ε ex 0 0.19 0.94 t2 0.41 0.31 0.22
µtot 0 3.0 3.0
µabs 0 3.21 3.47 64 atom supercell ( zb)
∆EFM-PM 0 -0.06 -0.21
∆ε ex 0 0.062 0.86
µtot 0 0.60 3.0
µabs 0 0.62 3.3
Effects of atomic relaxation
I also analyzed the effect of relaxation of the vacancy neighbors on the value of ∆EFM-PM
and on the distance between the vacancy and its first and second neighbors. The results of
calculations of ∆EFM-PM and the energy of relaxation ∆Erelax for zb-III-N nitrides are given in
Table 5.9. ∆Erelax, i.e., the difference between total energies of the system without and with
relaxation, was calculated for low- and high-spin configurations. One can see that without
relaxation ∆EFM-PM is -0.81, -0.94, and -0.99 eV for VGa, VAl, and VB, respectively, i.e., it
increases with the decreasing distance between N ions because of the increasing electron-electron
coupling. In the case of GaN and BN, the relaxation decreases ∆EFM-PM by 15 and 19 % for VGa
and VB, respectively, which stems from the fact that the outward displacement of N ions
decreases the overlap between the broken bonds, and consequently reduces the exchange
interaction. On the other hand, the effect of relaxation on ∆EFM-PM is very small in AlN in spite of

68
the fact that the displacement of N neighbors is close to those in GaN and BN. Analysis of the
electronic structure shows that in this case before the relaxation the a1↓ singlet in a resonance, but
after the relaxation it rises in energy and is located in the band gap at 0.25 eV above the TVB.
This in turn leads to a stronger localization of the wave function of a1, and consequently enhances
the exchange interactions within the vacancy orbitals. The two factors, i.e., the decrease of ∆EFM-
PM caused by the outward displacement of N ions, and its increase caused by the localization of
the a1 state, almost cancel.
Table 5.9. The effect of the relaxation on ∆Erelax and ∆EFM-PM (eV). 512-atom supercell.
After the relaxation, the distance between the vacancy and the first (l), second (m), and
third (k) neighbors of a neutral vacancy change. Those distances are show in Fig. 5.14. The first
and third neighbors are nitrogen atoms. The second neighbors are cation atoms. The results of
calculation are given in Table 5.10. In all cases, the relaxations are fully symmetric, and it mainly
consists in the pronounced outward relaxation of first neighbors by 10.1, 12, and 9.6 % for VGa,
VAl, and VB, respectively. The distances to the second and third neighbors change by about -0.5
and 0.2 %, respectively, for VGa; 0.3 and 0.46 %, VAl; -0.8 and 0 %, VB.
Fig. 5. 14. The gallium vacancy after relaxation.
∆Erelax ∆EFM-PM PM FM without
relaxation with
relaxation
VGa 0.61 0.45 -0.81 -0.69
VAl 0.78 0.77 -0.94 -0.93
VB 1.0 0.82 -0.99 -0.8

69
Table 5.10. The effect of the relaxation on the distance between the vacancy and the first, second, and third neighbors of vacancy (Å).
l m k
before relax
after relax
before relax
after relax
before relax
after relax
VGa 1.97 2.17 3.21 3.20 3.77 3.77
VAl 1.90 2.13 3.10 3.11 3.63 3.65
VB 1.57 1.71 2.56 2.54 3.00 3.00
In this Part I have analyzed the origin and the stability of high-spin states of cation
vacancies. The calculations explain the experimental data for VGa in GaP and VSi in SiC, and
predict the high-spin state for vacancies in III-N nitrides and II-O oxides. The vacancy-induced
states may be located either in the band gap or within the valence band forming resonant states.
The energy of t2 influences the degree of localization of the spin density, and to some extend the
stability of high-spin states. From the calculated values of ∆EFM-PM for zb-GaAs, GaP, and GaN it
follows that ∆EFM-PM decreases with the increasing of atomic number of anion, since it vanishes
in GaAs and it is highest in GaN, -0.69 eV. This trend corresponds to the trend exhibited by the
energy of the spin polarization of isolated As, P, and N atoms, which was discussed in Part III.
Thus, the high-spin states of vacancies, which may be regarded as local spin polarization, and the
global spin polarization of II-V crystals analyzed in the first part of my Thesis, shear a common
physical origin, which is the strong exchange interaction of compact p electrons of light anions.
70
Part VI
Summary
This Thesis is devoted to the problem of magnetism in systems that do not contain
transition metal atoms. In fact, magnetism based on s and p electrons only was experimentally
observed and/or theoretically predicted to exist in a number of solids. My main goal was to
confirm earlier theoretical results, to understand the mechanism responsible for the non-vanishing
spin polarization in several crystals, and to provide predictions regarding potential materials that
may exhibit this effect. To answer these problems, the calculations have been performed within
the framework of density functional theory, using both the local spin density and the generalized
gradient approximations for the exchange and correlation effects.
A detailed analysis of magnetic and electronic structure of a large number of IIA-V
compounds in several crystallographic phases was performed. The results indicate that most of
the considered crystals in the zinc blende phase are characterized by the total spin polarization of
free holes. However, there is a critical question regarding the thermodynamic (i.e., structural)
stability of these open-shell structures relative to the closed-shell insulating and non-magnetic
ones. Structural stability of the IIA-V compounds was analyzed by calculating their cohesive
energies and heats of formation. For all antimonides, arsenides, and phosphides, the Zn3P2 phase
is considerably more stable than the rs, and in the Zn3P2 phase the spin polarization vanishes.
However, properties of IIA-V nitrides are different, the rock-salt structure is only weakly
metastable, and possibly may be obtained by using epitaxial techniques. This suggestion is
supported by a successful epitaxial growth of a variety of metastable phases of solids.
In order to understand magnetic properties of the investigated crystals I have considered a
very broad range of lattice constants, beginning from the case of isolated atoms, and ending with
this of highly compressed solids. From the obtained results it follows that the non-vanishing spin
polarization has the origin in the spin polarization of isolated group-V anions. Atomic spin
polarization, known as the Hund's energy, is the strongest for compact p-orbitals of light atoms
from the second row of the Periodic Table, which explained why only compounds that contain C,

71
N, and O are expected to be spin-polarized. At small lattice constants the magnetization vanishes
because of two factors. First, the kinetic energy favors the non-polarized configuration of the
electron gas, and the role of this effect increases with the increasing electron density. The second
factor destabilizing magnetization at small lattice constants is the decreasing density of states at
the Fermi level, as predicted by the Stoner criterion.
Moreover, the recently synthesized SrN crystallized in the monoclinic structure, and
contains both isolated N ions and N2 dimers. An analysis of the magnetic properties of the m-SrN
indicates that this compound is a molecular antiferromagnet. Magnetic moments are localized on
N2 dimers. This stems from the occupation of the π*(N2) antibonding orbitals with 2 electrons in
the high-spin configuration, which is not destroyed by hybridization with Sr neighbors.
The second part of the Thesis is devoted to the local spin polarization, namely to the high-
spin states of vacancies. Typically, defects in semiconductors assume low-spin configurations,
with the total spin 0 or 1/2. High-spin states with S=3/2 of cation vacancies were observed in
several semiconductors two decades ago, but the effect was not explained. Based on the results
obtained for bulk II-V crystals one can expect that the effect is also due to the strong spin
polarization of light anions. To confirm this prediction, formation and stability of high-spin states
of cation vacancies were investigated for BN, AlN, GaN, GaP, ZnO, BeO.
Formation of a cation vacancy results in formation of dangling bonds of the anion
neighbors of the vacancy, which typically combine into a singlet state in the valence band and
triplet state t2 in the band gap close to the top of the valence band. The energy of triplet state
depends on an anion of matrix and it decreases with the increased electronegativity of anion. The
performed calculations show that high-spin state is stable in the case of a neutral VGa in GaP and
a negatively charged VSi in SiC, in agreement with experiment, but not in GaAs, again in
agreement with experiment. Moreover, the calculations also predict that high-spin states are
stable for Vcation in III-N nitrides and II-O oxides, due to the strong spin polarization of light
anions pointed out above. More specifically, the analysis shows that spin density of vacancy is
localized on sp3 orbitals of neighbor’s anions. In crystals, in which both the vacancy-induced t2↑
and t2↓ states are in the band gap (GaP or SiC), their wave functions are strongly localized on

72
those orbitals. When t2↑ is resonance state degenerate with the valence band, which is the case of
the nitrides, the wave functions have both the localized part and the extended tails. Moreover, the
spin polarization reflects the symmetry of the crystal: in the zinc blende structure the spin
polarization of vacancy has an isotropic character, but in the wurtzite structure it is anisotropic,
and only the “in plane” spin polarization takes place. Finally, the dependence of the spin state on
charged state of vacancy was investigated. It was found that the high-spin state of VGa in GaP is
stable only for the neutral vacancy. In contrast, in the nitrides, due to the much stronger spin
polarization of N than that of P in GaP, the vacancy high-spin states are stable for charge states
ranging from q=1+ to 2-.
The obtained results demonstrate that the physical origin of both effects, the spin
polarization of bulk IIA-N nitrides and high-spin state of vacancy in III-N nitrides and II-O
oxides, is the same, and consists in the strong spin polarization of p orbitals of light atoms from
the second row of the periodic table (B, C, N, O).

73
Bibliography
[1] K. Kukasabe, M. Geshi, H. Tsukamoto, and N. Suzuki, J. Phys. C: Condens. Matter 16, 5639 (2004). [2] Volnianska, P. Jakubas, and P. Bogusławski, J. Alloys Compd. 423, 191 (2006). [3] M. Sieberer, J. Redinger, S. Khmelevskyi, and P. Mohn, Phys. Rev. B 73, 024404 (2006). [4] O. Volnianska and P. Bogusławski, Phys. Rev. B 75, 224418 (2007). [5] M. Geshi, K. Kusakabe, H. Nagara, and N. Suzuki, Phys. Rev. B. 76, 054433, (2007). [6] G. Y. Gao, K. L. Yao, E. Şasioglu, L. M. Sandratskii, Z. L. Liu, and J. L. Jiang, Phys. Rev. B 75, 174442 (2007). [7] K. Sieranski, J. Szatkowski, and J. Misiewicz, Phys. Rev. B 50, 7331 (1994). [8] B.-G. Liu, Phys. Rev. B 67, 172411 (2003). [9] A. K. Das, C. Pampuch, A. Ney, T. Hesjedal, L. Daweritz, R. Koch, and K. H. Ploog, Phys. Rev. Lett. 91, 087203 (2003). [10] J. Gaude, P. L’Haridon, Y. Laurent, J. Lang, Rev. Chimie Minerale 8, 287 (1971). [11] G. Auffermann, Yu. Prots, and R. Kniep, Angew. Chem. Int. Ed. 40, 547 (2001). [12] G. Auffermann, U. Schmidt, B. Bayer, Yu. Prots and R. Kniep, Anal. Bioanal. Chem. 373, 880 (2002). [13] R. J. Meier and R. B. Helmholdt, Phys. Rev. B 29, 1387 (1984). [14] J. J. Attema, G. A. De Wijs, G.R. Blake, and R. A. de Croot, J. Am. Chem. Soc. 125, 16325 (2005). [15] J. J. Attema, G A. De Wijs, and R. A. de Groot, J. Phys.: Condens. Matter. 19, 165203, (2007). [16] J. Winterlik, G. H. Fecher, C. Felser, C. Mühle, and Martin Jansen, J. Am. Chem. Soc. 129, 6990 (2007). [17] O. Volnianska and P. Bogusławski, Phys. Rev. B 77, 220403 (R).(2008). [18] H. Pan, J. B. Yi, L. Shen, R. Q. Wu, J. H. Yang, J. Y. Lin, Y. P. Feng, J. Ding, L. H. Van, and J. H. Yin, Phys. Rev. Lett. 99, 127201 (2007)]

74
[19] X. J. Ye, H. A. Song, W. Zhong, M. H. Xu, X. S. Qi, C. Q. Jin, Z. X. Yang, C. T. Au, and Y. W. D, J.Phys. D:Appl. Phys. 41, 155055 (2008). [20] C. F. Yu, T.J. Lin, S.J. Sun, and H. Chou, J. Phys. D 40, 6497 (2007). [21] I. S. Elfimov, A. Rusydi, S. I. Csiszar, Z. Hu, H. H. Hsieh, H.-J. Lin, C. T. Chen, R. Liang, and G. A. Sawatzky, Phys. Rev. Lett. 98, 137202 (2007). [22] L. Shen, R. Q. Wu, H. Pan, G. W. Peng, M. Yang, Z. D. Sha, and Y. P. Feng, Phys. Rev. B 78, 073306 (2008). [23] K. Kenmochi, V. A. Dinh, K. Sato, A. Yanase, and H. Katayama-Yoshida, J. Phys. Soc. Jpn. 73, 2952 (2004). [24] T. Dietl, H. Ohno, F. Matsukura, J. Cibert, and D. Ferrand, Science 287, 1019 (2000). [25] T. Dietl, J. Appl. Phys. 103, 07D111 (2008). [26] K. Sato and Katayama-Yoshida, Jpn. J. Appl. Phys., Part 2 39, L555 (2000). [27] M. S. Park and B. I. Min, Phys. Rev. B 68, 224436 (2003). [28] C. H. Chien, S.H. Chiou, G Y. Gao Y. D. Yao, J. Magn. Magn. Mater. 282, 275 (2004). [29] K. Ando, H. Saito, Zhengwu Jin, T. Fukumura, M. Kawasaki, and Y. Matsumoto, J. Appl. Phys. 89, 7284 (2001). [30] H. J. Lee, B. S. Kim, C. R. Cho, and S. Y. Jeong, Phys. Status Solidi B 241, 1533 (2004). [31] D. B. Buchholz, R. P. H. Chang, J. H. Song, and J. B. Ketterson, Appl. Phys. Lett. 87, 082504 (2005). [32] D. J. Keavney, D. b. Buchholz, Q. Ma, and R. P. H. Chang, Appl. Phys. Lett. 91, 012501 (2007). [33] Q. Xu, H. Schmidt, S. Zhou, K Potzger, M. Helm, H. Hochmuth, M. Lorenz, A. Setzer, P. Esquinazi, Ch. Meinecke, and M. Grundmann, Appl. Phys. Lett. 92, 082508 (2008). [34] S. Deng, K. P. Loh, J. B. Yi, J. Ding, H. R. Tan, M. Lin, Y. L. Foo, M. Zheng, and C. H. Sow, Appl. Phys. Lett. 93, 193111 (2008). [35] R. Q. Wu, G. W. Peng, L. Liu, Y. P. Feng, Z. G. Huang, and Q. Y. Wu, Appl. Phys. Lett. 89, 062505 (2006). [36] J. H. Lee, I. H. Choi, S. Shin, S. Lee, J. Lee, C. Whang, S. C. Lee, K. R. Lee, J. H. Baek, K. H. Chae, and J. Song, Appl. Phys. Lett. 90, 032504 (2007).
75
[37] D. Huang, Yu. J. Zhao, D. H. Chen, and Yu. Z. Shao, Appl. Phys. Lett. 92, 182509 (2008). [38] L. H. Ye, A. J. Freeman, and B. Delley, Phys Rev. B 73, 033203 (2006). [39] L. M. Huang, A. l. Rosa, and R. Ahuja, Phys. Rev. B 74, 075206 (2006). [40] C. Sudakar, K. Padmanabhan, R. Naik, G. Lawes, B. J. Kirby, S. Kumar, and V. M. Naik, Appl. Phys. Lett. 93, 042502 (2008). [41] P. Esquinazi, A. Setzer, R. Hohne, C. Semmelhack, Y. Kopelevich, D. Spemann, T. Butz, B. Kohlstrunk, and M. Losche, Phys. Rev. B 66, 024429 (2002). [42] P. Esquinazi, D. Spemann, R. Hohne, A. Setzer, K.-H. Han, and T. Butz, Phys. Rev. Lett. 91, 227201 (2003). [43] H. Ohldag, T. Tyliszczak, R. Hohne, D. Spemann, P. Esquinazi, M. Ungureanu, and T. Butz, Phys. Rev. Lett. 98, 187204 (2007). [44] S. Talapatra, P. G. Ganesan, T. Kim, R. Vajtai, M. Huang, M. Shima, G. Ramanath, D. Srivastava, S. C. Deevi, and P. M. Ajayan, Phys. Rev. Lett. 95, 97201 (2005). [45] T. L. Makarova, B. Sundquist, R. Hohne, P. Esquinazi, Y. Kopelevich, P. Scharff, V. A. Davidov, L. S. Kashevarova, and A. V. Rakhmanina, Nature 413, 716 (2001). [46] R. A. Wood, M. H. Lewis, M. R. Lees, S. M. Bennington, M. G. Cain and N. Kitamura, J. Phys.: Condens. Matter 14, L385 (2002). [47] B. Narymbetov, A. Omerzu, V. V. Kabanov, M. Tokumoto, H. Kobayashi, and D. Michailovic, Nature 407, 883 (2000). [48] F. Simon, H. Kuzmany, B. Nafradi, T. Feher, L. Forro, F. Fulop, A. Janossy, L. Korecz, A. Rockenbauer, F. Hauke, and A. Hirsch, Phys. Rev. Lett. 97, 136801 (2006). [49] J. Zhao, C. Zeng, X. Cheng, K. Wang, G. Wang, J. Yang, J. G. Hou, and Q. Zhu, Phys. Rev. Lett. 95, 045502 (2005). [50] M. J. Butcher, F. H. Jones, P. H. Beton, P. Moriaty, B. N. Cotier, and M. D. Upward, Phys. Rev. Lett 83, 3478 (1999). [51] W. Hearneit, C. Boehme, S. Schaefer, K. Huebener, K. Fostiropoulos, and L. Lips, Phys. Rev. Lett. 98, 216601(2007). [52] Chih-Kai Yang, Appl. Phys. Lett. 92, 033103 (2008). [53] N. Parkansky, B. Alterkop, R. L. Boxman, G. Leitus, O. Berkh, Z. Barkay, Yu. Rosenberg, and N. Eliaz, Carbon 46, 215 (2008).

76
[54] For a review, see S. J. Blundell and F. L. Pratt, J. Phys.: Condens. Matter 16, R771 (2004). [55] P. O. Lehtinen, A. S. Foster, Y. Ma, A. V. Krasheninnikov, and R. M. Nieminen, Phys. Rev. Lett. 93, 187202 (2004). [56] P. O. Lehtinen, A. V. Krasheninnikov, A. S. Foster, and R. M. Nieminen, in "Carbon-Based Magnetism", ed. T. Makarova and F. Palacio, Elsevier 2006, p. 371. [57] Y. Zhang, S. Talapatra, S. Kar, R. Vajtai, S. K. Nayak, and P. M. Ajayan, Phys. Rev. Lett. 99, 107201 (2007). [58] Young-Woo Son, Marvin L. Cohen, Steven G. Louie, Nature 444, 347 (2006). [59] I. S. Elfimov, S. Yunoki, and G. A. Sawatzky, Phys. Rev. Lett. 89, 216403 (2002). [60] J. Osorio-Guille´n, S. Lany, S. V. Barabash, and A. Zunger, Phys. Rev. Lett. 96, 107203 (2006). [61] Haowei Peng, H. J. Xiang,Su-Huai Wei, Shu-Shen Li, Jian-Bai Xia, and Jingbo Li, Phys. Rev. Lett. 102, 017201 (2009). [62] T. A. Kennedy, N. D. Wilsey, J. J. Krebs, and G. H. Stauss, Phys. Rev. Lett. 50, 1281 (1983). [63] L. E. Halliburton, Phys. Rev. B 8, 1610 (1973). [64] B. H. Rose and L. E. Halliburton, J. Phys. C 7, 3981 (1974). [65] D. Galland and A. Herve, Phys. Lett. 33 A,1 (1970). [66] S. M. Evans, N. C. Giles, L. E. Halliburton, and L. A. Kappers, J. Appl. Phys. 103, 043710 (2008). [67] H. Itoh, A. Kawasuso, T. Ohshima, M. Yoshikawa, I. Nashiyama, S. Tanigawa, S. Misawa, H. Okumura, and S. Yoshida, Phys. Stat. Sol. (a) 162, 173 (1997). [68] L. Torpo, R. M. Nieminen, K.E. Laasonen, and S. Poykko. Appl. Phys. Lett. 74 (2), 221 (1999). [69] O.Volnianska and P. Boguslawski, XXXVII International School on the Physics of Semiconducting Compounds Jaszowiec 2008, p. 144. [70] P. Dev, Y. Xue, and P. Zhang, Phys. Rev. Lett. 100, 117204 (2008). [71] A. Drogetti, C. D. Pemmaraju, and S. Sanvito, Phys. Rev. B 78, 140404 (R) (2008).

77
[72] P. Hohenberg and W. Kohn, Phys. Rev. 136, B864 (1964). [73] W. Kohn and L. J. Sham, Phys. Rev. 140, A1133 (1965). [74] W. Kohn, Rev. Mod. Phys. 71, 1253 (1999). [75] R. G. Parr, W. Yang, Density-Functional Theory of Atoms and Molecules. Oxford: Oxford University Press. (1994). [76] M. Ceperley and B. J. Alder, Phys. Rev. Lett. 45, 566 (1980). [77] J. P Perdew, A. Zunger, Phys. Rev. B 23 (10), 5048 (1981). [78] D.C. Langreth and J.P. Perdew, Phys. Rev. B 21, 5469 (1980). [79] J. P. Perdew, J. A. Chevary, S. H. Vosko, K. A. Jackson, M. R. Pederson, D. J. Singh, and C. Fiolhais, Phys. Rev. B 46, 6671 (1992). [80] J. P. Perdew, K. Burke, and M. Ernzerhof, Phys. Rev. Lett.77, 3865 (1996). [81] D. R. Haman, M. Schluter, and C. Chiang, Phys. Rev. Lett. 43, 1494 (1979). [82] D. Vanderbilt, Phys. Rev. B 41, 7892 (1990). [83] www.pwscf.org. [84] H. J. Monkhorst and J. D. Pack, Phys. Rev. B 13, 5188 (1976). [85] M. Mizuguchi, H. Akinaga, T. Manago, K. Ono, M. Oshima, M. Shirai, M. Yuri, H. J. Lin, H. H. Hsieh, and C. T. Chen, J. Appl. Phys. 91, 7917 (2002). [86] J. H. Zhao, F. Matsukura, K. Takamura, E. Abe, D. Chiba, and H. Ohno, Appl. Phys. Lett. 79, 2776 (2001). [87] J. E. Pask, L. H. Yang, C. Y. Fong, W. E. Pickett, and S. Dag, Phys. Rev. B 67, 224420 (2003). [88] H. F. George and H. K. John, Phys. Rev. 93, 1004 (1954). [89] D. Gall, I. Petrov, N. Hellgren, L. Hultman, J. E. Sundgren, and J. E. Greene, J. Appl. Phys. 84, 6034 (1998). [90] T.-Y. Lee, D. Gall, C.-S. Shin, N. Hellgren, I. Petrov, and J. E. Greene, J. Appl. Phys. 94, 921 (2003). [91] J. R. Frederick and D. Gall, J. Appl. Phys. 98, 054906 (2005).

78
[92] K. Suzuki, T. Kaneko, H. Yoshida, Y. Obi, H. Fujimori, and H. Morita, J. Alloys Compd. 306, 66 (2000). [93] H. Yang, H. Al-Brithen, A. R. Smith, J. A. Borchers, R. L. Cappelletti, and M. D. Vaudin, Appl. Phys. Lett. 78, 3860 (2001). [94] W. R. L. Lambrecht, M. Prikhodko, and M. S. Miao, Phys. Rev. B 68, 174411 (2003). [95] B. R. Sahu and L. Kleinman, Phys. Rev. B 68, 113101 (2003). [96] A. Janotti, S. H. Wei, and L. Bellaiche, Appl. Phys. Lett. 82, 766 (2003). [97] P. Bogusławski and J. Bernholc, Appl. Phys. Lett. 88, 092502 (2006). [98] We do not consider other AFM phases since, e. g., in zb-MnTe energies of type-I and type-III AFM orders differ by 2 meV/atom only, see P. Djemia, Y. Roussigné, A. Stashkevich, W. Szuszkiewicz, N. Gonzalez Szwacki, E. Dynowska, E. Janik, B. J. Kowalski, G. Karczewski, P. Bogusławski, M. Jouanne, and J. F. Morhange, Acta Phys. Polonica A, 106, 239 (2004). Similar results are expected for II-V compounds. This value is an order of magnitude smaller than ∆EFM-
AFM for CaN and SrN, and thus does not affect our conclusions. [99] D.H. Martin, Magnetism in Solids, 1llife, London (1967). [100] V. A. Gubanov, A. I. Liechtenstein, and A. V. Postnikov, Magnetism and the Electronic Structure of Crystals (Springer, Berlin, 1992). [101] D. Ceperley, Nature 397, 386 (1999).
[102] G. Ortiz, M. Harris, and P. Ballone, Phys. Rev. Lett. 82, 5317 (1999).
[103] N. Takeuchi, Phys. Rev. B 65, 045204 (2002).
[104] J. C. Crowhurst, A. F. Goncharov, B. Sadigh, Ch. L. Evans, P. G. Morrall, J. L. Ferreira, and A. J. Nelson, Science 311, 1275 (2006). [105] A. Tabata, A. P. Lima, L. K. Teles, L. M. R. Scolfaro, J. R. Leite, V. Lemos, B. Schottker, T. Frey, D. Schikora, and K. Lischka, Appl. Phys. Lett. 74, 362 (1999). [106] A. F. Young, C. Sanloup, E. Gregoryanz, S. Scandolo, R. J. Hemley, and H. Mao, Phys. Rev. Lett. 96, 155501 (2006). [107] R. Yu, Q. Zhan, and X. F. Zhang, Appl. Phys. Lett. 88, 051913 (2006). [108] D. Iusan, B. Sanyal, and O.Eriksson, Phys. Rev. B 74, 235208 (2006).


![1 L 27 Electricity & Magnetism [5] Magnets –permanent magnets –Electromagnets –The Earth’s magnetic field magnetic forces applications Magnetism](https://img.dokumen.tips/doc/110x75/56649d9c5503460f94a85bd1/1-l-27-electricity-magnetism-5-magnets-permanent-magnets-electromagnets.jpg)


![L 28 Electricity and Magnetism [5] magnetism magnetic forces applications](https://img.dokumen.tips/doc/110x75/56649db65503460f94aa8390/l-28-electricity-and-magnetism-5-magnetism-magnetic-forces-applications.jpg)