Embed Size (px)
Citation preview

1 - 31 July 2017. Vol 4 Issue 4. For Private Circulation Only
pg 27. Interview – Mr R K Garg, ex PLNG
pg 4. Cover Story – Affordable Housing: India’s Metamorphosis
pg 31. Indian Economy – Trend Indicators
pg 33. PhillipCapital Coverage Universe – Valuation Summary

3GROUND VIEW GROUND VIEW 1 - 31 July 2017 1 - 31 July 2017 2
1st April 2017 Issue 3 1st March 2017 Issue 2
1st February 2017 Issue 1 1st December 2016 Issue 9
1st September 2016 Issue 71st November 2016 Issue 8
VOL 4. ISSUE 4. 1 - 31 JULY 2017
Vineet Bhatnagar- Managing Director and CEO
EDITORIAL BOARDNaveen Kulkarni, Manish Agarwalla, Kinshuk Bharti Tiwari, Dhawal Doshi
COVER & MAGAZINE DESIGN Chaitanya Modak, www.inhousedesign.co.in
EDITORRoshan Sony
RESEARCHBanking, NBFCs
Manish Agarwalla, Pradeep Agrawal, Paresh JainConsumer
Naveen Kulkarni, Preeyam ToliaCement
Vaibhav AgarwalEconomics
Anjali Verma, Shruti Bajpai Engineering, Capital Goods Jonas Bhutta, Vikram RawatInfrastructure & IT Services
Vibhor Singhal, Shyamal DhruveLogistics, Transportation & Midcap
Vikram SuryavanshiMidcap & Database Manager
Deepak AgarwalMedia
Manoj BeheraMetals & Automobiles
Dhawal Doshi, Nitesh SharmaOil & Gas
Sabri HazarikaHealthcare & Speciality Chemicals
Surya Patra, Mehul ShethTelecom
Naveen Kulkarni, Manoj Behera
EQUITY STRATEGYNaveen Kulkarni
TECHNICALSSubodh Gupta
PRODUCTION MANAGERGanesh Deorukhkar
SR. MANAGER - EQUITIES SUPPORTRosie Ferns
FOR EDITORIAL QUERIESPhillipCapital (India) Private Limited
No. 1, 18th Floor, Urmi Estate, 95 Ganpatrao Kadam Marg, Lower Parel West, Mumbai 400 013
SALES & DISTRIBUTION Ashvin Patil, Shubhangi Agrawal, Kishor Binwal,
Bhavin Shah, Ashka Gulati, Archan Vyas
CORPORATE COMMUNICATIONS Zarine Damania
Ground View - Previous Issues

3GROUND VIEW GROUND VIEW 1 - 31 July 2017 1 - 31 July 2017 2
31 . Indian Economy: Trend Indicators
33. PhillipCapital Coverage Universe Valuation Summary
CONTENTSLetter from the MD
27. INTERVIEW: Mr R K Garg,
ex Director Finance, Petronet LNG
4. COVER STORY: AFFORDABLE HOUSING: INDIA’S METAMORPHOSIS
The incumbent government seems to have taken up housing
in a manner that no previous government in India has done
before. It appears interested in using its ambitious Housing
for All 2022 project as an ‘agent of change’ in transforming
the Indian economic and social structure. Housing is known
to provide manifold employment and economic growth, but
the government might be looking at higher home ownership
as a means of effecting (much-needed) social equality or
minimizing India’s terrible socio-economic disparity and also
as a means for political mileage in the general elections in
2019.
Our cover story “Affordable Housing – India’s Metamorphosis”
evaluates whether the policy enablement is strong enough to
bring down the gap in housing in LIG and MIG segments.
Our analyst, Manish Agarwalla interacted with various
stakeholders such as policy makers, builders, financiers, and
end users of houses in order to understand their perspective
on affordable housing. The government’s subsidy scheme for
EWS and LIG has improved the affordability of this segment
and helped them come under the umbrella of formal lending
institutes. Developers have begun flocking to the affordable
space because of untapped demand, policy and fiscal
benefits, and lack of demand in normal housing. Surge in
demand for houses has created an opportunity for financiers.
Although the overall housing-finance market has expanded
due to increased affordability in the EWS and LIG segments,
the number of housing finance players in the system have also
increased.
Read on to find out how the governments housing for all
2022 scheme is likely to pan out over the next few years and
how it will probably be intricately woven into India’s political,
economic, and social fabric much like MGNREGA (the
employment guarantee scheme) did from 2005.
In addition to the cover story, we caught up with Mr R K
Garg, who recently superannuated from Petronet LNG
Ltd as Director Finance, after serving 16 years. He shared
his memorable experiences as a core part of India’s LNG
revolution, and talked about what the future could hold for
the company and the sector.
Best wishes
Vineet Bhatnagar

5GROUND VIEW GROUND VIEW 1 - 31 July 2017 1 - 31 July 2017 4
Karrm Infra’s project at Shahpur, near Mumbai. Karrm is a Mumbai-based affordable-housing builder with a portfolio under development of 15,000 units.

5GROUND VIEW GROUND VIEW 1 - 31 July 2017 1 - 31 July 2017 4
COVER STORY
BY MANISH AGARWALLA & KISHOR BINWAL
India has a large need-based housing shortage, as estimated by the technical
group. However, the government’s priority is to address demand-based
shortage first. Policy makers’ initiatives involve increasing supply by providing
fiscal sops to builders, reducing costs by providing extra FSI or by making
land available at a reasonable cost, and increasing affordability for buyers.
Given the huge demand-based shortage, affordable housing is a good way
for policy makers to revive the economy and insulating it to an extent from
global slowdowns. In this issue, GV looks at the efficacy of the government
policies towards affordable housing and tries to get a holistic perspective
by interacting with various stakeholders including financiers, policy makers,
builders, and end users (buyers).
pg. 6 IMPROVING AFFORDABILITY Turning dreams into realty________________________________________pg. 11 MITIGATING THE DEMAND-BASED SHORTFALL Demand-based housing target likely to be half of need-based shortfall________________________________________pg. 14 SUPPLY CHALLENGES Managing perception and cost________________________________________pg. 20 GOVERNMENT TURNS ENABLER Subsidy scheme gaining traction ________________________________________pg. 22 FINANCIER’S PREDICAMENT Rising competitive intensity – good/bad?________________________________________pg. 25 GDP MULTIPLIER A tool to boost the economy________________________________________
AFFORDABLE HOUSING:
INDIA’S METAMORPHOSIS

7GROUND VIEW GROUND VIEW 1 - 31 July 2017 1 - 31 July 2017 6
IMPROVING AFFORDABILITY
Turning dreams into realty
Table 1: Housing benefits for various segments
Satyanand Kadam works as a mechanic in a motor-
repairing shop in Ghatkopar, in central Mumbai.
He has spent 20 years of his life winding copper
wire and living in dilapidated housing conditions.
He supports a family of three with an income of Rs
22-25,000 per month and rents a shanty in one of
Mumbai’s numerous slums. Since most properties
in Mumbai are not below Rs 1mn, until recently,
Satyanand could never hope to own an apartment.
Of his total monthly income, he spends Rs 10-12,000
on food and about Rs 5-6,000 on rent. Even a Rs-
1mn property would result in a monthly instalment of
(Rs) EWS LIG MIG-I MIG-II
Household income 300000 3-600000 6-1200000 12-1800000
Average monthly income 12500 37500 75000 125000
Maximum instalment 6250 18750 37500 62500
Affordibility 600000 1800000 3600000 6000000
Home loan eligible for CLSS 600000 600000 900000 1200000
Interest subsidy 6.50% 6.50% 4% 3%
Tenure (years) 20 20 20 20
Maximum dwelling unit carpet area
covered
30 sq meter 60 sq meter 90 sq meter 110 sq meter
Processing fee (Rs) 3000 to be
given by govt
3000 for loan
upto Rs6lac to be
given by govt and
above Rs6lac PLI
can charge from
borrower
3000 for loan
upto Rs6lac to be
given by govt and
above Rs6lac PLI
can charge from
borrower
3000 for loan
upto Rs6lac to be
given by govt and
above Rs6lac PLI
can charge from
borrower
PV per Rs100 of loan 46 46 28 21
Total interest subsidy (Rs) 273,140 273,140 252,129 252,129
Interest subsidy % to loan 46% 15% 7% 4%
Effective interest rate NA 2.4% 3.8% 4.4%
Total interest subsidy, Rs 273,140 273,140 252,129 252,129
Interest subsidy as % of property value 46% 15% 7% 4%
Effective interest rate NA 2.4% 3.8% 4.4%
approximately Rs 9,000 after factoring in a ‘margin’
amount of Rs 100,000-150,000 – making it nigh
impossible for people like Satyanand. But something
has changed steadily in the last few years.
The magic of the CLSS scheme
Like Cinderella’s fairy godmother, in comes the
government swishing the magic wand of its credit-
linked subsidy scheme (CLSS) under its ‘housing
for all mission 2022’. The CLSS provides borrowers
with a one-time interest subvention of Rs 270,000.
Sour
ce: P
hilli
pCap
ital R
esea
rch

7GROUND VIEW GROUND VIEW 1 - 31 July 2017 1 - 31 July 2017 6
The credit-linked subsidy meaningfully improves
the affordability of prospective properties (please
refer to table 1) for the economically weaker section
(EWS) and low-income group (LIG). With the help of
CLSS, the house, which Satyanand could ill afford
until recently, becomes 27% cheaper. Consequently,
his EMI falls to Rs 6,300 from Rs 9,000. The
CLSS scheme has provided a big boost to lots of
prospective buyers with ticket sizes of less than Rs
2mn.
Affordable segment (financing and construction)
gaining momentum
The government’s thrust has made affordable-
housing a vibrant segment. Currently, real-estate
developers, in collaboration with financiers provide
faster and hassle-free loan-processing facilities to
prospective buyers. In its field visits, Ground View’s
team saw developers and financiers providing
housing loans even without income documents. For
example, Xrbia has a ‘no document’ scheme, where
buyers need not submit any income documents.
Any prospective buyer with the following details
can walk away with a home loan provided she has
– (1) no default in home, auto, personal loan, (2)
completes home / office verification successfully,
(3) personal discussion, and (4) KYC and 12-month
bank statements. However, for these schemes, the
interest rate charged is usually higher – for example,
Xrbia charges 11.9%. HDFC has a similar product,
where it charges about 13% interest. Likewise, Karrm
Infrastructure (a Mumbai-based affordable-housing
builder with a portfolio under development of
15,000 units) provides buyers with loans and options
of various insurance plans such as the option of an
annuity-based insurance plan (which is added to the
cost of the house), were the annuity is reinvested
and a lump sum amount is paid on closure of the
loan. The insurance scheme provides comfort to
The CLSS scheme has provided a big boost to lots of prospective buyers with ticket sizes of less than Rs 2mn
Most affordable projects have homes starting from Rs 0.9mn up to Rs 2mn. These projects usually come up on the outskirts of cities and provide amenities
Affordable housing loan book
Sour
ce: P
hilli
pCap
ital R
esea
rch,
ICRA

9GROUND VIEW GROUND VIEW 1 - 31 July 2017 1 - 31 July 2017 8
There is no data on an all-India basis to quantify the progress made by private builders, but GV team’s survey in Maharashtra and Gujarat suggests that encouraging progress has been made on the supply side
financiers and acts as an incentive to the buyer for
timely repayment of EMI.
Most affordable projects have homes starting from
Rs 0.9mn up to Rs 2mn. Given the high cost of
land within city limits, these projects usually come
up on the outskirts of cities and provide amenities
such as schools, medical centres, market places,
and play areas. These basic amenities are essential
to convince buyers to shift to the outskirts, which
more often than not entails quite a bit of work-
related travelling. Buyers are usually willing to
travel more if the housing schemes provide safety,
security, hygiene, and amenities. In one of Karrm
Infrastructure’s completed project, the GV team
visited a school affiliated to Maharashtra state board.
Amenities, such as reputable schools for children is
one of the main basis for people to shift to locations
on the outskirts of cities.
PMAY – HFA by 2022 has gained momentum in FY17
with the sanction of government-approved projects
growing rapidly. The total houses sanctioned under
various government projects increased by more
Sales office of an affordable project near Vastral, Ahmedbad
In major cities, hoardings advertising affordable housing have mushroomed. The one above is at Asangaon railway station, central line, Mumbai

9GROUND VIEW GROUND VIEW 1 - 31 July 2017 1 - 31 July 2017 8
than 3x to 2.1mn units, involving a total investment
of Rs 1tn. Similarly, projects by private builders in
the affordable segment have also seen significant
traction. There is no data on an all-India basis to
quantify the progress made by private builders,
but GV team’s survey in Maharashtra and Gujarat
suggests that encouraging progress has been made
on the supply side. The outskirts of mega cities
such as Mumbai have witnessed massive projects in
areas such as Badlapur, Shahpur, Neral, and Vangani
– along Mumbai’s central railway line. Similarly,
affordable projects are visible in Virar and Dahanu
Road along the western side. A patch of 25km in
Vastral (a city and a municipality in Ahmedabad
district in the Indian state of Gujarat) is home to
more than 250 affordable housing projects.
The buyers’ profiles
Monthly household incomes of buyers of these
projects ranges between Rs 25,000 and Rs 50,000.
Families with monthly incomes of Rs 22,000-25,000
would typically look for homes with a ticket size of
about Rs 800,000, while those with higher monthly
incomes of Rs 30,000-35,000 usually peruse
properties worth Rs 1.5mn. Families with even higher
monthly incomes (Rs 45,000-50,000) usually look at
properties worth about Rs 2mn.
The customer profile in the income bracket Rs
25,000-50,000 varies between salaried and self-
employed, usually 50:50. Salaried people are private
company employees, government employees, or
semi-government employees. In households seeking
out affordable housing, usually, there are two or
more earning members – in most cases, husband
and wife are both gainfully employed. Therefore,
builders and financial institutions have made co-
ownership (husband-wife) mandatory, in order to
avail government subsidy.
The nature of the demand – EWS, LIG, migrants
to cities
The demand for housing in the affordable segment
has increased in cities due to a large migrant
population. The demand is higher in cities with more
industrial belts such as Mumbai, Ahmedabad, Pune,
Nasik, Surat, Indore, Coimbatore, and Chennai.
Migrant workers who have settled in those areas for
a while, want their families to come and live with
them. A reasonable part of the demand in the low-
ticket segment comes from such migrant workers.
The report by The Technical Urban Group (TG-12),
constituted by the Ministry of Housing and Urban
Poverty Alleviation, pegs almost 96% of the housing
shortage from the EWS and LIG segments. As per
the government of India’s latest definitions, EWS
constitutes households with an annual income of
up to Rs 300,000 and LIG as those with Rs 300,000-
600,000. As a thumb rule, affordability is calculated
at four times the annual income. Considering the
shortfall, houses worth Rs 500,000 to Rs 2mn have
always been in demand in urban centres. This
demand has grown with the government of India’s
subsidy scheme, which has increased affordability in
a meaningful manner.
Lenders’ profiles and practices: Paradoxically
costly
Many formal lending institutes provide loans above
Rs 1mn, but very few provide loans between Rs
0.5mn and Rs 1mn. As per NHB data, in 2015, only
about 15% of loans that were disbursed were in
the less than Rs 1mn range. As per Jones Lang
LaSalle’s report on affordable housing, “The key
Year No. of houses sanctioned (mn dwelling units)
Project cost involved, Rs bn
Jul-17 2.1 1,111
Mar-17 1.8 957
Mar-16 0.4 201
Table 2: PMAY - Progress report
The demand for housing in the affordable segment has increased in cities due to a large migrant population
96% of the housing shortage is from the EWS and LIG segments
Source: MHUPA

11GROUND VIEW GROUND VIEW 1 - 31 July 2017 1 - 31 July 2017 10
issue that deprives people from availing a home
loan in the Rs 0.5-1mn bracket is the perceived high
risk – apprehensions of loans turning into non-
performing assets and uneven payment patterns.”
These segments are economically weaker, and live
in dilapidated housing conditions without proper
sanitation and drinking water. The government is
trying to address the issue of housing shortage in
the EWS segment in cities by providing grants to
dwellers under slum-area-redevelopment schemes in
partnership with private builders. However, the pace
of growth in addressing the issue of this segment is
slow, resulting in a deep housing shortfall.
The lending rate in the affordable segment varies,
depending on the customer profile. It starts
with 8.6% for a salaried customer with a reputed
BHK Carpet area, sq ft.
carpet rate Rs/
sq ft
Basic value,
Rs
CDC , Rs Actual value (Rs)
loan offered before sub-
sidy (Rs)
LTV (%) Loan after subsidy
(Rs)
LTV (%) Average monthly
household income (Rs)
1RK 162 4,330 701,460 200,000 901,460 856,387 95 589,387 65 25,000
1BHK 252 4,800 1,209,600 200,000 1,409,600 1,339,120 95 1,072,120 76 35,000
2BHK smart 310 4,800 1,488,000 250,000 1,738,000 1,651,100 95 1,384,100 80 40,000
2BHK comfort 368 4,950 1,821,600 250,000 2,071,600 1,968,020 95 1,701,020 82 50,000
Table 3: Price list of Xrbia Vangani (Badlapur)
organisation (can be government or private) to 13%
for a self-employed person with no income proof.
There are some financiers who even charge 15-16%,
but those would be in very few cases. A processing
fee of 0.75-1.00% is levied, unlike in the mid-income
housing segment, where processing fee is waived
by financiers in the wake of increased competition.
The processing fee compensates the financier
for the cost incurred in acquiring the customer.
Cost of acquiring a customer is a referral fee paid
to the direct selling agents. The interest rate in
affordable segment is high due to factors such as
high operating expenses and high risk of default
(because of buyers’ erratic cash flow, especially in
self-employed segment).
The interest rate for the affordable segment is high because of high operating expenses (lenders’) and high risk of default (borrowers’)
GV has tried to answer these questions in the following sections – Is
the affordable segment being overcharged by financiers? Or, is the
high interest rate necessary for financiers because of the low ticket
value and vulnerability of default, in order to generate a reasonable
internal rate of return?
Sourfe: Xrbia, PhillipCapital Research

11GROUND VIEW GROUND VIEW 1 - 31 July 2017 1 - 31 July 2017 10
MITIGATING THE DEMAND-BASED SHORTFALL
Demand-based housing target likely to be half of need-based shortfall
Government to probably look at housing shortfall
only for the homeless (about 10mn units vs. TG-
12’s estimate of 18.7mn)
In 2012, the technical group (TG-12) estimated
that the need-based total housing shortfall in India
in 2012 was 18.7mn dwelling units. The shortfall
calculated by TG-12 captured a genuine demand
for houses, but from the policy maker’s point of
view, the priority is to address the housing shortfall
for the homeless – whether it is a single person, a
couple, or a family. The actual housing need for the
homeless was never done before. Hence, under
the Pradhan Mantri Awas Yojna - Housing for All by
2022 programme, the Government of India initiated
the mammoth task of estimating the exact number
of houses needed for the homeless. This would
depend on demand survey for which all states/
cities would undertake detailed demand assessment
by integrating Aadhar number, Jan Dhan Yojana
account numbers, or any such identification of the
intended beneficiaries.
Though the survey is still ongoing in some states,
GV’s discussions with various government official
suggests that the advance estimate of the housing
shortfall only for the homeless is around 10mn.
Households living in non-serviceable katccha 0.99
Households living in obsolescent houses 2.27
Households living in congested houses requiring new houses 14.99
Households in homeless condition 0.53
Total 18.78
Table 4: Housing shortage in urban India in 2012 (mn units)
Therefore, it can be said that ‘the housing for all by
2022’ envisages building 10mn houses (not 18.7mn
recommended by TG-12). Within these, 96% of the
shortfall is in the economically weaker section and
low-income group.
The technical group’s estimates
The methodology that TG-12 adopted considers: (1)
identification of households residing in dilapidated
and non-serviceable houses, (2) households living in
congested conditions, and (3) homeless households.
The TG-12 report found that 80% of the shortage
Units, mn %
Economically weaker section (EWS) – Annual HH income upto Rs0.3 mn
10.55 56.2
Low income group (LIG) – Annual HH income Rs0.3-0.6 mn
7.41 39.5
MIG & above – Annual HH income > Rs0.6 mn 0.82 4.4
Total 18.78 100.0
Table 5: Economic-group-wise housing shortageGV’s discussions with various
government official suggests that the advance estimate of the housing shortfall for homeless is around 10mn (much less than the 18.7mn dwelling units that TG-12 estimated)
Source: Report of Technical Urban group TG-12, MHUPA
Source: Report of Technical Urban group TG-12, MHUPA, HH: Household

13GROUND VIEW GROUND VIEW 1 - 31 July 2017 1 - 31 July 2017 12
emanated from congestion (need based). The
manner in which it was calculated is – “couple or
persons above 10 years of age who did not have
their own room”.
As per the TG-12 report, urban housing shortage is
prominent across the economically weaker sections
(EWS) and low-income groups (LIG), which together
constitute over 95% of the total housing shortage. It
estimated the housing shortage among the middle-
income groups (MIG) and above at 4.38%.
State-wise housing shortage
State-wise distribution indicated that top-10 states
(in terms of population) contribute to 76% of
India’s total housing shortage, with Uttar Pradesh’s
contribution among the highest at 16.5%. Various
state governments such as Maharashtra and West
Bengal have launched their own housing schemes to
tackle the need in the EWS segment. Though they
have made some progress, the gap is still too wide.
Increasing urbanisation to drive demand for
housing
India’s urban population is set to outpace its overall
population growth. Over 2001-11, India’s urban
population CAGR was almost 3%, resulting in an
increase in the urbanisation rate to 31.2% from
27.8%. Out of the 1.21bn people who live in India,
377mn are urban dwellers. Federation of Indian
Chambers of Commerce (FICCI) estimates that by
2050, the country’s cities will see a net increase of
900mn people! Over 2012-50, the urbanisation
CAGR is likely to be 2.1%.
India’s agriculture sector has a limited absorption
capacity, so most of the growth in urbanisation
is likely to be a consequence of a rural-to-urban
migration. After India’s economic liberalisation, its
manufacturing and services sectors have seen an
influx from rural youth (in terms of employment).
With the country likely to witness rapid
industrialisation, this migration trend (rural to urban)
is likely to continue.
As per commercial property and investment management firm JLL, “The main reasons for rise in shortage in affordable housing on the supply side is lack of availability of urban land, rising construction costs and regulatory issues while lack of access to home finance for low-income groups are constraints on the demand side. Construction costs form nearly 50% to 60% of the total selling price in affordable housing projects while for luxury projects this figure is 18% to 20%. Moreover, majority of the loans disbursed by banks and housing finance companies are above Rs 1mn”
State-wise housing shortage, mn units
The 10 most populated states contribute to 76% of India’s total housing shortage; Uttar Pradesh is the highest
Sour
ce: M
HUPA
13GROUND VIEW GROUND VIEW 1 - 31 July 2017 1 - 31 July 2017 12
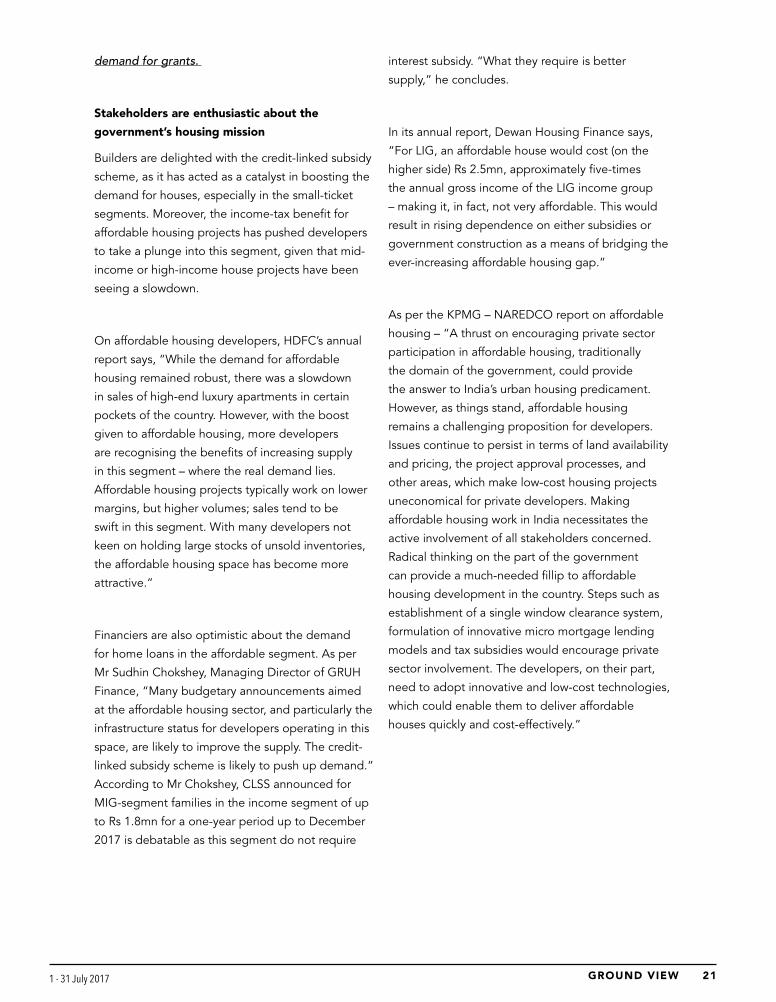
Urbanisation trend in India (%)
Meanwhile, in urban India, the looming housing
shortage and growing concentration of people
has resulted in an increase in the number of
people living in slums and squatter settlements.
Skyrocketing prices of land and real estate in
urban areas have induced the poor and the
economically weaker sections of the society
to occupy the marginal lands typified by poor
housing stock, congestion, and obsolescence.
According to a report submitted by a technical
committee to the Ministry of Housing and Urban
Poverty Alleviation (MHUPA), India’s urban housing
Source: PhillipCapital Research, MHUPA
shortage is estimated at nearly 18.78 million households in
2012.
It is apparent that a substantial housing shortage looms in
urban India and a wide gap exists between the demand
and supply of housing, both in terms of quantity and quality
in India (Bridging the Urban Housing Shortage – KPMG
NAREDCO report).
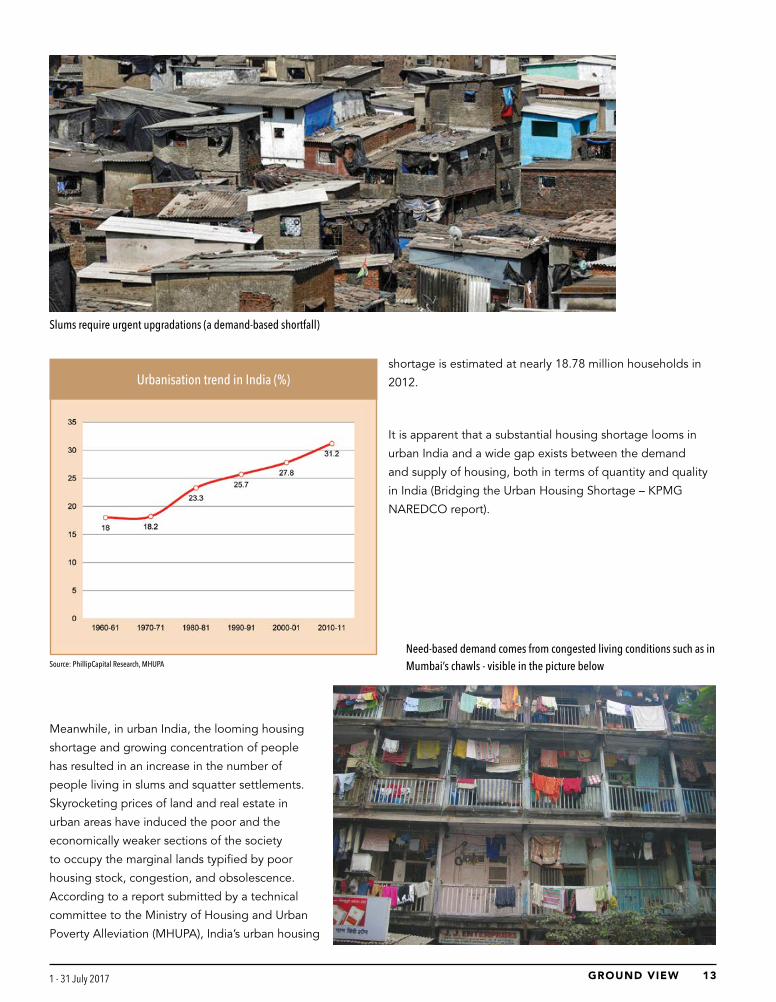
Slums require urgent upgradations (a demand-based shortfall)
Need-based demand comes from congested living conditions such as in Mumbai’s chawls - visible in the picture below

15GROUND VIEW GROUND VIEW 1 - 31 July 2017 1 - 31 July 2017 14
SUPPLY CHALLENGES
Managing perception and cost
Mr Sanjay Shah, the chairman and managing
director of DBS Affordable Housing Strategy, in his
book ‘Pursuit of Affordable Housing’, mentioned
that the development of affordable housing by
a private player is all about cash flows, volume,
and passion – managing cash flows to complete
construction and delivery on time, producing
enough units to break even, sustaining in the
market, and a passion to serve lower-income people
against all odds – form the core of this business, he
believes.
He goes on to say that, “There are many ways in
which the affordable segment is fundamentally
different. It has a lower rate of return due to low
appreciation in the prices of units. A Rs 1mn
dwelling is not likely to appreciate to Rs 2mn,
because then it stops being affordable. Even if does
appreciate, people with a capacity to purchase a
Rs 2mn unit are unlikely to be compatible (socially
and economically) with the people already residing
in such housing. Appreciation in the real estate
market is a different story altogether. Construction of
a signature, ‘limited edition’ society in a posh area
will ensure unlimited appreciation. This is the basic
difference between regular real estate businesses
and affordable housing.”
Apart from a perception challenge, affordable
housing also involves challenges related to
supplying houses at a really ‘affordable’ cost,
especially within city limits.
Some of the most common constraints that make
houses unaffordable are:
Unavailability of land in urban areas
In urban areas, high population density has
triggered huge demand. In such high-cost areas,
the number of projects completed or under
construction (such as Maharashtra and Delhi) tend
to be low, suggesting that availability of adequate
land is a must. Reports by various consultancy firms
suggest that without the government’s support,
limited availability of land in urban areas makes
it unviable for developers to take up affordable
housing projects. A KPMG report on the urban
housing shortage in India says that substantial non-
marketable urban land that government-owned
entities (such as railways) own, can be used more
efficiently – a number of such land parcels are in
centrally located areas. Through better monitoring,
authorities can make more optimum use of these
land parcels and prevent the on-going proliferation
of slums and squatter settlements in these areas.
Delays in approvals and permission
Even though real estate and housing contribute
significantly to India’s economic growth, the
sectors have “peculiar complexities that arise from
uncertainties, inter-dependencies, and inefficiency
in the operations of various process workflows and
authorities,” says a study by KPMG and NAREDCO.
The building approval process in India is relatively
slower and more expensive than in vs. several other
countries. In India, various types of approvals are
required at different stages by different authorities.
The KPMG-NAREDCO study says, “Development
authorities allocate approvals based on land use and
zoning regulations, while municipal corporations
are responsible for the enforcement of building
regulations as stipulated by the ‘NBC’. Additionally,
several non-planning permissions are also required
to be obtained from various authorities such as the

15GROUND VIEW GROUND VIEW 1 - 31 July 2017 1 - 31 July 2017 14
Approvals Maharashtra Gujarat Orissa Tamil Nadu Haryana
NA Permission/ Land conversion 3 months + 2 months 3-6 months 9 months 6 months
Ownership certificate 15 days 60 days 6-12 months 12 months 3 days
Building layout approval 1 month 6 months 6-12 months 45 days 6 months
Commencement certificate 15-30days 2-3 months 6 months 1-4 months 6-9 months
ASI 6 months over 1 year 3-24 months 2 months
AAI 3-4 months 6 months 6-12 months 1-2 months 3 months
Environment 3 months + 1 year 30days to 12 months 4-8 months 2 years
Building completion certificate 30 days 3-4 months 6-12 months 3-6 months 6 months
Occupancy certificate 60days 6 months
Table 6: Time taken for various approvals
Traffic and Coordination Department, Airport Authority of
India (AAI), Coastal Regulatory Zone (CRZ) authorities etc.,
as an assurance that buildings do not adversely affect their
surrounding areas. Permits are also needed from utilities
departments such as water and sewerage departments,
electricity boards, etc.” A FICCI research report titled
‘Streamlining Approval Procedures for Real Estate Projects’,
which surveyed five states, suggests that in India, it takes
anywhere between 2.5-4.0 years, on an average, to receive
necessary building approvals.
As per the ‘World Bank Group Report – 14’, in terms of
ease of dealing with construction permits, India is #185
in a ranking of 190 economies. The report highlights that
in India, an average of 35 procedures are needed over a
period of 190 days for obtaining construction permits (12
approvals over an average of 152 days in the OECD region,
16 approvals over an average of 196 days in the South Asia
region).
Mumbai Delhi India South Asia
OECD high income
Procedures (numbers) 42 29 35 16 12
Times (days) 164 213 190 196 152
Cost (% of warehouse value) 25 27 35 17 2
Building quality control index (0-15) 12 11 11 9 11
Table 7: Findings of the World Bank report on deal-ing with construction permits
Poor fund availability to builders
Real-estate developers are grappling with
funding challenges. Banks have curtailed
their exposure to real estate (citing caution),
leaving the developer segment with high-cost
finance options such as Non-banking Financial
Companies (NBFCs) and Private Equity (PE)
funding. Moreover, the high cost of finance,
coupled with waning demand, has disrupted
developers’ cash flows, leading to deferred project launches
and a change in the slated supply. For affordable housing
developers, the funding situation is even grimmer.
Bank credit to commercial real estate
Sour
ce: F
ICCI
Sour
ce: W
orld
Ban
k
Source: PhillipCapital Research

17GROUND VIEW GROUND VIEW 1 - 31 July 2017 1 - 31 July 2017 16
Targets urban areas with following components/options for
states/union territories and cities:
• Rehabilitation of slum dwellers with participation of
private developers using land as a resource
• Promotion of affordable housing for weaker sections
through credit-linked subsidy
• Affordable housing in partnership with public and private
sectors
• Subsidy for beneficiary-led individual house construction
or enhancement
Features
• Central grant of Rs 100,000 per house, on an average,
available under the slum rehabilitation programme. State
governments would have flexibility in deploying this
grant to any slum rehabilitation project (that uses land as
a resource for providing houses to slum dwellers).
• Under the Credit-Linked Interest Subsidy component, an
interest subsidy of 6.5% (on housing loans up to a tenure
of 15 years) will be provided to EWS/LIG categories,
wherein the subsidy payout on an NPV basis would be
about Rs 230,000 per house, for both categories.
• Central assistance at the rate of Rs 150,000 per house
for EWS will be provided under ‘affordable housing’
in partnership and beneficiary-led individual house
construction or enhancement.
• State governments or urban local bodies (like housing
boards) can take up affordable housing projects to avail
PRADHAN MANTRI AWAS YOJNA –
Housing for all by 2022the central government’s grant.
• Will be implemented as a Centrally Sponsored Scheme
except the credit-linked subsidy component, which will
be implemented as a Central Sector Scheme.
• The mission prescribes certain mandatory reforms for
easing up the urban land market for housing, to make
adequate urban land available for affordable housing.
Houses constructed under the mission would be allotted
in the name of the female head of the households or in
the joint name of the male head of the household and
his wife.
• The scheme will cover the entire urban area consisting of
4,041 statutory towns with an initial focus on 500 Class-1
cities and it will be implemented in three phases:
o Phase-I (April 2015 – March 2017) to cover 100
cities to be selected from States/UTs as per their
willingness.
o Phase – 2 (April 2017 – March 2019) to cover
additional 200 cities.
o Phase-3 (April 2019 – March 2022) to cover all other
remaining cities.
• However, there will be flexibility in covering number of
cities in various phases and inclusion of additional cities
may be considered by the Ministry of Housing & Urban
Poverty Alleviation in case there is demand from states
and cities, and there is capacity to include them in earlier
phases.
• Credit-linked subsidy component of the scheme would
be implemented across the country in all statutory towns
from the very beginning.
Implementation:
• Dimension of the task at present is estimated at 20mn
houses. However, the exact number of houses would
depend on a demand survey, for which all states/

17GROUND VIEW GROUND VIEW 1 - 31 July 2017 1 - 31 July 2017 16
cities will undertake a detailed demand assessment
and assess actual demand by integrating Aadhar
number, Jan Dhan Yojana account numbers, or any such
identification of intended beneficiaries.
• A Technology sub-mission under the Mission would be
set up to facilitate adoption of modern, innovative, and
green technologies, and building material for faster and
quality construction of houses. It will:
o Facilitate preparation and adoption of layout
designs and building plans suitable for various geo-
climatic zones.
o Assist states/cities in deploying disaster resistant
and environment friendly technologies.
o Will coordinate with various regulatory and
administrative bodies for mainstreaming and
up-scaling deployment of modern construction
technologies and material in place of conventional
construction.
o Coordinate with other agencies working in green
and energy efficient technologies, climate change,
etc.
o Will also work on the following aspects: (1)
design and planning, (2) innovative technologies
and materials, (3) green buildings using natural
resources, and (4) earthquake and other disaster
resistant technologies and designs.
In the spirit of cooperative federalism, the mission will
provide flexibility to states for choosing best options
among the four verticals of the mission, to meet housing
demand in their states. The process of project formulation
and approval in accordance with ‘mission guidelines’ would
be left to the states so that projects can be formulated,
approved, and implemented faster. The mission will
provide technical and financial support in accordance with
the ‘guidelines to the states’ to meet the challenge of
urban housing.
The mission will also compile best practices in terms of
affordable housing policies of the states/UTs designs
and technologies adopted by states and cities with an
objective to spread best practices across states and cities,
and foster cross learning. The mission will also develop a
virtual platform to obtain suggestions and inputs on house
design, materials, technologies, and other elements of
urban housing.
Central and state grants and incentives + local bodies
In order to incentivise borrowers and generate demand
for housing, Government of India has provided various
incentives and grants. For the EWS segment, it provides
a (per dwelling) central grant of Rs 150,000 where the
unit cost is around Rs 500,000. Apart from the central
government, state governments and urban local bodies
have various schemes with grant amounts of Rs 150,000-
250,000. Due to the existence of both central and state
grants, the beneficiary contribution tends to be minimal or
nil in the EWS segment.
In order to incentivise the LIG and MIG segments, the
government launched the credit-linked subsidy scheme
(CLSS). It provides an interest subsidy of 6.5% in the LIG
segment for loans up to Rs 600,000. Similarly, the interest
subsidy available for MIG-1/2 (MIG 1: Household income
Rs 0.6-1.2mn; MIG 2: Rs 1.2-1.8mn) is 4%/3%. The present
value of the subsidy amount is reduced from the principal
component, which brings down the cost of the dwelling
unit. For the LIG segment, the subsidy benefit for a
dwelling unit costing Rs 1.8mn translates to 14%. Similarly,
the average benefit in MIG-1/2 works out to 7%/4%.
Income tax benefits provided to home-loan borrowers,
along with subsidy schemes, brings down the effective
interest costs of home loans to as low as 2.4% for LIG,
which is similar to rental yields in India, while for MIG-1/2,
the costs come to 3.8%/4.4%.
Under CLSS, the present value of the subsidy amount is reduced from the principal component, which brings down the cost of the dwelling unit

19GROUND VIEW GROUND VIEW 1 - 31 July 2017 1 - 31 July 2017 18
The success stories globally in affordable housing have
some things in common, which can be well replicated in
India. Land has always being an issue within city limits. In
most of the global success stories, the government has
made land available. In India, today, government or semi-
government bodies (such as railways, defence, and state
transport authorities) own large land parcels. These land
parcels can be effectively used for affordable housing at low
costs. Similarly, there is a concept of rental homes provided
by local authorities, which would help address the issue of
down payments. Redevelopment of existing slums is a major
hurdle in cities such as Mumbai due to relocation policies.
Therefore, a welcome move would be policies (such as
higher FRA/FSI) that support redevelopment without too
much inconvenience to developers.
Singapore affordable housing:
The government develops and manages a large part of
the residential housing in Singapore. Around 75% of the
housing stock in the country is built by The Housing &
Development Board (HDB), Singapore’s public housing
authority. The primary objective of HDB is to provide
affordable housing for the poor. The purchase of these flats
is financially aided by the Central Provident Fund (CPF).
Because of effective policies, the country’s home ownership
rate at 90% is one of the highest globally. Currently,
Singaporeans who have a family income of less than SG$
12,000 a month qualify for an apartment. Among resident
employed households, the 2014 median household income
from work was SG$ 8,292 per month. The median house
type is a four-room flat sold by the Housing & Development
Board (HDB), on a 99-year leasehold basis.
Government provides support for HDB in the form of: (1)
annual grants from the current budget to cover its deficits
incurred for development, maintenance, and upgrading
of estates, (2) loans for mortgage lending and long-term
development purposes, and (3) land allocation for HDB
housing and comprehensive HDB town planning. The
Singapore affordable model has been a great success – 82%
of the resident population lived in such accommodation
as on 31 March 2015. The HDB brought about a
transformation on the housing-supply side, leading to higher
homeownership rates, which doubled to 59% in 1980 from
29% in 1970 and reached 90%+ in 2017.
Eligibility criteria for various dwelling types
• HDB rental and direct purchases are restricted to
citizens, with current monthly gross household income
caps at SG$ 1,500 for rental and SG$ 12,000 for direct
purchase, respectively.
• The Executive Condominium scheme, a hybrid public–
private housing scheme for citizen households, has a
household income cap of SG$ 14,000.
• The resale HDB sector is available to citizens and
Singapore permanent residents (SPRs). However, HDB
housing grants are made taking into account citizenship,
marital status, and household income of purchaser
households.
• The private housing sector is dominated by transactions
of higher-income Singapore citizens, SPRs, expatriates,
and foreign investors.
Central Provident Fund used as a vehicle for housing
finance
• In 1968, the government allowed withdrawals from the
CPF fund to finance the purchase of housing sold by
the HDB. Both employers and employees contributed a
certain share of the individual employee’s monthly salary
toward the employee’s personal and portable account
in the fund. When the CPF was established in 1955, the
contribution rate was 10% (5% each by employees and
employers) of the monthly salary. These rates were raised
gradually to 25% of wages in 1984. At present, these
are 20% of salary for employees and 17% of salary for
employers, up to a monthly salary ceiling of SG$ 6,000.
Singapore follows a progressive subsidy and tax structure
– wealthy property owners and investors are taxed and the
receipts are used to subsidise homeownership of lower-
income groups.
Global experience in affordable housing

19GROUND VIEW GROUND VIEW 1 - 31 July 2017 1 - 31 July 2017 18
Hong Kong affordable housing
The Hong Kong Housing Authority (HKHA) and The Hong
Kong Housing Society (HKHS) are two statutory bodies that
are responsible for implementing most of Hong Kong’s
public housing programmes. Hong Kong’s Long-Term
Housing Strategy (LTHS) has three major directions:
• To build more public rental housing (PRH) units and to
ensure the rational use of existing resources; these units
are rented at discounted rates to low-income residents
• To provide more subsidised sale flats, expand the forms
of subsidised home ownership, and facilitate the market
circulation of existing stock. These categories of houses
are assigned for sale to low-income qualifiers at prices
that are significantly lower than market value, and the
land value is similarly subsidised. The mortgage and
resale of these units in the second-hand market are
likewise restricted to eligible low-income residents.
• To stabilise the residential property market through
steady land supply and appropriate demand-side
management measures, and to promote good sales and
tenancy practices for private residential properties.
As of 31st March 2016, about 30% of the population lived in
PRH flats and 16% lived in subsidised sale flats; the rest 54%
were residing in private permanent houses. Because of the
focus on rental housing, home ownership rate in Hong Kong
remained relatively lower at about 50%.
Shanghai affordable housing
The Shanghai affordable housing model is based on four
approaches:
• Low-rental housing for extremely poor families who
otherwise find it difficult to be included in the formal
housing sector
• Public rental housing for the working population with
stable incomes
• Shared ownership housing with the government
• Housing for those who need to be relocated from their
old shaky buildings
Shanghai has set up a housing provident fund to fund
low-cost housing. The government introduced the Housing
20 building complexes in Shanghai, which includes a mix of 5- and 14-sto-rey buildings. Approximately 60 sqm per apartment, comprising living room, two bedrooms, kitchen, and bathroom
Economically affordable housing
Provident Fund in Shanghai in 1991, requiring all employees
of state-owned enterprises to contribute a proportion of their
salaries to the fund – with employers contributing a similar
amount. Workers are allowed to withdraw their savings from
the fund when they retire; alternatively, they can use the
money to purchase homes in the private housing market.
They can also apply for low-interest loans from the fund to
buy property. Because of the effective affordable housing
policy, homeownership in Shanghai has more than doubled
to 85% from 36% in 1997.

21GROUND VIEW GROUND VIEW 1 - 31 July 2017 1 - 31 July 2017 20
GOVERNMENT TURNS ENABLER
Subsidy scheme gaining traction
The government strongly inclined to become an
‘enabler’ vs. being a provider earlier, but…
GV team’s discussion with various stakeholders
(financiers, builders, policy makers) indicated a
strong commitment by the government towards
addressing India’s housing shortage. In order to
incentivise borrowers and generate demand for
housing, the government has taken on the role of an
‘enabler’, by providing various incentives and grants.
…will it put its money where its mouth is?
The housing shortfall of 10mn houses would require
central government support (grant and subsidy) of
Rs 1.8tn. However, the allocation in the previous four
years has been low, and the worst part is that the
utilisation of the allocated amount was even poorer.
The GOI allocated only Rs 200bn in the FY15-18
union Budgets and utilisation was poor at 15% in the
initial two years. Allocation towards urban housing in
the FY17-18 Union Budget was only Rs 60bn.
Looking at this meagre annual allocation number,
is it likely that the government will have resources
to fund affordable housing? Given the poor
past track record, can utilisation of the allocated
amount improve? From GV’s discussions with
government officials it appears that resources
Unit in Rs bn Year PMAY-Rural PMAY-Urban
Allocation Utilisation Allocation Utilisation
2018 230.0 60.4
2017 150.0 50.8
2016 100.0 101.2 46.3 14.9
2015 159.8 111.0 31.0 10.9
Table 8: GoI investment under Pradhan Mantri Awas Yojna, RBI
State-wise progress of PMAY at the end of March 2017
are not constrained. For FY17-18, it seems that
almost 80% of the money allocated towards urban
housing schemes has already been used up (within
three months) and the ministry is ‘contemplating’
additional fund allocation under supplementary
The housing shortfall of 10mn houses would require central government support (grant and subsidy) of Rs 1.8tn
Source: IndiaBudget.nic.in
Sour
ce: M
HUPA
, Phi
llipC
apita
l Res
earc
h
21GROUND VIEW GROUND VIEW 1 - 31 July 2017 1 - 31 July 2017 20
demand for grants.
Stakeholders are enthusiastic about the
government’s housing mission
Builders are delighted with the credit-linked subsidy
scheme, as it has acted as a catalyst in boosting the
demand for houses, especially in the small-ticket
segments. Moreover, the income-tax benefit for
affordable housing projects has pushed developers
to take a plunge into this segment, given that mid-
income or high-income house projects have been
seeing a slowdown.
On affordable housing developers, HDFC’s annual
report says, “While the demand for affordable
housing remained robust, there was a slowdown
in sales of high-end luxury apartments in certain
pockets of the country. However, with the boost
given to affordable housing, more developers
are recognising the benefits of increasing supply
in this segment – where the real demand lies.
Affordable housing projects typically work on lower
margins, but higher volumes; sales tend to be
swift in this segment. With many developers not
keen on holding large stocks of unsold inventories,
the affordable housing space has become more
attractive.”
Financiers are also optimistic about the demand
for home loans in the affordable segment. As per
Mr Sudhin Chokshey, Managing Director of GRUH
Finance, “Many budgetary announcements aimed
at the affordable housing sector, and particularly the
infrastructure status for developers operating in this
space, are likely to improve the supply. The credit-
linked subsidy scheme is likely to push up demand.”
According to Mr Chokshey, CLSS announced for
MIG-segment families in the income segment of up
to Rs 1.8mn for a one-year period up to December
2017 is debatable as this segment do not require
interest subsidy. “What they require is better
supply,” he concludes.
In its annual report, Dewan Housing Finance says,
“For LIG, an affordable house would cost (on the
higher side) Rs 2.5mn, approximately five-times
the annual gross income of the LIG income group
– making it, in fact, not very affordable. This would
result in rising dependence on either subsidies or
government construction as a means of bridging the
ever-increasing affordable housing gap.”
As per the KPMG – NAREDCO report on affordable
housing – “A thrust on encouraging private sector
participation in affordable housing, traditionally
the domain of the government, could provide
the answer to India’s urban housing predicament.
However, as things stand, affordable housing
remains a challenging proposition for developers.
Issues continue to persist in terms of land availability
and pricing, the project approval processes, and
other areas, which make low-cost housing projects
uneconomical for private developers. Making
affordable housing work in India necessitates the
active involvement of all stakeholders concerned.
Radical thinking on the part of the government
can provide a much-needed fillip to affordable
housing development in the country. Steps such as
establishment of a single window clearance system,
formulation of innovative micro mortgage lending
models and tax subsidies would encourage private
sector involvement. The developers, on their part,
need to adopt innovative and low-cost technologies,
which could enable them to deliver affordable
houses quickly and cost-effectively.”

23GROUND VIEW GROUND VIEW 1 - 31 July 2017 1 - 31 July 2017 22
FINANCIER’S PREDICAMENT
Rising competitive intensity – good/bad?
The Lehman crisis is still too fresh to be ignored
Although financiers are optimistic about the government’s
efforts in affordable housing finance, they are equally
concerned about the rising competition in the space. Gruh
Housing Finance, in its FY17 annual report mentions that –
“The MCLR-linked lending rates offered by banks resulted
in a price war in the market and overall lending rates have
come down substantially. The effective rate of interest
for customers is less than 3%, an all-time low considering
interest subsidy and tax sops. However, this is likely to
impact the interest spreads for many players, particularly
housing finance companies who are intermediaries and not
direct beneficiaries of excess liquidity. While the industry
continues to grow at around 16%, albeit at a rate lower than
the previous year, the poor offtake in credit has compelled
lenders to resort to loan takeovers, which are expected to
constitute 20-30% of the incremental disbursements”.
New entrants in affordable lending need best practices
One financier (who did not wish to be named) said that
lending practices of some of the players were too aggressive.
These players factor the credit-linked subsidy component
into their calculation of loan-to-value (LTV) ratio, which means
that in case subsidy is not approved, LTVs can actually end by
being more than 100%! Direct selling agents in Mumbai and
Gujarat revealed that new entrants in affordable housing are
dishing out huge referral fees – ranging from 1.0%-1.5% of
the amount disbursed.
The customer profile in affordable segment is very
vulnerable, characterised by erratic cash flow. Collection
efficiency is low and cases of cheque bouncing are as high
as 15%. Hence, operating expense in this segment is bound
to be high compared with the mid-income or high-income
segments. The dynamics of affordable housing are different
from the mid-income/high-income housing segments. GV
team’s field visit and discussion with various affordable
builders and financiers including Xrbia, Karrm Infrastructure,
DBS Infra, Nila Infra, Gruh Finance, LIC HF, HDFC, and
Aspire Home Finance threw some light on key features of the
affordable housing finance segment:
• Cost of customer acquisition is high because of lower
ticket sizes. It can range between 1% to 1.5% of the loan
size.
• Cancellation rate after property booking is generally
high. Given erratic cash flow, unbudgeted expenses
could provoke the buyer to cancel the booking.
• Pre-EMI (equated monthly instalment) amount is a key in
booking affordable flats. Many prospective buyers fail to
rustle up the booking amount (or pre-EMI amount) and
have to drop out of buying the property. It is generally
believed that faster execution of projects will bring down
costs and are hence beneficial to buyers, but some of
the builders believe that in the affordable housing, very
fast execution may not work as buyers need time to
accumulate booking amounts. In most cases, the booking
Lending practices of some of the affordable housing players are very aggressive
Customer profile in affordable lending is characterised by erratic cash flow, economic vulnerability
Lending in affordable segment characterised by low collection efficiency, high instances of cheque bouncing, and higher operating expense vs. mid-income or high-income segments

23GROUND VIEW GROUND VIEW 1 - 31 July 2017 1 - 31 July 2017 22
amount is also collected in instalments.
• Due to their poor collection efficiency, servicing costs of
affordable housing loans are high vs. mid-income housing
loans while operating cost per annum works out to 1% of
the loan amount.
• The industry does not have proper history of credit risk
involved in the segment. Hence, the adequate pricing of
loans is very important.
• The target customers are not well versed with the
concept of interest rates. What matters to them is the EMI
(equal monthly instalments). These customers are more
comfortable with a structure that suits their income flow.
Housing companies have mushroomed in the last two
years
The challenging dynamics of affordable housing finance
(high acquisition cost, high operating expenses, and risk
of higher credit costs) warrants adequate pricing, but the
sudden rise in the number of housing-finance companies is
making competition unhealthy. Until 2015, the growth in the
number of housing-finance companies was steady (about 10
players added in five years) and totalled 64, but this number
increased significantly to 85 in 2017. Industry players view
this sudden rise as detrimental. The policy push towards
housing has created an enabling environment, which has
attracted many new players into this space. These players
are often backed by private-equity investments, which have
increased manifold into the BFSI sector in the past few years
(almost US$ 4bn per annum).
Some undesirable practices have crept in
Some of the housing-finance players are resorting to either
unreasonable pricing or going overboard in terms of loan-
to-value ratio (LTV). Given heightened competition, at times,
the referral fee is high and loan takeover has become a more
prevalent practice. GV tried to understand the cost dynamics
in the affordable segment with ticket sizes of Rs 1-2mn. In
order to maintain internal rate of return (IRR) above the cost
of fund, the minimum spread required is between 2.5-3.0%,
factoring gross non-performing asset (GNPA) of ~3% and
operating cost of 1%. In case of a rise in GNPA beyond 3%,
the spread of 2.5-3.0% may not be able to generate an IRR
that would cover the cost of funds.
Credit and operating costs need to be adequately priced
for long-term healthy viability
The interest rate charged to customers in the segment varies
widely between 8.6% and 13%. While a salaried person with
a reputed organisation would be charged 8.6%, a person
without any income proof could be charged as high as 13%.
Are these interest rates unreasonably high or does the risk
involved warrant them? Before finding an answer, here are
the perspectives of various stakeholders (policy makers,
lenders, and borrowers).
Policy makers are in favour of formal loans to lower-
income groups at competitive rates
Making loans available to the affordable segment at a
reasonable cost is the foremost agenda of policy makers.
In order to ensure this, they would always like to make the
industry competitive by allowing more players. This has been
playing out in the housing-finance industry in the last few
years – the numbers of players have increased to 85 from 64.
Borrower’s delight
Borrowers will always prefer easy availability of credit at low
cost. Recently, more financiers have positioned themselves
in the affordable segment, given higher competition in the
mid-income salaried segments. The flow of credit into the
Many prospective buyers of affordable housing fail to come up with the booking amount
Total
2017 85
2015 64
2014 58
2013 56
2012 54
2011 53
Table 9: Number of HFCs
USD BN BFSI India (Total)
CY12 0.9 10.2
CY13 1.2 11.8
CY14 1.9 15.2
CY15 4.0 22.9
CY16 3.6 16.8
Table 10: Private equity deals in India
Source: Bain capital
Source: NHB

25GROUND VIEW GROUND VIEW 1 - 31 July 2017 1 - 31 July 2017 24
affordable segment has improved, with ticket sizes at Rs
1-2mn; there are encouraging flows of credit in the Rs 0.5-
1mn ticket size as well.
Financier’s predicament
For housing-finance companies in the affordable segment to
flourish in the long run, it is very important that credit costs
and other operating costs are adequately priced, so that in
a downturn, lenders have enough cushion to absorb losses
without stopping the flow of credit to the segment, which
actually magnifies the problem and derails the economy.
The experience of the banking industry after the Lehman
crisis has necessitated the Basel committee to mandate a
counter-cyclical provision buffer, so that in a downturn, credit
flow does not stop for want of capital. Though competition is
necessary, unhealthy competition is dangerous for long-term
growth. Some practices – such as high LTVs and predatory
pricing – do not adequately factor the risk involved in the
segment, especially as this segment does not have a credit
history.
For housing-finance co. in the affordable segment to flourish in the long run, it is very important that credit costs and other operating costs are adequately priced
1 Aadhar Housing Fin. Pvt. Ltd.. 29 Habitat Micro Build India Housing Fin. Co. Pvt. Ltd. 57 Muthoot Homefin (India) Ltd.
2 Aavas Financiers Ltd. 30 Hinduja Housing Fin. Ltd. 58 Muthoot Housing Fin. Co. Ltd..
3 Aditya Birla Housing Fin. Ltd. 31 Home First Fin. Co. India Pvt. Ltd.. 59 National Trust Housing Fin. Ltd.
4 Akme Star Housing Fin. Ltd. 32 Homeshree Housing Fin. Ltd. 60 Navarathna Housing Fin. Ltd.
5 Altum Credo Home Fin. Pvt. Ltd. 33 Housing and Urban Development Corp. Ltd. 61 New Habitat Housing Fin. and Development Ltd.
6 Anand Housing Fin. Pvt. Ltd. 34 Housing Development Fin. Corp. Ltd. 62 Nivara Home Fin. Ltd.
7 Aptus Value Housing Fin. India Ltd.. 35 ICICI Home Fin. Co. Ltd. 63 North East Region Housing Fin. Co. Ltd.
8 ART Affordable Housing Fin. (India) Ltd. 36 IKF Housing Fin. Pvt. Ltd. 64 Orange City Housing Fin. Ltd..
9 Aryarth Housing Fin. Ltd. 37 Ind Bank Housing Ltd 65 Panthoibi Housing Fin. Co. Ltd.
10 Aspire Home Fin. Corp. Ltd. 38 India Home Loan Ltd. 66 PNB Housing Fin. Ltd.
11 Aviom India Housing Fin. Pvt. Ltd. 39 India Infoline Housing Fin. Ltd. (IIHFL) 67 Prosper Housing Fin. Ltd.
12 Bajaj Housing Fin. Ltd. 40 India Shelter Fin. Corp. Ltd. 68 Reliance Home Fin. Ltd.
13 Bee Secure Home Fin. Pvt. Ltd. 41 Indiabulls Housing Fin. Ltd. 69 Religare Housing Development Fin. Corp. Ltd.
14 Can Fin Homes Ltd. 42 IndoStar Home Fin. Pvt. Ltd. 70 REPCO Home Fin. Ltd.
15 Capital First Home Fin. Ltd. 43 Khush Housing Fin. Pvt. Ltd. 71 Rose Valley Housing Development Fin. Corp. Ltd..
16 Capri Global Housing Fin. Ltd. 44 KIFS Housing Fin. Pvt. Ltd. 72 SEWA Grih Rin Ltd.
17 Cent Bank Home Fin. Ltd. 45 L&T Housing Fin. Ltd. 73 Shriram Housing Fin. Ltd.
18 Centrum Housing Fin. Ltd. 46 LIC Housing Fin. Ltd. 74 Shubham Housing Development Fin. Co. Ltd.
19 Dewan Housing Fin. Corp. Ltd. 47 Lodha Housing Fin. Pvt. Ltd. 75 SRG Housing Fin. Ltd.
20 DHFL Vysya Housing Fin. Ltd. 48 Magma Housing Fin. 76 Sundaram BNP Paribas Home Fin. Ltd.
21 DMI Housing Fin. Pvt. Ltd. 49 Mahindra Rural Housing Fin. Ltd 77 Supreme Housing Fin. Ltd.
22 Edelweiss Housing Fin. Ltd.. 50 Mamta Housing Fin. Co. Pvt. Ltd. 78 Swagat Housing Fin. Co. Ltd.
23 Essel Fin. Home Loans Ltd. 51 Manappuram Home Fin. Pvt. Ltd. 79 Swarna Pragati Housing Micro Fin. Pvt. Ltd..
24 Fasttrack Housing Fin. Ltd. 52 Manibhavnam Home Fin. India Pvt. Ltd. 80 Tata Capital Housing Fin. Ltd.(TCHFL)
25 Five-Star Housing Fin. Pvt. Ltd. 53 Manipal Housing Fin. Syndicate Ltd. 81 Ummeed Housing Fin. Pvt. Ltd.
26 Fullerton India Home Fin. Co. Ltd. 54 MAS Rural Housing and Mortgage Fin. Ltd. 82 Vastu Housing Fin. Corp. Ltd.
27 GIC Housing Fin. Ltd. 55 Mentor Home Loans India Ltd. 83 Vishwakriya Housing Fin. Ltd.
28 GRUH Fin. Ltd. 56 Micro Housing Fin. Corp. Ltd. (MHFCL) 84 VIVA Home Fin. Ltd.
85 West End Housing Fin. Ltd.
Housing Finance Companies
Sour
ce: N
HB

25GROUND VIEW GROUND VIEW 1 - 31 July 2017 1 - 31 July 2017 24
GDP MULTIPLIER
A tool to boost the economy
As per India Ratings’ estimates, the housing-for-all scheme
has the potential to push up India’s economy by 3.5% by
2022, with sectors supplying crucial inputs to the construction
industry being the biggest beneficiaries. Sectors such as
cement, iron, and steel – crucial inputs in construction – are
likely to be the biggest beneficiaries of the HFA programme.
In its study on the impact of housing on India’s GDP, National
Council of Applied Economic Research had highlighted the
following findings:
• Residential construction (housing sector) accounts for
(1) 1.24% of the total output of the economy (total
construction sector is 11.39%). (2) 1% of GDP (total
construction sector is 8.2%), (3) 6.86% of employment
(total construction sector is 11.52%).
• Housing is the fourth-largest employment-generating
sector in India.
• 99.41% of jobs in the housing sector are informal.
• Its labour-to-output ratio, i.e., the number of persons
employed to produce 100,000 units of output, is 2.34, the
highest among all sectors.
• The type-1 output multiplier for the housing sector is 2.33
and type-2 is 5.11, i.e., an increase of one unit in the final
demand for housing translates into induced cumulative
revenues of 5.11 units in the economy.
• For every Rs 100,000 invested in the housing sector, 2.69
new jobs (2.65 informal and 0.4 formal) are created in
the economy. With induced effect, the number of jobs
created would be 4.06 (3.95 informal and 0.11 formal).
• For every investment in the housing sector, household
income increases by Rs. 0.41. With induced effect, this is
estimated to be Rs. 0.76.
• For every unit of housing created, household income
increases by 0.41 units. With induced effect, this is
estimated to be 0.76 units.
• Type-1 income multiplier for housing sector is 1.54 and
type-2 is 2.84. This would mean that a unit of increase
in the final expenditure in this sector would generate
additional income as high as 3 times the income
generated within the housing sector itself.
• Every additional rupee invested in the sector will add
Rs 1.54 to the GDP, and with household expenditure
considered, it will add Rs 2.84.
• For every rupee invested in creating housing, Rs 0.12 is
collected as indirect taxes.
The impact of housing is visible in other segments too.
GV tried to look at the beneficiaries of the housing boom
in other sectors. Cement is a direct play in housing.
Developers use portable grade-53 cement in construction
and beneficiaries are branded cement players, as this is
not a fragmented industry. However, the benefits can vary
from area to area, depending on the shortfall. Out of the
total short-fall calculated by the TG-12 group, Uttar Pradesh
constitutes the largest at 3.1mn units. With the centre and
state government aligning with each other, major investment
can flow towards housing in Uttar Pradesh, which until now
was absent. Hence, north-based cement players could turn
out to be key beneficiaries.
In affordable housing, other inputs such as tiles, ceramics,
paints, wire & cable, and PVC pipes are dominated by
unbranded players due to prevalent cost benefits. On the
services side, lenders make term and property insurance
mandatory (for homes loan) in order to protect their
exposure. Hence, penetration of financial services should see
a significant jump in the next five years.
The housing-for-all scheme has the potential to push up India’s economy by 3.5% by 2022, with sectors supplying crucial inputs to the construction industry being the biggest beneficiaries

27GROUND VIEW GROUND VIEW 1 - 31 July 2017 1 - 31 July 2017 26
Global economic activity is
picking up with a long-awaited
cyclical recovery in investment,
manufacturing, and trade.
According to IMF, world growth is likely to
rise to 3.5% in 2017 and 3.6% in 2018 from
3.1% in 2016. India is also seeing a similar
trend, but challenges remain, considering
that private investment is absent. GST roll
out can be disruptive in the short term.
To add to India’s challenges is rising social
inequality, which is a bigger cause for worry
among policy makers.
Housing, especially affordable housing,
can address some of these challenges. It
not only has a multiplier impact on GDP,
but addresses a social cause by reducing
inequality. Every additional rupee invested
in the housing sector will add Rs 1.54 to
the GDP, and with household expenditure
considered, it would add Rs 2.84. The
maximum housing shortfall is in the
economically weaker section and low-income
group. These segments utilise 30-40% of
their household income on rent, leaving
them with a small portion of savings. The
government tries to act as an enabler
to encourage home-ownership in these
segments, which not only addresses a social
cause, but also earns political goodwill.
As an enabler, the government is trying to
raise the affordability of the borrower by
providing subsidy. The sudden improvement
in affordability has translated into a surge in
demand for affordable houses. Though the
demand was always present, what lacked
was supply. The policy has tried to address
this through policy and fiscal benefits to
builders. Developers have begun flocking
into the affordable space because of
untapped demand, policy and fiscal benefits,
and lack of demand in normal housing.
Surge in demand for houses has created
an opportunity for financiers. The overall
housing-finance market has expanded due
to increased affordability in the EWS and
LIG segments; at the same time, the number
of housing finance players in the system
have also increased. This sudden increase
has made rates competitive. However, some
of their practices are not healthy for the
sector. In order to ensure continued flow to
affordable housing, lending practices need
to be healthy enough for lenders to make
positive IRRs.
Thrust on affordable housing is the need
of the hour. It can provide a thrust to the
economy by way of capital investment to
the tune of ~Rs 1.00-1.25tn pa incrementally,
generate 27-34mn jobs, and have a direct
and indirect impact on other sectors –
translating into ~1.5% of GDP.
CONCLUSION

27GROUND VIEW GROUND VIEW 1 - 31 July 2017 1 - 31 July 2017 26
PhillipCapital’s Oil & Gas analyst, Sabri Hazarika, caught up with LNG veteran Mr R K Garg who recently superannuated from Petronet LNG Ltd as Director Finance, after serving 16 years. He shared his memorable experiences as a core part of India’s LNG revolution, and talked about what the future could hold for the company and the sector.
Living the Indian LNG revolution An interview with Mr R K Garg

29GROUND VIEW GROUND VIEW 1 - 31 July 2017 1 - 31 July 2017 28
Q. Having worked in Steel Authority of India for almost
two decades, what prompted you to consider Petronet
LNG, which was totally uncharted territory for you and
almost everyone involved back then?
A: It is true that compared to a well-established entity such
as SAIL, Petronet would have been viewed as a start-up
back then, in an industry that our country by and large had
no experience in. To be honest, I applied without too much
deliberation, and was not very sure about the future. Many
people told me not to risk it, but I sought the opinions of
seniors and industry veterans and received solid advice
from the first chief of Petronet, Mr Suresh Mathur, who told
me about Petronet’s vision of becoming a leader in the
promising gas industry. Since I was a finance and commercial
person, technology was not an issue. Petronet was backed by
strong oil and gas PSUs and the role was a much bigger one
than what I was playing in an already large company, SAIL –
therefore, I decided to give it a go.
Q. Can you tell us what challenges Petronet faced and
how you were able to overcome them in the initial years?
A: Petronet was a totally new venture – so whatever we
were doing was for the first time in our country. There were
the usual challenges of signing gas-sales agreements with
RasGas, off-take agreements with customers, and moving
ahead with the Dahej project effectively. Imported LNG
cost was almost double domestic APM gas back then, so
there was a concern whether it could be marketed in India
at all. Not only was the ability to efficiently operate an LNG
terminal not a given, project financing was also impacted
by issues at Enron who was developing the Dabhol LNG
terminal. In fact, promoters were not willing to guarantee
the funding. We were not able to finalise the equity too, as
it was clear that Petronet would be a private entity and we
were not able to get other stakeholders quickly. However,
there was a strong desire to excel under these circumstances.
Promoters, authorities, and other stakeholders provided a lot
of support. We were able to rope in ADB financing, thanks to
the pro-activeness of our then Director Finance, Mr Prosad
Dasgupta, who later became the MD. GDF had also bought
10% stake in the company. Hence, one by one, we were able
to overcome the many hurdles.
Q. Any particular moment or instance during that time,
which really tested you and the company?
A: There were many major challenges, but an interesting
one, I want to mention was about equity funding. We had
a nominal share capital of Rs 3,600 which represented 60%
stake of the promoters and GDF, while the remaining 40%
was allotted in the name of four promoter group employees.
When the Companies Act was amended in 2002 with a
minimum Rs 5 lakhs (Rs 500,000) share capital, we could not
take more than Rs 3 lakhs from the promoters and GDF, as
that could make Petronet a PSU. So, their remaining amount
was share money pending allotment. We still had to tie up
Rs 2 lakhs. Ultimately, five senior Petronet employees were
asked to contribute Rs 40,000 each, which we agreed to,
despite being unsure of the company’s future at the time.
Q. When did the company move on to a stronger footing
in terms of project financing and equity capital?
A: We were able to tie up 65% of equity funding from the
promoters, GDF and ADB but for the remaining 35% we
decided we would go for an IPO. While the IPO posed its
own challenges - merchant bankers not giving it more than
Rs 12 a share versus our estimate of Rs 15; when it was
launched, it received an overwhelming response with more
than 7 lakh (700,000) investors subscribing and that too at Rs
15 per share. By that time, we were also able to tie up project
financing fully besides signing off-take agreements with
our promoters cum off-takers. The Dahej terminal was also
getting ready. So by 2004, we had things falling into place.
Q. You mentioned LNG was a new concept and much
more costly than domestic gas at the time. What made
customers opt for it?
A: The boost actually came from customers using liquid
fuels, as crude oil prices started rising from 2004-05. LNG
became increasingly economical due to the cap-and-floor
pricing mechanism and customers started coming in.
Natural gas is an addictive fuel – once you get the benefits
of low maintenance, uninterrupted supply, and cleaner
surroundings, it is difficult to go back to liquid or solid fuels,
unless economics turn out to be highly unfavourable. In fact,
in 2005-06 itself we discussed expanding the Dahej terminal.
Q. Petronet has grown tremendously since its inception.
From a market share of under 10% in 2004-05, it current-
ly supplies over a third of India’s gas requirements. Prof-
its have risen almost secularly and the stock has delivered
a solid 30% CAGR in this period. What made it click?
A: I believe a major factor has been the lean structure and
management’s autonomy which led to fast decision making.
Despite having the petroleum secretary as the company’s
chairman, and large rival oil and gas PSUs as promoters,
there were no bureaucratic or procedural hurdles. We had

29GROUND VIEW GROUND VIEW 1 - 31 July 2017 1 - 31 July 2017 28
full independence. Petronet has only 450 employees even
now across Delhi, Dahej, and Kochi. Secondly, the company
consciously decided to lower its risk through contracts
management. That’s why there are back-to-back binding
agreements with suppliers and off-takers, with no price or
volume related risks. Our only focus was to run plants as
optimally as possible, and we were able to do this. Today,
Dahej is one of the largest re-gas terminals globally, with
probably the highest utilisation levels.
Another thing was the presence in Gujarat. During the
last decade, Gujarat has grown significantly in terms of
industrialisation and was moving towards a gas based
economy. Gujarat had very friendly policies coupled with
fast approval processes and limited labour issues. This led to
considerable growth in gas usage, which helped Petronet to
clock higher sales.
Q. When you started out, did you think you would reach
the heights that you did? As a finance person, did you
and your team have any goals on shareholder returns?
A: To be honest, no. As I mentioned, it was such a nascent
sector back then that Petronet’s very survival was in question.
We just moved ahead. In fact, we made a definite business
plan in a structured way only in 2010-11. Until 2010, it was
unchartered territory every day. In terms of financial goals,
too, there were no definite profitability targets. Our mandate
was to move the project forward and operate the terminal
optimally. In terms of returns, we targeted 16% equity IRR.
Q. As you said, Dahej is a global leader in terms of LNG
importing and regasification. However, the Kochi terminal
has suffered very low utilisation levels, even after almost
five years of commissioning. Was there a miscalculation
in terms of demand, or too much reliance on third-party
pipelines?
A: Kochi terminal was on the cards since 1999 when
Petronet started out. From the very beginning, Petronet
has targeted both northern and southern markets. In fact,
the company signed 7.5mn tonnes with RasGas back then,
out of which 2.5mn tonnes were to be imported into Kochi.
While discussions on the gas-demand scenario in the south
abounded, there was definitely a case for gas, especially
from the power sector. In Kerala, due to environmental
considerations, coal-based power was not supported. The
Kayamkulam plant, which was supposed to be one of Kochi
terminal’s anchor customers, was to run on gas. Even in terms
of pipelines there were no issues earlier. It was only later that
local issues emerged driven by socio-political considerations
and concerns about safety, especially after a major incident
took place in another pipeline in the region. Work on the
terminal and the pipeline had started simultaneously, and
was to be ready by year 2013. However, due to escalation
of tensions within the region, the pipeline could not be
completed on time.
Q. What is the current status of the pipeline and when do
you think Kochi will break even?
A: The Mangalore section of the pipeline is under active
progress and is likely to be ready by the end of 2018. I
believe that by that time, the terminal may clock almost
2mn tonnes of annual volumes, a level at which it is likely
to breakeven in terms of profit before tax as Kochi terminal
debts will also be repaid by then. Besides, discussions have
also started on the Bangalore section through Tamil Nadu.
Hence, there could be a positive outcome on that front too.
Kochi terminal is a strategic asset and Petronet remains fully
committed to it.
Q. You had a challenging time in 2015, when oil prices
crashed and your five-year pricing formula for RasGas
LNG made economics highly unfavourable, affecting your
volumes and profitability. Why was the pricing formula
changed at all, especially because it made Petronet and
other parties susceptible to such risks?
A: Earlier, oil prices had risen steeply to more than USD
100 a barrel and some estimates predicted even further
increases. We consciously decided to minimise such risks
and bring an element of stickiness into our pricing – the
reason we went for average pricing. Unfortunately, we, like
many other industry players, could not predict the collapse
of oil prices because of the shale-oil revolution, and had to
suffer high LNG prices for some time. However, our supplier
RasGas acknowledged our predicament and we were able
to negotiate changes to the formula so that it was more in
line with prevailing oil prices. The Indian government also
provided us with immense support.
Q. You have come a long way from being a start up to
becoming an important pillar of the Indian gas indus-
try. Where does Petronet go from here? What is on the
cards?
A: Presently, Petronet is looking at setting up LNG terminals
in neighbouring countries such as Bangladesh and Sri
Lanka, besides entering the LNG retail space in India – both
opportunities are under discussion. Petronet is planning to
market LNG as a retail fuel for trucks and other vehicles,
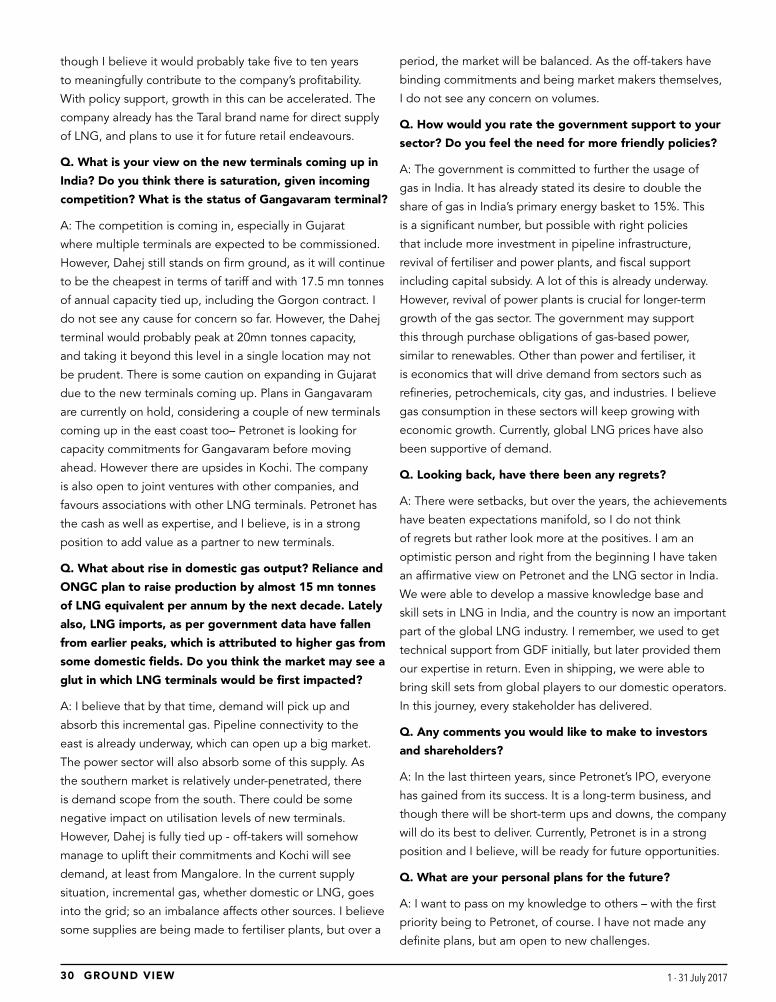
31GROUND VIEW GROUND VIEW 1 - 31 July 2017 1 - 31 July 2017 30
though I believe it would probably take five to ten years
to meaningfully contribute to the company’s profitability.
With policy support, growth in this can be accelerated. The
company already has the Taral brand name for direct supply
of LNG, and plans to use it for future retail endeavours.
Q. What is your view on the new terminals coming up in
India? Do you think there is saturation, given incoming
competition? What is the status of Gangavaram terminal?
A: The competition is coming in, especially in Gujarat
where multiple terminals are expected to be commissioned.
However, Dahej still stands on firm ground, as it will continue
to be the cheapest in terms of tariff and with 17.5 mn tonnes
of annual capacity tied up, including the Gorgon contract. I
do not see any cause for concern so far. However, the Dahej
terminal would probably peak at 20mn tonnes capacity,
and taking it beyond this level in a single location may not
be prudent. There is some caution on expanding in Gujarat
due to the new terminals coming up. Plans in Gangavaram
are currently on hold, considering a couple of new terminals
coming up in the east coast too– Petronet is looking for
capacity commitments for Gangavaram before moving
ahead. However there are upsides in Kochi. The company
is also open to joint ventures with other companies, and
favours associations with other LNG terminals. Petronet has
the cash as well as expertise, and I believe, is in a strong
position to add value as a partner to new terminals.
Q. What about rise in domestic gas output? Reliance and
ONGC plan to raise production by almost 15 mn tonnes
of LNG equivalent per annum by the next decade. Lately
also, LNG imports, as per government data have fallen
from earlier peaks, which is attributed to higher gas from
some domestic fields. Do you think the market may see a
glut in which LNG terminals would be first impacted?
A: I believe that by that time, demand will pick up and
absorb this incremental gas. Pipeline connectivity to the
east is already underway, which can open up a big market.
The power sector will also absorb some of this supply. As
the southern market is relatively under-penetrated, there
is demand scope from the south. There could be some
negative impact on utilisation levels of new terminals.
However, Dahej is fully tied up - off-takers will somehow
manage to uplift their commitments and Kochi will see
demand, at least from Mangalore. In the current supply
situation, incremental gas, whether domestic or LNG, goes
into the grid; so an imbalance affects other sources. I believe
some supplies are being made to fertiliser plants, but over a
period, the market will be balanced. As the off-takers have
binding commitments and being market makers themselves,
I do not see any concern on volumes.
Q. How would you rate the government support to your
sector? Do you feel the need for more friendly policies?
A: The government is committed to further the usage of
gas in India. It has already stated its desire to double the
share of gas in India’s primary energy basket to 15%. This
is a significant number, but possible with right policies
that include more investment in pipeline infrastructure,
revival of fertiliser and power plants, and fiscal support
including capital subsidy. A lot of this is already underway.
However, revival of power plants is crucial for longer-term
growth of the gas sector. The government may support
this through purchase obligations of gas-based power,
similar to renewables. Other than power and fertiliser, it
is economics that will drive demand from sectors such as
refineries, petrochemicals, city gas, and industries. I believe
gas consumption in these sectors will keep growing with
economic growth. Currently, global LNG prices have also
been supportive of demand.
Q. Looking back, have there been any regrets?
A: There were setbacks, but over the years, the achievements
have beaten expectations manifold, so I do not think
of regrets but rather look more at the positives. I am an
optimistic person and right from the beginning I have taken
an affirmative view on Petronet and the LNG sector in India.
We were able to develop a massive knowledge base and
skill sets in LNG in India, and the country is now an important
part of the global LNG industry. I remember, we used to get
technical support from GDF initially, but later provided them
our expertise in return. Even in shipping, we were able to
bring skill sets from global players to our domestic operators.
In this journey, every stakeholder has delivered.
Q. Any comments you would like to make to investors
and shareholders?
A: In the last thirteen years, since Petronet’s IPO, everyone
has gained from its success. It is a long-term business, and
though there will be short-term ups and downs, the company
will do its best to deliver. Currently, Petronet is in a strong
position and I believe, will be ready for future opportunities.
Q. What are your personal plans for the future?
A: I want to pass on my knowledge to others – with the first
priority being to Petronet, of course. I have not made any
definite plans, but am open to new challenges.

31GROUND VIEW GROUND VIEW 1 - 31 July 2017 1 - 31 July 2017 30
Indian Economy – Trend Indicators
Monthly Economic Indicators
Quarterly Economic Indicators
Growth Rates (%) May-16 Jun-16 Jul-16 Aug-16 Sep-16 Oct-16 Nov-16 Dec-16 Jan-17 Feb-17 Mar-17 Apr-17 May-17 Jun-17
IIP 8.0 8.9 5.2 4.9 5.7 4.9 5.7 2.6 3.8 1.9 3.8 2.8 1.7
PMI 50.7 51.7 51.8 52.6 52.1 54.4 52.3 49.6 50.4 50.7 52.5 52.5 51.6 50.9
Core sector 5.2 7.0 3.1 3.1 5.3 7.1 3.2 5.6 3.4 0.6 5.3 2.8 3.6
WPI -0.9 -0.1 0.6 1.1 1.4 1.3 1.8 2.1 4.3 5.5 5.1 3.9 2.1 0.9
CPI 5.8 5.8 6.1 5.0 4.4 4.2 3.6 3.4 3.2 3.7 3.8 3.0 2.2 1.0
Money Supply 10.1 10.4 10.4 10.3 12.1 10.9 8.5 6.2 6.4 6.5 7.3 6.2 7.0 7.4
Deposit 9.5 9.7 9.5 9.2 11.3 9.8 15.3 14.5 13.2 12.1 11.2 9.7 10.3 10.5
Credit 9.8 9.4 9.7 9.6 11.2 8.5 4.7 4.7 4.6 4.4 4.7 3.9 4.7 5.6
Exports -0.8 1.3 -6.8 -0.3 4.6 9.6 2.3 5.7 4.3 17.5 27.6 19.8 8.3 4.4Imports -13.2 -7.3 -19.0 -14.1 -2.5 8.1 10.4 0.5 10.7 21.8 45.3 49.1 33.1 19.0Trade deficit (USD Bn) -6.3 -8.1 -7.8 -7.7 -8.3 -10.2 -13.0 -10.4 -9.8 -8.9 -10.4 -13.2 -13.8 -13.0Net FDI (USD Bn) 1.4 3.3 3.6 4.4 4.6 2.4 4.5 2.7 3.8 1.1 0.6 1.8 3.4
FII (USD Bn) -1.6 -0.2 2.7 1.0 3.0 -1.8 -5.5 -4.0 -0.4 2.5 9.0 2.7 4.7
ECB (USD Bn) 1.3 1.1 1.2 3.2 2.5 1.8 0.5 2.8 1.8 2.2 3.3 1.7 1.1
Dollar-Rupee 67.3 67.5 67.0 67.0 66.6 66.8 68.4 67.9 67.9 66.7 64.9 64.2 64.5 64.6
FOREX Reserves (USD Bn) 360.2 360.8 365.5 366.8 372.0 367.2 365.3 360.3 361.6 362.8 370.0 372.7 378.8 386.5
NRI Deposits (USD Bn) 126.7 126.3 128.9 130.1 130.0 124.4 113.1 109.8 110.1 111.6 116.9 117.2 117.3
Balance of Payment (USD Bn) Q4FY15 Q1FY16 Q2FY16 Q3FY16 Q4FY16 Q1FY17 Q2FY17 Q3FY17 Q4FY17Exports 70.8 68.0 67.6 64.9 65.8 66.6 67.4 68.8 77.4Imports 102.5 102.2 104.7 98.9 90.6 90.5 93.1 102.0 107.1Trade deficit -31.7 -34.2 -37.2 -34.0 -24.8 -23.8 -25.6 -33.3 -29.7Net Invisibles 30.2 28.0 28.6 26.9 24.4 23.5 22.2 25.3 26.3CAD -1.5 -6.1 -8.6 -7.1 -0.3 -0.3 -3.4 -8.0 -3.5CAD (% of GDP) 0.3 1.2 1.7 1.3 0.1 0.0 0.0 1.4 0.6Capital Account 30.7 18.6 8.1 10.9 3.5 7.1 12.8 6.1 10.4BoP 30.1 11.4 -0.9 4.1 3.3 7.0 8.5 -1.2 7.3
GDP and its Components (YoY, %) Q4FY15 Q1FY16 Q2FY16 Q3FY16 Q4FY16 Q1FY17 Q2FY17 Q3FY17 Q4FY17Agriculture & allied activities -1.7 2.6 2.3 -2.1 1.5 2.5 4.1 6.9 5.2Industry 6.9 7.1 9.2 12.0 11.9 9.0 6.5 7.2 5.5Mining & Quarrying 10.1 11.2 12.2 11.7 10.5 -0.9 -1.3 1.9 6.4Manufacturing 6.6 8.5 9.3 13.2 12.7 10.7 7.7 8.2 5.3Electricity, Gas & Water Supply 4.4 2.5 5.7 4.0 7.6 10.3 5.1 7.4 6.1Services 8.3 8.3 9.0 9.0 9.4 8.2 7.4 6.4 5.7Construction 2.6 4.8 1.6 6.0 6.0 3.1 4.3 3.4 -3.7Trade, Hotel, Transport and Communications 13.1 10.6 8.3 10.1 12.8 8.9 7.7 8.3 6.5Finance, Insurance, Real Estate & Business Services 9.0 10.2 13.0 10.5 9.0 9.4 7.0 3.3 2.2Community, Social & Personal Services 4.1 6.3 7.2 7.5 6.7 8.6 9.5 10.3 17.0GDP at FC 6.2 7.8 8.2 7.3 8.7 7.6 6.8 6.7 5.6

33GROUND VIEW GROUND VIEW 1 - 31 July 2017 1 - 31 July 2017 32
Annual Economic Indicators and Forecasts Indicators Units FY9 FY10 FY11 FY12 FY13 FY14 FY15 FY16E FY17E FY18E
Real GDP/GVA growth % 6.7 8.6 8.9 6.7 6.0 5.6 7.1 7.9 6.6 7.0
Agriculture % 0.1 0.8 8.6 5.0 1.5 4.2 -0.2 0.7 4.9 6.5
Industry % 4.1 10.2 8.3 6.7 5.0 4.5 6.5 10.2 7.0 6.4
Services % 9.4 10.0 9.2 7.1 6.1 8.2 9.4 9.1 6.9 7.4
Real GDP Rs Bn 41587 45161 49185 52475 85992 90844 97190 104905 111854 119694
Real GDP US$ Bn 908 953 1079 1096 1694 1581 1589 1603 1667 1841
Nominal GDP Rs Bn 56301 64778 77841 87360 99466 112366 124451 136820 151837 167324
Nominal GDP US$ Bn 1229 1367 1707 1824 1828 1859 2035 2090 2264 2574
WPI (Average) % 8.1 3.8 9.6 8.7 7.4 6.0 2.0 -2.5 3.7 2.5-3
CPI (Average) 9.0 12.4 10.4 8.3 10.2 9.5 6.4 4.9 4.5 2.5-3
Money Supply % 20.5 19.2 16.2 15.8 13.6 13.5 12.0 10.3 7.3 9.5
CRR % 5.00 5.75 6.00 4.75 4.00 4.00 4.0 4.0 4.0 4.0
Repo rate % 5.00 5.00 6.75 8.50 7.50 8.00 7.50 6.75 6.25 5.75-6
Reverse repo rate % 3.50 3.50 5.75 7.50 6.50 7.00 6.50 5.75 5.75 5.5-5.75
Bank Deposit growth % 19.9 17.2 15.9 13.5 14.2 14.6 12.1 9.7 11.2 11.0
Bank Credit growth % 17.5 16.9 21.5 17.0 14.1 13.5 12.5 10.7 4.7 7.0
Centre Fiscal Deficit Rs Bn 3370 4140 3736 5160 5209 5245 5107 5328 5343 5465
Centre Fiscal Deficit % of GDP 6.0 6.4 4.8 5.7 5.2 4.6 4.1 3.9 3.5 3.2
State Fiscal Deficit % of GDP 2.4 2.9 2.1 1.9 2.0 2.2 2.6 3.6 3.0 3.5
Consolidted Fiscal Deficit % of GDP 8.4 9.3 6.9 7.6 6.9 7.1 6.6 7.5 6.5 6.7
Exports US$ Bn 189.0 182.4 251.1 309.8 306.6 318.6 316.7 266.4 280.1 296.9
YoY Growth % 13.7 -3.5 37.6 23.4 -1.0 3.9 -0.6 -15.9 5.2 6.0
Imports US$ Bn 308.5 300.6 381.1 499.5 502.2 466.2 460.9 396.4 392.6 443.6
YoY Growth % 19.7 -2.5 26.7 31.1 0.5 -7.2 -1.1 -14.0 -1.0 13.0
Trade Balance US$ Bn -119.5 -118.2 -129.9 -189.8 -195.6 -147.6 -144.2 -130.1 -112.4 -146.7
Net Invisibles US$ Bn 91.6 80.0 84.6 111.6 107.5 115.2 116.2 107.9 97.1 104.6
Current Account Deficit US$ Bn -27.9 -38.2 -45.3 -78.2 -88.2 -32.4 -27.9 -22.2 -15.3 -42.1
CAD (% of GDP) % -2.3 -2.8 -2.6 -4.2 -4.7 -1.7 -1.4 -1.1 -0.7 -1.6
Capital Account Balance US$ Bn 7.8 51.6 62.0 67.8 89.3 48.8 90.0 41.1 36.5 66.4
Dollar-Rupee (Average) 45.8 47.4 45.6 47.9 54.4 60.5 61.2 65.5 67.0 64.5
Source: RBI, CSO, CGA, Ministry of Agriculture, Ministry of commerce, Bloomberg, PhillipCapital India Research

33GROUND VIEW GROUND VIEW 1 - 31 July 2017 1 - 31 July 2017 32
Phill
ipC
apita
l Ind
ia C
over
age
Uni
vers
e: V
alua
tio
n Su
mm
ary
CMP
Mkt
Cap
Ne
t Sal
es (R
s mn)
EB
IDTA
(Rs
mn)
PAT (
Rs m
n)EP
S (R
s)
EPS
Grow
th (%
) P
/E (x
) P
/B (x
) EV
/EBI
TDA
(x)
ROE
(%)
ROCE
(%)
Nam
e of
com
pany
Sect
orRs
Rs b
nFY
17E
FY18
EFY
17E
FY18
EFY
17E
FY18
EFY
17E
FY18
EFY
17E
FY18
EFY
17E
FY18
EFY
17E
FY18
EFY
17E
FY18
EFY
17E
FY18
EFY
17E
FY18
E
Mah
indr
a CIE
Auto
mob
iles
249
9
4,15
0 5
1,21
3 6
5,54
9 5
,311
8
,761
1
,780
4
,435
6
1
2 7
.7
113
.0
45.
2 2
1.2
2.5
2
.7
20.
1 1
1.8
5.5
1
2.6
5.4
1
1.4
Asho
k Ley
land
Auto
mob
iles
84
238
,769
1
96,2
01
221
,827
2
2,02
5 2
4,09
1 1
5,73
9 1
3,48
8 6
5
4
1.6
-14.
3 1
5.2
17.
7 3
.9
3.3
1
1.1
9.8
2
5.7
18.
5 2
1.3
17.
6
Ceat
Ltd
Auto
mob
iles
1,6
91
68,
409
57,
810
69,
397
6,8
15
8,6
23
3,6
18
4,8
02
89
118
-2
1.0
32.
7 1
9.0
14.
3 2
.9
2.5
1
0.5
8.2
1
5.3
17.
3 1
5.2
17.
2
Apol
lo Ty
res
Auto
mob
iles
233
1
18,7
81
133
,058
1
49,7
45
19,
925
21,
437
10,
308
11,
156
20
22
-1.4
8
.2
11.
5 1
0.6
1.7
1
.5
6.9
6
.3
14.
5 1
3.7
10.
9 1
0.5
Esco
rts Lt
dAu
tom
obile
s 6
12
75,
066
41,
021
46,
888
3,2
09
4,6
39
2,1
62
3,1
81
18
27
108
.1
47.
1 3
3.8
23.
0 3
.6
3.1
2
3.1
15.
4 1
0.5
13.
5 9
.0
12.
4
Baja
j Aut
oAu
tom
obile
s 2
,893
8
37,1
39
213
,736
2
40,8
76
44,
224
46,
878
38,
277
41,
416
132
1
43
4.8
8
.2
21.
9 2
0.2
4.9
4
.3
18.
9 1
7.7
22.
5 2
1.3
24.
7 2
1.5
Hero
Mot
oCor
pAu
tom
obile
s 3
,298
6
58,6
70
281
,695
3
21,7
11
46,
348
55,
656
33,
771
40,
793
169
2
04
7.8
2
0.8
19.
5 1
6.1
6.5
5
.4
14.
3 1
1.9
33.
4 3
3.2
33.
7 3
3.8
Tata
Mot
ors
Auto
mob
iles
432
1
,380
,797
2
,678
,907
3
,078
,324
3
31,7
59
434
,799
8
0,11
2 1
36,2
32
25
42
-27.
5 7
0.1
17.
3 1
0.2
1.6
1
.4
5.3
4
.1
9.2
1
3.7
4.7
7
.3
Mar
uti S
uzuk
iAu
tom
obile
s 6
,688
2
,020
,251
6
65,3
40
753
,298
1
06,1
88
118
,994
7
3,46
9 8
2,49
6 2
43
273
6
0.7
12.
3 2
7.5
24.
5 6
.1
5.1
1
8.8
16.
7 2
2.3
20.
8 2
2.6
21.
2
Mah
indr
a & M
ahin
dra
Auto
mob
iles
1,3
71
851
,238
4
08,7
12
454
,622
5
4,76
7 6
1,82
9 3
4,26
0 3
9,16
9 5
8 6
6 4
.1
14.
3 2
3.7
20.
7 3
.3
3.0
1
5.6
13.
7 1
3.8
14.
2 1
1.9
12.
6
Bhar
at Fo
rge
Auto
mob
iles
1,1
29
262
,755
7
1,42
5 8
1,20
4 1
3,46
4 1
6,44
3 6
,084
8
,369
2
6 3
6 -7
.1
37.
6 4
3.2
31.
4 6
.7
5.8
2
0.6
16.
7 1
5.4
18.
5 1
1.8
14.
8
Siem
ens
Capi
tal G
oods
1,3
81
514
,950
1
08,0
89
115
,924
9
,731
1
3,30
5 6
,056
8
,518
1
7 2
4 4
.6
40.
6 8
1.2
57.
7 7
.5
7.1
4
9.3
35.
7 9
.2
12.
2 3
8.2
9.8
ABB
Indi
aCa
pita
l Goo
ds 1
,321
3
33,1
31
86,
484
102
,531
7
,467
1
0,24
2 3
,583
5
,355
1
7 2
5 1
9.5
49.
5 7
8.1
52.
3 8
.5
7.8
4
3.8
31.
9 1
0.9
14.
9 9
.2
12.
8
Ther
max
Capi
tal G
oods
1,0
31
123
,327
4
4,83
1 4
9,04
6 4
,330
4
,871
2
,969
3
,310
2
5 2
8 5
.2
11.
5 4
1.4
37.
1 4
.8
4.4
2
8.3
24.
9 1
1.7
11.
9 1
2.1
12.
9
Engi
neer
s Ind
iaCa
pita
l Goo
ds 1
15
112
,941
1
4,48
6 1
6,91
8 3
,928
2
,898
3
,834
3
,153
6
5
4
1.2
-17.
8 2
0.2
24.
6 2
.8
2.7
2
2.9
29.
9 1
3.8
11.
1 1
2.9
12.
4
Inox
Win
dCa
pita
l Goo
ds 4
18
44,
794
46,
885
51,
662
7,0
25
7,7
65
4,1
91
4,5
78
19
21
-8.0
9
.2
22.
1 2
0.3
4.3
3
.7
7.5
6
.3
19.
3 1
8.2
14.
1 1
3.5
Cum
min
s Ind
iaCa
pita
l Goo
ds 9
55
295
,481
4
9,58
1 5
5,90
9 8
,018
9
,398
7
,346
8
,679
2
7 3
1 -2
.6
18.
1 3
6.0
30.
5 7
.1
6.5
3
7.0
31.
0 1
9.6
21.
2 1
8.9
20.
5
KEC
Inte
rnat
iona
lCa
pita
l Goo
ds 1
52
57,
331
85,
844
98,
643
8,1
79
9,2
79
3,0
85
3,8
71
12
15
82.
2 2
5.5
12.
7 1
0.1
2.5
2
.0
10.
4 8
.8
19.
4 2
0.1
9.1
1
0.5
Lars
en &
Toub
roCa
pita
l Goo
ds 1
,173
1
,636
,211
1
,100
,110
1
,236
,553
1
10,7
47
130
,855
5
9,19
8 6
7,90
2 6
3 7
3 4
2.8
14.
5 1
8.5
16.
1 2
.2
2.0
2
2.8
19.
7 1
1.8
12.
4 5
.4
5.5
VA Te
ch W
abag
Capi
tal G
oods
730
3
6,84
2 3
2,07
9 3
4,90
7 2
,966
3
,391
1
,445
1
,789
2
6 3
3 6
2.7
23.
8 2
7.5
22.
2 4
.0
3.5
1
2.6
10.
6 1
4.6
15.
8 7
.2
12.
4
Crom
pton
Gre
aves
Capi
tal G
oods
62
55,
154
57,
518
61,
916
4,7
02
5,3
58
1,8
27
1,7
99
3
3
-18.
6 -1
.6
21.
2 2
1.5
0.9
0
.9
12.
7 1
0.7
4.4
4
.4
3.6
3
.6
Volta
sCa
pita
l Goo
ds 3
07
143
,769
6
0,32
8 7
1,12
9 5
,791
7
,396
5
,079
5
,811
1
5 1
8 4
1.8
14.
4 2
0.0
17.
5 3
.1
2.7
2
4.5
19.
2 1
5.4
15.
5 1
6.3
16.
2
BHEL
Capi
tal G
oods
279
4
35,5
50
282
,222
3
15,4
16
17,
749
21,
346
10,
294
14,
977
4
6
-245
.1
45.
5 6
6.3
45.
6 2
.1
2.0
1
8.7
15.
3 3
.2
4.5
2
.9
3.6
CG P
ower
& In
d Ca
pita
l Goo
ds 6
2 5
5,15
4 5
7,51
8 6
1,91
6 4
,702
5
,358
1
,827
1
,799
3
3
-1
8.6
-1.6
2
1.2
21.
5 0
.9
0.9
1
2.7
10.
7 4
.4
4.4
3
.6
3.6
GE T&
DCa
pita
l Goo
ds 5
64
92,
945
48,
848
54,
441
3,4
74
4,4
19
1,8
80
2,4
92
7
10
104
.7
32.
5 7
6.8
58.
0 1
2.5
10.
9 2
7.9
21.
8 1
6.3
18.
8 1
8.0
20.
4

35GROUND VIEW GROUND VIEW 1 - 31 July 2017 1 - 31 July 2017 34
Phill
ipC
apita
l Ind
ia C
over
age
Uni
vers
e: V
alua
tio
n Su
mm
ary
CMP
Mkt
Cap
Ne
t Sal
es (R
s mn)
EB
IDTA
(Rs
mn)
PAT (
Rs m
n)EP
S (R
s)
EPS
Grow
th (%
) P
/E (x
) P
/B (x
) EV
/EBI
TDA
(x)
ROE
(%)
ROCE
(%)
Nam
e of
com
pany
Sect
orRs
Rs b
nFY
17E
FY18
EFY
17E
FY18
EFY
17E
FY18
EFY
17E
FY18
EFY
17E
FY18
EFY
17E
FY18
EFY
17E
FY18
EFY
17E
FY18
EFY
17E
FY18
EFY
17E
FY18
E
JK La
kshm
i Cem
ent
Cem
ent
502
5
9,10
6 2
9,21
6 3
5,75
8 3
,697
5
,350
8
08
1,5
42
7
13
246
.5
90.
9 7
3.2
38.
3 4
.1
3.8
2
1.1
14.
1 5
.7
10.
0 7
.0
8.6
JK C
emen
tCe
men
t 1
,032
7
2,14
4 3
9,69
4 4
3,85
4 6
,741
8
,331
2
,272
3
,012
3
2 4
3 2
58.4
3
2.6
31.
8 2
4.0
4.0
3
.6
14.
4 1
1.4
12.
7 1
5.1
7.9
9
.1
Dalm
ia B
hara
t Ltd
Cem
ent
2,3
85
212
,183
7
4,04
4 8
8,43
7 1
9,01
9 2
4,97
6 3
,448
6
,608
3
9 7
4 8
0.5
91.
6 6
1.4
32.
1 5
.1
4.4
1
4.1
10.
3 8
.2
13.
7 7
.5
9.4
Heid
elbe
rgCe
men
t Ce
men
t 1
34
30,
457
18,
244
19,
946
2,4
54
3,1
82
676
1
,164
3
5
7
4.9
72.
2 4
5.0
26.
2 3
.2
2.9
1
5.1
11.
0 7
.1
10.
9 6
.6
8.6
OCL I
ndia
Cem
ent
1,1
09
63,
111
29,
529
33,
165
5,8
57
6,5
92
3,2
24
3,7
21
57
65
57.
5 1
5.4
19.
6 1
7.0
3.8
3
.3
10.
3 8
.6
19.
5 1
9.3
17.
5 2
0.6
Indi
a Cem
ent
Cem
ent
208
6
3,98
5 5
8,63
7 6
5,87
7 8
,910
1
1,05
3 1
,631
3
,822
5
1
2 1
8.7
134
.3
39.
4 1
6.8
1.2
1
.2
10.
6 8
.3
3.2
7
.1
4.4
6
.5
Ultra
tech
Cem
ent
Cem
ent
4,3
76
1,2
01,3
29
253
,749
3
38,0
01
52,
124
71,
792
27,
149
32,
513
99
118
1
8.7
19.
8 4
4.2
36.
9 4
.9
4.4
2
2.8
19.
1 1
1.1
11.
9 9
.2
9.2
Man
gala
m C
emen
tCe
men
t 3
70
9,8
75
9,0
09
9,9
22
1,1
37
1,6
28
344
6
82
13
26
-267
.9
98.
6 2
8.7
14.
5 1
.8
1.7
1
2.6
8.3
6
.4
11.
7 6
.3
8.9
Ambu
ja C
emen
tCe
men
t 2
57
510
,410
2
00,9
40
239
,971
2
8,69
3 3
8,07
8 1
1,50
9 1
7,40
0 7
9
2
5.0
34.
7 3
9.5
29.
3 2
.3
2.5
1
6.2
12.
1 5
.9
8.6
7
.9
8.0
ACC
Cem
ent
1,6
93
317
,999
1
09,4
56
130
,763
1
1,98
8 1
6,16
0 6
,430
8
,524
3
4 4
5 -1
4.5
32.
6 4
9.5
37.
3 3
.7
3.6
2
5.0
18.
6 7
.4
9.5
7
.0
8.3
Shre
e Ce
men
tCe
men
t
684
,961
8
4,29
2 1
00,9
42
23,
672
29,
401
13,
367
15,
868
384
4
55
120
.4
18.
7 5
1.2
43.
2 9
.9
8.4
2
8.2
22.
4 1
9.2
19.
5 1
8.0
19.
4
KEI I
ndus
tries
ELEC
TRIC
ALS
231
1
8,00
2 2
6,31
2 3
0,11
3 2
,743
3
,238
2
,463
2
,930
3
2 3
8 1
3.5
19.
0 7
.3
6.1
3
.8
3.1
9
.0
7.5
5
2.0
50.
0 2
3.7
23.
8
Finol
ex C
able
s Ltd
ELEC
TRIC
ALS
527
8
0,52
3 5
,154
6
,278
6
57
861
2
81
400
8
1
2 -1
2.3
42.
6 6
4.3
45.
1 7
.9
6.9
1
24.2
9
5.0
12.
2 1
5.3
12.
9 1
4.3
VGua
rd In
dustr
ies L
tdEL
ECTR
ICAL
S 2
12
90,
027
5,1
54
6,2
78
657
8
61
281
4
00
8
12
-12.
3 4
2.6
25.
9 1
8.2
3.2
2
.8
138
.7
106
.0
12.
2 1
5.3
12.
9 1
4.3
Baja
j Ele
ctrica
ls Lt
dEL
ECTR
ICAL
S 3
54
35,
862
46,
946
50,
568
2,6
05
2,9
89
1,0
69
1,2
84
11
13
11.
8 2
0.0
33.
4 2
7.8
4.2
3
.8
15.
7 1
3.5
12.
7 1
3.5
10.
6 1
1.1
Have
lls In
dia L
tdEL
ECTR
ICAL
S 4
98
311
,053
5
9,50
6 8
6,48
7 6
,395
1
0,56
4 4
,122
6
,382
7
1
0 -1
9.6
54.
8 7
5.4
48.
7 9
.5
8.6
4
5.9
29.
7 1
2.6
17.
7 1
2.2
16.
5
Shrir
am Tr
ansp
ort F
inFin
ancia
ls 1
,014
2
30,0
36
55,
970
59,
557
43,
682
43,
586
12,
573
16,
068
55
71
6.7
2
7.8
18.
3 1
4.3
2.0
1
.8
5.3
5
.3
11.
7 1
3.4
1.8
2
.0
Chol
a Inv
est a
nd Fi
nFin
ancia
ls 1
,088
1
70,0
02
25,
095
30,
640
15,
417
18,
778
7,4
87
9,4
27
48
60
31.
7 2
5.9
22.
7 1
8.0
3.9
3
.3
11.
0 9
.1
18.
8 1
9.9
2.5
2
.6
Man
appu
ram
Fina
nce
Finan
cials
95
80,
069
18,
570
23,
348
10,
454
13,
306
6,5
39
8,4
15
8
10
93.
9 2
8.7
12.
2 9
.5
2.5
2
.0
7.7
6
.0
21.
9 2
3.4
4.9
5
.1
Mah
& M
ah Fi
nanc
eFin
ancia
ls 3
32
188
,773
3
2,30
2 3
8,17
6 1
8,55
2 2
2,91
2 4
,625
8
,735
8
1
5 -3
1.2
88.
9 4
0.5
21.
5 3
.0
2.7
1
0.2
8.2
7
.5
13.
3 1
.1
1.8
Shrir
am C
ity U
nion
Fin
Finan
cials
2,0
90
137
,840
2
8,47
4 3
3,58
2 1
6,67
5 1
9,75
8 6
,286
7
,725
9
5 1
17
18.
6 2
2.9
21.
9 1
7.8
2.8
2
.4
8.3
7
.0
13.
2 1
4.5
2.8
2
.9
Mut
hoot
Fina
nce
Finan
cials
400
1
59,7
90
29,
972
34,
858
18,
191
21,
430
11,
592
13,
627
29
34
43.
2 1
7.6
13.
8 1
1.7
2.5
2
.1
8.8
7
.5
19.
1 1
9.4
4.0
4
.1
Unio
n Ba
nk
Finan
cials
157
1
22,9
49
134
,300
1
39,7
42
70,
560
70,
010
5,7
27
10,
305
8
12
-60.
4 5
3.8
20.
2 1
3.1
0.5
0
.5
1.7
1
.8
2.7
4
.5
0.1
0
.2
Orie
ntal
Ban
k of C
omFin
ancia
ls 1
62
60,
407
79,
612
79,
078
44,
505
40,
013
2,8
45
4,6
53
8
12
69.
3 4
9.2
19.
7 1
3.2
0.4
0
.4
1.4
1
.5
2.0
3
.1
0.1
0
.2
ICIC
I Ban
kFin
ancia
ls 2
59
1,7
45,3
46
412
,489
3
74,3
67
268
,614
2
10,8
17
85,
083
71,
498
15
12
-12.
7 -1
6.1
17.
7 2
1.2
1.6
1
.5
6.5
8
.3
9.2
7
.4
1.7
1
.6

35GROUND VIEW GROUND VIEW 1 - 31 July 2017 1 - 31 July 2017 34
Phill
ipC
apita
l Ind
ia C
over
age
Uni
vers
e: V
alua
tio
n Su
mm
ary
CMP
Mkt
Cap
Ne
t Sal
es (R
s mn)
EB
IDTA
(Rs
mn)
PAT (
Rs m
n)EP
S (R
s)
EPS
Grow
th (%
) P
/E (x
) P
/B (x
) EV
/EBI
TDA
(x)
ROE
(%)
ROCE
(%)
Nam
e of
com
pany
Sect
orRs
Rs b
nFY
17E
FY18
EFY
17E
FY18
EFY
17E
FY18
EFY
17E
FY18
EFY
17E
FY18
EFY
17E
FY18
EFY
17E
FY18
EFY
17E
FY18
EFY
17E
FY18
EFY
17E
FY18
E
Repc
o Ho
me
Finan
ce
Finan
cials
678
4
7,85
3 4
,038
5
,068
3
,326
4
,163
1
,802
2
,354
2
9 3
7 2
0.0
29.
8 2
3.6
18.
1 3
.8
3.2
1
4.4
11.
5 1
7.4
19.
2 2
.0
2.1
Stat
e Ba
nk o
f Ind
iaFin
ancia
ls 2
59
2,4
04,1
67
915
,543
9
30,6
47
454
,303
4
23,1
06
102
,503
1
32,5
82
13
16
-0.6
2
7.8
20.
3 1
5.9
1.3
1
.2
5.3
5
.7
6.7
8
.0
0.4
0
.5
Bank
of B
arod
a Fin
ancia
ls 1
54
431
,569
1
93,9
81
201
,585
1
03,5
33
101
,905
1
5,69
3 2
8,91
6 7
1
3 -1
29.1
8
4.3
22.
7 1
2.3
0.9
0
.9
4.2
4
.2
4.3
7
.5
0.2
0
.4
Indi
an B
ank
Finan
cials
131
1
70,4
07
73,
085
79,
100
39,
912
43,
322
14,
413
16,
492
30
34
102
.6
14.
4 4
.4
3.8
0
.4
0.4
4
.3
3.9
1
0.5
10.
5 0
.7
0.7
HDFC
Ban
kFin
ancia
ls 1
,109
3
,976
,379
4
48,7
60
533
,934
2
52,2
00
304
,517
1
46,3
89
176
,839
5
8 7
0 1
9.1
20.
8 1
9.1
15.
8 3
.3
2.8
1
8.7
19.
4 2
.0
2.0
Indu
sind
Bank
Finan
cials
950
8
54,8
98
100
,156
1
25,4
81
53,
020
67,
915
29,
683
38,
413
50
64
29.
4 2
9.4
19.
1 1
4.8
2.8
2
.4
16.
1 1
2.6
15.
7 1
7.5
2.0
2
.1
HDFC
Lim
ited
Finan
cials
1,3
04
2,4
61,8
76
115
,002
1
26,8
02
106
,625
1
17,3
85
73,
588
81,
113
47
51
3.7
1
0.2
28.
0 2
5.4
5.4
4
.8
23.
1 2
1.0
20.
4 2
0.1
2.5
2
.4
LIC H
ousin
g Fin
ance
Finan
cials
492
3
48,3
44
38,
395
41,
105
32,
208
33,
989
19,
217
20,
805
38
41
15.
7 8
.3
12.
9 1
1.9
2.3
2
.0
10.
8 1
0.2
19.
4 1
8.0
1.4
1
.3
Punj
ab N
atio
nal B
ank
Finan
cials
142
3
71,3
30
248
,616
2
51,6
56
129
,150
1
18,3
86
15,
749
30,
400
7
14
-135
.8
88.
2 1
9.6
10.
4 0
.7
0.7
2
.9
3.1
7
7.5
113
.1
0.2
0
.4
DCB
Bank
Finan
cials
133
5
9,13
2 1
0,48
6 1
2,40
3 4
,146
4
,814
2
,076
2
,458
7
8
6
.7
8.8
1
8.2
16.
7 1
.9
1.6
1
4.3
12.
3 1
1.0
10.
6 1
.0
1.0
AXIS
Ban
kFin
ancia
ls 5
61
1,2
45,2
61
293
,256
2
96,0
43
173
,334
1
59,6
30
30,
300
45,
498
13
19
-63.
3 4
9.4
44.
4 2
9.7
2.5
2
.4
7.2
7
.8
5.6
8
.2
0.6
0
.8
Cana
ra B
ank
Finan
cials
253
2
21,7
44
172
,544
1
85,9
46
86,
732
91,
806
14,
816
24,
569
26
41
-149
.4
62.
1 9
.9
6.1
0
.5
0.5
2
.6
2.4
5
.4
8.2
0
.3
0.4
SKS
Micr
ofina
nce
Finan
cials
760
1
04,8
66
11,
525
15,
045
5,9
48
7,6
42
6,4
20
6,6
71
47
48
95.
5 2
.9
16.
3 1
5.8
0.0
0
.0
17.
6 1
3.7
30.
9 2
1.5
7.5
5
.6
Bhar
at Fi
nanc
ial I
ncl
Finan
cials
549
1
04,8
66
11,
525
15,
045
5,9
48
7,6
42
6,4
20
6,6
71
47
48
95.
5 2
.9
11.
8 1
1.4
2.7
2
.2
17.
6 1
3.7
30.
9 2
1.5
7.5
5
.6
Colg
ate
FMCG
1,0
15
276
,079
4
3,22
8 4
9,95
1 9
,574
1
1,60
1 5
,926
7
,211
2
2 2
7 -2
.5
21.
7 4
6.6
38.
3 2
1.5
17.
1 2
8.5
23.
3 4
6.1
44.
6 5
1.4
49.
7
Baja
j Cor
pFM
CG 3
80
56,
035
8,7
09
9,6
31
2,6
32
2,8
96
2,3
50
2,5
66
16
17
0.5
9
.2
23.
8 2
1.8
12.
2 1
2.6
21.
0 1
9.2
51.
0 5
7.9
46.
9 5
6.6
Nestl
eFM
CG 6
,965
6
71,5
02
91,
594
106
,521
1
7,95
9 2
2,15
5 1
0,74
0 1
3,60
0 1
11
141
1
5.6
26.
6 6
2.5
49.
4 2
2.4
19.
6 3
7.3
29.
8 3
5.9
39.
7 3
1.8
42.
2
Glax
o Sm
ithkl
ine
Con
FMCG
5,3
24
223
,923
3
7,73
9 4
0,67
7 8
,335
9
,228
6
,567
7
,333
1
56
174
-4
.5
11.
7 3
4.1
30.
5 8
.1
7.3
2
3.1
20.
4 2
3.9
23.
8 2
5.4
25.
2
ITCFM
CG 2
76
3,3
47,8
19
428
,036
4
75,5
99
154
,359
1
74,5
54
104
,713
1
18,2
87
9
10
10.
3 1
3.0
31.
6 2
8.0
9.6
9
.1
21.
3 1
8.8
30.
3 3
2.5
23.
5 2
5.1
Godr
ej C
onsu
mer
Pro
FMCG
1,9
19
653
,664
9
2,42
8 1
03,4
16
19,
134
21,
453
13,
198
14,
912
39
44
15.
4 1
3.0
49.
5 4
3.8
11.
3 9
.4
35.
0 3
0.8
22.
8 2
1.5
17.
1 1
7.8
Dabu
r Ind
ia Lt
dFM
CG 2
78
489
,879
7
7,01
4 8
4,17
7 1
5,08
9 1
6,13
0 1
2,76
7 1
3,86
2 7
8
1
.9
8.6
3
8.4
35.
3 9
.8
8.4
3
2.3
30.
2 2
5.7
23.
8 2
4.1
22.
6
Brita
nnia
FMCG
3,6
90
442
,803
8
9,62
3 1
05,2
91
11,
864
12,
994
7,9
25
9,2
46
66
77
5.3
1
6.7
55.
8 4
7.9
19.
0 1
5.0
37.
0 3
3.5
34.
1 3
1.3
36.
0 3
3.2
Apco
tex I
ndus
tries
FMCG
380
7
,880
5
,640
6
,557
7
98
1,0
74
500
6
91
24
33
30.
2 3
8.0
15.
8 1
1.4
3.6
2
.9
9.5
6
.3
22.
7 2
5.8
25.
0 2
8.7
Emam
iFM
CG 1
,108
2
51,3
78
25,
297
28,
637
7,5
63
8,5
40
5,4
65
6,3
54
24
28
2.7
1
6.3
46.
0 3
9.6
17.
1 1
5.7
33.
9 2
9.9
37.
2 3
9.8
17.
7 2
2.5
Jubi
lant
Food
work
sFM
CG 9
77
64,
423
25,
834
27,
384
2,4
11
2,7
44
699
8
11
11
12
-27.
8 1
5.9
91.
4 7
8.8
7.8
7
.1
26.
4 2
2.3
8.6
9
.0
9.9
9
.0

37GROUND VIEW GROUND VIEW 1 - 31 July 2017 1 - 31 July 2017 36
Phill
ipC
apita
l Ind
ia C
over
age
Uni
vers
e: V
alua
tio
n Su
mm
ary
CMP
Mkt
Cap
Ne
t Sal
es (R
s mn)
EB
IDTA
(Rs
mn)
PAT (
Rs m
n)EP
S (R
s)
EPS
Grow
th (%
) P
/E (x
) P
/B (x
) EV
/EBI
TDA
(x)
ROE
(%)
ROCE
(%)
Nam
e of
com
pany
Sect
orRs
Rs b
nFY
17E
FY18
EFY
17E
FY18
EFY
17E
FY18
EFY
17E
FY18
EFY
17E
FY18
EFY
17E
FY18
EFY
17E
FY18
EFY
17E
FY18
EFY
17E
FY18
EFY
17E
FY18
E
Asia
n Pa
ints
FMCG
1,1
69
1,1
21,3
02
152
,902
1
75,2
42
30,
214
34,
755
19,
088
21,
860
20
23
7.9
1
4.5
58.
7 5
1.3
17.
2 1
4.8
36.
8 3
2.0
29.
2 2
8.9
29.
7 2
9.4
Agro
Tech
Food
sFM
CG 5
12
12,
477
8,0
43
8,6
13
609
7
46
247
4
04
10
17
5.6
6
3.4
50.
5 3
0.9
3.5
3
.2
21.
2 1
7.1
6.9
1
0.5
6.7
8
.6
Mar
ico In
dustr
ies
FMCG
309
3
98,4
98
59,
180
67,
572
11,
593
12,
793
7,9
86
8,9
99
6
7
12.
2 1
2.7
49.
9 4
4.3
16.
0 1
3.6
34.
0 3
0.4
32.
0 3
0.6
29.
8 2
8.9
Hind
usta
n Un
ileve
rFM
CG 9
96
2,1
54,9
35
323
,670
3
61,9
38
67,
090
77,
089
43,
374
50,
393
20
23
3.5
1
6.2
49.
8 4
2.8
33.
7 3
0.6
31.
8 2
7.5
67.
7 7
1.3
71.
0 7
2.6
Para
g M
ilk Fo
ods
FMCG
255
2
1,44
9 1
6,45
5 1
9,11
4 1
,666
2
,058
7
46
980
9
1
2 5
7.6
31.
4 2
8.8
21.
9 2
.9
2.6
1
3.4
10.
8 1
0.2
11.
8 1
3.5
12.
6
Hind
usta
n Co
nstru
ction
Infra
struc
ture
43
43,
258
41,
959
41,
400
7,5
36
4,9
68
806
1
,524
1
2
-4
9.4
89.
0 5
3.7
28.
4 1
.6
1.5
1
1.3
13.
0 3
.6
5.5
7
.9
6.4
NCC
Infra
struc
ture
96
53,
175
78,
921
87,
813
6,8
53
7,9
91
2,6
08
3,2
00
5
6
2.5
2
2.7
20.
4 1
6.6
1.5
1
.4
9.9
8
.5
7.6
8
.6
9.3
1
0.4
PNC
Infra
tech
Ltd
Infra
struc
ture
160
4
1,07
2 1
6,89
1 1
9,42
5 2
,210
2
,564
2
,103
1
,742
8
7
-9
.9
-17.
2 1
9.5
23.
6 2
.6
2.4
1
9.2
16.
6 1
4.3
10.
5 1
4.3
10.
4
Adan
i Por
ts &
SEZ
Infra
struc
ture
352
7
29,9
07
84,
394
100
,576
5
4,14
7 6
4,80
8 3
7,33
4 3
5,13
5 1
8 1
7 3
0.5
-5.9
1
9.6
20.
8 4
.2
3.5
1
7.1
14.
1 2
1.3
16.
9 1
2.5
10.
8
IRB
Infra
struc
ture
Infra
struc
ture
261
9
1,55
3 5
8,45
9 5
9,20
9 3
0,48
3 2
9,18
0 7
,155
8
,624
2
0 2
5 1
2.0
20.
5 1
2.8
10.
6 1
.7
1.5
6
.8
7.0
1
3.6
13.
9 3
.7
4.1
Asho
ka B
uild
con
Infra
struc
ture
210
3
9,32
9 2
9,79
4 3
4,02
9 8
,930
1
0,03
3 -1
04
-422
-1
-2
-7
0.1
306
.5
-379
.1
-93.
2 2
.3
2.4
9
.5
8.3
-0
.6
-2.6
5
.5
6.1
ITD C
emen
tatio
n In
frastr
uctu
re 1
89
29,
387
30,
896
35,
530
2,6
26
3,0
20
953
1
,206
6
8
9
8.1
26.
5 3
0.8
24.
4 4
.7
4.0
1
2.1
10.
8 1
5.2
16.
2 1
4.0
15.
9
Ahlu
walia
Con
tracts
Infra
struc
ture
388
2
5,99
1 1
4,26
5 1
6,12
0 1
,730
2
,055
8
60
1,1
21
13
17
1.9
3
0.3
30.
2 2
3.2
5.1
4
.4
14.
8 1
2.5
18.
5 2
0.3
17.
8 1
9.6
KNR
Cons
tructi
onIn
frastr
uctu
re 2
05
28,
827
15,
411
17,
722
2,2
96
2,5
70
1,6
81
1,6
37
12
12
4.4
-2
.6
17.
1 1
7.6
3.2
2
.7
13.
0 1
1.5
20.
6 1
6.8
18.
2 1
6.1
NIIT
Tech
nolo
gies
IT Se
rvice
s 5
03
30,
884
28,
021
29,
143
4,8
46
5,0
22
2,7
23
2,8
11
45
46
1.8
3
.2
11.
3 1
1.0
1.8
1
.7
4.8
4
.6
16.
1 1
5.6
15.
3 1
5.6
Min
dtre
e Lt
dIT
Serv
ices
509
8
5,44
9 5
2,36
4 5
4,14
2 6
,953
6
,804
4
,186
4
,493
2
5 2
6 -2
4.3
4.5
2
0.4
19.
5 3
.3
3.1
1
2.1
12.
4 1
6.2
15.
7 1
6.9
16.
7
Wip
roIT
Serv
ices
505
1
,227
,064
5
50,4
02
552
,304
1
16,9
86
115
,593
8
4,89
5 8
7,68
0 1
8 1
8 -3
.2
2.6
2
8.7
28.
0 4
.7
4.3
1
1.4
11.
4 1
6.3
15.
2 1
5.9
14.
7
Pers
isten
t Sys
tem
sIT
Serv
ices
585
4
6,78
4 2
8,78
4 3
0,23
2 4
,654
4
,797
3
,129
3
,208
3
9 4
0 5
.2
2.5
1
5.0
14.
6 2
.5
2.2
9
.7
9.5
1
6.5
15.
2 1
5.6
15.
0
KPIT
Tech
nolo
gies
IT Se
rvice
s 1
29
25,
556
33,
234
34,
555
3,4
86
3,3
44
2,1
25
2,0
46
11
11
-26.
4 -3
.7
11.
7 1
2.1
1.6
1
.4
7.2
7
.3
13.
4 1
1.7
14.
0 1
0.5
Info
sys T
echn
olog
ies
IT Se
rvice
s 9
48
2,1
76,4
70
684
,850
7
14,2
49
186
,050
1
92,6
24
143
,830
1
47,4
01
63
64
6.6
2
.5
15.
1 1
4.7
3.1
3
.1
9.6
9
.3
20.
9 2
1.0
21.
8 2
1.1
HCL T
echn
olog
ies
IT Se
rvice
s 8
43
1,2
03,3
72
467
,220
5
01,5
14
103
,090
1
34,2
69
84,
570
106
,797
6
0 7
6 5
5.1
26.
5 1
4.1
11.
1 3
.0
2.6
1
1.7
8.8
2
5.3
27.
2 2
5.8
27.
9
Tech
Mah
indr
aIT
Serv
ices
429
4
18,1
60
291
,408
3
00,1
06
41,
843
37,
197
28,
387
24,
589
32
28
-7.5
-1
3.4
13.
3 1
5.3
2.3
2
.1
9.5
1
0.6
17.
3 1
3.8
14.
0 1
1.0
Tata
Con
sulta
ncy
IT Se
rvice
s 2
,335
4
,600
,358
1
,179
,660
1
,217
,864
3
23,1
10
324
,967
2
62,8
90
260
,398
1
33
136
8
.6
2.2
1
7.5
17.
1 5
.2
5.5
1
4.1
14.
0 2
9.8
31.
8 3
1.7
29.
7
Navk
ar
Logi
stics
217
3
0,87
5 3
,875
7
,048
1
,458
2
,710
8
96
1,6
64
6
12
-19.
8 8
5.8
34.
5 1
8.5
2.2
1
.9
23.
7 1
2.5
6.4
1
0.3
5.8
9
.8
Gate
way D
istrip
acks
Logi
stics
257
2
7,90
0 1
0,90
2 1
2,34
2 2
,411
3
,262
1
,081
1
,782
1
0 1
6 -1
.3
64.
9 2
5.8
15.
6 2
.9
2.7
1
4.0
10.
3 1
1.3
17.
2 8
.3
11.
9

37GROUND VIEW GROUND VIEW 1 - 31 July 2017 1 - 31 July 2017 36
Phill
ipC
apita
l Ind
ia C
over
age
Uni
vers
e: V
alua
tio
n Su
mm
ary
CMP
Mkt
Cap
Ne
t Sal
es (R
s mn)
EB
IDTA
(Rs
mn)
PAT (
Rs m
n)EP
S (R
s)
EPS
Grow
th (%
) P
/E (x
) P
/B (x
) EV
/EBI
TDA
(x)
ROE
(%)
ROCE
(%)
Nam
e of
com
pany
Sect
orRs
Rs b
nFY
17E
FY18
EFY
17E
FY18
EFY
17E
FY18
EFY
17E
FY18
EFY
17E
FY18
EFY
17E
FY18
EFY
17E
FY18
EFY
17E
FY18
EFY
17E
FY18
EFY
17E
FY18
E
Allca
rgo
Logi
stics
Logi
stics
185
4
6,62
5 5
6,67
4 6
1,74
0 4
,788
5
,943
2
,248
3
,007
9
1
2 -1
9.2
33.
7 2
0.7
15.
5 2
.7
2.4
1
0.6
8.6
1
3.0
15.
3 9
.3
12.
7
Cont
aine
r Cor
p Of
Indi
aLo
gisti
cs 1
,200
2
92,4
61
54,
668
60,
835
10,
442
11,
715
7,3
22
8,1
36
38
42
-7.0
1
1.1
32.
0 2
8.8
2.7
2
.6
27.
7 2
4.6
8.6
9
.0
8.4
8
.8
VRL L
ogist
ics Lt
d Lo
gisti
cs 3
30
30,
110
18,
031
18,
945
2,1
82
2,4
77
705
9
19
8
10
-31.
1 3
0.4
42.
7 3
2.8
5.6
5
.3
14.
6 1
2.8
13.
0 1
6.0
10.
0 1
2.2
Orte
l Com
mun
icatio
nM
edia
108
3
,273
2
,533
3
,025
8
44
1,0
84
125
8
8 4
3
4
.2
-29.
9 2
6.1
37.
2 2
.2
2.0
6
.0
4.6
8
.3
5.5
8
.5
8.1
HT M
edia
Med
ia 8
3 1
9,42
3 2
4,52
1 2
6,02
5 2
,984
3
,449
1
,703
2
,063
7
9
1
.4
21.
1 1
1.4
9.4
0
.9
0.8
8
.4
6.4
7
.5
8.1
7
.9
8.2
Hind
usta
n M
edia
Vent
Med
ia 2
85
20,
917
9,3
33
10,
021
2,0
55
2,3
32
1,9
36
2,1
45
26
29
8.3
1
0.8
10.
8 9
.8
1.8
1
.5
10.
8 8
.6
16.
5 1
5.6
19.
2 1
7.2
DB C
orp
Limite
dM
edia
380
6
9,79
3 2
2,43
5 2
4,60
2 6
,422
7
,192
3
,730
4
,325
2
0 2
4 2
5.1
16.
0 1
8.7
16.
1 4
.3
3.8
1
0.4
9.1
2
2.8
23.
5 2
1.4
21.
6
Dish
TVM
edia
97
103
,236
3
0,14
4 3
1,69
4 9
,729
9
,954
1
,538
1
,614
1
2
-7
8.2
5.0
6
7.1
63.
9 2
0.6
15.
6 1
1.0
10.
6 3
0.7
24.
4 3
9.8
28.
0
Zee
Ente
rtain
men
tM
edia
505
4
85,0
27
64,
341
65,
665
19,
269
20,
698
9,9
87
14,
380
10
15
16.
9 4
4.0
48.
5 3
3.7
6.9
4
.5
23.
9 2
0.7
14.
1 1
3.4
14.
8 1
6.8
Jagr
an P
raka
shan
Med
ia 1
96
64,
173
22,
936
24,
808
6,3
47
7,1
71
3,7
13
4,3
27
12
14
13.
1 1
6.5
16.
8 1
4.4
3.3
2
.8
10.
3 8
.6
19.
4 1
9.5
16.
1 1
5.7
Tata
Ste
elM
etal
s 2
49
423
,741
1
,122
,994
1
,223
,602
1
70,0
78
198
,122
3
9,47
6 6
3,89
6 4
1 6
6 3
26.0
6
1.9
6.1
3
.8
0.7
0
.7
7.2
6
.2
11.
1 1
7.5
2.1
6
.6
Hind
alco
Inds
Met
als
106
4
18,7
13
1,0
01,8
38
1,0
45,9
17
124
,474
1
39,1
52
17,
943
34,
365
8
15
113
.3
91.
5 1
3.1
6.8
0
.5
0.5
7
.8
6.7
3
.9
6.8
4
.9
7.2
Veda
nta L
tdM
etal
s 1
29
674
,171
7
28,0
43
905
,686
2
15,2
76
272
,640
6
2,91
3 1
03,5
28
21
28
101
.1
31.
3 6
.1
4.6
0
.8
0.6
6
.3
4.6
1
2.8
12.
7 8
.5
10.
4
NALC
O M
etal
s 3
6 1
31,1
49
72,
858
87,
824
8,9
15
16,
701
5,2
05
10,
309
3
5
2.4
9
8.1
13.
2 6
.7
0.7
0
.7
12.
2 6
.2
5.1
9
.8
3.6
8
.5
SAIL
Met
als
58
251
,523
4
44,5
24
511
,379
3
80
44,
805
-26,
165
-4,9
09
-6
-1
-36.
5 -8
1.2
-9.2
-4
8.8
0.7
0
.7
1
5.7
-7.3
-1
.3
-1.0
1
.4
JSW
Ste
elM
etal
s 8
1 4
69,7
87
568
,768
6
21,9
10
134
,465
1
35,7
50
47,
395
45,
762
20
19
242
.6
-3.4
4
.1
4.3
0
.9
0.7
6
.6
6.6
2
0.9
17.
0 1
0.8
9.3
Hind
usta
n Zi
ncM
etal
s 1
56
1,0
72,1
75
172
,674
2
12,3
35
96,
656
128
,835
8
2,29
8 1
10,9
86
19
26
0.4
3
4.9
8.0
6
.0
1.5
1
.3
8.1
5
.4
19.
3 2
2.3
19.
4 2
2.4
PEBS
Mid
cap
149
5
,104
5
,154
6
,278
6
57
861
2
81
400
8
1
2 -1
2.3
42.
6 1
8.2
12.
8 2
.2
2.0
9
.4
7.4
1
2.2
15.
3 1
2.9
14.
3
KDDL
Mid
cap
199
2
,157
4
,760
5
,513
2
96
459
3
6 9
8 3
9
-3
1.7
170
.6
59.
6 2
2.0
2.1
1
.9
11.
2 7
.2
3.5
8
.4
4.8
7
.2
Penn
ar In
ds.
Mid
cap
50
5,9
69
15,
320
19,
035
1,7
77
2,2
78
488
7
49
4
6
11.
4 5
3.3
12.
2 8
.0
1.1
1
.0
4.8
3
.8
8.9
1
2.4
12.
9 1
5.1
Praj
Inds
.M
idca
p 8
6 1
5,39
2 9
,089
1
1,26
4 6
37
1,4
31
409
9
67
2
5
-40.
2 1
36.4
3
7.2
15.
7 2
.4
2.3
2
3.3
10.
5 6
.5
14.
5 6
.1
14.
1
Sint
ex In
dustr
ies
Mid
cap
115
6
3,49
1 8
3,70
2 9
9,49
4 1
4,45
5 1
7,54
0 5
,209
6
,706
1
0 1
3 -3
0.0
28.
7 1
1.6
9.0
0
.9
0.9
8
.7
7.4
8
.1
9.5
5
.4
5.9
Indo
Cou
nt In
dustr
ies
Mid
cap
205
4
0,44
7 2
2,64
3 2
5,15
8 4
,568
5
,138
2
,651
3
,005
1
3 1
5 0
.2
13.
4 1
5.3
13.
5 4
.5
3.5
9
.2
8.0
2
9.6
25.
9 2
4.7
23.
2
Gulf
Oil L
ubric
ants
Oil &
Gas
772
3
8,30
9 1
1,28
6 1
2,98
1 1
,804
2
,223
1
,211
1
,491
2
4 3
0 2
0.5
23.
1 3
1.6
25.
7 1
0.8
8.7
2
0.6
16.
8 3
4.2
33.
9 2
6.4
27.
8
Castr
ol In
dia
Oil &
Gas
443
2
19,3
13
36,
135
39,
952
10,
523
11,
988
7,1
28
8,0
98
14
16
7.6
1
3.6
30.
8 2
7.1
32.
8 2
9.2
20.
0 1
7.5
106
.6
107
.9
124
.9
128
.2
Guja
rat S
tate
Pet
rone
tOi
l & G
as 1
77
99,
868
10,
276
10,
898
8,8
83
9,3
98
4,9
66
5,2
10
9
9
11.
5 4
.9
20.
1 1
9.2
2.2
2
.0
11.
2 1
0.4
11.
0 1
0.7
9.4
9
.2

39GROUND VIEW GROUND VIEW 1 - 31 July 2017 1 - 31 July 2017 38
Phill
ipC
apita
l Ind
ia C
over
age
Uni
vers
e: V
alua
tio
n Su
mm
ary
CMP
Mkt
Cap
Ne
t Sal
es (R
s mn)
EB
IDTA
(Rs
mn)
PAT (
Rs m
n)EP
S (R
s)
EPS
Grow
th (%
) P
/E (x
) P
/B (x
) EV
/EBI
TDA
(x)
ROE
(%)
ROCE
(%)
Nam
e of
com
pany
Sect
orRs
Rs b
nFY
17E
FY18
EFY
17E
FY18
EFY
17E
FY18
EFY
17E
FY18
EFY
17E
FY18
EFY
17E
FY18
EFY
17E
FY18
EFY
17E
FY18
EFY
17E
FY18
EFY
17E
FY18
E
Petro
net L
NGOi
l & G
as 4
36
326
,888
2
46,1
60
270
,164
2
6,79
8 3
1,06
7 1
7,05
7 2
0,66
5 2
3 2
8 5
9.7
21.
2 1
9.2
15.
8 4
.0
3.4
1
2.7
9.7
2
1.1
21.
6 1
5.9
17.
5
GUJA
RAT G
AS LT
DOi
l & G
as 7
79
107
,203
5
0,92
6 5
5,97
9 7
,433
1
0,52
6 2
,195
4
,443
1
6 3
2 -6
.2
102
.4
48.
8 2
4.1
6.5
5
.4
17.
4 1
2.2
13.
3 2
2.4
6.3
9
.6
GUJA
RAT G
AS LT
DOi
l & G
as 7
79
107
,203
5
0,92
6 5
5,97
9 7
,433
1
0,52
6 2
,195
4
,443
1
6 3
2 -6
.2
102
.4
48.
8 2
4.1
6.5
5
.4
17.
4 1
2.2
13.
3 2
2.4
6.3
9
.6
Indr
apra
stha G
asOi
l & G
as 1
,025
1
43,5
00
38,
148
36,
666
9,6
38
10,
795
5,7
11
6,5
63
41
47
31.
9 1
4.9
25.
1 2
1.9
4.9
4
.2
14.
3 1
2.5
19.
5 1
9.4
17.
0 1
7.0
Relia
nce
Indu
strie
sOi
l & G
as 1
,346
4
,375
,969
3
,053
,820
3
,849
,646
4
61,9
40
539
,003
2
98,3
30
239
,810
1
01
81
17.
5 -1
9.7
13.
3 1
6.6
1.5
1
.4
13.
7 1
2.6
11.
3 8
.4
7.1
5
.8
Divi'
s Lab
orat
orie
sPh
arm
a 6
37
169
,170
4
1,06
3 4
1,44
4 1
4,85
7 1
3,79
1 1
1,00
1 9
,584
4
1 3
6 1
.2
-12.
9 1
5.4
17.
7 3
.4
3.0
1
1.3
12.
4 2
1.1
16.
9 -
-
Auro
bind
o Ph
arm
aPh
arm
a 6
13
359
,146
1
50,8
99
170
,649
3
4,89
3 3
9,59
0 2
2,91
4 2
4,93
1 3
9 4
3 1
2.3
8.8
1
5.6
14.
3 3
.9
3.2
1
1.1
9.6
2
5.4
22.
2 2
3.1
21.
5
Glen
mar
k Pha
rma
Phar
ma
874
2
46,4
74
89,
704
95,
972
21,
752
23,
124
13,
139
14,
175
47
50
42.
8 7
.9
18.
8 1
7.4
4.8
3
.8
12.
8 1
1.7
25.
7 2
1.9
18.
3 1
6.3
Lupi
nPh
arm
a 1
,261
5
69,5
12
171
,198
1
80,9
25
48,
620
49,
000
28,
994
29,
851
64
66
31.
9 3
.0
19.
6 1
9.0
4.3
3
.6
12.
8 1
2.2
19.
3 1
8.9
- -
Sun
Phar
ma
Phar
ma
643
1
,542
,946
3
02,6
42
300
,806
1
00,8
93
96,
649
69,
644
62,
174
29
26
20.
3 -1
0.7
22.
2 2
4.8
4.2
3
.7
14.
1 1
4.4
19.
0 1
4.9
15.
4 1
2.8
Dr R
eddy
's La
bs.
Phar
ma
2,5
98
430
,426
1
40,8
09
152
,347
2
5,22
0 3
4,27
8 1
2,03
9 1
8,96
4 7
1 1
11
-40.
4 5
7.5
36.
8 2
3.3
3.6
3
.2
18.
9 1
3.5
9.7
1
3.6
5.8
8
.6
Cadi
la H
ealth
care
Phar
ma
479
4
90,3
73
94,
156
121
,792
1
9,08
6 2
9,12
6 1
4,48
5 2
1,05
3 1
4 2
1 -1
.6
3
3.9
23.
3 7
.5
5.9
2
6.7
17.
3 2
2.2
24.
9 1
6.1
18.
9
Ipca
Labo
rato
ries
Phar
ma
550
6
9,33
1 3
2,10
6 3
5,86
8 4
,274
5
,882
1
,855
3
,121
1
5 2
5 3
6.1
68.
3 3
7.1
22.
0 2
.8
2.5
1
7.1
12.
2 7
.5
11.
2 6
.3
9.3
Cipl
a Ltd
Ph
arm
a 5
59
450
,083
1
4,63
0 1
6,27
0 3
,646
4
,149
1
,303
1
,561
1
6 1
9 -1
6.8
19.
8 3
4.5
28.
8 3
.5
3.2
1
24.6
1
09.3
1
7.4
20.
4 -
-
Bioc
onPh
arm
a 1
,030
2
05,9
90
38,
763
46,
678
9,7
95
10,
325
6,1
21
5,2
99
31
26
35.
8 -1
3.4
33.
7 3
8.9
4.6
4
.5
21.
9 2
1.0
13.
2 1
1.0
11.
5 1
0.2
Titan
Com
pany
Reta
il 4
73
419
,523
1
29,7
87
148
,471
1
1,55
4 1
4,59
8 7
,711
9
,847
9
1
1 1
4.3
27.
7 5
4.4
42.
6 1
0.1
8.7
3
6.2
28.
4 2
0.2
21.
9 1
8.7
22.
3
Meg
hman
i Org
anics
Spec
Che
m 4
1 1
0,45
2 1
5,46
3 1
7,02
8 2
,888
3
,355
9
15
1,1
15
4
4
11.
0 2
1.8
11.
4 9
.4
1.4
1
.3
5.1
4
.3
12.
6 1
3.4
10.
9 1
2.2
Cam
lin Fi
ne S
cienc
esSp
ec C
hem
90
9,3
55
5,3
39
7,4
25
386
1
,040
-1
13
459
-1
4
-1
25.9
-5
06.4
-8
2.8
20.
4 4
.4
3.7
3
1.1
12.
0 -3
.6
19.
6 -
-
Aarti
Indu
strie
sSp
ec C
hem
862
7
0,79
2 3
1,63
5 3
6,85
1 6
,535
7
,628
3
,158
3
,808
3
8 4
6 2
2.9
20.
6 2
2.4
18.
6 5
.4
4.2
1
3.0
11.
3 2
5.0
23.
7 -
-
SRF L
tdSp
ec C
hem
1,7
78
102
,065
5
1,36
6 5
8,07
8 9
,694
1
1,26
7 4
,874
5
,008
8
5 8
7 1
0.7
2.7
2
0.9
20.
4 3
.3
2.9
1
2.7
11.
2 1
6.6
14.
1 1
0.0
9.3
Vina
ti Or
gani
csSp
ec C
hem
850
4
3,85
2 7
,069
8
,510
2
,192
2
,649
1
,393
1
,708
2
7 3
3 4
5.1
22.
6 3
1.5
25.
7 6
.7
5.5
1
9.9
17.
2 2
1.3
21.
3 -
-
Atul
Ltd
Spec
Che
m 2
,476
7
3,44
8 2
9,96
1 3
3,44
4 5
,095
5
,886
3
,234
3
,624
1
09
122
2
0.0
12.
1 2
2.7
20.
3 4
.7
3.9
1
4.4
12.
1 2
0.4
18.
9 -
-
Bhar
ti In
frate
lTe
leco
m 3
66
677
,604
8
4,32
7 9
3,54
2 5
9,42
0 6
6,63
9 2
7,47
0 3
0,99
8 1
5 1
7 1
8.3
12.
7 2
4.7
21.
9 4
.4
4.7
1
0.7
9.4
1
7.8
21.
4 1
1.1
15.
7
Bhar
ti Ai
rtel
Tele
com
356
1
,424
,074
9
55,1
47
914
,244
3
53,7
63
318
,695
5
3,44
8 3
9,10
0 1
3 1
0 3
6.9
-26.
8 2
6.7
36.
4 2
.0
1.9
7
.4
8.2
7
.7
5.3
5
.7
4.9
Tata
Com
mun
icatio
nsTe
leco
m 6
56
186
,960
1
76,1
97
188
,796
2
4,05
9 2
8,49
8 2
,944
4
,408
1
0 1
5 -1
0.9
49.
8 6
3.5
42.
4 2
8.3
19.
7 1
1.0
9.2
4
4.6
46.
4 -1
7.1
4.7
Idea
Cel
lula
rTe
leco
m 8
8 3
15,8
69
355
,758
3
54,7
98
102
,763
9
1,93
0 -3
,997
-2
1,57
1 -1
-6
-1
14.6
4
39.7
-7
8.9
-14.
6 1
.3
1.4
7
.3
9.0
-1
.6
-9.4
3
.0
0.8
Sour
ce: P
hilli
pCap
ital I
ndia
Res
earc
h Es
timat
es

39GROUND VIEW GROUND VIEW 1 - 31 July 2017 1 - 31 July 2017 38
Disclosures and Disclaimers
PhillipCapital (India) Pvt. Ltd. has three independent equity research groups: Institutional Equities, Institutional Equity Derivatives and Private Client Group. This report has been prepared by Institutional Equities Group. The views and opinions expressed in this document may or may not match or may be contrary at times with the views, estimates, rating, target price of the other equity research groups of PhillipCapital (India) Pvt. Ltd.
This report is issued by PhillipCapital (India) Pvt. Ltd. which is regulated by SEBI. PhillipCapital (India) Pvt. Ltd. is a subsidiary of Phillip (Mauritius) Pvt. Ltd. References to "PCIPL" in this report shall mean PhillipCapital (India) Pvt. Ltd unless otherwise stated. This report is prepared and distributed by PCIPL for information purposes only and neither the information contained herein nor any opinion expressed should be construed or deemed to be construed as solicitation or as offering advice for the purposes of the purchase or sale of any security, investment or derivatives. The information and opinions contained in the Report were consid-ered by PCIPL to be valid when published. The report also contains information provided to PCIPL by third parties. The source of such information will usually be disclosed in the report. Whilst PCIPL has taken all reasonable steps to ensure that this information is correct, PCIPL does not offer any warranty as to the accuracy or completeness of such information. Any person placing reliance on the report to undertake trading does so entirely at his or her own risk and PCIPL does not accept any liability as a result. Securities and Derivatives markets may be subject to rapid and unexpected price movements and past performance is not necessarily an indication to future performance.
This report does not have regard to the specific investment objectives, financial situation and the particular needs of any specific person who may receive this report. Investors must undertake independent analysis with their own legal, tax and financial advisors and reach their own regarding the appropriateness of investing in any securities or investment strategies discussed or recommended in this report and should understand that statements regarding future prospects may not be realized. In no circumstances it be used or considered as an offer to sell or a solicitation of any offer to buy or sell the Securities mentioned in it. The information contained in the research reports may have been taken from trade and statistical services and other sources, which we believe are reliable. PhillipCapital (India) Pvt. Ltd. or any of its group/associate/affiliate companies do not guarantee that such information is accurate or complete and it should not be relied upon as such. Any opinions expressed reflect judgments at this date and are subject to change without notice
Important: These disclosures and disclaimers must be read in conjunction with the research report of which it forms part. Receipt and use of the research report is subject to all aspects of these disclosures and disclaimers. Additional information about the issuers and securities discussed in this research report is available on request.
Certifications: The research analyst(s) who prepared this research report hereby certifies that the views expressed in this research report accurately reflect the research analyst’s personal views about all of the subject issuers and/or securities, that the analyst have no known conflict of interest and no part of the research analyst’s compensation was, is or will be, directly or indirectly, related to the specific views or recommendations contained in this research report. The Research Analyst certifies that he /she or his / her family members does not own the stock(s) covered in this research report.
Independence: PhillipCapital (India) Pvt. Ltd. has not had an investment banking relationship with, and has not received any compensation for investment banking services from, the subject issuers in the past twelve (12) months, and PhillipCapital (India) Pvt. Ltd does not anticipate receiving or intend to seek compensation for investment banking services from the subject issuers in the next three (3) months. PhillipCapital (India) Pvt. Ltd is not a market maker in the securities mentioned in this research report, although it or its affiliates may hold either long or short positions in such securities. PhillipCapital (India) Pvt. Ltd does not hold more than 1% of the shares of the company(ies) covered in this report.
Suitability and Risks: This research report is for informational purposes only and is not tailored to the specific investment objectives, financial situation or par-ticular requirements of any individual recipient hereof. Certain securities may give rise to substantial risks and may not be suitable for certain investors. Each investor must make its own determination as to the appropriateness of any securities referred to in this research report based upon the legal, tax and accounting consid-erations applicable to such investor and its own investment objectives or strategy, its financial situation and its investing experience. The value of any security may be positively or adversely affected by changes in foreign exchange or interest rates, as well as by other financial, economic or political factors. Past performance is not
necessarily indicative of future performance or results.
Sources, Completeness and Accuracy: The material herein is based upon information obtained from sources that PCIPL and the research analyst believe to be reliable, but neither PCIPL nor the research analyst represents or guarantees that the information contained herein is accurate or complete and it should not be relied upon as such. Opinions expressed herein are current opinions as of the date appearing on this material and are subject to change without notice. Furthermore, PCIPL is under no obligation to update or keep the information current.
Copyright: The copyright in this research report belongs exclusively to PCIPL. All rights are reserved. Any unauthorized use or disclosure is prohibited. No reprinting or reproduction, in whole or in part, is permitted without the PCIPL’s prior consent, except that a recipient may reprint it for internal circulation only and only if it is reprinted in its entirety.
Caution: Risk of loss in trading/investment can be substantial and even more than the amount / margin given by you. Investment in securities market are sub-ject to market risks, you are requested to read all the related documents carefully before investing. You should carefully consider whether trading/investment is appropriate for you in light of your experience, objectives, financial resources and other relevant circumstances. PhillipCapital and any of its employees, directors, associates, group entities, or affiliates shall not be liable for losses, if any, incurred by you. You are further cautioned that trading/investments in financial markets are subject to market risks and are advised to seek independent third party trading/investment advice outside PhillipCapital/group/associates/affiliates/directors/employees before and during your trading/investment. There is no guarantee/as-surance as to returns or profits or capital protection or appreciation. PhillipCapital and any of its employees, directors, associates, and/or employees, directors, associates of PhillipCapital’s group entities or affiliates is not inducing you for trading/investing in the financial market(s). Trading/Investment decision is your sole responsibility. You must also read the Risk Disclosure Document and Do’s and Don’ts before investing.
Kindly note that past performance is not necessarily a guide to future performance.
For Detailed Disclaimer: Please visit our website www.phillipcapital.in
For U.S. persons only: This research report is a product of PhillipCapital (India) Pvt Ltd. which is the employer of the research analyst(s) who has prepared the research report. The research analyst(s) preparing the research report is/are resident outside the United States (U.S.) and are not associated persons of any U.S. regulated broker-dealer and therefore the analyst(s) is/are not subject to supervision by a U.S. broker-dealer, and is/are not required to satisfy the regulatory licensing requirements of FINRA or required to otherwise comply with U.S. rules or regulations regarding, among other things, communications with a subject com-pany, public appearances and trading securities held by a research analyst account.
This report is intended for distribution by PhillipCapital (India) Pvt Ltd. only to "Major Institutional Investors" as defined by Rule 15a-6(b)(4) of the U.S. Securities andExchange Act, 1934 (the Exchange Act) and interpretations thereof by U.S. Securities and Exchange Commission (SEC) in reliance on Rule 15a 6(a)(2). If the recipient of this report is not a Major Institutional Investor as specified above, then it should not act upon this report and return the same to the sender. Further, this report may not be copied, duplicated and/or transmitted onward to any U.S. person, which is not the Major Institutional Investor.
In reliance on the exemption from registration provided by Rule 15a-6 of the Exchange Act and interpretations thereof by the SEC in order to conduct certain business with Major Institutional Investors, PhillipCapital (India) Pvt Ltd. has entered into an agreement with a U.S. registered broker-dealer, Decker & Co, LLC. Transactions in securities discussed in this research report should be effected through Decker & Co, LLC or another U.S. registered broker dealer.
If Distribution is to Australian Investors
This report is produced by PhillipCapital (India) Pvt Ltd and is being distributed in Australia by Phillip Capital Limited (Australian Financial Services Licence No. 246827).
This report contains general securities advice and does not take into account your personal objectives, situation and needs. Please read the Disclosures and Dis-claimers set out above. By receiving or reading this report, you agree to be bound by the terms and limitations set out above. Any failure to comply with these terms and limitations may constitute a violation of law. This report has been provided to you for personal use only and shall not be reproduced, distributed or published by you in whole or in part, for any purpose. If you have received this report by mistake, please delete or destroy it, and notify the sender immediately.

PBGROUND VIEW GROUND VIEW 1 - 31 July 2017 1 - 31 July 2017 40
inh
ou
sed
esig
n.co
.in