Embed Size (px)
Citation preview

58
Housing Affordability’s Impact on Local Government Finance: An Adams County Case Study Executive Summary This study explores one of the societal impacts of the decline in housing affordability; the fiscal impact to local governments that are home to the increasing numbers of housing-‐challenged households. While it was beyond the scope of this study to explore every county in Colorado, it was decided to conduct a pilot of one county, Adams County. While the results of this study can only be considered illustrative, it can be inferred that other counties in the state face similar pressures. The major trends discovered in Adams County are:
• There is a structural imbalance in county fund reserves to provide the required match for basic human services. This is a situation that cannot be sustained forever.
• Historically, counties have served as the vehicle for pass-‐through funding and administering human services. Recent demand has prompted spending on human services at the county and municipal levels.
• Municipalities have been exposed to increasing pressure to enter the human services funding game by outsourcing those services to community-‐based organizations via philanthropic grant making with general funds.
• Related, some municipalities have decided to forego revenues in the form of development incentives in an attempt to mitigate the affordability issue on the front end by encouraging developments for lower-‐income households.
• There is approximately $170 million in crowded out spending, translating to $6 million in lost revenue impact to municipalities. Households that are cost-‐burdened have a dampening economic effect on sales tax revenues, the major source of general funds revenues for municipalities.
These findings ultimately require further investigation to better understand the dynamic across different counties in the state. In the end, this study intends to deepen the conversation around finding solutions for overall affordability of housing across the state. Acknowledgements The authors would like to express their sincere thanks to those individuals who offered their time to discuss the premise of this project. Their insight and experience provided the substance for the financial expenditure section. Without their participation, this study would not have been possible. Their names, representative local government or organization, and interview questions are listed in Appendix A.

59
Why This Study Now? The Denver region’s housing market garnered media attention in 2013 and 2014 around its recovery from the recession. This has brought national investors into the market, particularly for multi-‐family development acquisitions. This investor attention is due in part to the region’s historically low vacancy rates and rising rents, as reported by the Metro Apartment Association. Many apartment units have been built in the past year, and many are still under construction. However, all of these units brought to the market are unlikely to have a significant impact on vacancy rate and rents because new households continue to enter the region at a faster pace. In short, Denver is experiencing a perfect storm for real estate values because the region is an attractive place for people to live, is experiencing relatively robust job growth, and is lagging in new housing unit production. All of this bodes well for those who had previously invested in real estate, but once a wider view is exposed, another perspective emerges. Some national media outlets have described the phenomenon a “dual economy.” In this dual economy, a significant number of households are experiencing a very different set of challenges due to rising housing costs pushing them into cost-‐burdened status, meaning they are spending more than 30% of their incomes on housing. And, affordability in housing is emerging as an issue across all income segments. Affordability does not always have to reference subsidized housing because, increasingly, middle-‐income households are housing cost burdened. As increasing numbers of households at every income level struggle with housing affordability, there are impacts that reach beyond those specific to the households. This study explores one of the societal impacts of the decline in housing affordability; the fiscal impact to the local governments that are home to the increasing numbers of housing-‐challenged households. Specifically, are local governments in suburban communities prepared to continue dealing with an increasingly housing-‐challenged population? Can these local governments successfully provide human services infrastructures that have previously only existed in the urban core, and historically only been provided at a county level? Are local governments aware that in addition to the public expenditure pressures presented by housing-‐challenged households, that public revenues too are adversely impacted as these same households reduce other consumption in order to meet their housing needs? This study explores these questions in the context of Adams County, Colorado, a suburban county just outside Denver. Adams County: A Profile Adams County is located in the Denver Metropolitan northeast region, bordering Arapahoe, Broomfield, Denver and Jefferson Counties to the west and south. See Appendix B for a map. Adams County was selected to serve as a case study for this inquiry based on a few considerations:
• It has multiple municipalities to allow for diverse perspectives on what is happening at the local government level to address the needs of cost-‐burdened households.
• According to the 2011-‐2013 American Community Survey, Adams County had approximately 16% of the Denver region’s population and families, yet approximately 20% of families living in poverty. The only other county where this imbalance occurs is in Denver.
• According to the Denver Regional Council of Governments, Adams County will have a population of approximately 840,000 in 2035, i.e. the largest of any county in the region.
Housing cost-‐burdened: Any household that spends more than 30% of its income on housing.

60
• Much has been mentioned anecdotally about Adams County holding a higher relative share of affordable housing stock, when considering market rate affordable housing, in the region.
County Population Picture Adams County is a suburban county in the Denver region. There are nine municipalities located in the county, among which six1 straddle into neighboring counties. They include:
Adams County Municipalities, Population Share 2013 Source: Colorado State Demography Office, Draft 2013 Estimates
Adams County, and the region as a whole, has experienced continued population growth since the Great Recession ended in 2009. As shown in Table 1, the number of new households that entered Adams County between 2010 and 2013 outpaced new housing production by a factor of 3.5. Adams County also experienced the largest share of the region’s increase in suburban poverty since 2000, of over 28,000 people.2 Table 1: Adams County Growth since the Great Recession
2010 2013 Growth
Total Population 441,603 468,686 27,083
Total Households 153,764 163,189 9,425
Housing Units 163,136 165,775 2,639 Source: Census 2010: US Census Bureau, Colorado State Demography Office, Draft 2013 Estimates
Colorado and the Denver region will continue to be an attractive place for people to locate, and this is evident in the 2035 forecasted numbers. Due to various reasons, the primary one being available land area, Adams County is anticipated to become the most populous county in the Denver region by 2035, as seen in Table 2. The City and County of Denver, in fact, will be the third largest county, behind Arapahoe County.
1 Arvada, Aurora, Bennett, Brighton, Northglenn and Westminster are partially within Adams County. 2 Based on Brookings Institution definition of suburbanization of poverty.
Arvada 1%
Aurora 9% Bennett
0.4% Brighton
8%
Commerce City 11%
Federal Heights
2% Northglenn
8% Thornton
27%
Westminster 14%
Unincorporated 20%

61
Table 2: Denver Region Forecast
2000 2010 2010 Share 2035 Growth 2010-‐2035 2035 Share
Adams 351,735 441,601 15.8% 839,470 90.1% 20.0% Arapahoe 490,722 572,003 20.4% 833,097 45.6% 19.9% Boulder 276,255 294,990 10.5% 388,835 31.8% 9.3%
Broomfield 38,544 55,889 2.0% 100,916 80.6% 2.4% Denver 556,738 601,466 21.5% 777,160 29.2% 18.5% Douglas 180,510 285,614 10.2% 533,133 86.7% 12.7% Jefferson 526,718 534,744 19.1% 720,088 34.7% 17.2% Region 2,421,222 2,797,896 4,192,699
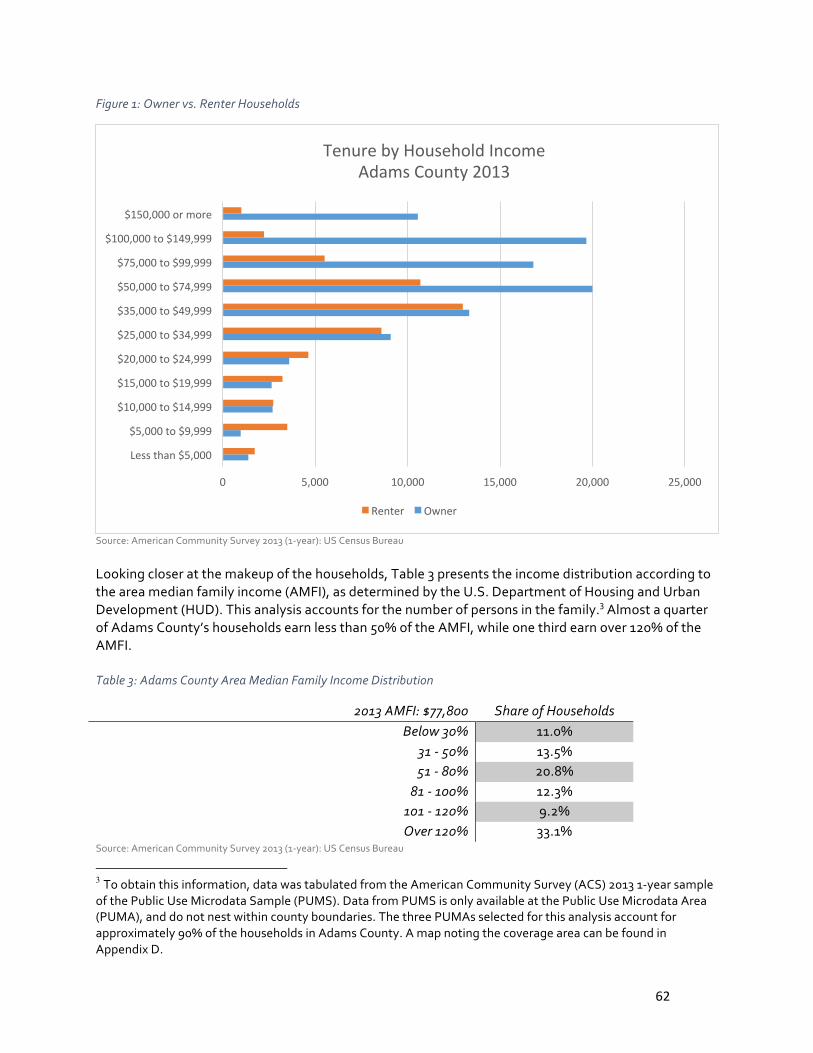
Source: Census 2010: US Census Bureau, Denver Regional Council of Governments C2 2010 Forecast What is the household distribution across income and tenure? According to the chart below, when looking at Adams County households earning above $50,000, there are 3.5 times more homeowners than renters. However, when looking at households earning less than $50,000, the number of homeowners versus renters is almost equal. Some of this parity can be attributed to the type of housing stock that is available throughout the county, particularly manufactured-‐owned homes that have much lower valuation.
62
Figure 1: Owner vs. Renter Households
Source: American Community Survey 2013 (1-‐year): US Census Bureau
Looking closer at the makeup of the households, Table 3 presents the income distribution according to the area median family income (AMFI), as determined by the U.S. Department of Housing and Urban Development (HUD). This analysis accounts for the number of persons in the family.3 Almost a quarter of Adams County’s households earn less than 50% of the AMFI, while one third earn over 120% of the AMFI. Table 3: Adams County Area Median Family Income Distribution
2013 AMFI: $77,800 Share of Households Below 30% 11.0%
31 -‐ 50% 13.5% 51 -‐ 80% 20.8%
81 -‐ 100% 12.3% 101 -‐ 120% 9.2% Over 120% 33.1%
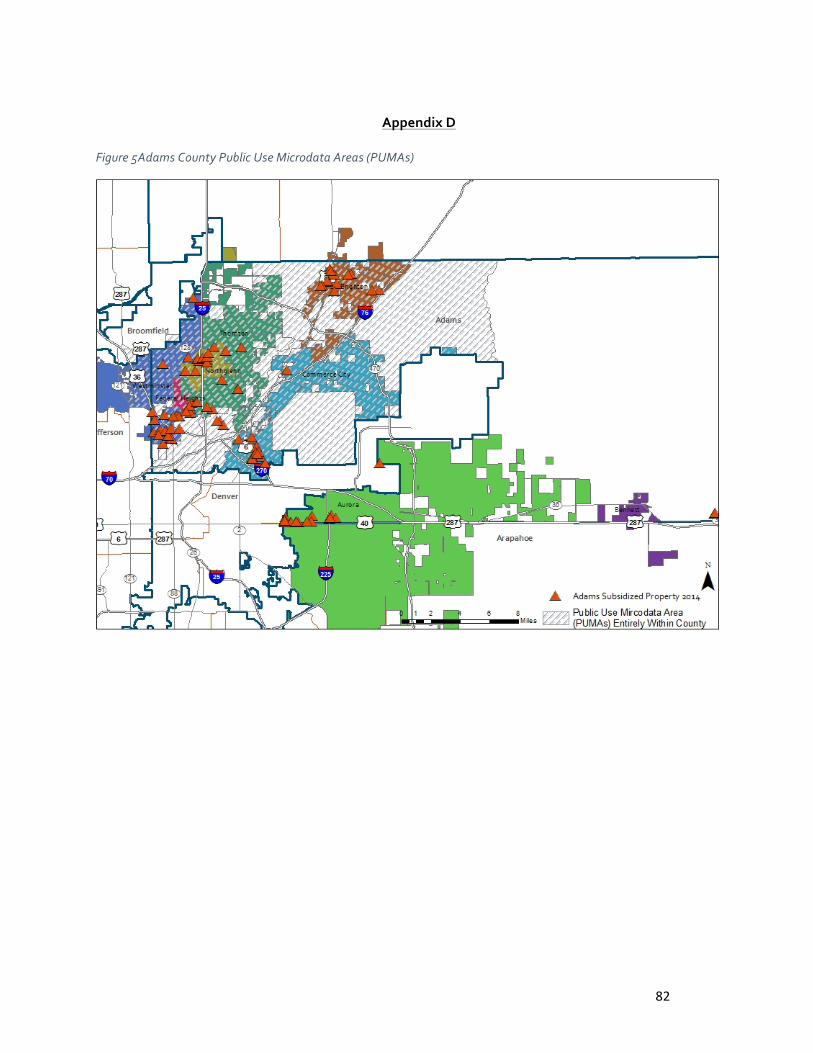
Source: American Community Survey 2013 (1-‐year): US Census Bureau 3 To obtain this information, data was tabulated from the American Community Survey (ACS) 2013 1-‐year sample of the Public Use Microdata Sample (PUMS). Data from PUMS is only available at the Public Use Microdata Area (PUMA), and do not nest within county boundaries. The three PUMAs selected for this analysis account for approximately 90% of the households in Adams County. A map noting the coverage area can be found in Appendix D.
0 5,000 10,000 15,000 20,000 25,000
Less than $5,000
$5,000 to $9,999
$10,000 to $14,999
$15,000 to $19,999
$20,000 to $24,999
$25,000 to $34,999
$35,000 to $49,999
$50,000 to $74,999
$75,000 to $99,999
$100,000 to $149,999
$150,000 or more
Tenure by Household Income Adams County 2013
Renter Owner
63
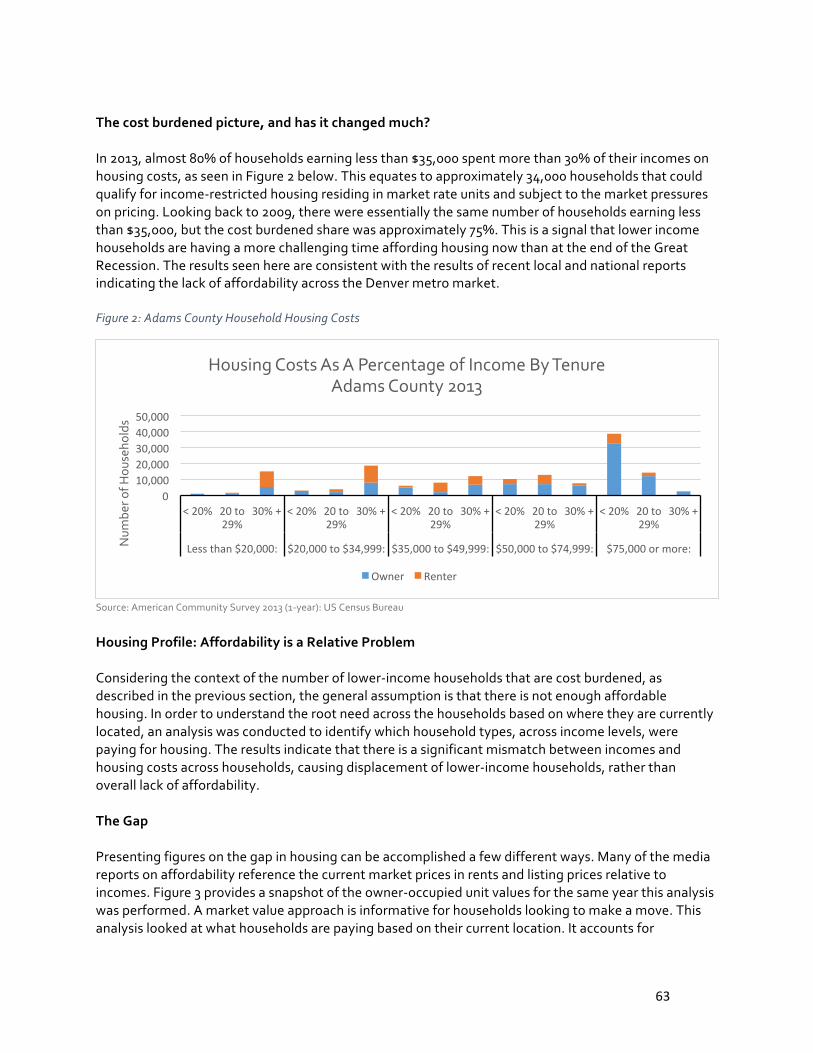
The cost burdened picture, and has it changed much? In 2013, almost 80% of households earning less than $35,000 spent more than 30% of their incomes on housing costs, as seen in Figure 2 below. This equates to approximately 34,000 households that could qualify for income-‐restricted housing residing in market rate units and subject to the market pressures on pricing. Looking back to 2009, there were essentially the same number of households earning less than $35,000, but the cost burdened share was approximately 75%. This is a signal that lower income households are having a more challenging time affording housing now than at the end of the Great Recession. The results seen here are consistent with the results of recent local and national reports indicating the lack of affordability across the Denver metro market. Figure 2: Adams County Household Housing Costs
Source: American Community Survey 2013 (1-‐year): US Census Bureau
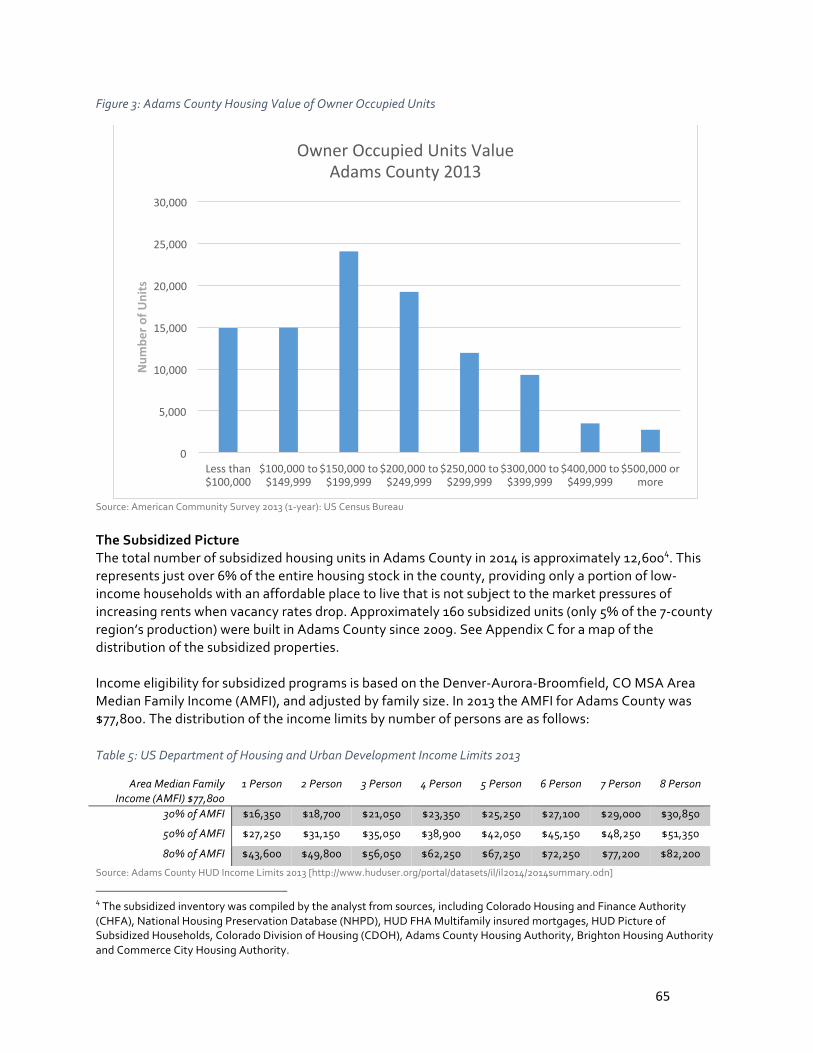
Housing Profile: Affordability is a Relative Problem Considering the context of the number of lower-‐income households that are cost burdened, as described in the previous section, the general assumption is that there is not enough affordable housing. In order to understand the root need across the households based on where they are currently located, an analysis was conducted to identify which household types, across income levels, were paying for housing. The results indicate that there is a significant mismatch between incomes and housing costs across households, causing displacement of lower-‐income households, rather than overall lack of affordability. The Gap Presenting figures on the gap in housing can be accomplished a few different ways. Many of the media reports on affordability reference the current market prices in rents and listing prices relative to incomes. Figure 3 provides a snapshot of the owner-‐occupied unit values for the same year this analysis was performed. A market value approach is informative for households looking to make a move. This analysis looked at what households are paying based on their current location. It accounts for
0 10,000 20,000 30,000 40,000 50,000
< 20% 20 to 29%
30% + < 20% 20 to 29%
30% + < 20% 20 to 29%
30% + < 20% 20 to 29%
30% + < 20% 20 to 29%
30% +
Less than $20,000: $20,000 to $34,999: $35,000 to $49,999: $50,000 to $74,999: $75,000 or more: Num
ber o
f Hou
seho
lds
Housing Costs As A Percentage of Income By Tenure Adams County 2013
Owner Renter

64
households that locked into payments years ago and now reflect a very affordable payment as a result of an increase in income. An obvious gap exists, at over 6,300 units, for renters earning below 30% of the AMFI, as seen in Table 4. This is the most challenging type of housing to build from financing standpoint, requiring the largest public subsidies. What is interesting is that there is a surplus in owner-‐based units for households earning below 30% of the AMFI. This is a function of the number of manufactured units in the county. It should be noted that this analysis does not account for a quality measure of the housing stock, which could call to question the manufactured housing contribution. Combining the household income and housing expenditure data exposed a surprising detail that the overall mismatch numbers do not immediately reveal when considering the cost burdened figures. Table 4 depicts a surplus in units for households earning between 51 – 80% of AMFI and a deficit for households earning over 120% of AMFI, for both renters and owners. On the surface it appears there is adequate affordable housing stock for households earning between 51 – 80% of AMFI. The problem rests in the fact that there is an overall mismatch, which causes displacement of lower-‐income households by higher-‐income ones, who occupying less expensive units. In many cases this situation causes further housing stress on cost-‐burdened households. Table 4: Adams County Rental & Owner Gap by Area Median Family Income: $77,800
Renters Units: Surplus <Deficit> Below 30% <6,360>
31 -‐ 50% 412 51 -‐ 80% 12,918
81 -‐ 100% <562> 101 -‐ 120% <1,166> Over 120% <5,102>
Owners Units: Surplus <Deficit>
Below 30% 8,851 31 -‐ 50% 472 51 -‐ 80% 10,012
81 -‐ 100% 7,058 101 -‐ 120% 3,458 Over 120% <29,221>
Source: American Community Survey 2013 (1-‐year): US Census Bureau
65
Figure 3: Adams County Housing Value of Owner Occupied Units
Source: American Community Survey 2013 (1-‐year): US Census Bureau
The Subsidized Picture The total number of subsidized housing units in Adams County in 2014 is approximately 12,6004. This represents just over 6% of the entire housing stock in the county, providing only a portion of low-‐income households with an affordable place to live that is not subject to the market pressures of increasing rents when vacancy rates drop. Approximately 160 subsidized units (only 5% of the 7-‐county region’s production) were built in Adams County since 2009. See Appendix C for a map of the distribution of the subsidized properties. Income eligibility for subsidized programs is based on the Denver-‐Aurora-‐Broomfield, CO MSA Area Median Family Income (AMFI), and adjusted by family size. In 2013 the AMFI for Adams County was $77,800. The distribution of the income limits by number of persons are as follows: Table 5: US Department of Housing and Urban Development Income Limits 2013
Area Median Family Income (AMFI) $77,800
1 Person 2 Person 3 Person 4 Person 5 Person 6 Person 7 Person 8 Person
30% of AMFI $16,350 $18,700 $21,050 $23,350 $25,250 $27,100 $29,000 $30,850
50% of AMFI $27,250 $31,150 $35,050 $38,900 $42,050 $45,150 $48,250 $51,350
80% of AMFI $43,600 $49,800 $56,050 $62,250 $67,250 $72,250 $77,200 $82,200
Source: Adams County HUD Income Limits 2013 [http://www.huduser.org/portal/datasets/il/il2014/2014summary.odn]
4 The subsidized inventory was compiled by the analyst from sources, including Colorado Housing and Finance Authority (CHFA), National Housing Preservation Database (NHPD), HUD FHA Multifamily insured mortgages, HUD Picture of Subsidized Households, Colorado Division of Housing (CDOH), Adams County Housing Authority, Brighton Housing Authority and Commerce City Housing Authority.
0
5,000
10,000
15,000
20,000
25,000
30,000
Less than $100,000
$100,000 to $149,999
$150,000 to $199,999
$200,000 to $249,999
$250,000 to $299,999
$300,000 to $399,999
$400,000 to $499,999
$500,000 or more
Num
ber o
f Units
Owner Occupied Units Value Adams County 2013

66
Local Government Finance Impacts As the data from Adams County suggest, communities across Colorado are home to increasing numbers of households that are housing cost constrained. While many studies address the direct effect of housing cost strain on the specific household, few look deeply into the broader economic and budgetary effects that result from housing cost pressures. In this study, we sought to better understand one of these effects; specifically, what are the fiscal effects of housing cost-‐constrained households on the local governments in which these households live? Through a combined approach of first person interviews with officials from the local governments in Adams County and an analytic review of revenue and spending data, we profiled some of the lesser acknowledged impacts on local government. The sections below outline both the expenditure and revenue stresses that housing-‐constrained households are beginning to place on local government budgets. Given the limitations of a single county analysis, the following sections should be taken as illustrative rather than as a definitive description of universal impacts across all local governments. However, the findings from this analysis clearly demonstrate that the lack of affordable housing options is having true effects that extend beyond those to the specific households. The Expenditure Side The County Perspective: A View from Adams County As outlined in the Code of Colorado Regulations, Adams County operates Human Services programs as funded through the state. Program offerings designed specifically to support low-‐income families include:
• Aid to the Needy Disabled (AND) • Burial Assistance • Child Care Assistance Program • CHOICES/Advancement Plus Program • Food Assistance Program • Head Start • Low Income Energy Assistance Program (LEAP) • Medicaid and Medical Assistance • Old Age Pension (OAP) • Supplemental Security Income/Colorado Supplement (SSI/CS) • Temporary Assistance to Needy Families (TANF)
As increasing numbers of households become financially strained by the cost of housing, the county programs listed above also begin to experience pressure. And, in many cases, although these services are supported with state and federal dollars, they also require county financial support. As the demand for programs increases, so does the demand on county budgets. Much of the impact identified by Adams County officials, and summarized below, deals with how housing cost stress ultimately affects county expenditures and service provision. Connection to Services Instituted by Ordinance/City Council Based on Resident Need Among all of the low-‐income based programs, TANF funds provide the most direct housing cost-‐burden relief by allowing recipients to use the funds for emergency services, house, and utility

67
payments. Some of these federal programs do impact the general fund in that there is a match requirement, specifically for TANF (15-‐17%), Child Welfare (20%), CORE (Mental Health Services for Children) (20%), and County Administration (20%). In recent years, the number of participating households has increased, further increasing the absolute match the county must expend from its general fund. For instance, Supplemental Nutrition Assistance Program (SNAP) allocations have almost tripled from 2008 ($33m) to 2013 ($90m). Half of the health and welfare expenditure line item in Adams County’s budget is from SNAP. As seen in Table 6, Adams County had a per capita change from 2008 -‐ 2013 in SNAP allocations. Table 6: Change in SNAP Allocations
2008-‐2013 Per Capita Change Adams County 2.43
Source: Analyst calculations of County Comprehensive Financial Reports (CAFR) and Colorado State Demography Office Population Estimates
Understanding Service Cost Structure Federal programs’ match requirements call attention to the impact the increase in participation is having on the County’s general fund. Because the required social services fund is funded through a portion of the property tax mill levy, it relies on a balance of property values to entitlement program participants. For example, in 2008 in Adams County, the fund had a surplus of about $20m, and now, in 2014, the fund will end the year with $7.2m in reserves. State dollars to help fund the administrative costs over the years have fallen short. The result, and ultimate impact to residents, is longer wait times for people to obtain support because the county cannot add more staff. The residents who need the assistance the most cannot necessarily take advantage of applying online if they don’t have internet access at home. Medicaid is the other expenditure item that is anticipated to continue to increase the budget, and, as a result of its match requirement, will be in a $3-‐4m deficit. How does property tax revenue’s very slow growth fit into the equation? The challenge on the mill levy side is revenues are only up 0.2% on property tax, and, in previous years, revenues were negative. “The mill levy for Human Services remains at 2.353 and has been so since 2005.”5 When looking across the last decade, Adams County property tax revenues have only averaged about a 3% increase. From the County’s perspective, it has to continue figuring out how to be more efficient. Even if the SNAP and Medicaid participation rates stay constant, the fund reserve will continue to decrease as a result of lagging property valuation, and continue to require transfers from the general fund. Identifiable Housing Expenditures Adams County has budgeted $130,000 for 2015 from its general fund to the Adams County Housing Authority (ACHA) for foreclosure prevention services, an increase from approximately $65,000 the prior year. This allocation has helped ACHA close the gap in needed funds for the program. According to ACHA, it anticipates an increase in foreclosure activities in the coming year due to renewed efforts by
5 Adams County 2014 Consolidated Annual Financial Report.
A structural imbalance exists with county fund reserves that provide the required match for basic human services. Increased participation in human services programs coupled with lagging property valuation renders an unsustainable fiscal situation for the county.

68
banks to clear their balance sheets. Table 7 outlines the attendance at ACHA-‐offered workshops, as of November 2014. Table 7: Adams County Housing Authority Workshop Attendance
2014 YTD Rent & Utility 610 Foreclosure 172
First Time Homebuyer Education 370 Source: Adams County Housing Authority According to ACHA, the agency has seen not only an increased number of residents in need of assistance but a wider demographic, particularly those who have not previously accessed the county’s services. In respect to people seeking assistance from the county human services, ACHA has observed an increase in the number of people coming to the county building where ACHA offices are located. ACHA tracks the number of inquiries for service as identified in the Table 8 below. Table 8: Adams County Housing Authority Phone Calls/Walk-‐in Traffic
2014 YTD
Section 8 Participant/Landlord 10,089
Section 8 Wants to Apply/ Are We Open 5,753
Previous Lottery App. Questions 376
Subsidy Information Request 864
Actual client of Housing Counseling 1,904
Deposit Assistance 128
Rent Assistance 1,791
Utility Assistance 347
Mortgage Assistance 107
HA Apartment Complaints 129
Resources for Legal Issues 206
Resources for Home Repairs 34
Emergency Housing 796
Housing for Disabled 289
Housing for Seniors 333
Housing for Felons 64
Housing for Pregnant Women 10
Misc. 2,520 Source: Adams County Housing Authority In terms of housing assistance, ACHA operates a lottery for the rental voucher system. The lottery is a time when ACHA is “open for business” to receive new residents. In 2013, ACHA distributed more than 5,000 applications, of which it only helped 120-‐150 of the applicant households, primarily because of households leaving the county. ACHA then keeps a few hundred of the applications throughout the year to pull from when a voucher becomes available. There is about a 40% success rate from the waitlist

69
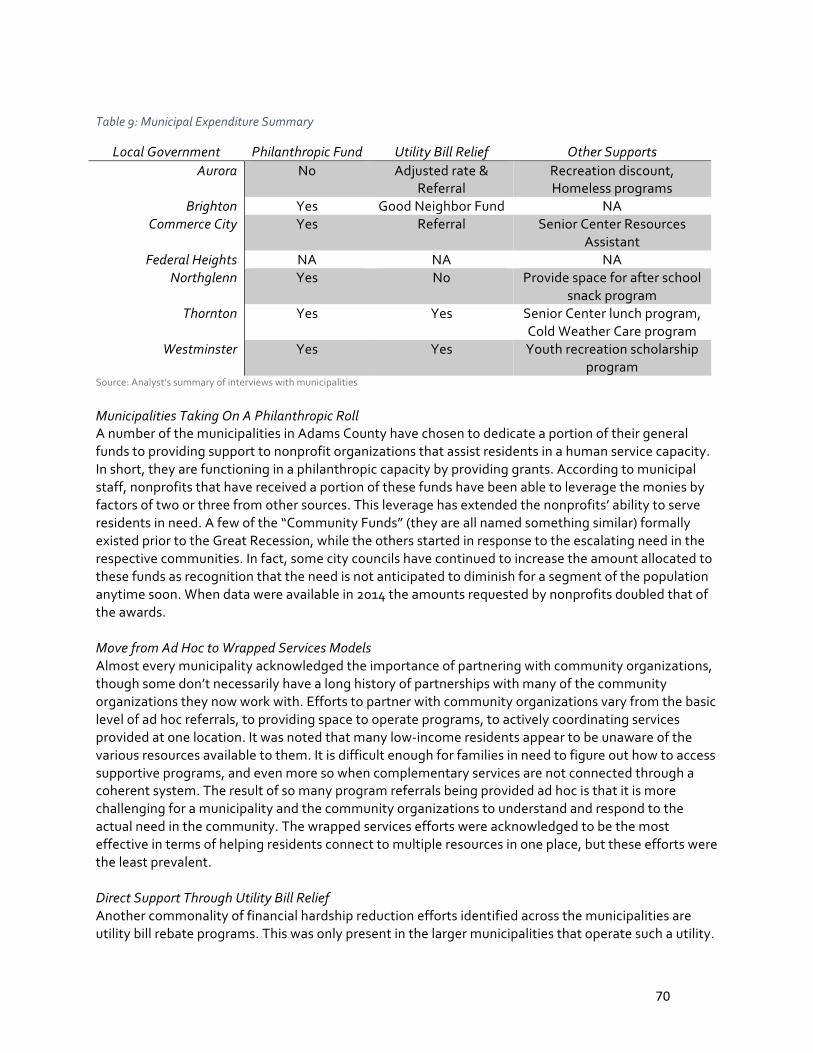
reserve, which is more than adequate to ensure any available vouchers get used. What this does mean is about 60% of the reserve applicants either cannot be contacted with the available information, or they end up not being eligible, alluding to the fact that the low-‐income population seeking affordable housing is constantly moving because their situations are so volatile. Rent vouchers are limited, and housing authorities work closely together to refer applicants to other counties or municipalities that might have availability. Vouchers are the unique housing support program that stays with the qualifying household. When a household receives a voucher, the only geographical requirement is the recipient must stay in the original issuant jurisdiction for the first year. After that year, they can move. If a move occurs, two things can happen with the voucher tracking based on HUD’s portability process. One is the receiving jurisdiction can administer the voucher on the behalf of the originating jurisdiction, allowing the voucher count to remain with the originating jurisdiction. The other way the voucher can be treated is through a swap of slots between jurisdictions, which is what ACHA has been experiencing lately. This type of exchange, however, doesn’t necessarily get to the issue of helping Adams County residents. Adams County Housing Authority Coordinating Wrapped Human Services: But Funding is Unsustainable A couple of years ago on a site at the intersection of 71st & Federal by Terrace Gardens, Adams County Housing Authority offered some of its community partners some temporary satellite space during redevelopment planning. Today the collection of organizations have become self-‐organized, yet they are getting some incredible results with connecting low-‐income residents to resources. Much of the success is attributed to the more personal experience these organizations provide to people seeking assistance or additional resources, compared to the main human services lobby at the County offices. Currently, ACHA is subsidizing the effort, but it is not a financially-‐sustainable model. The irony is that this is probably the prototype model for all counties, but lack of sustainable funding, coupled with increased demand, may render it a necessity. The Municipal Perspective: A View from Aurora, Thornton, Westminster, Northglenn, Brighton and Commerce City Municipalities that are located wholly or partially within Adams County vary in structure in terms of the level of services they provide to residents. Some provide a full suite of services, including water-‐based utilities, while others that are smaller only provide a few core services, such as safety and community development. Even with varying levels of service, some similarities appear across municipalities with respect to what is being done to provide additional support with general funds to residents who are struggling financially. While the amounts are not major line items in the overall municipal budgets, they do exist and represent an awareness of need in the community. There are also varying levels of perspective on the urgency of the situation for residents. One example that has shed light on the severity of need in one municipality is the recent increase in 911 calls asking for assistance with accessing basic health care. Comparatively, another municipality observed its peak of need about three to four years ago because of the foreclosure crisis, but, generally speaking, the municipality has always had high need. A summary of the general fund-‐supported programs offered by Adams County municipalities that support low-‐income households follows in Table 9.
70
Table 9: Municipal Expenditure Summary
Local Government Philanthropic Fund Utility Bill Relief Other Supports Aurora No Adjusted rate &
Referral Recreation discount, Homeless programs
Brighton Yes Good Neighbor Fund NA Commerce City Yes Referral Senior Center Resources
Assistant Federal Heights NA NA NA
Northglenn Yes No Provide space for after school snack program
Thornton Yes Yes Senior Center lunch program, Cold Weather Care program
Westminster Yes Yes Youth recreation scholarship program
Source: Analyst’s summary of interviews with municipalities Municipalities Taking On A Philanthropic Roll A number of the municipalities in Adams County have chosen to dedicate a portion of their general funds to providing support to nonprofit organizations that assist residents in a human service capacity. In short, they are functioning in a philanthropic capacity by providing grants. According to municipal staff, nonprofits that have received a portion of these funds have been able to leverage the monies by factors of two or three from other sources. This leverage has extended the nonprofits’ ability to serve residents in need. A few of the “Community Funds” (they are all named something similar) formally existed prior to the Great Recession, while the others started in response to the escalating need in the respective communities. In fact, some city councils have continued to increase the amount allocated to these funds as recognition that the need is not anticipated to diminish for a segment of the population anytime soon. When data were available in 2014 the amounts requested by nonprofits doubled that of the awards. Move from Ad Hoc to Wrapped Services Models Almost every municipality acknowledged the importance of partnering with community organizations, though some don’t necessarily have a long history of partnerships with many of the community organizations they now work with. Efforts to partner with community organizations vary from the basic level of ad hoc referrals, to providing space to operate programs, to actively coordinating services provided at one location. It was noted that many low-‐income residents appear to be unaware of the various resources available to them. It is difficult enough for families in need to figure out how to access supportive programs, and even more so when complementary services are not connected through a coherent system. The result of so many program referrals being provided ad hoc is that it is more challenging for a municipality and the community organizations to understand and respond to the actual need in the community. The wrapped services efforts were acknowledged to be the most effective in terms of helping residents connect to multiple resources in one place, but these efforts were the least prevalent. Direct Support Through Utility Bill Relief Another commonality of financial hardship reduction efforts identified across the municipalities are utility bill rebate programs. This was only present in the larger municipalities that operate such a utility.
71
All of the programs are income qualified and capped at a maximum yearly benefit. Westminster and Thornton’s programs were implemented in response to the Great Recession’s impact on residents. After six cycles of the program, Thornton has continued to see the number of households taking advantage of the benefit increasing, while Westminster has seen its numbers vary. It is impossible to say at this point why there is an almost divergent participation in neighboring municipalities. In response to the sensitivity that utility expenses have on low-‐income household budgets, Aurora inquired about the affordability of its water rates in 2013. The result of the inquiry was the creation of a tiered cost structure based on utilization, employing the assumption that more expensive single family properties tend to use more water, while smaller and multifamily properties tend to use less. Brighton has a senior water rate, but is getting ready to remove it, because it felt the program was not equitable. As its replacement, Brighton is setting up a new program called the “good neighbor fund” to pool donations from residents opting to add money to their own utility bill payment. Details remain to be determined on how the monies collected will be distributed, but qualified low-‐income families will be the recipients. Other Support Solutions The aging baby boom generation is a well-‐known demographic shift underway in the Denver region. Households preparing to retire will largely be facing fixed incomes, and many will be forced to deal with all the vulnerabilities that come with it. Municipalities have acknowledged the need to support their senior population through a variety of ways. Commerce City’s City Council recently approved the addition of a part-‐time position at its Senior Center. This position, a resources assistant, works exclusively with seniors to help them find resources of any kind. Outside of seasonal fluctuations, the highest reported need is for housing that is affordable on an income consisting primarily of Social Security. Even with a newly dedicated resource for seniors, the need remains high to support seniors with age-‐related lifestyle changes, such as downsizing a household, health challenges, housing modifications to age in place, etc. Thornton operates a lunch program at its senior center aimed at ensuring low-‐income seniors can eat a nutritious meal at an affordable price. This program has been in place since the 1980s, and it’s an example that Thornton City Council is committed to funding the program without the expectation to recover the costs, because it recognizes its benefits from a social needs perspective. Thornton also has a rebate program for low-‐income senior residents. It refunds sales tax paid on groceries, property tax, and a certain amount if seniors rent. The refund has been in place for a number of years, but the terms of its requirements have not been modified recently to adjust for current conditions. Other examples of programs or efforts that primarily benefit low-‐income households range from recreation center operations subsidies to youth recreation scholarships, and providing space for community organizations to offer after-‐school snacks to children. Finally, the cold weather care program (operated from the end of October – April) is a housing the homeless program that uses area churches as emergency shelters in an effort to reduce the number of people staying in their cars because shelters are at capacity. Because churches had not been allowed to serve as shelters, Thornton changed its land use code to allow this program to operate. Program participants can also utilize the city’s community center for its facilities (showers, etc.). According to Thornton, the program has

72
observed a reduction of Thornton residents served, but, interestingly, an increase in people whose last permanent address was out-‐of-‐state. Identifiable Housing Expenditures Few municipalities allocate general funds directly to housing-‐related programs outside of any match requirement. But there are a few that should be highlighted. Aurora allocates general funds to specific homeless programs, established through ordinance. The longest-‐standing allocation is from the traffic ticket revenue-‐based Nexus Program. Nexus funds four programs, including Aurora’s emergency shelters. The revenue for the program has remained stable over the years, allocating approximately $650,000. Additionally, the proposed 2015 budget has a line item to obligate $235,000 in general funds for service improvement at the Comitis emergency shelter. It is being presented as a cost-‐effective expenditure, and proposed to be ongoing for future budgets. The other identifiable direct funding Aurora provides around housing is for the Aurora @ Home pilot program aimed at housing displaced or homeless families. The funding allocated for 2015 is approximately $67,000. The program is only able to serve a very small number of families (15-‐25) who are challenged and require intensive support services. When a household that either rents or owns is cost burdened, Thornton reports that the biggest visible community impact is the lack of maintenance of the exterior of the property. To ensure that a neighborhood maintains its external appearance, Thornton administers an abatement program that addresses the amount of code violations a property has been issued due to lack of external maintenance (e.g. overgrown weeds, parked inoperable cars, etc.). As those violations accrue so does the cost to mitigate the situation. The abatement program eventually brings violators to a blight hearing, heard by an associate judge. If the ruling determines the violator is unable to rectify the problem, the city will contract for the needed services (e.g. towing, landscapers, removal of junk). The program initially observed an increase at the height of the foreclosure crisis, but has also seen a constant flow of violations due to fixed-‐income older residents who have become physically unable to maintain their property. The city will only address the exterior of the properties, since owners can leverage entitlement funds to make improvements on deferred maintenance for the interior. In 2014 the program allocated around $54,000 compared to the peak in 2009, where it allocated $60,000. It is also worth noting the type of programs municipalities choose to administer through Community Development Block Grant (CDBG) funds. Additionally, each municipality has been creative with limited resources and has opted to operate housing support programs with Community Development Block Grant (CDBG) funds. Aurora allocates general funds to match HUD HOME funds distributed through the Community Development Services department. This allocation has remained fairly constant, around $200,000 per annum. Northglenn uses its CDBG funds allocated for the Help for Homes program to provide repair and accessibility improvement services to income-‐qualified households. The city council decided to make use of those funds that way because it saw the need in the community. Westminster uses a portion of its CDBG funds to help fund emergency repair services. The city council redirected more to it in 2014 at $90,000 versus years past (80% from previous year), because it saw a

73
general increasing trend in this area of need. The decision was also made because money ran out from the state, and city council approved an adjustment in the policy determining who qualifies. The Revenue Side As described above, local governments increasingly are called upon to provide more services to households that are housing cost-‐burdened. This is placing additional expenditure pressures on local government budgets. But the budgetary effects are not limited to the expenditure side. Cost-‐constrained households are also indirectly affecting local budgets by reducing their consumption of other goods in order to afford housing. For the state’s local governments, many of which are highly dependent on the sales taxes generated from household consumption, this reduction in all other household consumption has an adverse revenue effect on local government budgets as well. The section below uses national and local data to estimate the magnitude of the revenue effect on the totality of local governments in Adams County. Share of Housing-‐Stressed Households Slightly Greater in Adams County than in US Overall Table 10: Summary of Cost-‐Burdened Households Earning Less than $50,000
Cost-‐Burdened Households Earning Less than $20,000 15,160
Cost-‐Burdened Households Earning Between $20,000 and $49,999 30,690 Cost-‐Burdened Households Earning Less than $50,000 45,850
Share of Cost-‐Burdened Households Earning Less than $50,000 29.13% Source: American Community Survey 2013 (1-‐year): US Census Bureau According to the 2013 American Community Survey (1 year survey), there were just under 157,392 households in Adams County. Of those, 29.13%, or 45,850 of them, were low-‐to-‐moderate income (earning less than $50,000/year) and spent more than 30% of their household income on housing (the standard for affordability). Almost three in ten low-‐and-‐moderate income households in the county were housing cost-‐burdened, according to the latest data available. If households at all incomes are included, that share rises to just over three and a half in ten to 35.53%, a slightly higher share in Adams County than for the US overall. According to The Joint Center for Housing Studies at Harvard University (cited at http://www.cbsnews.com/news/millions-‐of-‐u-‐s-‐families-‐cant-‐afford-‐their-‐homes/) by the end of 2012, 35.3% of families were spending more than 30% of their income on housing. And Some of Those Housing-‐Stressed Households Forced to Dedicate up to 25% of Their Income to Covering Housing Costs Above the 30% Affordability Standard Table 11: Additional Annual Household Spending on Housing Required by Income
For an Average Household Earning Less than $20,000 $5,927 For an Average Household Earning Between $20,000 and $49,999 $2,160
Source: Analyst calculation from 2012/2013 Consumer Expenditure Survey data
Combining data from the 2013 American Community Survey and the 2012/13 Consumer Expenditure Survey (national sample), we know that on average households earning less than $20,000/year are

74
spending just over $8,900/year on housing. For households in the $20,000 -‐ $49,999/year cohort, average annual housing expenditures are $13,110. While we do not know the distribution of households in those cohorts nor the distribution of housing costs within those households, we can estimate at the midpoint. Doing so, we determine that households in the under $20,000 income category, at 30% of midpoint, should spend no more than $3,000/year on housing to stay within the affordability standard. For households in the next income cohort ($20,000 -‐ $49,999), the affordability standard at the midpoint is $10,500/year. Comparing those thresholds with the reported spending in the Consumer Expenditure Survey, we determine that the lowest income households dedicate, on average, an additional $5,927 annually to housing. For households in the next cohort up, that additional amount is just over $2,100/year. In the lowest income households, a full 25% of income must be dedicated to supplementing housing costs above the 30% affordability standard. Additional Housing Spending Crowds Out Other Household Spending Table 12: Additional Monthly Household Spending on Housing Required by Income
For an Average Household Earning Less than $20,000 $493.88 For an Average Household Earning Between $20,000 and $49,999 $217.47
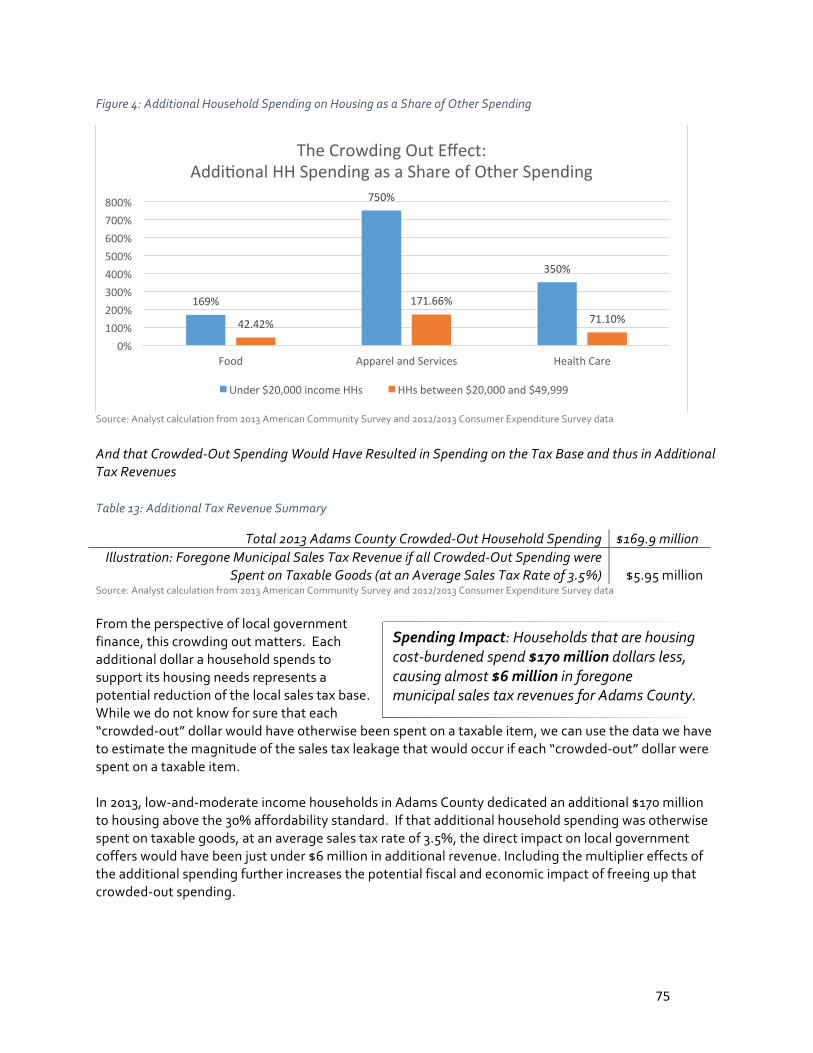
Source: Analyst calculation from 2012/2013 Consumer Expenditure Survey data In 2013, almost 44% of all Adams County households earned less than $50,000/year. Of those, just under two thirds are spending more than the 30% affordability standard for housing. In these households, the additional share of income dedicated to supporting household spending must be crowding out other household spending. While data do not allow us to determine exactly which categories of household spending are crowded out, we do have data that provide an illustrative example of the magnitude of the potential crowding out of major categories of household spending. On average, housing-‐stressed households earning less than $20,000 per year are spending an additional $5,927 annually (over the 30% threshold) to support housing expenses. For households in the $20,000 to $49,000 income cohort, that additional spending falls to $2,160. Regardless of the amount, each of these households is supplementing its housing expenditures with funds that otherwise would be available for basic needs such as health care, food, and apparel and services. For example, at the extreme, households earning under $20,000/year are supplementing their housing costs with an amount that represents 7.5 times what the average household in that age cohort spends annually on apparel and other services. The graph below shows, for this and other categories of spending, the magnitude of the crowding out caused by additional housing expenditures.
75
Figure 4: Additional Household Spending on Housing as a Share of Other Spending
Source: Analyst calculation from 2013 American Community Survey and 2012/2013 Consumer Expenditure Survey data
And that Crowded-‐Out Spending Would Have Resulted in Spending on the Tax Base and thus in Additional Tax Revenues Table 13: Additional Tax Revenue Summary
Total 2013 Adams County Crowded-‐Out Household Spending $169.9 million Illustration: Foregone Municipal Sales Tax Revenue if all Crowded-‐Out Spending were
Spent on Taxable Goods (at an Average Sales Tax Rate of 3.5%)
$5.95 million Source: Analyst calculation from 2013 American Community Survey and 2012/2013 Consumer Expenditure Survey data From the perspective of local government finance, this crowding out matters. Each additional dollar a household spends to support its housing needs represents a potential reduction of the local sales tax base. While we do not know for sure that each “crowded-‐out” dollar would have otherwise been spent on a taxable item, we can use the data we have to estimate the magnitude of the sales tax leakage that would occur if each “crowded-‐out” dollar were spent on a taxable item. In 2013, low-‐and-‐moderate income households in Adams County dedicated an additional $170 million to housing above the 30% affordability standard. If that additional household spending was otherwise spent on taxable goods, at an average sales tax rate of 3.5%, the direct impact on local government coffers would have been just under $6 million in additional revenue. Including the multiplier effects of the additional spending further increases the potential fiscal and economic impact of freeing up that crowded-‐out spending.
169%
750%
350%
42.42%
171.66% 71.10%
0% 100% 200% 300% 400% 500% 600% 700% 800%
Food Apparel and Services Health Care
The Crowding Out Effect: AddiUonal HH Spending as a Share of Other Spending
Under $20,000 income HHs HHs between $20,000 and $49,999
Spending Impact: Households that are housing cost-‐burdened spend $170 million dollars less, causing almost $6 million in foregone municipal sales tax revenues for Adams County.

76
What efforts are attempting to address the gap? In the wake of the great recession local governments have recognized that economic recovery alone will not address the gap in affordability of the housing stock. As a result efforts are underway to bring new housing into the community through direct expenditures as well as foregone revenues. The following are some highlights from various municipalities in Adams County. The Commerce City Housing Authority recently purchased some parcels to investigate future options of senior affordable product. The city is also entering into the planning stages for another sizable redevelopment project that would include some affordable housing. Aurora has been able to assemble project capital costs through tax credits and grants to build a new supportive housing project on a property close to the Fitzsimons Life Science District. Even with capital costs identified, the subsidized operation costs are still unknown, so the property can accommodate households earning less than 30% of AMI. Additionally, Aurora had two recent affordable housing projects where fees were waived, amounting to approximately $300,000 each, in an effort to move the projects forward. Brighton looks at housing developments with an eye towards affordability. It is a high priority for the city to have affordable living options. It recognizes the role that local regulations play in achieving a vibrant community, as well as possible unintended consequences that could raise housing prices to unaffordable levels. Recently, Brighton saw a trend in housing development where there were not enough units being built at affordable price points. Development staff then worked with the mayor to build an “attainable housing matrix.” This matrix set specific incentives throughout the development process across various income levels. In short, it saves developers real dollars, and time, which also translates into dollars. Brighton has followed through with implementing the incentives by working with housing developers from the beginning of the project, and foregoing the development fees. One notable example is Hughes Station, Brighton’s first affordable apartment development. It benefitted from the monies saved on the front end of the process, making the project a reality. The matrix has been leveraged on a few additional projects, amounting to approximately $2 million worth of offsets. Brighton had previously explored other affordable housing policies, such as an inclusionary housing ordinance (IHO), but it didn’t feel it had the same effect. The goal is to incorporate the matrix concept into all types of projects with for-‐profit developers. Essentially the question is, “how can Brighton look at the market like the Home Builders Association (HBA) does when considering housing teachers, firefighters, and other essential roles for a vibrant community?” Another element Brighton is focused on is sustainable development, and how it relates to reducing total cost burden on households. The goal is to have efficient housing units with very low utility payments, so people can move into a new home and afford the operation costs. Again, Brighton set incentives on the energy/operation savings side of the development process. It took almost three years to get the incentives approved by city council, and has resulted in big upfront dollars ($2 million) in incentives that are a direct impact to homeowners.

77
Closing Thoughts and Further Questions While the results of this study can only be considered illustrative, it can be inferred that other counties in the state face similar pressures. The major trends discovered in Adams County are:
• There is a structural imbalance in county fund reserves to provide the required match for basic human services. This is a situation that cannot be sustained forever.
• Historically, counties have served as the vehicle for funding and administering human services. Recent demand has prompted spending on human services at the county and municipal levels.
• Municipalities have been exposed to increasing pressure to enter the human services funding game by outsourcing those services to community-‐based organizations via philanthropic grant making with general funds.
• Related, some municipalities have decided to forego revenues in the form of development incentives in an attempt to mitigate the affordability issue on the front end by encouraging developments for lower-‐income households.
• There is approximately $170 million in crowded out spending, translating to $6 million in lost revenue impact to municipalities. Households that are cost-‐burdened have a dampening economic effect on sales tax revenues, the major source of general funds revenues for municipalities.
These findings represent the beginning rather than the end of investigations into the myriad of effects that lack of housing affordability is placing on the state and local economy and fiscal position. Our selection of Adams County as a starting point was with the intention of highlighting issues that should be further studied for their consistency across the state. We firmly believe that Adams County is not alone in the pressures it is feeling, but only further study can confirm our belief. But in the interim, this study, by highlighting the issues in a one county case study, will hopefully deepen awareness of the lesser known effects of the lack of housing affordability and as a result deepen the conversation around finding solutions for overall affordability of housing across the state.

78
Bibliography
Joint Center for Housing Studies of Harvard University (2014) The State of the Nation’s Housing. Cambridge, MA Pankratz, H. (2014) Rents soar as apartment vacancies in metro Denver near all-‐time high. Denver Post, 30th Oct. 2014. Available from: http://www.denverpost.com/business/ci_26793927/undefined?source=infinite [Accessed 10/30/14]. Pankratz, H. (2014) Home affordability for metro Denver middle class slipping away. Denver Post, 18th Nov. 2014. Available from: http://www.denverpost.com/business/ci_26960668/home-‐affordability-‐middle-‐class-‐slipping-‐away [Accessed 11/19/14]. Storum, D. (2014) Panel: Lack of affordable housing hurts economic development. BizWest, 2nd Oct. 2014. Available from: http://bizwest.com/category/industry-‐news/real-‐estate-‐industry-‐news/ [Accessed 10/3/14]. Svaldi, A. (2014) Delwest sees a market in affordable apartments for Denver. Denver Post, 19th Sept. 2014. Available from: http://www.denverpost.com/business/ci_26563149/delwest-‐sees-‐market-‐affordable-‐apartments-‐denver?source=infinite [Accessed 9/20/14].

79
Appendix A
Local Government Name Title
Adams County Richard Lemke Director of Finance Adams County Housing Authority Donald May,
Peter LiFari Executive Director, Deputy Director
Aurora Jason Batchelor, Signy Mikita
Director of Finance, Community Development Planner
Brighton Marv Falconburg Assistant City Manager for Development Commerce City,
Commerce City Housing Authority
Roger Tinklenburg, Chris Cramer, Steve Timms, Priscilla Mancosky
Administrative Services Officer, Director of Community Development, Planning Manager, Housing Accountant
Northglenn Jason Loveland Director of Finance Thornton Maria Ostrom,
Nichole Jeffers Finance Director, Neighborhood Services Manager
Westminster Barbara Opie Assistant City Manager Local Government Interview Questions: Overarching: What are the municipal (and county) services that are not entitlement programs that income-‐qualified households are already taking advantage of? Need to gain a broader understanding of the following:
• Where does an inventory of these programs exist? If so, what are they and can they be line item extracted from an expenditure perspective? If so, have they been increasing over time? And at what time were these services created? *Clarify that the expenses are not “flow through” dollars, and are from the general fund.*
• Is the county doing anything to supplement the health care/healthy living/screenings/etc. (possibly mental health, dentistry, etc.)? There are very few optional programs through the state, so additional ones would come through a property tax levy.
• Are the cities doing anything regarding direct housing support that is funded through the budget? What about homeless programs?
• Are they doing anything explicitly to partner with the philanthropic community to address the needs through coordination, etc.?
• Food, other social services, etc. categorized detail? • How are those programs taxed/strained into the future?
o Does the local government feel the trend will continue? • Are there current conversations about this very subject across departments? • For housing authorities, what trend, if any, have they seen in demand? What is the waitlist?

80
Appendix B
Study Area: Adams County & its Municipalities

81
Appendix C
Adams County Subsidized Properties
82
Appendix D
Figure 5Adams County Public Use Microdata Areas (PUMAs)