Embed Size (px)
Citation preview
Petroleum Resource Rent Tax Review
Final Report13 April 2017

© Commonwealth of Australia 2016
ISBN 978-1-925504-41-5
This publication is available for your use under a Creative Commons BY Attribution 3.0 Australia licence, with the exception of the Commonwealth Coat of Arms, the Treasury logo, photographs, images, signatures and where otherwise stated. The full licence terms are available from http://creativecommons.org/licenses/by/3.0/au/legalcode.
Use of Treasury material under a Creative Commons BY Attribution 3.0 Australia licence requires you to attribute the work (but not in any way that suggests that the Treasury endorses you or your use of the work).
Treasury material used ‘as supplied’Provided you have not modified or transformed Treasury material in any way including, for example, by changing the Treasury text; calculating percentage changes; graphing or charting data; or deriving new statistics from published Treasury statistics — then Treasury prefers the following attribution:
Source: The Australian Government the Treasury
Derivative materialIf you have modified or transformed Treasury material, or derived new material from those of the Treasury in any way, then Treasury prefers the following attribution:
Based on The Australian Government the Treasury data
Use of the Coat of ArmsThe terms under which the Coat of Arms can be used are set out on the It’s an Honour website (see www.itsanhonour.gov.au).
Other usesEnquiries regarding this licence and any other use of this document are welcome at:
ManagerCommunications The TreasuryLangton Crescent, Parkes ACT 2600Email: [email protected]
Page 2
The Hon Scott Morrison MP 13 April 2017TreasurerParliament HouseCANBERRA ACT 2600
Dear TreasurerPetroleum Resource Rent Tax Review Final ReportIn accordance with the Terms of Reference, I am pleased to present the Final Report of the Petroleum Resource Rent Tax Review.The Report provides an assessment of the design and operation of the PRRT, crude oil excise and associated Commonwealth royalties that apply to the onshore and offshore oil and gas industry. The overall assessment is that while the PRRT remains the preferred way to achieve a fair return to the community for the extraction of petroleum resources without discouraging investment, changes should be made to PRRT arrangements to make them more compatible with the developments that have taken place in the Australian oil and gas industry.In considering the extent and timing of any changes to the PRRT, however, allowance has to be made for the very large recent investment in the Australian petroleum sector on the basis of long-standing taxation arrangements. The overall stability of the PRRT has contributed to this large investment. Given the range of uncertainties involved in large, long-term petroleum investments, stability in fiscal settings is an important factor influencing a country’s investment attractiveness. Moreover any substantial change to the PRRT should be the outcome of a considered, comprehensive and consultative process. Consequently, the Report’s recommendations are in two parts. First, a process to update the design of the PRRT with resulting changes only applying to new projects (as defined in the PRRT legislation) from a date to be specified. Second, changes to improve the integrity, efficiency and administration of the PRRT that should apply to existing and new PRRT projects. There has been widespread industry and public interest in the review. Over 75 submissions were received and the review met with a cross section of interested parties, including from oil and gas companies, non-government organisations, community groups, resource tax experts, and academics.I would like to thank the many individuals and organisations that gave considerable time and resources to assist the review; in particular, the Department of the Treasury, the Department of Industry, Innovation and Science and the Australian Taxation Office for their assistance.Finally, I wish to acknowledge and thank the members of the review secretariat for their excellent support.Yours sincerely
Mike Callaghan
Page 3

CONTENTS
Table of Abbreviations................................................................1Petroleum Resource Rent Tax Review..........................................2Purpose of the Review............................................................................................2Terms of Reference................................................................................................2Review Process.......................................................................................................2Overview, Conclusions and Recommendations.............................4The Task................................................................................................................. 4Summary of Issues Raised......................................................................................4What is an equitable return to the Australian community?....................................4What constitutes ‘without discouraging investment’?............................................5Rising costs and falling prices................................................................................5Tax and the competitiveness of Australian petroleum projects..............................5Design of the PRRT.................................................................................................6The PRRT rate.........................................................................................................6Uplift rate for deductions........................................................................................7PRRT designed for oil but now LNG dominates.......................................................8Gas Transfer Pricing...............................................................................................8Starting Base..........................................................................................................8Closing down arrangements...................................................................................9Administration of PRRT...........................................................................................9Royalties.................................................................................................................9Excises................................................................................................................. 10Conclusions..........................................................................................................10Recommendations................................................................................................13Part A. Recommended changes to apply to new PRRT projects...........................14Part B. Recommended changes to apply to existing and new PRRT projects.......................................................................................................141. Australia’s Oil And Gas Industry......................................171.1 Overview of Australia’s Oil and Gas Industry...........................................171.1.1 Crude oil..................................................................................................171.1.2 Natural gas..............................................................................................171.2 Growth of Australia’s Oil and Gas Industry..............................................181.2.1 Development of Australia’s oil and gas industry......................................181.2.2 LNG investment boom.............................................................................201.3 Major Oil and Gas Projects in Australia....................................................221.3.1 Industry and investment benefits............................................................221.3.2 Project development challenges..............................................................231.4 Outlook for the Oil and Gas Industry........................................................241.4.1 Oil and gas prices....................................................................................241.4.2 LNG market structure and pricing............................................................241.4.3 Falling prices and Australia’s LNG industry..............................................25

1.5 Determinants of Oil and Gas Exploration and Development in Australia...............................................................................................................261.5.1 Exploration influences..............................................................................261.5.2 Determinants and costs of development.................................................281.5.3 Fiscal risks...............................................................................................302. Taxing Australia’s Oil and Gas Industry............................332.1 Overview of Resource Taxation...............................................................332.1.1 Types of resource taxes...........................................................................332.2 Resource Charging Arrangements in Australia........................................362.3 Revenue From Resource Charging Arrangements...................................382.3.1 Historic Commonwealth resource revenue..............................................382.3.2 State royalties..........................................................................................402.3.3 Company tax revenue..............................................................................412.3.4 Modelling future PRRT revenue................................................................422.4 Resource Taxation in Other Countries.....................................................492.5 Comparing Australian LNG Revenue With Qatar......................................563. The Petroleum Resource Rent Tax...................................603.1 Overview of the PRRT..............................................................................603.2 Historical Changes to the PRRT................................................................613.2.1 Expansion of the PRRT regime.................................................................613.2.2 Incentives for exploration........................................................................624. Assessment of PRRT Design............................................634.1 The PRRT Rate.........................................................................................634.2 Uplift Rates..............................................................................................644.2.1 Basis of Initial Uniform Uplift Rate...........................................................664.2.2 Transferability for exploration costs and reduced uplift...........................674.2.3 Petroleum industry view of uplift rates....................................................714.2.4 Project risk versus risk of losing deductions............................................714.2.5 Tax neutrality objectives..........................................................................724.3 Transferability of Exploration Expenditure Deductions............................734.4 Ordering of Deductions............................................................................764.4.1 Further changes to the ordering of deductions........................................764.4.2 Possible changes to ordering arrangements............................................784.5 Stockpile of Deductible Expenditure........................................................804.6 Resource Tax Expenditure.......................................................................814.7 Transitioning Arrangements for 2012 PRRT Extension.............................824.7.1 The starting base as a deferred tax asset................................................824.7.2 Combining projects..................................................................................854.8 Closing Down Expenditure.......................................................................854.8.1 Opposition to the PRRT closing down credit.............................................864.8.2 Guidance on project decommissioning....................................................864.8.3 Partial closing down costs........................................................................874.9 Gas Transfer Pricing.................................................................................884.9.1 Issues raised on gas transfer pricing.......................................................89
Page 5

4.9.2 Preferred approach to arm’s length pricing.............................................904.9.3 Effect of the RPM......................................................................................914.9.4 Issues with RPM framework.....................................................................924.9.5 Issues with RPM calculations....................................................................934.9.6 Gas Transfer Pricing and FLNG.................................................................944.10 PRRT and Investment in Marginal Projects...............................................954.11 Robustness of PRRT Administration.........................................................974.11.1 Self-assessment and compliance.............................................................974.11.2 Uncertainty in the law..............................................................................994.11.3 Modernising PRRT administration..........................................................1005. Crude Oil Excise............................................................1035.1 Overview of Crude Oil Excise.................................................................1035.2 Operation of Crude Oil Excise................................................................1035.3 Historical Changes to Crude Oil Excise..................................................1055.4 Administration of Excise........................................................................1075.4.1 Administration differences between onshore and offshore....................1085.5 Commentary on Crude Oil Excise..........................................................1096. Other Revenue Including Royalties................................1116.1 Commonwealth Royalties — North West Shelf Project...........................1116.1.1 North West Shelf royalty administration................................................1116.1.2 Commentary on North West Shelf royalties...........................................1136.2 Resource Rent Royalty...........................................................................1136.3 State Royalties.......................................................................................1146.4 Other Revenues — Joint Petroleum Development Area.........................1146.5 Applying a Royalty to Offshore Petroleum.............................................1146.5.1 Impact of a new offshore royalty...........................................................1166.5.2 Capping yearly deductions.....................................................................1186.5.3 Impact of a delayed offshore royalty.....................................................1196.5.4 Overlapping coverage of PRRT, royalties and excise.............................1206.5.5 Royalties for regions..............................................................................1217. Other Issues.................................................................1237.1 Government Involvement......................................................................1237.2 Environmental Concerns........................................................................1237.3 Profit Shifting.........................................................................................124Bibliography...........................................................................125Appendix A — Australia’s Major Oil and Gas Projects................129
Page 6
Appendix B — Operation and Administration of the PRRT..........131B.1 Operation of the PRRT............................................................................131B.1.1 The PRRT rate........................................................................................132B.1.2 Assessable petroleum receipts..............................................................132B.1.3 Eligible real expenditure........................................................................132B.1.4 Resource tax expenditure......................................................................133B.1.5 Starting base expenditure.....................................................................134B.1.6 Deductible expenditure and deduction ordering....................................135B.1.7 Transferability........................................................................................136B.1.8 Gas transfer pricing...............................................................................137B.1.9 Consolidation for PRRT purposes...........................................................140B.1.10 Lodging, reporting and paying...............................................................140B.1.11 Interaction between petroleum titles and PRRT.....................................140B.2 Administration of the PRRT....................................................................141Appendix C — Timeline of PRRT Amendments...........................147Appendix D — Gas Transfer Pricing..........................................150D.1 Development of the Gas Transfer Pricing Regulations...........................150D.2 Use of the Gas Transfer Pricing Regulations..........................................151D.3 Extending the PRRT to Secondary Activities..........................................152D.4 Determining the Value of Sales Gas......................................................153D.5 Transparency of Gas Transfer Pricing....................................................154D.6 The Options for Determining the Transfer Price.....................................155D.7 The RPM.................................................................................................157D.8 The RPM Capital Allowance Rate............................................................161Appendix E — International Comparisons.................................163E.1 Fiscal Stability — Lessons From International Comparisons..................163E.1.1 United Kingdom.....................................................................................163E.1.2 Alberta...................................................................................................165E.1.3 Alaska....................................................................................................166E.2 Summary of Fiscal Regimes for Oil and Gas in Selected Countries........169E.2.1 Norway...................................................................................................169E.2.2 United Kingdom.....................................................................................170E.2.3 Papua New Guinea.................................................................................170E.2.4 Canada...................................................................................................171Alberta................................................................................................................171British Columbia.................................................................................................172Newfoundland and Labrador..............................................................................172E.2.5 United States.........................................................................................172Texas..................................................................................................................173North Dakota......................................................................................................173Gulf of Mexico (Offshore Federal Zone)..............................................................173E.2.6 Qatar.....................................................................................................173
Page 7

Appendix F — Gas Markets......................................................175F.1 Global LNG Market.................................................................................175F.2 Australia’s Domestic Gas Markets..........................................................177Appendix G — Submissions and Meetings................................180Submissions.......................................................................................................180Confidential submissions....................................................................................181Meetings.............................................................................................................181From Industry.....................................................................................................181Outside of Industry.............................................................................................182
Page 8
TABLE OF ABBREVIATIONS
ACCC Australian Competition and Consumer CommissionAEMO Australian Energy Market OperatorAFTS Australia’s Future Tax System ReviewANAO Australian National Audit OfficeAPA Advance Pricing ArrangementAPPEA Australian Petroleum Production and Exploration AssociationATO Australian Taxation OfficeCUP Comparable Uncontrolled PriceDIIS Department of Industry, Innovation and ScienceFID Final Investment DecisionFLNG Floating LNGGDP Gross Domestic ProductCSG Coal Seam GasGST Goods and Services TaxGTL Gas-to-LiquidsGTP Gas Transfer PricingIMF International Monetary FundJPDA Joint Petroleum Development AreaLNG Liquefied Natural GasLTBR Long Term Bond RateMEC Multiple Entry Consolidated (Group)MPC Marketable Petroleum CommodityNWS North West ShelfNPV Net Present ValuePRRT Petroleum Resource Rent TaxRPM Residual Pricing MethodRRT Resource Rent Tax
Page 1
PETROLEUM RESOURCE RENT TAX REVIEW
PURPOSE OF THE REVIEWOn 30 November 2016, the Australian Government announced a review into the operation of the Petroleum Resource Rent Tax (PRRT), crude oil excise and associated Commonwealth royalties to help better protect Australia’s revenue base and to ensure that oil and gas projects are paying the right amount of tax on their activities in Australia.
The review will advise the Government to what extent Commonwealth oil and gas taxes and royalties are operating as intended, having regard to the need to provide an equitable return to the Australian community from the extraction and sale of these resources without discouraging investment in exploration and development.
TERMS OF REFERENCEThe Terms of Reference for the review, released by the Treasurer on 30 November 2016, are:
• The review will have regard to the need to provide an appropriate return to the community on Australia’s finite oil and gas resources while supporting the development of those resources, including industry exploration, investment and growth.
• The review will examine the design and operation of the PRRT, crude oil excise and associated Commonwealth royalties that apply to the onshore and offshore oil and gas industry, having regard to economic conditions in the industry and trends over time.
• The review will also consider the impact of previous policy decisions on Commonwealth revenue.
• Drawing on international experience, the review will make recommendations to the Government on future tax, excise and royalty arrangements having regard to revenue adequacy, efficiency, equity, complexity, regulatory costs and the impact on the industry generally.
• The review will also examine other related matters.
REVIEW PROCESSThe review was led by Michael Callaghan AM PSM, with the support of a secretariat comprising of officers from the Department of the Treasury, the Australian Taxation Office (ATO), the Department of Industry, Innovation and Science (DIIS) and an external expert.
The review publicly released an issues note on 20 December 2016 which provided background on the PRRT, excise and associated Commonwealth royalty arrangements, along with a summary of many of the public comments that have
Page 2
been made regarding the design and operation of these arrangements. Submissions were invited from interested parties.
The review conducted an extensive consultation program which included companies operating in the oil and gas industry, civil organisations, academics, the business community and interested individuals. All registered PRRT taxpayers were contacted by the ATO to advise them of the opportunity to provide input into the review. At Appendix G is a list of the firms, organisations and individuals consulted by the review.
The review received a total of 77 submissions, listed in Appendix G. Public submissions are available on the Treasury website, link:
http://treasury.gov.au/ConsultationsandReviews/Reviews/2016/Review-of-the-Petroleum-Resource-Rent-Tax/Consultation.
Page 3

OVERVIEW, CONCLUSIONS AND RECOMMENDATIONS
Following is a summary of the issues raised and considered during the review, the broad conclusions reached, along with the review’s recommendations.
THE TASKThis report reviews the operation of the PRRT, crude oil excise and associated Commonwealth royalties with the aim to advise to what extent the PRRT is operating as intended.
When announcing the review on 30 November 2016, the Treasurer, the Hon Scott Morrison said, ‘We will ensure that the PRRT provides an equitable return to the Australian community from the recovery of petroleum resources without discouraging investment in exploration and development which is vital to that industry’. The review has used this as a summary of the intent of the PRRT.
The PRRT, which came into effect in 1988, aims to capture the ‘economic rent’ associated with the development of petroleum resources. The economic rent refers to returns in excess of those necessary to attract commercial investment into the activity. Since these ‘excess’ returns are in part a function of the scarcity of petroleum resources, which are owned by the Australian community, it was considered equitable to share these returns. Because the PRRT is a profit-based tax, it not only captures the upside of rising petroleum prices, but also avoids the problems of an excise or royalty regime which are considered to discourage activity and investment in marginal projects.
It became clear during the course of the review that there are different views as to what constitutes an equitable return to the Australian community and what constitutes the discouragement of investment, along with the relative weight to be placed on either influence. Any assessment as to whether the PRRT is operating as intended or whether changes are required will ultimately come down to judgements after balancing a range of considerations.
SUMMARY OF ISSUES RAISEDWhat is an equitable return to the Australian community?The community groups consulted were of the view that the PRRT was not providing the Australian people with an equitable return on the development of petroleum resources. In particular, concern was expressed that PRRT revenue is declining at a time when a number of large LNG projects have or will soon come into production that will result in Australia becoming a leading exporter of LNG. Concerns were also expressed that some large LNG projects may not pay PRRT for decades to come, or may never pay PRRT at all.
Industry argued that given the surge in investment in petroleum projects, it is inevitable that it will be some time before these projects become cash positive and pay PRRT, especially as some of these major projects have only recently commenced production or are still being developed.
Page 4
What constitutes ‘without discouraging investment’?The concept that a desirable aspect of a profit-based resource tax, such as the PRRT, is that it will facilitate marginal projects with little economic rent, was not accepted by all. Some of the groups consulted believed it was appropriate for marginal projects to not go ahead, and for the resources to only be extracted when they were profitable enough for returns to be paid to the community through PRRT or royalty payments. Some believed that for environmental considerations it would be appropriate to discourage the development of petroleum resources. Views were expressed that the current PRRT arrangements were designed to encourage petroleum exploration and development and, while that may have been appropriate when the PRRT was introduced, this was no longer the case.
In contrast, the universal view of the petroleum industry was that the PRRT was operating as intended and that current tax arrangements were instrumental in promoting the very large investment in the exploration and development of Australia’s resources. However, this was not the view of industry in the 1980s, as they opposed the introduction of the PRRT on the basis that it would discourage investment. Industry now considered that what some saw as a weakness in the PRRT arrangements, namely the delay in PRRT payments until projects become cash positive, was a deliberate design feature and ensured that investment would not be discouraged. Industry argued that because investors who encountered projects with poor rates of return (and as such had little or no economic rent) did not face an additional tax/royalty burden, there was a powerful incentive to invest in Australia. It was also argued that it was important for marginal projects to proceed because the community benefited from the jobs they created and other taxes the projects paid, particularly company tax. In addition, what are considered to be marginal projects at current prices may generate significantly higher tax revenues if prices increased.
Rising costs and falling pricesIndustry noted that many of the large LNG projects that have recently or will shortly commence production had expectations of high rates of return when the investment decisions were taken some years ago. However, subsequent cost increases, the decline in oil prices and unfavourable exchange rate movements are such that these projects are now generating considerably lower than expected returns for investors. Similarly, PRRT revenue will be lower and paid later than was expected when investment decisions were taken.
A factor influencing the rise in costs was the demands from the simultaneous development of a number of large projects. The view was raised that there should be some constraints over petroleum projects to ensure that they are not unduly expensive and infrastructure is used more efficiently, such as through sharing agreements.
Tax and the competitiveness of Australian petroleum projectsIndustry highlighted the high cost structure of the Australian petroleum industry, in part a combination of where many of Australia’s resources are located (remote, offshore and in deep water) and high cost/low labour productivity
Page 5

compared with other countries. The comment was made that resource projects in Australia are 40 per cent more expensive to deliver than in the United States. Global resource companies noted that investments in Australia had to compete with opportunities they had in other parts of the world. Given the high cost structure of the Australian industry, it was emphasised that the appropriateness and stability of Australia’s tax arrangements was a significant influence on investment decisions.
Given the variety of petroleum tax arrangements in other countries, as well as direct government involvement in the industry in many countries, it is difficult to assess the relative competitiveness of these arrangements. The report contains detail on petroleum taxation in a range of countries. One industry submission referred to a study which ranked Australia’s offshore petroleum environment in the second quartile of countries reviewed in terms of their overall attractiveness for investment, and another study ranked Australia in the fourth quartile for ‘government take’ in terms of the extent to which such government take impacts on project returns.
Stability in tax arrangements was emphasised by industry as being a major factor influencing the attractiveness of a country as an investment destination and the stability of Australia’s tax arrangements was said to be a factor influencing the recent investment boom. It was noted that Norway was looked on favourably because there had been little change in its tax arrangements, notwithstanding that its tax rate for petroleum is around 78 per cent. In contrast, other jurisdictions were cited, such as the United Kingdom, who had increased taxes on the petroleum industry with a resulting decline in exploration and development.
Design of the PRRTThe review emphasised during consultations that in order to assess whether the PRRT was operating as intended it was necessary to examine the appropriateness of design features of the PRRT. Moreover, there were a number of public comments criticising aspects of the PRRT, some of which were outlined in the Issues Note the review released on 20 December 2016.
Industry largely emphasised to the review that the current design of the PRRT was appropriate, and reflected the outcome from previous consultation with industry and that the arrangements had been reviewed a number of times by governments. In contrast, a number of other bodies raised concerns with aspects of the design of the PRRT.
There is a significant amount of economic literature on the concept of a resource rent tax. However, the practical application of the tax may differ from the theoretical ideal. For example, what represents economic rent can be portrayed in a hypothetical example and might be neatly captured under a theoretically pure resource rent tax, but it is challenging in practice to design and implement legislation that will clearly capture the economic rent associated with a project without consequent budgetary risks. Economic rent will vary across projects, but the legislation applies across the industry. Moreover, it is difficult to isolate the rent associated with the quality and scarcity value of petroleum resources from the quasi-rents earned on investments in exploration and development which reduces costs.
Page 6
The PRRT rateSome bodies consulted suggested that the PRRT rate (40 per cent) is too low and a larger proportion of the economic rent associated with a project should be returned to the community. The combined PRRT and company tax rate applying to annual PRRT profit is 58 per cent. However, it has been acknowledged in the economic literature that, given the difficulties in making any practical resource rent tax arrangement approximate the theoretical concept of a pure rent tax, justifies taxing only a share of the estimated economic rent. Moreover an adequate incentive has to be given to investors to explore, develop and produce. It is a matter of judgement as to what is an appropriate resource rent tax rate. The 40 per cent rate has been in place for over 30 years, is broadly comparable to the rate in other jurisdictions, and there does not appear to be a strong policy case to change the PRRT rate.
Uplift rate for deductionsA key feature of the PRRT is that it taxes profitable petroleum resource projects, just like a cash flow tax, but does not provide cash rebates for tax losses (negative cash flows). Tax losses are carried forward with an uplift to be offset against future positive cash flow from the project. The uplift rate at which losses (deductions) are carried forward has a significant impact on when/if a project will pay PRRT.
When the PRRT came into effect in 1988, the uplift rate for both exploration and general project expenditure was the long term bond rate (LTBR) plus 15 percentage points. In 1991, when the deductibility of exploration expenditure was widened to a company basis, the uplift rate for general project expenditure was lowered to LTBR plus 5 percentage points. Exploration expenditure incurred after 1 July 1990 was still carried forward at LTBR plus 15 percentage points.
It is difficult to determine from published material the basis for the specific uplift rates introduced when the PRRT came into effect in 1988 (LTBR plus 15 percentage points) and the changes introduced in 1990 (with the introduction of LTBR plus 5 percentage points for general project expenditure). It appears that it was recognised at the time that the application of a single generally-applicable uplift rate was imperfect and the decision on the rate was arbitrary. Importantly, there is a difference in views as to what is the rationale for the uplift rate. The submissions from industry generally refer to the uplift rate as reflecting an appropriate rate of return for the risk borne in carrying on a petroleum project. Government statements at the time of the PRRT design suggest that the uplift rate should maintain the value of the deduction and should take into account the risk that the project will not produce sufficient returns to utilise the deduction. Academics and other reviews of the PRRT have supported this approach. An uplift rate that takes into account the risk of losing a deduction is not the same as the investor’s required rate of return for a project.
A number of submissions claimed that the uplift rate for exploration expenditure was excessively generous, originally aimed at encouraging exploration but this should no longer be an objective. Industry argued that the uplift rate reflected the high risks associated with exploration. However, exploration expenditure that takes place more than five years before a production licence is issued, and is arguably more risky, is only uplifted at the GDP factor rate. When transferability
Page 7
of exploration was introduced in 1991, this reduced the risk that the exploration expenditure for a project will not be used, but the uplift rate was maintained at LTBR plus 15 percentage points and the uplift rate for general project expenditure was reduced to LTBR plus 5 percentage points. Statements by the Government at the time said the reduction in the uplift rate for general project expenditure reflected the significant benefits industry derived from the introduction of company-wide transferability for exploration expenditure. Nevertheless, reducing the uplift rate for general project expenditure was consistent with the lower risk of losing PRRT deductions in the development and production stages of a project.
The existence of multiple uplift rates for different categories of expenditure adds to the complexity of PRRT arrangements and provides an incentive for taxpayers to misclassify expenditure in order to gain a higher uplift rate. Adding to the complexity of the PRRT is the ordering of deductions with different uplift rates. Expenditure that is not transferable and contained in the project (such as general project expenditure uplifted at LTBR plus 5 percentage points) is higher in the order of deductions to increase the chance it will be used. However, exploration expenditure which has a higher uplift rate, is further down the order of deductions, meaning that the project will gain the benefit of a higher uplift for a longer period of time. The order of deductions influences when a project will pay PRRT.
PRRT designed for oil but now LNG dominatesA number of submissions highlighted that the PRRT was designed to apply to oil projects but the Australian industry is now dominated by LNG and the PRRT is not appropriate for LNG.
Compared to LNG, oil projects normally involve considerably less capital expenditure and commence production significantly sooner than gas projects. Depending on prices, an oil project can be cash positive and paying PRRT within a few years of commencing production. In contrast, an LNG project requires significantly more capital expenditure and is more complex and risky compared to an oil project. In addition, the life of an LNG project can span many decades. As noted, the very large capital expenditure in an LNG project will delay the time a project becomes cash positive and pays PRRT. However, the uplift rate of deductions that are carried forward can have a significant impact in extending when a project will pay PRRT. High uplift rates for LNG projects can see deductions compound over time with the result that the return to the community through PRRT revenue will be reduced. This compounding effect is exacerbated by arrangements for the ordering of deductions.
Gas Transfer PricingThe prevalence of LNG projects has posed a number of challenges for the PRRT regime. The PRRT is applied to the gas that is used to make LNG but not on the final product. In an integrated LNG project, there is usually no observable arm’s length price from the ‘upstream’ (the extraction of the gas) to the ‘downstream’ (it’s liquefaction) which will serve as a taxing point for the application of PRRT. Transfer pricing arrangements were developed and involve three approaches: an advance pricing arrangement (APA) between the taxpayer and the ATO; a comparable uncontrolled price (CUP); and the residual pricing method (RPM)
Page 8
which involves a series of formulas to calculate the gas transfer price. The RPM involves 14 detailed steps and complex record keeping of costs and allocations on a phase-by-phase basis within each upstream and downstream component.
Some submissions criticised the gas transfer pricing (GTP) arrangements, particularly the RPM, as being flawed, lacking transparency and recommended that alternative approaches be pursued in order to obtain a ‘fairer’ price. Among the options raised included only using the ‘netback’ step in the RPM calculation or applying the PRRT on LNG which would mean that the PRRT was going beyond taxing the extraction of the resources and would include taxing the value added from subsequent processing of the gas. Industry argued that the GTP arrangements were appropriate and were the outcome of detailed consultations between the industry and the Government. In particular industry argued that the approach in the RPM which split the residual profit (or rent) in an integrated LNG plant equally between the upstream and downstream operations was appropriate because it recognised the symbiotic relationship that each has with the other.
Starting BaseA key feature of the extension of the PRRT to onshore projects and the North West Shelf (NWS) project in 2012 was that transitioning projects were provided with a starting base amount that is carried forward and uplifted at LTBR plus 5 percentage points until it is applied against the assessable receipts of the project. These projects have very large starting bases mainly because most used the market value approach, including the value of the resource, to determine their starting base and the valuation was done when oil prices were relatively high. The starting base effectively acts as a tax shield and means these projects will only pay PRRT at very high oil prices. However, they do pay state royalties and excise, which is credited against PRRT, and this will be their main form of resource taxation.
The extension of PRRT to onshore projects has also meant that these projects can transfer exploration expenditure to other PRRT paying projects within a wholly owned group of companies, which is likely to have lowered PRRT revenue since 2012.
Closing down arrangementsWithin the next decade, a number of offshore projects in Australia will be decommissioned. Under the PRRT, eligible closing down expenditure is a deduction in the year it is incurred and if there are not sufficient receipts, a tax credit of 40 per cent of the non-deducted expenditure is provided to the extent a project has previously paid PRRT. While some submissions raised concerns about giving a credit for closing down expenditure, it is consistent with the resource rent nature of the PRRT which recognises all project costs. Closing down expenditure is a project cost just as exploration and development are project costs. A credit is provided because the expenditure normally takes place at the end of a project’s life when there are little receipts.
Industry did raise concerns that the existing closing down arrangements did not recognise partial closing down situations.
Page 9
Administration of PRRTThe ATO has administered the PRRT since its introduction. The ATO’s administration has been subject to a performance audit by the Australian National Audit Office (ANAO) which found that the ATO has administered the PRRT in a generally effective manner. However, concerns were raised during the consultations over the PRRT being subject to self-assessment and the capacity of the ATO to undertake audit activities in order to ensure compliance. It was also claimed that the PRRT was based on ‘fuzzy’ legislation and certain aspects of the PRRT are arguably no longer appropriate to deal with some commercial and financial arrangements that are in place in today’s petroleum industry and the legislation needs to be modernised.
RoyaltiesA number of submissions advocated that a royalty should be applied to offshore petroleum projects, in addition to the PRRT. A royalty was considered to be advantageous because it would provide an early and assured revenue flow to the Government. Since royalty payments are credited against PRRT, it was argued that a royalty would effectively bring forward the government tax take from those projects that would pay PRRT in the future and, for those projects that never paid PRRT, it would ensure that there was some return to the Australian community for the use of its petroleum resources.
One option raised with the review was for all offshore petroleum projects to be subject to a royalty after five or ten years from when they first commenced production. The royalty would be deducted from assessable PRRT receipts. The lag in the introduction of the royalty was to minimise distortions from the royalty.
Another option raised with the review was to cap the extent to which PRRT expenditure can be deducted in calculating annual PRRT taxable profits — that is a project’s PRRT taxable profit in each year would not fall below a certain percentage (for example 10 or 20 per cent) of the year’s assessable PRRT receipts. This would have a similar impact as imposing a royalty.
There were a number of submissions supporting the introduction of a new ‘Royalty for Regions’ tax/levy to better support the rural and remote areas from which the majority of petroleum resources are derived.
ExcisesCrude oil excise is the tax the Government imposes on eligible crude oil and condensate production from onshore areas and the NWS project. No excise is payable on the first 30 million barrels of stabilised crude oil or condensate from a particular field and each production area must also reach an annual production threshold before excise is payable. In practice, only the NWS project pays excise.
Industry submissions said that since the Government has effectively accepted that PRRT will be its primary mechanism for the taxation of crude oil and condensate production, the continued application of production excise for areas that are unlikely to incur a liability for excise should be revisited. Other submissions questioned the logic of high production thresholds before excise is payable and called for all production to be subject to excise.
Page 10

CONCLUSIONSGiven the magnitude of the investment in Australia’s petroleum industry over the past decade, it is evident that the PRRT is not discouraging investment in exploration and development of Australia’s petroleum resources.
The petroleum industry faces considerable uncertainty in project planning and execution. Possible changes to oil prices, exchange rates, costs of production and production volumes are among the many risks that need to be addressed. Also influencing investment decisions is Australia’s high cost structure. Given such influences, stable fiscal settings are important for companies planning long-term petroleum investments. The overall stability of the PRRT has contributed to the very large investment in the Australian petroleum industry.
The fact that PRRT revenue has been declining and is not rising in line with the increase in LNG production does not of itself indicate that the Australian community is not receiving an equitable return from the development of its resources.
The PRRT has generated over $33 billion in revenue since payments were first made in 1989-90. The reduction in PRRT revenue from 2002-03 to 2015-16 reflects subdued oil and gas prices, declining production in mature projects, growing deductible expenditure from the recent large investment in new projects and the transfer of exploration expenditure between companies in wholly owned groups. The large stock of deductible expenditures will curtail PRRT revenue for a number of years notwithstanding the increase in LNG production. Under the PRRT arrangements, tax only becomes payable once projects become cash flow positive, meaning all expenditure has been deducted. The cost of developing many of these new projects is significantly higher than originally planned when the decision was taken to proceed, and oil prices are significantly lower. If current oil prices prevail for an extended period, the profitability of these projects will be substantially lower than expected when the decisions were taken to proceed with these projects, as will PRRT revenue to the Government.
Modelling undertaken by the review suggests that on the basis of a steady oil price assumption of $US65 per barrel (indexed to maintain its real value), PRRT revenue could total around $12 billion in the next 10 years (to 2027) and around $105 billion in total over the period to 2050. Most major offshore LNG projects are expected to pay PRRT over this latter period. The modelling undertaken by the review is based on data provided by the consultancy firm Wood Mackenzie, and has been adjusted following discussions with individual oil companies. In particular, the adjustments incorporated feedback from companies on exploration expenditure which is expected to be transferred between projects held within a wholly owned group of companies. The transfer of deductions for exploration expenditure is a significant factor in offsetting the impact of prolonged periods of compounding these deductions, which are uplifted each year at the rate of LTBR plus 15 percentage points.
Should oil prices rise, PRRT revenue will also be higher. The review’s modelling indicated that with an oil price assumption of $US80 per barrel indexed, PRRT revenue could total around $25 billion over the 10 years to 2027 and around $170 billion over the period to 2050. PRRT revenue based on an oil price assumption of $US100 per barrel could be $45 billion in the 10 years to 2027 and $230 billion in the period to 2050. Conversely, low oil prices will depress PRRT
Page 11

revenue. It is projected that with an oil price assumption of $US45 per barrel indexed, PRRT revenue could total around $9 billion in the 10 years to 2027 and $18 billion in the period to 2050.
Relatively low PRRT revenue does not necessarily mean that the Australian community is not receiving an equitable return from the use of its resources. The other objective of the PRRT is not to discourage investment. The fact that PRRT revenue varies in line with the profitability of a project may be an important factor in not discouraging investment in the Australian petroleum industry. In addition to PRRT revenue, the Australian community gains from the jobs created during the construction and operation of these projects and the range of other tax payments they generate, particularly company income tax.
However, it is not only important that the Australian community receives an equitable return from the use of its petroleum resources; it is important that they also have confidence that this is occurring.
There are aspects of the PRRT arrangements that may not be compatible with changes in the Australian petroleum industry. The dominance of LNG projects, with significantly larger investment requirements than oil projects and much longer periods before they will become cash positive, highlights the importance of avoiding excessively high uplift rates for carrying forward deductions. In such circumstances, high uplift rates for deductions combined with periods of subdued oil prices may mean that deductions compound over the life of a project such that the project may never pay PRRT.
The rationale for the current specific uplift rates is not entirely evident. However, the modelling undertaken by the review highlights the significant impact uplift rates can have on PRRT revenue in large, long life projects. If the rationale of the uplift rate for exploration expenditure was to maintain the value of exploration deductions taking into account the risk that subsequent returns will not be sufficient for the deductions to be used, it would be expected that the uplift rate would have been reduced when transferability of exploration deductions was introduced in 1991. It was not reduced, but the uplift rate for general project expenditure was reduced. A reduction in this uplift rate was appropriate given the lower risk associated with this expenditure, but transferability significantly reduced the risk that deductions for exploration expenditure would not be used. However, industry does not see the uplift rate as compensating for the risk that deductions will not be used, but see it as representing the return for the risk in carrying on a petroleum project. A consensus needs to be reached on the conceptual basis for the uplift rates.
The transferability of exploration expenditure introduced additional complexity into the PRRT arrangements while reducing the risk of losing deductions for exploration expenditure relating to both relatively unprofitable projects and greenfields exploration. But it also helped offset lengthy periods where exploration expenditure is uplifted at a relatively high rate. This was particularly important for large scale LNG projects and has helped ensure a better return to the community from these projects.
The introduction of the transferability provisions resulted in the introduction of a schedule as to the order in which different categories of expenditure can be deducted from PRRT assessable receipts. The order involves expenditure with lower uplift rates being claimed before those with higher uplift rates and
Page 12

exacerbates the generosity of the current uplift rate for exploration expenditure. This influences the timing and amount of PRRT payments.
The starting base arrangements associated with the extension of the PRRT to onshore projects and the NWS project were designed to facilitate the extension of the PRRT to these existing projects and to recognise that they were already subject to royalty payments. When the starting base arrangements were negotiated, it was recognised that they would substantially limit a taxpayer’s liability to pay PRRT. Any subsequent change to the starting base arrangements may have a significant impact on these projects. However, integrity measures are needed to ensure the starting base is limited to these transitioning projects.
The RPM method under the GTP arrangements is complex, opaque and raises issues as to whether the outcome ensures the Australian community is receiving an equitable share from the gas used in LNG projects. An in-depth examination of the GTP arrangements would be in order. In particular, the option of using a CUP as the primary method should be explored. Aspects of the RPM that could be reviewed include the appropriateness of the asymmetrical treatment of the upstream and downstream operations of an integrated project, the way profits are split between upstream and downstream activities and the rate of the capital allowance. Consistent with the process of establishing the existing GTP arrangements, any future examination should involve close consultation with industry. A change to the transfer pricing arrangements could have major implications for existing projects.
A number of changes should be made to the legislative arrangements for the PRRT in order to: modernise them; align them with current commercial arrangements; improve the integrity of the system; and improve certainty for taxpayers. For example, requiring PRRT taxpayers to lodge annual returns after they start holding an interest in an exploration permit, rather than when they first produce assessable PRRT receipts as currently applies, would improve the ability of the ATO to undertake compliance action regarding deductible expenditure and provide greater certainty for taxpayers.
Introducing a royalty for offshore projects would provide a more stable revenue flow to the Government and a more transparent means of demonstrating to the Australian community that they are getting a return for the development of their resources. Introducing a royalty similar to that applying to the NWS project would bring forward substantial revenue over the first ten years or so but, with royalty payments creditable for PRRT and uplifted at LTBR plus 5 percentage points, there would be a significant reduction in PRRT revenue over the life of the projects. Furthermore bringing forward payments to the Government through a royalty would have a major impact on the cash flow position of existing projects. The PRRT was introduced to overcome deficiencies in excise and royalty regimes, particularly because they may discourage investment in more marginal projects. The fact that projects have proceeded onshore under a state royalty regime does not help with questions regarding which projects might have been discouraged by the regime. While applying a royalty to offshore projects would equate them with onshore projects that are now subject to state royalties, the starting base arrangements that onshore projects gained when they were brought under the PRRT mean that they are unlikely to ever pay PRRT.
The argument that there are no economic rents in LNG projects, and as such the PRRT is not appropriate for such projects, appears to be based on the assumption
Page 13
that oil and gas prices will largely remain at low levels over the life of current projects. As noted previously, modelling suggests that based on a moderate oil price assumption, most current offshore LNG projects are expected pay PRRT. Claims that major offshore LNG projects will not pay PRRT appear to ignore the impact of compulsory transfers of exploration expenditures between projects held within a wholly owned group of companies.
It was judged that such issues as: introducing measures to curb the cost of petroleum projects; improving arrangements for the sharing of infrastructure; discouraging the development of projects for environmental reasons; and introducing a ‘ royalty for regions’ tax, were outside the scope of the review.
The overall assessment is that while the PRRT remains the preferred way to achieve a fair return to the community for the extraction of petroleum resources without discouraging investment, changes should be made to PRRT arrangements to make them more compatible with the developments that have taken place in the Australian oil and gas industry. However, the timing of any changes will need to take into account that there have been very large investments in the Australian petroleum industry based on tax arrangements that have been in place for nearly 30 years. Fiscal certainty is an important factor influencing a country’s investment attractiveness. In addition, for the large projects that have recently or will soon commence in Australia, a combination of cost over runs and a fall in oil prices are such that the returns from these projects will be significantly lower than expected when these investment decisions were taken.
Any significant increase in the tax on existing petroleum projects may substantially increase perceptions of the fiscal risk associated with investments in Australia and may deter future investment. Moreover, concerns over fiscal risk are likely to be exacerbated if changes impacting on existing projects are perceived to be ad-hoc and arbitrary. Indeed, some of the issues raised about the appropriateness of existing PRRT arrangements are the result of changes made in the past that did not fully take into account the integrated nature of the PRRT and how they may impact on future developments in the petroleum industry.
Consequently while the PRRT should be updated so that it is more compatible with a petroleum industry that is primarily based on large-scale, long-term gas projects, this should be the outcome of a considered, comprehensive and consultative process. The outcome of such a process could result in substantial changes to the PRRT regime. If these changes were applied to existing projects it would represent a significant departure from the arrangements under which there has been very large investment to date. Given the importance of fiscal stability in influencing a country’s investment attractiveness, any major change to the design of the PRRT should only apply to new projects.
RECOMMENDATIONSThe review’s recommendations are based on the overall assessment that, while the PRRT is a sound basis for taxing petroleum resources, it needs to be updated so that it is more compatible with the current state of the Australian petroleum industry. In considering the extent and timing of any changes to the PRRT, however, allowance has to be made for the very large recent investment in the Australian petroleum sector on the basis of long-standing taxation arrangements.
Page 14

Major changes to the PRRT that significantly increase the PRRT paid on existing projects could have adverse implications for Australia’s reputation as a stable investment destination.
Consequently the review’s recommendations are in two parts: first, a process to update the PRRT with resulting changes only applying to new projects; and, second, changes to improve the integrity, efficiency and administration of the PRRT that will apply to existing and new PRRT projects.
Part A. Recommended changes to apply to new PRRT projectsRecommendation 1. A process should be established, involving full consultation with industry and the community, to update the PRRT arrangements so that they are more appropriate to the current Australian oil and gas industry. This process should be comprehensive and take into account the integrated nature of the PRRT along with likely future developments in the Australian petroleum industry. Changes to the PRRT from this process should only apply to new projects (as defined in the PRRT legislation) after a date to be specified. Areas that should be considered include:
• changing the arrangement for the uplift rates for all deductible expenditures such that they are more commensurate with the risk of losing PRRT deductions, taking into account transferability and that this risk will vary over the life of a project;
• ensuring that classes of expenditure with the highest uplifts are deducted first having regard to how deductions can compound in large, long-life projects;
• examining the rules for the transferability of deductions between projects in a company to ensure they produce a consistent set of outcomes; and
• examining the gas transfer pricing arrangements to identify possible changes that would achieve greater simplicity and transparency, ease of compliance, and fair treatment of the economic rent from each stage of an integrated petroleum operation. In particular, issues to consider include:
– strengthening the scope to use a CUP as the primary method of setting the gas transfer price in line with international best practice and recent work by the Organisation for Economic Co-operation and Development (OECD); and
– where a CUP is not available, examining the appropriateness of the asymmetric treatment of upstream and downstream operations, the way profits are split between upstream and downstream, and the rate of the capital allowance in the RPM.
Part B. Recommended changes to apply to existing and new PRRT projectsRecommendation 2. When the PRRT was extended to onshore projects and the NWS project in 2012, to facilitate the transition of these projects they were provided with an additional amount of deductible expenditure called a starting
Page 15
base. The integrity measure introduced at that time which excluded transitioning projects with a starting base from combining with offshore projects should be extended to include a prohibition between transitioning projects with a starting base combining with future onshore projects without a starting base. This will avoid the revenue risk posed by transitioning projects with a starting base combining with other projects without a starting base to form a single PRRT project that would use the starting base amount as a tax shield for the whole project.
Recommendation 3. Under the PRRT, closing down expenditure is a recognised category of deduction, which may be refunded to the limit of past PRRT payments. The implications for PRRT revenue should be taken into account in the current review of the policy and legislative framework for the decommissioning of projects in Commonwealth waters being undertaken by the Department of Industry, Innovation and Science. Any changes to decommissioning requirements coming from this review should take into account that onerous closing down requirements will significantly affect PRRT revenue.
Recommendation 4. The PRRT has a linear, or cradle-to-the grave, treatment of the phases involved in a petroleum project’s operational life and this no longer captures the characteristics of multi-stage projects that have become a common feature of the industry. Projects are now designed to operate for upwards of 40 years, although parts of the project will be closed over that time. The ATO is currently undertaking consultations to clarify the treatment of closing down expenditure within the meaning of the legislation. If this review does not provide sufficient clarity to deal with partial closing down situations, the legislation should be amended to recognise partial closing down expenditure as a legitimate general project expense. There is no reason why expenditure that is deductible when a project is completely closing down should not be deductible because the project is partially closing down.
Recommendation 5. Under current PRRT arrangements, a PRRT taxpayer is only required to lodge an annual return with the ATO when a project starts producing assessable receipts. It is only at this point that a PRRT taxpayer is required to disclose the carried forward deductible expenditure for the project to the ATO. Given the long lead times for some projects, this expenditure may have occurred many years prior to a return being lodged, which can result in considerable uncertainty for PRRT taxpayers and significantly restricts the ATO’s ability to undertake compliance activity. This also affects the ATO’s ability to provide reliable data to Treasury for revenue forecasting purposes. To deal with this, the PRRT arrangements should be amended such that PRRT taxpayers are required to lodge annual returns after they start holding an interest in an exploration permit, retention lease or production licence rather than having to wait until they receive assessable receipts from the project.
Recommendation 6. The PRRT design feature which links a project to a production licence does not align with current commercial practice whereby a production licence may revert to a retention lease. The Commissioner of Taxation should be given the power to treat a new project as a continuation of an earlier project, where it would be reasonable to do so.
Recommendation 7. The structure of ownership interests used by the industry is becoming more diverse and fragmented and less likely to remain constant through the life of a project. To deal with these increasingly complex structures
Page 16
that were not envisaged when the PRRT was introduced, the Commissioner of Taxation should be given the discretion to recognise more than one project from a production licence area for genuinely separate and independent petroleum operations in the licence area.
Recommendation 8. Entities within a wholly owned group currently have the option to have all the interests held by the group in an onshore project taken together and reported as a single PRRT return (without affecting the project-based nature of the tax). This compliance cost saving measure should be extended to offshore projects.
Recommendation 9. Currently all PRRT tax payers must prepare their PRRT return on a 30 June year end, which is out of step with income tax and accounting rules. The PRRT arrangements should be amended such that PRRT taxpayers can chose to adopt a substituted accounting period for PRRT so it can align with their choice to use a substituted accounting period for income tax.
Recommendation 10. The functional currency rules for PRRT are out of step with those for income tax as they do not recognise a functional currency choice by a ‘Multiple Entry Consolidated (MEC) group’. A MEC group is an income tax consolidated group of Australian entities that are wholly foreign-owned and do not have a common Australian head company. The PRRT arrangements should be amended so that PRRT taxpayers operating with a MEC group can make a functional currency choice for PRRT purposes that aligns with the functional currency choice made for income tax purposes.
Recommendation 11. Given that some PRRT projects are unlikely to ever pay PRRT (such as the oil project on Barrow Island), in order to reduce compliance costs for taxpayers and administrative costs for the ATO, the Commissioner of Taxation should be given the power to administratively exempt projects from lodging PRRT returns where they are clearly unlikely to pay PRRT in the foreseeable future.
Recommendation 12. Amendments were made to the income tax anti-avoidance rules in 2013 to ensure they operated as intended after a number of Federal court cases suggested there were deficiencies in identifying a ‘tax benefit’. The PRRT anti-avoidance rules should be amended in line with the amendments to the income tax rules.
Page 17

1. AUSTRALIA’S OIL AND GAS INDUSTRY
1.1 OVERVIEW OF AUSTRALIA’S OIL AND GAS INDUSTRYAustralia’s oil and gas industry is underpinned by substantial petroleum reserves, the development of which is strengthening Australia’s position as a leading market participant. Over time, the focus of Australia’s oil and gas industry has shifted from oil towards gas development. This has been a consequence of limited new oil discoveries to supplement production, and the discovery of major new gas reserves underpinning substantial investment in new supply capacity.
1.1.1 Crude oilAustralia’s oil reserves are limited, representing about 0.2 per cent of world oil reserves and Australia increasingly relies on imports to meet demand (Geoscience Australia, 2016). Crude oil exploration in Australia has not repeated the success of the 1960s when the first offshore exploration yielded significant field discoveries in the Gippsland Basin. Although Australia has over 300 crude oil fields, most production has come from only seven major fields (Geoscience Australia, 2016).
Most of Australia’s known remaining oil resources are condensate and liquefied petroleum gas (LPG) associated with giant offshore gas fields in the Browse, Carnarvon and Bonaparte basins. Australia’s known remaining oil (combined crude oil, condensate and LPG) reserve production life is estimated at just over 14 years (Geoscience Australia, 2016).
There is scope for growth in Australia’s oil reserves in existing fields, and for new oil discoveries in both proven basins and in underexplored frontier basins that are prospective for petroleum. Liquids associated with new shale gas developments and light tight oil may add further oil resources in the future if economic and environmental challenges can be overcome.
1.1.2 Natural gasGas is Australia’s third largest energy resource after coal and uranium. Australia’s identified conventional gas resources have grown substantially since discovery of the significant gas fields along the NWS in the early 1970s. Australia’s gas resources have increased more than fivefold over the past 40 years (Geoscience Australia, 2016). Most of the conventional gas resources (around 95 per cent) are located in the Carnarvon, Browse, Bonaparte and Gippsland basins off Australia’s North-West and South-East coasts. These resources have been progressively developed for domestic use and liquefied natural gas (LNG) export.
At the end of 2014, Australia’s total identified conventional gas resources were estimated at 169 trillion cubic feet (tcf). At current production rates, there are sufficient conventional gas reserves (70 tcf) to last another 34 years (Geoscience Australia, 2016). Many offshore gas discoveries have remained sub-economic (contingent). Australia’s gas reserves will increase substantially following the conversion of contingent resources earmarked for development via new projects.
Page 18

Australia also has large unconventional gas resource potential in many basins, including coal seam gas (CSG), shale gas and tight gas. Exploration of unconventional gas resources has been widespread throughout Australia.
Significant CSG resources have been identified in the major coal basins of Eastern Australia. CSG is expected to remain the most important sector of Australia’s unconventional gas industry and is being developed for domestic use and LNG export. In 2014, Australia’s CSG reserves were 43 tcf, accounting for about 38 per cent of Australia’s total gas reserves. Reserve life is estimated to be around 130 years at current rates of CSG production. More than 93 per cent of the reported CSG reserves are in Queensland, with the remainder in New South Wales (NSW). In addition to reserves, Australia has substantial contingent resources (32 tcf) of CSG (Geoscience Australia, 2016).
Large amounts of shale and tight gas resources (about 13 tcf of contingent resources) have also been identified. More than 600 tcf of unconventional prospective gas resources have been estimated for various sedimentary basins. Gas production from shale gas resources started in the Cooper Basin in 2012 (Geoscience Australia, 2016).
Australia’s total identified gas resources are in the order of 257 tcf which is equal to around 106 years of gas at current production rates. Known gas reserves account for about 47 years of this production life while the rest is attributed to contingent resources (Geoscience Australia, 2016).
1.2 GROWTH OF AUSTRALIA’S OIL AND GAS INDUSTRY 1.2.1 Development of Australia’s oil and gas industryThe emergence of oil and gas as a major Australian industry commenced in the 1960s when the Esso and BHP joint venture drilled the first offshore well in Bass Strait. The initial focus was on oil production given the large oil discoveries and their significant market value.
As shown in Figure 1.1, Australia’s oil production increased rapidly from first production in the mid-1960s through to the mid-1970s. From then until around the turn of the century Australia’s oil and condensate production continued to increase at a steadier rate, with some yearly deviations. Since 2000, Australia’s oil and condensate production has been in gradual decline. However, the start-up of new offshore based LNG projects is expected to see a short term rise in condensate production over the next few years as the petroleum liquids are developed at the start of the projects.
Page 19

Figure 1.1 — Australia’s crude oil and condensate production
Source: Department of Industry, Innovation and Science, 2016a & 2016b.
When the PRRT was introduced in the late 1980s, Australia’s oil and gas industry had a very different look with respect to oil and gas production compared to today. As shown in Figure 1.2, over this period Australia’s oil and condensate production has nearly halved, while gas production has increased more than fivefold with further rises expected as a number of large LNG projects commence and expand production.
Figure 1.2 — Change in Australia’s oil and gas production since PRRT introduction
Oil and Condensate (million litres) Gas (million cubic metres)
31264
1567918395
81186
1987-88 2015-16Source: Department of Industry, Innovation and Science, 2016a & 2016b.
The industry’s transition towards a greater focus on gas over oil has largely been brought about by the commercialisation of significant new gas discoveries, a growing market for this resource, both domestically and overseas, and limited success in finding new oil.
This transition commenced with the discovery of substantial gas resources along the NWS in offshore Western Australia (WA) in the early 1970s. The first development phase of the NWS project commenced in 1980 and it started to
Page 20
0
5,000
10,000
15,000
20,000
25,000
30,000
35,000
40,000
45,000
0
5,000
10,000
15,000
20,000
25,000
30,000
35,000
40,000
45,000
1963-64 1973-74 1983-84 1993-94 2003-04 2013-14
Million litresMillion litres
Crude oil and condensate
Forecast

supply gas into the WA market in 1984 and shipped its first LNG cargo to Japan in 1989.
Since then, Australia has steadily expanded its LNG supply capacity with the development of substantial offshore gas discoveries. Production from the NWS project was expanded throughout the 1990s and 2000s.
The Darwin LNG project commenced production in 2006 processing gas from the Bayu-Undan field in the Joint Petroleum Development Area (JPDA) shared between Australia and Timor Leste. This was followed by the Pluto LNG project which commenced production in 2012. Figure 1.3 illustrates the long term steady increase in Australia’s gas production, with LNG exports comprising an increasing share of Australia’s overall gas production.
Figure 1.3 — Australia’s gas balance
Source: Department of Industry, Innovation and Science, 2016a, 2016b & 2016d.
1.2.2 LNG investment boomAustralia has received a significant share of recent global investment in LNG supply capacity. This investment has been spurred by a previous period of constrained supply, rising demand and high oil and gas prices. Between 2009 and 2012, final investment decisions (FID) were taken on seven major new LNG projects in Australia, representing around $200 billion in capital expenditure. At the height of this investment boom in 2013, the International Energy Agency reported that over two-thirds of global investment in LNG capacity was occurring in Australia (International Energy Agency, 2013, p. 110). As a result, Australia’s share of global LNG exports is forecast to increase from 12 per cent in 2015, to 24 per cent in 2018 (Department of Industry, Innovation and Science, 2016c, p. 10).
In this investment phase, the three CSG based LNG projects in Queensland (Queensland Curtis LNG, Gladstone LNG and Australia Pacific LNG) were the first completed, achieving first gas (LNG exporting) over 2015 and early 2016. Three conventional offshore gas projects (Gorgon, Wheatstone and Ichthys) in WA and the NT are also transitioning to production. Gorgon shipped its first LNG cargo in
Page 21
0
20000
40000
60000
80000
100000
120000
140000
160000
0
20000
40000
60000
80000
100000
120000
140000
160000
1974-75 1984-85 1994-95 2004-05 2014-15
Million cubic metresMillion cubic metres
LNG exports Domestic gas consumption
Forecast
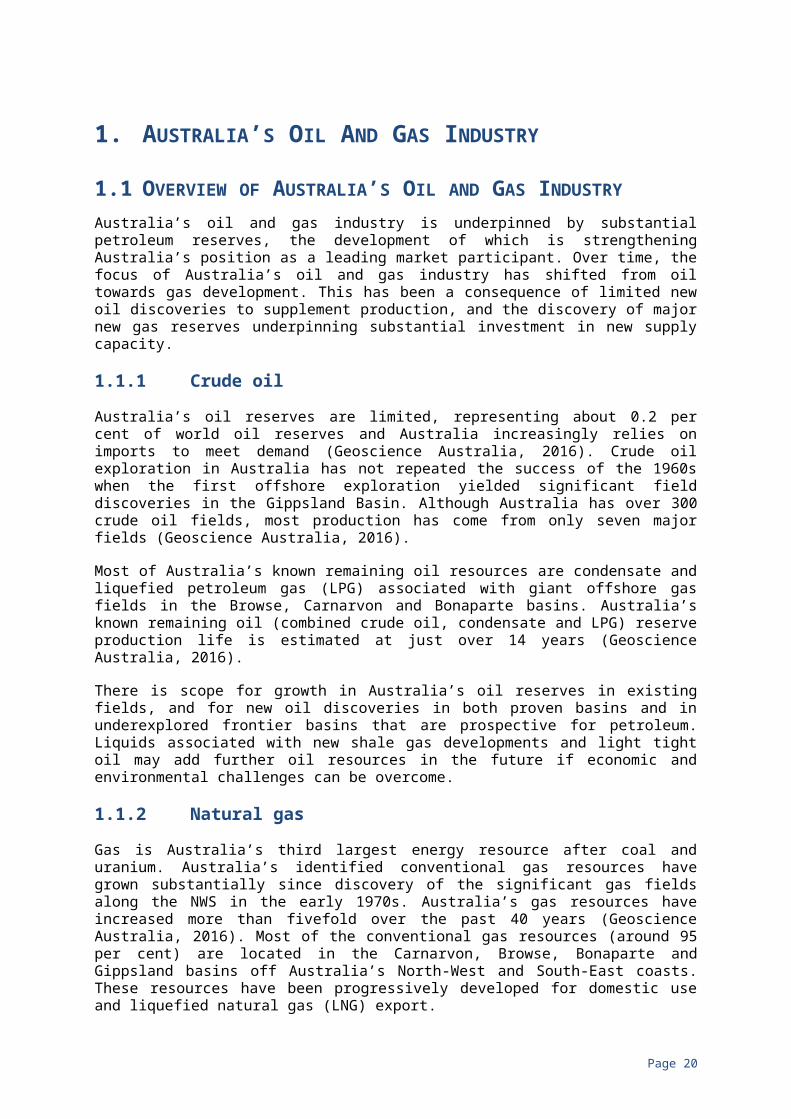
March 2016, while the Wheatstone and Ichthys projects are expected to commence by the end of 2017. Australia’s first floating LNG project, Prelude, is also nearing completion with first gas likely in 2018. The location of these projects is shown in Figure 1.4 and a full list of the projects and their respective details is provided in Appendix A.
Figure 1.4 — Australia’s major oil and gas projects
Source: Department of Industry, Innovation and Science and Petroleum Resource Rent Tax Review Secretariat.
When all projects are operational, Australia will have 10 LNG projects comprising 21 trains with a total liquefaction capacity of around 87 million tonnes per annum (mtpa), as shown in Figure 1.5 below (Department of Industry, Innovation and Science, 2016b, p. 77).
Page 22

Figure 1.5 — Australia’s liquefaction capacity
Source: Department of Industry, Innovation and Science, 2016b.
Page 23
0
20
40
60
80
100
0
20
40
60
80
100
1989 1991 1993 1995 1997 1999 2001 2003 2005 2007 2009 2011 2013 2015 2017 2019
mtpamtpa
North West Shelf Project Darwin LNG Pluto LNG QCLNG
GLNG APLNG Gorgon LNG Ichthys LNG
Wheatstone LNG Prelude FLNG
Existing
Committed
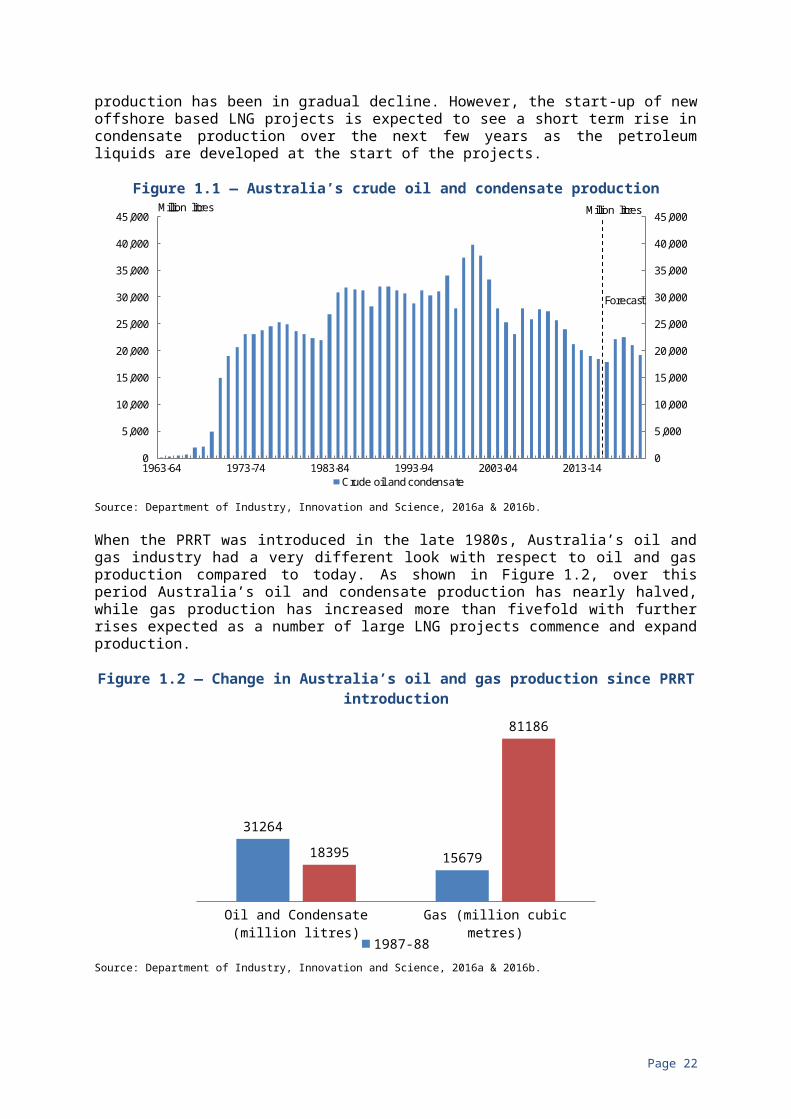
Australia’s LNG exports are expected to reach 77 mtpa in 2021-22, which is slightly below effective capacity due to strong global competition. This would represent more than a threefold increase since 2013-14 and could see Australia overtake Qatar as the world’s largest LNG exporter. In terms of Australia’s LNG export earnings, this represents an increase from $16.3 billion in 2013-14 to $47.4 billion in 2021-22 (Department of Industry, Innovation and Science, 2017, p. 72).
1.3 MAJOR OIL AND GAS PROJECTS IN AUSTRALIA1.3.1 Industry and investment benefitsA number of submissions from industry highlighted the importance of the oil and gas industry and the benefits it provides to the Australian community. In its submission, the Australian Petroleum Production and Exploration Association (APPEA) stated:
The oil and gas industry is an integral part of the Australian economy, including through: the supply of reliable and competitively priced energy; the investment of hundreds of billions of dollars of capital; the payment of taxes and resource charges to governments; the direct employment of tens of thousands of Australians; and, the generation of significant amounts of export earnings (APPEA Submission, p. 1).
As noted, recent LNG project investment in Australia involved capital expenditure of around $200 billion. Direct employment during construction across these projects was in the order of 35 000 people (Department of Industry, Innovation and Science, 2016e). The transition to the far less labour intensive production phase involves fewer direct jobs, and is expected to be around 4 400 across the projects (Department of Industry, Innovation and Science, 2016e).
Natasha Cassidy and Mitch Kosev from the Reserve Bank of Australia have commented on the economy wide implications of LNG project investment in Australia:
The decline in LNG investment and ramp-up in LNG production and exports is expected to affect Australian economic output (real GDP) and national income in a number of ways. LNG investment contributed an estimated ¼ percentage point on average to Australian annual GDP growth between 2008 and 2013, once the high share of imported inputs used to construct these projects is taken into consideration. The peak in LNG investment was in late 2013, and the continued falls in LNG-related investment will subtract from GDP growth in the next few years as the construction of large-scale projects is gradually completed. As the projects begin to ramp up production, the Bank currently estimates that LNG exports will contribute around ¾ percentage point to GDP growth in 2016/17. The timing of the boost will depend on whether these projects are completed on schedule and how quickly production is ramped up. As production of LNG gradually stabilises at a higher level, the boost to GDP growth will dissipate although GDP will remain at a higher level (Cassidy and Kosev, 2015, p. 40).
Page 24
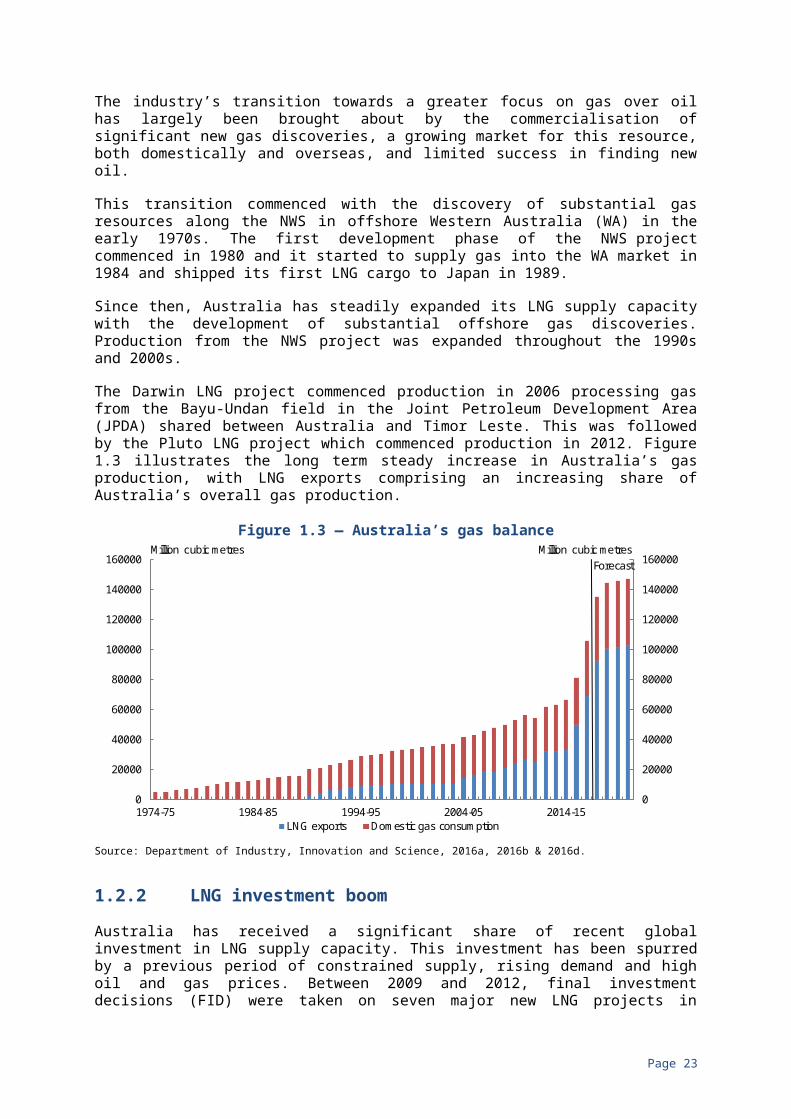
Consultancy firm McKinsey Australia has commented on the potential long term benefits of Australia’s new LNG projects beyond construction into the production phase:
Based only on projects for which the final investment decision has been taken, 55,000 to 65,000 people are expected to be employed in the wider LNG industry and its direct supply chain (that is, direct and indirect jobs) during the operations phase. Most of these jobs are highly skilled and remunerated well above Australia’s average wage. Throughout the 2020s and beyond, the LNG industry is forecast to add around A$30 billion per annum to Australia’s GDP, equivalent to about 2 percent of the total. Depending on realised prices, LNG could contribute up to A$55 billion exports in 2020 — rivalling iron ore, Australia’s biggest commodity export today (Dediu et al, 2016, p. 3).
1.3.2 Project development challengesWhile the scale of LNG project development in Australia is significant, a number of challenges have arisen during the investment phase and are likely to persist at least in the short to medium term. In particular, the scale, scope and remoteness of the projects have contributed to cost pressures. Nearly all projects have reported cost increases on their original estimates.
Most notably, the Gorgon project has seen a considerable cost increase. Project operator Chevron announced progressive project cost increases from the original US$37 billion estimate to US$54 billion at the end of 2013 (Chevron, 2012 & 2013).
Other projects have also announced cost increases, although not to the same extent as that for Gorgon (see Table 1.1). Reported cost increases across Australia’s seven new LNG projects average around 24 per cent — however, this could be understated as more cost revisions may be released as construction transitions to completion. All projects have also been subject to delays on scheduled commencement which impacts project economics.
Table 1.1 — New Australian LNG projects: cost escalations and delaysProject Capacity
(mtpa)Est. Cost at
FID($US billion)
Est. Cost Mar 2017(US$ billion)
Cost increase
(%)
Est. First Gas at FID
First Gas at Mar 2017
QCLNG 8.5 15 20.4 36 end 2014 Jan-15
GLNG 7.8 16 18.5 15.6 end 2015 Oct-15
APLNG 9 20 22.5 12.5 2015 Jan-16
Gorgon 15.6 37 54 45.9 2015 Mar-16
Wheatstone 8.9 26.4 34 28.8 2016 est. 2H 2017
Ichthys 8.9 34 37.4 10 2017 est. 2H 2017
Prelude 3.6 12.6 12.6 0 2017 est. 2017-18
Total 62.3 161.0 199.4 23.9 AvSource: Various company statements and reports.
While each project has its own specific circumstances contributing to these cost increases and delays, industry has cited the common factors as: the strong
Page 25
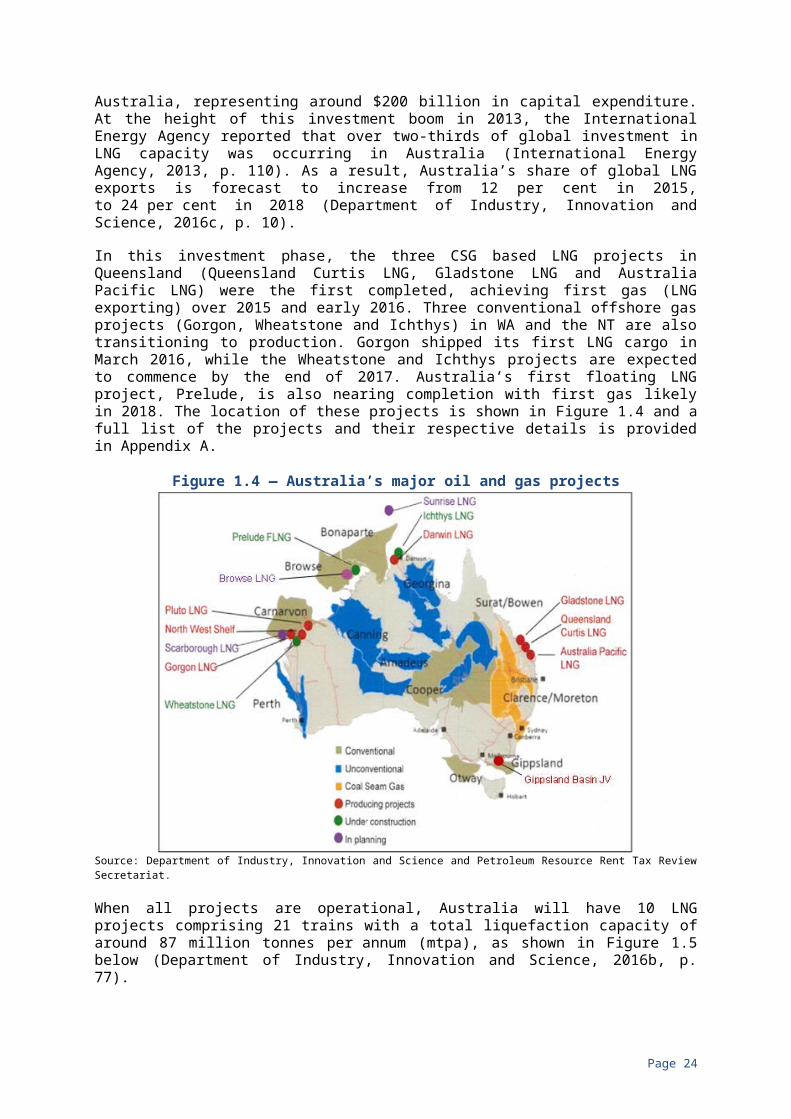
Australian dollar, high labour costs and ongoing productivity issues. Logistical challenges and weather delays are also cited as factors.
Pressures from the concurrent construction of several LNG projects in Australia have been a significant factor behind increases in labour and material costs. Some industry commentators contend that better collaboration between project proponents would have resulted in substantial expenditure reductions across the projects.
Cost overruns have focussed attention on the future competitiveness of Australia as an LNG exporter. Australian projects face new and competing sources of supply, which will place added pressure on the competitiveness of projects, especially those supplying to the Asia region.
These challenges have implications for Australia’s attractiveness to foreign investment in major oil and gas projects. In the short to medium term, investment in major projects will likely be largely limited to brownfield expansions rather than new greenfield projects. The cost of utilising and/or expanding existing infrastructure capacity is expected to be more cost competitive than building new capital intensive projects, particularly given that the current phase of LNG project investment will fully transition to production over the next year or so.
1.4 OUTLOOK FOR THE OIL AND GAS INDUSTRY1.4.1 Oil and gas pricesFluctuations in oil and gas prices affect the global oil and gas industry in a variety ways. Historically, limited global oil supply has led to price shocks stimulating expenditure to expand supply and rebalance the market.
The recent fall in world oil prices largely reflects the strength of supply, particularly the rise in production of ‘unconventional’ oil from the United States. The effect on prices was not immediate, but prices have fallen significantly in recent years and investment in the oil and gas sector has been curtailed. As shown in Figure 1.6, global oil prices rose steadily from around the early 2000s, with some dips along the way before the sharp decline in prices that occurred from 2014.
Page 26
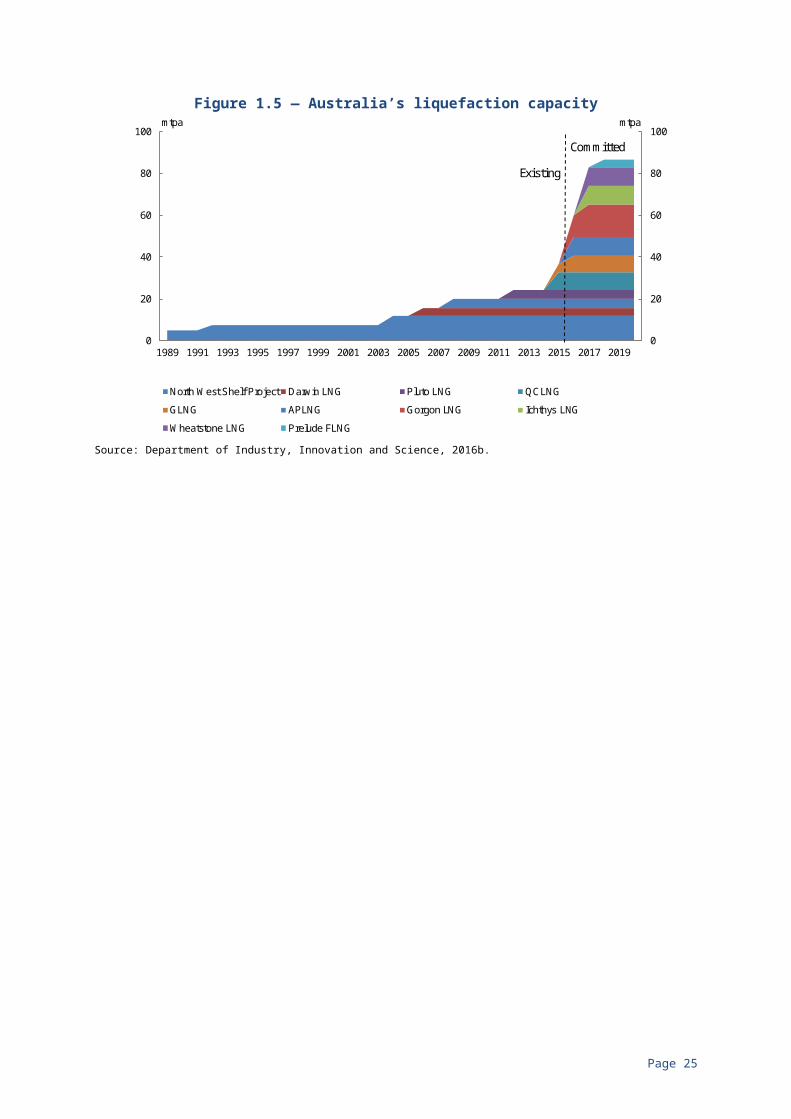
Figure 1.6 — Movements in the global oil price
Source: US Energy Information Administration, 2017.
As a net importer of oil, falling oil prices would be expected to contribute to a rise in Australia’s terms of trade, lower inflation and potentially net positive economic growth. However, this is offset to some degree by falling LNG prices, which are linked to the price of oil, resulting in reduced profits that will have an impact on government revenue.
1.4.2 LNG market structure and pricingThe vast majority of Australian LNG is sold into the Asia Pacific market under long-term bilateral contracts, typically 15 to 20 years, which are linked to the price of oil. This provides producers with a level of certainty on the recovery of significant upfront LNG project investment, and is important to Asian purchasers in terms of long-term security of energy supply.
The oil price linkage in the Asia Pacific LNG market is long standing practice. It was established for Japan’s first LNG imports in the late 1960s when oil was a major competing fuel source for electricity generation. This linkage has since been adopted by other Asian economies. This contrasts with the spot market pricing of natural gas in North America, and to a lesser extent Europe, where competing sources of gas (pipeline and LNG) are priced in hubs.
While the exact terms of the oil price linkage in Asian LNG contracts is negotiated confidentially between buyers and sellers, it is commonly linked to the price of Japanese customs cleared crude oil. This reflects the average price of crude oil imported into Japan which closely correlates to the lagged price of Brent oil.
Long-term contract price arrangements are often subject to periodic renegotiations which may occur through bilateral agreement or be triggered contractually by significant oil price movements. Some contracts also include a non-linear pricing slope, referred to as an ‘s-curve’. With an s-curve agreement, the sensitivity of LNG prices to oil price movements varies, protecting producers’ earnings at low levels of oil prices and limiting the impact on purchasers’ energy costs when oil prices are high.
Page 27
0
20
40
60
80
100
120
0
20
40
60
80
100
120
1987 1989 1991 1993 1995 1997 1999 2001 2003 2005 2007 2009 2011 2013 2015
$US/barrel$US/barrel
WTI oil price Brent oil price
While the vast majority of Australia’s LNG production continues to be traded via long-term contracts, there has been an increase in shorter-term LNG trade (that is, spot and short-term contract sales) globally. A key contributing factor is the greater flexibility that short-term contracts can provide in terms of responding to changes in sources of supply and demand for LNG.
1.4.3 Falling prices and Australia’s LNG industryThe investment decision for many of Australia’s major LNG projects was taken when oil and gas prices were high. Subsequent falls in global oil prices are affecting Australia’s LNG industry in a variety of ways, as are movements in the Australian dollar. Since the oil price began to fall in August 2014, the Asian LNG contract price has fallen at a similar rate with only a short lag due to the oil price linkage in most contracts. At the same time, the LNG spot price has also collapsed in line with contract prices, and as a result of the emerging excess supply capacity (see Figure 1.7 below).
Figure 1.7 — LNG price indices
Source: Department of Industry, Innovation and Science, 2017.
Lower oil prices are impacting Australian LNG producers as they reduce the cash flow and profitability of projects, a number of which are already over budget. The challenge for many new Australian LNG projects is that cost overruns will have raised the profit breakeven point higher than it was when contracts were executed. Despite this, projects under construction are progressing to production, given capital investments and contractual obligations. A lower Australian dollar can cushion the impact of lower oil prices as contracts are almost uniformly priced in US dollars.
Over the medium term, lower oil prices will have broader effects on the LNG market. Producers are expected to focus on efficiency improvements and savings, but lower prices could also stimulate demand for LNG as its competitiveness against other fuels (excluding oil) increases. If competing projects yet to make a FID are deferred or cancelled, this may reduce competition in the medium to longer term.
Page 28
0
20
40
60
80
100
120
0
2
4
6
8
10
12
14
16
18
Jan-2014 May-2014 Sep-2014 Jan-2015 May-2015 Sep-2015 Jan-2016 May-2016 Sep-2016 Jan-2017
$US/barrel$US/gigajoule
North East Asia Spot LNG (LHS) Aust. LNG to Japan (LHS)
Aust. LNG to China (LHS) Japan Customs-cleared Crude (RHS)
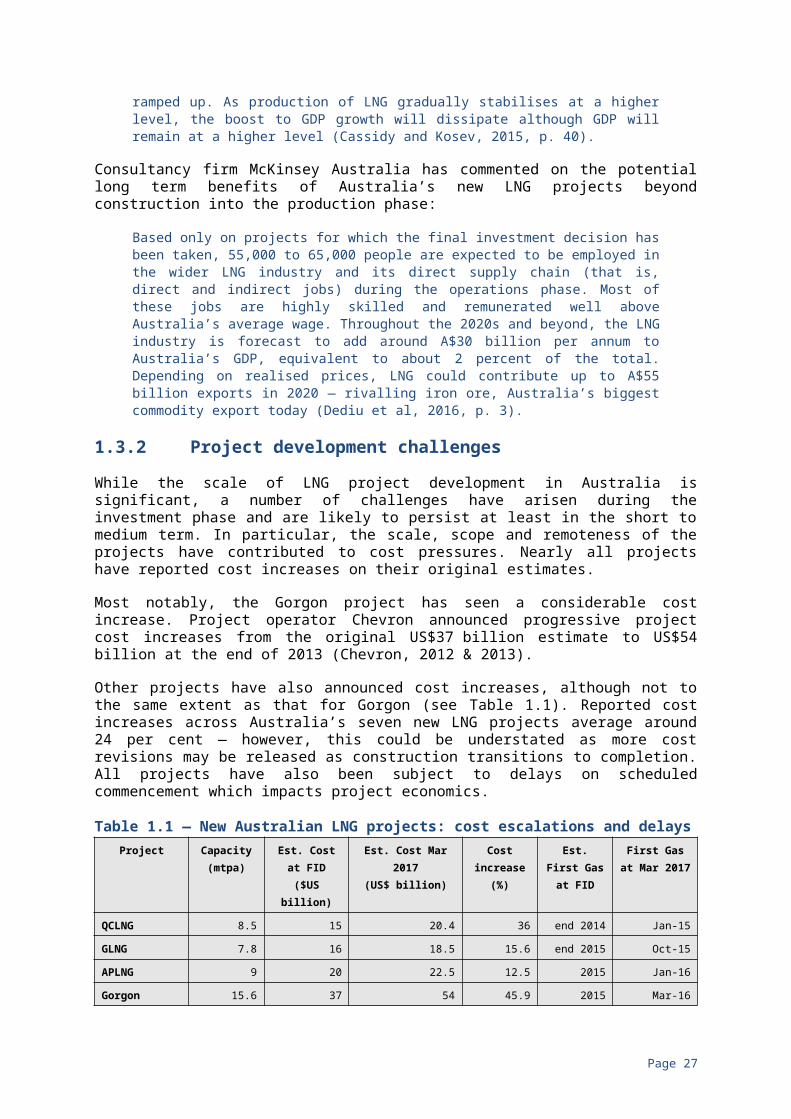
Further detail on the global LNG market and Australia’s domestic gas market is at Appendix F.
1.5 DETERMINANTS OF OIL AND GAS EXPLORATION AND DEVELOPMENT IN AUSTRALIAA number of factors determine the destination, timing and extent of investment in oil and gas exploration and development in Australia and globally. Prevailing market conditions are the single most important factor, particularly with respect to the timing and extent of investment, while country specific conditions have a major bearing on the choice of investment destination by multinational oil and gas companies.
1.5.1 Exploration influencesThe Australian Government administers policy which encourages petroleum exploration in Australia’s offshore areas. Underpinning this is the Government’s annual release of offshore petroleum acreage. All released areas are supported by pre-competitive geological and geophysical data and analysis undertaken by Geoscience Australia, which aims to reduce exploration uncertainties and promote prospectivity.
Work program bidding is predominantly used by the Joint Authority1 to award exploration permits to the applicant who proposes the optimal exploration strategy and work program, demonstrates technical and financial capacity and has a record of past performance. Some exploration permits may also be awarded via cash bidding, which the Australian Government reintroduced from 2014 to cover selected known and mature areas and as an efficient means of preventing over exploration in these areas.
Market conditions, however, are a predominant influence on investment cycles in petroleum exploration in Australia and globally. In addition, efficient, effective and stable regulatory and fiscal frameworks are an important influence on exploration activity. The Productivity Commission has highlighted the influence of market conditions and regulatory settings:
The commercial viability of investing in the upstream petroleum sector is heavily influenced by the end product prices and overall costs. Oil and gas prices are volatile and hard to predict in the longer term. Governments cannot change some negative influences, such as low oil prospectivity and geographical remoteness. On the other hand, improving regulatory performance can be a key to reducing regulatory costs and offsetting those adverse influences on investment returns in the sector in Australia (Productivity Commission, 2009, p. 224).
The influence of market conditions on exploration expenditure in Australia has been highlighted by the recent fall in Australia’s petroleum exploration expenditure which recorded its largest ever annual decrease in 2015, falling by
1 Joint Authorities make decisions on offshore petroleum titles and comprise the responsible Commonwealth Minister (currently the Minister for Resources and Northern Australia) and the relevant state or Northern Territory Minister. Joint Authorities may delegate functions and powers to relevant departmental officials.
Page 29

42 per cent to $2.7 billion (Australian Bureau of Statistics, 2016). Both onshore and offshore exploration in Australia recorded sharp declines. The main contributing factors include low oil prices and expectations of further strong future supply growth. Figure 1.8 illustrates the strong correlation between petroleum exploration expenditure and the oil price with a small time lag, typically around one year.
Figure 1.8 — Australia’s petroleum exploration expenditure and oil price
Source: US Energy Information Administration (2017) and Australian Bureau of Statistics (2016).
1.5.2 Determinants and costs of developmentFavourable market conditions are equally important to facilitating the commercial development of discovered petroleum resources. This has been evident in the latest global LNG investment phase, whereby all of the FIDs for Australia’s seven latest LNG projects occurred between 2009 and 2012, a period when the global oil price rose to over US$100 per barrel.
Notwithstanding the influence of general market conditions on the timing and extent of investment in petroleum exploration and development, the high concentration in Australia of mobile global investment reflects, at least in part, a number of country specific advantages. These include:
• Australia’s significant petroleum reserves. As noted in section 1.1 large oil discoveries underpinned early growth in Australia’s oil and gas industry while the more recent commercialisation of large gas discoveries is seeing the rapid expansion of Australia’s LNG sector.
• Policy and regulatory certainty. Australia offers a comparatively stable policy and regulatory environment required to underpin the significant long term investments which characterise the oil and gas industry.
• Stable fiscal settings. A number of industry submissions to the review emphasised the importance of ongoing stability of Australia’s taxation arrangements, and how this has been a major factor in Australia attracting significant recent investment in LNG supply capacity.
Page 30
0
20
40
60
80
100
120
0
500
1,000
1,500
2,000
2,500
3,000
3,500
4,000
4,500
5,000
1986 1988 1990 1992 1994 1996 1998 2000 2002 2004 2006 2008 2010 2012 2014 2016
$US/barrelA$million
Exploration expenditure (lhs) WTI oil price (rhs)

• Experience with and proximity to growing Asian energy markets. Australia has a longstanding record as a reliable supplier of energy to nearby Asian markets and has developed extensive market and contract experience over this period.
Despite these advantages, a number of major challenges confront the development of oil and gas projects in Australia. In particular, the development of Australia’s gas resources, especially offshore, is challenged by its remoteness, a lack of available infrastructure, geological uncertainties and the significant capital costs and long lead times required to facilitate resource recovery. Australia is a high cost destination for LNG project investment. Figure 1.9 shows the high cost of Australia’s new LNG projects compared to other projects around the world.
Figure 1.9 — Global LNG project cost curve ($ per mmbtu)
Source: Macrobusiness, 2016.
The Business Council of Australia’s submission noted research that ‘found that resource projects are 40 per cent more expensive to deliver in Australia than in the United States Gulf Coast (Business Council of Australia Submission, p 6)’. In addition, complying with regulation across jurisdictions is also cited as being costly and timely:
The environmental assessment done under federal and state legislation took more than two years, involved over 4000 meetings, briefings and presentations across interest groups and resulted in a 12,000-page report. When approved, more than 1500 conditions (1200 state and 300 federal) were imposed. These conditions had a further 8000 sub-conditions and the company invested more than $25 million in the environmental impact assessment alone (Business Council of Australia Submission, p. 7).
ExxonMobil Australia provided information (see Figure 1.10) comparing Australia’s relative costs of onshore construction for the components of engineering, fabrication and construction with equivalents in Norway, the United Kingdom, Canada, Qatar and the United States. Across all components, Australia is most costly, but is equivalent to both the United Kingdom and Norway in engineering costs.
Page 31

Page 32
Figure 1.10 — ExxonMobil onshore construction cost comparison
Source: ExxonMobil Australia Additional Information Submission, p.2.
Higher costs will impact the overall profitability and rates of return achievable by a project, which will in turn influence tax collections.
1.5.3 Fiscal risksNearly all industry submissions emphasised that given Australia’s comparatively high cost environment, it was important that it ensure ongoing regulatory and fiscal stability in order to compete with other countries as a destination for global oil and gas investments. APPEA noted:
Changes to cost structures and investor sentiment as a result of negative tax modifications can have significant implications in capital intensive projects with long lead times, impacting on exploration, development and production decisions (APPEA Submission, p. 5).
For the industry to capture the next wave of developments in the sector, a stable and balanced fiscal framework is essential. Australia has a proven, successful model (including the PRRT) which should be retained (APPEA Submission, p. 3).
Similarly, Japan Australia LNG (MIMI) Pty Ltd noted:
A stable and neutral taxation regime is essential to encourage development of resources by allowing a return on investment commensurate with the risk of exploration and development. Adverse fiscal regime changes may discourage already challenging projects to remain undeveloped when market conditions are difficult (Japan Australia LNG Submission, p. 2).
Page 33
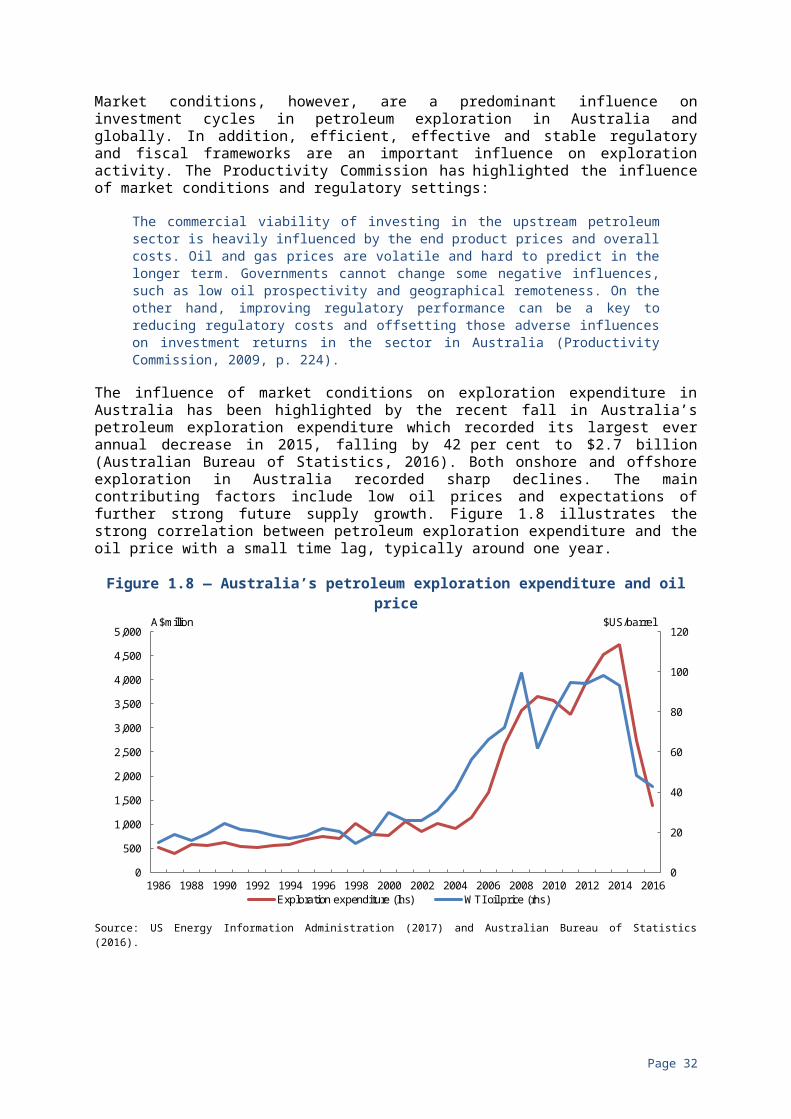
Industry submissions noted that the recent substantial investment in long-term Australian LNG projects were undertaken on the basis that long standing taxation arrangements would be maintained. The Business Council of Australia noted:
It is also critical to recognise that investment decisions are undertaken based on the tax and policy settings at the time, with consideration for stability in these settings. Australia has traditionally been considered a safe environment for oil and gas investment, with a low level of sovereign risk. Indeed, this reputation helped foster the recent $200 billion investment boom and should be maintained (Business Council of Australia Submission, p. 10).
Some industry submissions provided examples of negative impacts on oil and gas investments when other jurisdictions made changes to fiscal regimes. For example, BHP Billiton referred to tax changes in the United Kingdom impacting adversely on oil exploration in the North Sea.
The evidence suggests that tax instability in 2011 significantly discouraged investment (especially in exploration) and incentivised production declines which will take years — if ever — to recover. The UK must now offer some of the most competitive terms globally in order to attract the investment required to address the impact of the 2011 fiscal policy changes (BHP Billiton Submission, Appendix 4: Taxing North Sea Oil, p. 21).
Woodside and the Business Council of Australia also referred to examples of the consequence of fiscal policy changes provided in a 2011 report prepared for the US Department of the Interior, Comparative Assessment of the Federal Oil and Gas Fiscal System:
For example, policy changes in Alaska and Alberta contributed to a decline in petroleum-related activity and a loss of investor confidence in the stability and predictability of their regimes. Short-sighted changes that seek to extract more revenue from existing projects also risk deterring new investments or expansions of existing investments. Critically, this would come at a time when the next wave of investment needs to be encouraged and unlocked (Business Council of Australia Submission, p. 11).
In its Global Petroleum Survey 2016 the Fraser Institute rated Australia as an attractive investment destination second only to the United States. The survey across the global oil and gas industry ranks countries’ investment potential based on petroleum reserves and quantified barriers to investment including tax rates, regulatory certainty, and political stability. Supporting Australia’s standing as a desirable investment destination, the survey ranked Australia well against other jurisdictions in terms of its fiscal and taxation settings (Fraser Institute, 2016a).
Interestingly, Australia moved ahead of Canada in the 2016 survey as an attractive investment destination. The Fraser Institute cited regulatory uncertainty in Canada’s Alberta province as a major contributor:
Canada’s fall to the third most attractive region in the world for investment is reflective of Alberta’s continued deterioration, as investors continue to view the province as less attractive for investment … the Alberta government has introduced policies that are confusing and possibly costly, creating uncertainty for the oil and gas industry, which can invest elsewhere … Alberta earned low marks for regulatory duplication and inconsistencies, high taxation, and
Page 34
uncertain environmental regulations … Alberta dropped 18 spots to 43rd out of 96 jurisdictions worldwide on the Policy Perception Index, a comprehensive measure of the extent to which policy deters oil and gas investment (Fraser Institute, 2016b).
Further information comparing Australia’s fiscal and taxation settings internationally is provided in sections 2.4 and 2.5, and in Appendix E.
The view was also raised that an important part of ensuring a stable fiscal arrangement is ensuring that the community receives an equitable return for the use of its resources. If the community believes that this is not the case, then there will be pressure on governments to change the arrangements to ensure that the community is adequately compensated. The Tax Justice Network Australia called for the introduction of a royalty on existing offshore projects in order to ensure that the Australian community was appropriately compensated, arguing that such a royalty would not be retrospective in nature or create sovereign risk:
This proposal would not be retrospective, would not create sovereign risk, would equalise royalty regimes across the oil and gas sector, would maintain a stable investment climate, and not be a deterrent to future investment (Tax Justice Network Australia Submission, p. 6).
Page 35

2. TAXING AUSTRALIA’S OIL AND GAS INDUSTRY
2.1 OVERVIEW OF RESOURCE TAXATIONGovernments around the world typically tax resource extraction industries differently to other industries, such as manufacturing or services. This is done most commonly by applying additional taxes or charges on top of general taxes. Additional taxes are applied for two main reasons:
• First, non-renewable mineral and petroleum resources in most countries are publicly or government owned and so a tax or charge is applied to ensure that the community receives an adequate return for the extraction of its resources.
• Second, readily accessible, high quality resources may offer high levels of ‘economic rent’2 or profit well above a level necessary to attract capital, labour and other inputs to find and extract the resources.3 Additional taxation that just taxes economic rent should have a neutral impact on investment as it only taxes profit above that necessary to undertake investment.
In theory, absent taxation of any variety, investors seek out the best returns which, in turn, maximises overall productivity and therefore long-term growth. Ideally, imposition of secondary taxes on resources would raise tax revenue in a way that does not interfere with investors’ search for the best returns, so that Australia’s overall productivity and long-term growth are not adversely impacted.
Consistent with this ideal, the review’s terms of reference require the review to ‘have regard to the need to provide an appropriate return to community on Australia’s finite oil and gas resources while supporting the development of those resources, including industry exploration, investment and growth’.
2.1.1 Types of resource taxesOf the most common ways of imposing additional taxes on mineral and petroleum resources, cash flow taxation specifically targets economic rent and may have neutrality benefits. The PRRT seeks to emulate those neutrality benefits, but not the tax revenue risks, of a cash flow tax.
There are a number of forms of additional taxes applied to non-renewable mineral and petroleum resources. They can be compared on their revenue-raising strengths and weaknesses, as well their effect on investment decision-making.
Bids for exploration and production rights
Exploration and production rights are commonly acquired via work-program bidding or cash bidding.2 There can be many sources of economic rent. For example, land, access to a government
licence to undertake an activity where licence numbers are restricted, and monopolistic control of a technology or market may provide economic rents.
3 Lower quality resource deposits may still have some economic rent associated with them.
Page 36
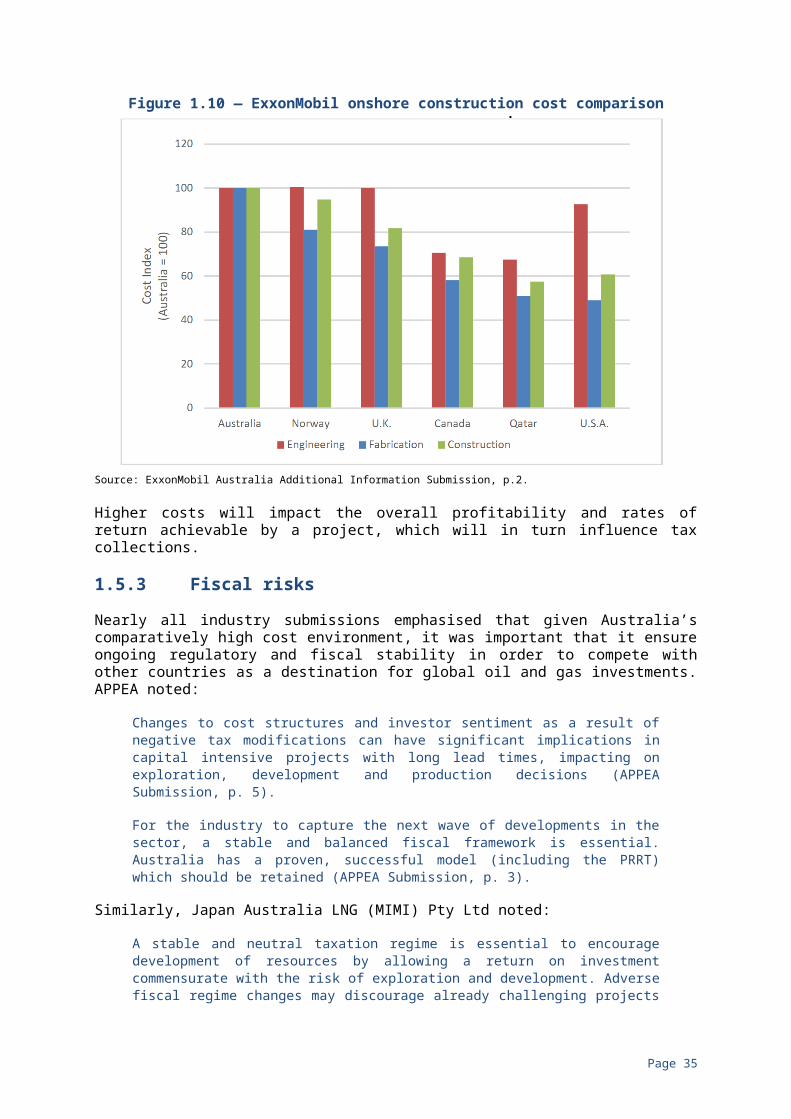
Under work-program bidding, investors may bid away prospective high profitability by offering to over-spend and over-capitalise. Investment decisions can be immediately adversely impacted without any financial return to the community. Moreover, over-capitalisation diminishes the prospects of tax revenue from profit-related taxes also applying to the resources.
In contrast, competitive cash bidding offers the prospect of up-front community return reflecting investor expectations of future high profitability without distorting investment decisions. Profit-related secondary taxes applied in conjunction with cash bids would yield additional tax revenue from unexpectedly high future profits.
Higher rates of income tax
A higher rate, or additional progressive rates, of tax are sometimes applied to the conventional income tax system to achieve additional tax revenue from mineral and petroleum resources.
Conventional income taxation applies tax at investors’ marginal income tax rates on their overall income from extraction activities, regardless of the level of profitability, as well as from other taxable activities. A higher rate (or additional progressive rates) of tax targeted as a secondary tax on investors’ resource income involves practical difficulties and inevitably imposes investment distortions.
At the practical level, for example, complications arise with ring-fencing taxpayers’ taxable income associated with extraction activities from their broader taxable income, as well as managing profit shifting between the two categories of income. In terms of impact on investment decisions, investment neutral income taxation requires investors to be facing the same marginal tax rate across alternative investment opportunities. Investment decisions will inevitably be affected if pre-tax returns from resource opportunities are reduced proportionally more than those from other investment opportunities.
Production-based royalties and excises
Royalties and excises applied to the volume or value of production (sometimes with specific cost deductions) are the most common form of secondary resource taxation.
These imposts are typically easier to administer than other forms of resource taxation, difficult to avoid and provide a transparent and early stream of revenue from the extraction of resources. However, the tax take from royalties is relatively high when profitability is low or negative and relatively low when profitability is high.
A range of related deficiencies have been commonly cited with excise and royalty regimes applying to petroleum resources. These deficiencies include: projects that earn comparable profits paying very different levels of tax; discouragement of exploration activity and marginal projects which would otherwise have been developed; and resources left in the ground that would have otherwise been extracted.
Page 37

Royalties and excises can be adjusted, either in their design or on an ad hoc basis, to reflect changes in price or volume of production in an attempt to be more sympathetic to changes in profitability. However, such arrangements cannot neatly track profitability and inevitably create investor uncertainty.
Cash flow taxation
Cash flow taxation is a form of profit-related tax that can have a neutral impact on investment decision-making (Brown, 1948, p. 300-316).
Under a pure cash flow tax (also known as a Brown tax), tax at the specified tax rate would be paid on annual positive cash flow (assessable receipts less costs) of petroleum projects, as is the case with the PRRT (see section 3.1). But, unlike the PRRT, annual negative cash flow, or losses (costs greater than assessable receipts), would attract immediate cash rebates from government equal to the loss multiplied by the tax rate. Cash flow taxation therefore cuts assessable receipts and costs (both capital and recurrent) in proportion to the tax rate. The investment neutrality properties of cash flow taxation are outlined in Box 2.1.
Page 38
Box 2.1: Investment Neutrality Properties of Cash Flow TaxationThe investment neutrality properties of cash flow taxation can be seen by considering an investor assessing the viability of a petroleum project before and after cash flow tax.
Before cash flow tax, the investor assesses project viability by comparing expected return (the discount rate that equates the up-front value of costs and sales receipts) against the investor’s risk-weighted discount (hurdle) rate. The investor may decide to invest if return is greater than the hurdle rate. The investor may also decide to invest on the basis that up-front value of sales receipts is greater than up-front value of costs with discounting at the hurdle rate (positive net present value (NPV)). Either positive project NPV or the component of project return above the hurdle rate may be considered a measure of economic rent perceived by the particular investor undertaking the viability assessment.
• Some believe, however, that any component of return above hurdle rate (or positive NPV) that comes from innovation, specialised skills, and so on, is not strictly economic rent (Freebairn, 2015, p. 586-601).
• Against such views, positive NPV or return above hurdle rate (‘above-normal’ return) would be better viewed more generally as a measure of profitability higher than that needed for any particular investor to screen projects for possible investment.
After cash flow tax, because costs and sales receipts are cut in proportion to the tax rate, post-tax return is the same as pre-tax return (same discount rate equates costs and sale receipts shared proportionally with government). The up-front value of receipts and up-front value of costs (with discounting at hurdle rate) are also cut in proportion to the tax rate. Consequently, positive project NPV is also cut in proportion to the tax rate. Project profitability measured by NPV is therefore reduced by the tax — but profitability remains above that needed to screen the project as a potential investment.
Despite clear benefits in terms of investment neutrality, cash flow taxation suffers from associated risks to tax revenue. Government would, for example, face the risk that the payout of cash rebates for tax losses was greater than tax collections, which in turn ultimately depends on the profitability of the ventures and the associated commercial nous of investors.
Resource rent taxes
There are a variety of resource rent taxation (RRT) arrangements that seek to achieve the tax neutrality benefits of a cash flow tax, but without the adverse tax revenue implications. The PRRT is an example of such a tax. The PRRT taxes annual positive cash flow just like a cash flow tax but does not provide general cash rebates for annual tax losses (negative cash flow). Tax losses are instead carried forward and uplifted (or augmented) annually and offset against any future positive cash flow of projects.
This RRT design seeks to have the investor view the reduction in RRT payable consequent on assessable receipts ultimately absorbing uplifted project losses as
Page 39

being financially equivalent to receiving an up-front cash rebate for the original losses. In these circumstances, the RRT would be viewed as matching the effect of cash flow taxation on a project’s negative cash flow (see Box 2.1).
As discussed in section 4.2, the rate at which deductions are uplifted is a central feature of the design of an RRT. Given the risk of losing deductions varies considerably between projects, uniform uplift rates are necessarily arbitrary and no level of uplift rate can compensate for deductions that are ultimately lost. Practical design of an RRT must therefore have some impact on investment decision-making. An uplift set too low will deter marginal projects, while an uplift set too high will result in the under-taxing of highly profitable projects.
2.2 RESOURCE CHARGING ARRANGEMENTS IN AUSTRALIAIn Australia, governments apply a variety of resource charging arrangements. As noted in section 1.5.1, exploration leases in Australia are awarded on the basis of work-program bidding although cash bidding was reintroduced for some exploration permits in 2014. The main resource charging arrangements generally consist of the PRRT, a crude oil excise, Commonwealth petroleum royalties and state petroleum royalties. Table 2.1 outlines where the different types of resource charging arrangements apply in Australia.
Page 40
Table 2.1 — Summary of resource charging arrangements in AustraliaPRRT Excise State Royalties Commonwealth
RoyaltiesResource Rent Royalty (RRR)
Commodities Any naturally
occurring
hydrocarbon (or
naturally occurring
mixture of
hydrocarbons)
whether in
gaseous, liquid or
solid state.
Includes oil shale.
Crude oil and
condensate
Any naturally
occurring
hydrocarbon (or
naturally occurring
mixture of
hydrocarbons)
whether in
gaseous, liquid or
solid state.(a)
Any naturally
occurring
hydrocarbon (or
naturally occurring
mixture of
hydrocarbons)
whether in
gaseous, liquid or
solid state.
Any naturally
occurring
hydrocarbon (or
naturally occurring
mixture of
hydrocarbons)
whether in
gaseous, liquid or
solid state.
Excludes oil
shale.
Onshore (b) Yes
(since
1 July 2012)
Yes
(excluding Barrow
Island)
Yes No Barrow Island
only
Offshore Yes
(since 1988)
North West Shelf
project only
No North West Shelf
project only
No
North West Shelf project (special offshore area)
Yes
(since
1 July 2012)
Yes No Yes. Shared with
WA (c)
No
Barrow Island (special onshore area)
Yes No
(replaced with
RRR)
No
(replaced with
RRR)
No
(replaced with
RRR)
Yes
(since 1985)(d)
Bass Strait(offshore)
Yes
(since 1990-91)(e)
No No No No
(a) Slight variations across states.(b) Including within three nautical miles of the Australian coastline. The Commonwealth is also entitled to 40 per cent of
royalties obtained by WA from petroleum developments derived from pre-1979 leases which are located in the coastal waters region adjacent to WA.
(c) These royalties are shared with WA according to the formula set out in the Offshore Petroleum and Greenhouse Gas Storage Act 2006 — Section 75 (approximately one third to the Commonwealth, two thirds to WA).
(d) Shared between the Commonwealth and WA 75:25.(e) Production in Bass Strait changed from a royalty/excise regime to PRRT in 1990-91.
Page 41
2.3 REVENUE FROM RESOURCE CHARGING ARRANGEMENTS2.3.1 Historic Commonwealth resource revenueThe level of revenue collected by the Australian Government from PRRT, crude oil excise, and Commonwealth royalties is shown in Figure 2.1.
Figure 2.1 — Resource tax collections
Source: Australian Taxation Office and Department of Industry, Innovation and Science.
Throughout the 1990s and early 2000s, PRRT revenue averaged around 0.2 per cent of GDP, peaking at almost $2.5 billion in 2000-01. From 2002-03 to 2015-16, PRRT revenue has been lower as a proportion of GDP, averaging around 0.12 per cent of GDP. The reduction in receipts from PRRT reflects subdued oil and gas prices, declining production in mature fields and large amounts of deductible expenditure from the recent investment boom.
Crude oil excise revenue averaged around 0.05 per cent of GDP from 2000-01 to 2011-12 but has been declining since 2012-13. Revenue from crude oil excise is expected to remain subdued due to the weaker oil price outlook. Crude oil excise collections are driven by oil prices and production levels in areas where excise applies. Policy decisions have also had an impact on excise collections, including: replacement of the excise with the PRRT in some areas (1985, 1988, 1990); the introduction of a tax exemption for the first 30 million barrels of production in 1987; a past exemption for condensate production (between 1977 and 2008); and the variable excise rates that apply depending on when the resource was discovered. The removal of the condensate exemption in 2008 increased excise collections; however, collections have subsequently fallen, primarily due to the low oil price.
The Commonwealth receives royalties for petroleum production in the NWS project, Barrow Island, from some onshore leases in WA (developed before 1979) and the JPDA. From 2000-01 to 2011-12, the Commonwealth share of royalty collections averaged around 0.04 per cent of GDP. Royalty collections are driven by oil prices and production levels and have been declining since 2012-13.
Page 42
0
500
1000
1500
2000
2500
3000
3500
4000
4500
0
500
1000
1500
2000
2500
3000
3500
4000
4500
1990-91 1993-94 1996-97 1999-00 2002-03 2005-06 2008-09 2011-12 2014-15
$million$million
PRRT Excise Royalties (Commonwealth share)
As illustrated in Figure 2.1, resource tax revenue has been relatively volatile over time. This volatility has been particularly pronounced for PRRT. This is the result of the sensitivity of profits to the oil price and the structure of the industry, which comprises a small number of large taxpayers. These factors also contribute to uncertainty in forecasting PRRT. Oil price changes and one-off unexpected events such as large (deductible) capital expenditures or disruptions to production can cause large deviations from forecasts.
Figure 2.2 shows how PRRT collections have decreased as the composition of petroleum production has changed. PRRT collections have moved roughly in line with oil production, but have yet to respond to increasing gas production.
Figure 2.2 — Petroleum production and PRRT revenue
Source: Department of Industry, Innovation and Science and Department of the Treasury.
In addition to prices and production levels, the level of deductible expenditure in the system is a key determinant of PRRT revenues. The level of deductible expenditure in the system is further discussed in section 4.5.
As illustrated in Figure 2.3, the total deductible expenditure in the system has been increasing. This reflects the expansion of the PRRT onshore in 2012 (see section 3.2.1) and the very large capital investment associated with the recent LNG projects.
It is also likely that transfers of exploration expenditure from new projects entering the PRRT system have reduced revenue from existing PRRT paying projects.
The outlook for future PRRT revenue is discussed in section 2.3.4.
Figure 2.3 — Total deductible expenditure
Page 43
0
500
1,000
1,500
2,000
2,500
3,000
0
500
1000
1500
2000
2500
1999-00 2001-02 2003-04 2005-06 2007-08 2009-10 2011-12 2013-14
Petajoules$million
Oil Gas PRRT

Source: ATO Taxation Statistics, ATO submission.
2.3.2 State royaltiesIn addition to PRRT and excise, onshore oil and gas projects pay state royalties. For onshore projects such as the large CSG to LNG projects in Queensland, state royalties are the primary means of charging for resources. WA also receives approximately two thirds of the royalties collected from the NWS project. State royalty collections have declined recently due to falling oil prices. Figure 2.4 outlines state royalty collections from 2004-05 to 2015-16.
Figure 2.4 — State royalty collections4
Source: State Governments, Petroleum Resource Rent Tax Review Secretariat.
4 Data is not available for New South Wales. This is not expected to be material.
Page 44
0
50000
100000
150000
200000
250000
300000
0
50000
100000
150000
200000
250000
300000
1999-00 2001-02 2003-04 2005-06 2007-08 2009-10 2011-12 2013-14 2015-16
$million$million
Expenditure-Total
0
200
400
600
800
1000
1200
1400
0
200
400
600
800
1000
1200
1400
2004-05 2005-06 2006-07 2007-08 2008-09 2008-10 2010-11 2011-12 2012-13 2013-14 2014-15 2015-16
$million$million
State royalty collections
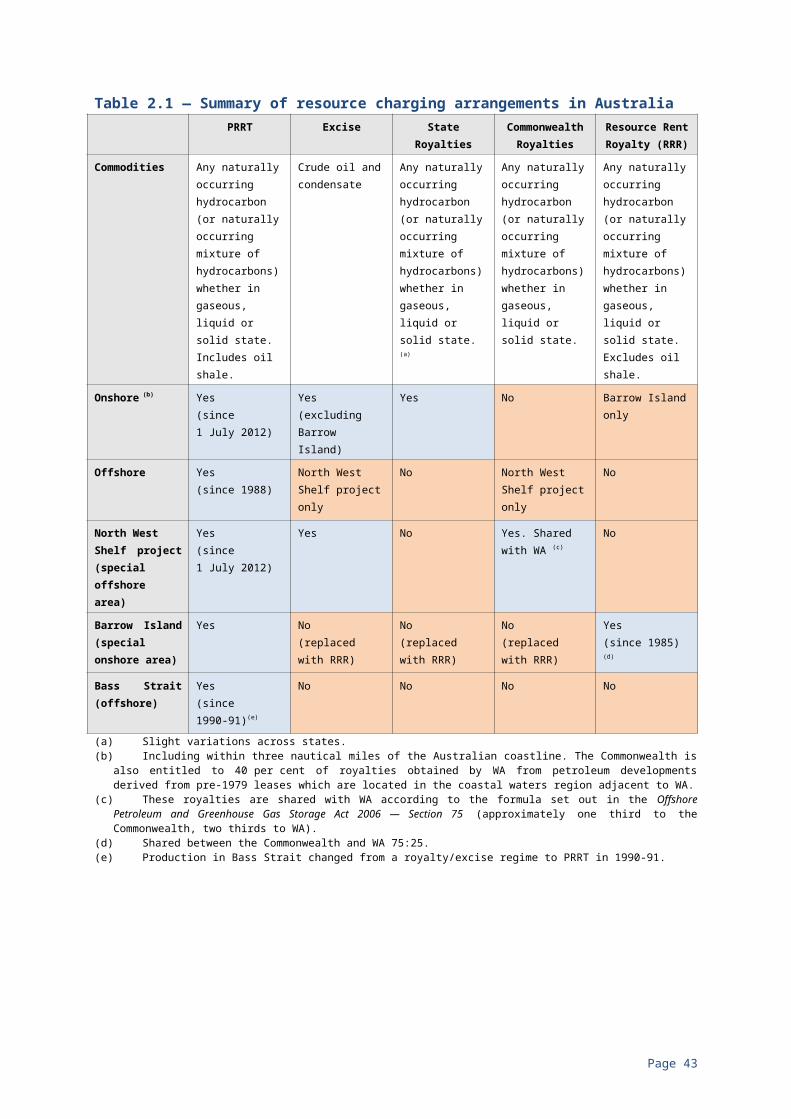
2.3.3 Company tax revenueIn addition to resource taxes, oil and gas companies pay company tax on income earned in Australia like any other company operating in Australia. Companies may also pay other state taxes including stamp duties and payroll tax.
According to APPEA, company tax comprises around half of the total taxes paid by the oil and gas industry. For LNG projects that have lower profits, company tax is expected to dominate the total tax take, especially in the short term because the different tax bases result in company tax generally becoming payable before PRRT.
In terms of the segmentation of the two primary forms of taxation paid by the industry (company tax and resource taxes), on average, around half has been attributable to each form of taxation over the period since data has been collected, although this will change with company tax receipts being expected to significantly increase in coming years as new large scale export gas projects reach plateau production.
Overall, tax payments generally averaged between $7 and $8 billion per annum in the period 2007-08 to 2013-14, however this fell in 2014-15 in line with the significant reduction in commodity prices and the continued decline in petroleum liquids production in Australia (APPEA submission, p. 8).
Other stakeholders, including the Tax Justice Network Australia, contested the claim that the industry pays significant amounts of company tax and noted that some companies may engage in tax minimisation activities.
Based on the ATO data, in 2013/14, the Australian operating companies of international oil and gas majors BP, Shell, Exxon and Chevron had total income of $65.6 billion, but paid company tax of less than $603 million, or under 1 per cent of total income. In 2014/15, they had total income of $58.5 billion and paid company tax of $1.3 billion, or just over 2 per cent of total income. While there are clearly legitimate reasons for lower corporate tax payments, including significant investment costs, there is also evidence of aggressive tax minimisation (Tax Justice Network Australia submission, 2007, p. 7-8).
These claims are difficult to evaluate as accurate data are not available on company tax payments that are specifically attributable to the upstream oil and gas sector. The ATO’s Taxation Statistics includes company tax data from companies involved in ‘oil and gas extraction’ activities in Australia. However, the published classifications are not always consistent over time and may not accurately reflect the main activity of a company. For companies that are also involved in other activities, such as mining or petroleum refining and retailing, this may result in company tax payments being allocated to a different classification, or in company tax paid on other activities being recorded in the oil and gas extraction classification. Companies move in and out of this category frequently, further complicating the data.
In March 2017, the ATO publicly released the tax performance data of companies with a direct or indirect interest in Australia’s major offshore oil and gas projects. However, the data do not just reflect the performance of these offshore projects
Page 45
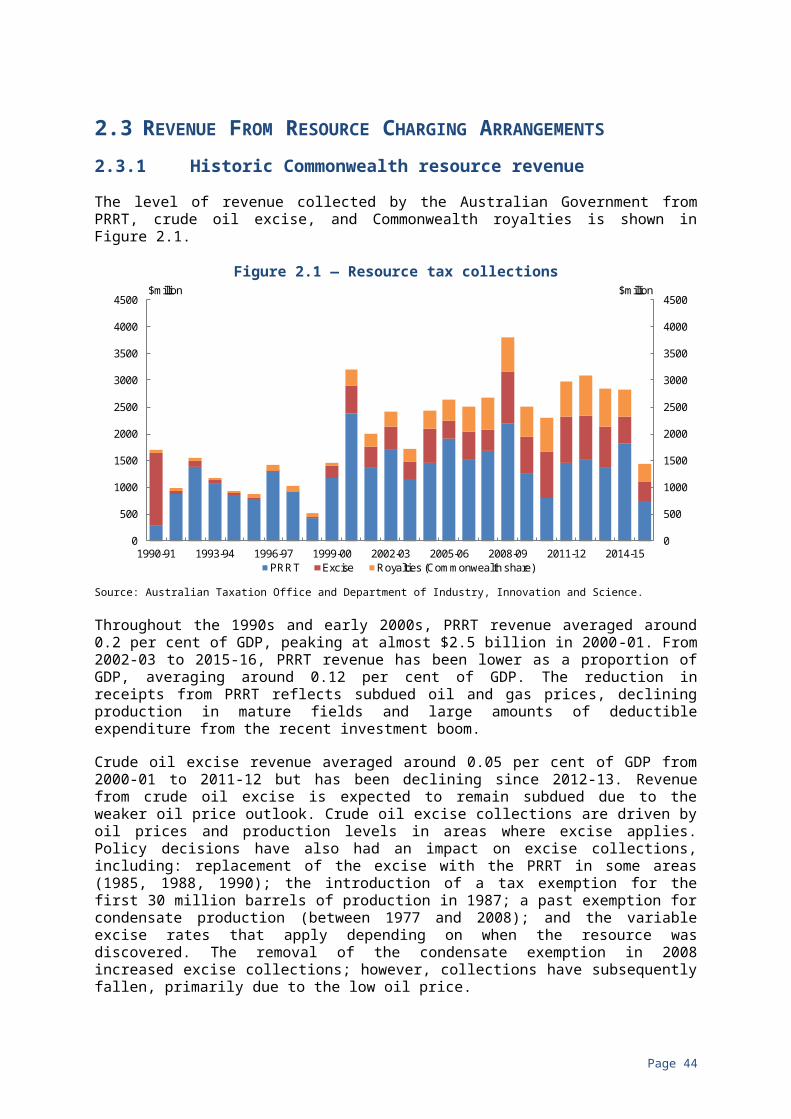
as income tax collections are reported on a taxpayer basis, rather than on a project basis.
Table 2.2 — Tax data for 2012 to 2016 income tax years5
2011-12 2012-13 2013-14 2014-15 2015-166
Number of economic groups No. 32 32 32 32 32
Net profit / loss per year7 $m 9,348 10,825 6,692 -11,140 -11,749
Profit reported $m 10,603 12,760 9,420 7,409 4,750
Loss reported $m -1,255 -1,935 -2,728 -18,550 -16,499
Net Taxable Income $m 4,189 6,982 1,880 -304 -7,419
Taxable income reported $m 6,417 8,645 5,508 6,931 3,540
Net tax loss reported $m -2,227 -1,662 -3,627 -7,235 -10,959
Tax losses deducted $m 413 422 667 1,982 290
Income tax payable $m 1,883 2,368 1,483 1,622 547
Revenue losses carried forward $m 13,160 13,981 17,685 24,052 34,436
Net capital gains tax reported $m 691 5,108 54 4,699 18Source: ATO submission to Senates Economics Reference Committee Inquiry into corporate tax avoidance and minimisation and Australia’s offshore oil and gas industry, p. 8.
Issues around whether companies are paying the right amount of company tax are outside the review’s terms of reference. There is considerable ongoing work within the Government covering these issues.
2.3.4 Modelling future PRRT revenueThe review undertook extensive modelling to obtain an insight into the factors influencing PRRT revenue, to deliver a comprehensive picture of how the PRRT system operates, and to enhance understanding of the impacts of certain design features within the system.
Many petroleum projects will operate for another 40 plus years and PRRT revenue will depend on production levels, movements in oil and gas prices, exchange rate changes and project capital expenditure. The review has not attempted to provide long-term forecasts of PRRT revenue, but has sought to highlight the influence of these variables and as such provide a guide as to the possible future course of PRRT revenue.
The review’s approach to modelling PRRT revenue is outlined in Box 2.2.
5 Data as at 27 March 2017. Where figures have been rounded discrepancies may occur between the sums of the component and their totals.
6 Some income tax returns have not yet been lodged for this year. The figures may therefore be incomplete.
7 Based on income tax return disclosures of income and expenses (not statutory account information).
Page 46
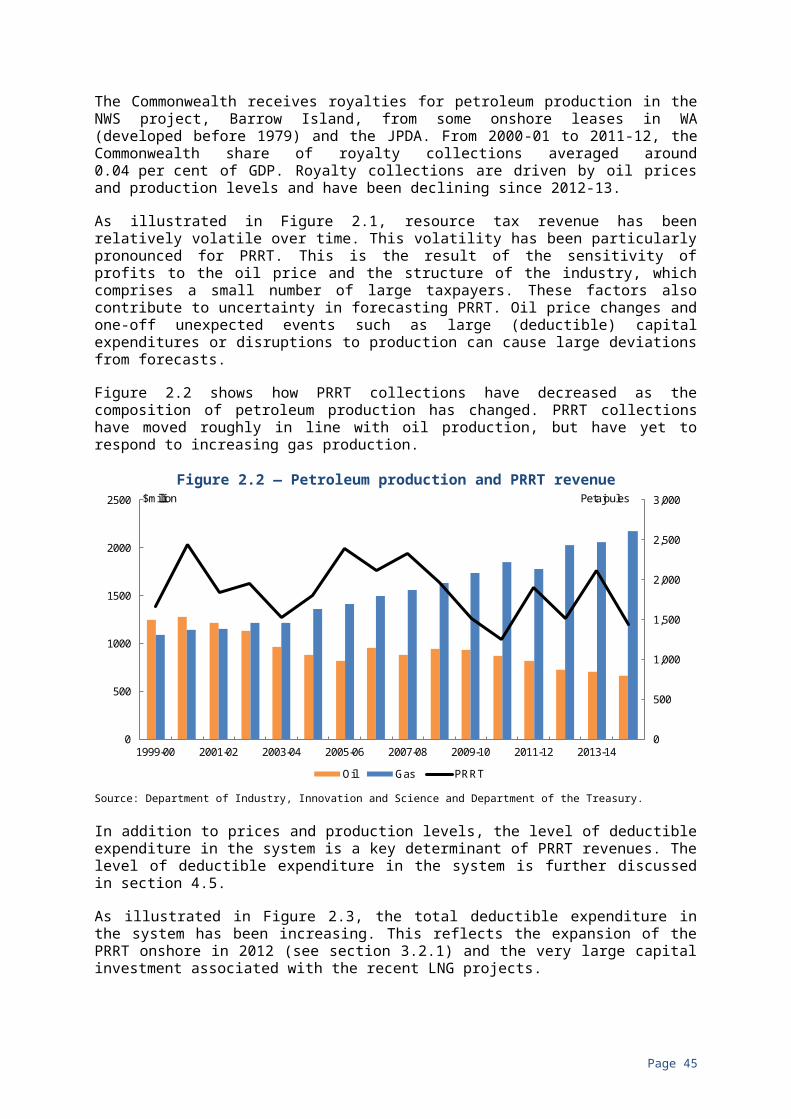
Box 2.2: The Review’s PRRT ModelThe ModelThe review has used the Department of Treasury’s PRRT model as the basis for all of its modelling. The model incorporates the main features of the PRRT system such as carry-forward of undeducted expenditure at different rates depending on the category of expenditure, ordering of deductions and GTP arrangements. In addition, each joint venture partner in a PRRT project is modelled separately given that deductions are specific to each partner. The PRRT model used was reviewed by the Australian Taxation Office and the Department of Industry, Innovation and Science.
Model DataThe modelling uses data provided from global resources consulting firm, Wood Mackenzie.8 Wood Mackenzie is a widely used source of commercial information for the resources sector, providing high quality data gathered from a variety of sources including primary research with industry operators.
The Wood Mackenzie asset reports for all Australian oil and gas projects were accessed. These asset reports contain detailed data and information on the upstream operations of projects, including information on the size of reserves, production profiles, capital cost and expenditure profiles, operating cost, expenditure profiles and estimated cash flows.
Wood Mackenzie provides an independent view of asset information and project profiles, incorporating operator feedback, public information and its own analysis and industry insight. As an independent source of information, Wood Mackenzie’s assumptions may differ from those of companies and operators about the projects in which they hold a stake. Therefore, where possible, the review made every effort to engage with individual oil and gas companies and operators to confirm the appropriateness of the Wood Mackenzie data, and make adjustments to the data where necessary to achieve as accurate as possible representation of projects and the sector as a whole. The feedback on project data provided by companies and operators assisted the review in reconciling information, and improved the integrity and reliability of the data used in the model.
The oil price and exchange rate assumptions are critical in influencing the profitability of projects and in turn PRRT revenue. The Wood Mackenzie material incorporates a central oil price assumption. From 2020 onwards a steady oil price assumption of $US65 per barrel (indexed to retain its value) is used. While not endorsing this assumption as the most likely forecast of future oil price movements, the review has used the Wood Mackenzie oil price assumptions as a baseline for its modelling work. The value in the modelling comes from having a consistent framework to assess changes from the baseline when prices or other policy parameters are changed.
While sensitivity analysis around different oil prices and changes in the design of the PRRT was conducted, the same analysis was not undertaken for different exchange rate assumptions as exchange rate movements have differing impacts
8 Wood Mackenzie provides commercial intelligence for the energy, metals and mining industries. Wood Mackenzie provides analysis and advice on assets, companies and markets.
Page 47

on companies depending on individual financing and contractual arrangements.
Box 2.2: The Review’s PRRT Model (continued)The PRRT model incorporates projections for the 10 year long term government bond rate (LTBR) consistent with the Government’s budget methodology.
The modelling was conducted on a financial year basis. For example 2027, refers to the financial year 2026-27 and 2050 refers to the financial year 2049-50.
Scenario analysis
To highlight some of the factors influencing future PRRT revenue, the PRRT model was used to assess a range of scenarios which incorporate different key assumptions. The scenarios include:
• unadjusted scenario — unadjusted Wood Mackenzie data;
• baseline scenario — Wood Mackenzie data adjusted by the review following engagement with companies, including on the transferability of exploration expenditure deductions;
• baseline scenario with no allowance for transferability — the review’s baseline assumptions but removing the provision in the existing PRRT arrangements for companies to transfer exploration expenditure deductions; and
• oil price scenarios — in addition to the baseline oil price assumption, the impact of three oil price assumptions ($US45, $US80 and $US100) are assessed.
Unadjusted scenario (unadjusted Wood Mackenzie data at $US65)Under this scenario, illustrated in Figure 2.5, unadjusted Wood Mackenzie data are used in the review’s PRRT model. The scenario assumes a steady oil price assumption of $US65 per barrel (indexed to retain its real value). The unadjusted scenario assumes the PRRT system operates on a project basis and does not take into account the transferability of exploration expenditure.
Page 48

Figure 2.5 — Unadjusted scenario (unadjusted Wood Mackenzie data) at $US65
Source: Petroleum Resource Rent Tax Review Secretariat.
Under the unadjusted scenario, PRRT revenue is estimated to total around $12 billion over the 10 years to 2027, and $48 billion over the period to 2050.
Under this scenario most of the major LNG projects do not pay any PRRT. PRRT revenue comes largely from the existing Bass Strait, Enfield-Vincent and Pyrenees-Macedon projects, with some revenue also coming from the Ichthys and Wheatstone projects.
In the absence of exploration expenditure being transferred, PRRT revenue would be very subdued over the period. This is because under these assumptions exploration expenditure is retained in the original project and only deducted after general expenditure, allowing it to be uplifted, typically at LTBR plus 15 percentage points, over a longer timeframe (for more detail on the transferability of exploration expenditure, see section 4.3)
Uplift at LTBR plus 15 percentage points allows exploration deductions to almost double every four years, which means that a moderate amount of exploration expenditure can grow into a large tax shield, while general expenditure is being deducted.
Baseline scenario (Wood Mackenzie data adjusted for exploration transfers) at $US65Under this scenario, adjusted Wood Mackenzie data are used in the PRRT model. The adjustments are based on discussions with individual oil and gas companies. The baseline scenario includes the transferability of exploration expenditure. Under the PRRT rules, eligible exploration expenditure owned by a company is compulsorily transferred to a paying project in which the same company has ownership (see Appendix B.1.7). This results in more PRRT being paid overall, as deductible exploration expenditure is used more quickly and so does not compound for as long. The adjustments to the Wood Mackenzie data incorporate feedback from companies on future exploration expenditure which in their view is likely to be transferred.
Page 49
-3,000
-2,000
-1,000
0
1,000
2,000
3,000
4,000
5,000
-3,000
-2,000
-1,000
0
1,000
2,000
3,000
4,000
5,000
2018 2020 2022 2024 2026 2028 2030 2032 2034 2036 2038 2040 2042 2044 2046 2048 2050
$million$million
Unadjusted Scenario
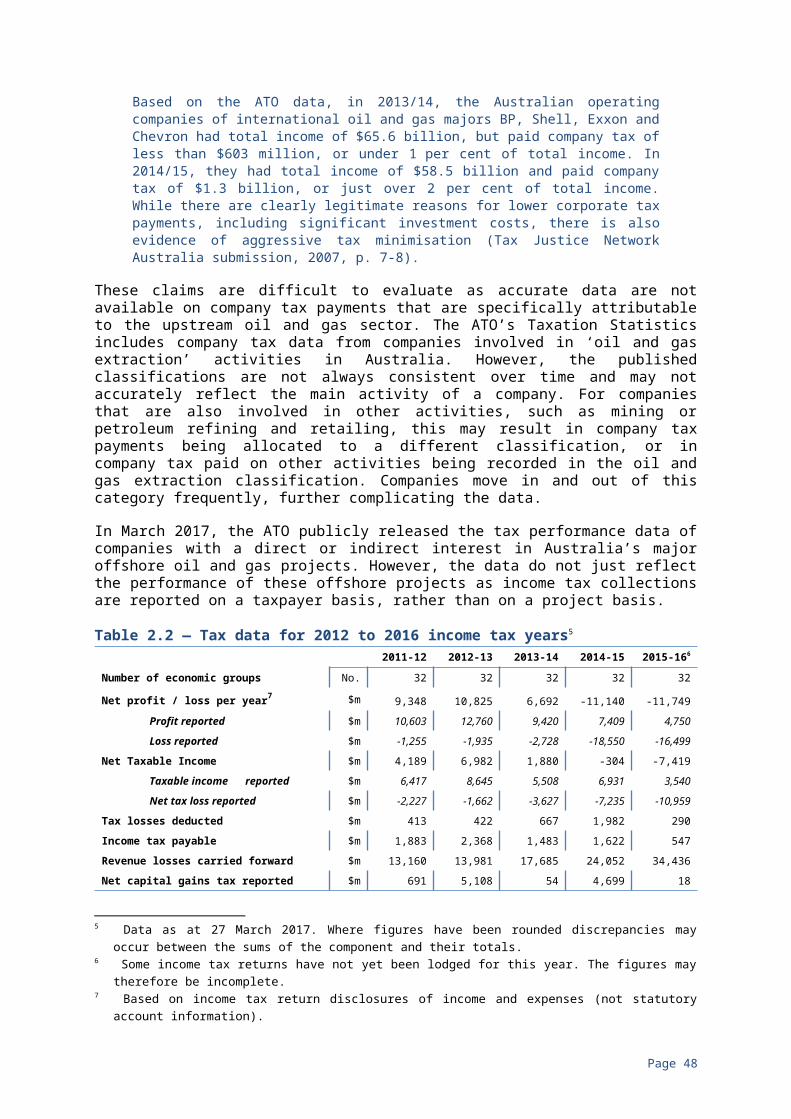
The baseline scenario, illustrated in Figure 2.6, assumes a steady oil price assumption of $US65 per barrel (indexed to retain its real value).
Figure 2.6 — Baseline scenario (adjusted Wood Mackenzie data with exploration transfers) at $US65
Source: Petroleum Resource Rent Tax Review Secretariat.
Under the review’s baseline scenario, PRRT revenue is estimated to total around $12 billion over the ten years to 2027, while PRRT revenue in the period to 2050 is estimated to be about $106 billion.
Under the baseline scenario, Bass Strait, Enfield-Vincent and Pyrenees-Macedon are expected to continue paying PRRT throughout their project lives. New projects that are expected to pay PRRT over the next decade are Gorgon, Ichthys, Wheatstone and Pluto. Collections are then expected to remain relatively high throughout the life of these projects. The baseline scenario also illustrates negative PRRT revenue in the mid-2040s, as major projects like Bass Strait and Ichthys come to an end and have their closing down costs refunded (see section 4.8). Onshore projects are not expected to pay PRRT because of their starting base deductions and resource tax credits for royalties paid.
The baseline scenario reflects PRRT collections from projects that are currently operating or in development, but does not include discoveries or developments that could take place in the future. The baseline scenario also does not include deductible expenditure that may currently sit outside the PRRT system and has not been advised to the review. For example, exploration expenditure that has been undertaken for possible future projects, deductions for which may either be used by new projects if they proceed or transferred to other projects. It is possible that transferability that has not been modelled will impact overall PRRT revenue.
Baseline scenario (adjusted Wood Mackenzie data with no exploration transfers) at $US65Under this scenario, illustrated in Figure 2.7, adjusted Wood Mackenzie data are used in the PRRT model. However, the feature of transferable exploration expenditure is removed.
Page 50
-1,000
0
1,000
2,000
3,000
4,000
5,000
6,000
7,000
8,000
-1,000
0
1,000
2,000
3,000
4,000
5,000
6,000
7,000
8,000
2018 2020 2022 2024 2026 2028 2030 2032 2034 2036 2038 2040 2042 2044 2046 2048 2050
$million$million
Baseline Scenario at $US65

Figure 2.7 ― Baseline scenario (adjusted Wood Mackenzie with no exploration transfers) at $US65
2018
2020
2022
2024
2026
2028
2030
2032
2034
2036
2038
2040
2042
2044
2046
2048
2050
-3,000
-2,000
-1,000
0
1,000
2,000
3,000
4,000
5,000
6,000
-3,000
-2,000
-1,000
0
1,000
2,000
3,000
4,000
5,000
6,000
Baseline Scenario (No Exploration Transfers) at $US65
$million $million
Source: Petroleum Resource Rent Tax Review Secretariat.
Under this scenario, total PRRT revenue is estimated to be $15 billion over the ten years to 2027, and $72 billion over the period to 2050.
This scenario illustrates the importance of the feature of the PRRT that requires the compulsory transfer of exploration expenditure. It demonstrates that compulsory transfers of exploration expenditure, where it occurs, reduces the chance that uplifted exploration expenditure grows so large that it can effectively shield profitable projects from tax. This scenario also highlights the effect of the exploration uplift of LTBR plus 15 percentage points in combination with the order of deductions which sees transferable exploration expenditure deducted last. These two features of the PRRT when combined can see deductible exploration expenditure grow, delaying and reducing PRRT payments (see sections 4.2, 4.3 and 4.4).
Under the baseline scenario with no exploration transfers, Bass Strait, Enfield-Vincent and Pyrenees-Macedon are expected to continue paying PRRT throughout their project lives. New projects like Pluto, Ichthys and Wheatstone are also expected to pay PRRT under this scenario. However, Gorgon will pay very little PRRT and much later in its life. This is because uplifted exploration expenditure continues to grow for a long period, delaying when the project will pay PRRT.
Oil price scenariosThe review modelled its baseline scenario (adjusted Wood Mackenzie data with exploration transfers) under different oil price scenarios. The purpose was to observe the sensitivity of PRRT revenue to changes in oil prices.
Figure 2.9 illustrates the level of PRRT revenue under three different oil price scenarios ― a low oil price ($US45 per barrel indexed), a mid-range oil price ($US80 per barrel indexed) and a high oil price ($US100 per barrel indexed). The baseline scenario ($US65) is included for comparison. Historically there has been a large degree of variability in the oil price in real terms (see Figure 2.8).
Page 51

Figure 2.8 — Historical Brent oil prices9
Source: Datastream, US Bureau of Labor Statistics and Treasury.
Figure 2.9 — PRRT revenue at different oil prices
Source: Petroleum Resource Rent Tax Review Secretariat.
Changes in the oil price can have a significant impact on PRRT revenue. This is because the value of assessable receipts is generally dependent on the oil price.
Under the $US45 per barrel oil price assumption, total PRRT revenue is estimated to be $9 billion over the 10 years to 2027, and $18 billion in the period to 2050.
Under this oil price scenario, existing paying projects are expected to continue to pay PRRT. However, some new projects that are coming online, such as Ichthys, Pluto and Prelude are not expected to pay PRRT, while Gorgon and Wheatstone will pay later and much less than under a higher price scenario.9 Real Brent oil price is calculated by deflating the Brent FOB price ($US/barrel nominal) by US
CPI (indexed to Sep-14).
Page 52
0
20
40
60
80
100
120
140
160
0
20
40
60
80
100
120
140
160
Jun-70 Jun-75 Jun-80 Jun-85 Jun-90 Jun-95 Jun-00 Jun-05 Jun-10 Jun-15
$US/barrel$US/barrel
Brent price ($US/barrel, real) Average
-2,000
0
2,000
4,000
6,000
8,000
10,000
12,000
14,000
-2,000
0
2,000
4,000
6,000
8,000
10,000
12,000
14,000
2018 2020 2022 2024 2026 2028 2030 2032 2034 2036 2038 2040 2042 2044 2046 2048 2050
$million$million
$45US Oil Price $65US Oil Price $80US Oil Price $100US Oil Price

Under the $US80 per barrel oil price assumption, total PRRT revenue is estimated to be around $25 billion over the 10 years to 2027, and $169 billion in the period to 2050.
Under this oil price scenario, existing paying projects are expected to continue to pay PRRT. As in the baseline scenario, Bass Strait, Enfield-Vincent and Pyrenees-Macedon are expected to continue paying PRRT throughout their project lives. New projects Gorgon, Ichthys, Wheatstone and Pluto are also expected to pay PRRT. However, the quantum of PRRT revenue that these new projects pay under this price scenario is much higher than under the baseline. In particular, PRRT revenue from Gorgon almost doubles under this price scenario.
Under the $US100 per barrel oil price assumption, total PRRT revenue is estimated to be around $46 billion over the 10 years to 2027, and $232 billion in the period to 2050.
Under this oil price scenario, existing paying projects are expected to continue to pay PRRT. As in the baseline scenario and the $US80 price scenario, Bass Strait, Enfield-Vincent and Pyrenees-Macedon are expected to continue paying PRRT throughout their project lives. New projects Gorgon, Ichthys, Wheatstone and Pluto are also expected to pay PRRT. Again, the quantum of PRRT revenue that these new projects pay under this price scenario is much higher than under the baseline.
The projects transitioned into the PRRT in 2012 (the NWS project, and the onshore projects APLNG, QCLNG and GLNG) are not expected to pay PRRT under any of the oil price scenarios, including the $US100 per barrel scenario.
Page 53
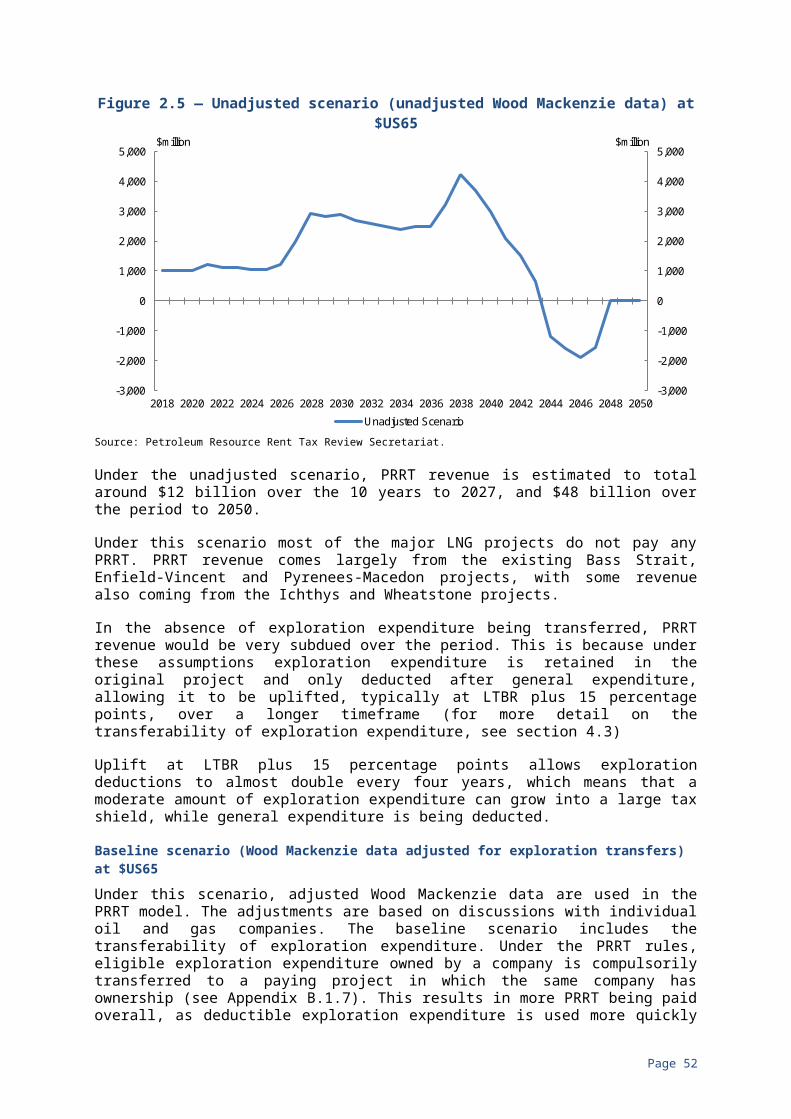
2.4 RESOURCE TAXATION IN OTHER COUNTRIESEvery country with an oil and gas industry has its own particular resource taxing arrangements and making direct comparisons is difficult. Headline rates only tell a limited story — tax rates are levied on bases that are calculated in specific ways. Deductions, exemptions and allowances also differ. There may also be interactions with other taxes or incentive schemes.
There are two main approaches countries adopt to fiscal regime design as it applies to extractive industries: a contractual arrangement with the government, which would include production sharing or service contracts; and a tax/royalty system with licencing of areas.
A contractual arrangement provides for case by case agreements on profit and risk sharing to be struck by the government for the exploration and development of each field. Under contractual arrangements, governments typically retain ownership of the resource in production. There are two main types of contractual arrangements: production sharing agreements and risk service contracts.
Under a production sharing agreement, for taking on the risk and costs of exploration and development, the investor (also called the contractor) obtains a return through a share of the production. ‘Cost oil’ represents the portion of production the contractor receives in recognition of development costs. The remaining portion is ‘profit oil’ and is often divided between the government and contractor according to the different production and profitability indicators. Different rates can be levied on profit oil as particular benchmarks are achieved, for example, on cumulative volumes, rates of return or revenue/cost ratios. While these arrangements are not as readily transparent as tax/royalty arrangements, the contracts can be constructed to achieve similar outcomes and often include both ad valorem components together with profit-based components.
Under a risk service contract, the government typically pays a fee to a contractor (international oil company) for its services (for example, commercial production from the contractual area) in line with agreed specified parameters. Usually, contractors’ costs are recovered together with an agreed rate of return.
Jurisdictions that utilise contractual arrangements have predominantly been developing countries. Examples include Iraq, Qatar, Malaysia, and Indonesia.10
The tax/royalty arrangement is also sometimes referred to as a concessionary system. Australia utilises a concession system. Examples of some other countries that also use the concession system include the Canada, Norway, Papua New Guinea, the United Kingdom, and the United States.
While there are exceptions like the United States (see Appendix E.2.5), typically, oil and gas reserves are the property of the community and the government grants companies rights to explore and extract the oil and gas resources in a particular area.
10 In January 2017, the Indonesian Government announced that a future upstream oil and gas contracts should be based on a gross split scheme (operating essentially as a tax and royalty scheme), gradually replacing the current model.
Page 54

Usually associated with these rights to explore and extract oil and gas are resource charging arrangements that are subject to conditions that are underpinned by legislation. The typical instruments used under a tax/royalty arrangement are bonus payments (with bidding), production based or ad valorem payments (royalty, severance tax), rent taxes, and corporate income tax. Key features of these instruments were outlined in section 2.1.1.
Some countries use both the concession and contract approaches; for example, Brazil and Nigeria.
Government involvement is typically motivated by increased oversight, through ‘a seat at the table’ or increased information sharing. This was probably a factor in the evolution of the contractual regime11 but is also possible in concession arrangements. Governments can also choose to participate in the upstream oil and gas sector by providing funds directly or through a government controlled body. Norway is an example of a concession approach partnered with a level of government investment.
Overall, each country’s choice of fiscal regime reflects their context, influenced by historical taxing preferences, quality of the petroleum resource, costs and risks to develop the resource, and extent of reliance on oil and gas revenues.
Countries with large, easily accessible resources and low risks and costs for development are more likely to be able to attract private investors notwithstanding relatively high taxing arrangements (for example, Qatar). In contrast, countries with a mature industry, relatively small remaining fields, high extraction costs and increased decommissioning requirements may choose to focus on attracting investment to ensure maximum extraction of resources rather than revenue maximisation (for example, the United Kingdom).
Typically, governments use a number of instruments with varying focus to balance their objectives. Table 2.3 outlines an International Monetary Fund (IMF) evaluation of various mechanisms against a range of government criteria. The IMF staff advice (for developing countries) has been to combine a rent tax with a royalty to make up the ‘resource charge’ with the balance between the royalty and rent tax components determined on a case by case basis by relative ability to bear risk and the government’s tolerance for potential delay in revenue (IMF, 2012, p. 21).
11 In which private companies can finance government participation with costs offset against future state share of production or profits. The Qatari project Pearl GTL is an example where through a Development and Production Sharing Agreement the State of Qatar retains ownership of the project. Shell provided full funding and is the project’s operator.
Page 55

Table 2.3 — Primary government objectives and relevant mechanismsGovernment Objectives
Signature Bonus
Flat Royalty Sliding Scale Royalty
Resource Rent Tax
Corporate and (variable)
Income tax
State Participation
Maximising government share over project life
x x
Securing early revenue
x x
Ensuring adequate incentives for exploration
x x
Visible share of commodity price increases
x
Strategic ownership interest
x
Maximise resource utilisation
x x
Minimise administrative burden and risks
x x
Source: IMF, 2012, p. 28.
While most countries that use concession arrangements have a production based (royalty) system as a key source of revenue from the oil and gas sector, a number use a rent tax, for example:
• Norway has a profit rent tax in the form of ‘Allowance for Corporate Capital’ design;
• some Canadian provinces (Newfoundland and Labrador, British Columbia) have moved to more complicated taxing arrangements that include components calculated on the basis of profit, although these are historically referred to as ‘royalties’;
• Papua New Guinea has an Additional Profits Tax; and
• the United Kingdom first introduced its Petroleum Rent Tax in 1975. This was reduced to 0 per cent in 2016, but other profit-based taxes remain, through the ring fenced corporations tax and supplementary charge.
Further details on some of these arrangements are in Appendix E.
The Fraser Institute, an independent Canadian research think tank has, for the last 10 years, conducted an annual international survey on barriers to investment in oil and gas exploration in jurisdictions around the world. This is a qualitative study in which jurisdictions are ranked according to the scores assigned by managers and executives in the petroleum industry to 16 factors that affect
Page 56
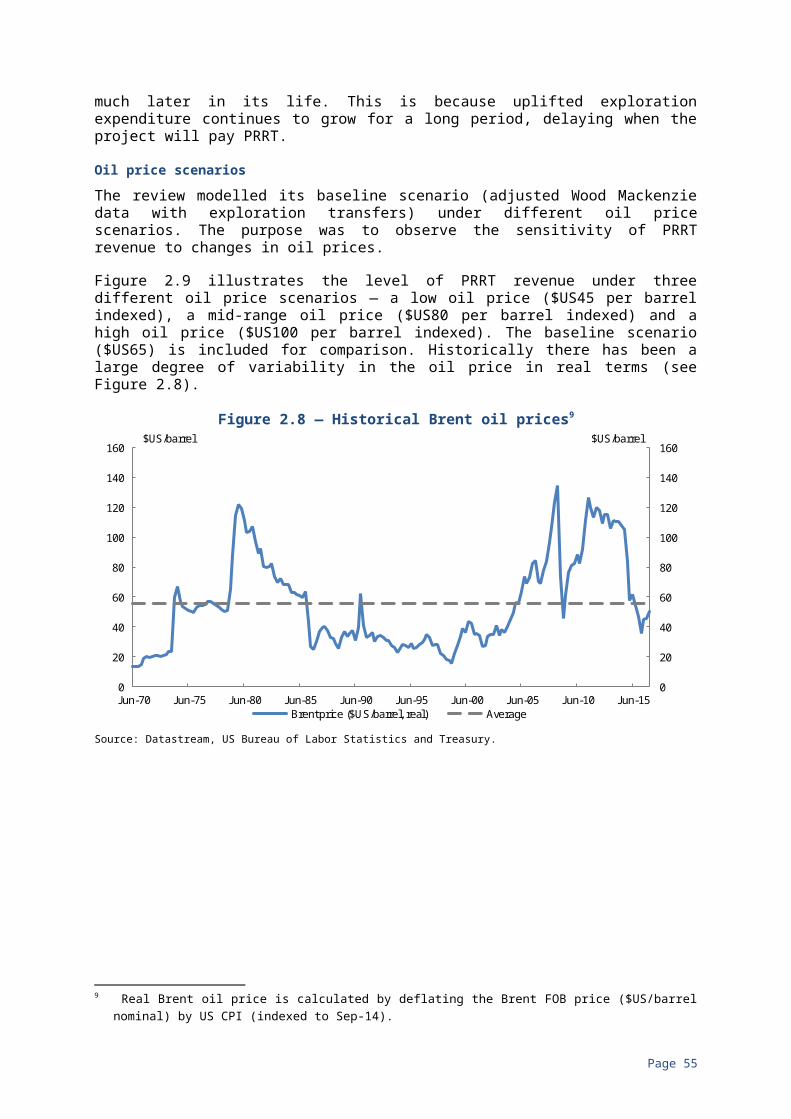
investment decisions.12 These scores are then used to generate a ‘Policy Perception Index’ for each jurisdiction that reflects the perceived extent of the barriers to investment. Table 2.4 shows the Policy Perception Index scores and rankings for a selected group of countries over the last five years.
The Australian offshore (and the WA and QLD) jurisdictions fall within the second quartile, comparable with the United States Gulf of Mexico and a number of Canadian jurisdictions. As noted in section 1.3, the 2016 report indicates that when overall regions are compared with each other, weighted by reserve size, Australia follows the United States as the most attractive region for investment.
When the two fiscal regime settings (fiscal terms and taxation arrangements13) are reviewed for the same range of countries, Australia continues to compare well with countries like Canada and Norway. These results are presented in Figures 2.10 and 2.11. This suggests Australia’s overall fiscal regime settings are not a deterrent to investment. Australia’s ability to attract significant LNG investments in recent years supports this.
12 The 16 indicators in 2016 Global Survey included fiscal terms, taxation in general, environmental regulations, regulatory enforcement, cost of regulatory compliance, protected areas, trade barriers, labour regulations and employment agreements, quality of infrastructure, quality of geological database (with similar indicators used throughout the 10 survey period).
13 ‘Fiscal terms’ refers to licences, lease payments, royalties and other production taxes, gross revenue charges that directly target petroleum production. ‘Taxation in general’ refers to corporate and personal income taxes, payroll, capital and other taxes. It includes tax arrangements that apply to corporations generally, including the oil and gas sector. Together, fiscal terms and taxation arrangement indicators provide feedback on broader fiscal regime settings.
Page 57
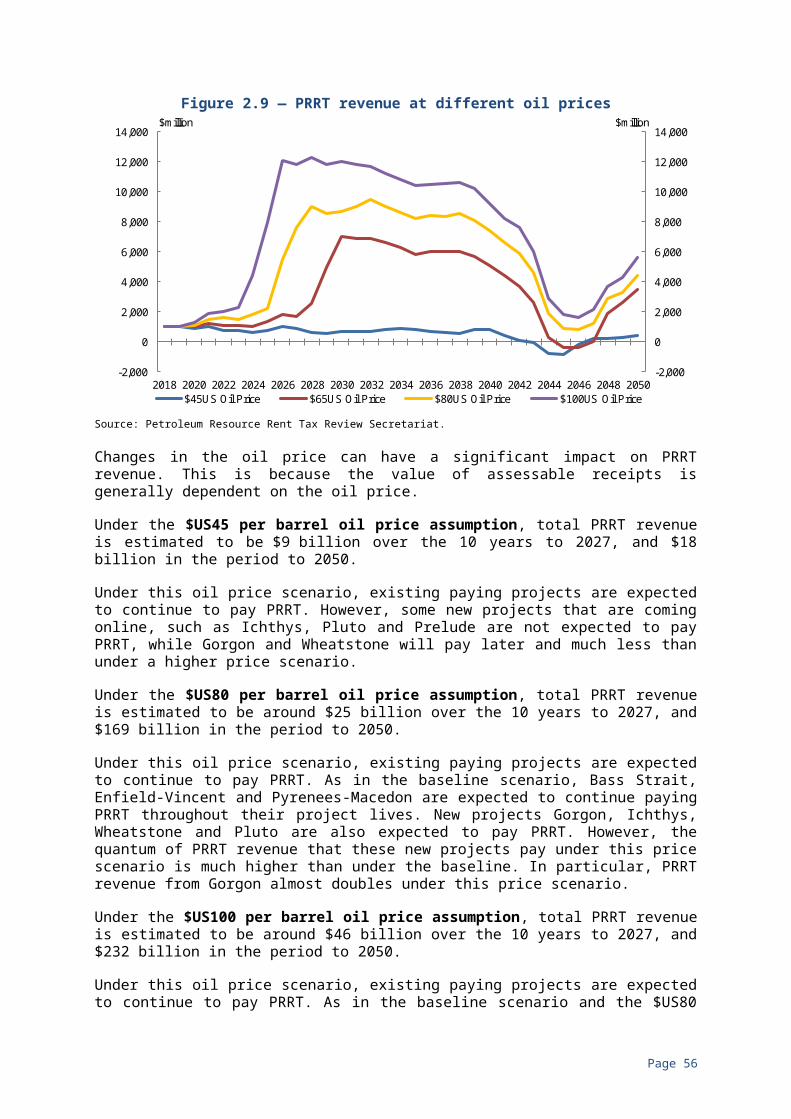
Table 2.4 — Selected 2016 Fraser Institute results — Policy Perception Index scores and ranksPolicy Perception Index
Score
(the closer to 100, the more positive the perception index for investment)
Rank
(Placement in total jurisdictions, with first place represented as 1)
Jurisdiction 2016 2015 2014 2013 2012 2016 2015 2014 2013 2012
Australia—Offshore
78 75 74 71 79 26/96 32/126 34/156 54/157 30/147
WA 72 73 69 74 77 35/96 37/126 47/156 47/157 35/147
QLD 64 71 66 61 68 47/96 40/126 55/156 76/157 55/147
North Dakota 93 90 97 96 89 6/96 7/126 5/156 4/157 9/147
Texas 98 96 98 98 97 2/96 2/126 3/156 2/157 2/147
US Offshore—Gulf of Mexico
76 82 73 77 82 28/96 16/126 38/156 44/157 23/147
Alberta 67 78 86 86 85 43/96 26/126 14/156 17/157 17/147
British Columbia 68 68 64 73 76 39/96 46/126 60/156 49/157 36/147
Newfoundland & Labrador
79 79 78 83 72 25/96 22/126 28/156 24/157 46/147
Papua New Guinea 49 52 45 45 40 76/96 88/126 105/156 123/157 118/14
7
Norway— (except North Sea)*
86 79 84 96 80 16/96 21/126 17/156 5/157 28/147
Norway—North Sea*
92 89 83 88 84 7/96 8/126 21/156 11/157 18/147
UK (except North Sea)*
88 78 77 34 75 12/96 24/126 29/156 138/157 40/147
UK North Sea 82 82 78 84 81 20/96 18/126 27/156 22/157 25/147Source: Fraser Institute, 2016a.
Page 58

Figure 2.10 — Selected 2016 Fraser Institute results related to fiscal terms
Source: Fraser Institute, 2016a.
Figure 2.11 — Selected 2016 Fraser Institute results related to broader tax arrangements
Source: Fraser Institute, 2016a.
Page 59

International comparisons were raised in a number of submissions (ENI Australia, BHP Billiton, Business Council of Australia, APPEA). ENI Australia considered Australia a high taxing jurisdiction, taking into account headline company tax, royalties and excise, as well as PRRT. BHP Billiton referred to IHS Markit,14 Fraser Institute and Wood Mackenzie studies:
Global benchmarking data indicates that Australia’s investment climate for oil and gas exploration, development and production has become increasingly less competitive over the last several years:
• Wood Mackenzie ranks Australia 32nd in the world for undiscovered resources, suggesting that there are fewer large economically attractive fields waiting to be developed.
• Australia is ranked towards the bottom of the third quartile in the ranking of 130 countries in terms of fiscal attractiveness by IHS Markit.
• Canada’s Fraser Institute ranked Australia’s offshore petroleum environment as 26 out of 96 in terms of their overall attractiveness for investment in 2016 (BHP Billiton submission, p. 5).
In contrast, the Tax Justice Network Australia raised concerns about the relatively low PRRT collections when compared to oil and gas revenues collected by other jurisdictions:
Australia’s neighbours, Malaysia and Indonesia are also significant exporters of LNG. While the structure of the industries in those countries are very different from Australia, total government revenues from oil and gas, per unit, in 2014 were more than double total government revenue from oil and gas in Australia (Tax Justice Network Australia submission, p. 7).
The APPEA submission specifically responded to the Tax Justice Network Australia comparison of revenue collected by other governments with the tax revenue collections from Australia’s LNG projects. Section 2.5 refers to studies referenced in APPEA’s submission that provide reasons for differences in oil and gas tax revenues between Qatar and Australia.
APPEA’s submission included a Wood Mackenzie report it had commissioned focused on international comparisons. The Wood Mackenzie report provided a peer group comparison, shown in Figure 2.12, of the government share of profits from a hypothetical offshore oil project and how sensitive this was to changing oil prices. Overall, Australia benchmarks as a neutral, competitive regime, regardless of changes in price, with the government’s share of profits associated with an oil and gas project’s extraction at 58 per cent. This is consistent with the combined company and PRRT tax rate on PRRT profits.
14 IHS Markit is a global strategic planning, operations, engineering and analytics consultancy firm. Their ranking of fiscal attractiveness from an oil and gas perspective is not publicly available.
Page 60
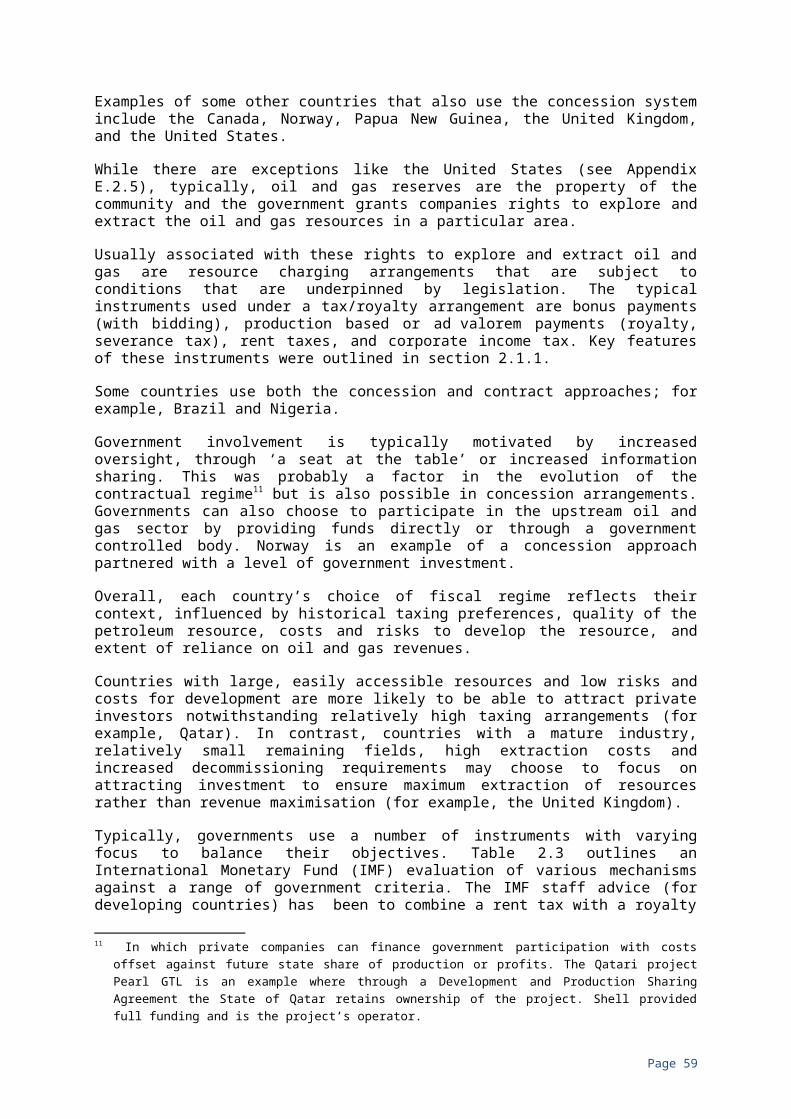
Figure 2.12 — Wood Mackenzie sensitivity analysis of fiscal terms to changing oil price on a theoretical discovery
Source: APPEA Submission, Attachment 3.
2.5 COMPARING AUSTRALIAN LNG REVENUE WITH QATARWith Australia set to equal or exceed Qatar as the world’s largest LNG exporter, comparisons have been made between the export volumes and government earnings of the two countries. For example, the International Transport Workers’ Federation has commented:
By 2021, Australia’s LNG export volumes are predicted to exceed those of Qatar, reaching 103.72 cubic meters (bcm) while Qatar’s output falls to 101.7 bcm. The Australian Government is expected to receive only $0.8 billion in PRRT revenues in 2019-20, or 1.97 per cent of LNG export sales. At the same time, the Government of Qatar is forecast to collect $26.6 billion in royalties from LNG exports, equivalent to a share of 23.35 per cent (International Transport Workers’ Federation, 2016, p. 1).
APPEA and the Business Council of Australia submissions cautioned against comparing revenue collections between countries because of the differences that exist between Australia and Qatar. APPEA noted:
The Tax Justice Network has used project revenues as a simplified basis for comparing tax contributions for projects from different countries. This methodology is fundamentally flawed, as it implicitly assumes turnover is a proxy for profitability or capacity to pay. The failure of this approach is clear when a comparison of unit costs of production are made between projects (APPEA Submission, p. 57).
Figure 2.13 from APPEA’s submission illustrates the high costs per volume of product faced by Australian LNG projects relative to LNG projects in other countries.
Page 61

Figure 2.13 — Comparison of LNG project revenues and costs
Source: APPEA Submission, Attachment 3.
The Business Council of Australia submission identified issues that need to be taken into account when making comparisons between countries:
The characteristics of the project, including technical, geological and operational factors. Project characteristics differ across Australia, let alone the world. Australian LNG projects, such as for coal seam gas, were a world-first and as such presented different challenges to those based on conventional offshore resources.
The stage of the project life cycle. Is it new or mature? Have costs been recovered?
Are taxes like-for-like? How do tax systems compare? Is the taxing point the same?
What other taxes are paid?
Geography — is the area remote or close to urban areas? Is climate an issue, such as cyclones? Are there environmental considerations, such as nature reserves?
Differences in input costs, including those driven by labour market conditions and workplace regulations, and broader regulations including environmental regulation.
Page 62

How do taxes compare over the life of a project? (Business Council of Australia Submission, p. 10).
As outlined in section 1.3, many of Australia’s recent LNG investments have relatively low profit margins because of the high costs associated with building infrastructure in remote locations combined with high labour costs, a high Australian dollar and productivity issues that resulted in large cost increases.
Australia’s petroleum resources are largely remote and widely dispersed, with low levels of liquids, such as condensate. In contrast, Qatar has a lower cost upstream and downstream operating environment, and large reserves that are concentrated with relatively easy access to existing infrastructure. The gas is also more liquids rich, with considerable reserves of profitable condensate and LPGs, as well as significant volumes of ethane, sulphur and helium. An example of cost differences between Gorgon and QatarGas was illustrated in the Wood Mackenzie report attached to the APPEA submission (Figure 2.14). Gorgon came on line in 2016, with an output of 15.6 million metric tonne per annum (mmtpa) while QatarGas 4 had an output of 7.9 mmtpa in 2011. The comparison shows Gorgon’s total lifetime capital expenditure to be $97 billion versus $7 billion for QatarGas, leading to an internal project rate of return of 7 per cent and 32.5 per cent for Gorgon and QatarGas, respectively.
Figure 2.14 — Revenue comparison of Gorgon and Qatar Gas
Integrated Company ProfitIntegrated Government ShareDownstream CostsUpstream CostsInternal Rate of Return
Source: APPEA Submission, Attachment 3.
While aggregate sales revenue in company profits is similar for both projects, downstream and upstream costs are significantly higher in Gorgon, resulting in much lower profitability for Gorgon and much reduced government tax revenue. Wood Mackenzie states:
Higher costs at a project like Gorgon reduce the profit, thus reducing the government taxes. However the profitability (as measured by IRR) is also low for the company—representing a borderline investment. In a project like Qatargas 4, the very low cost environment increases profitability for both the company (Qatar Petroleum) and the government (APPEA Submission, Attachment 3 — Wood Mackenzie 2017 ‘Independent Report on the PRRT Review in Australia, p 15).
Page 63

Additionally, Australia is at a different point in the investment and production cycle compared to Qatar. Qatar has been the world’s largest LNG exporter since 2006. To reach this position, Qatar underwent a large investment phase in the mid-1990s resulting in a significant increase in gas production and LNG exports. Since 2012, gas production has plateaued with only incremental increases in capacity expected to 2030. As described in section 1.2.2, Australia’s large investment phase has occurred relatively recently.
With PRRT collected after all expenditure is deducted, PRRT revenue collections should not be expected to align with the ramp-up in LNG production. Instead, a delay in timing is expected. The time it takes a project to pay PRRT will depend on how soon the project becomes cash flow positive, reflecting the interaction of current and past expenditures (and associated uplifts) and assessable receipts. Section 3.1 describes how the PRRT operates and the modelling in section 2.3.4 shows the effects of some key influences on the timing of PRRT payments by Australian oil and gas projects.
Page 64
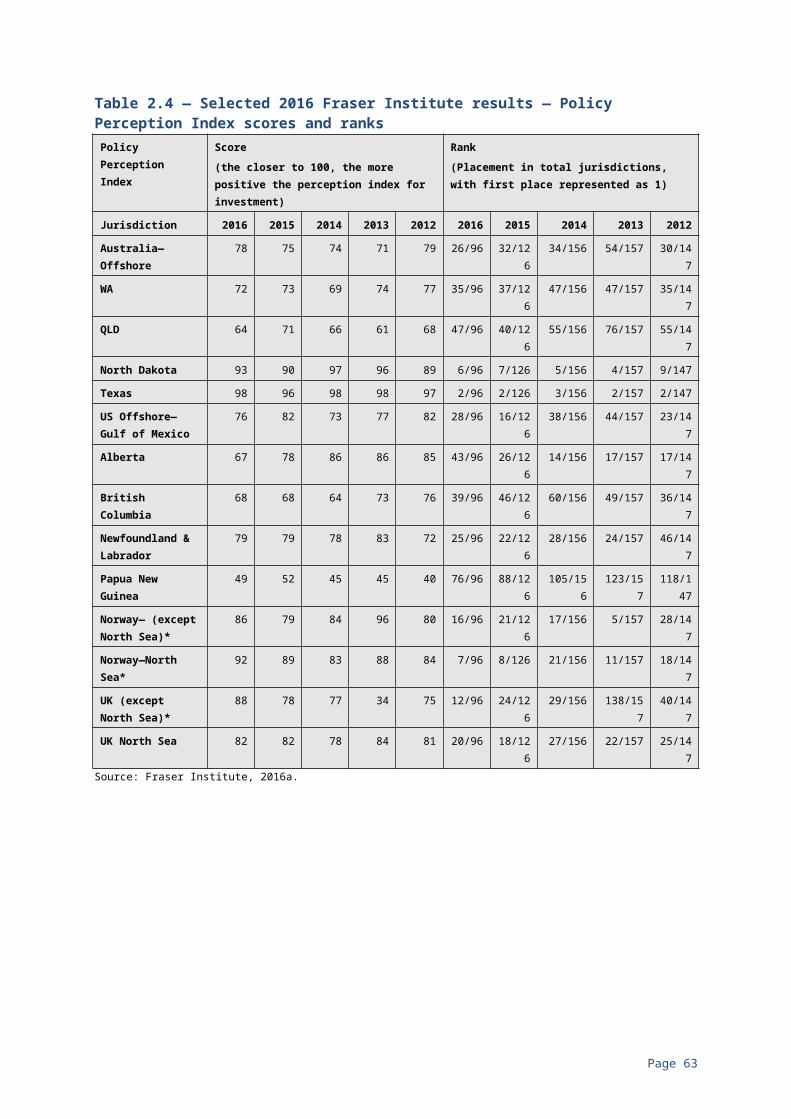
3. THE PETROLEUM RESOURCE RENT TAX
3.1 OVERVIEW OF THE PRRTThe PRRT was enacted in 1988 to apply to offshore greenfield petroleum projects. As explained in section 3.2.1, the existing Bass Strait and NWS offshore projects continued to be subject to excise and royalty arrangements and were initially exempted from the PRRT.15
The PRRT was introduced because of deficiencies with the excise and royalty regimes which were seen to distort investment and production decisions, impacting overall productivity and long term growth. When introduced the then Government noted:
‘The Government believes that a resource rent tax related to achieved profits is a more efficient and equitable secondary taxation regime than the excise and royalty system that it is to replace’. The Hon John Kerin MP (Parliament of Australia, 1987, p. 1215).
The change to the PRRT from excises and royalties was expected to result in more revenue being raised from profitable projects, with less (and potentially no) revenue from marginal projects. This was seen as striking a better balance between providing a return to the community for the exploitation of high value non-renewable resources and providing industry with adequate returns on exploration and development, including more marginal projects:
‘Petroleum resources are, in their most basic sense, community property and the Government believes that the community as a whole should share in the potentially high returns from the exploitation of these scarce, non-renewable resources. At the same time it is recognised that participants in petroleum projects who do not earn high profits in relation to the amount invested and the risk involved, particularly when oil prices decline, should be able to operate secure in the knowledge that excise and royalties which are based on production will not apply’. The Hon John Kerin MP (Parliament of Australia, 1987, p. 1215).
The PRRT is a profit-based tax designed to avoid the practical disadvantages of cash flow taxation (section 2.1.1) and now applies to all onshore and offshore petroleum projects in Australia. The key features of the PRRT are:
• Assessment is on individual projects which arise when a production licence comes into existence. A project may include a number of production licences where the combination rules are satisfied.
• The boundary of a project that defines receipts and expenditures to be included for assessment purposes is determined by the taxing point of petroleum products (first point at which a product becomes marketable) and the activities necessary to get the product to the taxing point.
15 The Commonwealth and states have jurisdiction over offshore and onshore areas, respectively.
Page 65
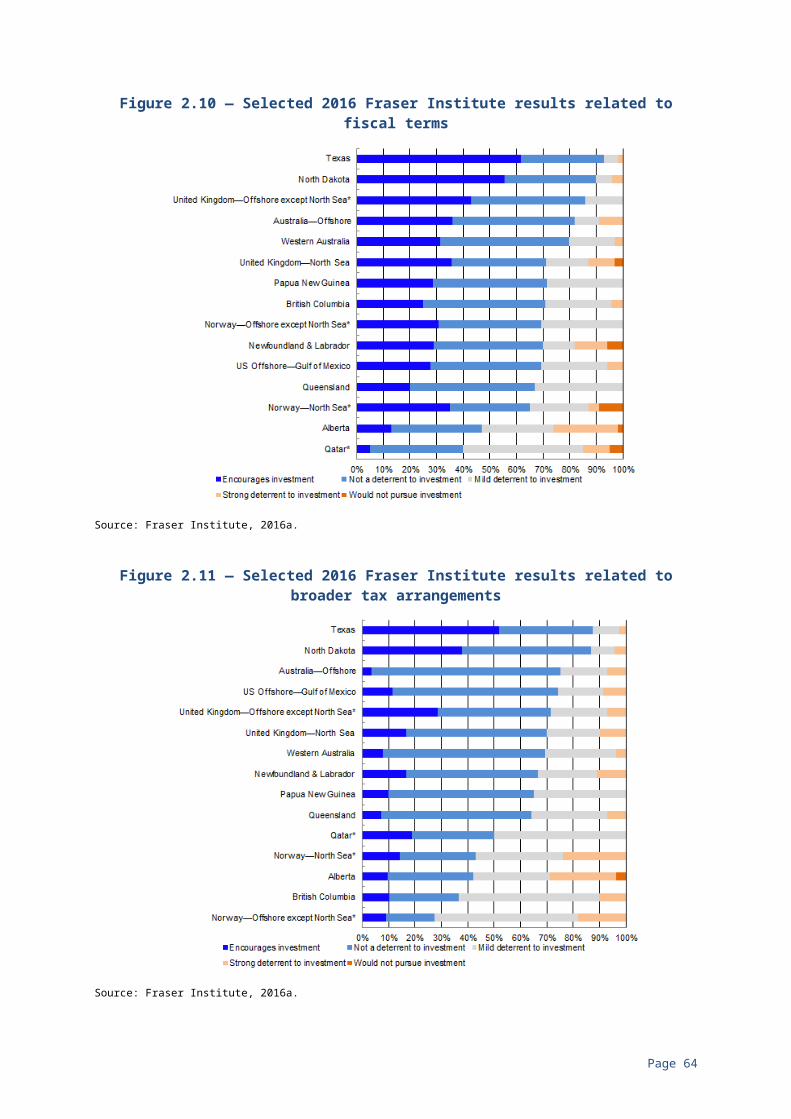
• Assessable receipts include receipts from the sale of petroleum products at the taxing point or attributed value if no arm’s length sale occurs at that point, and for integrated GTL projects the methods for determining the price of gas for PRRT purposes include a dedicated pricing methodology (Gas Transfer Pricing regulations, see section 4.9).
• Expenditures (both capital and recurrent outlays) necessary to bring product to the taxing point, other than certain excluded costs such as financing costs, are deductible in the year incurred and include those related to exploration, development, operating and closing down activities.
• Exploration expenditure is expenditure that is incurred in, or in connection with exploration for petroleum in the eligible exploration or recovery area of a project.
• Expenditure not deducted against assessable receipts in a year is carried forward and uplifted at an uplift rate that depends on the type and timing of the expenditure in relation to the time of application of the associated production licence.
– Exploration expenditure attracts uplift at LTBR plus 15 percentage points if incurred within five years of the granting of the associated production licence.
– Exploration expenditure, as well as other general expenditure, incurred prior to that five year period attracts uplift at the GDP deflator rate.
– Other general costs as well as starting bases for existing onshore projects and the NWS project, and creditable state and Commonwealth royalties and excises generally attract an uplift of LTBR plus 5 percentage points.
• Undeducted eligible closing down expenditure attracts a 40 per cent cash rebate to the extent that a project has previously paid PRRT.
• A tax credit of 40 per cent of the excess expenditure is provided to the extent that a project has previously paid PRRT.
• PRRT liabilities are deductible for income tax purposes.
Appendix B provides a detailed outline of the operation and administration of the PRRT.
3.2 HISTORICAL CHANGES TO THE PRRTThe PRRT has been amended a number of times since it was enacted in 1988. These amendments have broadly fallen into three categories:
• expansion of the PRRT regime;
• changes to encourage exploration; and
• changes to ensure the law continues to work as industry develops and the law is tested.
Page 66

Key changes to the PRRT are outlined in section 3.2.1. A more comprehensive timeline of changes to the PRRT is in Appendix C.
3.2.1 Expansion of the PRRT regimeWhen the PRRT was enacted in 1988 it only applied to greenfield offshore petroleum projects in Commonwealth waters. The two significant offshore projects already in operation at that time — Bass Strait and the NWS, were exempt from the PRRT. However, they continued to be subject to excise and royalties instead.
Over time, the PRRT has been extended to cover all oil and gas projects in Australia. The first expansion occurred in 1991-92 when the Bass Strait project switched from the previous excise and royalty system into the PRRT regime. The Bass Strait project entered the PRRT regime with no explicit recognition of historical expenditure or resource value, but with the application of the excise and royalty regimes lifted.
On 1 July 2012, the PRRT was extended to onshore oil and gas projects and to the NWS. While this change broadened the PRRT coverage, existing projects were given transitional arrangements that mean they are unlikely to pay PRRT (see Appendix B.1.5). It was recognised that existing royalties and excise arrangements would be the primary form of resource taxation applying to these projects.
3.2.2 Incentives for explorationOther changes to the PRRT have focused on encouraging petroleum exploration.
In 1991, deductibility of exploration expenditure was widened from a project basis to a company basis. Exploration expenditure from all offshore operations (both greenfields and project-specific expenditure) by a company after 1 July 1990 became transferable to PRRT paying projects held within a wholly owned group of companies. The objective was to encourage exploration throughout Australia. At the same time the uplift factor for general project expenditure incurred after 1 July 1990 was lowered to LTBR plus 5 percentage points. However, exploration expenditure was still carried forward at LTBR plus 15 percentage points where it was incurred within 5 years of granting a production licence. This change moved the PRRT away from a pure project-based tax (see section 4.3).
The designated frontier exploration incentive was introduced as part of the 2004-05 Commonwealth Budget. The incentive provided a 150 per cent allowance on PRRT deductions incurred in designated offshore frontier areas for five years. The measure had a range of restrictions and was designed to encourage exploration in areas where discoveries had not yet been commercialised. The incentive was subsequently extended to cover the 2009 release of exploration permits.
Page 67
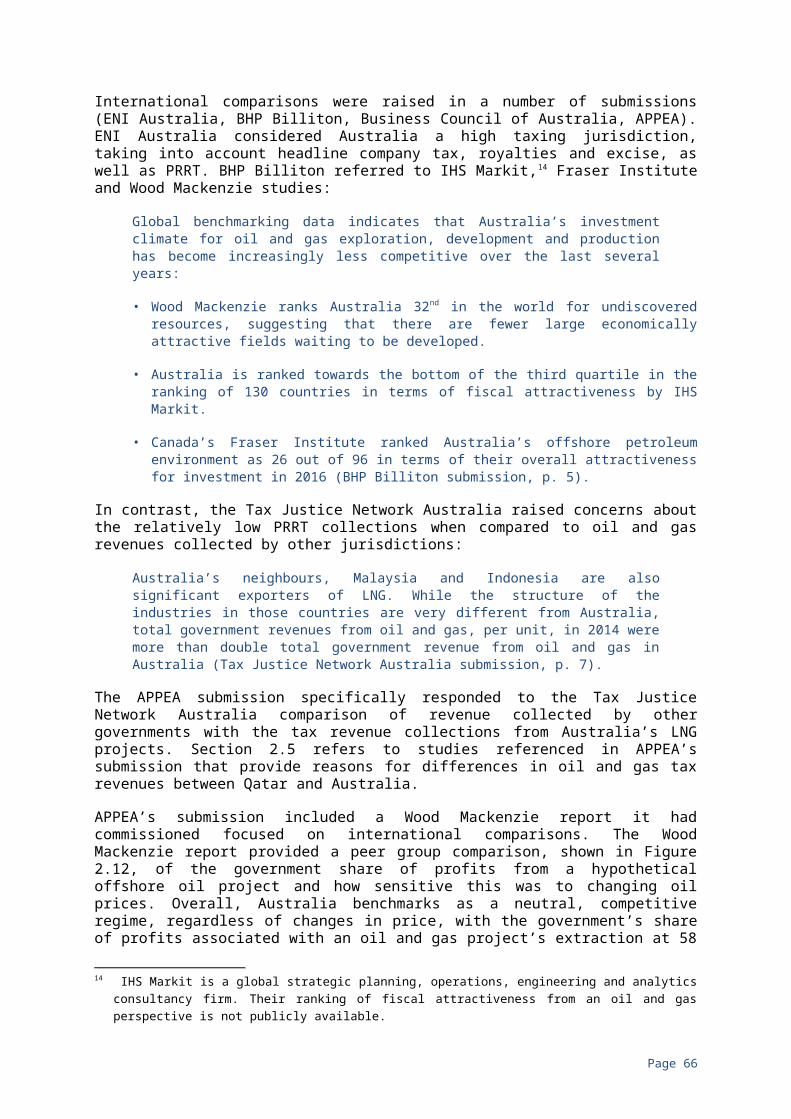
4. ASSESSMENT OF PRRT DESIGN The PRRT is a tax with a number of design features of varying complexity that are intended to work together. These features are aimed at emulating cash flow tax outcomes (see section 2.1.1), while limiting the consequences of not guaranteeing the utilisation of tax losses (and consequent Government budget risk) — as well as separating the resource tax base from downstream activities. The uplift rates, the taxing point, the tax base (defined by what can be included as deductible expenditure and what constitutes assessable receipts) and establishing the resource price at the taxing point are all important elements of the design aimed at taxing resource rents (see section 3.1). Features such as the headline tax rate rest on judgements about balancing the need to deliver an equitable return to the community for the use of its resources while ensuring industry has a sufficient incentive to take on risk and invest in projects.
The review has been conscious that in assessing particular PRRT design features to judge whether the PRRT is operating as intended, those features need to be balanced against how they interact with other elements of the PRRT and in the context of how the tax is working as whole.
4.1 THE PRRT RATEThe PRRT tax rate determines how the resource rent in a petroleum project is shared between the company and the government. The PRRT is levied at a rate of 40 per cent of a petroleum project’s taxable profit.
The Australia’s Future Tax System Review (AFTS) noted that, ‘the rate of the resource rent tax should be set to achieve an appropriate return for the community for the exploitation of its resources (Australia’s Future Tax System Review, 2010, p. 233)’. As AFTS implies, the rate of the resource rent tax is a matter for the judgement of the government of the day.
In its submission, The Australia Institute noted that a higher tax rate could be considered.
Once the operator’s reasonable costs (including the going rate of return) are covered, any additional revenue is unnecessary to attract the operator and so can be taken by the government without affecting the incentive to operate that project. In principle all the super profit should be returned to the people who own the superior resource. If we acknowledge that the PRRT is a mechanism for recovering the benefit of the resource for the community then it is unnecessary to share over half of the super profit with the operator. However, just enough has to be left with the operator so there remains some incentive to operate efficiently. Experience in countries like Norway suggests the total tax on profits can approach 90 per cent without deterring investment (The Australia Institute Submission, 2010, p. 5).
While well designed resource rent taxes can in theory be levied at relatively high rates without deterring incentives to invest and develop projects, the academic literature recognises the difficulty of targeting resource rents precisely and notes
Page 68

a sufficient incentive still needs to be present for firms to take on project risks. AFTS also cautioned against setting the resource rent tax rate too high.
If a rent-based tax is levied at a rate of 100 per cent, it would be similar to the government outsourcing exploration and production to private firms — the government would effectively pay all the costs and, in return, receive all the receipts from a project. This would erode the return to resources because there would be no incentive for private firms to make decisions that maximise the return. Further, a very high tax rate would increase the incentive for private firms to minimise tax by understating revenue and overstating costs. It could also lead to viable projects not being undertaken if the amount subject to tax overstates the rent due to the design of the tax law (Australia’s Future Tax System Review, 2010, p. 233).
Most submissions from the oil and gas sector indicated that the current tax rate is fair and appropriate.
The fiscal benefit for Australia is that once PRRT is payable, it is levied at a high rate of 40 per cent, ensuring that the long-term return for the nation can be substantial (Chevron Submission, p. 3).
In addition, APPEA noted that project estimates prepared for the 2012 Business Tax Working Group indicated that the Government’s share of the present value of net project cash flows exceeded the share for investors (APPEA Submission, p. 19). Similarly, Woodside noted that:
The Australian tax regime enables the government to receive revenue from the start-up and extract the majority of a project’s value well before investors have even met their cost of capital (Woodside Submission, p. 7).
These high estimates of the share of government tax take arise due to the operation of the company income tax system, where tax is payable before projects are cash flow positive due to capital being depreciated rather than immediately expensed. In addition, investors will typically have higher discount rates than the Government, which will increase their estimate of the Government’s take of project profits in NPV terms, relative to a government discount rate.
Reviewing current income tax arrangements are outside the review’s terms of reference and the point raised in a number of submissions that company tax is payable before a project is cash flow positive is not unique to the tax arrangements applying to the oil and gas sector.
There does not currently appear to be a strong policy justification for raising the PRRT tax rate, which is broadly comparable with that applying under similar tax arrangements elsewhere. The PRRT tax rate has been stable since the introduction of the tax and significant industry investment has been undertaken with the strong expectation that the tax rate would remain stable.
Ultimately, as previously noted, what is considered to be an appropriate PRRT rate to deliver an equitable return to the Australian community for the use of its resources is a matter of judgement.
Page 69
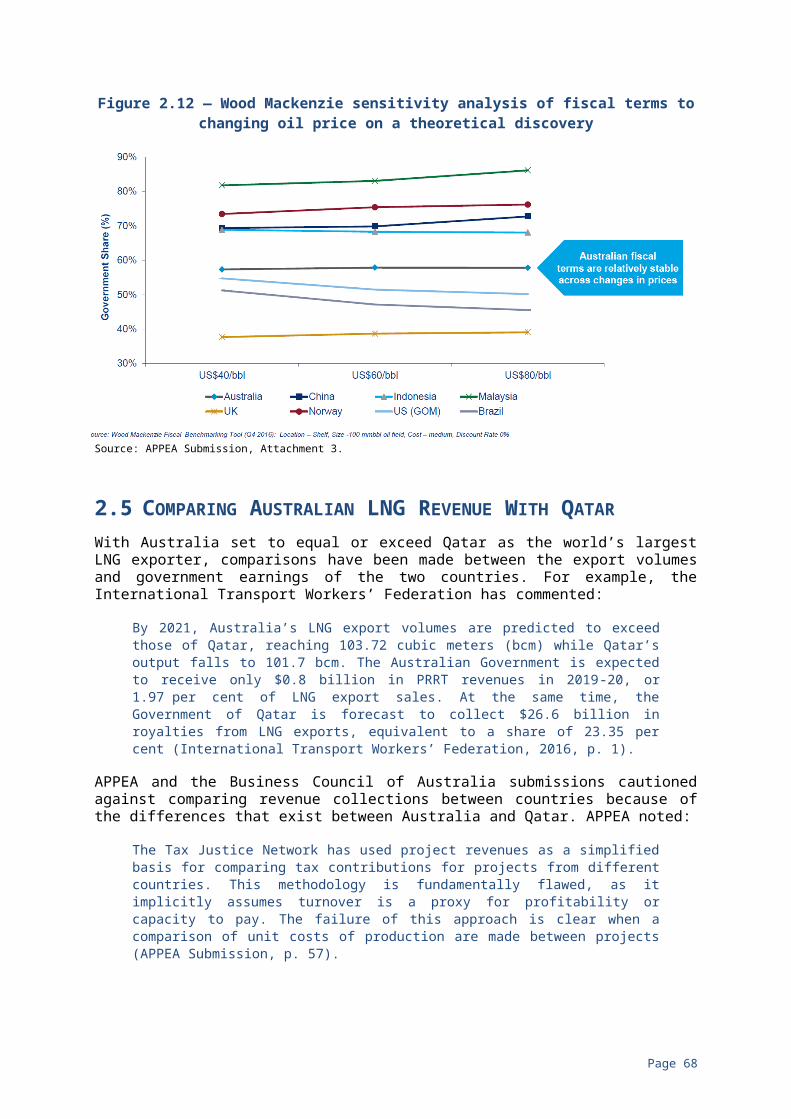
4.2 UPLIFT RATESUnder the PRRT, when deductible expenditure exceeds assessable PRRT receipts from a project, the excess deductible expenditure (PRRT ‘loss’) is carried forward with an annual uplift. This is the most notable design feature that distinguishes the PRRT from a tax-neutral cash flow tax (Brown tax) which provides immediate cash rebates for losses. Consistent with the cash flow design of the tax, the PRRT uplift (threshold) rate is intended to maintain the value of excess PRRT deductions until they can be written off against future positive cash flows from the project.
When costs cannot be recouped immediately because of the lack of available income, the threshold rate applied to any unrecouped deductions aims at maintaining the value of these deductions until sufficient income is available (Commonwealth Government, 1983, p. 4).
Government statements at the time of the PRRT design suggest an uplift rate of LTBR would be appropriate if it were certain excess deductions would eventually be written off against future assessable receipts.
In circumstances where at the time of investment it is certain that any excess costs will be written off in full eventually, the threshold rate required to maintain the value of the deductions will correspond to the year-by-year cost of having to wait to recoup that certain value (Commonwealth Government, 1983, p. 4).
This observation has been supported by a range of academics and others since 1984 (in absence of income tax implications), including in the AFTS where the idea is canvassed for the full recoupment of carried forward and uplifted losses via delayed government rebates.
If the government promises to provide a refund for the tax value of losses at the time a project is closed (full loss offset), the appropriate interest rate is the government bond rate. The uplift or allowance rate does not need to reflect the required rate of return of the project, which includes a risk premium that varies according to the project … where the government provides a full loss offset, the riskiness of the project is irrelevant (Australia’s Future Tax Review, 2010, p. 223).
Specifically in a PRRT context, if it were certain these losses would be able to be utilised, investors would only have to be compensated for the time delay before carried forward losses were written off against future PRRT receipts. In these circumstances the PRRT would be financially equivalent to a pure cash flow tax, as it would have the same financial effect on investors as receiving a cash rebate for the loss at the time it arose, and would therefore have a neutral impact on the overall return of the project (see section 2.1).
Inevitably, however, some investments in the petroleum resources sector will never be rewarded with sufficient revenue to be cash flow positive, and will therefore be unable to recoup all their carried forward losses. The PRRT design avoids up-front cash rebates and does not provide rebates for all losses at the end of a project (losses out of closing down expenditure being the exception). That means there is a risk that carried forward, deductible expenditure will never be written off in full. Government statements at the time the PRRT was being
Page 70

designed point to the intention that the loading on LTBR in the uplift rate was meant to be a counterweight to the risk of losing PRRT deductions completely.
In practice, there will be some risk that the allowable deductions will not be recouped. One means of attempting to take account of this risk would be to provide a loading for it in the threshold rate (Commonwealth Government, 1983, p. 5).
The initial design had a single uplift rate of LTBR plus 15 percentage points applying to both ‘qualifying’ exploration expenditure (within five years of a project’s first production licence) and general project expenditure. Practical advantages of a single uplift rate may have been a consideration.
From an administrative perspective, a single threshold and tax rate also has the advantage of simplicity relative to more complex RRT tax structures (Commonwealth Government, 1983, p. 5).
Nevertheless, exploration and general project expenditure more than five years before the granting of a project’s first production licence was allocated an uplift of GDP deflator, allowing only for the effects of inflation over time — presumably recognising the potentially large effects on PRRT collections if expenditure on very old exploration activity was uplifted at LTBR plus 15 percentage points.
Despite the uniform uplift rate of LTBR plus 15 percentage points, Government statements at the time noted that the uplift rate should be lower where the PRRT design reduces the possibility of deductions not being utilised.
The greater the degree of loss offset incorporated in the RRT structure the more the threshold rate should be reduced (Commonwealth Government, 1984a, p. 2).
Academics and others have also noted how an uplift rate incorporating a loading on LTBR may be viewed as an attempt to make up for the risk that carried forward expenditure may never be utilised. In doing so they invariably make a clear distinction between project risk and the risk that tax deductions will never be utilised.
If it is not certain that tax credits … will eventually be redeemed — perhaps because…the tax laws do not guarantee full loss offset — the appropriate interest rate only depends on the risk characteristics of the asset being taxed to the extent that these characteristics determine the probability that the tax credits … will never be redeemed (emphasis added) (Fane, 1987, p. 103).
In the PRRT context, the loading on LTBR, which bolsters the return on profitable investment outcomes, can also be viewed as a counterweight to the reality that no level of uplift rate can remove the possibility of investment outcomes where carried forward losses are never utilised.
4.2.1 Basis of Initial Uniform Uplift RateIn the original development of the PRRT, the Government undertook lengthy consultations with industry on designs with different combinations of uplift and tax rates, as well as immediate cash rebates for eligible exploration expenditure.
Page 71
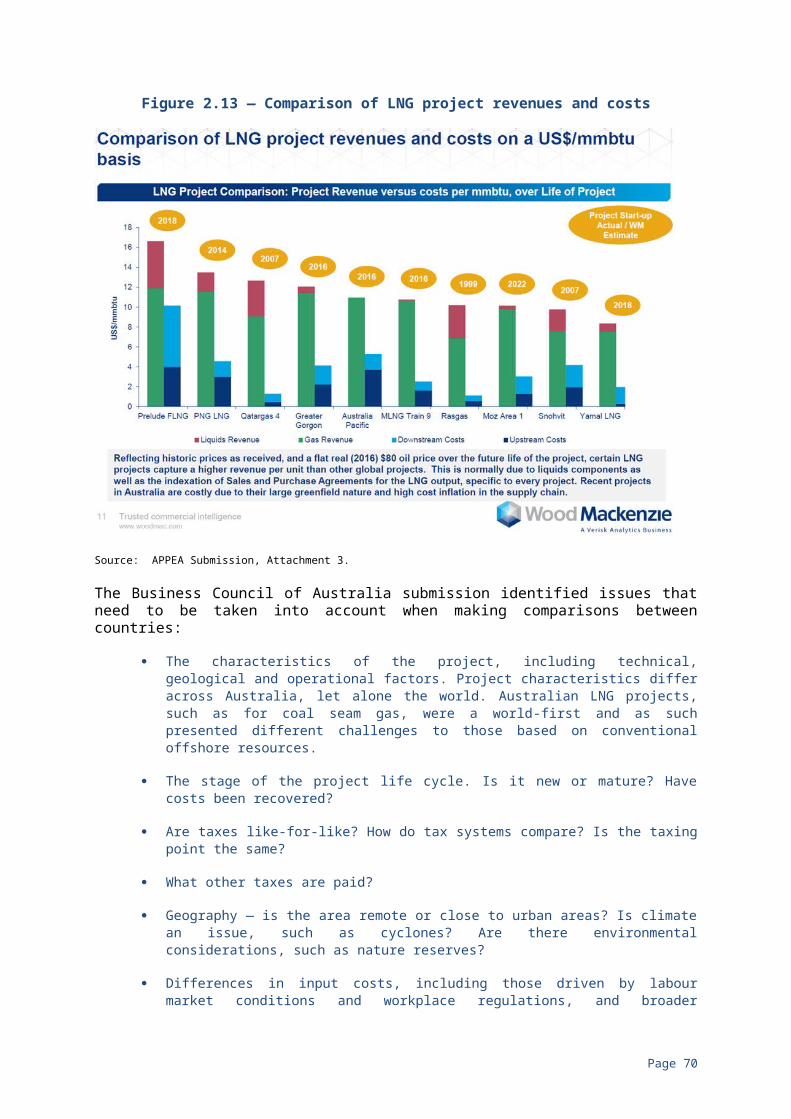
One approach involved two uplift rates and two associated tax rates, as well as a cash rebate for eligible exploration expenditure. The cash rebate effectively removed any risk of losing deductions for exploration expenditure. The lower uplift/tax rate combination under this approach incorporated an uplift of LTBR plus 5 percentage points.
An alternative approach, which proved to be the template for final design, incorporated a single uplift rate at LTBR plus 10 percentage points (LTBR was about 15 per cent at the time) and accompanying tax rate of 45 per cent. No cash rebate for exploration expenditure was included. The shift in the loading on LTBR in the single uplift rate to 15 percentage points when the PRRT was introduced, points to a particular focus given to risks at the exploration phase in the selection of the uplift rate.
This approach seeks to achieve a reasonable balance between revenue and exploration objectives by means of a relatively high threshold and a relatively low tax rate. The relatively high threshold rate and the single, low tax rate reflect the risk of the deductions in respect of exploration not being recouped in full for RRT purposes (Commonwealth Government, 1984b, p. 6).
Getting the uplift rates ‘right’ is clearly desirable. However, there is no precise formula for setting uplift loadings — a difficulty magnified if a uniform uplift rate is to be applied. That is because the risk of losing PRRT deductions varies greatly from exploration phase to development phase and from project to project. Consequently, the initial application of a single generally-applicable uplift rate was recognised as imperfect, and the selection of the 15 percentage point loading above LTBR that was eventually adopted, was necessarily arbitrary.
In practice, however, there are very significant difficulties in attempting to devise an objective test of the degrees of risk inherent in different projects or categories of expenditure and in translating such tests into particular threshold loadings (Commonwealth Government, 1983, p. 5).
If the threshold rate were set too high, revenue would suffer because fewer projects would be taxable, and/or the consequent high tax rate required to raise sufficient revenue would provide an incentive to over-invest in taxable projects. If the threshold rate were set too low, less profitable projects are likely to be deferred (Commonwealth Government, 1983, p. 5).
The threshold and tax rate have been set at levels which, in the Government’s view, represent a reasonable balance between revenue and oil exploration objectives (Commonwealth Government, 1984c, p. 6).
While there is no precise formula or benchmark for selecting the specific uplift rate to use in the PRRT, it does have a major bearing on the amount of PRRT revenue that will be collected from petroleum projects, including whether projects pay any PRRT.
4.2.2 Transferability for exploration costs and reduced upliftMost relevant to the uplift rate for petroleum exploration expenditure is the risk that there will be no ensuing project receipts to absorb this expenditure. In such
Page 72

circumstances, a project-based PRRT design offers no recompense for the expenditure outlaid.
The situation was significantly changed with the introduction in 1991 of transferability of exploration expenditure within the same company group (see section 4.3). The benefits of transferability were explained in the second reading speech for the Petroleum Resource Rent Legislation Amendment Act 1991:
‘The introduction of wider deductibility for exploration expenditure will improve the efficiency of the resource rent tax and stimulate the exploration effort in offshore Australia. Previously, deductibility was limited to individual permit areas. The new arrangements make the after tax cost of exploration within RRT paying permits the same as the cost outside those permits. The current disincentive to explore in frontier areas will, therefore, be removed, an important change for the discovery of new hydrocarbon accumulation.’ The Hon Paul Keating MP (Parliament of Australia, 1991, p. 3436).
With transferability, a company group may see that failed and uplifted greenfields exploration expenditure will ultimately be able to be offset against PRRT receipts on other projects within the group. With a significant reduction in the risk of not being able to deduct unsuccessful exploration expenditure, it could be expected that the uplift rate for such expenditure of LTBR plus 15 percentage points would have been reduced. This was not the case.
When exploration transferability was introduced, it was not the loading on LTBR for exploration expenditure that was reduced. The loading for general project expenditure was reduced from 15 to 5 percentage points for expenditures after 1 July 1990, which is consistent with the lower risks of losing PRRT deductions at the development and production stages of a project. However, there was no change to the exploration uplift, even though the risk of losing exploration deductions was reduced by the introduction of transferability.
The second reading speech points to a focus in 1991 on how transferability provides the opportunity for early, perhaps immediate, offset of exploration expenditure.
‘The new arrangement will reflect the relative likelihood of recovering exploration and development expenditures, in contrast to the existing composite carry forward rate. The carry forward rate for general expenditures incurred from 1 July 1990 will be reduced from the long term bond rate plus 15 percentage points to the long term bond rate plus five percentage points. Undeducted exploration expenditure will continue to be eligible for compounding at the long term bond rate plus 15 percentage points.’ The Hon Paul Keating MP (Parliament of Australia, 1991, p. 3436.
The focus on the benefit in being able to transfer exploration expenditure ignored the overall reduction in the risk of losing exploration deductions associated with wider deductibility.
As outlined in section 1.2.2, a major change that has taken place in the Australian petroleum industry since the introduction of the PRRT is the increased importance of large, long life LNG projects. Even though the PRRT was designed to accommodate all petroleum products, large scale gas projects have put a particular focus on the appropriateness of the PRRT uplift rates.
Page 73

A number of submissions to the review point out that, compared to typical offshore crude oil projects, offshore LNG projects involve very high capital intensity, long development lead times and long production periods — resulting in longer timeframes before commercial returns are achieved.
Uplift rates are particularly important for projects with high development costs and long lead times before production commences. Low uplift rates may choke off prospective exploration activity and project development. But high uplift rates will see losses compound over time to such an extent that the return to the community may be reduced considerably even for large projects with good profitability. This is particularly so for exploration losses which, with an uplift rate of LTBR plus 15 percentage points, double approximately every four years. This compounding effect is exacerbated by current arrangements for the ordering of PRRT deductions (see section 4.4), potentially resulting in a continual build-up of deductions well beyond the start of production and possibly throughout the life of some projects.
Figures 4.1 and 4.2 compare the impact on PRRT revenue paid by a hypothetical gas project with an uplift rate for exploration expenditure at LTBR plus 15 percentage points and LTBR plus 5 percentage points, respectively. Figure 4.1 shows that with the uplift rate for exploration expenditure at LTBR plus 15 percentage points, the compounding effect of this uplift combined with the uplift for general project expenditure is such that PRRT payments do not begin until year 36. In contrast, as shown in Figure 4.2, if the uplift rate for exploration expenditure is the same as that for general project expenditure at LTBR plus 5 percentage points, the project begins to pay PRRT in year 18.
Figure 4.1 — Hypothetical gas project: exploration uplift at LTBR plus 15 percentage points
Source: Petroleum Resource Rent Tax Review Secretariat.
Page 74
-70000.00
-60000.00
-50000.00
-40000.00
-30000.00
-20000.00
-10000.00
0.00
10000.00
20000.00
30000.00
40000.00
1 2 3 4 5 6 7 8 9 10 11 12 13 14 15 16 17 18 19 20 21 22 23 24 25 26 27 28 29 30 31 32 33 34 35 36 37 38 39 40
$million
Gross receipts Exploration expenditure General expenditure Undeducted plus uplift PRRT
Figure 4.2 — Hypothetical gas project: exploration uplift at LTBR plus 5 percentage points
Source: Petroleum Resource Rent Tax Review Secretariat. Figure 4.3 illustrates possible effects on future PRRT revenue of a reduction in the uplift loading on LTBR for exploration expenditure from 15 to 5 percentage points. It shows increased PRRT revenue from 2024 to 2029 (totalling approximately $6 billion) followed by somewhat steady annual increases in revenue to 2044. Over the period to 2050, total increase in revenue is estimated to be around $19 billion. These revenue figures reflect the changed uplift rate applying to the stock of past uplifted exploration expenditure, as well as future exploration expenditure. Were the change applied only to future exploration expenditure, the effect on PRRT revenue would be significantly less.
Page 75
-70000.00
-60000.00
-50000.00
-40000.00
-30000.00
-20000.00
-10000.00
0.00
10000.00
20000.00
30000.00
40000.00
1 2 3 4 5 6 7 8 9 10 11 12 13 14 15 16 17 18 19 20 21 22 23 24 25 26 27 28 29 30 31 32 33 34 35 36 37 38 39 40
$million
Gross receipts Exploration expenditure General expenditure Undeducted plus uplift PRRT
Figure 4.3 — Effect on PRRT of cutting uplift on exploration expenditure to LTBR plus 5 percentage points
Source: Petroleum Resource Rent Tax Review Secretariat.
As noted previously, in 1991 when transferability of exploration expenditure was introduced, the uplift rate for general project expenditure was reduced to LTBR plus 5 percentage points. Given that the risk of not being able to deduct losses at the project development stage is likely to be low, though varying between projects, the reduction in that uplift rate can be justified. Why the specific uplift rate for general project expenditure was chosen in 1991 is not documented. AFTS and several submissions to the review argue that current uplift rates for both exploration and general project expenditure are too high.
Although the current PRRT collects a more stable share of rents in varying economic circumstances, it fails to collect an appropriate and constant share of resource rents from successful projects due to uplift rates that over-compensate successful investors for the deferral of PRRT deductions (Australia’s Future Tax System Review, 2010, p. 223).
Generous uplift of cost deductions erodes the resource rental base … The 15 per cent uplift above the Long Term Bond Rate (LTBR) is an extraordinary gift that undermines the resource rent tax base by allowing it to be minimised any time there is new investment by the owner of the PRRT project, whether it is related to the project or not … Recommendation: Apply the LTBR as a maximum uplift on all costs (Prosper Australia Submission, p. 10-11).
A first step in considering the appropriateness or otherwise of the uplift rate for general project expenditure is to determine the conceptual basis for setting PRRT uplift rates.
Submissions to the review and the review’s consultations with industry reveal a distinctive and important difference between the two views on the conceptual basis for setting the PRRT uplift rates. On the one hand, and as outlined in section 4.2.1, there is the view reflected in Government statements when the PRRT design was being formulated, and in subsequent views of academics and
Page 76
-1000
0
1000
2000
3000
4000
5000
6000
7000
8000
-1000
0
1000
2000
3000
4000
5000
6000
7000
8000
2018 2020 2022 2024 2026 2028 2030 2032 2034 2036 2038 2040 2042 2044 2046 2048 2050
$million$million
LTBR + 15% LTBR + 5%
others, that the PRRT uplifts should be based on the risk of losing PRRT deductions. This would be consistent with the conceptual design of a cash flow tax. On the other hand, there is the general view held by the petroleum industry that PRRT uplifts should reflect project risk and associated risk-weighted hurdle rates.
4.2.3 Petroleum industry view of uplift ratesThe petroleum industry has a very clear, almost unanimous view that the uplift rate equates with the typical overall risk of a petroleum project measured by weighted average cost of capital (WACC) or, more specifically, risk-weighted discount rates used to assess potential petroleum projects. The industry sees no distinction between project risk and the risk of losing PRRT deductions and therefore believes PRRT should not be payable until a return on expenditure has been realised that aligns with typical risk-weighted hurdle rates used in the petroleum industry.
The carry forward rates remain a cornerstone of the PRRT system and ensure that it operates in a manner such that an initial tax liability is not incurred until such a time an entity has generated a risk adjusted return based on the modest rates contained in the legislation (APPEA Submission, p. 66).
The view of the petroleum industry that the PRRT uplift rates should match typical risk-weighted industry discount rates may be based on Government statements at the time the PRRT design was announced, such as:
The tax will apply to profits which exceed the specified threshold level (Commonwealth Government, 1984c, p. 5).
The second reading speech of the PRRT Bill in 1987 also said:
‘As the PRRT is profit-based, rather than production-based, it will apply only where there is an excess of project-related receipts for a financial year over both project-related expenditure for the year and undeducted expenditure of previous years brought forward at a compound rate. This compounding of expenditure ensures that the investment represented by the expenditure obtains an appropriate rate of return free of secondary tax.’ The Hon John Kerin MP (Parliament of Australia, 1987, p. 1215).
The rationale for the PRRT uplift rates has to be clarified. To this end, it is relevant to consider the difference between project risk and the risk of not being able to use PRRT deductions.
4.2.4 Project risk versus risk of losing deductionsThe risk of losing PRRT deductions is significantly different from the overall risk of a petroleum project.
Risk of a prospective petroleum project is reflected in the wide range of possible realised outcomes arising from changes in prices, costs and other events; outcomes spanning from very high profitability, moderate/marginal profitability and a spread of losses. The spread of possible outcomes is inevitably higher at the exploration stage, given the high chances of failure at that stage, but that
Page 77

spread contracts considerably once petroleum is discovered and proved up for development.
The risk of losing PRRT deductions also depends on changes in the same myriad of prices, costs and events. But this risk is only reflected in the spread of possible outcomes where uplifted expenditures exceed revenue. Irrelevant to that spread are outcomes where revenues exceed uplifted expenditures — though these outcomes are a vital part of a project’s overall risk spectrum.
Successful exploration programs may point to the prospect of highly profitable projects with a wide spread of possible outcomes (high project risk), none of which have any significant prospect of losing carried forward losses (low risk of losing deductions), particularly given the availability of cash rebates for closing down expenditures. More generally, once developed, rare would be the (still risky) project that could not utilise PRRT deductions uplifted at LTBR. This is confirmed by the review’s modelling. In contrast, much exploration expenditure never gives rise to a production licence and, absent exploration transfers, would never be applied against project revenue and would therefore be lost.
4.2.5 Tax neutrality objectivesThe risk of losing deductions will inevitably vary between prospective exploration programs and between prospective developments of discovered petroleum deposits, just as overall project risk varies considerably between projects.
Consequently, and as observed in the submission by the Business Council of Australia, generally-applicable threshold rates unavoidably mean that some projects will be overcompensated and some undercompensated for their particular risks, no matter the level of uplift rates.
Once uplifted losses are written off, however, the values of the original deductions have been maintained. It is as if the taxpayer had been able to deduct the loss when originally incurred. This PRRT outcome matches that of a cash flow tax (see section 2.1) and consequently investors’ assessments of pre- and post-PRRT economic rent depend on the returns of their projects relative to their risk-weighted discount rates.
Inevitably, some uplifted losses will never be fully utilised: these are the undercompensated exploration programs that can never achieve the equivalence of full loss offset within the PRRT design. However, other projects will be overcompensated where the risk of losing deductions in those particular projects is less than the uplift rate applied to the deductions.
Nevertheless, a PRRT design that sets uplift rates on the basis of investors’ risk-weighted hurdle rates is likely to underestimate the levels of economic rent and therefore collect lower levels of PRRT. In contrast, uplifting PRRT losses at a rate commensurate with the risk of unutilised PRRT deductions would further tax neutrality and tax revenue objectives.
Box 4.1 shows how PRRT uplift rate set in line with the risk of losing deductions (5 per cent in the example) provides a PRRT outcome equivalent to that of a tax-neutral cash flow tax (see section 2.1.1, Box 2.1).
Page 78
Box 4.1: PRRT uplift rate aligned with risk of unutilised PRRT deductionsBefore tax, an investor is assessing the prospects of a petroleum resource project involving $1000 of exploration/development expenditure in Year 1 to get $1100 in Year 2. The project’s 10 per cent per annum pre-tax return matches the investor’s 10 per cent risk-weighted discount rate so, to the investor, the project has a zero NPV ($1100/1.1 — $1000) before PRRT.
After 40 per cent PRRT with 5 per cent uplift, the 5 per cent reflecting risk of unutilised PRRT losses:
Year 1 Year 2Pre-tax cash flow $1000 $1100PRRT loss -$10005 per cent loss uplift
0 -$1050 (x 0.4 = $420 PRRT savings)
PRRT 0 -$20Post-PRRT -$1000 $1080
With discounting at the investor’s 10 per cent discount rate, NPV is -$18.2 ($1080/1.1-1000), which might suggest the project, marginal before tax, is now unviable.
However, sound analysis requires the $420 PRRT savings in Year 2 to be discounted back to Year 1 at 5 per cent, the rate commensurate with the risk of losing those PRRT savings, not the investor’s risk-weighted discount rate which reflects overall (unique plus market) risk of the project:
Year 1
Year 2
Pre-tax cash flow -$1000
$1100
Discounted (at 5 per cent) Year 2 tax savings
$400 $0
Year 2 PRRT ex uplifted loss -$440
($1100 x 0.4)
Adjusted post PRRT cash flow -$600
$660
Thus, after discounting the project’s adjusted cash flows at the investor’s 10 per cent discount rate, the project remains on the investor’s margin post-PRRT with zero NPV ($660/1.1-$600).
Page 79

4.3 TRANSFERABILITY OF EXPLORATION EXPENDITURE DEDUCTIONSViews varied widely in submissions on the value of the transferability of exploration expenditure introduced in 1991 for expenditure from 1 July 1990 (including greenfields exploration associated with an exploration permit).
Some view the wider deductibility of exploration expenditure positively.
While difficult to quantify, the advice from APPEA member companies indicates wider deductibility considerations form an important element in company exploration decisions. Any change to the current provisions would need to be mindful of the impact on exploration in Australia, particularly at a time of historically low levels of activity (APPEA Submission, p. 67).
Others have an opposing view.
The exploration uplifts are also transferable between projects. They can be earned on one project and used to delay PRRT payments on other projects. These PRRT credits are likely to prevent any significant new PRRT payments for many years to come (Tax Justice Network Australia Submission, p. 3).
The view was also expressed that transferability distorts investment decisions and consequently all PRRT costs should be quarantined on a project basis.
The fact that exploration and other spending can be offset against other projects adds a serious distortion to the market. That means an entity with a profitable project that actually pays the PRRT has a greater incentive to explore new fields than a company without such a project/s. The taxable unit for the PRRT should be limited to the project in question and not transferable to unrelated projects (The Australia Institute Submission, p. 5).
This mechanism erodes the resource rental tax base without providing additional incentives for exploration. It is almost exactly like ‘negative gearing for oil and gas exploration.’ A major adverse effect is that companies who already have PRRT liable projects will have a higher return from exploration, crowding entry of any potential new competitors who cannot deduct explorations losses from other PRRT projects (which is especially valuable with an uplift), with no overall improvement in exploration incentives (Prosper Australia Submission, p. 11).
If costs expended in unrelated exploration can be deducted against a profitable project, rather than quarantined against future profitable projects in the exploration area, it simply diminishes the resource rental base (Prosper Australia submission, p. 11).
The design of any profit-related tax will affect decision making to some extent if it does not provide full loss offset and requires taxpayers to obtain the value of annual tax losses from one activity by offsetting those losses against taxable profits from other activities through loss transfer. Under such design, those who do not have taxable profits from other activities have to carry stand-alone losses forward to offset against hoped for future taxable profit from their taxable activity.
Page 80
As explained in section 3 and section 4.2, the original design of the PRRT sought to minimise this potential tax distortion even though the PRRT then applied on the basis of ring fenced projects with no transferability. To minimise this effect, PRRT losses are not just carried forward at face value, they are carried forward with uplift to maintain the value of losses over time. The aim is for the writing-off of the losses against future PRRT profit to provide an outcome financially equivalent to one where the investors had been able to offset the losses fully up front.
Being a project-based system, however, there is no guarantee investors with PRRT losses from a project will always be able to fully offset losses against future PRRT profits from the same project — regardless of the level of the uplift rate applying to the losses. Section 4.2 explains that the loading on LTBR in the uplift rate was designed as a counterweight to the risk of losing deductions entirely.
After the introduction of transferability, investors without PRRT profits still attract an uplift on LTBR for the risk of losing their exploration deductions. But those investors with PRRT profits can immediately offset their exploration deductions, including deductions from greenfields exploration, against these PRRT profits. The overall risk of losing exploration deductions across the industry must therefore be significantly reduced.
The consequent different treatment of losses of different investors should be viewed in the context of the prior variability in PRRT treatment of different investors. That variability already existed because of the vastly different risks of losing deductions across different projects matched up against a necessarily uniform uplift rate and design which cannot guarantee ultimate loss offset. Wider deductibility simply reduced the overall degree of risk of losing deductions for exploration expenditure. Consequently, as discussed in section 4.2, the reduced overall risk of losing deductions suggests that the uplift rate of LTBR plus 15 percentage points should be reduced.
It might seem that a reduction in the uplift rate as a consequence of widened deductibility disadvantages investors with standalone projects. Attempting to address this by applying a different uplift rate for such projects would be impracticable because it is impossible to know in advance which investors might or might not ultimately have interests in more than one project. The industry is largely characterised by multiple partners, in joint ventures, typically with interests in more than one project. In any case, once a standalone project becomes profitable, prior uplifted greenfields exploration expenditure of the associated investors is deductible against the project’s PRRT profits.
Transferability of exploration expenditure offers the prospect of helping to ensure that the Australian community receives an equitable return from the use of its petroleum resources while not discouraging petroleum investment. The introduction of transferability provides the basis for reducing the uplift rate for qualifying exploration expenditure which would increase future PRRT income. The modelling in section 2.3.4 illustrates how the impact of the compulsory transfer of exploration deductions avoids the compounding of these deductions in many of the recent major LNG projects that can delay PRRT revenue for lengthy periods — perhaps indefinitely. Transferability also ensures that some investors will not lose deductions for risky exploration activities.
Page 81

However, a project’s own exploration expenditure compulsorily transferred (to the project with the most recent production licence as explained in Appendix B.1.7) may see its uplift rate reduced from LTBR plus 15 percentage points to GDP deflator. This is because it is treated as exploration expenditure of the receiving project and the receiving project’s production licence may be more than five years after the transferred exploration expenditure was incurred. As noted by ExxonMobil Australia in their submission:
Further, the way the ordering and transferability rules operate, the investor may find that exploration expenditure of an initial marginal project that is being uplifted at LTBR plus 15 per cent is suddenly reduced to GDP deflator when it is compulsorily transferred to a second, more profitable, project. This effectively means that in many cases the investor does not receive the benefit of the headline LTBR plus 15 per cent uplift rate (ExxonMobil Australia submission, p. 5).
In different circumstances, transferred exploration expenditure recently incurred could attract immediate offset against PRRT profit of the receiving project, and so would avoid the risk of losing the associated deductions completely. Moreover, transferred exploration that was being uplifted at GDP deflator in its own project may have its uplift rate increased to LTBR plus 15 percentage points if the production licence of the receiving project came before, or not greater than, five years after the exploration expenditure was incurred. Nevertheless, preferred design would allow transferability of exploration deductions without inconsistent application of uplift rates.
4.4 ORDERING OF DEDUCTIONSIn the original PRRT design deductible expenditures with higher uplift were deducted before those with lower uplift, with closing down expenditure last as it potentially provided a credit to the PRRT taxpayer.
When wider transferability was introduced in 1991, the ordering rules were changed to first utilise deductible expenditure that is not transferable. The aim was to make sure that a project’s deductions that are quarantined to the project (project-specific or non-transferable deductions) were not displaced by deduction of the project’s exploration expenditure that could potentially be transferred to other projects.
This was explained in the second reading speech for the Petroleum Resource Rent Legislation Amendment Act 1991 (where ‘other project’ exploration expenditure refers to exploration expenditure transferred in):
‘To minimise the risk that project specific expenditure for unsuccessful or marginal projects would not be deducted, the amendments will provide for an order of deductions that will ensure project specific expenditures are written off first. The order of deductions for RRT liable projects will be non-transferable project expenditure, including general expenditure and pre-1 July 1990 exploration expenditure, project specific exploration expenditure, closing down expenditure and other project transferable exploration expenditure.’ The Hon Paul Keating MP (Parliament of Australia, 1991, p. 3437).
In the 1991 amendments, the uplift rate for general expenditure was reduced from LTBR plus 15 percentage points to LTBR plus 5 percentage points (for expenditure incurred after 1 July 1990). The uplift rate for exploration
Page 82

expenditure incurred after 1 July 1990 was maintained at LTBR plus 15 percentage points.
The accompanying changes to the ordering rules meant that deductible expenditures with higher uplift rates were no longer deducted first. Instead a project’s general expenditure is deducted before (transferable) exploration expenditure (although exploration expenditure uplifted at LTBR plus 15 percentage points is deducted before exploration expenditure uplifted at the GDP deflator). The result is that, if exploration expenditure for a project is not transferred but is deducted against the receipts of that project, the exploration expenditure deductions (uplifted at LTBR plus 15 percentage points) can accumulate and grow rapidly well into the production phase before the project’s accumulated pool of uplifted general expenditure deductions is exhausted. Exploration expenditure that is transferred into a project from elsewhere remains last in the order of deductions (absorbed by pre-transfer PRRT profit).
4.4.1 Further changes to the ordering of deductionsIn 2012, the ordering of deductions was again amended when PRRT was extended onshore and to the NWS. The projects transitioned into the PRRT were already subject to state or Commonwealth royalties and excises and attracted starting bases in recognition of the imposition of PRRT (see section 4.7.1). The issue raised was the ordering of deductions for royalties/excises (which are creditable for PRRT purposes), starting base deductions and acquired exploration expenditure (associated with one method of starting base determination). These deductions generally attract an uplift of LTBR plus 5 percentage points.
Expenditure in these new categories is deducted after the project’s own (transferable) exploration expenditure. This ordering would seem to contradict the 1991 policy aim of having a project’s quarantined deductions applied ahead of its (transferable) exploration deductions.
As a result, the ordering of PRRT deductions is complex with no consistent rationale. In broad terms and ignoring pre-1990 and closing down expenditures, the current ordering is:
• general expenditure (LTBR plus 5 per cent uplift);
• project’s own (transferable) qualifying exploration expenditure incurred within five years of production licence (LTBR plus 15 per cent uplift);
• project’s own (transferable) exploration expenditure incurred more than five years before production licence (GDP deflator uplift);
• grossed-up deductions for royalties and excises (LTBR plus 5 per cent uplift);
• acquired exploration expenditure (generally LTBR plus 5 per cent uplift);
• starting base deductions (generally LTBR plus 5 per cent uplift); and
• exploration expenditure transferred in from elsewhere (LTBR plus 15 per cent or GDP deflator uplift).
Page 83
The 1991 changes to the ordering of deductions can have a major impact on the amount of PRRT a project may pay as the expenditure with the highest uplift rate may not be deductible first. As illustrated in Figure 4.4, this can result in deductions with uplift at LTBR plus 15 percentage points dominating a project’s profile of PRRT payments. This is particularly so for gas projects with moderate profitability, and long lead times before production begins and very high levels of general project expenditure. The implications of changing the order of deductions for a petroleum industry that is now dominated by major LNG projects would not have been a consideration in 1991 when the ordering of deductions was changed.
Figure 4.4 — Hypothetical gas project subject to current ordering
Source: Petroleum Resource Rent Tax Review Secretariat.
In addition, the ordering in 2012 of royalty and starting base deductions after a project’s own exploration expenditure means that an extra expenditure pool for royalty and starting base deductions needs to be maintained (to be applied when uplifted exploration deductions are exhausted). This results in additional complexity and means the ordering of deductions works differently for those companies who have their historical expenditure recognised in the starting base (deductible last) compared to those who have it recognised as general expenditure (deducted first).
The 2012 ordering may have been in response to the recognition that transitioning projects were unlikely to ever pay PRRT and as a consequence transferable expenditure was placed higher in the order of deductions to reduce the revenue risk of this expenditure reducing PRRT payable in other projects, although this is not documented.
Overall, the current system appears complex and tries to accommodate varying underlying principles.
Page 84
-70000.00
-60000.00
-50000.00
-40000.00
-30000.00
-20000.00
-10000.00
0.00
10000.00
20000.00
30000.00
40000.00
1 2 3 4 5 6 7 8 9 10 11 12 13 14 15 16 17 18 19 20 21 22 23 24 25 26 27 28 29 30 31 32 33 34 35 36 37 38 39 40
$million
Gross receipts Exploration expenditure General expenditure Undeducted plus uplift PRRT
4.4.2 Possible changes to ordering arrangements Rules setting out the order in which a project’s uplifted PRRT expenditures are deducted would not be necessary if a single uplift rate were applied to all expenditures. However, since the inception of the PRRT different uplift rates have applied to different classes of expenditure. The order of deductions will have a significant impact on PRRT revenue as long as there are large differences in uplift rates for different types of expenditure.
Consistency could be achieved in the ordering of deductions by following the broad principle that expenditure with the highest uplift rate is ordered first. However, were royalty and starting base deductions applied before own-project exploration expenditure attracting GDP deflator uplift, there would be a greater chance that this uplifted exploration expenditure would remain available to be transferred to profitable projects.
Given that the circumstances of the starting base provided to transitioning projects has largely eliminated the possibility that these projects will pay PRRT (as discussed in section 4.7), it does not seem appropriate that transitioning projects also be allowed to transfer significant amounts of exploration expenditure to other projects thereby lowering PRRT payable in these other projects.
Combining these two considerations would see expenditure deducted in the following sequence, based on the dual ordering principle of expenditure with higher uplift before expenditure with lower uplift and transferable expenditure before project-specific expenditure:
• transferable project-specific qualifying exploration expenditure (LTBR plus 15 per cent uplift);
• transferable project-specific exploration expenditure (GDP deflator uplift);
• general expenditure (LTBR plus 5 per cent uplift); and
• royalty and starting base (LTBR plus 5 per cent uplift).
Current pooling arrangements would be simplified under this design. As illustrated in Figures 4.5 and 4.6, this change would also have significant impact on PRRT revenue, particularly from large scale gas projects.
Figure 4.5 shows that under this design the hypothetical gas project referred to in Figure 4.4 would start paying PRRT in year 18 rather than year 36 under current ordering as shown in Figure 4.4.
Page 85

Figure 4.5 — Hypothetical gas project with expenditure with highest uplift deducted first
Source: Petroleum Resource Rent Tax Review Secretariat.
Figure 4.6 illustrates the estimated effect on the review’s baseline scenario for aggregate PRRT revenue of changing the order of deductions to have exploration expenditure deducted first. Such a change would result in increased PRRT revenue from 2024 to 2028 of around $7 billion, followed by a brief period of reduced revenue, after which there would be a steady annual increase in revenue to 2050, totalling around $17 billion over the whole period.
Figure 4.6 — Effect on PRRT revenue of expenditure with highest uplift deducted first
Source: Petroleum Resource Rent Tax Review Secretariat.
Page 86
-70000.00
-60000.00
-50000.00
-40000.00
-30000.00
-20000.00
-10000.00
0.00
10000.00
20000.00
30000.00
40000.00
1 2 3 4 5 6 7 8 9 10 11 12 13 14 15 16 17 18 19 20 21 22 23 24 25 26 27 28 29 30 31 32 33 34 35 36 37 38 39 40
$million
Gross receipts Exploration expenditure General expenditure Undeducted plus uplift PRRT
-1000
0
1000
2000
3000
4000
5000
6000
7000
8000
-1000
0
1000
2000
3000
4000
5000
6000
7000
8000
2018 2020 2022 2024 2026 2028 2030 2032 2034 2036 2038 2040 2042 2044 2046 2048 2050
$million$million
General expenditure first Exploration first

4.5 STOCKPILE OF DEDUCTIBLE EXPENDITURE The ATO submission provides a snapshot of key PRRT data relating to deductible expenditure. The data aggregate PRRT returns lodged across the system and provide a snapshot across various tax return labels and expenditure categories. The aggregate data for 2015-16 show a further increase in the amount of deductible expenditure that PRRT taxpayers lodging returns have registered in the system.
There will be large increases in deductible expenditure categories when project participants first have assessable PRRT receipts from a project and enter the reporting system. Entities do not have to lodge a PRRT return until they are deriving assessable PRRT receipts. PRRT returns are due 60 days after the end of each tax year. So each time a new project comes online and starts selling petroleum commodities, the accumulated expenditure for that project is first lodged in the reporting system at the end of that PRRT year.
For example, if the first sales of petroleum product from an offshore LNG project occurred in the 2015-16 PRRT year, the first return for project participants deriving assessable PRRT receipts from sales in that PRRT year would be due on 29 August 2016. It would be in this return that they would disclose to the ATO how much deductible expenditure they had incurred in the LNG project up to this point, even though that expenditure would have been spread over many years. This accounts for large and lumpy increases in the aggregate stock of PRRT deductions.
Table 4.1 estimates when Australian LNG projects first commenced or will commence sales and when project participants were or will be included in PRRT aggregate data.
Page 87

Table 4.1 ― Year of project entry into PRRT system
Project First Production* Likely Year Historical Deductions First Recognised in Aggregate PRRT Data
North West Shelf 1984 (domestic gas), 1989 (LNG) 2012-13
Darwin LNG 2006 Not a PRRT project
Pluto 2012 2011-12
Queensland Curtis LNG 2014 2012-13
Gladstone LNG 2015 2012-13
Australia Pacific LNG 2015 2012-13
Gorgon 2016 Likely 2015-16
Wheatstone Planned for mid-2017 Possibly 2017-18
Ichthys Planned for late 2017 Possibly 2017-18
Prelude Planned for 2018 Possibly 2018-19* Based on first production and sales dates from company websites.Source: Petroleum Resource Rent Tax Review Secretariat.
Some submissions to the review highlighted the increase in the carry-forward deductible expenditure from $18 billion in 2011-12 to $188 billion in 2014-15 and $237 billion in 2015-16.
A significant portion of this total amount reflects the addition of the NWS and onshore projects to the PRRT. Resource tax expenditure, acquired exploration expenditure and starting base expenditure are all confined to the onshore and NWS projects. In 2015-16 these categories accounted for approximately 44 per cent of the total deductible expenditure in the system, or $112 billion. These amounts are not transferable to other projects. Unless the individual projects to which these amounts relate have assessable PRRT receipts in excess of the other categories of deductions that are used first, the amounts will continue to be uplifted and provide a shield against future PRRT liabilities.
Beyond starting base expenditure (set at 1 July 2012) and resource tax expenditure, growth of general and exploration deductible expenditure from 2012-13 is also likely to be attributable in part to the onshore and NWS projects joining the PRRT. The result is that a large component of the existing stock of deductible expenditure likely relates to onshore projects and the NWS project.
4.6 RESOURCE TAX EXPENDITUREAppendix B.1.4 outlines that resource tax expenditures (Commonwealth and state royalties and excises) are creditable against PRRT payable and explains how the effect of a credit is achieved. Unused grossed-up resource tax deductions are carried forward at an uplift rate of LTBR plus 5 percentage points (consistent with the uplift rate generally applicable to general project expenditure).
Consistent with the discussion of uplift rates in section 4.2, the PRRT uplift rate should reflect the risk that associated deductions cannot be used. From the Commonwealth’s perspective, there is no difference between providing the value of a credit up front or later if the uplift rate on the credit carried forward matches the Commonwealth’s cost of borrowing or LTBR. This may suggest that the Commonwealth should not be providing an uplift rate for resource tax
Page 88
expenditure credits higher than its cost of borrowing. The 5 percentage point uplift loading on these credits is, however, designed to recognise the risk to the investor that uplifted credits will never be offset against future PRRT payments. In that sense, it is appropriate that the uplift rate for these credits is the same as that for other deductions at the development phase of petroleum projects.
Nevertheless, the risk of losing deductions, including those giving the effect of credits for resource tax expenditures, is very much reduced once projects reach the development stage (section 4.2.4). While that argues for a reduction in the 5 percentage point uplift loading for general expenditure, greater weight could be given to a reduction in the uplift loading for resource tax expenditures given these expenditures attract full crediting against PRRT payments.
4.7 TRANSITIONING ARRANGEMENTS FOR 2012 PRRT EXTENSION4.7.1 The starting base as a deferred tax assetA key feature of the extension of the PRRT to onshore projects and the NWS project in 2012 was that these transitioning projects were provided with a starting base amount. The provision of the starting base was agreed through a Heads of Agreement between the then Government and industry. The details of how the starting base would apply were determined by the Policy Transition Group (PTG).16
Prior to the extension of the PRRT to onshore projects and the NWS project, the only project that had been transitioned into the PRRT was the mature Bass Strait project. On that occasion there was no specific mechanism to recognise past investments. Instead, the treatment of the Bass Strait project reflected negotiations as part of an individual package within broader measures (Policy Transition Group, 2010, p. 90), including removing the project from the Commonwealth’s excise and royalty regime.
Rather than preventing the tax from ‘applying retrospectively’, the starting base effectively ‘grandfathered’ transitioning projects. Several submissions made the observation that the rationale for the starting base was to shield a company’s historical investments so the PRRT did not effectively apply retrospectively to these past investments.
The starting base reflects the value of the projects upon entry into the PRRT regime. The starting base also provides an equitable outcome that acknowledges the PRRT was not applicable to these projects at the time investment decisions were taken (Shell Submission, p. 10).
Without such recognition investors would have been disadvantaged, leading to the premature payment of PRRT before earning economic rent from the project. This measure ensured Australia’s competitiveness in the global oil and
16 A body lead by then Resources Minister, The Hon Martin Ferguson MP, and Mr Don Argus AC formed by the Government to oversee the development of detailed technical design of legislation covering both the MRRT and the extension of the PRRT to cover all petroleum projects onshore and offshore Australia.
Page 89

gas market and investor confidence was not eroded through fiscal instability (Shell Submission, p. 17).
The PRRT starting base ensured that sovereign risk from a changing fiscal regime was minimised, and the value of existing investments was protected. The starting base should be maintained in its current form for existing projects (Origin Energy Submission, p. 1).
While the PRRT has been in operation since 1988, Queensland’s onshore gas industry has only been subject to the PRRT since 2012. At the time the PRRT was applied onshore a starting base was provided to existing projects, to prevent the retrospective application of the tax and to shield the economics of those existing onshore projects (Queensland Resources Council Submission, p. 3).
The value of an existing project comes from its expected future stream of positive cash flows. Taxing that stream without recognising project value in a starting base would have the effect of the imposition of a one-off capital levy (value reduced in proportion to the tax rate). For a company, expectations of future cash flows from the company’s petroleum projects will be largely capitalised into existing share prices. An investor who has just bought into the company is not expecting significant rents, these having been captured by the seller. Consequently, unanticipated taxation of the cash flows of the company’s projects would be expected to result in a reduction in value of the investor’s shares. In addition to these considerations, significant changes to resource tax arrangements can raise investor perceptions of risk, particularly if there is not a strong rationale for the changes.
As noted in Appendix B.1.5, the starting base is calculated using one of three different methods: a market value method (including the value of the resource); a book value method; and a look-back method (which recognises actual expenditures incurred prior to the extension). The starting base is an additional amount of deductible expenditure and is applied against the assessable PRRT receipts of the petroleum project after all the other deductible expenditure of the project, including resource tax expenditure, has been utilised.
Project deductions, whether current or carried forward as losses, should be the first amounts to reduce PRRT revenue. It is only after these amounts have been applied that a PRRT liability could arise in respect of a project. Where a potential PRRT liability remains, government resource tax credits are to be applied on a credit equivalent basis. Starting base deductions should then be applied to shield existing investment from any residual tax liability (Policy Transition Group, 2010, p. 93).
The projects that have transitioned into the PRRT bring with them large starting bases. Several factors have contributed to the large size of these starting bases. First, most transitioning projects elected to use the market value approach to valuing their starting base. The market value method includes the market value of the resource. At the time of the PRRT’s extension, Professor Michael Crommelin from the University of Melbourne made the following observation on the transitional arrangements for the PRRT and the MRRT that allowed resource projects to value their starting base on a market value basis:
Page 90

That approach is absolute anathema to the very concept of a resource based tax. It just gave the companies what the tax base would otherwise have been. It’s destroyed the tax base. The companies can, having obtained these valuations of these assets at that time, deduct a fixed percentage of those valuations until 2037. So they have very substantial deductions for the next 24 years which effectively erode dramatically the tax base as it would otherwise be for the MRRT. So far as the PRRT is concerned, the arrangement is the same but the practical consequence is probably much less significant because you don’t have existing onshore petroleum investments at anything like the scale that you have for the iron ore mines and the coal mines. So in simple terms, the option given to the companies of the market value approach to valuation of starting based assets destroyed the tax base of the MRRT. It hardly comes as a surprise then that the returns from that tax have not only been small but are not projected to rise dramatically at least in the foreseeable future (Grattan Institute, 2013, p. 4).
Several submissions to the review commented on the starting base arrangements, noting that transitioning projects are unlikely to pay PRRT in the foreseeable future, if at all, given the size of the royalty payments and starting base expenditure. It was also suggested that allowing companies to value their starting base assets at their market value was excessively generous. Prosper Australia was particularly critical of allowing projects to value their starting base assets at their market values.
The net effect is to shield the full economic rent of the project from the PRRT, since the market value of the project is the capitalisation of all future economic rents! This move was either a massive mistake or was developed with a high degree of industry input and limited oversight from a frank and fearless public service (Prosper Australia Submission, p. 7).
The PTG recognised that the provision of the starting base and the way it is valued can have significant bearing on taxpayer liabilities.
The PTG notes that market valuation of the starting base could have a significant bearing on taxpayer liabilities for PRRT and that different valuation methodologies and assumptions can produce quite different results (Policy Transition Group, 2010, p. 91).
Also impacting on the extent to which the starting base arrangements will shield projects from PRRT payments is the fact that oil and gas prices were significantly higher at the time that the starting bases were calculated compared with current prices. Figure 4.7 illustrates the movement of the oil price (tapis $USD/barrel) since 2000.
Page 91
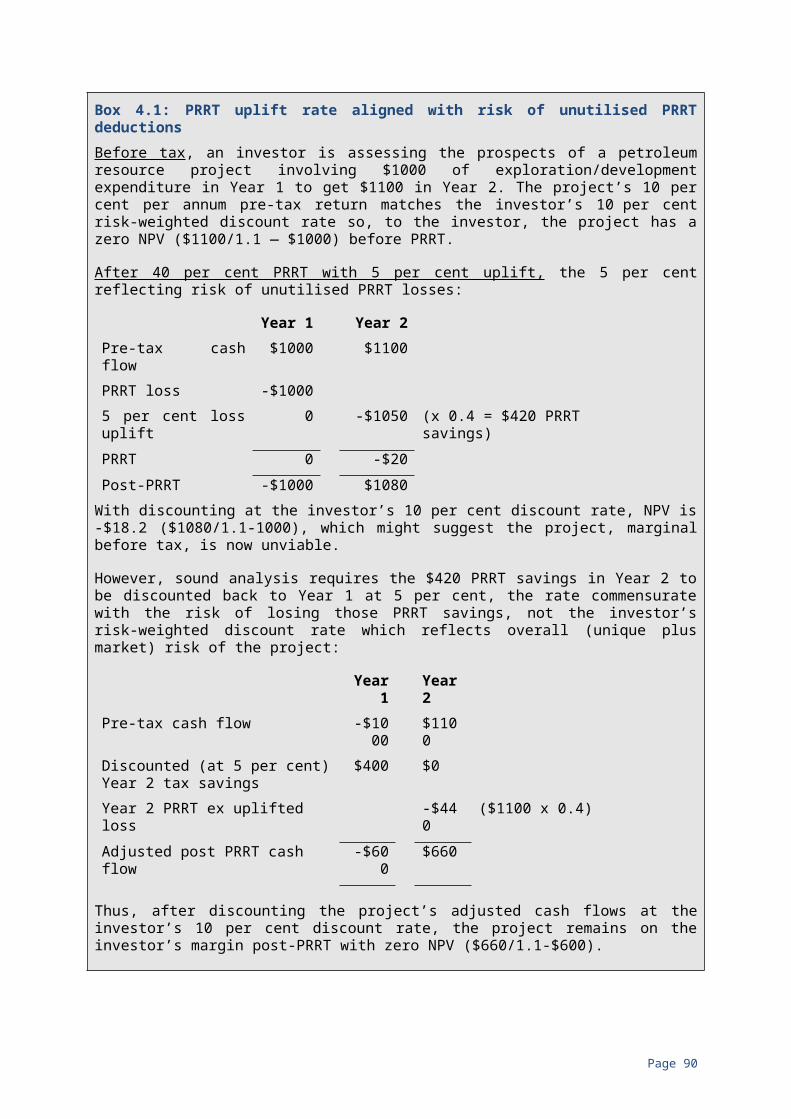
Figure 4.7 — Historic oil prices (Tapis, $USD/barrel)
Source: Petroleum Resource Rent Tax Review Secretariat.
The augmentation rate at which the starting base is uplifted has meant that the starting base continues to grow. The PTG recommended that the starting base should be uplifted at the same augmentation rate as general project expenditure, namely LTBR plus 5 percentage points.
Starting base amounts should be treated in the same manner as general project expenditure, being immediately deductible, non-transferable and non-refundable, with undeducted amounts uplifted in accordance with the existing augmentation provisions (Policy Transition Group, 2010, p. 123).
These factors — the market value of the resource, high oil prices at the time of valuation, and the uplift rate attached to the starting base — mean that transitioning projects will only pay PRRT in the event that the projects’ profitability proves to be significantly better than market expectations in 2010. Further, transitioning projects, like all onshore projects, are subject to state royalties, which are creditable against PRRT. This means these projects will only pay PRRT where their assessable PRRT receipts exceed their deductible expenditures including their carry-forward starting bases and grossed-up royalty payments (section 4.6).
The review’s modelling confirms that transitioning projects are not expected to pay PRRT under existing arrangements even at average oil prices of $US100 per barrel to 2050.
An additional consequence of transitioning projects into the PRRT under rules which mean they are unlikely to pay PRRT is that transferable exploration expenditure from these projects could reduce PRRT payable in other projects. The ordering of deductions set in 2012 for starting base and royalty credits had those deductions coming after transferable exploration expenditure which reduces this risk. However, as exploration expenditure is compulsorily transferred to a PRRT payable project as soon as it is allowed, it is likely that some of the exploration expenditure from transitioning projects has been transferred to existing projects and therefore reduced PRRT revenue overall since 2012.
Page 92
0
20
40
60
80
100
120
140
0
20
40
60
80
100
120
140
Mar-00 Sep-01 Mar-03 Sep-04 Mar-06 Sep-07 Mar-09 Sep-10 Mar-12 Sep-13 Mar-15
$US$US
$USD/Barrel
4.7.2 Combining projectsAn important integrity measure applying to transitioning projects specifically excluded them from combining with offshore projects. Since there was an expectation that transitioning projects would be heavily shielded from PRRT liabilities, it was anticipated that there would be a revenue risk if starting bases could also be used as a tax shield for offshore projects through projects combining into a single project for PRRT purposes.
However, this integrity measure was not extended to onshore projects. It is possible that onshore exploration permits that are developed and converted into production licences, and become onshore projects for PRRT purposes, could apply to the Resources Minister to combine with other onshore projects with a starting base. Where onshore projects combine to form a single project, any starting base amounts from the projects are pooled together, rather than being quarantined, and can be used to provide a ‘tax shield’ for any assessable PRRT receipts produced from the combined project.
This could have significant implications for future PRRT collections as the starting base from these onshore transitional projects could be used to shield future economic rents from future projects that do not have a starting base.
It would be appropriate to extend the integrity measure prohibiting offshore projects combining with transitioning onshore projects so that future onshore projects with no starting base were also prohibited from combining with these onshore projects with a starting base. This will ensure the 2010 starting base arrangements do not provide a tax shield for future investment and development, which was not intended. Alternatively, the starting base expenditure from each project could be quarantined when projects combine to form a single project, so the starting base expenditure can only be used against the assessable PRRT receipts derived from the project that originally attracted the starting base. However, this approach would introduce further complexity to the PRRT and significantly increase the compliance burden on taxpayers.
4.8 CLOSING DOWN EXPENDITUREA number of offshore projects within Australia are reaching the end of their productive lives and it is anticipated that, within the next two decades, will need to be decommissioned. Recent estimates indicate 100 offshore oil production installations will need to be decommissioned in Australia to 2040, at a cost of $1.2 billion (Barrymore and Butler, 2015).
Under the PRRT, ‘closing down expenditure’ is a recognised category of deductions. Expenditure will be deductible as closing down expenditure if it is related to closing down a petroleum project. This includes expenditure on environmental restoration of the petroleum project area and the removal of drilling platforms (but not the cost of relocating them elsewhere). Closing down expenditure is not augmented and carried forward like other deductible expenditure categories, nor is it transferable. The expenditure is only recognised in the year it is incurred and consequently may attract a tax credit. This is the case because closing down expenditure is usually incurred once a project has ceased production and is not generating any income.
Page 93

If there are not sufficient assessable receipts for a year against which to deduct closing down expenditure incurred for that year, a tax credit of 40 per cent of the excess expenditure is provided to the extent that a project has previously paid PRRT. The provision of a tax credit means that the value of eligible closing down expenditure incurred may be realised even though production from the associated project may have ceased. The closing down credits cannot exceed the amount of PRRT the project has paid.
Several submissions raised issues in relation to closing down expenditure, including: the appropriateness from a community perspective for projects to receive PRRT credits for closing down costs; the need for guidelines to clarify expectations for decommissioning; and whether the existing law is flexible enough to deal with modern multi-stage petroleum projects.
4.8.1 Opposition to the PRRT closing down creditThe Tax Justice Network Australia submission opposed the PRRT credit allowed for closing down expenditure:
There appears to be no valid reasons for companies to be refunded for decommissioning costs after successfully operating and profiting from reserves for decades. Refunds for decommissioning costs under the PRRT should be eliminated (Tax Justice Network Australia Submission, p. 4).
The PRRT taxes positive cash flows: assessable receipts less associated project expenditure. Closing down expenditure is a project cost, just like exploration costs and general expenditure. A significant feature of closing down costs is they are most likely to be incurred only after a project is no longer generating receipts against which to offset the costs. Making closing down expenditure deductible but not creditable would be the equivalent of not recognising the closing down expenditure as a project cost.
4.8.2 Guidance on project decommissioningDecommissioning arrangements were raised by BHP Billiton, which operates three legacy assets: Griffin, Stybarrow and Minerva that are transitioning to closure and decommissioning. BHP Billiton noted:
There is no guidance material available from the regulator on the expectations for decommissioning, as such there is no clarity for oil and gas operators or the government on the full liability decommissioning costs represent (BHP Billiton Submission, p. 18).
It is outside the scope of the review to comment on policy and regulatory considerations relating to decommissioning. For clarity regarding the expectations about decommissioning, DIIS is in the process of reviewing the policy and seeking to identify areas where the existing regulatory and legislative framework for decommissioning in Commonwealth waters could be clarified or improved. The Department’s review is broad, encompassing legislative, regulatory and policy issues with the aim of ensuring decommissioning strikes the right balance between: enabling productivity improvements for the offshore petroleum sector; meeting community expectations; and maintaining optimal safety and environmental outcomes. As part of this process, the Department will release guidelines to provide companies with clarity on legislative and regulatory
Page 94

requirements, along with Government policy and expectations for the decommissioning of offshore petroleum infrastructure in Commonwealth waters.
As noted earlier, closing down costs are an integral design feature of the PRRT; however, there is a risk that PRRT revenue could be significantly eroded if regulatory requirements for removing infrastructure and for environmental restoration are unnecessarily onerous. This could materially alter the return to the community from the use of its petroleum resources. It is important therefore that the Department’s review of decommissioning requirements seeks an appropriate balance between environmental and cost outcomes.
4.8.3 Partial closing down costs The PRRT legislation has a linear approach to the operational life of petroleum projects across the phases of exploration, construction, production and closing down. This observation was made by ExxonMobil Australia:
The PRRT was enacted as a cradle-to-grave tax. Section 37, the cradle, provided for exploration, while section 38, life, provided for development and operation, and section 39, the grave, closing down. It was predicated upon providing a stable whole of life taxing regime that attracted investment capital into the petroleum industry in Australia whilst providing an equitable return to the community from the use of the community’s resources (ExxonMobil Australia submission, p. 3).
This linear or cradle-to-grave design of the PRRT does not always reflect the modern characteristics of multi-stage oil and gas projects. For example, typical oil and gas projects have long pay back periods and long operational lives during which the projects’ original petroleum resources may be depleted and associated infrastructure closed down, but production may continue for many years through the commissioning of new wells in existing adjacent tenements, known as brownfield developments.
In its submission, APPEA identifies these ‘partial close down scenarios’ as an area of potential uncertainty for industry:
The law is currently uncertain in the context of what represents closing down expenditure — is it the closure and or abandonment of any facility within a project area or the last production facility within a project area? To promote certainty for the large scale developments that are becoming more common (as opposed to the simpler offshore oil platform scenario), it would be helpful to remove this potential for ambiguity (APPEA submission, p. 82).
The ATO submission notes that it is currently undertaking consultations to clarify, ‘when a payment is considered to constitute closing down expenditure within the meaning of the Act’ (ATO submission, p. 23).
There have already been some changes made to the PRRT legislation to cater for infrastructure licences that were introduced in 2000 to allow for the continued use of project infrastructure for specific activities other than exploring and recovering petroleum. The infrastructure licences covered the situation where the petroleum reserves for a project have been exhausted by allowing the project infrastructure to be used to process petroleum piped in from an alternative
Page 95
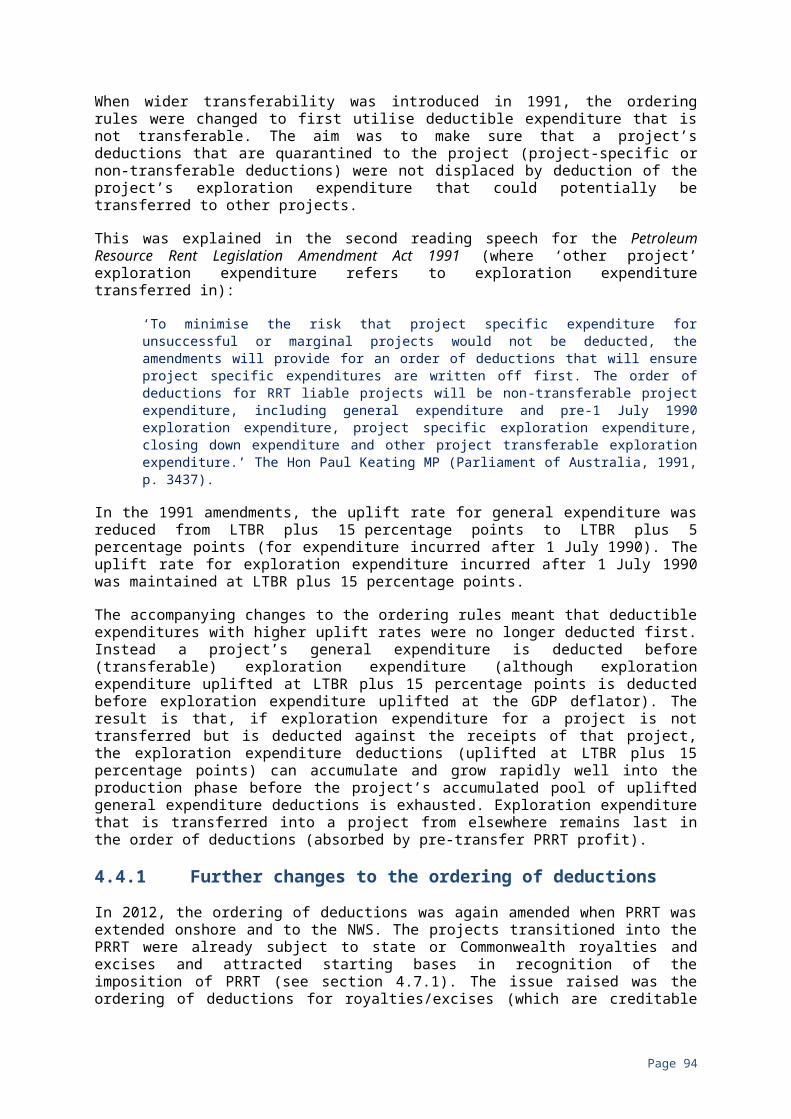
source located nearby. The owners of the infrastructure would receive a fee for providing this service to a third party.
In 2006, the PRRT was amended to include as allowable deductions, future costs of closing down project infrastructure that remains operating beyond production licence expiry via acquisition of an infrastructure licence. The 2006 amendments partly addressed some of the issues concerning closing down expenditure in some circumstances. They did not, however, deal with all the issues raised by APPEA relating to large multi-stage projects that have become a feature of Australia’s petroleum industry.
In principle, the eligible costs of closing down parts of a multi-stage project should be deductible consistent with the treatment for a single linear project. The partial decommissioning of large multistage projects is yet to occur in Australia. There is therefore limited practical evidence to demonstrate whether the existing laws adequately allow for the costs of closing down parts of multi-stage projects, either through the provisions for general operating deductions or through the provision for closing down expenditure deductions. It will be important, however, to keep the law under review to ensure that it is sufficiently flexible to deal with all aspects of partial decommissioning.
4.9 GAS TRANSFER PRICINGThe GTP regulations are detailed and complex. The role of the regulations is to provide a framework for the valuation of gas feedstock (sales gas) for LNG plants at the PRRT taxing point. However, the taxing point (point of first marketable product), the need for a valuation and the valuation methods in the GTP regulations — in particular, the RPM — are not well understood outside a small group of tax practitioners and industry and tax experts.
The purpose of the RPM is to allocate rents of overall gas-to-liquids (GTL) (normally LNG) operations, between the ‘upstream’ component (gas extraction to taxing point) and the ‘downstream’ component (taxing point to LNG production and export). The operation of RPM may be summarised in very broad terms in three stages. First, a specified return (or capital allowance) on upstream capital and operating costs for the year directly determines the upstream gas price and thereby the ‘cost-plus’ measure of upstream gross receipts (price times volume). Secondly, the same specified return (capital allowance) applied to downstream capital and operating costs for the year determines downstream gross receipts which are subtracted from known overall gross receipts from LNG sales to give a ‘netback’ measure of upstream gross receipts. Finally, the RPM measure of upstream gross receipts, subject to PRRT, is the average of the cost-plus and netback measures.
How the RPM splits the overall profits from LNG between upstream and downstream operations can be explained if the specified return on costs in the cost-plus and netback measures is taken to match the investment hurdle rate of the investors concerned (see Box 2.1 in section 2.1.1). In these circumstances, the investors perceive no returns above hurdle rate from upstream activities from the cost-plus measure and no returns above hurdle rate from normal downstream activities from the netback measure (hurdle rate equals specified return in both cases).
Page 96

All above ‘specified’ returns of the overall LNG are therefore allocated upstream by the netback measure (reflected in overall project gross receipts less downstream gross receipts determined by this measure). The RPM then splits these returns or rents equally upstream and downstream.
4.9.1 Issues raised on gas transfer pricingSubmissions to the review provided little detailed analysis of the regulations. Industry submissions highlighted that the regulations were developed in close consultation with industry and emphasised that they formed an important part of the LNG project planning process because they provide certainty. Industry argued that the approach in the RPM of dividing the residual profits (rent) in an integrated LNG operation equally between the upstream and downstream operations was appropriate because it recognised that the two parts of the operation were integrated and one could not exist without the other.
Submissions that were critical of the regulations did not comment on the development of the regulations, discuss the principles behind their development or provide any evidence-based assessment of whether they were working appropriately. Instead these submissions raised three broad issues in relation to the GTP regulations. The first issue is whether a price for sales gas is required at all. Some submissions advocated moving the taxing point to the end of the LNG production process by, for example, using the free on board price for LNG:
… include LNG as a marketable petroleum commodity (MPC) under the PRRT, which would then apply to the integrated project. This would avoid any splitting of economic rents between the resource extraction and the downstream processing, which can (and does) happen in the calculation of the shadow price of the MPC. This is a first-best option and captures the full resource rent as the tax base in these cases (Prosper Australia Submission, p. 12).
The second issue is whether a ‘transfer price’ (the price of sales gas transferred to the LNG process) is the best method for establishing the price for sales gas in an integrated project. The Tax Justice Network Australia observed:
Given that these projects are vertically integrated and taxed at a point when the value is transferred from one related party to another, there are huge potential problems with transfer pricing and undervaluation of the taxable gas. It is very likely that the current means of pricing at the wellhead are inadequate and need to be reformed. The gas pricing is a highly technical and complex issue and we encourage the PRRT Review Team to look at this critical issue and explore best practices both in Australia and globally (Tax Justice Network Australia Submission, p. 3-4).
The third issue is whether the methodology used for establishing a transfer price is appropriate. As Dr Diane Kraal noted:
The Gas Transfer Price method is flawed, as shown by case study modelling. There are alternatives, such as the use of the ‘mid-stream breakeven price’ method, or the ‘Net Back’ method alone, either of which would derive a fairer price (Dr Diane Kraal Submission, p. 2).
Page 97

Submissions also expressed concern about the lack of transparency surrounding the application of the methodology to LNG projects. A submission also questioned whether the existing transfer pricing arrangements are suitable for floating LNG (FLNG) operations. These issues are outlined briefly below; further detailed analysis of the regulations is set out in Appendix B.1.8 and Appendix D.
There is an overall concern in relation to the GTP regulations regarding whether the outcome of the complex calculations is consistent with their intent and whether they operate in a way that prevents a fair return to the community. These concerns are particularly aimed at the RPM where the underlying concern is that it can allocate more profits to the company than to the community. Given that the PRRT is a resource rent tax, the pricing of sales gas under the GTP regulations should result in the PRRT taxing those resource rents that are properly attributable to the associated petroleum resource. Similarly, it would be inappropriate for project profits properly attributable to the downstream LNG processing operation to be captured within the PRRT if the intention of the PRRT is only to capture the resource rents associated with initial processing of sales gas. The allocation of resource rents associated with integrated LNG projects is, however, an issue of some contention.
Consultations have resulted in a range of views being expressed about how resource rents are generated by an integrated LNG project and what underlying assets generate those rents. Some assert that all project rents should be attributable to the resource. Others assert that any rents are attributable to the collective use of a range of assets including the non-renewable resource, capital assets and intellectual property.
4.9.2 Preferred approach to arm’s length pricingThe GTP regulations provide that the arm’s length price of the sales gas in an LNG project can be worked out in three ways: a comparable uncontrolled price (CUP), advanced pricing arrangement (APA) and residual pricing method (RPM). A description of the different options available is in Appendix B.1.8.
It was always intended that if a CUP could be established then that would be preferable to using the RPM. The following is from the explanatory materials for the 2001 amendments introducing the arm’s length test:
The preferred option for implementing the policy objective is to include a methodology to determine a GTP. The shadow pricing methodology can only be used where there is an observable comparable arm’s length price. It is not expected that the shadow pricing method could be reliably applied in the foreseeable future (Explanatory Memorandum, Tax Laws Amendment Bill No. 6 2001 (Cth), p. 20).
The RPM was intended to be a default methodology. However, onshore projects are able to elect the RPM to take precedence over a CUP. This outcome is not consistent with the original intent of using a CUP where available, and appears to be have been done to ensure that the East Coast onshore LNG projects would be able to accurately plan for their entry into the PRRT using the RPM, rather than be subject to a potentially variable CUP that was then not identifiable. Currently, there is a clearer link between the price of gas in the domestic market and the price of sales gas being used for export on the East Coast. If a CUP can be
Page 98

established for operations in the East Coast gas market then it would be preferable to move to the use of the CUP rather than using the RPM.
The LNG operations in North West Australia present a different challenge to establishing a CUP. Some of the operations do not sell gas to the domestic market, meaning the price of sales gas is not observable. Where sales gas is sold it is sold under WA’s domestic gas reservation policy, resulting in a price for the sales gas that is not comparable. These differences mean that there are no observable or comparable market based transactions available to establish a price for sales gas. Despite this, it would be appropriate to continue to pursue the option of establishing a shadow price or CUP across the LNG projects and align the approach to establishing a CUP to the latest OECD recommendations and approaches on transfer pricing. The market conditions and project structures could be regularly reviewed to determine whether it is appropriate to establish an industry wide CUP that would take the place of the RPM as the main GTP methodology for LNG projects.
4.9.3 Effect of the RPMThe RPM operates on a whole-of-LNG-project basis. It attempts to allocate the rents of the project to the upstream and the downstream components of the process. The project’s overall rent or residual profit is split equally between the upstream and the downstream components of the project.
The equal division of rents between the upstream and downstream parts of the operation has a direct effect on the amount of PRRT payable by the project. Under a resource rent tax, the government’s (or the community’s) return from the project is determined by the tax rate. Thus, for integrated LNG projects, the community’s return under the PRRT is 40 per cent of half the overall project rents allocated upstream by the RPM, or 20 per cent of the total project rents. This outcome is driven by decisions made in relation to the PRRT tax rate, the use of RPM and the 50:50 division of the a project’s overall rents using that method.
As noted, one of the options raised in the submissions was to use the netback method alone to determine the taxing point. Figure 4.8 illustrates possible effects on PRRT revenue of allocating the entire rents of a PRRT project to the upstream by using the netback price in the RPM model as the gas transfer price.
Page 99
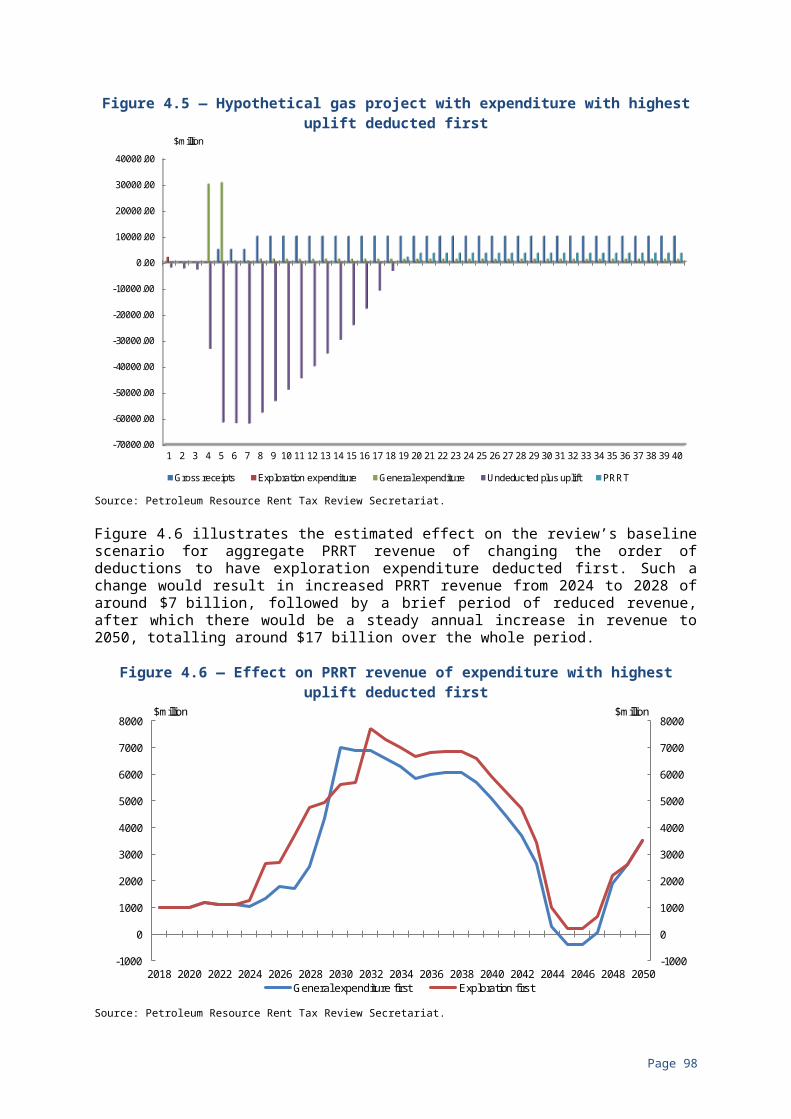
Figure 4.8 — Netback only
Source: Petroleum Resource Rent Tax Review Secretariat.
The figure shows increased PRRT revenue from 2023 to 2050 (totalling around $89 billion) with a particularly strong increase between 2027 and 2039 (totalling around $68 billion).
This outcome is achieved by increasing the transfer price in cases where there are residual profits, and allocating associated residual profits 100 per cent to the upstream to be taxed at 40 per cent, while allowing a return of LTBR plus 7 percentage points to the downstream. The higher revenue is from a combination of:
• projects that were already paying PRRT in the baseline scenario, paying a higher amount of PRRT sooner; and
• projects paying PRRT that were not paying PRRT in the baseline scenario.
In each case the higher amount of PRRT receipts is the result of higher assessable receipts from the LNG projects absorbing the available deductions at a faster rate. The 40 per cent tax rate applies to the higher amount of assessable receipts.
The modelling demonstrates that the GTP arrangements are a very significant factor influencing PRRT revenue and any change in the way that project rents are allocated would have a significant impact on the profit split between the Government and projects.
4.9.4 Issues with RPM frameworkA set of principles were developed in consultation between the Government and industry in the late 1990s to provide a framework for developing the RPM and the regulations. The principles include:
• only upstream activities are liable for PRRT;
• outcomes should be assessed against economic efficiency criteria;
Page 100
-1000
1000
3000
5000
7000
9000
11000
-1000
1000
3000
5000
7000
9000
11000
2018 2020 2022 2024 2026 2028 2030 2032 2034 2036 2038 2040 2042 2044 2046 2048 2050
$million$million
Baseline Netback only
• GTP methodology to apply to all integrated LNG projects;
• project risks equitably reflected on all cost centres;
• the transfer price references the first commercial third party price for derivative products; and
• the transfer price is transparent, equitable, auditable and simple to administer.
These principles are consistent with the original design of the PRRT. However, the submissions illustrate that there is not a consensus on whether the GTP regulations are delivering a transfer price that is transparent, equitable, auditable and simple to administer. The reforms suggested in submissions are aimed at deriving a price for sales gas that is simpler, more transparent or more ‘equitable’; however, each of the alternative approaches represents a departure from the principles previously agreed between Government and industry.
For example, moving the taxing point to the end of the LNG project would mean a change to the principle of only taxing upstream activities. It is consistent with the original design of the PRRT for the taxing point to be where the petroleum is processed to become sales gas, rather than at a point further downstream that includes the whole LNG operation. Such a change would be a shift from a tax on the resource and its associated initial processing, to a tax on the profits of the entire LNG processing value chain.
Likewise, changing the RPM to rely on the netback price only (thereby allocating all project profits to the upstream) would mean that project risks are no longer equitably reflected on all costs centres. The result would be that any rents attributable to the downstream would be captured in the upstream and subject to PRRT.
Shifting away from using the RPM to determine the arm’s length price for sales gas also presents some complexity. The strength of the RPM is that it is a single method that is designed to apply to all LNG projects. The RPM removes the uncertainty that usually arises in valuation matters whether by arm’s length or market valuation principles. The RPM provides certainty by removing the need to determine the most appropriate method to use for valuation, underlying assumptions or forecasts. The RPM does not require multiple experts or valuation professionals to assist with the valuation process. Instead it is a one size fits all approach built on the principle that the GTP methodology applies to all of the integrated LNG projects. Changing the valuation method for sales gas away from the RPM to a different method, either using arm’s length or market valuation principles, may present greater challenges in terms of transparency, equality, auditability and simplicity.
The principles outlined above were developed nearly 20 years ago before the current integrated LNG projects that are subject to PRRT existed, and it is timely to consider whether they are still fit for purpose. If perceived deficiencies with the RPM cannot be addressed then the established principles may need to be revised so that a method for valuing sales gas can be identified that balances the need for certainty in investment with a fair return to the community.
Page 101

Applying a methodology like the RPM where there is so little flexibility and judgement can make it difficult to apply to new situations or scenarios. The ATO and industry should continue to work through new scenarios in advance of projects commencing to ensure that the RPM works as intended. Difficulties should be raised early and resolved publicly — for example, in the form of guidance — to ensure that confidence in application of the RPM is maintained.
4.9.5 Issues with RPM calculationsAlthough using the RPM as the default methodology has benefits for certainty in project planning and administration, the methodology does have a number of perceived issues that warrant further review. One of the design features underpinning the model is that the upstream and downstream components of the integrated LNG operation are treated equally in terms of how the capital invested is rewarded. However, there are a number of features of the RPM that undermine this principle and provide for asymmetric treatment of the upstream and downstream capital:
• In situations where the price received for the LNG at the point of sale means that both the upstream business and the downstream business cannot cover their costs under the RPM, the shortfall or loss is not distributed evenly between the two sides and is instead borne solely by the upstream business.
• Exploration, appraisal and feasibility costs relating to the resource are excluded from the RPM. Therefore, this component of the capital investment is not taken into account in the balance between the upstream and downstream capital allocation. This potentially undervalues the upstream business. The stated reasons for excluding these costs in the explanatory materials to the regulations are not compelling.
• The augmentation (uplift) and depreciation rules also seem to work to the effect that downstream LNG assets will generally be augmented between when they are built and first used, while upstream assets are more likely to be depreciated. This design feature may result in the contribution of the downstream component being overvalued.
Asymmetric treatments of the upstream and downstream components of the RPM should be reviewed to ensure that the model is functioning as intended and the individual or cumulative effect of these asymmetries does not undermine an appropriate return to the community.
Another area of concern in the application of the RPM is the interaction between the capital allowance rate and the residual profit split. The RPM captures value through the use of three main components: a capital allowance, recognition of operating costs and a 50:50 split of any residual profits. The equal allocation of profits, regardless of the contribution of the upstream and downstream components of the business is justified on the basis that in such an integrated operation it is not possible to use any refined basis of allocation. This can result in some unusual outcomes. For example, if the total capital of a project was spent 80 per cent on one side of the taxing point and 20 per cent on the other side of the taxing point, any residual profits would still be allocated equally. This does not seem to be an appropriate outcome. There has been recent work from the OECD on methodologies for allocating profits using a profit split approach.
Page 102

The RPM should be reviewed, to determine whether the 50:50 profit split is consistent with best practice and globally agreed approaches.
The 50:50 split of profits results in outcomes that are inconsistent with the intent of properly capturing the upstream rents within the PRRT ring fence. Where resource rents are high, allocating the higher profits of the whole operation equally will result in the PRRT upstream project being undertaxed. Correspondingly, when downstream rents are high, the equal allocation of residual profits may result in the upstream PRRT project being overtaxed. The 50:50 split assumes that project rents are just as likely to be attributable to the downstream as the resource.
The RPM attempts to split project rents between the upstream and the downstream operations in a way that recognises how integrated operations work consistent with the design principles of the PRRT. It is a very complex process and there are aspects of the RPM calculations that can be questioned. It is not evident from the submissions, however, that there are workable alternative arrangements readily available which will result in improved outcomes. Moreover, recognising that the existing GTP arrangements were developed in close consultation with the industry, and taking into account the long investment cycles of integrated LNG operations and the substantial investment that has taken place based on existing arrangements, any change in the approach to calculating transfer prices would require careful consideration and should be undertaken in consultation with industry. Any in depth review of GTP could examine whether the current arrangements are consistent with the latest transfer pricing practices and whether particular elements should be changed, such as the notional loss situation, the appropriate way to split profits and the appropriate rate to use for the capital allowance.
4.9.6 Gas Transfer Pricing and FLNGDr Diane Kraal has publicly called for the PRRT GTP arrangements to be reviewed to determine whether they adequately cover the development of FLNG (Kraal, 2016).
Shell, who are developing the Prelude FLNG project, commented that:
There are no provisions under PRRT legislation that uniquely apply to FLNG projects and, in our view, none are necessary. The FLNG facility is essentially an LNG processing plant built on a very large floating structure (currently the largest in the world). The main difference between FLNG and conventional onshore LNG plants that is relevant for PRRT purposes is the floating infrastructure (for example, the hull, turret and moorings). Further, FLNG projects do not require a lot of the land-specific infrastructure, including jetties and the works associated with constructing facilities on land.
Expenditure relating to both FLNG and onshore LNG processing plants needs to be apportioned between the upstream (deductible for PRRT) and downstream (not deductible) operations. The capital expenditure relating to differences between FLNG and onshore LNG processing plants is much less than the expenditure on infrastructure and equipment that is common to both, including processing and storage components. Accordingly, in our view, the PRRT outcomes for FLNG projects will be materially consistent with conventional LNG projects (Shell Submission p. 18).
Page 103

There are important choices that need to be made in relation to the RPM; in particular, the allocation of capital expenditure between the downstream and upstream phases of an FLNG project. The taxing point for a project will depend on the particular design of the project and how the gas is processed. In some projects the processing from natural gas to sales gas and the subsequent liquefaction happen in the same plant and, as a result, the taxing point for the gas occurs inside the LNG plant. This apportionment issue is the same for FLNG projects and regular LNG projects, though FLNG will involve apportionment of different physical assets.
Both the PRRT and the RPM already contain apportionment rules between the upstream and downstream components, and for apportionment between petroleum commodities. Although FLNG presents new challenges these are no different conceptually to challenges resulting from any new technological, value chain or process development and the GTP regulations are equipped to deal with them, as complicated as they are.
4.10 PRRT AND INVESTMENT IN MARGINAL PROJECTSA design feature of the PRRT and one of the reasons for its introduction was to have a taxation regime that did not discourage investment in marginal projects. While marginal petroleum projects may not pay PRRT, there is still benefit to the community in the form of the resulting economic activity, employment and increase in other taxes, such as payroll and company tax. Furthermore, at the time of its introduction there was also a strong concern about energy security and supply after the two oil shocks in the 1970s resulted in high prices and supply shortages.
Uniting Church in Australia, the Tax Justice Network Australia and The Australia Institute submissions argued the design of the PRRT has the effect of distorting investment by encouraging the development of economically sub-marginal projects; including causing the development of projects before commercial conditions make them clearly profitable. In general, these submissions suggest that any project that does not pay amounts of PRRT equivalent to what royalties or excises would collect is sub-marginal and should not have proceeded.
Specifically, the Justice and International Mission Unit, Synod of Victoria and Tasmania, Uniting Church in Australia observed:
The current design of the PRRT is to stimulate exploitation of Australia’s non-renewable oil and gas reserves as soon as possible, rather than across a period of time when the return to the Australian public would be greatest (Justice and International Mission Unit, Synod of Victoria and Tasmania, Uniting Church in Australia Submission, p. 1).
The Tax Justice Network Australia stated:
To be cost neutral in terms of the returns to the public, the PRRT would need to collect for highly profitable projects what it gives away to bringing on line ‘marginal’ projects earlier than they would have otherwise been brought online. If the PRRT collects less than what could be collected by an excise or royalty scheme, then in effect the Commonwealth Government is making the public subsidise the bringing online of ‘marginal’ projects ahead of when they
Page 104

would have become profitable (Tax Justice Network Australia Submission, p. 5).
The Australia Institute concluded that the PRRT encourages the development of sub-marginal projects that should not go ahead:
Projects that deliver no economic rent, pay no PRRT, no royalties and receive subsidised infrastructure and other assistance are not the ‘marginal project’ that the PRRT aims to facilitate. They are sub-marginal, reduce the welfare of the Australian public and should not be pursued. In such cases it appears the current system works to distort investment and incentivise sub-marginal projects (The Australia Institute Submission, p 3).
The PRRT is not designed to bring forward marginal projects for early production or to encourage sub-marginal projects to be developed. The profit-based PRRT is designed to have as neutral an impact as practicable on investment decisions in the petroleum industry, including the timing of those decisions, relative to the decisions that would have been taken in the absence of PRRT.
In contrast, traditional production-based petroleum royalties and excises are likely to have a more distortive impact on investment decision making (see section 2.1.1). To illustrate, the submission of the WA Government, while pointing to the practical benefits of production-based royalties, noted the clear benefits of sound investment and production decisions that came from replacing production-based imposts with the Resource Rent Royalty (a tax similar to the PRRT) on the Barrow Island project:
… to ensure the viability of this project, these regimes were replaced with a Resource Rent Royalty under the Barrow Island Royalty Variation Agreement Act 1985 as an incentive for the continued maintenance of the wells on Barrow Island to ensure optimal oil recovery. At the time it was considered the combined royalty regimes were threatening the shutdown of parts of the project (Western Australian Government submission, p. 8).
These views in the above submissions also suggest a jurisdiction’s taxation regime is the main driver for petroleum development. However, as described in section 1.5.2 petroleum companies factor in a range of considerations when making a FID, including: prevailing market conditions; quality and size of petroleum reserves; policy and regulatory settings and certainty; fiscal settings; and proximity to market. Many of the investments that have taken place in the last ten years were the result of years of planning taking such considerations into account. The timing of any decision to proceed is sensitive to all these considerations and good tax design does not interfere with that decision or its timing. For example, Cooper Energy’s submission referred to its Sole project that has been in the development phase for 40 years but is only now becoming viable because of market conditions:
… it is relevant to note that Sole is not a new discovery, having been drilled initially in 1973 and successfully appraised in 2002. The field was not previously developed as it was uneconomic at the then prevailing gas prices. Sole has only recently qualified as a commercial project because of the stronger prices brought by the tightening of gas supply to south-east Australia (Cooper Energy Submission, p. 2).
Page 105

The current lower price environment for petroleum is a cyclical feature of global energy markets. Accordingly, a project that is economically marginal now could be profitable in the future. Thus, a profit-based tax like the PRRT that does not interfere with decisions regarding marginal petroleum projects stands to provide returns to the community that are much greater that those from regular royalties when product prices and profitability increase.
An example of the importance of PRRT not discouraging marginal projects, setting the circumstances for the community to benefit in future economic upswings, was provided in BHP Billiton’s submission. When the Stybarrow oil field was discovered in 2003, with an estimated 70 million recoverable barrels of oil, it was considered a marginal project due to the low oil price and associated development cost of the field. The PRRT regime, however, was conducive to the viable development of this project. Petroleum taxation arrangements meant that the cost of the greenfields exploration could be offset against the producing Griffin field, and that the cost of developing the offshore field could be offset once production commenced. A production-based royalty instead of the profit-based PRRT would likely have had the effect of directing capital to other projects outside of Australia.
BHP Billiton’s investment decision for Stybarrow, at a time of low oil prices, incorporated a low capital expenditure infrastructure leasing arrangement due to expected low project returns based on the oil price at the time. The design of the PRRT did not interfere with the investment decision.
As the project commenced production in 2007, oil prices unexpectedly increased significantly, to around US$150 per barrel. As a result, the Stybarrow project’s upfront capital expenditure was paid off within three months of start-up and the project began paying PRRT in the same year production commenced.
Stybarrow continued paying PRRT for the remainder of its production life. BHP Billiton’s share of the Stybarrow project delivered $856 million in PRRT. This project was made possible because the design of the PRRT provided BHP Billiton with the confidence to invest and resulted in windfall profits for the Australian people when prices where high.
In comparison, if BHP Billiton were to develop Stybarrow today, assuming the same development concept, cost, capital expenditure and production profile, the return to Government would be significantly lower due to the considerably lower oil price. Given the current low oil price environment, a taxation regime that interfered more with commercial decision making than the existing PRRT would effectively preclude the development of a Stybarrow equivalent today (BHP Billiton Submission, p. 8-9).
4.11 ROBUSTNESS OF PRRT ADMINISTRATION The ATO administers the PRRT as part of its broader administration of the Australian taxation system. The ATO administrative functions include compliance, engagement and assurance, risk and intelligence, legal interpretation and advice, reporting, registration, debt management and collection.
Page 106
4.11.1 Self-assessment and complianceThe PRRT, like other Commonwealth taxes such as income tax, operates on the basis of a self-assessment system. Several submissions raised concerns about the PRRT self-assessment system:
State governments have not had a vested interest in monitoring these projects and at the federal level the industry is taking the greatest advantages possible under a system of self-regulation and voluntary compliance. This is self-regulation and voluntary compliance for large multinationals which have proven themselves extremely adept at aggressive tax avoidance in Australia and around the world (Tax Justice Network Australia Submission, p. 1).
Concerns were also raised over a lack of transparency in how PRRT taxpayers self-assessed their PRRT liabilities:
The inherent problems of a profit-based resource tax are further exacerbated because the system lacks transparency and is based on self-reporting and voluntary compliance (Tax Justice Network Australia Submission, p. 3).
In recent years the PRRT has failed as a tax. It is extraordinary that multi-billion dollar private revenues from offshore gas fields are likely to yield little or no public revenue from the PRRT for many years, notwithstanding the inevitable ‘delays’ in revenue yields from a profit-based tax. The reasons appear to include excessively generous ‘uplift factors’ for deductible expenses; lack of transparency in gas pricing; international profit-shifting; and the system of self-assessment (Australian Council of Social Service Submission, p. 1).
The petroleum industry supported the self-assessment regime:
The decision to introduce self-assessment was a logical and considered decision that recognised the practical benefits of such a change, while ensuring that strong protections existed to maintain the integrity of the regime. It represented a natural progression in terms of the administration of PRRT (APPEA Submission p. 72).
The industry experience is that the ATO has expanded both the number of resources and depth of industry experience in the context of administering PRRT. Any perceived lack of transparency should not be confused with a lack of compliance activity (APPEA Submission p. 52).
The self-assessment system is not unique to the PRRT and is commonly used in other Commonwealth taxes such as income tax and the goods and services tax (GST). It is not a voluntary system and imposes a number of reporting and disclosure obligations on taxpayers. The ATO has strong enforcement powers and is able to review and amend assessments where necessary. Penalties apply if taxpayers do not meet their obligations under the law. Under self-assessment the onus is on the taxpayer to correctly lodge their returns and to actively manage their own tax risks. The ATO is resourced with staff and has administrative powers to make corrections to these assessments when they consider it is necessary to ensure PRRT taxpayers pay the right amount of tax.
Page 107
The PRRT taxpayer base is very concentrated compared to other tax bases such as income tax. For example, in 2015-16 there were only six projects making taxable profits and therefore paying PRRT. Another 55 projects lodged annual returns but did not pay PRRT.
The concentrated nature of the industry allows the ATO to closely monitor all PRRT projects and to pay particularly close attention to those that are, or are close to, being profitable to ensure the correct amount of PRRT is being paid.
The ATO has publically stated it is able to have one on one engagement with all paying projects due to the small number of projects paying the PRRT. This high level of coverage gives the ATO a very high degree of confidence in the accuracy of the PRRT paid by these projects (Parliament of Australia, 2017, p. 52).
The ATO uses a risk-based approach to ensure its resources and efforts are focused on those PRRT taxpayers and issues posing the greatest risk to the PRRT system. There are also features of the natural business systems of the oil and gas industry that make risk assessment of the PRRT more robust than other taxes. For example, the vast majority of the petroleum projects in Australia are operated through joint ventures where the operator is primarily responsible for the activities of the project, with each project participant paying their share of the costs of these activities. There is natural commercial tension between the participants in joint ventures as the operator usually needs the approval of all the participants before it can spend money on behalf of the project. They also often have in-built governance safeguards, such as requiring the operator to produce audited joint venture accounts in accordance with generally accepted accounting principles, and for the operator to regularly report to project participants.
Resource companies are often involved in more than one petroleum project. This can lead to participants in competing projects also being participants in the same project and jointly making decisions about the costs the operator can incur on that project. In some LNG projects, buyers who have signed up to long term sales contracts also have an equity stake in the project. In both cases, it is unlikely these competitors involved in the project would allow the operator to profit at their expense by inflating the construction and operating costs of the project.
The ATO leverages the natural tension between the participants in a project as part of its compliance and assurance program for the PRRT. For example, the ATO generally begins any queries or investigations at the joint venture operator level as the majority of the project activities are by the operator. After focusing on the operator, the ATO is then able to compare the claims of the operator with the other participants in the project. Where there are discrepancies between the participants, they are investigated further if the discrepancies are not within tolerance levels or cannot be readily explained by the taxpayer.
The ATO publishes the key risks and behaviour it is concerned about in relation to the PRRT and how it will assess and treat these issues on the ATO website. By being openly transparent about these key risks and behaviours of potential concern the ATO is able to influence taxpayer behaviour. Another way the ATO influences taxpayer behaviour and promotes certainty in the PRRT is by publishing guidance on the PRRT and by consulting with industry on future and emerging issues.
Page 108

4.11.2 Uncertainty in the lawIndustry raised concerns with the ANAO in 2009 that there was considerable uncertainty on the ATO view on a number of interpretative issues, such as the scope of certain indirect costs that are specifically excluded for PRRT, and whether the PRRT meaning of exploration is the same as the income tax meaning of exploration. Concerns were also raised on the taxing point for sales gas.
Similar concerns were also expressed by industry to the PTG during the consultation process for the extension of the PRRT. While it was outside the terms of reference for the PTG to provide recommendations to the Government on the existing operation of the PRRT, the PTG advised the Government to align the meaning of exploration with the income tax meaning of exploration and to change the test for deductibility to a ‘necessarily incurred’ test which is used in income tax law. The PTG acknowledged that adopting these recommendations would come at a revenue cost, and the Government at that time did not choose to adopt the recommendation.
Since the release of the PTG report, there have been a number of cases, such as the Esso decision in 2011, the Esso decision in 2012, and the ZZGN case in 2013 (discussed in Appendix B) which have clarified many of these long standing issues. Following from the Esso case in 2012, amendments were made to the PRRT to clarify the treatment of excluded costs where a PRRT taxpayer procures projects services from a contractor.
The ATO has published two practical compliance guidelines (PCG 2016/12 and PCG 2016/13) that are designed to assist taxpayers comply with the deductible expenditure provisions and the ‘excluded’ expenditure provisions in the PRRT. They broadly outline the types of expenditure the ATO considers to be low risk and will not generally devote compliance resources to review, as well as those types of expenditure the ATO considers to be high risk and is more likely to review. After extensive consultation with industry, the ATO published its view on the meaning of exploration in Taxation Ruling TR 2014/9, which is consistent with the views expressed by the Tribunal in the ZZGN decision.
The APPEA submission referred to the PTG recommendations and said they were no longer needed as these longstanding issues have largely been addressed. Only one company thought these recommendations should still be implemented to reduce compliance costs.
4.11.3 Modernising PRRT administrationThe ATO is facing a number of challenges with the shift by the industry from oil projects to large LNG projects. For instance, a design feature of the PRRT is that a project is required to lodge an annual return with the ATO after the project starts producing assessable PRRT receipts. It is only when a PRRT taxpayer lodges their first return for a project that there is a requirement to disclose the carried forward deductible expenditure for a project.
For some LNG projects, it can take a decade or considerably longer after a discovery is made before commercial production begins and there are assessable PRRT receipts from the project. Since annual returns are only lodged after a project starts producing assessable PRRT receipts it may be many years, or for some LNG projects decades, after expenditure is incurred before assessable
Page 109
receipts are produced and the first annual return is lodged. This significantly restricts the ATO’s ability to undertake compliance activity when a project incurs the expenditure, and also limits the ATO’s ability to provide reliable data to Treasury for revenue forecasting purposes, as the data provided by the ATO is derived from the annual returns.
PRRT taxpayers also do not have certainty over their carried forward expenditure until they start lodging annual returns, as the usual four-year period of review by the Commissioner only applies when an amount of deductible expenditure is included in an assessment. There can also be difficulties for PRRT taxpayers providing information to substantiate their claims for deductible expenditure where the expenditure in dispute was incurred many years, or in some cases, decades earlier.
This problem was raised in the PTG report. It could be addressed by amending the PRRT so that PRRT taxpayers are required to lodge annual returns after they start holding an interest in an exploration permit, retention lease or production licence rather than having to wait until they receive assessable PRRT receipts from the project. Since most PRRT taxpayers already track and substantiate their expenditure when it is incurred the additional compliance costs to gain this certainty should be minimal. However, a process would need to be put in place by the ATO, in consultation with industry, to facilitate the lodgement of annual returns for existing projects, exploration permits and retentions leases. The ATO may also require additional resources so it can undertake the necessary assurance activities, within the usual four-year period of review, to provide the community with confidence the right amount of deductions are claimed in these returns.
Some legal experts consulted by the review suggested the black letter drafting style used in the PRRT legislation (which was common in the 1980s) has resulted in ‘fuzzy law’ and that arguably certain parts of the PRRT are no longer appropriate to deal with some of the commercial and financial arrangements that are in place today. Other submissions also suggested amendments were needed to modernise the PRRT regime.
For example, the development of large LNG projects in often remote locations can require significant expenditure on social infrastructure and public amenities such as roads, hospitals, water, electricity and sewerage. A project may be required to provide social infrastructure as one of the conditions of the government approval process for the project, or it may be provided as there is an expectation by government and the community as part of the projects social licence to operate (APPEA Submission, p. 78). The ATO is currently consulting with APPEA and other stakeholders to provide guidance on this issue.
FLNG is another example of the PRRT having to adapt to new technology used by the oil and gas industry. This new technology will place a greater emphasis on the apportionment principles in the PRRT as the entire upstream and downstream operations of the LNG project are essentially contained within a floating vessel. This will potentially cause a number of practical challenges for the ATO and PRRT taxpayers as they will need determine how to apportion these expenditures for PRRT purposes. Again the ATO is consulting with the industry on this issue with the aim of developing practical guidance to provide greater certainty in this area.
Page 110

Other parties consulted by the review observed that the PRRT design feature of linking a project to a production licence may not align with contemporary commercial practices in the oil and gas industry. For instance, a production licence may revert to a retention lease where there has been no recovery of petroleum from the licence area for a period of time. If further petroleum can be recovered in the future a new production licence can be granted. However, the PRRT regime does not contemplate that a production licence can revert back to a retention lease. It only contemplates the linear progression of an exploration permit to a retention lease to a production licence as this was the normal progression of an oil project in the 1980s when the PRRT was first introduced. Not recognising that a production licence may revert to a retention lease may result in a ‘black hole’ of any carried forward expenditure as the project for PRRT purposes ceases to exist when a production licence comes to an end. This means any future production licence that is granted will give rise to a new project for PRRT purposes that does not have access to the previous carried forward expenditure related to the earlier production licence even where the later project is a genuine continuation of the earlier project. This seems to be an unintended consequence where the PRRT legislation has not kept up with changes in the administration of petroleum tenements. Providing the Commissioner with the power to treat a project as a continuation of an earlier project, where it would be reasonable to conclude the later project is a genuine continuation of the earlier project could address this unintended consequence.
Similarly, the structure of ownership interests is also becoming more complex, diverse and fragmented and less likely to remain constant through the life of petroleum fields contained within a petroleum title. For instance, some companies are entering into transactions to effectively split petroleum rights into their constituent parts so parties only operate in smaller areas of the right or only recover a certain commodity (for example gas), while other companies recover other commodities (for example oil and condensate) from the licence area. There can also be exploration and recovery activities by separate independent parties at different stratigraphical levels within the area of a mining right such as the overlapping deep and shallow substrata of unconventional coal seams or tight gas reservoirs. The increasing complexity of ownership structures is placing pressure on the PRRT core concept of a project being linked to a production licence area and can lead to unintended outcomes. Providing the ATO with the discretion to treat genuinely separate and independent petroleum discoveries as distinct petroleum projects would provide the PRRT with the flexibility needed to cater for these increasingly complex structures that were not envisaged when the PRRT was introduced.
Entities within a wholly owned tax group have the option to have all the interests held by the group in an onshore project to be taken together and reported in a single PRRT return regardless of which entities in the group hold these interests. This compliance cost saving measure only applies to onshore projects and was introduced as part of the PRRT extension. It is designed to simplify compliance and administration without compromising the design of the PRRT as a project-based tax.
Historically participants in offshore projects have typically held their interest in the project in a single entity. However, as the offshore industry evolves through mergers and acquisitions there will increasingly be situations where the interests in offshore projects will be fragmented across an economic group, which is similar to the evolution of the onshore petroleum industry. Restricting this
Page 111

compliance saving measure to onshore projects potentially increases the compliance burden on offshore projects and adds complexity to the PRRT system and is out of step with the evolution of the oil and gas industry.
Currently all PRRT taxpayers must prepare their PRRT returns on a 30 June year end, which is out of step with income tax and accounting rules that allow entities to prepare their records using other year-end dates to reduce compliance costs. The PTG report recommended modernising the PRRT so taxpayers could choose to adopt a substituted accounting period, so it can align with their choice to use a substituted accounting period for income tax. Similarly, the PRRT ‘functional currency’ rules are out of step with the functional currency rules used for income tax as they do not cater for MEC groups. Broadly, a MEC group is a group of Australian entities that are wholly foreign-owned, which does not have a common Australian resident head company. To reduce compliance costs, the PRRT could be amended to allow PRRT taxpayers to choose a substituted accounting period and a functional currency that aligns with the choice they have made for income tax purposes.
One submission highlighted there are some onshore projects that are unlikely to ever pay PRRT as they are also subject to royalties which are deductible for PRRT purposes. For example, the Barrow Island onshore oil project is subject to the Resource Rent Royalty (section 2.2) and is calculated on a similar basis to the PRRT, which means it is unlikely to pay PRRT. To reduce compliance costs for taxpayers and the administrative burden on the ATO, the Commissioner of Taxation could be given the power to administratively exclude projects from filing PRRT returns where they are unlikely to pay PRRT in the foreseeable future. It would be appropriate for these projects that are administratively excluded to lose their PRRT attributes, including any carried forward expenditure, as they would not be required to lodge a PRRT return.
The PRRT integrity measures are out of step with recent developments to the income tax anti-avoidance provisions. For example, amendments were made to the income tax anti-avoidance rules after the ATO lost a number of Federal court cases as there was no ‘tax benefit’ because the taxpayer would not have done anything at all if they had not entered into the tax avoidance scheme. Amendments were consequently made to ensure the anti-avoidance rules operated as intended. However, similar amendments were not made to the PRRT legislation. To ensure the PRRT anti-avoidance rules operate as intended amendments could be made in line with the changes made to the income tax rules.
Page 112

5. CRUDE OIL EXCISE
5.1 OVERVIEW OF CRUDE OIL EXCISECrude oil excise is imposed by the Australian Government on eligible crude oil and condensate production from onshore areas (which includes coastal waters within three nautical miles of the Australian coastline) and the NWS project area. This is in addition to state royalties for onshore production and the Commonwealth royalty in the case of the NWS project. On Barrow Island, a Resource Rent Royalty (RRR) has replaced the excise and the ad valorem royalty arrangement (see section 6.2).
While no gas (including LNG) is subject to crude oil excise, the respective royalty regimes do collect from gas, as well as condensate and crude oil production.
The crude oil excise is an ad valorem tax. It is levied as a percentage of the market value of crude oil and condensate production from a producing area. Past crude oil excise collections are illustrated in Figure 2.1 (section 2.3). Overall, the main factors that impacted these collections were the level of production, crude oil prices and the exchange rate (as sales contracts are typically in US dollars).
5.2 OPERATION OF CRUDE OIL EXCISENo excise is payable on the first 4767.3 megalitres (30 million barrels) of stabilised crude oil or condensate (combined) from a particular production field.17 A production field can be made up of one or more production areas.
After the total field threshold is reached, each production area must also reach an annual production threshold before excise is payable. The rate of excise that applies varies as different levels (or tranches) of annual production are achieved — the higher the annual production, the higher the rate of excise. The annual thresholds apply separately in respect of the type of product (crude oil or condensate) coming from each production area.
The annual production thresholds are outlined in Table 5.1. The excise rates applicable across the different annual production tranches are outlined in Table 5.2.
For crude oil, the production thresholds and tranches also depend on when the field was discovered and developed. There are three categories:
• old oil is oil discovered and in production before 18 September 1975;
• intermediate oil is oil discovered before 18 September 1975, but not developed as of 23 October 1984; and
• new oil is oil produced from naturally occurring discrete accumulations discovered on or after 18 September 1975.
17 This exemption was introduced in 1987 with the objective of encouraging the exploration and development of petroleum following the reduction in crude oil prices at that time.
Page 113

Page 114
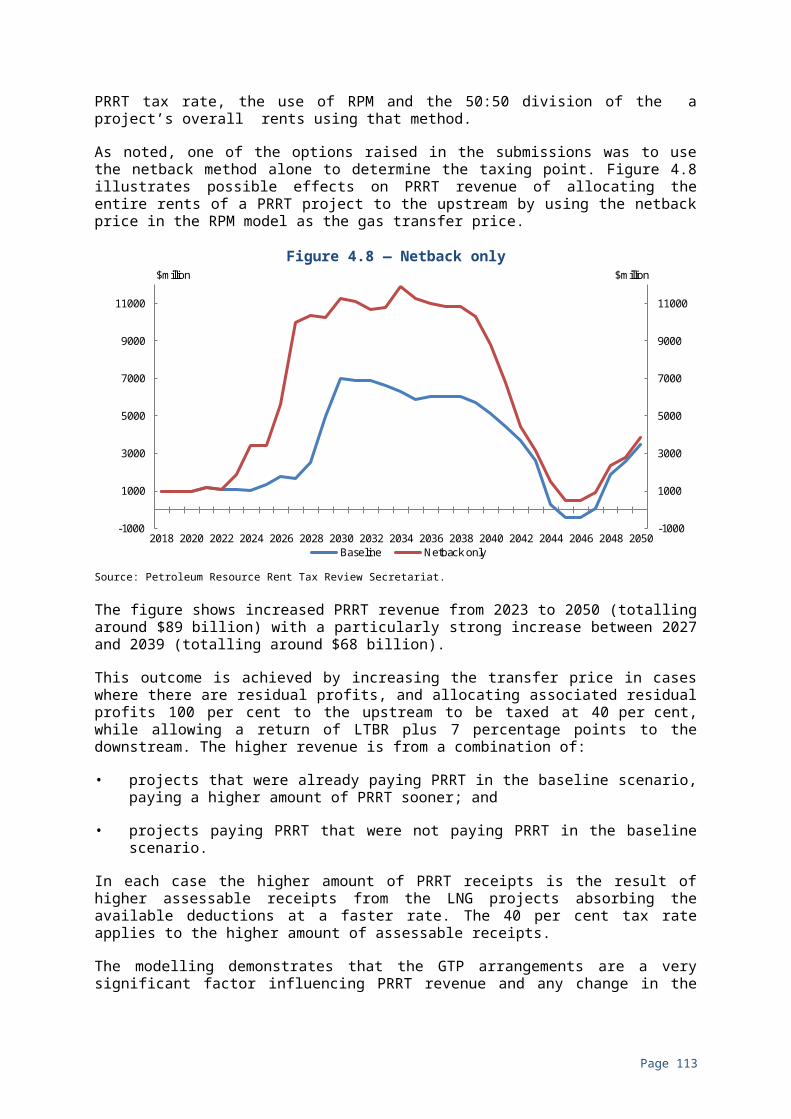
Table 5.1 — Annual production thresholds for Crude Oil ExciseOld Oil Intermediate Oil New Oil Condensate
Annual Production Threshold
(megalitres, approximate)200 300 500 500
Table 5.2 — Crude Oil Excise rates Annual Crude Oil Sales Old Oil Intermediate Oil New Oil Condensate
Annual Production Tranches*
(megalitres)
% of VOLWARE % of VOLWARE % of VOLWARE % of VOLWARE
0 to 50 0 0 0 0
Over 50 to 100 0 0 0 0
Over 100 to 200 0 0 0 0
Over 200 to 300 20 0 0 0
Over 300 to 400 30 15 0 0
Over 400 to 500 40 30 0 0
Over 500 to 600 50 50 10 10
Over 600 to 700 55 55 15 15
Over 700 to 800 55 55 20 20
Over 800 55 55 30 30*Exceeding the 4763.3 megalitres threshold.
Where excise is payable, the amount of excise liability is calculated by applying the relevant crude oil excise rate to the VOLWARE price (volume weighted average of realised selling price).
The ATO is responsible for determining the VOLWARE price, which is calculated on the basis of an oil producing region. Oil producing regions can consist of one or more prescribed production areas.
While the final excise liability is on the basis of a financial year, monthly liabilities are calculated and represent the weighted average proportional liability based on sales volumes and revenue receipts from the start of the financial year to the month calculated. These are calculated by the ATO on an interim and final basis and involve data inputs from producers, including sales volumes and average sale prices.18
18 Regulation 4 of the Petroleum Excise (Prices) Regulations 1988 outlines the information that producers must provide the Minister (or delegate).
Page 115
The calculation for the VOLWARE price for a month is outlined in the ATO’s submission:
VOLWARE price for amonth=∑ of transaction prices¿of crude oil∨condensate salesTotalquantity of crude oil∨condensate¿∗¿¿
*There are certain rules governing the calculation of the transaction price.
** A VOLWARE price is calculated separately for excisable crude oil and for excisable condensate produced from each producing region (ATO Submission p. 26).
5.3 HISTORICAL CHANGES TO CRUDE OIL EXCISECrude oil excise was introduced in 1975 to redistribute to the community some of the gains producers received from increased world oil prices. Initially, it was a production based levy at the rate of $2 a barrel. From the time of its introduction, the Government made frequent adjustments to the rate of the excise, as this was a time in which the Government controlled oil prices received by producers.19 Overall, the changes sought to balance the objectives of obtaining an appropriate return to the broader Australian community while providing the right incentives for exploration and production of oil.
In 1977, in the context of international oil prices exceeding domestic prices, together with a number of changes to the rate of the levy (and arrangements to transition to import parity pricing for all oil), condensate was exempted from the crude oil excise. The exemption for condensate was primarily aimed at encouraging development of the LNG industry in the NWS.
An ‘intermediate’ category of oil was added in 1984 and the rate of excise applicable became dependent on both the discovery and development date of producing fields. Oil discovered before 18 September 1975 was ‘old’, with ‘new’ oil categorised as oil produced from naturally occurring discrete accumulations discovered on or after 18 September 1975. The ‘intermediate’ category represented fields discovered before 18 September 1975, but not developed by 23 October 1984. This provided a concession on ‘old’ oil excise (but not as great as that applying to ‘new’ oil) to further encourage development of formally marginal ‘old’ oil fields in the Bass Strait.
In 1986 and 1987, in response to falling crude oil prices, changes were made to reduce excise rates. In 1987, again in response to low crude oil prices, the government introduced an exemption for the first 30 million barrels of crude oil produced from onshore fields and reaffirmed the exemption of condensate and offshore LPG production.
Crude oil price marketing was deregulated from 1 January 1988. Accompanying this change, the method for calculating crude oil excise changed from one based on import parity price (and production) to one based on the VOLWARE price.
The mid 1980s was also a time of increased discussion and debate about replacing the production based crude oil excise and royalty arrangements with a profit-based and more efficient resource rent tax. The PRRT was enacted in 1988 19 A useful summary of these early changes is contained in 1990 Background Report on Petroleum
Production Taxation, reproduced in part in the APPEA submission.
Page 116

for greenfield projects in offshore areas where the Commonwealth’s Petroleum (Submerged Lands) Act 1967 applied, replacing the crude oil excise and royalty systems. After introduction of the PRRT, crude oil excise applied to onshore production and the offshore areas of the Bass Strait and NWS project.20
Crude oil excise (and royalty) coverage of the Bass Strait was removed from 1 July 1990 when the application of the PRRT was extended to the Bass Strait. Treasurer Keating’s second reading speech outlined that the extension of PRRT to the Bass Strait was made in part to promote the optimal recovery of petroleum reserves and as some producers had made decisions to shut in oil production subject to the highest marginal rates.21
In 2001, crude oil excise rates for ‘old’ and ‘new’ oil were reduced, outlined in Table 5.3, with these rates applying to the current day. Increased energy self-sufficiency was a motivating factor behind the decision to lower excise to encourage production.22
Table 5.3 — 2001 changes to the excise rates of old oil and new oilProduction (Megalitres)
Old Oil(Current)
Old Oil(Before 2001 Changes)
New Oil(Current)
New Oil(Before 2001 Changes)
0 to 50 0 0 0 0
Over 50 to 100 0 5 0 0
Over 100 to 200 0 15 0 0
Over 200 to 300 20 20 0 0
Over 300 to 400 30 40 0 0
Over 400 to 500 40 70 0 0
Over 500 to 600 50 75 10 10
Over 600 to 700 55 75 15 20
Over 700 to 800 55 75 20 30
Over 800 55 75 30 35
20 Coverage of crude oil excise had already been removed from (onshore) Barrow Island from 1 July 1985. Further information on the regime applying on Barrow Island is in section 6.2.
21 ‘The Bill will extend, from 1 July 1990, the resource rent tax to the Bass Strait, replacing the complex and arbitrary excise and royalty regime. The measure will not only permit the generation of a fair return to the community from the production of hydrocarbons, but will do so in a manner which encourages the producers to efficiently drain the Bass Strait province in a manner which has greater regard to the producers’ capacity to pay … The extension of the resource rent tax to Bass Strait, will, as I indicated earlier, promote the optimal recovery of Bass Strait petroleum reserves. New fields will become viable and recovery from existing fields will be enhanced. This is expected to lead to the recovery of a further 200-300 million barrels of oil from Bass Strait and, over the longer term, it can be expected that gas production will also be enhanced.’ Treasurer Keating’s second reading speech Petroleum Resource Rent Legislation Amendment Bill 1991.
22 The then Minister for Industry, Science and Resources, the Senator Nick Minchin’s media release stated ‘Ultimately, the consumer and Australia will benefit from efforts to meet Australia’s future energy needs through enhancing Australia’s self-sufficiency in oil and gas.’ Media release 01/371, 15 August 2001 ‘Government encourages domestic oil exploration and production’.
Page 117

Source: Petroleum Resource Rent Tax Secretariat
In 2008, condensate production became subject to the crude oil excise regime at the same rates as ‘new oil’. This reversed the 1977 exemption and resulted in condensate production in the NWS project area and onshore being subject to excise.
On 2 July 2010, the then Government announced as part of its revised resource tax arrangements that the PRRT regime would be extended to all Australian onshore and offshore oil and gas projects. When the PRRT was extended from 1 July 2012, crude oil excise and royalty arrangements were maintained. The explanatory statement addresses this issue:
The existing crude oil excise arrangements are not intended to be disturbed by the extension of the PRRT to all Australian oil and gas projects from 1 July 2012. These arrangements will continue to apply once the projects become subject to the PRRT, with the excise paid being creditable against the PRRT (Explanatory Memorandum, Petroleum Resource Rent Tax Assessment Amendment Bill 2011 (Cth), p. 113).
As outlined in section 4.6 and Appendix B.1.4 the PRRT legislation provides a deduction category to accommodate Commonwealth and state resource tax expenditures, such as royalties and crude oil excise, to ensure petroleum projects are not subject to double taxation.
As a result of these changes, crude oil excise currently only applies to onshore production (except Barrow Island) and to the NWS project area. In practice, only the NWS project area pays crude oil excise. There is no onshore production that has, or is expected to, exceed the current field and annual thresholds.
In respect of the NWS project area, while gases are not levied under the current crude oil excise, they are covered under the Commonwealth royalties that apply to the NWS project, discussed in section 6.1.
5.4 ADMINISTRATION OF EXCISEA number of Commonwealth Acts interact to support the operation of the excise:
• Petroleum Excise (Prices) Act 1987 (Cth) and supporting regulations — which contain the legislative mechanism and supporting administrative functions for the determinations of the VOLWARE price.
• Petroleum Resource Rent Tax Assessment Act 1987 (Cth) — contains the definition of the Resources rent tax area exempt from excise duty.
• Excise Tariff Act 1921 (Cth) — contains definitions other than condensate, by-law requirements and method of calculating excise.
• Excise Act 1901 (Cth) — includes condensate definition, by-law authority, associated registration and reporting requirements and other administrative matters.
• Seas and submerged Lands Act 1973 (Cth) — contains the definition of ‘territorial sea’ for the purposes of exempt offshore field.
Page 118
The excise regime is administered by the ATO.
The Excise Act 1901 (Cth) provides the Commissioner of Taxation with authority to make by-laws where an item of the Schedule in the Excise Tariff Act or a section of the Excise Tariff Act is expressed to apply to things as prescribed by by-law. In the context of crude oil and condensate, by-laws are made by the Commissioner in order to prescribe fields;23 old production areas (old oil); new production areas (new oil); condensate production areas (condensate); and intermediate production areas (intermediate oil).
The Petroleum Excise (Prices) Act 1987 (Cth) gives the Minister or person authorised by the Minister the power to determine VOLWARE prices. The Minister (Treasurer) has delegated this power to specific ATO personnel while retaining responsibility over the remaining provisions.
The ATO makes interim VOLWARE determinations for each production region monthly, and has up to six months following the end of a month to issue the final VOLWARE determination for that month. The review understands that the ATO has a staged quality assurance process to ensure that the interim and final VOLWARE price determinations are accurate.
In practice, the requirement to make VOLWARE determinations is relatively small as there are only a few taxpayers from which crude oil excise is collected and the ATO need not make interim or final VOLWARE determinations where there is no excise liability. The ATO submission indicated that:
Only offshore producers currently pay Crude Oil Excise. There are no onshore producers paying, as the initial 4767.3 ML threshold and annual thresholds have not been exceeded for any prescribed production areas (ATO Submission, p. 26).
Further, the calculations to determine crude oil excise liabilities are relatively straightforward and outlined in regulations.
Overall, the ATO’s view is:
The excise regime for crude oil and condensate is operating in accordance with its legislative intent (ATO Submission, p. 28).
5.4.1 Administration differences between onshore and offshore There are different licencing requirements between onshore and offshore producers. For offshore fields, the first 4767.3 megalitres of stabilised crude oil and condensate produced from offshore fields are exempt from excise duty. In contrast, the same quantity from onshore fields receives a ‘free rate’ of excise duty. As a result, all onshore production is subject to the licencing requirements of the Excise Act 1901 (Cth). This impacts 25 producers who hold 120 separate licences24 and requires them to provide annual reports to the ATO as part of their record keeping requirements, including:
23 For example, Excise By-law 127 prescribes those fields which are ‘onshore fields’. Excise By-law No. 114 prescribes those fields which are ‘exempt offshore fields’.
24 Sourced from the ATO.
Page 119
• type and quantity of each product (that is, stabilised crude petroleum oil and/or condensate) recorded separately for each production area;
• where a production area has ceased production, the date of cessation and the quantities of product manufactured prior to that date; and
• where there has been a change in ownership of a production area, the date of transfer and name of the new producer.
5.5 COMMENTARY ON CRUDE OIL EXCISEThe APPEA submission argued that the continued application of production excise should be revisited for onshore producers and noted the compliance costs on onshore producers that result from the licencing differences from onshore and offshore production:
All producers of crude oil excise and condensate covered by the regime are required to comply with the provisions of the legislation and any compliance/reporting obligations that may be imposed by the Australian Taxation Office …
… Overall, there is not expected to be any duty incurred for onshore crude oil and/or condensate production in Australia. Despite this, producers are required to meet the verification, administrative and compliance obligations imposed by the regime.
In addition to the compliance costs imposed on companies, the imposition of a potential excise liability on onshore crude oil and condensate production (in the event of a future discovery) has the potential to be factored into the exploration decisions of investors. In particular, this may impact on exploration in frontier onshore areas where the risk/reward balance can be different to more traditionally explored regions. High risk frontier exploration requires a fiscal framework that provides an incentive for risk capital to be directed towards these areas — the imposition of a potential excise liability on future discoveries clearly sends a negative fiscal signal.
In summary, as the Government has effectively accepted that PRRT is now its primary mechanism for the taxation of crude oil and condensate production, the continued application of production excise for areas that are unlikely to incur a liability should be revisited (APPEA Submission, p. 32).
In contrast, Prosper Australia noted the reduction in the rates of excise over time and questioned the logic for such high exemptions on crude oil and condensate. They recommended to ‘remove exemptions so that all production incurs some crude excise’ (Prosper Australia Submission, p. 13).
The removal of the current 30 million barrel threshold was modelled on a project basis rather than a field basis and resulted in a $2 billion increase in revenue compared with the baseline over the period to 2050, predominantly from production in the NWS project, see Figure 5.1. 25 Extending the crude oil excise to
25 Modelling was conducted on a project basis as data about individual onshore fields and their production levels are not available.
Page 120

all offshore projects and removing the 30 million barrel threshold was also modelled. These results are also in Figure 5.1.
Page 121

Figure 5.1 — Excise threshold removed and applied onshore and offshore
2018
2020
2022
2024
2026
2028
2030
2032
2034
2036
2038
2040
2042
2044
2046
2048
2050
-1000
0
1000
2000
3000
4000
5000
6000
7000
8000
-1000
0
1000
2000
3000
4000
5000
6000
7000
8000
BaselineExcise (remove 30 million barrel threshold; apply offshore)Excise (remove 30 million barrel threshold)
$million $million
Source: Petroleum Resource Rent Tax Review Secretariat.
Under this option, compared with the review’s baseline scenario, revenue collections (including crude oil excise and PRRT) would be around $12 billion higher over the ten years to 2027. However, over the whole period to 2050, this option results in total revenue being around $14 billion lower than in the baseline scenario. While the removal of excise thresholds results in increased revenue from excise collections initially, over the longer term there is significantly lower revenue. This is because excises paid would be resource tax expenditures and would be uplifted at LTBR plus 5 percentage points and carried forward against assessable PRRT receipts in the future. There are similarities in the results from this option and that of introducing a new royalty (outlined in section 6.5).
Further, Prosper Australia recommended considering merging the crude oil excise and Barrow Island RRR and increasing the rate as a simplification measure (Prosper Australia Submission, p. 13). The Barrow Island RRR, described in further detail in section 6.2, is essentially a profit-based tax very similar in design to the PRRT and may not be a good candidate for a simplification merger.
As outlined in section 5.3, the changes in the rate of excise over time have primarily sought to encourage further development of marginal fields. This was one of the reasons for the introduction of a total field threshold in 1987 and it was one of the factors that led to the introduction of the PRRT around the same time. The smaller onshore fields typically have higher marginal costs to operate and were disproportionately impacted.
State royalties are the primary method by which the Australian community receives a return for its onshore resources. No onshore producers currently pay crude oil excise because production has not exceeded the annual and field production thresholds. Further, at current rates of production, it is unlikely that any existing onshore fields will pay any excise.
As noted in section 5.4, crude oil excise is only collected from the NWS project area and together with the Commonwealth royalty, makes up the long standing
Page 122

tax arrangements applying to this project. While gases are not levied under the crude oil excise, they are covered by royalty arrangements along with oil and condensate production.
Page 123
6. OTHER REVENUE INCLUDING ROYALTIES
In addition to the PRRT and excise, the Australian Government receives other revenue from petroleum projects, mostly in the form of royalties.
6.1 COMMONWEALTH ROYALTIES — NORTH WEST SHELF PROJECTCommonwealth offshore petroleum royalty only applies to the NWS project. The NWS project is also subject to PRRT (from 2012) and excise, making it Australia’s only offshore petroleum project subject to all three taxation regimes. Royalty is payable to the Australian Government on the value of all petroleum (including gas) production from the NWS project area and is shared with the WA Government as prescribed by section 75 of the Offshore Petroleum and Greenhouse Gas Storage Act 2006. The legislative basis for the collection of Commonwealth royalty is the Offshore Petroleum and Greenhouse Gas Storage Act 2006 and the Offshore Petroleum (Royalty) Act 2006.
The NWS royalty is an ad valorem royalty levied as a percentage of the wellhead value. Wellhead value is calculated by taking sales receipts and subtracting excise, allowances for post-wellhead capital assets and depreciation, and operating costs such as processing and transportation. Conceptually, the wellhead is the point of valuation closest to the petroleum extraction point.
The NWS royalty rate is set at between 10 and 12.5 per cent of the wellhead value, depending on the production licence. Petroleum recovered under a primary production licence attracts a royalty rate of 10 per cent. If there is an area remaining within the permit or lease after the primary licence is granted, a secondary production licence may be granted over that area. Royalty rates on secondary production licences are limited to between 11 and 12.5 per cent. All fields that are currently producing under a secondary licence pay royalties at 12.5 per cent.
The NWS royalties are shared with WA, with approximately two thirds of collections paid to the WA Government and one third to the Commonwealth Government. As the royalty rate increases from 10 to 12.5 per cent, WA’s share of the royalty increases incrementally.
Royalties received from the NWS project represent a significant and constant source of revenue for the Commonwealth and WA Governments. The NWS project’s submission to the review stated:
… the royalties paid by the NWS Project participants over the life of the project are significant, recently averaging over $1 billion annually (NWS Project Submission, p. 8).
6.1.1 North West Shelf royalty administrationUnder the Offshore Petroleum (Royalty) Act 2006, functions relating to the operation and administration of the NWS project, including royalties, are undertaken through a Joint Authority arrangement between WA and the
Page 124
Commonwealth. The current WA member of the Joint Authority is the WA Minister for Mines and Petroleum, with the responsible Commonwealth Minister currently the Minister for Resources and Northern Australia.
Functions relating to the day to day administration of the NWS royalty are the responsibility of the WA delegate of the JA, the WA Department of Mines and Petroleum (DMP). The DIIS acts on behalf of the Commonwealth delegate to ensure the accuracy and completeness of NWS royalty revenue received and paid to WA. These arrangements have been in place since the Offshore Constitutional Settlement 1979 and are enshrined in the Offshore Petroleum (Royalty) Act 2006.
During 2016, the ANAO conducted a performance audit of the NWS royalty administration arrangements.
The ANAO identified four key areas for review: general administration; compliance; promoting certainty in administering the royalties; and governance arrangements. The ANAO made four recommendations which broadly included:
1) Improve governance over the administration of the royalty calculation and collection function.
2) Set a timeline and regularly review progress against this timeline so as to expedite changes to the Royalty Schedule aimed at updating and improving the clarity of descriptions relating to deductible expenditure, and incorporating expenditure relating to new fields.
3) Implement improved controls for the verification of NWS petroleum production and sales to provide increased assurance that the approach taken when allocating production to fields is complete and accurate.
4) Verify the validity of deductions claimed prior to 2014; and develop and implement a comprehensive strategy for gaining a reasonable level of assurance that deductions claimed by the NWS producers in 2015 and later years are valid and calculated in accordance with the Royalty Schedule.
In its response to the ANAO audit report findings, DIIS agreed with all four recommendations. DIIS stated:
… accountability and assurance frameworks over the administration of collection of NWS petroleum royalties could be improved, in particular to ensure they are appropriately documented and that the operational responsibilities of the Australian and Western Australian Governments are clearly articulated’ and that ‘the current processes over royalty collection are robust and provide for the accurate, efficient and comprehensive collection of NWS royalty payments. The Department will confirm their reliability in partnership with the Western Australia Government and the NWS joint venture participants in actioning the report’s recommendations (ANAO, 2016, p. 10).
The WA Government stated:
The North West Shelf project royalty revenue verification processes used by the Western Australian Department of Mines and Petroleum are robust and adequate.
Page 125

The Australian people can be confident that North West Shelf project royalties are being accurately assessed and collected (ANAO, 2016, p. 11).
In its submission, the NWS project stated:
Woodside, as operator of the NWS Project, has robust compliance processes with regard to royalty obligations and has supported DIIS in the assurance review carried out by the ANAO and the 2014 NWS Project royalty audit by the Western Australian Department of Mines and Petroleum (DMP). Woodside as operator in carrying out its regular royalty compliance activities and audits with the DMP, and in supporting DIIS in relation to its review, has and will continue to conduct itself in an open, transparent and cooperative manner (NWS Submission, p. 10).
While the ANAO’s findings of the administration of the NWS royalty regime point to areas requiring improvement, the findings do not suggest any administration concerns that are not being resolved through DIIS’ implementation of the recommendations. There is no evidence to suggest the issues identified in the audit extend beyond the NWS project or are systemic across the broader industry.
6.1.2 Commentary on North West Shelf royaltiesAs discussed throughout this report, there are arguments for and against the imposition of royalties. Output-based royalties discourage investment and production because they are levied irrespective of the costs of production. Consequently, investors receive a lower post-tax return from a more expensive operation because costs are not recognised for tax purposes (Australia’s Future Tax Review 2009, p. 222).
Despite these shortcomings there are benefits from an ad valorem royalty regime that are attractive to governments. Royalty regimes generally provide a relatively stable and predictable revenue flow to the government, offer administrative efficiency, and are a transparent way of demonstrating to the general community that they are getting a return for the use of their resources. The WA Government submission noted that ad valorem royalties provide revenue stability which is particularly important to state governments with limited means of raising revenue (Western Australian Government Submission, p. 10). To minimise the impact on marginal projects, the WA Government states:
NWS ad valorem royalty regime it applies is more efficient because it deducts certain operating and capital costs than a specific royalty that charges per physical unit of production (Western Australian Government Submission, p. 9).
The WA Government also made the point that it uses the revenue it receives from royalties to invest in infrastructure required to support the growth of petroleum projects in WA, noting that:
the royalty revenue sharing arrangements between the state and the Commonwealth reflect both the state’s significant investment in support of these projects and historic royalty arrangements (Western Australian Government Submission, p. 1).
The royalty arrangements applying to the NWS project are long standing and there does not appear to be a case for introducing any changes.
Page 126

6.2 RESOURCE RENT ROYALTYCommonwealth excise can be waived on particular onshore projects where a state or territory introduces a resource rent royalty (RRR) in accordance with the Petroleum Revenue Act 1985 and negotiates a revenue sharing agreement with the Commonwealth Government. The RRR currently only applies to the Barrow Island project off WA. It is profit-based, similar in principle to PRRT, except that:
• exploration deductions are limited to the year preceding the introduction of RRR;
• revenue is shared according to a formula in the Act, whereas PRRT revenue is not shared with the states; and
• for Barrow Island, RRR is shared between the Commonwealth and WA Governments in the ratio 75:25 respectively.
The RRR was introduced for the Barrow Island project in 1985. The RRR was an initiative by the WA Government in consultation with the Commonwealth Government to replace the existing ad valorem royalty and crude oil excise that applied to the Barrow Island project. It was as an incentive for continued production and optimal recovery from the project following concerns that future investment could be impeded by the prevailing royalty arrangements.
6.3 STATE ROYALTIESThe states have responsibility for onshore petroleum resources and within nearby coastal waters (less than three nautical miles from shore), including for resource charging arrangements.
State royalties are the primary means by which the community receives a return for its onshore petroleum resources. An examination of whether state royalties are achieving a fair return for the community is outside the review’s terms of reference.
State royalties are typically calculated on an ad valorem basis or percentage of the value of the petroleum, applying a fixed percentage of between 10 and 12.5 per cent of the wellhead value. The state royalty regimes are broadly similar in structure to Commonwealth royalties with a few minor differences relating to deductions and the royalty rates. State royalty collections are set out in Figure 2.4.
6.4 OTHER REVENUES — JOINT PETROLEUM DEVELOPMENT AREAPetroleum produced within the JPDA in the Timor Sea is subject to fiscal terms outlined in a Production Sharing Contract (PSC). PSCs are agreements between the parties to a petroleum extraction facility and the Australian and Timor-Leste Governments regarding the percentage of production each party will receive after the participating parties have recovered a specified amount of costs and expenses.
Page 127
Day-to-day regulation of the JPDA is managed by the Designated Authority, which is the Timor-Leste offshore regulator the Autoridade Nacional do Petróleo E Minerais (ANPM). The ANPM regulates operations in the JPDA and administers and collects revenue on behalf of both countries. The Timor Sea Treaty provides that revenue from petroleum production in the JPDA, which is currently only from the Bayu-Undan field, is split between Timor-Leste and Australia on a 90:10 basis. These arrangements represent a bilateral agreement between Australia and Timor-Leste and are covered for completeness in this review with no contemplation of recommending any change.
The Australian Government also collects a small amount of revenue from petroleum projects in coastal waters. While state royalties from projects in coastal waters are usually retained by the relevant state, royalty revenue from projects derived from Commonwealth permits that existed prior to 1979 is shared with the Australian Government.
6.5 APPLYING A ROYALTY TO OFFSHORE PETROLEUMA number of submissions (including Dr Diane Kraal and of Australia, supported by Publish What You Pay, Community and Public Sector Union, Australian Council of Social Service, and Australian Council of Trade Unions) advocated that a new royalty be applied to offshore petroleum projects, in addition to the PRRT:
Royalties should be re-introduced for integrated natural projects in Commonwealth waters. This change would result in earlier and assured revenue from resources. Royalties are credited against later PRRT collection. The fiscal system would then be equal to onshore coal seam gas projects and the North West Shelf project (Dr Diane Kraal Submission, p. 2).
The Tax Justice Network Australia proposes that a royalty based on the existing state and Commonwealth royalties, and ‘deductible from PRRT’, would ensure a reasonable return to the community and equalise the tax arrangements for oil and gas projects:
This royalty regime would support the important but basic principle that the Australian people should be paid a floor or minimum price for extracting and selling the nation’s finite natural resources. No other industries, including other oil and gas projects, are able to obtain their inputs for free. Introducing this royalty would level the playing field for all oil and gas projects and industry players in Australia (Tax Justice Network Australia, p. 6).
The Tax Justice Network Australia estimated a new 10 per cent royalty on existing and new offshore gas projects could return $4 to $6 billion over the forward estimate period. The McKell Institute26 undertook further work and analysis on this proposal. It produced projections under low and high case scenarios over 4 years (the forward estimate period) as well as 10 years, that results in royalty revenue collections up to $11.3 billion in the forward estimate period and $28.4 billion over 10 years in a high case scenario — see Figure 6.1.
A royalty was also considered advantageous by the WA Government as it provides an assured revenue flow to the government. It noted:26 The McKell Institute is an independent, not for profit Australian research institute that engages
across of a range of public policy issues.
Page 128
Wellhead ad valorem systems as used in Western Australia, with their limits on deductibility, will always provide a return to the community whenever production occurs. Hence they can be argued to be fairer than rent based systems, such as the PRRT, where a considerable number of marginal projects will not make any return to the community (Western Australian Government Submission p. 10).
The Australia Institute considered the PRRT and royalty taxes were levied for different reasons. They supported ‘imposing a new royalty on all oil and gas extraction and increasing the rate of the PRRT’ (The Australia Institute Submission, p. 7):
Royalties are akin to a sale of the commodity in question and may well be tailored to recover government costs…the PRRT by contrast is designed to capture for the community the super profits attributable (The Australia Institute Submission, p. 5).
In other submissions, Greenpeace Australia Pacific, Uniting Church in Australia, Prosper Australia supported reforms that resulted in a more equitable return for the Australian community, delivered either through PRRT reforms or a new royalty scheme. Professionals Australia recommended where possible, Commonwealth and state governments should utilise royalties levied on volumes as the preferred taxation method for resources, as these best recognise the depletion of finite assets.
Figure 6.1 — 4 and 10 year revenue projections under low, base and high case scenarios
Source: McKell Institute 2017, p 44.
6.5.1 Impact of a new offshore royaltyIndustry submissions were largely silent on the proposal for a royalty. Those advocating for a new royalty did not articulate how the scheme would be designed.
Page 129
The review modelled extending a royalty arrangement similar to that applying to the NWS project to all offshore projects.27 This involved applying a 10 per cent royalty as a percentage of wellhead value to the projects Gorgon, Wheatstone, Ichthys, Pluto and Prelude. The current uplift rate on resource tax expenditures of LTBR plus 5 percentage points was maintained. Figure 6.2 illustrates the impact of the introduction of such a royalty.
Figure 6.2 — 10 per cent royalty applied to offshore projects
Source: Petroleum Resource Rent Tax Review Secretariat.
Compared to the baseline scenario, introducing a royalty would result in an increase in revenue collections by $23 billion over the ten years to 2027. The new royalty essentially acts as a bring-forward of PRRT payable and would have a major impact on the cash flow position of projects. However, over the longer period to 2050, the combined royalty and PRRT collections would be around $19 billion lower than the PRRT revenue in the baseline scenario. This occurs because royalty payments are creditable for PRRT purposes, uplifted at LTBR plus 5 percentage points. PRRT revenue is reduced due to the uplifted royalty credits, which outweigh royalty collections.
The modelling by the Tax Justice Network Australia and the McKell Institute (section 6.5), while conducted on a different basis, covers the shorter term impacts when PRRT collections are not expected from these offshore projects. The long-term impacts on PRRT collections or interactions with the uplift factor were not taken into account. Nor were the implications of a royalty on the cash flow position of existing projects.
The impact of a royalty will differ for each project (together with changes in oil price). For more marginal investments, a royalty would provide a minimum return to the Australian community for the use of its petroleum resources. However, the imposition of the royalty would also likely discourage future investment, and potentially impact the extent to which petroleum resources are extracted as
27 Onshore projects are subject to state royalties in addition to excise and the PRRT. In the NWS project, a shared Commonwealth/state royalty applies as well as excise and the PRRT. On Barrow Island, a shared Commonwealth/state Resource Rent Royalty and PRRT applies.
Page 130
-1000
0
1000
2000
3000
4000
5000
6000
7000
8000
-1000
0
1000
2000
3000
4000
5000
6000
7000
8000
2018 2020 2022 2024 2026 2028 2030 2032 2034 2036 2038 2040 2042 2044 2046 2048 2050
$million$million
Baseline 10% Offshore Royalty uplifted at LBTR + 5

producers may decide to shut production (similar to the concerns over Bass Strait in the 1990s).
For more profitable investments, (those with a higher internal rate of return that are more likely to return PRRT revenues), it is likely that over the life of the project, a royalty would provide a lower amount of revenue than the current PRRT. The new royalty would result in cash payments from the time of production, before the venture is profitable. As a result, credits for royalties paid under this option would all be converted to a deduction equivalent and uplifted at the rate LTBR plus 5 percentage points and carried forward for deduction against assessable PRRT receipts in the future. While the Government receives some revenue early on, the undeducted expenditure associated with that royalty payment grows at a greater rate than the Government’s long term cost of borrowing for that payment. This reduces the overall tax revenue received by the government and extends the lead time before PRRT revenue is collected. These outcomes highlight issues around the appropriateness of the uplift for royalty taxation which is discussed in Section 4.6.
6.5.2 Capping yearly deductionsOne option raised in consultations was capping the amount of deductions that can be used in any one year, in order that all projects with positive receipts pay some amount of PRRT in each year, including before projects become cash flow positive. For example, the use of deductions could be limited to 80 or 90 per cent of assessable PRRT receipts, with PRRT paid on the remaining amount. This is a type of royalty under a different guise — the ‘royalty’ rate is the percentage of assessable PRRT receipts retained, multiplied by the tax rate.
There are a number of variations on this proposal. For example, this arrangement could apply for the life of a project, or for a finite amount of time, say, for the first ten years of production with full deductions possible after this.
The treatment of resource tax expenditure (for example excise and state royalties) would be a key consideration. In order to minimise the potential for double taxation, the cap could not apply to deductions for resource tax expenditure. This would mean that projects paying royalty or excise could in theory pay no PRRT, with the return to the community generated through other resource charging arrangements.
This option would move away from the original design of the PRRT as a cash flow tax towards a hybrid system comprising elements of both royalty and profit-based systems. For projects ultimately profitable enough to pay PRRT under the current regime, this is effectively a pre-payment of PRRT, at a discount rate equal to the uplift rate. For projects that would never be profitable enough to pay PRRT, this model would operate similar to a royalty and impose a minimum tax. In both cases, projects would pay during times when their projects are cash flow negative. For future projects, this would contribute to the downside risk of projects, as outlined in section 1.5.2.
The review has modelled a specific option raised with the review which was to cap the deductions that could be claimed in any one year to 80 per cent of assessable PRRT receipts. This would provide an immediate increase in revenue to the government. But in order not to adversely impact on overall profitability of existing projects, it was proposed that the uplift for general project expenditure
Page 131
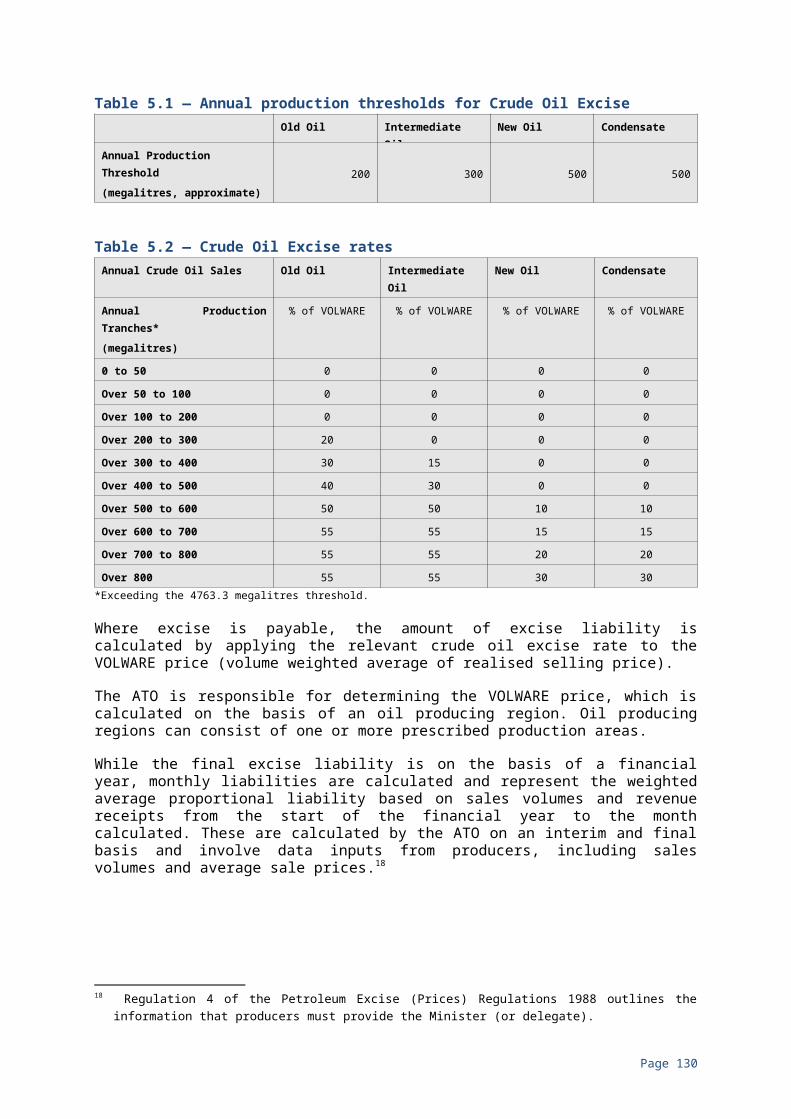
be increased to LTBR plus 7 percentage points. The results are outlined in Figure 6.3.
Figure 6.3 — Capping PRRT deductions at 80 per cent with an uplift on general expenditure of LTBR + 7 percentage points
Source: Petroleum Resource Rent Tax Review Secretariat.
Under this approach, compared with the review’s baseline, PRRT revenue would be around $31 billion higher over the ten years to 2027. However, over the whole period to 2050, this option results in total PRRT revenue being around $21 billion lower than that in the baseline scenario. While there is a bring-forward in PRRT revenue, this is at the expense of significantly lower revenue in the later period because deductions for general expenditure are being uplifted at a higher rate than in the baseline.
6.5.3 Impact of a delayed offshore royalty Another option proposed to the review was to provide a ‘grace period’ for the introduction of any new royalty, in recognition of the impact on the cash flow position of investments already committed and to minimise distortions. One option was to subject all offshore projects to a royalty 5 to 10 years from when they first commence production. Alternately, the new royalty could start 5 to 10 years after commencement of any new legislation. The grossed-up royalty would continue to be deducted from assessable PRRT receipts.
The review modelled a royalty of 10 per cent on wellhead value, commencing 10 years after production (with the uplift factor remaining LTBR plus 5 percentage points). The results are illustrated in Figure 6.4.
Page 132
-2000
-1000
0
1000
2000
3000
4000
5000
6000
7000
8000
-2000
-1000
0
1000
2000
3000
4000
5000
6000
7000
8000
2018 2020 2022 2024 2026 2028 2030 2032 2034 2036 2038 2040 2042 2044 2046 2048 2050
$million$million
Baseline Capped deductions
Figure 6.4 — 10 Per cent royalty commencing ten years after production begins
Source: Petroleum Resource Rent Tax Review Secretariat.
Under this approach, when compared with the review’s baseline, the PRRT revenue would increase by around $7 billion over the ten years to 2027. Over the whole period to 2050, the combined royalty and PRRT revenues would be around $6 billion higher than in the baseline scenario. This result is more positive than the immediate introduction of the royalty or capping the total deductions predominantly because delaying royalty payments means they become more aligned to when projects become profitable. As a result, royalty payments are not uplifted and offset against future PRRT revenue as much as in these alternate options (in 6.5.1. and 6.5.2).
The modelling does not capture the distortive effect of the royalty which is likely to affect projects towards the end their lives or the lives of particular fields. As noted in section 3, the PRRT was introduced in part because of concerns that the existing royalty arrangements were leading to the premature closing of fields leaving resources in the ground.
6.5.4 Overlapping coverage of PRRT, royalties and exciseSome submissions (Tax Justice Network Australia, Dr Diane Kraal) drew attention to the inconsistencies in the coverage of tax instruments between onshore and offshore projects.
The 10 per cent royalty should be designed based on review of the existing State and Commonwealth royalties that already apply to all other oil and gas projects in Australia. As with these existing royalty systems the new royalty system would be deductible from PRRT, but the PRRT remains as a backstop that would collect additional revenue if and when prices increase substantially and when existing PRRT credits are exhausted (Tax Justice Network Australia, p. 6).
The coverage of respective tax instruments is largely a historical and legacy feature. The successive changes to the various regimes have been iterative and
Page 133
-1000
0
1000
2000
3000
4000
5000
6000
7000
8000
-1000
0
1000
2000
3000
4000
5000
6000
7000
8000
2018 2020 2022 2024 2026 2028 2030 2032 2034 2036 2038 2040 2042 2044 2046 2048 2050
$million$million
Baseline Royalty commencing after 10 years
have taken into account past policy settings, for example, when the PRRT was extended in 2012 to production onshore and in the NWS project area and starting base arrangements were made to assist the transition. Details are outlined in section 3.1. The overall impact of the starting base arrangements is such that onshore projects and the NWS project (subject to both royalties and the PRRT) are unlikely to pay PRRT. As the NWS project submission noted:
Since the inception of the NWS Project, the primary resource taxes paid have been royalties and excise. The existing royalty and excise regimes continue to operate alongside the PRRT regime and the royalties and excise paid by the NWS Project participants are effectively creditable against any PRRT liability that may be payable. Consequently, it is expected that royalties and excise will continue to be the primary resource taxes paid in relation to the NWS project (NWS Project submission, p. 8).
Further, in respect of the special onshore Barrow Island arrangements (see section 6.2), ExxonMobil Australia submission stated:
the EMA Group is a participant in a project subject to the Barrow Island royalty, a scheme that is largely the same as PRRT, including being applied at a rate of 40 per cent. Because this project is already paying an equivalent royalty, the project is not expected to pay PRRT, but is required to complete annual PRRT returns. This regulatory cost is borne by the EMA Group and the ATO, without any apparent benefit to the community (ExxonMobil Australia Submission, p. 6).
New onshore projects will be subject to a state royalty and PRRT but would not have access to the starting base arrangements. Whether or not these projects will pay both the royalty and PRRT will depend on their individual circumstances. The fact that projects have proceeded onshore under a state royalty regime does not help with questions regarding which projects might have been discouraged by the regime.
The application of a state royalty, together with current uplift factor for resource tax expenditures, could result in a significant reduction in PRRT revenue over the life of those projects and a similar total revenue collection profile to that in Figure 6.2 (see section 6.5.1).
Overall, returning to a royalty arrangement for offshore projects similar in design to that applying onshore or to the NWS project would initially provide a more stable revenue flow and, potentially, a more transparent way of demonstrating to the community that Australians are getting a return for the development of their oil and gas resources. However, after the first 10 years of production, revenues would likely become less than what it would have been under the current arrangements. The interaction with the uplift for resource tax expenditures is an additional factor that needs to be considered (see section 6.5.1). With royalty payments credited against PRRT and uplifted at LTBR plus 5 percentage points, over the longer term (and in line with the review’s baseline scenario of oil prices around $65 a barrel indexed), the steady returns initially provided are offset. Over the life of the project, the community receives a lower overall return as total revenue (PRRT and royalties) collected is significantly reduced compared to the scenario had the royalty not applied. The imposition of royalties also results in a different distribution of who is paying revenue in addition to differences in the total revenue collected.
Page 134
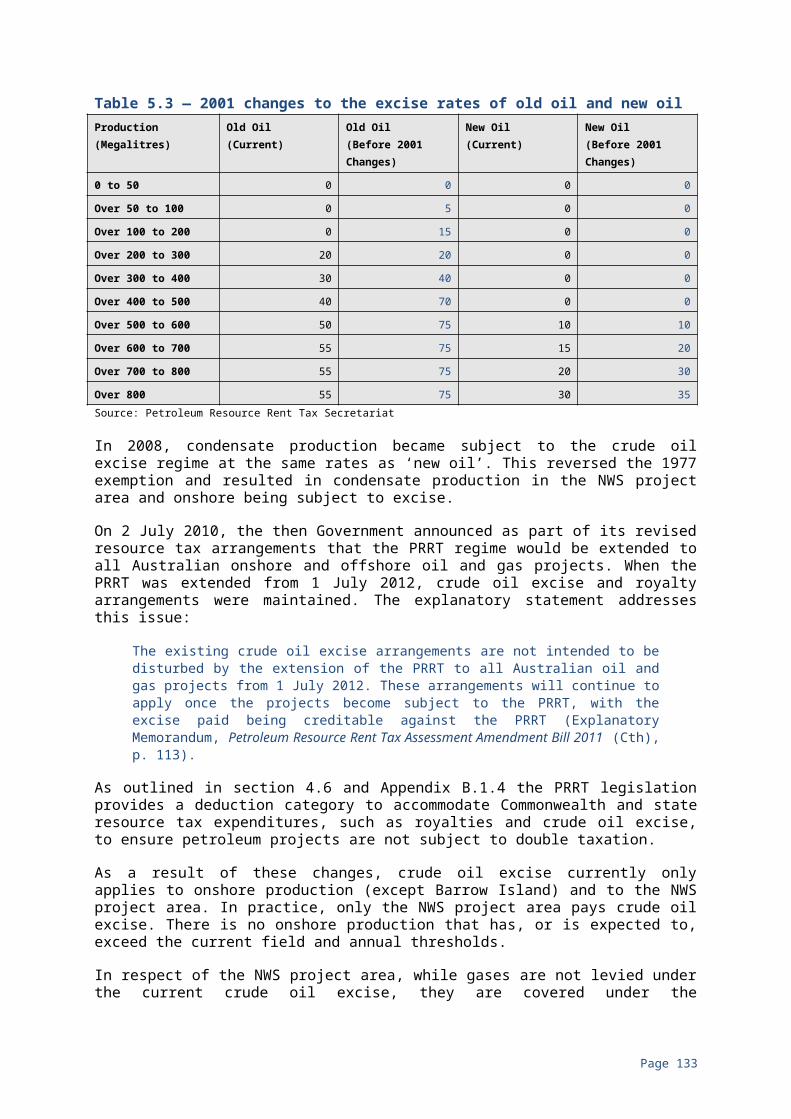
The introduction of the PRRT to greenfield offshore projects in 1988 was designed to overcome deficiencies in excise and royalty regimes, including that investment and development of more marginal projects was being discouraged (see section 3.1). A return to the royalty regime would likely encounter similar arguments as to its deficiencies at a future point in time.
6.5.5 Royalties for regionsA large number (27) of submissions supported introduction of a new ‘Royalty for Regions’ scheme to better support the rural and remote areas from which the majority of resources are derived. The review acknowledges these submissions and notes that recommendations related to how Commonwealth revenue should be distributed following its collection are outside its terms of reference.
Issues relating to the distribution of onshore royalties are a matter for the states.
Page 135
7. OTHER ISSUES
A number of issues canvassed in submissions were considered to be outside the scope of this review. These are canvassed in this section.
7.1 GOVERNMENT INVOLVEMENTSome submissions considered direct government involvement in the development of oil and gas projects was important and should be increased in a range of different areas. Prosper Australia suggested increased government ownership of projects would help ensure adequate returns:
International comparisons suggest that any effective method of capturing resource rents for the public will require heavy-handed government involvement in the sector. If this Review is unable to consider much greater involvement in the sector by government, such as taking ownership stakes in current oil and gas operations, or by investing in government–owned operations in new resources, than [stet] little genuine progress will be made (Prosper Australia Submission, p. 7-8).
The focus of Professionals Australia was for governments to have an increased role in ensuring that the skills from local engineering firms were developed and utilised in delivering oil and gas projects. They made a number of recommendations along these lines, including:
That all future projects and major service contracts must contain a requirement for a workforce skills development plan, which incorporates local actions that will be applicable to all subcontracting companies. These should have a focus on the development of high-wage, high-skills jobs for the State (Professionals Australia Submission, p. 2).
Another perspective was offered in the submission by Professor John Chandler. He focused on the efficient use of infrastructure and the potential role governments could have in incentivising developers to engage in more collaborative behaviour that took national or regional requirements into account. Professor Chandler believes because licensees are focused on making the maximum profit from their licence area, without obligations to take national or regional interests into account, projects may be developed in a way that use infrastructure inefficiently or are unduly expensive, resulting in a loss of PRRT revenue.
7.2 ENVIRONMENTAL CONCERNSThe submission from Greenpeace Australia Pacific was framed on the basis ‘of the very clear scientific evidence that most of the world’s known fossil fuel reserves must be left in the ground if climate change is to be kept below 2°C of warming above pre-industrial levels (Greenpeace Australia Pacific Submission, p. 2-3)’.
Page 136
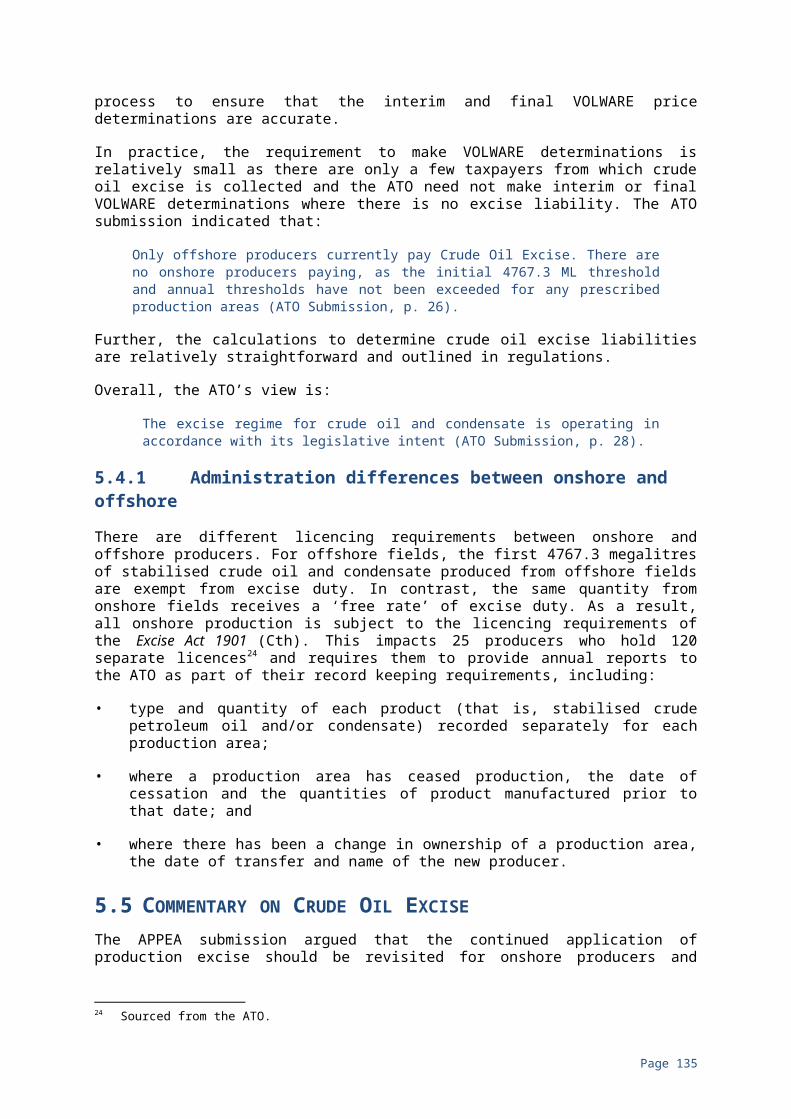
Greenpeace Australia Pacific noted that they would:
… support reforms that will result in more money from existing fossil fuel developments flowing back into the public purse. However, we fundamentally disagree with the notion that any further exploration activities conducted by fossil fuel companies should be facilitated or subsidised by the government (Greenpeace Australia Pacific Submission, p. 1).
Greenpeace Australia Pacific also recommended that ‘revenue from a reformed PRRT or royalty scheme should be invested in renewable energy to help speed up the transition to a clean energy economy (Greenpeace Australia Pacific Submission p. 6)’.
7.3 PROFIT SHIFTINGThe ability for multinational corporations to shift profits in order to reduce their tax obligations was raised as an issue of concern in a number of submissions:
Where profit-based taxes are employed, the Federal Government should ensure that companies are not able to shift their profit abroad to avoid taxation. More stringent requirements around local content would assist this process (Professionals Australia Submission, p. 2).
The notion of a profit-based tax is brilliant in theory, but presents serious problems in the real world. These problems are exacerbated by long-standing practices of multinational oil companies to aggressively minimise tax payments by shifting profits to low or no tax regimes (Tax Justice Network Australia Submission, p. 2).
… a component of the decline in resource tax revenues is probably due to standard profit shifting by multi-nationals, including transfer-pricing of brand inputs, exploration and rig investments. This obviously applies much more broadly than to resource taxation alone. But as noted in this submission numerous times, enforceability of a tax is in many ways more important than its efficiency (Prosper Australia Submission, p. 10).
While issues associated with profit shifting to avoid company tax obligations are outside the scope of the review, the review notes that the Government is pursuing the G20/OECD Base Erosion Profit Shifting agenda. On the issue of integrity of the PRRT legislation, see section 4.11 which covers the robustness of the ATO’s administration of the PRRT.
•
Page 137

BIBLIOGRAPHY
Agalliu, I. (2011). Comparative Assessment of the Federal Oil and Gas Fiscal System. US Department of the Interior Bureau of Ocean Energy Management. October 2011. Available at https://www.energy.senate.gov/public/index.cfm/files/serve?File_id=d174971c-4682-4d96-b194-a85fa2b86774
Alaska Department of Revenue (2015). Alaska’s Oil and Gas Competitiveness Report. Alaska Oil and Gas Competitiveness Review Board. February 27, 2015. Available at: http://dor.alaska.gov/Oil-Gas-Competitiveness-Review-Board.aspx
Alberta Oil and Gas Industry Quarterly Update (2016). Winter 2016. Available at: http://www.albertacanada.com/business/statistics/oil-and-gas-quarterly.aspx
Australia’s Future Tax System Review (2010). Australia’s Future Tax System: Report to Treasurer. Commonwealth of Australia. Available at: http://taxreview.treasury.gov.au/
Australian Bureau of Statistics (2016). Mineral and Petroleum Exploration, Australia. Dec 2016, Cat. No. 8412.0. Available at www.abs.gov.au/AUSSTATS/[email protected]/Lookup/8412.0Main+Features1Dec%202016?OpenDocument
Australian Competition and Consumer Commission (2016). Inquiry into the East Coast Gas Market. April 2016. Available at: https://www.accc.gov.au/regulated-infrastructure/energy/east-coast-gas-inquiry-2015
Australian Energy Market Operator (2017). Gas Statement of Opportunities for Eastern and South-Eastern Australia. March 2016. Available at: https://www.aemo.com.au/-/media/Files/PDF/2016-Gas-Statement-of-Opportunities.pdf
Australian Energy Market Operator (2016). Gas Statement of Opportunities for Western Australia. December 2016. Available at: https://www.aemo.com.au/-/media/Files/Gas/National_Planning_and_Forecasting/WA_GSOO/2016/2016-WA-Gas-Statement-of-Opportunities.pdf
Australian National Audit Office (2009). Administration of the Petroleum Resource Rent Tax. 20 May, 2009. Available at: https://www.anao.gov.au/work/performance-audit/administration-petroleum-resource-rent-tax
Australian National Audit Office (2016). Collection of the North West Shelf Royalty Revenue. Available at: https://www.anao.gov.au/sites/g/files/net2766/f/ANAO_Report_2016-2017_%2028.pdf
Australian Taxation Office (2016). Timor Sea Treaty: Joint Petroleum Development Area instructions 2016, Available at:
Page 138
https://www.ato.gov.au/Forms/Timor-Sea-Treaty---Joint-Petroleum-Development-Area-instructions-2016/?page=2#Background
Barrymore, S and Butler, A (2015). Decommissioning Facilities in Australia’s Offshore Areas — Whose Responsibility? Available at: https://www.ampla.org/conference-information/5b2-barrymore/2015-annual-conference---perth
Brown, E. C. (1948), ‘Business Income Taxation and Investment Incentives’ in edited book Income Employment and Public Policy, Essays in Honor of Alvin H. Hansen. Edited by L. A.Metzler, H. S.Perloff and E. D.Domar. Norton, New York.
Chevron (2012 and 2013). Press Releases. Available at www.chevron.com/investors/press-releases
Commonwealth Government (1983). Discussion Paper on Resource Rent Tax in the Petroleum Sector. December, 1983.
Commonwealth Government (1984a). Effects on Exploration of Resource Rent Tax With Full Exploration Loss Offsets. February, 1984.
Commonwealth Government (1984b), Outline of a ‘Greenfields’ Resource Rent Tax in the Petroleum Sector. April, 1984.
Commonwealth Government (1984c). “Resource Rent Tax on ‘Greenfields’ Offshore Petroleum Projects”. Statement by the Treasurer The Hon P. J. Keating and the Minister for Resources and Energy Senator The Hon Peter Walsh. June, 1984.
Cassidy N. and Kosev (2015). “Australia and the Global LNG Market”. Bulletin. March Quarter 2015. Reserve Bank of Australia. Available at http://www.rba.gov.au/publications/bulletin/2015/mar/pdf/bu-0315-4.pdf
Dediu, D., Ellis, M., Heyning, C., Lambert, P., Segorbe, J. and Thain, A. (2016). Sustaining Impact from Australian LNG Operations. McKinsey Australia. April 2016.
Department of Industry, Innovation and Science (2016a). Australian Energy Update 2016. Office of the Chief Economist. Available at www.industry.gov.au/Office-of-the-Chief-Economist/Publications/Pages/Australian-energy-statistics.aspx
Department of Industry, Innovation and Science (2016b). Resources Energy Quarterly — March 2016. Office of the Chief Economist. Available at www.industry.gov.au/Office-of-the-Chief-Economist/Publications/Pages/Resources--and-energy-quarterly.aspx
Department of Industry, Innovation and Science (2016c). Resources Energy Quarterly — December 2016. Office of the Chief Economist. Available at www.industry.gov.au/Office-of-the-Chief-Economist/Publications/Pages/Resources--and-energy-quarterly.aspx
Department of Industry, Innovation and Science (2016d). Energy in Australia 2015. Office of the Chief Economist. Available at
Page 139

www.industry.gov.au/Office-of-the-Chief-Economist/Publications/Pages/Energy-in-Australia.aspx
Department of Industry, Innovation and Science (2016e). Resources and Energy Major Projects — December 2016. Office of the Chief Economist. Available at www.industry.gov.au/Office-of-the-Chief-Economist/Publications/Documents/req/Resources-and-Energy-Major-Projects-December-2016.pdf
Page 140
Department of Industry, Innovation and Science (2016f). Gas Market Report 2015. Office of the Chief Economist. Available at www.industry.gov.au/Office-of-the-Chief-Economist/Publications/Pages/Gas-market-report.aspx#
Department of Industry, Innovation and Science (2017). Resources Energy Quarterly — March 2017. Office of the Chief Economist. Available at www.industry.gov.au/Office-of-the-Chief-Economist/Publications/Pages/Resources--and-energy-quarterly.aspx
Department of Industry, Innovation and Science (n.d). The History of Petroleum Resources Rent Tax. Available at: https://industry.gov.au/resource/Enhancing/ResourcesTaxation/PetroleumResourceRentTax/Pages/PRRTHistory.aspx
Fane, G (1987). “Neutral taxation under uncertainty”. Journal of Public Economics. Volume 33, Issue 1. pp. 95-105.
Fraser Institute (2016a). Global Petroleum Survey 2016. Available at www.fraserinstitute.org/studies/global-petroleum-survey-2016
Fraser Institute (2016b). Global Petroleum Survey 2016. Canada Press Release. Available at https://www.fraserinstitute.org/sites/default/files/global-petroleum-survey-2016-news%20release.pdf
Freebairn, J. (2015). “Reconsidering Royalty and Resource Rent Taxes for Australian Mining”. Australian Journal of Agricultural and Resource Economics. Volume 59, Issue 4. October 2015. pp. 586-601.
Geoscience Australia (2016). Australian Energy Resources Assessment: Interim Report. Available at: www.ga.gov.au/aera
Grattan Institute (2010). “Mineral Resource Rent Tax—Will It Work?”. Transcript. 30 May, 2013. Available at: http://www.taxwatch.org.au/ssl/CMS/files_cms/186_MRRT%20Report.pdf
HM Treasury (2014). Review of the Oil and Gas Fiscal Regime: Call for Evidence. December 2014. Available at: https://www.gov.uk/government/consultations/review-of-the-oil-and-gas-fiscal-regime-a-call-for-evidence
Hogan L. and Goldswrothy, B. (2010). “International mineral Taxation: Experience and Issues” in edited book The Taxation of Petroleum and Minerals: Principles, Problems and Practice by Daniel, P. Keen M, and McPherson, C. Routledge: New York, New York. pp. 122-162.
International Energy Agency (2013). World Energy Outlook 2013. Available at www.worldenergyoutlook.org/weo2013/
International Monetary Fund (2012). Fiscal Regimes for Extractive Industries: Design and Implementation. Fiscal Affairs Department, IMF. August 15, 2012. Available at: https://www.imf.org/external/np/pp/eng/2012/081512.pdf
Page 141
International Transport Workers’ Federation, Briefing Paper (2016). Australian LNG Exports to Boom, Tax Revenue is a Bust. Available at: https://static1.squarespace.com/static/574507cde707eb3324 24b26a/t/582d44d3b3db2bc03f850780/1479361749065/ITF+PRRT+Brief+2+Qatar+-+Sept2016.pdf
Kellas, G (2010). “Natural Gas Experience and Issues” in edited book The Taxation of Petroleum and Minerals: Principles, Problems and Practice by Daniel, P. Keen M, and McPherson, C. Routledge: New York, New York. pp. 163-184.
Kraal, Diane (2016). “Call for Review: Petroleum Resource Rent Tax Gas Transfer Pricing”. Business Insight. Monash Business School. 23 May, 2016.
Macrobusiness (2014). “IEA: Nobody will invest in Australian LNG”. Available at: http://www.macrobusiness.com.au/2014/03/iea-nobody-will-invest-in-australian-lng/
McKell Institute (2017). “Harnessing the Boom — How Australia can better capture the benefits of the natural gas boom”. Available at: https://mckellinstitute.org.au/research/reports/harnessing-the-boom/
Oil and Gas Authority (2015). Summary of UK Estimated Remaining Recoverable Hydrocarbon Resources 2015. Available at: https://www.ogauthority.co.uk/data-centre/data-downloads-and-publications/reserves-and-resources/
Organisation of Economic Co-operation and Development (2010) OECD Transfer Pricing Guidelines for Multinational Enterprises and Tax Administrations 2010. OECD Publishing, Paris. Available at: http://dx.doi.org/10.1787/tpg-2010-en.
Parliament of Australia (1986) House of Representatives Hansard. 28 November 1986.
Parliament of Australia (1987). House of Representatives Hansard. 21 October, 1987.
Parliament of Australia (1991). House of Representatives Hansard. 9 May, 1991.
Petroleum Resource Rent Tax Bill 1987 (Cth) (1987).
Petroleum Resource Rent Tax Bill 1987 (Cth) (1987). Explanatory Memorandum. 1987.
Petroleum Resource Rent Tax Assessment Amendment Bill 2011 (Cth). Explanatory Memorandum. 2011.
Policy Transition Group (2010). “New Resource Taxation Arrangements”. Policy Transition Group Report to the Australian Government. December, 2010.
Productivity Commission (2009). “Review of Regulatory Burden on the Upstream Petroleum (Oil and Gas) Sector”. Productivity Commission Research Report. April 2009. Available at:
Page 142
http://www.pc.gov.au/inquiries/completed/upstream-petroleum/report/upstream-petroleum.pdf
Tax Laws Amendment Bill No. 6 2001 (Cth) (2001). Explanatory Memorandum. 2001.
US Energy Information Administration (2017). Petroleum and Other Liquids: Spot Prices Data. Available at: www.eia.gov/dnav/pet/pet_pri_spt_s1_d.htm
APPENDIX A — AUSTRALIA’S MAJOR OIL AND GAS PROJECTS
NameType Proponents
LocationBasinPlant
FID (final investment
decision) and FG (first gas)
Size Cost
In Operation
Gippsland Basin Joint Venture
Esso (Operator, 50%)BHP Billiton (50%)
VICGippsland Basin
First production 1967
Produced around 4.7 billion barrels of oil and 8 tcf of gas since startup
A$32b
North West Shelf
Woodside (Operator, 16.67%)Shell (16.67%)BP (16.67%)Chevron (16.67%)BHP Billiton (16.67%)MIMI (16.67%)CNOOC (gas and associated liquids 5.3%)
WACarnarvon BasinKarratha
FG (Domestic gas) 1984;FG (LNG) 1989
16.3Mtpa5 trains
A$34b
Darwin LNG
ConocoPhillips (Operator, 57.15%)ENI Australia (10.99%)Santos (11.39%)INPEX (11.27%)TEPCO & Tokyo Gas (aggregate 9.2%)
NTJPDADarwin
FG 20063.6Mtpa1 train
-
Pluto LNGWoodside (Operator, 90%)Tokyo Gas (5%)Kansai Electric (5%)
WACarnarvon Basin Karratha
FID 2007FG 2012
4.3Mtpa1 train
A$14.9bWoodside
Queensland Curtis LNG
Shell (Operator, 50% Train 1, 97.5% Train 2)CNOOC (50% in Train 1)Tokyo Gas (2.5% in Train 2)
QLDBowen and Surat BasinGladstone
FID 2010FG Jan 2015
8.5Mtpa2 trains
US$20.4b Shell (formerly BG Group)
Gladstone LNG
Santos (Operator, 30%)Petronas (27.5%)Total (27.5%)KOGAS (15%)
QLDBowen and Surat BasinGladstone
FID 2011FG Oct 2015
7.8Mtpa2 trains
US$18.5b Santos
Australia-Pacific LNG
Origin Energy (37.5%)ConocoPhillips (37.5%)Sinopec (25%)
QLD Bowen and Surat BasinGladstone
FID: (Train 1) 2011; (Train 2) 2012FG Jan 2016
9Mtpa2 trains A$24.7b
Origin
GorgonLNGDomGas
Chevron (Operator, 47.333%)Exxon (25%)Shell (25%)Osaka Gas (1.25%)Tokyo Gas (1%)
WACarnarvon BasinBarrow Is.
FID 2009FG Mar 2016
LNG:15.6Mtpa,3 trainsDom gas: 150Tj/d to 300 Tj/d
US$54bChevron
Page 143
NameType Proponents
LocationBasinPlant
FID (final investment
decision) and FG (first gas)
Size Cost
Chubu (0.417%)
In Construction
WheatstoneLNGDomGas
Chevron (Operator, 64.14%)KUFPEC (13.4%)Woodside (13%)Kyushu Electric Power Company (1.46%)PE Wheatstone Pty Ltd, part owned by TEPCO (8%)
WACarnarvon BasinOnslow
FID Sept 2011FG 2017
LNG:8.9Mtpa2 trainsDom gas: 200Tj/d
US$34bChevron
IchthysLNGCondensate
INPEX (Operator, 62.245%)Total (30%)CPC Corporation Taiwan (2.625%)Tokyo Gas (1.575%)Osaka Gas (1.2%)Kansai Electric Power (1.2%)Chubu Electric (0.735%)Toho Gas (0.42%)
WABrowse BasinDarwin
FID Jan 2012FG 2017
8.9Mtpa2 trains
US$37.4b INPEX
Prelude Floating LNGCondensate
Shell (Operator, 67.5%)INPEX (17.5%)KOGAS (10%)OPIC (CPC Taiwan) (5%)
WABrowse BasinFLNG
FID May 2011FG 2017/18
3.6Mtpa1 trainFLNG
US$12.6b estimate
In Planning
BrowseLNGCondensate
Woodside (Operator, 30.6%)Shell (27%)BP (17.33%)MIMI (14.4%)PetroChina (10.67%)
WABrowse Basin
- - -
Scarborough Floating LNG
Esso (Operator, 50%)BHP Billiton (25%)Woodside (25%)
WACarnarvon Basin - - -
SunriseLNGCondensate
Woodside (Operator, 33%)ConocoPhillips (30%)Shell (27%)Osaka Gas (10%)
NT/JPDABonaparte Basin - - -
Page 144
APPENDIX B — OPERATION AND ADMINISTRATION OF THE PRRT
B.1 OPERATION OF THE PRRTThe PRRT is applied to the taxable PRRT profit derived by an entity in a financial year from a petroleum project at a rate of 40 per cent. An entity has a taxable PRRT profit in a year of tax in relation to a petroleum project if their assessable PRRT receipts exceed their deductible expenditures. Each entity that earns a taxable profit in relation to a petroleum project in a year of tax is liable to pay PRRT. That is, parties in a joint venture are assessed on an individual basis.
A petroleum project is taken to exist when there is a production licence in force. A single production licence can form the basis of a petroleum project, or two or more production licences (that are sufficiently related) can be combined to form a single project for PRRT purposes. In addition, what constitutes a petroleum project can include activities conducted in relation to the project but which physically takes place outside the production licence area.
Taxable profit is calculated by deducting eligible project expenses from the assessable receipts derived from the project. Assessable receipts primarily comprises of the receipts received by an entity from the sale of petroleum, or marketable petroleum commodities produced from the petroleum, recovered from a project. Marketable petroleum commodities include stabilised crude oil, sales gas, condensate, LPG and ethane. Deductible expenditure broadly includes those expenditures, whether capital or revenue in nature, that are directly incurred by an entity in relation to the petroleum project. Figure B.1 illustrates the basic framework for calculating PRRT.
Figure B.1 — Calculating PRRT liability
Where an entity incurs deductible expenditure that exceeds their assessable PRRT receipts in a financial year, the excess expenditure is carried forward and uplifted to be deducted against assessable receipts derived by the entity in future years. As the PRRT is a project-based tax, excess undeducted expenditure may not generally be offset against income from other projects. The exception is
Page 145

exploration expenditure, which is transferable to other petroleum projects, subject to a number of conditions.
B.1.1 The PRRT rateSince its inception, the PRRT tax rate has been set at 40 per cent of the taxable profit of a petroleum project.
This Bill will declare the rate of petroleum resource rent tax and formally impose the tax in respect of the taxable profit of a petroleum project determined in accordance with the accompanying Petroleum Resource Rent Tax Assessment Bill 1987. The rate of tax is to be 40 per cent (Explanatory Memorandum, Petroleum Resource Rent Tax Bill 1987 (Cth), p. 1).
The PRRT represents only part of the return to the community for the use of its resources. The company income tax system also taxes resource rents (and normal returns) in petroleum projects. When the PRRT rate of 40 per cent is combined with the company tax rate of 30 per cent, this produces a combined statutory rate of 58 per cent on taxable profits. However, care needs to be taken in interpreting this rate, as the PRRT tax base (cash flow, incorporating immediate write-off of all expenditure, excluding financing costs) is considerably narrower than the company income tax base.
The PRRT acts a secondary tax seeking to apply additional tax on projects with resource rents (section 2.1).
B.1.2 Assessable petroleum receiptsAssessable petroleum receipts result from the sale of petroleum prior to a marketable petroleum commodity (MPC) being produced, or from an MPC that becomes an ‘excluded commodity’ via sale. Where an MPC becomes an excluded commodity other than by sale (for instance, the commodity is moved away from its place of production other than to adjacent storage, or further processed), the market value of an MPC immediately before it became an excluded commodity is treated as an assessable receipt for PRRT purposes. Special provisions apply to calculating the assessable receipts associated with sales gas produced in integrated GTL projects such as LNG projects. These provisions are contained in the Petroleum Resource Rent Tax Assessment Regulations 2015.
Assessable receipts do not include amounts received as loans, or in respect of loans made, receipts of interest and capital repayments received from borrowers. They also do not include share capital received as shareholders’ funds, dividends or bonus shares received from associated companies or private royalty income.
B.1.3 Eligible real expenditureUnder the PRRT, expenditure of both a capital and revenue nature which is incurred by an entity in relation to the petroleum project (eligible real expenditure) is deductible in the year it is incurred. Eligible real expenditure is categorised as general project expenditure, exploration expenditure or closing down expenditure, depending on its nature and purpose. Where capital expenditure is incurred in respect of assets or property that is to be used only partly in relation to a petroleum project, only that portion of the expenditure related to petroleum project use is deductible for PRRT purposes.
Page 146

Exploration expenditure comprises expenditure incurred in, or in connection with, exploration for petroleum in an eligible exploration or recovery area. The characterisation of exploration expenditure is a question of fact and is not determined simply by the fact that an entity may hold an exploration permit (or a retention lease). Rather, the nature of the expenditure must be examined. Exploration expenditure is deductible against assessable PRRT receipts of the project but if there are insufficient receipts, exploration expenditure can be transferred to other projects if certain conditions are satisfied.
General project expenditure comprises expenditure (other than excluded expenditure, exploration expenditure or closing down expenditure) incurred in relation to carrying on or providing the operations, facilities and other things comprising a petroleum project. It includes expenditure related to the recovery of petroleum from the production licence area, processing to produce marketable petroleum commodities, as well as storage, services and employee amenities related to the project. Examples of general project expenditure include expenditure on production platforms, drilling plant and equipment, pipelines to transport petroleum from the wellhead to a reception point, payments to contractors, and the wage costs of project employees.
Closing down expenditure comprises all expenditure related to closing down a petroleum project, including expenditure on environmental restoration of the petroleum project area and the removal of drilling platforms (but not the cost of relocating them elsewhere). In cases where an entity derives insufficient assessable PRRT receipts for a year against which to deduct closing down expenditure incurred for the year, a tax credit of 40 per cent of the excess expenditure is provided subject to the tax credit not exceeding the cumulative PRRT previously paid.
Excluded expenditure comprises project financing costs (including interest payments, dividend payments, share issue costs and equity capital repayments), certain indirect payments and certain payments in respect of administration and accounting activities. These costs are specifically not taken into account in ascertaining amounts of exploration, general project and closing down expenditure in relation to a project. Excluded expenditure also includes payments to acquire an interest in an exploration permit, retention lease or production licence, private royalties, and payments of income tax and GST.
There are two other categories of eligible real expenditure — resource tax expenditure and starting base expenditure. These categories are discussed separately in sections B.1.4 and B.1.5.
B.1.4 Resource tax expenditureCommonwealth and state resource tax expenditures are creditable against the PRRT taxable profit of petroleum projects. ‘Resource tax expenditures’ include Commonwealth and state royalties and crude oil excise. In order to be creditable, resource tax expenditure must be incurred in relation to petroleum recovered from the production licence areas comprising the petroleum project. This is consistent with the PRRT being a project-based tax.
The crediting of payments of resource taxes is given effect by converting these payments to a deduction equivalent by dividing the value of the expenditure by the PRRT rate. For example, if a petroleum project pays a royalty of $2 million to
Page 147

a state government for petroleum recovered from a production licence area, the deduction is calculated by dividing the $2 million royalty payment by the PRRT tax rate ($2 million/0.40 = $5 million). Thus, the grossed-up $5 million is immediately deductible against available assessable PRRT receipts and reduces the PRRT payable by the project by $2 million. Since this is equal to the $2 million paid in royalties it reduces the PRRT payable dollar for dollar. In these circumstances, the PRRT overrides the distortionary impact of the royalty. In addition, crediting the royalty has the practical effect of avoiding the potential for double taxation were the royalty only deductible for PRRT purposes.
In circumstances where these grossed-up resource taxes cannot be deducted against a petroleum project’s assessable PRRT receipts in a financial year, the excess is carried forward and uplifted at the rate of LTBR plus 5 percentage points (with any undeducted amounts being non-refundable and non-transferrable to other petroleum projects).
Where the grossed-up value is carried forward and uplifted and ultimately offset against future assessable PRRT receipts the PRRT overrides the effects of the royalties and excises, so long as the uplift rate used is consistent with the risk that these amounts may not be fully utilised because of insufficient PRRT receipts (see section 4.2).
However, the investment distortions caused by royalties and excises are not able to be fully overridden by the PRRT where there is insufficient assessable PRRT receipts to fully utilise the carried-forward grossed-up value of these other resource taxes. This is because taxpayers are effectively in the position where they are only paying these resources taxes, rather than the PRRT.
B.1.5 Starting base expenditureIn 2010, the PRRT was extended to existing onshore petroleum projects and the NWS project. Holders of interests in transitioning petroleum projects, exploration permits and retention leases that existed at 2 May 2010 were given an additional amount of deductible expenditure to recognise their historical investments, past taxes paid under royalty and excise regimes, and in recognition that projects were undertaken in the expectation that PRRT would not apply. This additional amount of deductible expenditure is called starting base expenditure. The provisions for determining starting base amounts are not a permanent feature of the PRRT, but a feature designed to transition certain projects into the PRRT.
There are three different valuation methods a taxpayer may choose to determine the amount of starting base expenditure that an interest may hold. They are the market value approach, the book value approach and the look back approach.
If the market value approach is chosen, the starting base amount as at 1 July 2012 will comprise the sum of the market values of the starting base assets (including the rights to the resource) as at 2 May 2010. If the book value approach is chosen, the starting base amount as at 1 July 2012 will comprise the sum of the most recent audited accounting book values of starting base assets (not including the rights to the resource) available at the time. Starting base assets include most tangible and intangible assets that are related to a project’s interest. They can be property, or legal or equitable rights but they must be related to the project, or to the retention lease or exploration permit from which
Page 148

a production licence will potentially be derived and a petroleum project will later arise. In addition to these market value and book value amounts, an entity can also include capital expenditure incurred in relation to the interest during the interim period between the time the starting base asset values were determined and 30 June 2012.
Where the book value approach is chosen, both the value of starting base assets and interim expenditure amounts are uplifted on 1 July 2012 for the total interim period from 2 May 2010 during which the starting base assets were continuously held. The amount is uplifted by LTBR plus 5 percentage points over the relevant period. Market value starting base amounts are not uplifted over the interim period.
The look back approach is an alternative valuation method for determining the value of the starting base assets for a petroleum project. Where the look back approach is chosen, there is no starting base amount. Instead, historical expenditure from 1 July 2002 will be taken into account in determining the PRRT liability for a project, consistent with existing PRRT deductible expenditure provisions. In addition, where the project interest was directly acquired, or the company holding the interest was acquired during the period 1 July 2007 to 1 May 2010, the acquisition price may be taken into account via the look back approach to the extent it relates to the project interest. The look back method also makes provision for acquired exploration expenditure which is equal to the amount of the cost of acquiring the interest that has been allocated to the exploration and evaluation assets recognised in a financial report. Acquired exploration expenditure is a separate category in the PRRT deductions framework and is uplifted at LTBR plus 15 percentage points for the first five years after 2 May 2010, and then LTBR plus 5 percentage points thereafter.
Starting base amounts are immediately deductible against assessable PRRT receipts following the extension of the PRRT where a production licence exists. This means that transitioning projects are able to immediately deduct starting base or look back amounts from 1 July 2012, with unused amounts uplifted by LTBR plus 5 percentage points each year.
Starting base amounts are not transferable between petroleum projects. Exploration expenditure that is taken to be incurred by a project prior to 1 July 2012 under the look back approach is also not transferable.
B.1.6 Deductible expenditure and deduction orderingWhere the deductible expenditure in relation to a petroleum project exceeds their assessable PRRT receipts in a year, the excess is carried forward and uplifted on a yearly basis until it can be absorbed against assessable PRRT receipts from the project, or transferred to another project. There a number a categories of deductible expenditure that determine the order in which deductions are applied against assessable receipts, and the uplift rate that is applied to any carried forward expenditure. Table B.1 outlines the order in which these categories of expenditure are deducted against the assessable PRRT receipts of a project and the uplift rate which is applied.
Page 149

Table B.1 — Order of deductible expenditure in the PRRT28
Category of Deductible Expenditure Description Uplift Rate
Class 1 ABR — general expenditure General expenditure before 1 July 1990, less than 5 years
before production licence came into force.
LTBR+15%
Class 1 ABR — exploration expenditure Exploration expenditure before 1 July 1990, less than 5 years
before production licence came into force.
LTBR+15%
Class 2 ABR— general expenditure General expenditure after 1 July 1990, less than 5 years
before production licence came into force.
LTBR+5%
Class 1 GDP factor expenditure General expenditure and exploration expenditure (before
1990) incurred more than 5 years before production licence
came into effect.
GDP deflator
Class 2 ABR — exploration expenditure
TRANSFERABLE
Own-project exploration expenditure incurred after 1 July
1990, less than 5 years before production licence came into
effect.
LTBR+15%
Class 2 GDP factor expenditure
TRANSFERABLE
Own-project exploration expenditure incurred after 1 July
1990, more than 5 years before production licence came into
effect.
GDP deflator
Resource Tax expenditure Commonwealth, state and territory imposed resource taxes,
divided by 40 per cent.
LTBR + 5%
Acquired exploration expenditure The exploration component of the ‘look back’ method of
determining the starting base.
LTBR+15%
for 5 years
following May
2010, LTRB
+5%
thereafter
Starting base expenditure Recognising the value of projects brought into the PRRT
regime in 2012.
LTBR+5% in
most cases
Transferred exploration expenditure Exploration expenditure transferred in from elsewhere. LTBR+15% or
GDP deflator
Closing down expenditure Eligible undeducted payments to close operations are credited. -
B.1.7 TransferabilityExploration expenditure incurred after 1 July 1990 is transferable to other project interests that are held by companies in a wholly owned group where certain conditions are met:
• the receiving project interest has a PRRT taxable profit;
• the amount of expenditure transferred is only so much as will reduce the PRRT profit of the receiving project to zero (this is referred to as a ‘notional profit’ in the PRRT); and
• a common ownership rule is met.
Transfers are made in a specific order:
28 ABR is augmented bond rate, GDP is gross domestic product, LTBR is long term bond rate.
Page 150
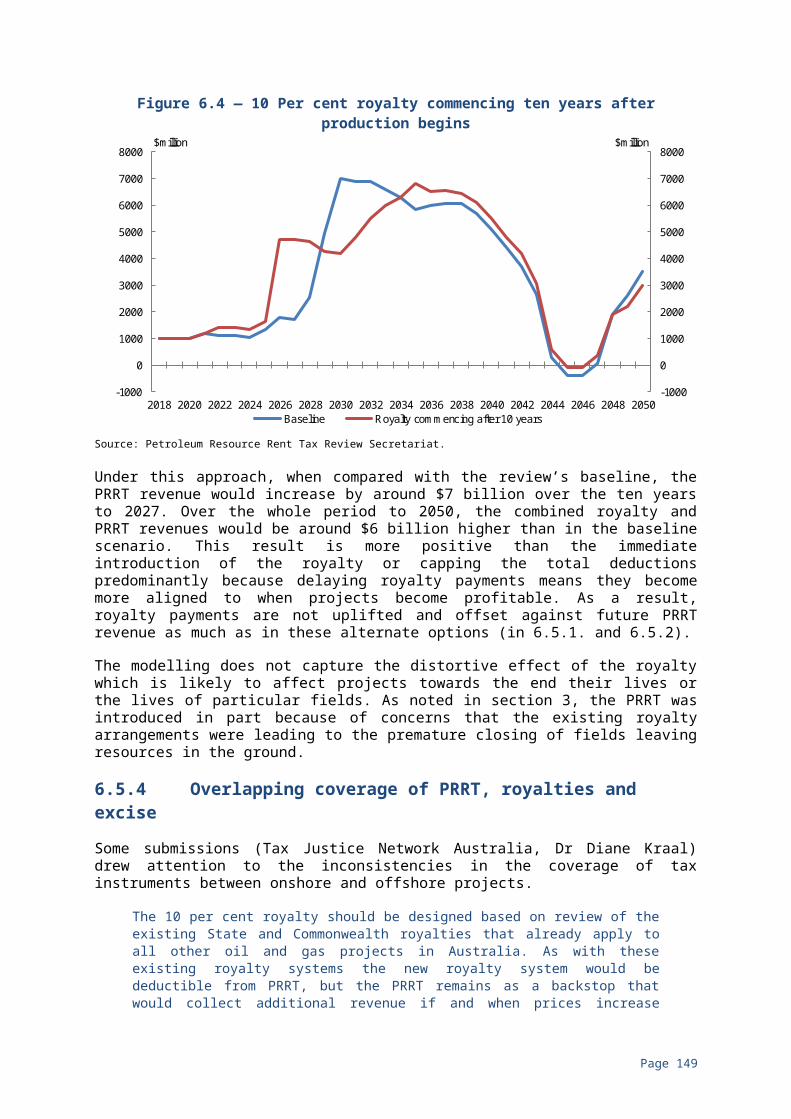
• Transfers are made first to other petroleum projects that the company owns. Transfers may also be made to other companies within a wholly owned group.
• Transfers are made to the petroleum project with the most recent production licence first.
• Transfers of expenditure attracting LTBR plus 15 percentage points are transferred before expenditure attracting the GDP factor uplift (see section 4.3). The uplift rate that is applied to the transferred expenditure is determined by reference to the receiving project.
• The oldest eligible expenditures are transferred first.
The common ownership rule requires a company to have an interest in both the transferring project and receiving project from the time the expenditure is incurred until the expenditure is transferred. This rule prevents the acquisition of projects in order to offset transferable expenditure against an income stream.
Exploration expenditure that satisfies the transfer rules must be transferred under the PRRT. In some cases, where a company already has a profitable PRRT project, any exploration expenditure is transferred immediately and offset against the notional PRRT profit of the receiving project. In this circumstance the exploration expenditure receives no uplift as it is transferred and deducted in the same year it is incurred.
In other cases the exploration expenditure is carried forward until a different petroleum project within the wholly owned group has a notional taxable profit. In this case the exploration expenditure that is transferred is treated as exploration expenditure of the receiving project and the uplift rates that apply are determined by the facts of the receiving project.
The result is that exploration expenditure of several participants in the same project may receive different treatment. For example, a project participant that has another profitable project will transfer the expenditure immediately. A second participant may have another project that only becomes profitable a number of years after the expenditure has been incurred and will transfer and uplift the expenditure based on the facts of the receiving project. A third participant may not have another profitable project and will therefore not be able to transfer the expenditure to another project. In this case, the expenditure will be carried forward and deducted against the future assessable receipts of the project.
In some circumstances, the different facts of the different projects within a company group may result in different treatment for exploration expenditure. The transfer rules may mean that exploration expenditure that would have been uplifted at GDP deflator if it was utilised by the project, is uplifted at LTBR plus 15 percentage points when it is compulsorily transferred to a second project or, alternatively, a project’s exploration expenditure that would have been uplifted at LTBR plus 15 percentage points, may only be uplifted at the GDP deflator when its transferred.
Page 151
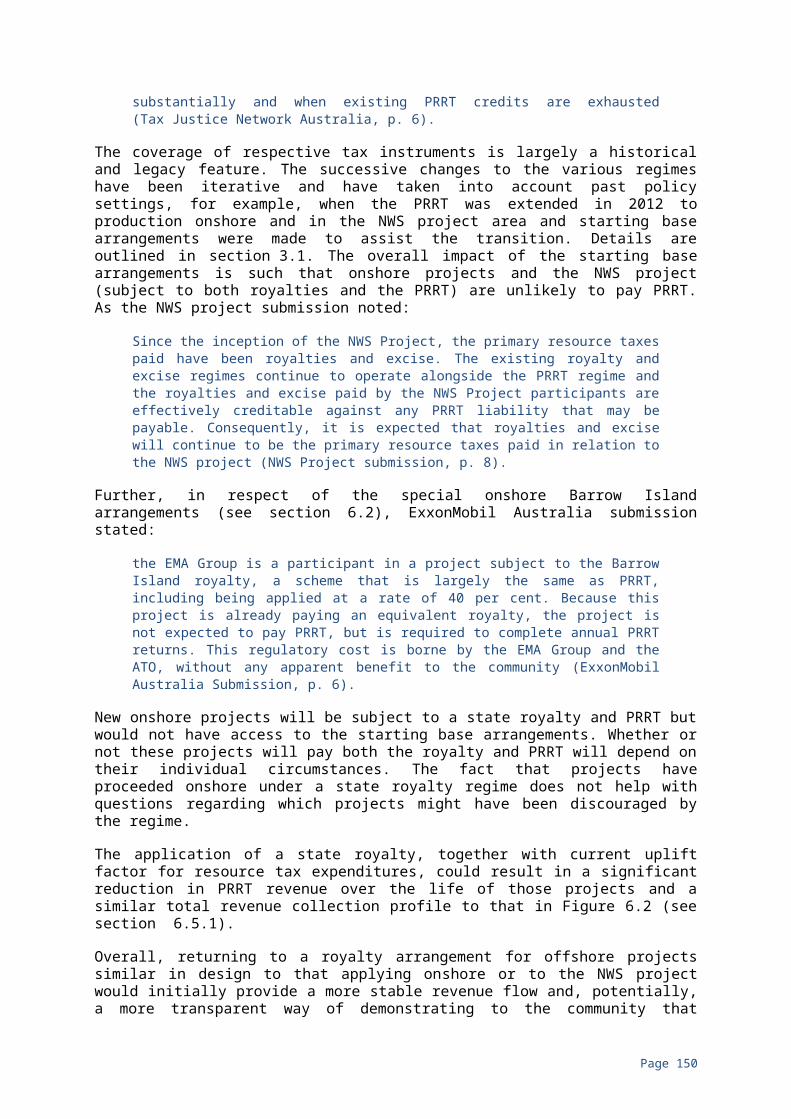
B.1.8 Gas transfer pricingThe PRRT is levied on profits from the processing of petroleum up to the point where it is first in its final form as an MPC. It does not levy tax on any subsequent operations of an integrated project. The GTP methodology to calculate the arm’s length price for sales gas (the MPC) which is used as feedstock gas in the integrated LNG project is contained in the PRRT regulations. It is important to know the transfer price of the gas at the taxing point in order to calculate the PRRT liability for project.
The GTP regulations are contained in the Petroleum Resource Rent Tax Assessment Regulation 2015, originally enacted as the Petroleum Resource Rent Tax Assessment Regulations 2005. The GTP regulations set out a framework for determining the price of sales gas at the taxing point for the purpose of calculating PRRT liability. Under the GTP methodology, there are several methods for calculating a transfer price:
• an advance pricing arrangement (APA) that has been agreed between the taxpayer and the Commissioner of taxation;
• a comparable uncontrolled price (CUP); and
• the residual pricing method (RPM) contained in the regulations.
Advance pricing arrangements
An APA is an agreement between the Commissioner of taxation and a taxpayer on the future application of the arm’s length principle to the taxpayer’s dealings with international related parties.
An APA is not an agreed price but an agreed method of calculating an arm’s length price. APAs are typically used in cross border international dealings to manage transfer pricing risks for taxpayers and the Commissioner of Taxation. In the PRRT context the transfer pricing risk is not limited to or focused on cross border international dealings. The main aim of the APA is to find agreement on the appropriate methodology, assumptions and information to calculate the price at the PRRT taxing point.
The ATO submission outlined the circumstances in which the ATO would enter into an APA:
The ATO may enter into APAs with operators and participants of petroleum projects in order to determine, in advance of controlled transactions, an appropriate set of criteria for the determination of the transfer pricing of those transactions over a fixed period of time. Parties enter into APAs for various reasons but primarily to mitigate risk. Once entered, an APA is reviewed by the ATO to ensure the conditions (described as ‘critical assumptions’) listed in the APA have not been breached, and the terms of the APA have been met (ATO submission, p. 15).
Page 152
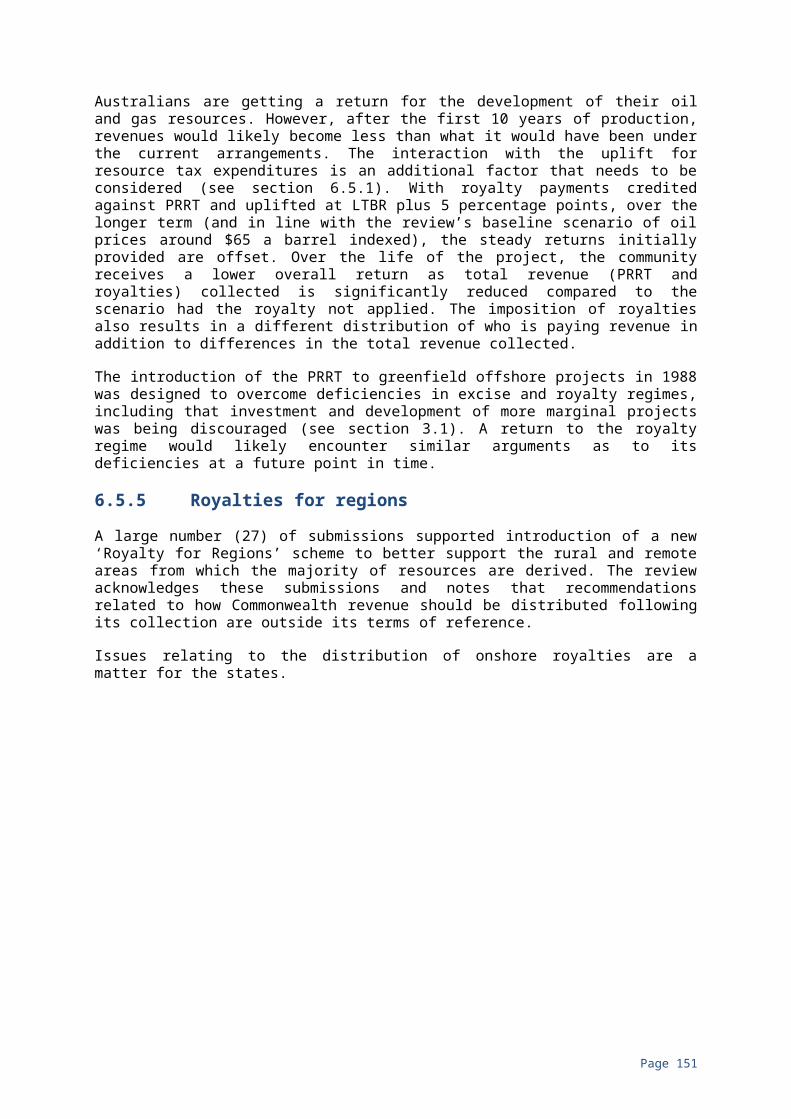
Comparable uncontrolled price
A CUP is a common transfer pricing methodology used to find an arm’s length price that is supported by OECD Transfer Pricing Guidelines for Multinational Enterprises and Tax Administrations.
The CUP method compares ‘the price for property or services transferred in a controlled transaction to the price charged for property or services transferred in a comparable uncontrolled transaction in comparable circumstances’ (OECD, 2010, p. 24.).
In the case of the PRRT, the ‘controlled transaction’ is the transfer of the sales gas from the upstream PRRT ring fence to the downstream liquefaction process. Finding an ‘uncontrolled’ comparable transaction is difficult, especially for offshore integrated projects. There is no uncontrolled transfer of natural gas or sales gas into LNG projects in the North West Australia region to observe. Transferring natural gas or sales gas across unrelated projects or arm’s length purchasing of sales gas for feedstock for LNG processing is much more common with onshore operations. However this does not necessarily mean that dealings are comparable for transfer pricing purposes.
For dealings to be comparable, none of the differences between the transactions being compared should be material, or reasonably accurate adjustments can be made to eliminate the effect of any such differences. The materiality of any differences depends on examining the facts and circumstances of each case and recognising there is likely to be some uncertainty in the judgements that have to be made.
The complexity of taking comparability factors into account is highlighted in ATO guidance:
While all comparability factors need to be taken into consideration, the most important are similarity of product, contract terms and economic/market conditions. For example, the prices of internationally traded mineral commodities often differ because of geographic differences in the markets, the terms of the contractual arrangements (such as volumes, discounts, interest free periods, and exchange rate exposure), the particular time period of the contracts, or differences in the physical/chemical features of the commodity and the relative bargaining power and strategies of buyers and sellers. Business strategies like price competition and marketing intangibles like brand names can also impact on prices. If such differences are material, adjustment is needed; if such adjustments cannot be made, the reliability of the method is affected. (Taxation Ruling TR 97/20, paragraph 3.14)
Despite the greater likelihood that a CUP will be able to be established for the price of sales gas for onshore LNG projects than for offshore LNG projects, the regulations provide that a participant in an onshore integrated LNG operation can choose to use the RPM even where a CUP exists. This option is not available for offshore operations.
The result is that, although the regulations provide for the use of the widely accepted CUP methodology, in practice price will invariably be ascertained using the RPM.
Page 153

The residual pricing method
The RPM applies two formulas (the cost-plus formula and the netback formula) to calculate the gas transfer price. In both cases, the calculations allow for a rate of return on capital costs of the upstream and downstream operations.
The RPM involves the calculation of three prices (Figure B.2):
• the cost-plus price — the lowest notional price the ‘upstream’ operation (which includes the gas extraction) would sell the sale gas/feedstock gas to the ‘downstream’ operation;
• the netback price — the highest notional price the ‘downstream’ operation (which includes the liquefaction, sales and marketing side of the business) would pay for the gas; and
• the RPM price — the average of the cost-plus and netback prices, which is the gas transfer (or RPM) price, unless the cost-plus price exceeds the netback price in which case the netback price is the RPM price.
Figure B.2 — the RPM model
Source: Petroleum Resource Rent Tax Assessment Regulation 2015.
The netback method identifies all the relevant costs incurred in the downstream operation, including an allowance for a return on capital expenditure, and then subtracts those costs from the total revenues realised from selling the liquefied product. This provides a notional maximum ‘arm’s length’ price a downstream producer would pay for the feedstock gas in order to achieve the minimum return necessary to continue production.
The cost-plus price does not reference the final market LNG price; rather it is based on the total costs of the upstream operation to produce the feedstock gas, including an allowance for capital expenditure. This provides the notional minimum price the upstream operation requires to continue supplying the feedstock gas to the LNG plant.
Page 154

Appendix D provides more detail on why and how the GTP regulations were developed, as well as how the regulations operate.
B.1.9 Consolidation for PRRT purposesA group of Australian resident entities that is a consolidated group or a MEC group for income tax purposes can choose to consolidate for PRRT purposes. It must notify the Commissioner of taxation of its decision to do so. Consolidation under the PRRT only applies to onshore project interests. It does not apply to interests in offshore projects.
A PRRT consolidated group is treated as a single entity, so that the group’s onshore project interests are treated as being those of the head company of the group. However, the members of the group will be jointly and severally liable for paying the head company’s PRRT liabilities if the head company does not pay them. An entity that joins a PRRT group (when the group forms or because it is acquired by the group) is treated as having transferred its project interests to the head company of the group. For PRRT purposes, when an entity leaves a consolidated group, the head company is treated as having transferred to it the interests (and parts of interests) the entity takes with it. Changes in a group’s head company, and certain conversions from a MEC group to a consolidated group (and vice versa), lead to rollovers under which the PRRT treatment that applied to the old head company is inherited by the new head company, ensuring a continuity of treatment for the group.
B.1.10 Lodging, reporting and payingA company with an interest in a petroleum project that is in commercial production needs to lodge an annual PRRT return, even if its taxable profit is nil. As PRRT is assessed on a project basis, an entity needs to prepare and lodge separate PRRT returns for each interest it has in a petroleum project. A company needs to pay their annual PRRT liability in three cumulative quarterly instalments with a final payment when it lodges its PRRT return. All companies must lodge their annual returns on the basis of a 30 June year end, as the PRRT does not allow to companies to choose a substituted accounting period.
Companies also need to notify the ATO where there is a transfer of exploration expenditure or where there is a transfer of a project interest.
B.1.11 Interaction between petroleum titles and PRRTA titles system is commonly used across Australian jurisdictions to regulate petroleum exploration and development. State governments are responsible for the allocation of petroleum rights onshore and in nearby coastal waters, while in offshore Commonwealth waters this responsibility lies with the Australian Government.
There are various types of titles which reflect the different activities throughout the petroleum lifecycle. Focussing on the offshore regime, exploration permits are awarded following a competitive process by companies seeking exclusive rights to explore in certain areas. If a discovery is made, titleholders must declare a location over the resource. They may then apply for a production licence if the resource is considered commercial for development, or a retention lease if the
Page 155

resource is not yet commercially viable. The system is intended to encourage responsible and timely petroleum exploration and development.
Decisions on offshore petroleum titles are made by the Joint Authority which comprises the relevant Australian Government Minister and state Minister or their delegates.
For the purposes of the PRRT, a project commences with the issue of a production licence. Taxpayers can apply to combine several production licences into a single PRRT project where they meet certain criteria which demonstrate the licences are ‘sufficiently related’.
The timing of issuance of production licences hinges on the commerciality of the resource and is often linked to investment decisions to develop the resource. For instance, many of Australia’s new LNG projects required production licences to be in place or in train to achieve a FID for the project to proceed. Government policy on timely development also requires that titleholders progress to a production licence once the resource is deemed commercial.
The timing of the issuance of production licences has implications for expenditure deductibility under the PRRT. For example, exploration expenditure is uplifted by the GDP deflator where it is incurred more than five years prior to the complete application for a production licence (see Table B.2).
B.2 ADMINISTRATION OF THE PRRTResponsibility for administering the PRRT is shared by the Department of the Treasury, the DIIS and the Commissioner of Taxation. In brief:
• The Department of the Treasury and DIIS are jointly responsible for PRRT policy and legislation.
• The Commissioner of taxation is responsible for the administration of the PRRT and the collection of PRRT liabilities.
• The Resources Minister is responsible for issuing combination certificates.
The ATO, as the Government’s principle revenue collection agency, administers the PRRT. The functions the ATO is responsible for include compliance, engagement and assurance, risk and intelligence, legal interpretation and advice, reporting, registration, debt collection and management.
The PRRT, like other Commonwealth taxes works on a system of self-assessment. Self-assessment was introduced into the PRRT administration in 2006 along with other modernising reforms. These changes meant that the self-assessment regime would apply to PRRT taxpayers in the same way that their obligations work for income tax. Important features of the self-assessment regime include: the obligation for PRRT taxpayers to fully self-assess their own PRRT liability; amendment periods under the PRRT that are aligned to those in place for income tax; and the ability of the Commissioner of taxation to issue binding rulings on the application of the PRRT.
To ensure compliance within the self-assessment system, the ATO uses a risk based approach across all taxes and tailors those approaches to particular taxes
Page 156

and types of taxpayers. The ATO uses data and analytics to target monitoring and has an enforcement focus for taxpayers with whom the ATO has more significant concerns. The ATO Submission to the review outlines how the ATO’s risk based approach is tailored to PRRT compliance including how the ATO leverages the natural business systems of taxpayers including joint venture arrangements to manage risk.
The ATO submission gives the following outline of the teams responsible for the different functions used to administer the PRRT:
The PRRT compliance work program is predominantly managed by an operations team in the Public Groups and International (PG&I) Business Line located in Perth. The operations team is supported by a risk and intelligence function performed in Melbourne. Broadly, the PG&I Business Line has responsibility for all publicly listed and international entities. The PG&I Advice and Guidance area manages the provision of advice relating to PRRT matters. The operations and advice area are technically supported by the Tax Counsel Network, which identifies and manages high risk interpretive issues, and includes several tax counsel who specialise in tax issues relating to the extractive industries, including PRRT. Other aspects relating to the administration of the PRRT such as reporting, registration and debt are managed by the Service Delivery Group (ATO Submission, p. 13).
The ATO’s administration of the PRRT was subject to a review by the ANAO in 2009. The ANAO report assessed the effectiveness of the ATO’s administration across the four key areas of general administration, compliance, promoting certainty in administering the PRRT and governance arrangements. The ANAO concluded that:
Overall, the Tax Office has administered the PRRT in a generally effective manner, which has supported voluntary compliance by taxpayers. The vast majority of PRRT taxes are paid promptly in accordance with administrative arrangements that underpin the self-assessment system. Compliance activities are being undertaken according to the Tax Office’s risk-based strategy following the recent increase in coverage, general administration of the PRRT is sound, and governance arrangements are suitable (ANAO, 2009, p. 14).
The administration of the PRRT is concentrated on the small group of taxpayers involved in the petroleum extraction industry. Returns are only required to be lodged once a project starts receiving assessable receipts. In its submission the ATO provided information on 2015-16 lodgements. The PRRT population consists of 54 economic groups and 145 taxpayers, lodging returns in relation to 62 projects.
Table B.2 — Companies lodging PRRT returns
2013-14 2014-15 2015-16PRRT returns 148 149 148Lodging projects 60 62 62Lodging economic groups 54 52 54Entities with a PRRT liability 12 12 Not yet publishedProjects with a PRRT liability 9 8 6
Source: ATO Submission, p. 10.
Page 157

Transparency data from the 2013-14 and 2014-15 PRRT years published on data.gov.au as part of the ATO’s annual Report on entity tax information shows the names of the 12 entities who paid in each year and the amounts they paid.
Table B.3 —Companies paying PRRT Name ABN PRRT Payable
2013-14 $ 2014-15 $AWE (OFFSHORE PB) PTY LTD 29008988930 5,315,502 1,290,297AWE OIL (WESTERN AUSTRALIA) PTY LTD 32008939080 5,358,875BHP BILLITON PETROLEUM (AUSTRALIA) PTY. LTD. 39006923879 381,369,378 340,737,757BHP BILLITON PETROLEUM (BASS STRAIT) PTY. LTD. 29004228004 559,866,686 293,921,172BHP BILLITON PETROLEUM (VICTORIA) PTY. LTD. 12006466486 26,555,124 28,110,468ESSO AUSTRALIA RESOURCES PTY LTD 62091829819 538,485,033 265,070,131MITSUI E&P AUSTRALIA PTY LTD 45108437529 63,010,702 82,422,986PEEDAMULLAH PETROLEUM PTY LTD 17009363820 5,508,558 211,763QUADRANT PVG PTY LTD 51129604860 114,654,288ROC OIL (WA) PTY LIMITED 83083143382 10,493,858 3,727,953TALISMAN OIL & GAS (AUSTRALIA) PTY LIMITED 77111708868 9,099,656 3,471,458VERMILION OIL & GAS AUSTRALIA PTY LTD 29113023591 75,117,597 36,801,589WOODSIDE ENERGY LTD. 63005482986 85,795,767 31,087,035
Source: data.gov.au, corporate tax transparency.
Although there were 13 separate entities that paid PRRT, these entities are concentrated in nine economic groups across six projects. Two economic groups paid the majority of the PRRT across those two years. Of the 24 payments made across the two year period eight, or one third, were under $10 million.
BHP Billiton state in their submission ‘The Bass Strait operation is the largest payer of PRRT in Australia and has been paying PRRT since 1990 (BHP Billiton Submission, p.11)’. If this claim is accurate it would serve to further highlight the concentrated nature of the PRRT risk.
In summary, compared to other taxes that the ATO administers, there are a relatively small number of economic groups with assessable PRRT receipts, spread across a small number of projects. There are an even smaller number of PRRT projects close to or in a profitable phase at any point in time. As a result, the compliance risks for the ATO are concentrated in a relatively small number of taxpayers.
A feature of the way the oil and gas industry operates in Australia is that projects are often shared between industry participants that operate through joint venture arrangements with one of the project participants taking on the role of project operator. The operator directly or through a service entity incurs the majority of the operating costs of the project, with each project participant paying their share of the costs. As a result, although there may be multiple participants in the project, the majority of the ATO’s assurance and compliance activity can be done with the project operator. Since the expenditure incurred by the operator will often represent the bulk of the project expenditure, the ATO is able to use the work done in relation to the project operator to compare claims and assure expenditure in the other joint venturers’ returns.
The ATO’s approach to providing the community with an assurance that oil and gas projects are paying the right amount of PRRT on their activities in Australia is a risk based approach. As outlined earlier, the number of taxpayers that are
Page 158

involved in profitable or close to profitable projects is relatively small and the ATO is able to risk assess each one.
The way that the ATO conducts this risk assessment is through the use of a ‘risk-differentiation framework’ (RDF) which the ATO uses to classify taxpayers based on the economic consequence of non-compliance and the likelihood of non-compliance. The application of the RDF to the PRRT population has resulted in seven economic groups being classified as ‘key taxpayers’ for PRRT purposes in 2015-16. Key taxpayers are those who have a higher economic consequence of non-compliance and a lower likelihood of non-compliance.
The ATO has a higher level of ongoing engagement with key taxpayers and takes a closer interest in their risk management and governance frameworks. The ATO also expects key taxpayers to fully disclose potentially contestable matters as they arise. In addition, the ATO’s compliance strategy with key taxpayers encourages early engagement on matters prior to lodgement. Two examples of more formal arrangements for early engagement are the annual compliance arrangements (ACA) and APAs.
The Woodside submission outlined the following benefits of entering an ACA:
In 2013, Woodside voluntarily entered into an Annual Compliance Arrangement (ACA) with the ATO, covering both income tax and PRRT. Through the ACA framework the ATO and Woodside can discuss tax matters in an open and transparent manner (Woodside Submission, p. 5).
The ATO also uses a range of post-lodgement compliance activities to assess whether tax risks arise from a taxpayer’s self-assessment including reviews and audits. These approaches along with data analysis on returns and taxpayer statements are used across the PRRT population.
A key role of the ATO is providing guidance to provide certainty to taxpayers about how the PRRT operates. Taxpayers can then make informed decisions about how the PRRT applies to their particular circumstances and better manage their PRRT risks.
An important way the ATO provides guidance to taxpayers is by publishing public rulings and practical compliance guidelines on the ATO legal database. Public rulings are binding on the ATO and provide certainty to taxpayers by providing the ATO view on interpretative issues. While practical compliance guidelines outline how the ATO will administer a certain area of the law and how the ATO will assess the tax compliance risks for particular types of activities or arrangements. They may also set out a practical compliance solution where tax laws create a heavy administrative or compliance burden, or where a tax might be uncertain in its application. The ATO also maintains guidance material on its website which is designed to address key topics that existing and potential PRRT taxpayers need to know.
Litigation is also used by the ATO to provide certainty to the industry on contentious interpretative issues. In recent years there have been a number of court cases which have provided certainty on a number of longstanding PRRT interpretative issues. For example, historically there has been considerable uncertainty whether the meaning of exploration for PRRT is similar to the meaning of exploration used for income tax purposes, which relies on a statutory
Page 159
definition that specifically includes feasibility studies. This uncertainty was resolved by ZZGN v Commissioner of Taxation [2013] AATA 351 which held that the PRRT meaning of exploration is the ordinary meaning of exploration. The ordinary meaning of exploration is limited to the discovery and identification of the existence, extent and nature of hydrocarbons or petroleum pools and includes searching in order to discover the resource, as well as the process of ascertaining the size of the discovery and appraising its physical characteristics. Importantly, it held the PRRT meaning of exploration does not include economic feasibility studies to determine whether it is commercially viable to develop a petroleum field.
Following the ZZGN decision, the ATO published Taxation Ruling TR 2014/9 which clarified the ATO view on the meaning of exploration which is consistent with the ZZGN decision. Since the ATO had an approach contrary to the views in TR 2014/9 of accepting that a wider range of feasibility expenditure fell within the PRRT meaning of exploration, the ATO did not seek to disturb exploration claims for expenditure incurred on or before 21 August 2013 where taxpayers have self-assessed on the basis that exploration for petroleum includes expenditure which is directed at making a full assessment or evaluation of the commercial or economic viability of an entire project to develop a petroleum pool, including how best to develop the pool as part of that assessment or evaluation.
In Esso Australia Resources Pty Ltd v Commissioner of Taxation [2012] FCAFC 5, the Full Federal Court made the important observation that the PRRT is significantly different to income tax. It said it was a deliberate design feature of the PRRT that only expenditure that has a close or direct connection to the project will be deductible, as opposed to the ‘necessarily incurred’ test used for income tax purposes which is a wider test for deductibility.
Technical amendments were made to the PRRT after the Esso Decision to clarify that PRRT taxpayers are required to apply a look-through approach for payments to related contractors to procure project services. This was seen as an important integrity measure to ensure that ‘excluded costs’ and related party profit margins are not taken into account in working out the deduction available to the PRRT taxpayer.
After the Esso decision the ATO published two practical compliance guidelines (PCG 2016/12 & PCG 2016/13) that are designed to assist taxpayers to comply with the deductible expenditure provisions and the excluded expenditure provisions in the PRRT. They broadly outline the types of expenditure the ATO considers to be low risk (so will not generally devote compliance resources to review) as well as those types of expenditure the ATO considers to be high risk and is more likely to review.
The Full Federal Court in Esso v Commissioner of Taxation [2011] FCA 154 clarified the ‘taxing point’ for PRRT is the point at which a MPC is separated from the process of production and is capable of being sold or moved or stored as a finished product. In reaching this conclusion the Court rejected the PRRT taxpayer’s argument that the taxing point should be taken at the point at which the substance extracted first meets the specified chemical composition of an MPC (for example sales gas), rather than the point at which processing is complete and the product is in its intended final form.
Page 160

Private Rulings are another mechanism that can be used by PRRT taxpayers to get certainty on their individual taxation arrangements. According to the ATO submission only four taxpayers have requested a private ruling application in respect of their PRRT issues over the last two years (ATO Submission, p. 17).
The ATO actively engages with industry and the tax profession on existing and emerging PRRT issues. The peak body for industry engagement is the Energy & Resources Working Group which is chaired by the Deputy Commissioner PG&I — Public Groups. The Working Group comprises of members from industry, resource associations and the tax profession. The group was established to assist the ATO to identify and address administrative and technical issues affecting the mining industry. The ATO also engages with APPEA on a quarterly basis to identify and resolve significant technical and administrative issues affecting the petroleum industry.
The ATO is currently consulting with the industry to develop guidance to provide certainty on the following emerging issues:
• the scope of the closing down provisions in the PRRT;
• whether payments for social infrastructure costs, such as roads and hospitals, which are part of the project’s social licence to operate, are deductible under the PRRT; and
• the application of the PRRT to FLNG as this new technology places a greater emphasis on the apportionment principles in the PRRT as both upstream and downstream activities are performed on the vessel.
Page 161
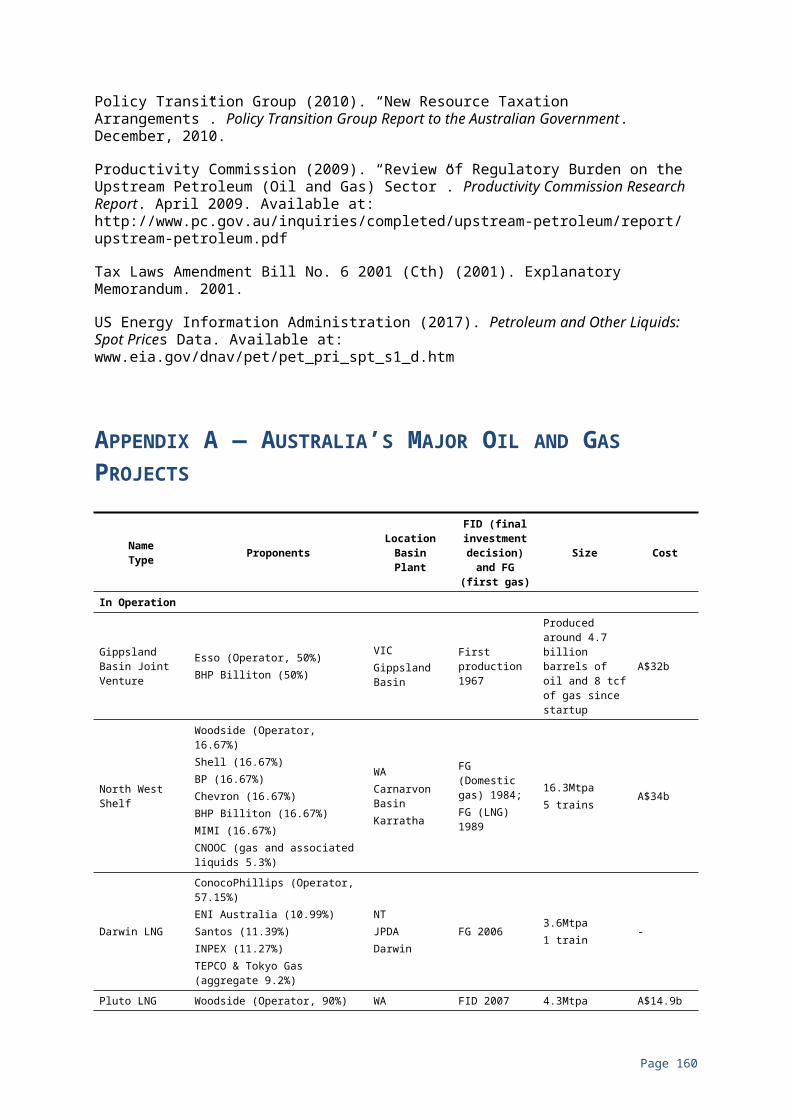
APPENDIX C — TIMELINE OF PRRT AMENDMENTS
Year Amendment
1991
In 1991 exploration expenditure deductibility was widened from a project to a company wide basis.This enables undeducted exploration expenditure incurred after 1 July 1990 to be transferred to other projects with a taxable profit held by the same entity. In the case of a company in a wholly owned company group, the expenditure is also transferable to other PRRT liable projects held in the group.
2001
In October 2001 legislative amendments allowed the Commissioner of Taxation to apply a gas transfer price formula in the absence of an arm’s length price for sales gas used as feedstock in an integrated LNG project.The reference date for the five year rule applying to expenditure uplifts was changed to refer to the date nominated in a ‘Statement of Receipt’ issued when all information pertinent to the application for a production licence is supplied to the ‘Designated Authority’.
2003
In October 2003 legislative amendments removed an inconsistency in relation to tolling fees.In a tolling situation, the property of one project, such as the platform or processing facilities, may be partially used to produce its own petroleum and partially used to process petroleum sourced from third party projects. The amendments ensure that all partial usage situations are treated the same way and do not impact on efficient commercial arrangements. The amendments also ensure that double taxation, black hole expenditures or understatement of net assessable receipts do not affect government or industry.
2004
In May 2004 the Government introduced a measure to encourage petroleum exploration in remote offshore areas.This involves an uplift of 150 per cent on PRRT deductions for exploration expenditure incurred in designated offshore frontier areas. The measure applies to pre-appraisal exploration expenditure in the initial term of the exploration permit granted for a designated area. This measure applies up to 30 June 2008.
Page 162
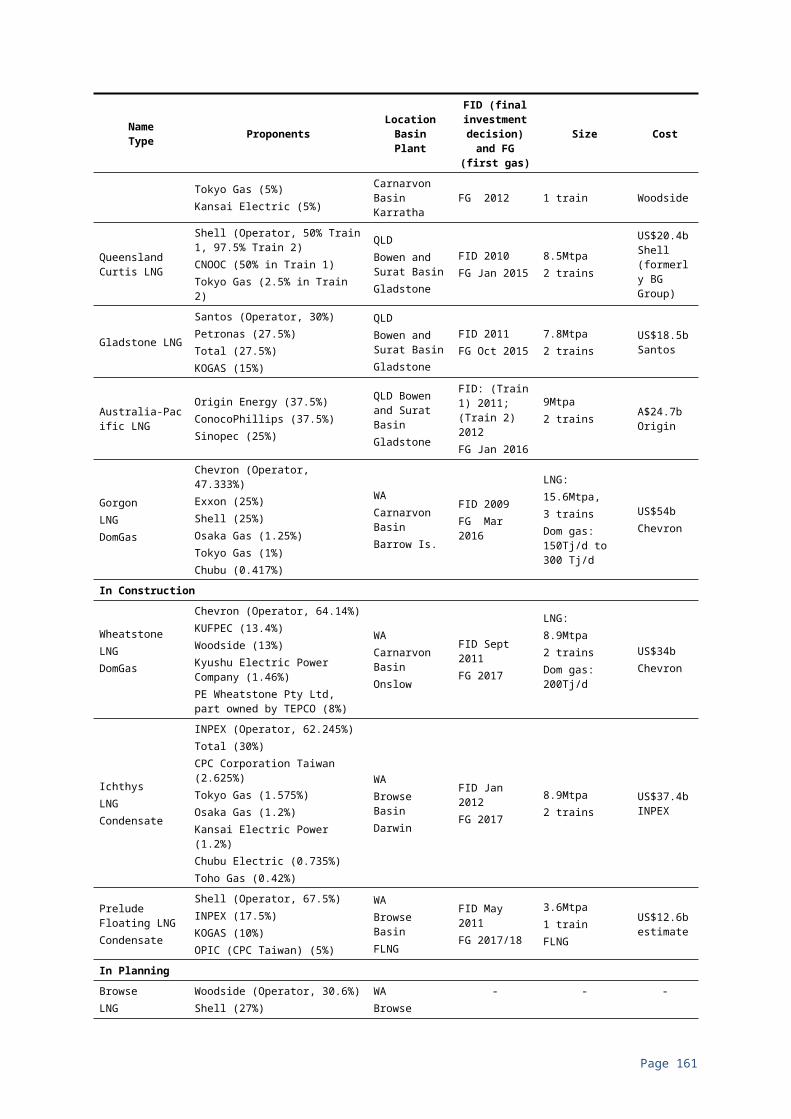
Year Amendment
2005
In 2005 the Government introduced the Gas Transfer Pricing regulations.The objective of the regulations is to provide a framework to determine the price for gas in the case of an integrated LNG project. The framework enables a PRRT liability to be calculated in the upstream component of an integrated LNG project where there is no arm’s length price or comparable uncontrolled price. These regulations allow for a gas transfer price to be determined by the Commissioner of Taxation either by an advanced pricing arrangement agreed with the PRRT taxpayer, a comparable uncontrolled price, or by a Residual Pricing Mechanism. The regulations took effect from 20 December 2005.
2005
In May 2005, the Government announced further policy changes to the PRRT designed to reduce compliance costs, improve administration and remove inconsistencies in the PRRT regime. These changes, which became effective from 1 July 2006, included:
• allowing deduction of transferable exploration expenditure when calculating quarterly instalments and of fringe benefits tax for PRRT purposes;
• allowing deduction of closing down costs when moving from a production to an infrastructure licence;
• the PRRT in the self-assessment regime;
• providing roll-over relief for internal corporate restructuring;
• introducing a transfer notice requirement for vendors disposing of an interest in a petroleum project; and
• extending the lodgement period for PRRT annual returns from 42 to 60 days.
Page 163

Year Amendment
2007
The Government announced in the 2007–08 Budget on 8 May 2007 three policy changes to the PRRT that aim to lower compliance costs and remove inconsistencies. These measures, which are planned to commence from 1 July 2008, will include:
• a functional currency rule built into the PRRT, similar to that under income tax, which will allow oil and gas producers to elect to work out their PRRT position in a foreign currency;
• the introduction of a ‘look back’ rule for exploration expenditure, ensuring that all exploration expenditure is deductible for PRRT purposes where a production licence is derived from a retention lease on or after 1 July 2008; and
• addressing overlap between two petroleum projects—so that where a petroleum project processes petroleum sourced from another petroleum project for a tolling fee, the tolling fee received will be treated as a PRRT receipt, and the expenses incurred will be treated as a PRRT deduction.
2010On 2 July 2010, the Government announced that from 1 July 2012, the PRRT would be extended to include all onshore and offshore oil and gas projects, including the North West Shelf (NWS), oil shale projects and coal seam gas projects.
2012On 1 July 2012, the PRRT extension to onshore oil and gas projects, including the NWS, oil shale projects and coal seam gas projects, came into effect.
2015The Gas Transfer Pricing regulations were remade in 2015, with some minor changes to modernise the drafting style, reduce compliance costs for industry and to ensure that the regulations are fit for purpose.
Source: Department of Industry, Innovation and Science and Petroleum Resource Rent Tax Review Secretariat.
Page 164
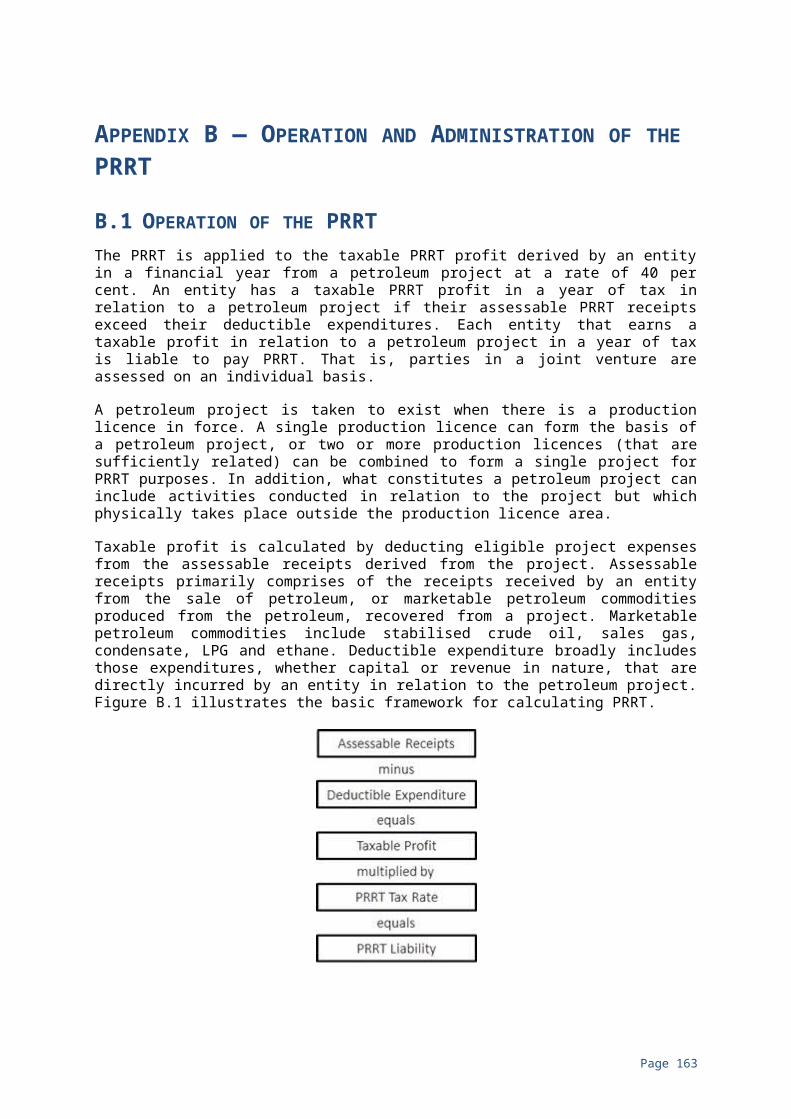
APPENDIX D — GAS TRANSFER PRICING
Appendix B.1.8 provides background on the GTP regulations for determining an arm’s length price for PRRT purposes of sales gas used in integrated LNG processing. Analysis of the GTP regulations first requires an understanding of why and how they were developed.
D.1 DEVELOPMENT OF THE GAS TRANSFER PRICING REGULATIONSAfter the discovery of significant gas fields in Commonwealth waters in North West Australia, oil and gas companies commenced planning integrated gas liquefaction projects using natural gas as feedstock. These new projects would be subject to the PRRT, unlike the NWS project which has been exporting LNG since 1989. Uncertainty arose for the industry and the Government as to how the PRRT would apply to these projects because the coverage of the PRRT includes the production of natural gas but does not include the conversion of natural gas to other products like electricity or LNG. This uncertainty arose in part because the gas fields under development consideration were a long way from any commercial market. The gas fields were considered uneconomical to exploit without the liquefaction process allowing transportation and access to markets and the PRRT taxing point (the point at which a taxable product first becomes marketable) occurs part way through the integrated project. This results in difficulty establishing the value of the gas at the PRRT taxing point, leading to the issue of how to establish a price for the gas at that point.
The value of the gas at the taxing point determines how much economic rent associated with the integrated project is attributed to the ‘upstream’ gas resource and subject to PRRT and how much is attributed to the ‘downstream’ LNG processing. In the late 1990s the Government consulted with the industry on how to equitably apportion the rents between the PRRT ring fence and the liquefaction processing phase. The price that would be established at the PRRT taxing point was to be known as the gas transfer price. The aim of the transfer price was to reflect a price that would be arrived at in arm’s length commercial negotiations.
On 23 December 1998 the then Treasurer and Minister for Industry, Science and Resources announced that a ‘residual price method’ or RPM would form the basis of the transfer price. This method was only to apply where no comparable commercially negotiated arm’s length price was available. The Taxation Laws Amendment Act (No. 6) 2001 amended the PRRT legislation to enable a framework or methodology to establish the gas transfer price to be incorporated in regulations.
A set of principles were developed in consultation between the Government and the industry to provide a framework for developing the regulations. The principles included:
• only upstream activities are liable for PRRT;
• outcomes should be assessed against economic efficiency criteria;
Page 165
• GTP methodology to apply to all integrated GTL projects;
• project risks equitably reflected on all cost centres;
• the transfer price references the first commercial third party price for derivative products; and
• the transfer price is to be transparent, equitable, auditable and simple to administer.
The GTP regulations were enacted in 2005. The explanatory material accompanying the regulations set out the intent of the regulations:
The RPM incorporates netback and cost-plus calculations to value the gas as defined by the Regulations. The cost-plus price is the price the upstream stage of an integrated GTL operation would sell its sales gas for in order to cover its upstream costs. The netback price is the price paid for sales gas that allows the downstream stage of the integrated GTL operation to cover its costs, given the price obtained for its project liquid. In both cases, the calculations allow for a rate of return on capital costs incurred (Explanatory Statement, Select Legislative Instrument 2005 No 329, p. ii.).
The regulations were remade in 2015 as they were subject to sunset provisions. Changes were made to the drafting style and to fit in with current industry practices.
The decision to implement the GTP regulations and adopt the RPM reflects deliberate policy decisions to:
• maintain the approach of taxing sales gas as the MPC rather than apply the PRRT to the whole LNG project;
• use transfer pricing principles rather than market valuation principles to establish the price of the sales gas at the taxing point inside an integrated operation;
• adopt a profit split methodology as the most appropriate way to value the relative contributions of the upstream and downstream components of the project; and
• split the residual profits of the integrated operation equally between the upstream and downstream components.
D.2 USE OF THE GAS TRANSFER PRICING REGULATIONSThe GTP regulations only apply to PRRT projects using gas in integrated LNG projects, also known as GTL projects, or gas to electricity projects where an arm’s length price needs to be established for the sales gas at the PRRT taxing point. Several submissions expressed concerns regarding the application of the GTP methodology to Australia’s expanding LNG production.
One submission drew a link between the decline in PRRT revenue and the introduction of the GTP regulations:
Page 166
… as Australia’s hydrocarbon output has become more weighted towards gas, PRRT revenue has fallen. This may reflect the working of the prevailing gas price methodology used to calculate the taxing point on gas used for LNG projects (Institute for Sustainable Futures Submission, p. 1).
When the GTP regulations were introduced, there were no LNG projects subject to the PRRT regime. For many years the only Australian LNG project was the NWS project which was initially outside the PRRT regime and subject to separate taxation arrangements. In 2006 Australia’s second LNG project, Darwin LNG, commenced operations using gas from the Bayu-Undan field in the JPDA. The JPDA is subject to other taxation arrangements and is not subject to the PRRT.
The first LNG project subject to the PRRT regime, and potentially subject to the GTP regulations, was the Pluto project which commenced operations in April 2012. The NWS project became subject to the PRRT regime on 1 July 2012. The LNG projects using onshore gas came online and made their first shipments in January 2015 (QCLNG), October 2015 (GLNG) and January 2016 (Australia Pacific LNG). The Gorgon project commenced shipping LNG in March 2016. A table of new Australian LNG projects with actual and estimated first production dates is set out in section 1.3.2.
Gas being sold to the domestic market does not use a gas transfer price. The onshore and NWS gas projects pay royalties and/or excise on gas production and, though they use the GTP regulations where they are using their own or related party gas for LNG production, the PRRT remains secondary to their existing royalty and/or excise based resource taxation arrangements. The GTP regulations have only applied to two projects within the PRRT regime that are not subject to other resource tax arrangements: Pluto (since 2012) and Gorgon (since 2016).
Against these considerations, no link can be made between the GTP regulations and the decline in PRRT revenue. The reasons for decline in PRRT revenue are discussed in section 2.3.1.
Other offshore LNG projects that will be subject to the PRRT that are yet to come online include Ichthys, Wheatstone and Prelude. The GTP regulations will apply to all of these projects, and the planning for each of these projects has been based on the GTP regulations as they are currently designed.
D.3 EXTENDING THE PRRT TO SECONDARY ACTIVITIESThe existing PRRT design is for a project-based tax with a taxing point at the point that petroleum resources are first processed into a form which can be sold (MPC). It separates treatment processes that are integral to production and initial onsite storage from those where the community has no proprietary interest. The second reading speech introducing the PRRT explained that:
‘In broad terms, a petroleum project incorporates the production licence area, and such treatment and other facilities and operations outside that area as are integral to the production of marketable petroleum commodities such as stabilised crude oil, condensate and liquefied petroleum gas’ The Hon Chris Hurford MP (Parliament of Australia, 1986, p. 3942).
Identified marketable commodities are contrasted with those that result from refining or other activities that augment the physical or chemical makeup of the
Page 167
sales gas in an integrated operation. Sales gas was one of the products identified as an MPC at the beginning of the PRRT regime. The definition of MPC also excluded any product produced from an MPC. From the outset, PRRT sales gas was identified as taxable but other products produced by the processing of sales gas were not.
It is consistent with the original design of the PRRT for the taxing point to be at the point where the petroleum is processed to sales gas rather than at the end of the whole LNG operation. Nevertheless, some submissions supported a fundamental change to the PRRT where the PPRT ring fence would be extended to a point of sale or export:
… it may be debateable why the conversion of gas into liquid form so that it can be transported (it being uneconomic to build pipelines to Australia’s major markets) renders it an excluded commodity (Professor John Chandler submission, p. 6).
The Prosper Australia submission noted that the preferred way to apply PRRT to LNG projects would be to:
… include LNG as a marketable petroleum commodity (MPC) under the PRRT, which would then apply to the integrated project. This would avoid any splitting of economic rents between the resource extraction and the downstream processing, which can (and does) happen in the calculation of the shadow price of the MPC. This is a first-best option and captures the full resource rent as the tax base in these cases (Prosper Australia submission, p. 12).
Moving the taxing point to the end of the liquefaction process would lessen the complexity of the PRRT regime by removing the need for the arm’s length price and the accompanying complex GTP regulations. This would make determining the assessable PRRT receipts in the project simpler but could introduce extra demands regarding the determination of what constitutes deductible expenditure as extra downstream costs are included in the PRRT ring fence.
Extra assessable PRRT receipts would also flow from the inclusion of the LNG price in the PRRT ring fence. Moving the entire LNG plant inside the PRRT ring fence would increase the exposure of any ‘firm-specific rents’ to be taxed by the PRRT and would extend the scope of the PRRT. Such a change would mean that the secondary tax on petroleum was being extended from a tax on the resource rents to a tax on the rents of the entire integrated operation.
The Business Council of Australia’s submission highlights these points and in particular argued that:
The design of the PRRT may also capture firm-specific rents, such as returns to know-how and expertise, which is not the intention of the tax (Business Council of Australia submission, p. 9).
D.4 DETERMINING THE VALUE OF SALES GASThe Tax Justice Network Australia submission raises issues with the use of transfer pricing approaches to determine the price at the taxing point:
Page 168

Given that these projects are vertically integrated and taxed at a point when the value is transferred from one related party to another, there are huge potential problems with transfer pricing and undervaluation of the taxable gas. It is very likely that the current means of pricing at the wellhead are inadequate and need to be reformed. The gas pricing is a highly technical and complex issue and we encourage the PRRT Review Team to look at this critical issue and explore best practices both in Australia and globally (Tax Justice Network Australia submission, p. 3-4).
If the taxing point is positioned part way through the vertically integrated project then a value for the gas needs to be determined at that point. In general, if the approach to resource taxation uses a valuation of the resource at a different point (for example ‘at the wellhead’) than the point of sale, then it has to use a mechanism to calculate that price. This applies regardless of whether the resource taxation method is a royalty or a rent tax. Prior to 2001, the PRRT relied on the concept of market value to decide the price at the taxing point. The concept of market valuation has caused many difficulties in tax administration29
and causes particular difficulties where there is no observable market for the transaction that is being valued. In market valuation, like in transfer pricing approaches generally, there are a range of different valuation methods available, many of which rely on a series of assumptions and forecasts.
The decision in 2001 to rely on the arm’s length principle that is used primarily for international dealings between related parties where there is no observable market was taken to increase certainty and provide clear guidance on the appropriate way to calculate the price of the sales gas. This is confirmed by the explanatory materials accompanying the introduction of the arm’s length principle for LNG processing:
The current (pre-GTP) regime (through disputations and court actions), may produce a taxable value for the gas not dissimilar to a GTP calculated using a methodology. However, the proposed regime provides certainty on the manner in which a taxing value is to be determined (Explanatory Memorandum, Tax Laws Amendment Bill No. 6 2001 (Cth), p. 19).
The ExxonMobil Australia submission highlights the value to the industry of clear guidelines for calculating the price:
Absent these rules, the parties would fall back to the general PRRT provisions that require a taxpayer to return the market value of a Marketable Petroleum Commodity that becomes an excluded commodity without being sold at the point immediately before it becomes an excluded commodity. There would be no increased transparency from this — but likely, increased disputation and increased risk for project proponents for new LNG projects, with little, if any additional tax being paid (ExxonMobil Australia submission, p. 5-6).
The use of the arm’s length test and transfer pricing principles is consistent with the underlying design of the PRRT and is an appropriate way to determine the value of the sales gas at the taxing point. The use of the arm’s length test and the transfer pricing principles has clear advantages over a market value test.
29 See for example the Inspector General Taxation Review into the ATO’s administration of valuation matters, 19 January 2015.
Page 169

D.5 TRANSPARENCY OF GAS TRANSFER PRICINGSome submissions and public commentary have called for greater transparency in relation to how the gas transfer price is calculated.
To further increase the transparency of the PRRT, the value and calculation method of wellhead gas should also be made public, and should be re-evaluated to ensure the Australian people are paid a fair price for their natural resources. These prices are calculated behind closed-doors and there is no market to which to compare these (Australian Council of Trade Unions submission, p. 2).
Advance Pricing Arrangements should be made transparent to the public, much like the Australian Tax Office ‘sanitised’ private rulings or interpretive decisions (Dr Diane Kraal submission, p. 2).
The large accounting firms interpret the [gas transfer price methodology] for their clients’ integrated gas to liquids projects, but the workings are not available for community scrutiny (Kraal, 2016).
In its submission, the ATO states that:
The details of how each taxpayer may have applied the Regulation to their particular circumstances are not publicly disclosed by the ATO due to the secrecy and privacy provisions contained in the Taxation Administration Act 1953, which makes it an offence for taxation officers to disclose such information except in specified circumstances. However, the ATO has adopted a mix of strategies including risk reviews, audits, ACAs, APAs and guidance to assist and monitor taxpayer compliance with the requirements of the Regulation (ATO submission, p. 20).
Existing transparency provisions in relation the PRRT do not extend to information about how the gas transfer price is calculated. The information used to calculate an RPM price uses information about contractual arrangements and internal costs that would usually be ‘commercial in confidence’ information.
Transparency around gas transfer price calculations or publishing APA arrangements (see Appendix B.1.8) would result in commercially sensitive information being made public. Such information could potentially be damaging to the commercial interests of the entities and could affect market negotiations because of access to the information. This could result in outcomes that do not reflect market realities and potentially impact the amount of assessable PRRT receipts within the PRRT ring fence.
When the GTP regulations were adopted one of the justifications was that the resulting methodology and assumptions would be more transparent and provide a consistent approach for these calculations across industry:
The introduction of a clearly defined mechanism for the determination of a GTP will provide increased regulatory transparency for industry involved, or planning on being involved, in GTL operations in Australia. The implementation of a mechanism will provide industry with greater certainty with regard to GTL projects, assisting them in assessing the viability of
Page 170

proposed projects (Explanatory Memorandum, Tax Laws Amendment Bill No. 6 2001 (Cth), p. 18).
The GTP regulations were considered more transparent than alternative options.
D.6 THE OPTIONS FOR DETERMINING THE TRANSFER PRICE Once it was established that the preferred method to calculate the price of the sales gas in an integrated operation was using the arm’s length test, a decision had to be made about the transfer pricing approaches that would be appropriate for measuring the value contributed by different parts of an integrated operation.
The explanatory materials accompanying both the legislation and the regulations introducing the GTP referred to a process involving extensive consultations with industry, the involvement of an expert consultant and a public consultation process prior to the existing GTP arrangements being enacted.
Key to the development of the methodology was the need to balance the respective contributions of the upstream and downstream parts of the integrated project. Once the principles for establishing GTP were designed and agreed (section D.1), the process then involved examining the various transfer pricing methodologies commonly used in international transfer pricing and in calculating wellhead value in resource taxation.
It is generally considered that the best proxy for an arm’s length price is using a CUP but it is often difficult in practice to find an uncontrolled price suitable for comparison either directly or with reasonable adjustments. At the time of the development of the regulations there was no competitive market in Australia for the LNG feedstock gas which meant that a CUP was not likely to be available. Despite this, reflecting the advantages of establishing a suitable CUP, the option of determining a CUP was included in the regulations and the power to determine whether a CUP exists was given to the Commissioner of Taxation.
In transfer pricing practice it is commonly the most appropriate method for the particular circumstances that is used to determine the arm’s length price. While the GTP regulations specify the RPM as the default mechanism for determining the transfer price, the regulations allow the taxpayer and the Commissioner to agree on the most appropriate methodology for calculating the price for a particular LNG project. These methodologies include APAs which are reviewed annually and involve significant upfront negotiations and costs but provide a greater level of certainty to the taxpayer.
The ATO submission outlined the circumstances in which the ATO would enter into an APA:
The ATO may enter into APAs with operators and participants of petroleum projects in order to determine, in advance of controlled transactions, an appropriate set of criteria for the determination of the transfer pricing of those transactions over a fixed period of time. Parties enter into APAs for various reasons but primarily to mitigate risk. Once entered, an APA is reviewed by the ATO to ensure the conditions (described as ‘critical assumptions’) listed in the APA have not been breached, and the terms of the APA have been met (ATO submission, p. 15).
Page 171

In practice it seems likely that taxpayers would seek an APA if they are unhappy with the transfer price outcome of the default RPM or their circumstances made the RPM difficult to apply, or if they valued the additional certainty of an APA. One way that an APA could operate in practice could be to modify the RPM to make it work in the practical circumstances of the PRRT projects covered by the APA.
Dr Diane Kraal has raised concerns with the GTP regulations, particularly with the RPM:
The Gas Transfer Price method is flawed, as shown by case study modelling. There are alternatives, such as the use of the ‘mid-stream breakeven price’ method, or the ‘Net Back’ method alone, either of which would derive a fairer price (Dr Diane Kraal submission, p. 2).
Common approaches for determining a gas transfer price around the world where a CUP is not available include a cost-plus approach, and a netback approach. The cost-plus looks at the cost of upstream operations, a netback looks at the costs of the downstream operations. Each of these methods commonly allows a return to the side of the operation it is measuring but allocates profits of the project in excess of the allocated return to the other side of the operation. A cost-plus method would allocate project rents in excess of the mandated return to the downstream, while a netback allocates project rents in excess of the mandated return to the upstream. It is only by measuring the contribution of each side of the operation that the profits can be determined and split.
The ‘mid-stream breakeven price’30 refers to the minimum cost required to operate the LNG plant and may also include costs of LNG transport, storage, marketing and selling and is commonly also calculated using a netback-style approach.
An issue with all transfer pricing methodologies, including netback approaches, is that the underlying assumptions and the particular way they are designed govern how the price is determined. No one netback is necessarily the same as any other and the underlying assumptions in a netback methodology can impact the outcome. Examples include how the project risks borne by the different components of the downstream operation are taken into account; the way that a return on capital is calculated on assets used; and the value of the functions undertaken and the method for attributing profits. Methodologies focused solely on one side of an integrated operation can also lead to distortions because increased profits from technological and process improvements that reduce capital and operating costs are at risk of being allocated to the other side of the operation.
Transfer pricing methodologies designed to capture the rents of the whole project rather than sharing them between the upstream and downstream operations would be a departure from the rationale of the PRRT to only capture upstream rents. The RPM was developed as an approach that balanced the need for a
30 Mid-stream is a term less commonly used in Australia than other parts of the world to describe the component of the oil and gas value chain between the upstream and downstream phases. The mid-stream typically includes petroleum processing, storage, wholesale marketing and transport. In the Australian LNG context, the mid-stream could encompass the liquefaction, transport and regasification of natural gas and associated activities.
Page 172

transparent ‘one size fits all’ approach that fulfilled the principle that only upstream activities are liable for PRRT. The RPM is a bespoke transfer pricing methodology, based on a residual analysis, designed to find a balance between the various principles set out to guide the development of the transfer pricing approach.
The OECD defines a residual analysis as:
An analysis used in the profit split method which divides the combined profit from the controlled transactions under examination in two stages. In the first stage, each participant is allocated sufficient profit to provide it with a basic return appropriate for the type of transactions in which it is engaged. Ordinarily this basic return would be determined by reference to the market returns achieved for similar types of transactions by independent enterprises. Thus, the basic return would generally not account for the return that would be generated by any unique and valuable assets possessed by the participants. In the second stage, any residual profit (or loss) remaining after the first stage division would be allocated among the parties based on an analysis of the facts and circumstances that might indicate how this residual would have been divided between independent enterprises (OECD, 2010, p. 29).
In broad terms, in the PRRT context, residual profit determined by the RPM is the excess profit above the ‘basic’ (or mandated) return on costs employed, which excludes the intrinsic value of the petroleum resource.
D.7 THE RPMOperation of the RPM
Recognising that there are contributions to the residual profit from both the upstream and downstream petroleum operations, the RPM splits the residual profit (or rent) equally between that determined by the cost-plus and netback measures. The result is that the RPM price is the average of the netback and cost-plus prices in cases where there is a residual profit. The justification for the equal split is that:
Although the application of the netback and cost-plus formula define the residual profit in a project, no theoretical basis exists for determining how the residual profit should be split between the netback and cost-plus prices to arrive at a single price. Consequently, the RPM splits this differential equally. This split reflects the integrated and interdependent nature of an integrated GTL operation. It is also the most appropriate and equitable solution to split the difference between the netback price and the cost-plus price to arrive at the project’s gas transfer price (Explanatory Statement, Select Legislative Instrument 2005 No 329, p. iii.)
The RPM model measures the residual profits of the integrated operation as the amount of profit in the operation that results from a price set as the average of the cost-plus and netback prices. The netback price allocates upstream, all profit above a mandated or ‘basic’ return on downstream costs. The cost-plus price allocates upstream no profit that is above the same mandated return on upstream costs. This means the RPM measures overall residual profit, cuts it in half and allocates half upstream.
Page 173

AFTS made the following observation on the RPM:
The PRRT may also fail to collect the appropriate share of rents when the gas transfer pricing regulations are applied. The regulations provide a framework for determining the price for gas in the case of an integrated gas to liquids project and include a residual pricing method. Essentially, the residual pricing method applies an arbitrary cost of capital allowance uplift (long term bond rate plus 7 percentage points) and splits in half the rents associated with the integrated process between the upstream and downstream processes (Australia’s Future Tax System Review, 2010, p. 227).
The residual profits representing the return in excess of the fixed return to capital in the RPM would be attributable to any assets not recognised in the RPM, particularly the return on the inherent value of the petroleum resource. The explanatory statement for the 2005 version of the regulations recognises that other factors may also contribute to the residual profit:
Factors contributing to the residual profit for a project include intellectual property and know how related to gas production, process and marketing (Explanatory Statement, Select Legislative Instrument 2005 No 329, p. iii.)
The justification that the residual profit split should be equally apportioned is on the ground that it is a reasonable approximation of how independent parties would split the profit. The 2010 OECD Transfer Pricing Guidelines discuss the use of ‘allocation keys’ to divide profits and further guidance is being considered by the OECD as part of revisions to the Transfer Pricing Guidelines. Given such developments, it would be timely to review the way in which the profits are split under RPM to determine whether it aligns with international best practice.
In practice, a netback price (the price underlying overall return of the integrated operation above mandated return on downstream costs) that is higher than the cost-plus price (the price underlying mandated return on upstream costs) implies that there are profits in the operation beyond those required to cover overall operating costs and repay capital. Where the cost-plus price exceeds the netback price it implies that the operation is not covering its costs and is not profitable. In these circumstances there is no residual profit or rents in the project.
Asymmetries in the RPM
In situations where the cost-plus price is greater than the netback price and the RPM shows a loss rather than a residual profit, the GTP regulations state that the ‘the gas transfer price is equal to the netback price and the loss is taken by the upstream part of the project (Explanatory Statement, Select Legislative Instrument 2005 No 329, p. iii.)’. For example, if an LNG producer used the RPM and worked out that the netback price was $6 per unit, and the cost-plus price was $4 per unit, the RPM price would be $5 per unit. If, however, the netback price was $4 per unit and the cost-plus price was $6 per unit, the RPM price would be $4 per unit because the cost-plus price was higher than the netback price.
The result is asymmetric treatment of profits and losses in the RPM. This asymmetric treatment means that the RPM assumes that residual profits are shared across the integrated operation but that in a notional loss situation the loss is always attributed to the value of the resource and associated extraction
Page 174

and processing. It infers, for the purpose of setting the price, that the liquefaction, sale and marketing side of the operation will always cover its costs.
The RPM operates on a whole-of-project basis. Both the cost-plus and netback formulas operate on relevant capital and operating costs allocated to either the upstream or downstream phase. Any operating costs incurred before the production date are treated as capital costs. Operating costs incurred after the production date are allocated to the year in which they are incurred. Marketing and selling costs can be included as operating costs of the individual project participant rather than as aggregated costs. This ensures that commercial in confidence information that is outside the scope of the joint venture agreement is not required to be disclosed.
The capital costs and operating costs incurred prior to production are subject to augmentation (uplift), reduction and allocation rules. The principle is that the capital costs are allocated across the life of the integrated LNG operation. In order to calculate how much capital cost is allocated to a particular year, capital costs incurred for a unit of property over several years and capital costs incurred before the production year are uplifted ‘so as to provide a return to capital for costs incurred prior to the commencement of the operational use’ (Explanatory Statement, Select Legislative Instrument 2005 No 329, p. 30).
Costs associated with exploration and costs of getting the project to FID are excluded from the upstream and downstream capital allocation rules. These costs are deductible for PRRT purposes but are not recognised in the RPM as costs to the business prior to production. The result is that these costs are not capitalised, uplifted and allocated like other costs prior to production. There is no return in the RPM for the costs of finding and commercialising the petroleum resource. As these costs are more likely to be recognised for PRRT purposes in the upstream and uplifted over several years, the failure to include these costs in the RPM potentially undervalues the return to the upstream business. The reasoning provided in the explanatory statement for the exclusion of these costs is not compelling. The effect of the exclusion of these costs is a potential asymmetry in how development costs for the upstream and downstream are reflected in the RPM.
In cases where other MPCs are produced from the project before project sales gas is produced, the relevant capital costs associated with the production of the other MPCs are reduced by depreciation each year prior to the production of project sales gas. Capital costs for assets used solely for the project sales gas and project liquid sequence continue to be uplifted as they are not being used until the production date for project sales gas.
The practical effect of this in a LNG operation where other MPCs are produced first is that the capital costs for much of the upstream infrastructure will be reduced over the period in which the other MPCs are produced before the production of sales gas while the capital costs for the downstream infrastructure will continue to be uplifted.
Cost allocation under the RPM
Once the value of capital costs is established they are allocated over the effective life of the respective units of property. The pre-production operating costs are allocated over the life of the project. Capital costs are allocated to each
Page 175

year from the production year onwards; new capital costs are added and allocated over the remaining life of the project.
Capital costs for a unit of property with an expected operating life of 15 years or less are allocated according to the formula:
capital cost x capital allowance for the cost year1 — (1+ capital allowance for the cost year)-N
where:
N is the number of calendar years in the expected operating life of the unit.
Capital costs for units of property with an expected operating life of more than 15 years are allocated on the basis of the following calculation:
capital cost x capital allowance for the cost year
The capital allowance for a relevant year applies to capital costs incurred in that year and is used to calculate the annual capital allocation for capital. Once determined, the annual allocation for a unit of property does not change. The only exception is to reflect changes in the expected operating life of the unit of property or the integrated project (see sub-regulation 42(5) of the Petroleum Resource Rent Tax Assessment Regulation 2015).
The GTP regulations also include apportionment rules to ensure that ‘only those costs that relate to the production and processing of project sales gas into project liquid are included in the RPM for the determination of a gas transfer price’ (Explanatory Statement, Select Legislative Instrument 2005 No 329, p. 8).
The overall effect of the capital allocation rules is that the RPM price is set by looking at the ratio of capital that has been allocated to the upstream and downstream stages with adjustments made for operating costs and new capital expenditures each year. In theory,
the transfer price tends to rise throughout the life of a project — a function of greater ongoing capital expenditure in the upstream phase of the project. This has the effect of gradually shifting more of the revenue to the upstream (higher tax) phase, and steadily increases the overall tax burden of the project (Kellas, 2010, p. 172).
For long-term LNG projects, the value of the capital allowances from the start of the project is also diluted by inflationary pressures on new costs coming into the calculation and any long-term increase in prices. The result is that the residual profits or rents of the project should grow over time. Higher capital allowance rates will initially impact the RPM price by squeezing out residual profit. As the project progresses and the ratio of upstream capital to downstream capital shifts to favour the upstream, the resulting capital allowances shift the balance of the RPM further toward the upstream and the RPM price is higher. This effect would be exacerbated the higher the capital allowance rate is set.
Page 176
D.8 THE RPM CAPITAL ALLOWANCE RATEAll capital augmentations, reductions and allocations in the RPM use the capital allowance which is LTBR plus 7 percentage points. The capital allowance ‘represents a proxy for the cost of equity’ (Explanatory Statement, Select Legislative Instrument 2005 No 329, p. 14). There is no further explanation on why LTBR plus 7 percentage points was chosen as the appropriate uplift rate. Nor is there any explanation of why this represents a proxy for the cost of equity.
The risk with any arbitrary number is that it either over- or under-compensates the investors in any given project. The actual cost of capital for each integrated LNG project will vary between projects and the participants in each project. It is also reasonable to assume that in many projects the actual capital funding mix will include a mix of debt and equity.
Hogan and Goldsworthy have commented on the delicate balance of trying to use capital allowance rates (termed ‘threshold rates’) to target economic rents:
If the threshold rate for a given project is set at the private investor’s minimum rate of return (comprising the risk free interest rate plus an appropriate risk premium), the remaining net cash flow represents the economic rent of the project. If the economic rent and resource rent are equivalent, it is reasonable for the government to target the entire economic rent as a return to the mineral resource (Hogan and Goldsworthy, 2010, p. 138).
It follows from their analysis that, if the capital allowance rate is set too high, then the government is not targeting the entire economic rent of the project, and if the capital allowance is set too low, then the government is targeting more than the economic rents of the project.
Under RPM, if the capital allowance rate is set too high then there is a risk that the economic rents of the project will be diluted by an excessive return on both upstream and downstream capital. The rents not captured by the residual profit will instead be allocated by the ratio of upstream to downstream capital rather than by the residual profit split.
If the capital allowance rate is set so high that the excessive return lifts the cost-plus price above the netback price (resulting in the netback price becoming the RPM price) then the result could be a transfer of the economic rent from the upstream to the downstream side of integrated project. It is more likely that this would occur at the start of a project, in periods of high cost or where prices are very low.
If the capital allowance rate is set too low then there is a risk that the economic rents of the project will be exaggerated by the RPM. Under the RPM, the excessive rents would be distributed evenly between the upstream and the downstream even though the ratio of capital and operating costs in the upstream and downstream may differ from the 50:50 allocations of residual profits.
The other risk is that by not providing a sufficient capital allowance the operation would be in notional loss for economic purposes but this would not be recognised under the RPM. The result in this case is that the notional loss would not be attributed to the upstream, contrary to the original intent of the RPM.
Page 177

These risks to the distribution of project rents between the upstream and downstream grow as the project matures and the measured residual profits of the project increase. If the capital allowance rate is set too high it risks transferring rents from the upstream to the downstream at the start of the project as a result of the cost-plus exceeding the netback price. This would result in lower assessable PRRT receipts for the project, meaning that deductions would be used up at a slower rate. This could result in delay in the project becoming a paying PRRT project. However, once it became a paying project, the high capital allowance rate would absorb the rents as the normal return to the business. If the upstream capital exceeded the downstream capital it would result in a higher RPM price through the PRRT profitable phase of the project.
If the capital allowance rate is set too low it risks not compensating adequately the upstream and downstream processing operations. This would result in a higher RPM price at the beginning of the project, potentially making the project pay PRRT sooner. However, as the ratio of the capital allocation in the upstream increases, the capital allowance rate would not capture the normal returns attributable to the upstream and would transfer them on a 50:50 split to the downstream. The overall effect would be transferring rents from the upstream to the downstream processing during the long profitable phase of the LNG operation (as a lower capital allowance rate in the RPM would lower the cost-plus price thereby lowering the RPM price). This could result in a PRRT project having lower assessable PRRT receipts during the profitable, PRRT paying, phase of the project, resulting in a lower overall tax take for government.
Any uniform RPM capital allowance rate applied across the industry will inevitably under or over-estimate the ‘basic return’ of investors across integrated gas projects in the RPM’s measurement of residual profit. To assist in this regard, the use of the netback price as the RPM price in ‘notional loss’ situations could be removed. This would assist with removing one of the risks of having an excessive capital allowance rate. Research could be done on other ways of splitting the project residual profit to decrease the likelihood of rents being transferred from downstream to upstream or from upstream to downstream by the application of a predetermined rate to a specific project (for example, consideration could be given to splitting the residual profit-based on the capital allocation ratio each year).
Page 178

APPENDIX E — INTERNATIONAL COMPARISONS
E.1 FISCAL STABILITY — LESSONS FROM INTERNATIONAL COMPARISONSAs noted in section 1.5.3, a number of industry submissions referred to the United Kingdom, Alberta (Canada) and Alaska (United States) as examples of countries where changes in their resource taxation arrangements negatively impacted investment. These examples are reviewed below.
E.1.1 United KingdomThe United Kingdom fiscal regime has been subject to numerous changes from the time oil production commenced in the United Kingdom Continental Shelf (CS) in the 1960s. A summary of these changes is in Figure E.1. Since that time, typically, the government take increased in line with oil prices.
Figure E.1 — Brief history of the United Kingdom oil and gas fiscal regime
Source: HM Treasury, 2014, p. 13.
Page 179
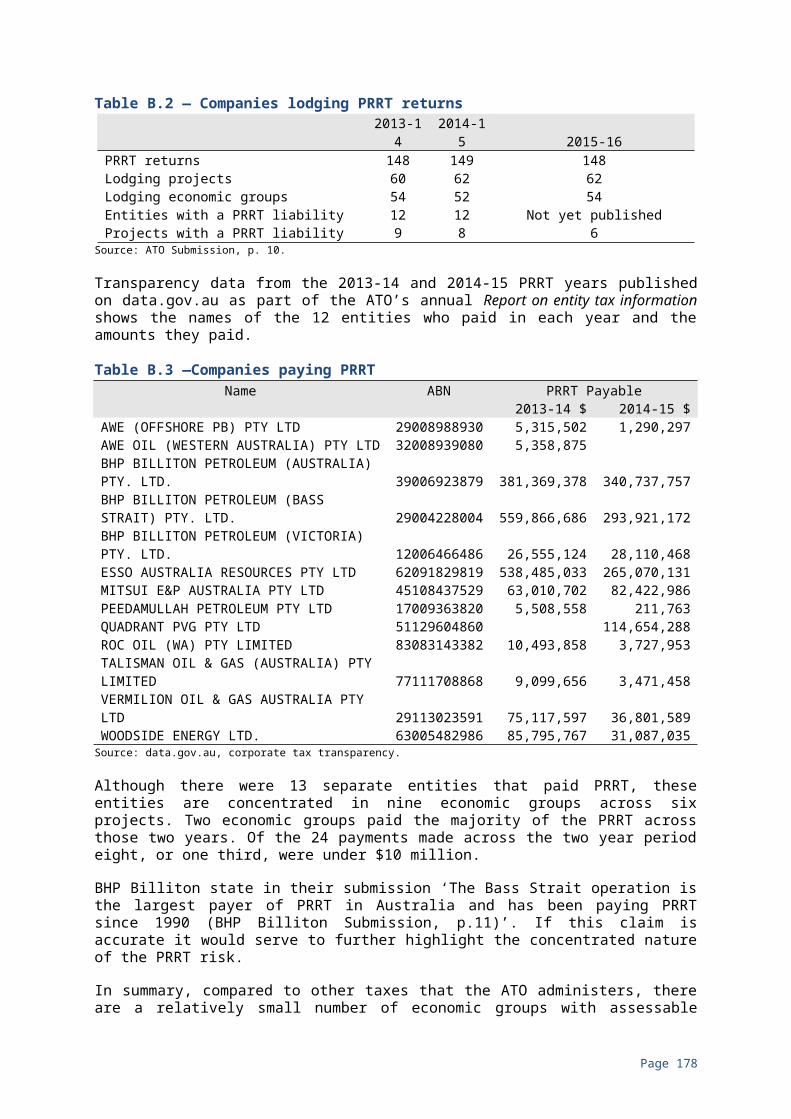
Figure E.2 charts government revenue, investment, oil price, investment and production.
Figure E.2 — Exchequer revenue, oil and gas production, investment and Brent oil price
Source: HM Treasury, 2014, p. 13.
Overall, when the various fiscal changes are compared with investment — for example the introduction of the supplementary charge at 10 per cent in 2002, its increase in 2006 to 20 per cent and then to 32 per cent — it is difficult to assess whether these changes significantly discouraged investment. The price of oil and the economic context associated with the United Kingdom CS may have been more important drivers of investment. The United Kingdom CS is now one of the most mature basins in the world, with cumulative oil and gas production to date totalling around 43 billion barrels of oil equivalent. Production is winding down and the United Kingdom Government estimates the United Kingdom CS holds a further 10 to 20 billion barrels of oil equivalent in remaining recoverable hydrocarbons (Oil and Gas Authority, 2015, p. 3).
The United Kingdom CS is characterised by smaller sized field opportunities that are more marginal and interdependent, requiring significant investments to develop. As existing fields come to the end of their lives there has been an increased focus on decommissioning requirements. In this context, reviews were conducted in 2013 and 2014 to evaluate the path forward. In response, the United Kingdom Government reformed its approach to oil and gas taxation in its
Page 180
2015, 2016 and 2017 budgets, seeking to maximise investment (and economic oil and gas recovery) by reducing the overall tax burden. The regulatory environment was also changed with the establishment of the Oil and Gas Authority in 2015 which has the role of regulating, influencing and promoting the United Kingdom oil and gas industry to maximise oil and gas economic recovery. An overview of the current regime is in section E.2.2.
E.1.2 AlbertaAgalliu, I. (2011), referenced in the Business Council of Australia submission, included a case study on the impact of the changes to Alberta’s royalty regime announced by their government in October 2007, with effect from 1 January 2009. These changes were designed to increase the government take. To illustrate the impact of the changes, the 2011 report drew from a study conducted by Sierra Systems Group for the Alberta Department of Energy on Alberta’s natural gas and conventional oil competitiveness which indicated that there was a shift in percentage of land sales in 2008 from Alberta to British Columbia. Figure E.3 reproduces a chart illustrating percentage of land sales in Western Canadian Provinces. A similar trend was also found in reinvestment patterns where ‘Reinvestment in conventional oil and gas in Alberta dropped from a 60 percent mark over the past decade to 40 percent in 2008. In British Columbia, by 2008 the industry was reinvesting over 100 percent, more than its share of earnings in that jurisdiction’ (Agalliu, 2011, p. 127).
Figure E.3 — Percentage of land sales in Western Canadian provinces
Source: Agalliu, 2011, p. 127.
While these results suggest the fiscal measures announced in 2007 contributed to a shift in investments away from Alberta and into British Columbia and Saskatchewan, in this case, the introduction of the new fiscal regime also coincided with a sharp decline in crude oil prices and competition from increased shale gas production in the US. These other factors are likely also to have played some role in the resulting investment activity in Alberta. Figure E.4 illustrates drilling activity in Alberta over time together with price.
Page 181

Figure E.4 — Drilling activity in Alberta, 1967-2015
Source: Alberta Oil and Gas Quarterly, Winter 2016, p. 12.
In April 2016, the Government of Alberta announced a change to the fiscal regime which had effect from 1 January 2017. Features of this new regime are outlined in section E.2.4. These changes likely contributed to Alberta’s decreased place in the Fraser institute’s overall Policy Perception Index, suggesting the policy change had some negative impact on oil and gas investment.
E.1.3 Alaska In 2006, Alaska’s long standing gross value oil and gas production severance tax was changed to a net profit tax system to make it more progressive. A progressive tax rate was applied on net revenue (which took operating and capital costs into account). The final tax liability was determined after tax credits were taken to account. Since this change, the production tax has been subject to further substantive and successive changes to rates, calculations, together with changes to tax credits and incentives. This included, in 2007, further increasing the state’s share through the Alaska’s Clear and Equitable Share Production Tax and, in 2008, increasing exploration credits and establishing the Oil and Gas Credit Fund as a more effective way of purchasing qualifying credits. In 2014, further changes to tax credits and the production tax rate became effective, establishing the current production tax rate of 35 per cent of the net production value.31
Agalliu, I. (2011), referenced in the Business Council of Australia submission, focused on the changes that occurred in 2006 and 2007. The report drew from acreage licencing results in Alaska to illustrate the impact of the changes (see Figure E.5). The report notes, ‘The drop of licencing activity in Alaska in 2007 and 2008, despite rising oil prices until July 2008 indicates that the decline is related
31 For further information, the Alaska Oil and Gas Competitiveness Review Board periodically publishes a competitiveness report, the most recent publication was released February 2015. In addition, the Alaska Department of Revenue’s website contains a historical overview: http://www.tax.alaska.gov/programs/programs/reports/Historical.aspx?60650.
Page 182
to the harsh fiscal terms and loss of investor confidence in the stability of the petroleum fiscal system’ (Agalliu, 2011,p. 125).
Figure E.5 — Alaska: acreage awarded 2005-2010
Source: Agalliu, 2011, p. 126.
The trends of lease sales over a longer period of time are examined, together with exploration well activity, illustrated in Table E.1 and Figures E.6 and E.7. Like Alberta, many of these changes were also taking place at the same time as a decrease in oil price, increased competition and production from elsewhere in the United States. Similarly, while the changes to fiscal stability will likely have had an impact on investment activity, these changes are hard to isolate from other influences.
Page 183

Table E.1 — Alaska: competitive oil and gas lease sale results from 2000
Source: Alaska Department of Revenue, 2015, p. 29.
Figure E.6 — Cumulative value of rents and bonus bids received for leases awarded with the area wide lease sale program
Source: Alaska Department of Revenue, 2015, p. 26.
Page 184

Figure E.7 — Exploratory wells and wellbores in Alaska from 2000 (includes wells completed, suspended or abandoned). Background is the West Coast spot price for Alaska North Slope crude oil (Dollars/barrel)
Source: Alaska Department of Revenue, 2015, p. 29.
E.2 SUMMARY OF FISCAL REGIMES FOR OIL AND GAS IN SELECTED COUNTRIES E.2.1 NorwayIn Norway, oil and gas companies are subject to a ‘special tax’ which is applied in addition to the ordinary company tax on profits. The special tax rate is 54 per cent and the company tax rate is 24 per cent, resulting in a combined tax rate of 78 per cent on profits of petroleum businesses.
The tax base for the company and the special tax are the same, except that the special tax is provided with an extra deduction (‘uplift’) on investments. This extra deduction is currently 21.6 per cent, equivalent to 5.4 per cent each year for four years from the investment year. While the marginal tax rate is high, attractive features of the Norwegian fiscal regime from resource companies’ perspective include its stability over a long period of time and the availability of refunds for undeducted exploration expenditure.
Deductions for all relevant operating costs are allowed, including costs associated with exploration, research and development, financing and closing down. Investments are written off using straight line depreciation over six years. Consolidation between fields is permitted, which means losses from one field or exploration costs can be written off against income from operations elsewhere in the Norwegian shelf. Where losses are incurred, the loss and any unused uplift
Page 185

can be carried forward with interest. Companies may also apply for an immediate refund of the tax value of exploration costs.
E.2.2 United KingdomThe fiscal regime applying to oil and gas in the United Kingdom has consisted of three main taxes: a Ring Fence Corporation Tax, the Supplementary Charge and Petroleum Revenue Tax.
The Ring Fence Corporation Tax is a ring fence profits tax with a 30 per cent rate (compared to the corporate tax rate of 20 per cent). Ring fenced profits are calculated in the same way as for corporate tax except that taxable profits from oil and gas extraction cannot be reduced by losses from other activities. Special allowances apply; for example, a capital allowance provides 100 per cent deduction for qualifying capital expenditure in the first year. Unused expenditure can be carried forward to maintain the value of exploration, appraisal and development costs. Unused expenditure is increased by 10 per cent each year for a maximum of ten accounting periods.
The rate of the Supplementary Charge is 10 per cent. It is an additional charge on a company’s ring fence profits but with no deduction for finance costs, although the Supplementary Charge can be reduced by some allowances.32
The Petroleum Revenue Tax is a field based profit tax that applies to individual oil fields in operation before 16 March 1993. As part of the 2016 budget, it has been permanently zero rated, and so exists now primarily for deducting losses arising, for example, from decommissioning.
E.2.3 Papua New GuineaThe fiscal regime that applies in Papua New Guinea includes a combination of corporate income tax, royalties and development levies and an Additional Profits Tax (APT), as well as an option for government participation. Some of these arrangements were altered as part of a package of tax reforms announced in the 2017 budget following a broad tax system review.
The APT is a profit-based tax levied on a project basis and was one of the taxes that changed in the recent reforms. Effective from 1 January 2017, the APT now applies to all resource projects, including oil and gas at the rate is 30 per cent. A single accumulation (uplift) rate of 15 per cent applies.33
32 The Supplementary Charge has been changed a number of times since its introduction in 2002 at the rate of 10 per cent. In 2006 it was increased to 20 per cent and to 32 per cent in the United Kingdom’s 2011 Budget. Following the Wood Review in 2014, it was reduced to 30 per cent and subsequently to 20 per cent between 1 January 2015 and 31 December 2015. The change to the current 10 per cent rate was announced in the United Kingdom’s 2016 Budget together with the reduction in the Petroleum Revenue Tax from 35 per cent to 0 per cent.
33 The APT had previously been changed several times. In 2003, the APT was removed for oil and gas projects but was reintroduced for designated gas projects in 2008 as a result of negotiations on the PNG LNG project. Under the 2008 arrangement, two calculations were used to determine APT: Calculation X applied a tax rate of 7.5 per cent at an uplift rate of 17.5 per cent and Calculation Y applied a tax rate of 10 per cent at an uplift rate of 20 per cent (with Calculation X deductible for the purposes of performing Calculation Y).
Page 186

For oil and gas businesses, company tax is ring fenced around the project. From 1 January 2017, the resident corporate tax rate has been standardised at 30 per cent across all sectors of the economy. For non-resident corporates, the tax rate depends on whether the resource project was subject to specific provisions:
Specific provisions Non-resident tax rate
Petroleum — old projects (income from operations derived before 31 December 2000) 50
Petroleum — new projects (no income from operations derived before 31 December 2000) 45
Petroleum — incentive rate (project that arises from a prospecting licence granted between
1 January 2003 and 31 December 2007 where the development licence is issued prior to
31 December 2017
30
Gas 30
A royalty payment equal to 2 per cent of gross revenue from resource sales applies to oil and gas projects. In addition, new petroleum and gas projects are typically subject to a development levy also equal to 2 per cent of the gross revenue from resource sales, paid to the provincial government where the project is located. Where a project is subject to both the royalty and development levy, the royalty can be claimed as a credit against income tax.
An option is also available in legislation for the Government to acquire an interest of up to 22.5 per cent on a sunk cost basis at the time the development is decided.
E.2.4 Canada Unlike Australia, Norway or the United Kingdom where a fiscal regime for oil and gas extraction is levied at the federal level, Canada and the United States levy such a regime at the state/province level.
Most Canadian provinces have a two tiered arrangement where, from production to cost recovery, a tax is applied to revenue at a low and flat rate. After cost recovery, the rates increase and collections become a function of a number of factors, including profit, price and production levels.
Separate corporate taxes also apply at the province level, ranging between 11 to 16 per cent. This is in addition to federal corporate tax applied at the rate of 15 per cent. Corporate tax at the federal and province level typically have a similar base and royalties paid are deductible against corporate tax.
A number of Canadian provinces have updated their fiscal settings recently, primarily in response to increased competition from United States shale gas. The fiscal regimes vary considerably between the key oil and gas exporting provinces of Alberta, British Columbia and Newfoundland and Labrador.
AlbertaA new framework for crude oil, liquid and natural gas came into effect from 1 January 2017, with current wells grandfathered for 10 years. Initially, a 5 per cent flat rate applies on gross revenue until revenue equals a cost recovery allowance.
Page 187

The royalty rate then varies up to a maximum of 40 per cent and is a function of the hydrocarbon resource, market price, production and well maturity.
For oil sand projects, a royalty rate of between 1 to 9 per cent is applied to total revenue until project costs are recovered. After costs are recovered, the rate becomes the greater of either 1 to 9 per cent of total revenue or 25 to 40 per cent of net revenue.
Alberta’s province company tax rate is 12 per cent.
British ColumbiaFrom 1 January 2017, an LNG income tax is payable for LNG liquefaction activities at the rates of 1.5 per cent on ‘net operating income’ while ‘net income’ is zero, or 3.5 per cent on ‘net income’ (with this rate scheduled to increase to 5 per cent on 1 January 2037).
A natural gas royalty is determined by multiplying the royalty rate (ranging between 5 and 27 per cent as a function of the origin of gas) by the marketable gas volume from the wellhead and the reference price.
A oil royalty payable is calculated by determining the value of production from the well (volume multiplied by a weighted average net selling price) and multiplying it by the appropriate royalty rate (which ranges between 0 and 40 per cent depending on volume, whether the oil is produced on crown or freehold land and classification of oil).
British Columbia’s company tax rate is 11 per cent.
Newfoundland and LabradorA generic offshore natural gas royalty has applied from November 2015 which consists of two components: a ‘basic royalty’ and a ‘net royalty’. The basic royalty is levied from initial production and is payable on revenue less transportation costs. The basic royalty rate varies from 2 to 10 per cent and is a function of the netback value of production. The ‘net royalty’ is payable after project costs are recovered. The net royalty is levied on net revenue (revenue less applicable costs of transport, capital, operating and basic royalty paid). The net royalty rate varies from 0 to 50 per cent and is driven by the ratio of cumulative project revenue over cumulative project costs (the return ‘R’ factor).
An offshore oil royalty regime also consists of basic and net components, both of which are based on a return ‘R’ factor (cumulative project revenue over cumulative project costs). The basic royalty is applied to gross revenue from initial production and increases from 1 per cent to 7.5 per cent as the project recovers costs. After project costs are fully recovered, the net royalty rate is applied to net revenue. The net royalty rate is between 10 per cent and 50 per cent, driven by the ‘R’ factor. The basic royalty is credited against the net royalty, so only one royalty is effectively paid at any stage.
Onshore oil resources are subject to a slightly different regime again consisting of basic and net components. The first 2 million barrels of oil is exempt, after which the basic royalty is levied at a rate of 5 per cent of gross revenue (gross sales revenue less eligible transportation costs to the point of sale). The net royalty has
Page 188
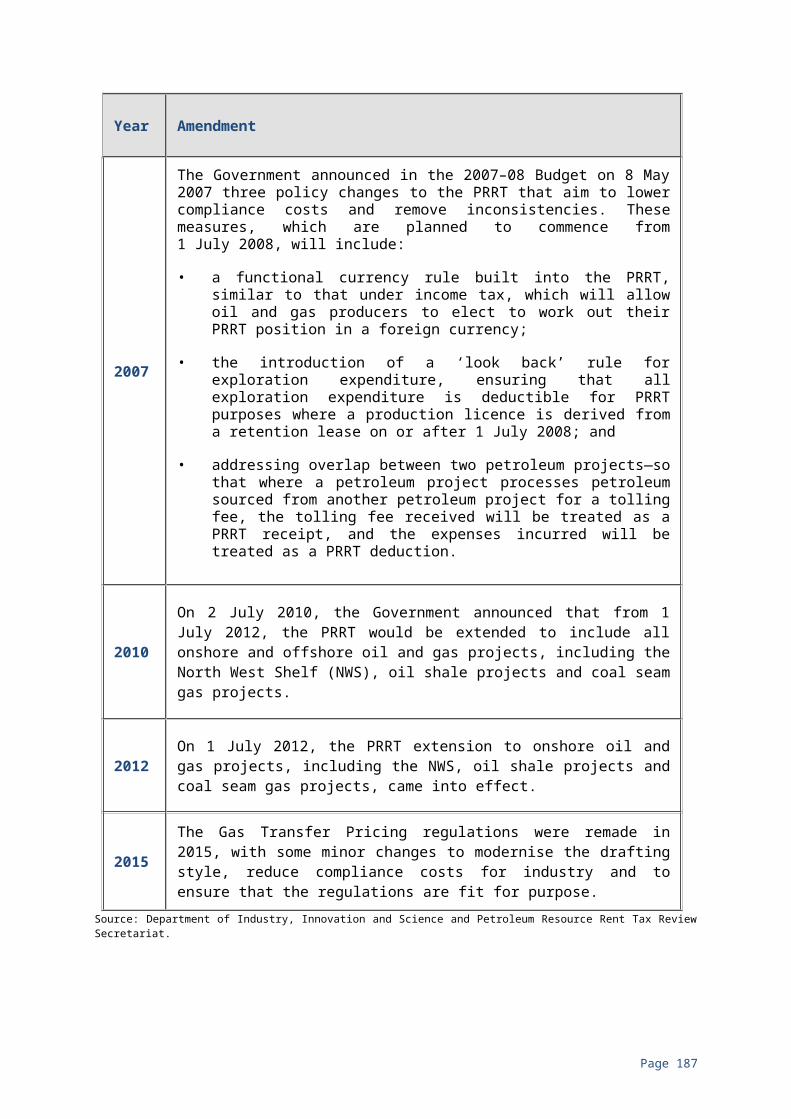
two tiers. The Tier 1 royalty rate of 20 per cent is applied to net revenue after a return allowance of LTBR plus 5 percentage points is achieved. The basic royalty is a credit on this tier, so companies need only pay the higher of the basic or Tier 1 net royalty. The Tier 2 royalty rate of 5 per cent is applied to net revenue after a return allowance of LTBR plus 15 percentage points is achieved. This tier is in addition to other royalties payable.
Newfoundland and Labrador’s company tax rate is 15 per cent.
E.2.5 United StatesIn the United States, onshore oil and gas resources are privately rather than publicly owned. Oil and gas revenue is typically collected from private owners at the state level in the form of a severance tax. Each state has individual tax and incentive arrangements typically applied on an ad valorem basis. In federal zones, a separate fiscal regime applies which differentiates between onshore and offshore projects.
Taxable income from oil and gas corporations is subject to United States federal income tax at the corporate level. This tax is graduated ranging from 15 per cent to a maximum of 35 per cent where taxable income is greater than US$15 million.
TexasCrude oil and condensate production taxes are levied at 4.6 per cent of the market value of crude oil and condensate. Natural gas production tax is 7.5 per cent of the market value of gas produced. Incentive programs can reduce (or remove) these severance taxes. On state land leases, the Texas General Land Office typically receives a 20 to 25 per cent royalty from oil and gas produced. Additionally, entities doing business in Texas also pay a franchise tax levied at a maximum rate of 0.75 per cent on the entity’s taxable ‘margin’.
North DakotaA gas production tax applies on an annually adjusted flat rate per thousand cubic feet (mcf) of all non-exempt gas produced. The current rate is $0.0601 per mcf. Annual adjustments are made on 1 July and take into account the average producer price index for gas fuels.
An oil production tax is applied at the rate of 5 per cent to the gross value (adjusted for transport costs) of oil produced at the well. An oil extraction tax is also applied at the rate of 5 per cent to the gross value of oil produced at the well, although this may be increased to 6 per cent if particular price conditions are triggered.
On state land leases, a royalty of between 16.67 and 18.75 per cent of ‘net mineral interest’ typically applies. North Dakota also levies a corporate income tax on a stepped basis with a maximum rate of 4.31 per cent of North Dakota taxable income.
Page 189
Gulf of Mexico (Offshore Federal Zone)The federal government receives (biddable) signature bonuses. Before production starts, annual rents are payable at a level commensurate with the holding cost of the lease. The rent amounts are prescribed in the Final Notice of Sale and typically increase over time to encourage early development.
The federal government receives royalty payments once production starts. The royalty rate is applied to the value of the amount of production. The royalty rate of 18.75 per cent has typically applied to shallow and deep water leases in the Gulf of Mexico from March 2008. Royalty relief and other incentives apply.
E.2.6 QatarThrough the state owned corporation Qatar Petroleum (QP), the Qatari Government has a direct interest in all stages of oil and gas activities: exploration, development, production, storage, marketing, sale and downstream affiliated activities. Exploration, production and development rights are provided through specific agreements with QP, typically through production sharing agreements and development and fiscal agreements (DFAs). Fiscal arrangements differ as a result of the individual agreements entered into and cannot be readily compared. As a guideline, fiscal arrangements could include:
• corporate tax rate — this rate is not to be less than 35 per cent for oil and gas operations;
• royalties, payable on total sales (under DFAs) with rates set in the specific agreement;
• bonuses, payable on signature and/or on achievement of specific production targets;
• cost recovery arrangements; and
• profit sharing arrangements.
Qatar does not levy a specific petroleum rent tax.
Qatar’s exports of LNG and crude oil provide a significant portion of government revenues.
Page 190
APPENDIX F — GAS MARKETS
F.1 GLOBAL LNG MARKETGlobal LNG trade volumes have grown strongly over the last 50 years, facilitated by the diversification of both import and export markets. The LNG market has become increasingly interconnected and flexible, reflected in the increasing significance of LNG spot trading.
Currently, the global LNG market is going through a period of significant transformation. The tight supply conditions and high prices prior to 2014 have given way to sharply lower spot and contract prices, as expanded supply from new Australian and United States LNG projects enter the market.
LNG imports in the Asian region are expected to drive global LNG growth over the next few years, forecast to increase from 167 million tonnes in 2015 to around 246 million tonnes in 2021 (Department of Industry, Innovation and Science, 2016b, p. 73). While Japan will remain the largest Asian market, the role of China is expected to increase, overtaking South Korea to become the second largest market by the end of the decade. LNG demand growth is also expected to be led by strong growth in India and a range of smaller and emerging importers in the rest of Asia, as well as a recovery of LNG demand in Europe.
However, strong growth in capacity will more than offset the projected demand growth over the next few years. Global liquefaction capacity is forecast to increase on average by 7 per cent a year until 2021 as new projects come online, mostly from Australia and the United States (see Figure F.1). Australia’s new LNG projects will add around 25 per cent to global liquefaction capacity (Department of Industry, Innovation and Science, 2016f, p. 42).
Page 191

Figure F.1 — Global liquefaction capacity
Source: Department of Industry, Innovation and Science, 2017.
Figure F.2 shows that despite the rapid increase in LNG demand to 2020, an even faster expansion of LNG capacity over the same period will add to excess supply in the market causing downward pressure on spot prices.
Figure F.2 — Global liquefaction capacity and imports
2005 2006 2007 2008 2009 2010 2011 2012 2013 2014 2015 2016 2017 2018 2019 20200
100
200
300
400
500
600
0
100
200
300
400
500
600
Middle East S.E. Asia Africa OtherAustralia North America Imports
billion cubic metres billion cubic metres
forecast
Source: Department of Industry, Innovation and Science, 2016f.
There is no certainty on when this excess capacity may be absorbed beyond 2020. The countries with the greatest potential for long term LNG demand growth can also access pipeline supplies and/or increased domestic production. Also, the demand for natural gas will be sensitive to the price relativity of gas versus other fuels, such as nuclear, renewables and coal, and the difficulties in predicting the likely direction of global environmental and economic policies.
The cost competitiveness of gas will be a key determinant of the outlook beyond 2020. The price needs to be low enough to sustain and improve the share of natural gas in total primary energy consumption, but high enough to encourage
Page 192
0
20
40
60
80
100
Australia NorthAmerica
Middle East Africa S.E. Asia Other
million tonnes
Additional capacity by 2022 Existing capacity in 2016

investment in new gas supply. There may be constraints on investment regardless of price movements and, if so, excess capacity could be expected to decline between 2020 and 2030.
F.2 AUSTRALIA’S DOMESTIC GAS MARKETSAustralia’s domestic gas market consists of three distinct regional markets: the Eastern market (Victoria, South Australia, New South Wales, Australian Capital Territory, Queensland and Tasmania); the Western market (WA); and the Northern market (NT). The Eastern and Northern gas markets will be connected when completion of the Northern Gas Pipeline, expected in 2018, links Mount Isa and Tennant Creek.
Australian gas consumption has been growing steadily, by around 4 per cent a year on average over the past decade. The growth in gas consumption reflects greater uptake of gas in electricity generation, and increased use in mining and industry. As such, gas is an increasingly important energy source in Australia. As shown in Figure F.3, gas accounted for around 24 per cent of Australia’s energy consumption in 2014-15 (Department of Industry, Innovation and Science, 2016a, p.7).
Figure F.3 — Australian energy consumption by fuel type 2014-15
Source: Department of Industry, Innovation and Science, 2016a.
After decades of stable growth in supply and demand, the Eastern gas market is currently undergoing a major transition and is facing a looming gas supply shortage. This has been initiated by the rapid expansion of CSG production required to supply the three new LNG projects in Queensland which recently commenced production and effectively link the Eastern market to international LNG markets. The Australian Energy Market Operator (AEMO) has projected gas for LNG to account for 73 per cent of total gas demand in the Eastern market. The significant gas export demands of these projects is impacting the domestic market, leading to fears of gas shortages and significant price rises. Gas supply shortages are expected to have a detrimental impact for gas powered generation that could lead to electricity supply shortfalls in the National Electricity Market between 2019 and 2021 (AEMO, 2017, p.1).
Page 193
32.2%
37.8%
24.2%
5.8%
Coal Oil Gas Renewables

Compounding these concerns is the fact that many of the long term (and low priced) legacy contracts which have underpinned the domestic market have recently come up for renewal, which has exposed users to prevailing gas prices, and to the uncertainties of shorter term, less flexible contracts, and in some cases the risks of oil price linkage.
AEMO forecasts that commercially recoverable gas reserves required to meet East Coast demand will start to deplete from 2019 if undeveloped gas reserves and resources are not brought into production. There is sufficient gas in the Eastern gas market to meet domestic demand and existing LNG contract commitments, but there is uncertainty over the timing of some developments, particularly due to low oil prices (AEMO, 2017, p.1). Figure F.4 from the Australian Competition and Consumer Commission’s (ACCC) 2016 report, Inquiry into the East Coast Gas Market, highlights the decline in production from developed supply sources and the undeveloped supply required to enter the market to satisfy domestic and LNG demand to 2025 (ACCC, 2016, p. 55).
Figure F.4 — Forecast gas supply and demand balance in the East Coast gas market (excluding Arrow project, 2016-17)
Source: ACCC, 2016.
The ACCC’s Inquiry found the domestic gas market supply risk is driven by the confluence of three factors:
• Significant demand from the LNG projects. While these projects are predominately supplied by CSG fields in the Surat and Bowen Basins in Queensland, they are also relying on gas from traditional sources of domestic supply. For example, the Cooper Basin which has historically only had access to and supplied the domestic market and is now supplying increased LNG demand.
• Low oil prices reducing the ability and incentive of producers across the entire East Coast gas market to explore for and develop gas. As a consequence of the low oil price, LNG project cash flows have been severely inhibited. Instead of investing in the development of new supply, LNG projects have sought additional gas from third parties in the domestic market.
Page 194

• A lack of support for onshore gas development, particularly unconventional sources such as shale and CSG. Community concern about the environmental impacts of gas development have led to moratoria on onshore gas exploration and development and other regulatory restrictions in New South Wales, Victoria, Tasmania, and the Northern Territory (NT), prohibiting new gas supply (ACCC, 2016, p. 18).
Tight market conditions on the Eastern domestic gas market have had consequences for the prices gas users pay and the availability of contracts for large users. The Inquiry into the East Coast Gas Market found that prices have been affected by the commissioning of LNG export facilities in Eastern Australia. The ACCC also found evidence that new domestic contract terms have become shorter but less flexible and that some contract prices are now linked to international oil prices.
Submissions to the review that reflected on gas supply shortages and high prices in the East Coast market were limited. Santos in its submission stated:
The capital intensive nature and profitability of these projects is such that changes to the PRRT can effect further investment decisions and the review must be cognisant of its potential impact on future supply (Santos Submission, p. 1).
Similarly, Cooper Energy’s submission stated:
Shortfalls between forecast south east Australia gas demand and contracted supply has resulted in substantial increases to gas prices and highly publicised concern about the adequacy of supply and broader economic impacts. The increase in gas prices is encouraging the development of gas resources which were previously considered uneconomic where this is possible (Cooper Energy Submission, p. 1).
AEMO’s ten year supply forecast for WA projects the state’s gas market to be well supplied, with potential gas supply expected to remain higher than forecast demand over the outlook period. AEMO notes its forecast for surplus supply is contingent on continued expenditure to develop gas supplying the WA domestic market. However, the current low oil price environment has seen exploration in WA’s gas basins at its lowest level since 1990. There is a risk, if exploration remains low, that new gas projects may not be developed and existing domestic gas production facilities may cease production due to lack of gas feedstock (AEMO, 2016, p.1)
Page 195

APPENDIX G — SUBMISSIONS AND MEETINGS
SUBMISSIONSThe review received a total of 77 submissions of which 6 were provided on confidential basis. Non confidential submissions were made available on the Treasury website: http://www.treasury.gov.au/ConsultationsandReviews/Reviews/2016/Review-of-the-Petroleum-Resource-Rent-Tax/Consultation/Submissions
1. Armidale Regional Council2. Arrow Energy3. Australia Taxation Office4. Australian Council of Social Service5. Australian Council of Trade Unions6. Australian Petroleum Production and Exploration Association (APPEA)7. Ballina Shire Council8. Balonne Shire Council9. Banana Shire Council10. BHP Billiton11. BHP Billiton Additional Information12. BP Australia13. Bulloo Shire Council14. Bundaberg Regional Council15. Burdekin Shire Council16. Business Council of Australia17. Central Desert Regional Council18. Chamber of Commerce and Industry WA19. Chevron 20. Cobar Shire Council21. Community and Public Sector Union22. Cooper Energy23. Dr Diane Kraal — Monash Business School — Monash University24. Dwyer Lawyers25. Edward River Council26. ENI Australia 27. ExxonMobil Australia28 ExxonMobil Australia Additional Information29. Far North Queensland Regional Organisation of Councils30. Greenpeace Australia Pacific31. INPEX Operations Australia Pty Ltd32. Isaac Regional Council33. Japan Australia LNG (MIMI) Pty Ltd34. Jera Australia Pty Ltd35. Justice and International Mission Unit, Synod of Victoria and Tasmania,
Uniting Church in Australia36. Kangaroo Island Shire Council37. Kevin Morrison — Damien Giurco — UTS Institute of Sustainable Futures38. Local Government Association of Queensland39. Loddon Shire Council40. Mackay Regional Council41. Maranoa Regional Council
Page 196

42. Mareeba Shire Council43. Mid-Western Regional Council44. Mitsui E&P Australia Pty Ltd45. North West Shelf Project46. Northern Territory Government47. Origin Energy Limited48. PE Wheatstone Pty Ltd49. Peter Matters50. Professionals Australia51. Professor John Chandler52. Prosper Australia53. Publish What You Pay54. Queensland Resources Council55. Quilpie Shire Council56. Santos57. Senex Energy58. Shell Australia59. Shire of Flinders60. Shire of Lake Grace61. Shire of Merredin62. Shire of Murchison63. Shire of Wyalkatchem64. Southern Downs Regional Council65. Tax Justice Network Australia66. The Australia Institute67. Toowoomba Regional Council68. United Voice69. Western Australian Government 70. WoodsideConfidential submissions71. AWE Limited 72. Australia Pacific LNG (APLNG)73. ConocoPhillips 74. Department of Foreign Affairs and Trade 75. Dr Diane Kraal 76. INPEX Operations Australia Pty Ltd — Additional Information77. Total E&P Australia
MEETINGSMeetings were held with the following organisations and individuals.From Industry1. Australian Petroleum Production and Exploration Association (APPEA)2. Australia Pacific LNG (APLNG)3. BHP Billiton4. BP Australia 5. Chevron 6. Conoco Philips7 Cooper Energy8. ExxonMobil Australia9. INPEX Operations Australia Pty Ltd
Page 197

10. Interoil11. Japan Australia LNG Pty Ltd (MIMI)12. Origin Energy Limited13. Quadrant Energy 14. Queensland Resources Council15. Santos 16. Shell Australia17. Total E&P Australia18. Vermilion Oil and Gas Australia Pty Ltd19. WoodsideOutside of Industry20. Australian Taxation Office21. Department of Foreign Affairs and Trade22. Dr Craig Emerson 23. Dr Diane Kraal, Monash Business School, Monash University 24. Embassy of Japan 25. Mr Dale Koenders, Citi Research26. Mr Grant Cathro, Allens27. Mr Jason Ward, International Transport Workers’ Federation28. Mr Ian Macfarlane29. Mr John de Wijn, QC30. Mr Kevin Morrison, UTS Institute of Sustainable Futures31. Mr Thomas Lassourd, Natural Resource Governance Institute32. Professor Jack Mintz, School of Public Policy, University of Calgary33. The Australia Institute34. Tax Justice Network Australia35. Western Australian Department of Mines and Petroleum36. Western Australian Department of State Development37. Western Australian Department of Treasury
Page 198