Embed Size (px)
Citation preview
DEPARTMENT OF LABOR AND EMPLOYMENT Division of Oil and Public Safety Remediation Section 633 17th Street, Suite 500 Denver, Colorado 80202-3660 (303) 318-8500; Fax (303) 318-8546 Website: http://oil.cdle.state.co.us
Petroleum Hydrocarbon Remediation by In-situ Chemical Oxidation at Colorado Sites
The Colorado Department of Labor and Employment Division of Oil and Public Safety
June 14, 2007
Table of Contents 1.0 Introduction........................................................................................................... 1
2.0 ISCO Overview and Implementation.................................................................. 2 2.1 ISCO Applicability and Process ......................................................................... 2 2.2 Summary of ISCO Technologies ........................................................................ 2
2.2.1 Hydrogen peroxide and Fenton’s Reagent...................................................... 3 2.2.2 Sodium persulfate ........................................................................................... 4 2.2.3 Ozone .............................................................................................................. 4
2.3 Site Characterization........................................................................................... 5 2.3.1 Physical Parameters ........................................................................................ 5 2.3.2 Chemical Parameters ...................................................................................... 6
2.4 Pilot Testing ........................................................................................................ 7 2.4.1 Bench-scale Testing ........................................................................................ 7 2.4.2 Field-scale Pilot Testing ................................................................................. 8
2.5 Oxidant Delivery................................................................................................. 9 2.5.1 Oxidant Volume............................................................................................ 10 2.5.2 Oxidant Concentration.................................................................................. 10 2.5.3 Oxidant Delivery Method ............................................................................. 11 2.5.4 Monitoring .................................................................................................... 12
2.6 ISCO Implementation with Other Remedial Technologies .............................. 13 2.7 Site Logistics..................................................................................................... 13 2.8 Health and Safety and Regulatory Concerns .................................................... 13
3.0 Evaluation of Colorado Sites ............................................................................. 14 3.1 Evaluation of ISCO Success ............................................................................. 14 3.2 Evaluation of ISCO Components...................................................................... 17
3.2.1 Site Characterization (Characteristics/Activities A – F)............................... 20 3.2.2 Remedial Design (Characteristics/Activities G - L) ..................................... 21 3.2.3 Oxidant Delivery (Characteristics/Activities M – P).................................... 21
3.3 Conclusions....................................................................................................... 22 Figures 3-1 Benzene Concentration Plot for Site 2...................................................................17 3-2 Benzene Concentration Plot for Site 3...................................................................18 3-3 Benzene Concentration Plot for Site 11.................................................................18 3-4 Benzene Concentration Plot for Site 20.................................................................19 Tables 2-1 Oxidant strengths .....................................................................................................4 2-2 Monitoring Parameters...........................................................................................11 3-1 ISCO Success at Colorado Sites as a Result of Benzene Trend Evaluation..........17 3-2 Site Characterization, Remedial Design, and Oxidant Delivery Components ......21 3-3 ISCO Success Correlation with Site Components .................................................22 Appendix A - Table A-1. Site Parameters Evaluated for Colorado Sites Appendix B - Benzene Concentration Plots for Colorado Sites Appendix C - Check sheet for CAP with ISCO Component
1
1.0 Introduction
Several documents present details of in-situ chemical oxidation (ISCO) technologies as they apply to various contaminants. This document addresses only ISCO technologies that are appropriate for the remediation of petroleum hydrocarbon contamination. The primary objectives of this document are to summarize the components of ISCO application and to evaluate ISCO activities conducted and results obtained at petroleum hydrocarbon contaminated sites in Colorado. ISCO is the injection of liquid or gas into the subsurface that causes oxidation and can result in the direct destruction of petroleum contamination. This process can also result in the indirect decrease of petroleum contamination by increasing the dissolved oxygen content in groundwater, which enhances biodegradation. The Colorado Division of Oil and Public Safety (OPS) identified 20 leaking underground storage tank (LUST) sites in Colorado at which ISCO was implemented as a component of, or as the sole remediation method, in the approved corrective action plan (CAP). These sites were evaluated to determine the effectiveness of the different ISCO products being approved for remediation and to determine which, if any, site specific factors have the greatest influence on the successful performance of an ISCO approach for remediation of petroleum contamination. As a result of this study, the OPS developed a checklist containing activities to be completed and characteristics to be evaluated when proposing ISCO in a remedial approach. This checklist, included in Appendix C of this report, must be completed and included in any CAP that includes an ISCO component. OPS anticipates that this evaluation of Colorado sites will be an evolving study and additional sites will be evaluated as technology advances and additional oxidants and delivery methods are proposed that will require consideration and careful evaluation. As new sites are evaluated, it will also be possible to compare ISCO implementation costs to other ISCO technologies, as well as to other remedial technologies and approaches.
2
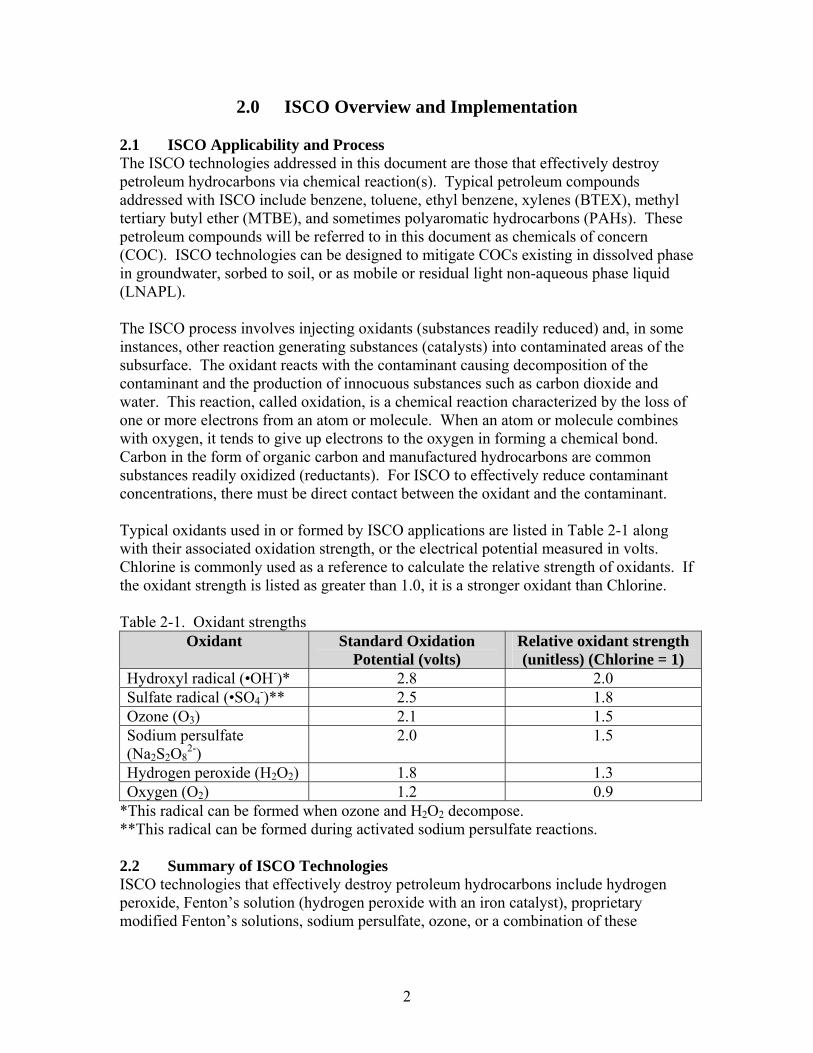
2.0 ISCO Overview and Implementation 2.1 ISCO Applicability and Process The ISCO technologies addressed in this document are those that effectively destroy petroleum hydrocarbons via chemical reaction(s). Typical petroleum compounds addressed with ISCO include benzene, toluene, ethyl benzene, xylenes (BTEX), methyl tertiary butyl ether (MTBE), and sometimes polyaromatic hydrocarbons (PAHs). These petroleum compounds will be referred to in this document as chemicals of concern (COC). ISCO technologies can be designed to mitigate COCs existing in dissolved phase in groundwater, sorbed to soil, or as mobile or residual light non-aqueous phase liquid (LNAPL). The ISCO process involves injecting oxidants (substances readily reduced) and, in some instances, other reaction generating substances (catalysts) into contaminated areas of the subsurface. The oxidant reacts with the contaminant causing decomposition of the contaminant and the production of innocuous substances such as carbon dioxide and water. This reaction, called oxidation, is a chemical reaction characterized by the loss of one or more electrons from an atom or molecule. When an atom or molecule combines with oxygen, it tends to give up electrons to the oxygen in forming a chemical bond. Carbon in the form of organic carbon and manufactured hydrocarbons are common substances readily oxidized (reductants). For ISCO to effectively reduce contaminant concentrations, there must be direct contact between the oxidant and the contaminant. Typical oxidants used in or formed by ISCO applications are listed in Table 2-1 along with their associated oxidation strength, or the electrical potential measured in volts. Chlorine is commonly used as a reference to calculate the relative strength of oxidants. If the oxidant strength is listed as greater than 1.0, it is a stronger oxidant than Chlorine. Table 2-1. Oxidant strengths
Oxidant Standard Oxidation Potential (volts)
Relative oxidant strength (unitless) (Chlorine = 1)
Hydroxyl radical (•OH-)* 2.8 2.0 Sulfate radical (•SO4
-)** 2.5 1.8 Ozone (O3) 2.1 1.5 Sodium persulfate (Na2S2O8
2-) 2.0 1.5
Hydrogen peroxide (H2O2) 1.8 1.3 Oxygen (O2) 1.2 0.9
*This radical can be formed when ozone and H2O2 decompose. **This radical can be formed during activated sodium persulfate reactions. 2.2 Summary of ISCO Technologies ISCO technologies that effectively destroy petroleum hydrocarbons include hydrogen peroxide, Fenton’s solution (hydrogen peroxide with an iron catalyst), proprietary modified Fenton’s solutions, sodium persulfate, ozone, or a combination of these
3
oxidants. A summary of the ISCO technologies are discussed in more detail in the following sections.
2.2.1 Hydrogen peroxide and Fenton’s Reagent Hydrogen peroxide (H2O2) alone is an oxidant, although the addition of a ferrous iron (Fe+2) salt as a catalyst dramatically increases the oxidative strength of hydrogen peroxide. This increase is due to the production of hydroxyl radicals (•OH-). These hydroxyl free radicals are molecular fragments that have an unpaired electron, causing them to be highly reactive and short-lived. They rapidly attack organic contaminants and break down their carbon-to-carbon bonds. In some cases there may be sufficient Fe+2 in the treatment area, which eliminates the need for further iron augmentation. The reaction of iron-catalyzed peroxide oxidation at pH of 2.5-3.5 is called a “Fenton’s reaction”, named after its founder, H.J.H. Fenton. Ferric ions (Fe+3) are produced (oxidized from Fe+2) during the reactions, which if kept in solution, can be reconverted back to Fe+2 to continue hydroxyl radical production and continued reactions with COCs. Fenton’s reaction was initially developed at low H2O2 concentrations. However in practice, higher concentrations of H2O2 solutions, ranging from 3 to 35% by weight, are utilized. Any deviation from the traditional low-concentration Fenton’s solution is known as a modified Fenton’s system. Acids such as hydrochloric (HCl), sulfuric (H2SO4), and acetic (CH3COOH) are commonly used to lower the pH of the subsurface and to increase the solubility of iron. Iron solubility can also be maintained without inducing a pH change by the use of chelating agents, which are carboxyl groups of inorganic acids (oxalic and citric). The chelating agent EDTA (ethylenediamine tetra-acetic acid) is routinely used in modified Fenton’s systems. In low iron environments, acidified or chelated iron solutions can be injected with the H2O2 solution to act as a catalyst. Considerations for use of these hydrogen peroxide-based solutions include:
• Hydrogen peroxide and Fenton’s reactions increase the dissolved oxygen concentrations of groundwater that will enhance biodegradation.
• The effective porosity may be reduced with the precipitation of Fe+3 in soil. • Low pH can cause metals to be mobilized within the treatment zone. • Reactions of strong peroxide solutions (> 10%) are exothermic, although if
controlled, this heat can be used to enhance the desorption and dissolution of sorbed LNAPL.
• There is potential gas generation and volatilization of COCs. • Carbonate ions (high alkalinity) exert a strong demand on hydroxyl radicals and
acids. • ISCO is a non-selective process, therefore the oxidant will readily oxidize natural
organic matter (NOM) existing in soil along with the COCs, thereby reducing the ratio of volume of COCs oxidized per volume of oxidant.
4
2.2.2 Sodium persulfate Sodium persulfate (Na2S2O8) is the most common persulfate salt used for ISCO applications. This is due to the potential liberation of ammonia gas during injection of ammonium persulfate and potassium persulfate’s low solubility in water. The ISCO process consists of the dissociation of persulfate salts to persulfate anions (S2O8
2-) which are strong oxidants. The persulfate ion is a more powerful oxidant than hydrogen peroxide, although the hydroxyl radicals generated during hydrogen peroxide are kinetically faster in destroying COCs. Because the persulfate anion is kinetically slower in oxidation than the hydroxyl radical, its reaction with NOM is also much lower. The addition of heat or, as in a Fenton’s system, a ferrous iron salt or chelated ferric iron significantly increases the oxidative strength of persulfate due to the creation of sulfate free radicals (•SO4
-). The resulting solution from this modification is called activated sodium persulfate. The sulfate radical is kinetically faster than the persulfate anion. Some design considerations for the use of sodium persulfate include the following:
• Because the persulfate reaction with COCs is kinetically slower than with hydroxyl radicals, further distribution of the oxidant is possible prior to decomposition.
• Sodium persulfate has the potential to lower the pH in groundwater, although many soils have the capacity to buffer this low pH.
• Persulfate has the ability to degrade soft metals (e.g. copper or brass). • The use of chelated iron may increase the longevity of iron in groundwater. • Low pH can cause metals to be mobilized within the treatment zone. • As with all ISCO applications, the increase of NOM reduces the ratio of volume
of COCs oxidized per volume of oxidant.
2.2.3 Ozone Ozone-based ISCO processes are unique as compared to the processes described previously because ozone application usually involves injection of gas as opposed to liquid. Ozone (O3), a strong oxidant, is an allotrope (structurally different) of oxygen and is more soluble than oxygen in water. Ozone is commonly injected into the vadose zone, sparged below the groundwater table, or injected or re-injected as ozonated water (ozone dissolved in water prior to injection). When ozone is delivered as a gas, design and operational issues are very different than with the liquid applications of ozonated water or other liquid oxidant applications (peroxide and persulfate). Ozone reactions with COCs can occur as direct oxidation by ozone itself or as indirect oxidation which includes the production of hydroxyl radicals. Direct oxidation involves the direct insertion of the ozone molecule into unsaturated carbon-carbon bonds forming an ozonide. Indirect oxidation, a faster reaction than direct oxidation, is caused by the reaction with the hydroxide ion at neutral to basic pH, which forms hydroxyl radicals. A chain reaction is also initiated causing the formation of new radicals. Hydroxyl radical formation is enhanced in the presence of ultraviolet light (ex-situ application) and by the reaction with certain cations.
5
Common soil matrix components can consume ozone prior to, along with, or instead of the ozone reaction with contaminants. These components include naturally occurring humic acids (oxidation products), tertiary alcohols (i.e. tert-butyl alcohol [TBA]), elevated concentrations of bacteria biomass, total organic carbon (TOC), iron, manganese, hydrogen sulfide, and carbonates. Ozone implementation design issues include:
• Ozone decomposition provides oxygen to the microbial community, although in high concentrations or long injection times, it can be a sterilizing agent.
• Groundwater with high carbonate concentrations can limit the effectiveness of ozone.
• There is potential gas generation and volatilization of COCs due to oxidation and sparging activities.
• Low pH caused by reactions can cause metals to be mobilized within the treatment zone.
• As with all ISCO applications, the increase of NOM reduces the ratio of volume of COCs oxidized per volume of oxidant.
Application of ozone in combination with hydrogen peroxide (perozone) results in enhanced generation of hydroxyl radicals by reactions of peroxide and ozone independently and with intermediate products. 2.3 Site Characterization One of the most important factors in the success of any remediation project is the completion of an adequate site characterization. A conceptual site model should be created that incorporates the location and mass of COCs, an understanding of the geology and hydrogeology, aquifer geochemistry, major migration pathways for the COCs, groundwater flow direction/gradient, and the identification of surface and subsurface structures, underground utilities, and potential receptors in the area. Although the oxidants listed in Table 2-1 can successfully oxidize COCs, the site-specific success of the oxidant is reliant upon the reaction rate and the effective distribution of the oxidant. Reaction rates of oxidants are dependent on many subsurface parameters including temperature, pH, concentration of the COCs, reaction by-products, and other naturally occuring reductants. These parameters must be evaluated during site characterization, prior to the design of ISCO implementation. Site characterization components are discussed in the following sections.
2.3.1 Physical Parameters Since successful ISCO applications are dependent on the transmission of oxidants to contaminated areas, soil effective porosity (soil permeability), hydraulic conductivity, and soil heterogeneity become major evaluation factors. ISCO injections into soil with higher effective porosity usually yield greater transport rates and more uniform distribution (radius of influence) of injected oxidants than in soil with low or variable effective porosity. The distribution of oxidants is also very dependent upon the horizontal and vertical heterogeneity of the treatment area soils. Soil moisture content is
6
also an important physical measurement, especially in the application of ozone gas to the vadose zone. In soils of low permeability and/or high moisture content, advective flow of the ozone gas is restricted. The presence of manmade (i.e. utility conduits, boreholes) or natural (i.e. former stream channel materials) conduits can provide preferential pathways for the migration of contaminants, injected oxidation reagents, and products from the reactions.
2.3.2 Chemical Parameters Collection of groundwater samples and soil samples from locations above and below the water table is important in determining the vertical and horizontal delineation of contaminants and the mass of the dissolved, sorbed, and LNAPL phase contaminants. If the location and mass of the contamination is not identified, leaching of COCs to groundwater will continue to occur, and dissolved COC concentrations in groundwater will not decrease in a timely manner. In addition, contaminants may change from LNAPL or sorbed phase to dissolved phase during ISCO applications, increasing dissolved phase COC concentrations. The contaminant load in all phases along with natural chemical and physical components of soil and groundwater which consume the oxidant is called the total oxidant demand (TOD). The natural oxidant demand components consist of dissolved- and solid-phase reduced minerals, and dissolved- and sorbed-phase NOM, usually represented by total organic carbon (TOC) measurements. The measurement of baseline pH of the groundwater is important, especially when activated persulfate and Fenton’s Reagent are injected. Lower pH promotes the production of hydroxyl radicals by keeping iron in solution. Alkalinity is a measure of the carbonate and bicarbonate concentrations in water. Measurement of alkalinity is important because:
• It helps determine the amount of acid required to reduce the pH level for Fenton’s injections.
• Hydroxyl radicals are scavenged in the presence of highly alkaline water. • High carbonate concentrations can limit the effectiveness of oxidation by ozone.
Oxidation-reduction Potential (ORP), sometimes referred to as redox or Eh, is a measure of the oxidizing environment and can be used to determine oxidant movement through the subsurface. Positive values of redox indicate oxidizing conditions. The dissolved oxygen (DO) concentration in groundwater and distribution throughout the contaminant plume can indicate contaminant movement, degradation, or plume stability. The DO concentration usually reflects its organic contaminant load (the lower the DO, the greater the contaminant concentrations). Baseline DO is also important because following peroxide, Fenton’s systems, and ozone reactions, the DO concentrations should increase. A temperature increase of the groundwater is usually detected immediately after injection of hydrogen peroxide. The specific conductivity of groundwater frequently increases
7
following injections and can be used to determine the extent of oxidant dispersion. Oxygen and carbon dioxide emissions often increase from the injection well after injections. In all ISCO projects it is important to determine the concentrations of metals in soil and groundwater. ISCO processes can oxidize some metals, such as iron, chromium, and selenium, to more soluble forms, thereby increasing their mobilization potential. The characterization should include analyzing arsenic, barium, cadmium, chromium, copper, iron, lead, and selenium. The concentration of Fe+2 should be measured and the result used to estimate the amount of iron, if any, to be injected with activated persulfate, Fenton’s, or modified Fenton’s applications. If baseline iron content is high and the amount of iron in injections is not reduced accordingly, overdosing of iron could be the result. Overdosing of iron may result in reduction of aquifer permeability (due to formation of iron oxides) and thereby reduce the overall distribution of the oxidant. If alkalinity, pH, DO, and ORP results are inconclusive in determining the chemical characteristics of groundwater, a general mineral analysis may be useful to determine baseline levels and to track changes in mineral composition during oxidation in the groundwater. Minerals included in this analysis would include total dissolved solids (TDS), major anions (chloride, sulfate, nitrate, fluoride), and major cations (calcium, sodium, magnesium, potassium, and manganese). Sulfate measurements are very important prior to and during persulfate applications to determine the effectiveness of the oxidant distribution. The concentration and volume of the oxidant during full-scale implementation must be sufficient to overcome all of the above TOD components throughout the contaminant plume with consideration of potential heterogenous soil conditions and changing contaminant loads. This underscores the importance of a complete site characterization to accurately estimate the contaminant mass and identification of the magnitude of other oxidant scavengers. 2.4 Pilot Testing The success of an ISCO application in remediating contaminant mass is largely dependent on the determination of the appropriate concentration, volume of oxidant and oxidant delivery parameters (e.g. pressure) to achieve an effective radius of influence (ROI) to remediate the contaminant mass. Oxidant delivery parameters can be estimated based on the site-specific soil characteristics and site geohydrology. To accurately determine these parameters, pilot testing must be completed.
2.4.1 Bench-scale Testing In order to determine accurate oxidant injection volume, the TOD of the contaminated zone must first be determined. Bench-scale pilot testing can be used to calculate the TOD, to quantify treatment efficiencies of the oxidant with the COC, to determine the potential for metals mobilization, and ultimately, to estimate the oxidant injection volume and concentration.
8
Bench-scale test methods to determine TOD include simple colorimetric testing techniques and the examination of the biogeochemical state of the aquifer. The colorimetric techniques determine the TOD by comparing coloration in varying ratios of oxidant mass to soil mass in separate vials; or by applying excessive oxidant to a single soil or groundwater sample and, following the reaction of the two, titrating back the oxidant with a reductant. Although bench-scale testing can produce usable results, it is difficult to estimate field-scale oxidant demands based on bench-scale pilot tests, because of the following:
• The results of the bench-scale test may or may not be linearly applied to field-scale implementation.
• Bench-scale tests are usually based on well mixed static systems, unlike natural systems.
• Bench-scale tests usually do not address the potential heterogeneity of the subsurface.
The TOD calculated from the bench-scale test can be important in identifying oxidant volume and concentration starting points in field-scale pilot testing. Field-scale testing refines the oxidant volume and concentration and determines the injection ROI. If a field-scale test is not feasible (e.g. small contaminant plume or inability to complete a field-scale pilot test), the oxidant injection ROI can be estimated. ROI estimation is based on the effective porosity and the heterogeneity of the soil within the zone to be treated. Literature states that ROIs for injections range from 2.5 to 10 feet for tight clays, to 15 to 20 feet in permeable saturated soils. Faster-reacting oxidants (i.e. Fenton’s system) will be more limited than slower-reacting oxidants (i.e. activated persulfate) in the distance that they can travel in the subsurface without being consumed.
2.4.2 Field-scale Pilot Testing A field-scale pilot test should be conducted to determine parameters for full-scale design of ISCO implementation. The injection parameters to be determined are: oxidant concentration and injection volume, injection rates, injection pressures, and radius of influence. Based on these parameters, full-scale injection can be designed which would include injection point spacing, frequency of injections, as well as full-scale remediation costs. Effective field-scale pilot tests are conducted on-site at a location that is most representative of site conditions. This location should be in an area with contamination but cross-gradient of the contaminant plume to insure that contaminants will not flux into the treated area. If contaminants flux into the pilot test treatment area, effects of the ISCO process can not be accurately determined through monitoring. If geology varies (soil heterogeneity) significantly throughout the plume area, similar pilot tests may be implemented at multiple locations.
9
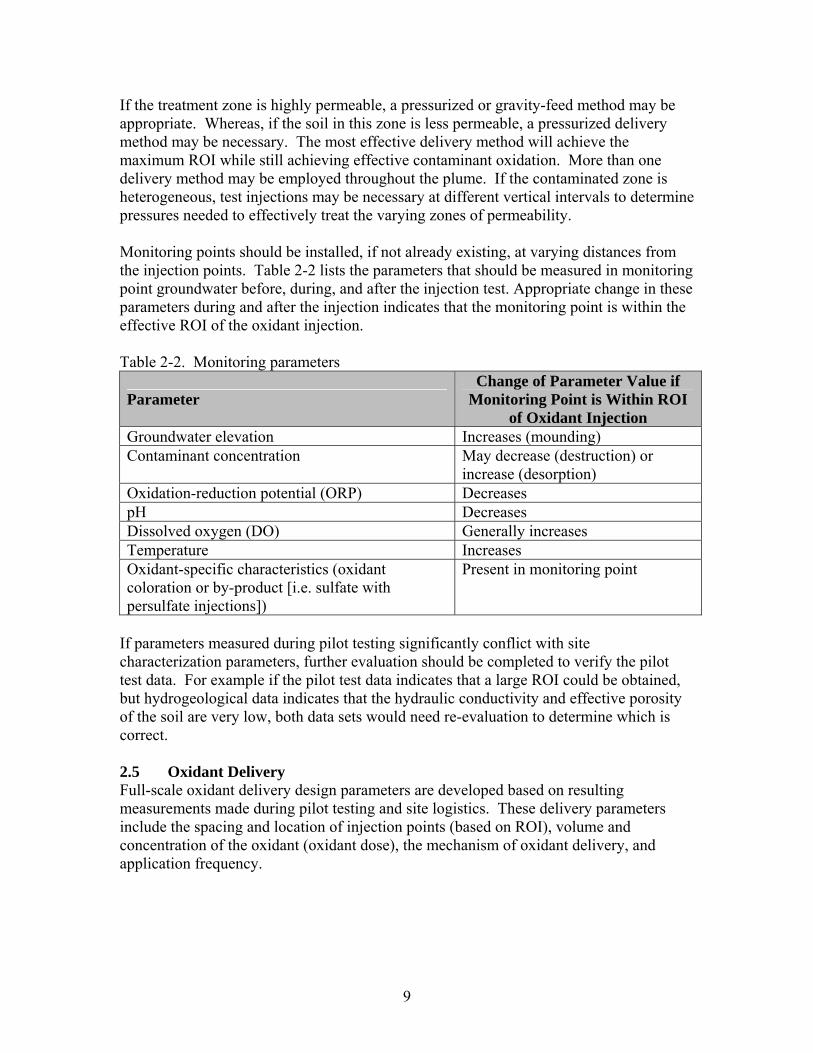
If the treatment zone is highly permeable, a pressurized or gravity-feed method may be appropriate. Whereas, if the soil in this zone is less permeable, a pressurized delivery method may be necessary. The most effective delivery method will achieve the maximum ROI while still achieving effective contaminant oxidation. More than one delivery method may be employed throughout the plume. If the contaminated zone is heterogeneous, test injections may be necessary at different vertical intervals to determine pressures needed to effectively treat the varying zones of permeability. Monitoring points should be installed, if not already existing, at varying distances from the injection points. Table 2-2 lists the parameters that should be measured in monitoring point groundwater before, during, and after the injection test. Appropriate change in these parameters during and after the injection indicates that the monitoring point is within the effective ROI of the oxidant injection. Table 2-2. Monitoring parameters
Parameter Change of Parameter Value if
Monitoring Point is Within ROI of Oxidant Injection
Groundwater elevation Increases (mounding) Contaminant concentration May decrease (destruction) or
increase (desorption) Oxidation-reduction potential (ORP) Decreases pH Decreases Dissolved oxygen (DO) Generally increases Temperature Increases Oxidant-specific characteristics (oxidant coloration or by-product [i.e. sulfate with persulfate injections])
Present in monitoring point
If parameters measured during pilot testing significantly conflict with site characterization parameters, further evaluation should be completed to verify the pilot test data. For example if the pilot test data indicates that a large ROI could be obtained, but hydrogeological data indicates that the hydraulic conductivity and effective porosity of the soil are very low, both data sets would need re-evaluation to determine which is correct. 2.5 Oxidant Delivery Full-scale oxidant delivery design parameters are developed based on resulting measurements made during pilot testing and site logistics. These delivery parameters include the spacing and location of injection points (based on ROI), volume and concentration of the oxidant (oxidant dose), the mechanism of oxidant delivery, and application frequency.
10
2.5.1 Oxidant Volume In theory, the volume of oxidant necessary to achieve the desired injection point ROI is equivalent to the pore spaces (porosity) within the ROI. As oxidant is delivered, it displaces the liquid or gas within the pore spaces. In reality, the volume of oxidant injected relies on the heterogeneity of the subsurface and preferential pathways of fluid migration. In addition, diffusion and dilution of the oxidant occurs as the oxidant fluid displaces or mixes with the pore space fluid. Therefore, the volume of the oxidant to be delivered is the volume injected during the pilot test which effectively reduces the COC concentrations at a specific ROI. Oxidant injection volumes may vary dependent upon the contaminant mass distribution and heterogeneity throughout the contaminant plume. For example, the contaminant source area may require a higher density of injection points and oxidant volume than an area located downgradient of the source. As with other remediation method designs, ISCO applications require overlap of injection ROIs. If the design ROIs cannot be achieved using existing injection points, additional points must be installed.
2.5.2 Oxidant Concentration Concentrations of peroxide/Fenton’s injections typically range from 3 to 35% hydrogen peroxide (by weight). Hydrogen peroxide is sometimes added without the iron catalyst for the purpose of enhancing the bioremediation of COCs by increasing the DO in groundwater. In these cases the concentration of hydrogen peroxide is lower, approximately 3 to 20%. In other cases, hydrogen peroxide is added at higher concentrations up to 35% for the purpose of desorbing NAPLs via the production of heat. Higher concentrations may increase the chance of pressure and gas generation in the subsurface, and in situations of shallow groundwater, it may cause displacement of the water and flooding at the surface. The solubility of sodium persulfate allows for a solution concentration of up to 25%, although concentrations of no more than 12% are generally injected to prevent corrosion to delivery equipment. The optimal iron catalyst (ferrous salts or chelated ferric iron) load is 100 to 200 milligrams per liter (mg/L). Sodium bicarbonate, at 20% of the persulfate load, is sometimes added to slow reactions and increase dispersion. Ozone is typically produced on site using an ozone generator (or concentrator), and injected at concentrations from 5 to 10% (by weight) if the generator input is oxygen, and approximately 1% with atmospheric air input. Aqueous equilibrium ozone concentrations are generally in the range of 5 to 30 mg/L. To maximize mass transfer to groundwater, ozone is commonly delivered via sparge screens with very small orifices so that small bubbles form. Ozone is usually injected at continuous flow rates of less than 1 standard cubic foot per minute (scfm).
11
2.5.3 Oxidant Delivery Method Typical ISCO delivery methods include gravity or pressurized injections on a periodic frequency. In some cases, the oxidant is delivered continuously using manifolded delivery piping to the injection points. Hydrogen peroxide without a catalyst is commonly delivered via gravity-feed into injection wells or existing monitoring wells on a periodic frequency. Fenton’s systems are commonly delivered via batch addition that consists of gravity or pressurized delivery utilizing a mobile injection unit with specialized pumping equipment and injection points, or by a pressurized continuous-feed system manifolded to injection points throughout the plume. This type of injection is usually completed by delivering the oxidant to the deepest injection interval and moving upwards (“bottom up” technique). If an acid is needed to lower the subsurface pH to the desired 3.5 to 5 for Fenton’s system, it must be added to the subsurface prior to peroxide/catalyst application. The injection tools are usually customized for ISCO delivery and usually consist of screened intervals of 10 to 20 feet. If the pH is adjusted with acid, stainless steel injection points are required. Packers employed above injection intervals generally will allow for greater distribution distance by preventing vertical migration of the oxidant up the borehole annulus. The two primary methods of delivering sodium persulfate are batch addition on a periodic frequency and by recirculation. Recirculation involves gravity or pressurized delivery with periodic or continuous frequency, and extraction of groundwater at points located downgradient of the injections. The extracted water is then treated for remaining contaminants, mixed, and reinjected. Recirculation is more suited to sodium persulfate than hydrogen peroxide, since sodium persulfate is more persistent in the subsurface. Ozone is usually delivered as ozonated water for injection or via sparging below the groundwater table. Sparge designs are equivalent to standard in-situ biosparging systems. Multiple injection points are manifolded together and sometimes sparged in groups or clusters. The ozone generator will produce flow rates of 0.25 to 2 scfm, which are adjusted according to the volatility of the COCs. With volatile COCs present (i.e. BTEX), sparge rates must be in the lower range or fugitive vapors must be recovered via soil vapor extraction. Ozone is corrosive to many materials, so stainless steel, Teflon, and Kynar should be utilized in remediation system construction materials. In some cases, delivery methods are enhanced by soil fracturing conducted prior to oxidant delivery to enhance hydraulic conductivity and increase the injection ROI. This process is used primarily in low-permeability soils and bedrock and should also be pilot tested to ensure the effectiveness of the application. The fracturing may significantly increase the hydraulic conductivity of the aquifer, although this increase in flow capability is usually through preferential pathways (fractures) and may not come into contact with COCs in soils outside of the fractures. If contamination persists throughout a vertical zone of heterogeneity, it may be necessary for the oxidant to be delivered at different pressures to treat the varying permeability throughout the contaminated zone.
12
If ISCO is applied to contamination in the vadose zone, the oxidant must be evenly dispersed throughout the contaminated soil matrix. This may require hydration of vadose zone soils during injection because water is the reaction medium. Peroxide and persulfate mixtures are sometimes co-injected. This combination of oxidants may be more effective because of the higher oxidation potential of hydroxyl radicals and the persistence of persulfate for greater dispersion. In a perozone system, hydrogen peroxide is injected immediately prior to an ozone injection to increase the oxidation potential of these oxidants.
2.5.4 Monitoring Performance monitoring (during application) and post-application monitoring are important components of the ISCO process. Evaluation of monitoring results will:
• Determine the effectiveness of the ISCO application. • Confirm delivery parameters. • Determine if adjustments to delivery parameters are necessary. • Determine whether the process is meeting time to cleanup milestones.
Monitoring points should be located downgradient of injection locations, but not so close as to exaggerate effectiveness. Performance monitoring usually occurs on a more frequent schedule than post-implementation monitoring, because performance monitoring includes establishing baseline conditions and assessing the effectiveness of ISCO injections at the frequency of the injections. Measurements to determine baseline conditions should include COC concentrations, pH, ORP, DO, and by-products that will potentially be generated by the ISCO process (i.e. sulfate prior to persulfate injections). During performance monitoring, pH, temperature, ORP, DO, specific conductivity, Fe+2, sulfate, and CO2 should be measured at injection and monitoring points. COC concentrations should be measured at monitoring points only. When the oxidant is correctly applied to the subsurface so that the oxidant comes into contact with contamination, contamination is desorbed from soil and to some degree transferred to dissolved phase in groundwater. If there is a sufficient volume of oxidant applied, a good portion of this dissolved contamination is subsequently destroyed and concentrations in groundwater will decrease. If contamination initially resides primarily in the dissolved phase, with minimal sorbed contamination, concentrations may not increase following the oxidant application, but will immediately begin to decrease. With either of the two scenarios described above, the increase of DO in groundwater will enhance biodegradation of remaining contamination. Other issues to be considered during performance monitoring are displacement of contaminated groundwater and COC vapor generation. Contaminated groundwater may be displaced to other portions of the site as opposed to being destroyed by the oxidant. An indicator of this situation is if COC concentrations decrease at wells near the injection point but increase in other wells. If concentrations decrease at all monitoring points, displacement is probably minimal. Vapor phase petroleum hydrocarbons, and possibly
13
COC concentrations, should be measured in soil vapor as additional volatilization may occur during oxidant injection. The primary objective of post-application monitoring is to track the oxidative-reductive state of the aquifer and to evaluate COC levels according to proposed cleanup milestones. This objective can be accomplished with the measurement of COC concentrations, pH, ORP, and DO in monitoring points. Mass removal rates can be calculated based on the estimated total mass throughout the contaminant plume. Calculation of mass removal rates allows for the determination of COC reduction. 2.6 ISCO Implementation with Other Remedial Technologies ISCO is sometimes implemented in conjunction with soil excavation or traditional mass transfer technologies such as air sparging, soil vapor extraction, or dual-phase extraction. In many cases, these other technologies are used to mitigate the immediate source area and/or the core of the contaminant plume where LNAPL may still be present. ISCO is then implemented to mitigate the plume outside of the source area. In addition, other technologies may be used at sites where complex mixtures of contaminants, geologic/hydrogeologic limitations, or site logistic limitations are present. 2.7 Site Logistics Contaminated soil and groundwater zones are often present in the vicinity of currently operating USTs. The presence of UST systems and/or utilities can make the application of ISCO infeasible because of the following potentially negative effects:
• Peroxide and persulfate applications can be corrosive • Peroxide applications can be exothermic • The delivery of oxidants may involve extreme pressures (pneumatic or hydraulic
fracturing), which may cause negative effects on UST systems. The location of contaminated media in relation to site structures could also hinder the success of ISCO. If contaminants have migrated to below these onsite structures, it may not be possible for the injection of the ISCO product to fully address the contaminated media. In addition, injection points must be located at safe distances from sub-grade structures (i.e. basements) so as not to cause ISCO off-gas vapors or liquids from entering the structure through slab or wall fractures. 2.8 Health and Safety and Regulatory Concerns This report does not address oxidant chemicals and reaction by-products as they relate to contractor health and safety. As with any oxidizing chemical, appropriate care should be taken with the storage, handling and distribution of the oxidants. An appropriate health and safety plan, specific to the chemicals being utilized, should be prepared and followed. Any underground injection into a well is prohibited unless the well is authorized by rule or authorized by an Underground Injection Control (UIC) permit. Injection well owners are required by law to submit inventory information to USEPA or the state delegated agency. In addition, UIC owners must not endanger underground sources of drinking water (USDWs).
14
3.0 Evaluation of Colorado Sites
The OPS identified 20 LUST sites in Colorado at which ISCO was implemented as a component of, or as the sole remediation method, in the approved CAP. These sites were evaluated to determine the effectiveness of the different ISCO products being approved for remediation and to determine which, if any, site characteristics or ISCO-related activities conducted have an impact on the success of the ISCO approach. The study sites were identified by querying the OPS database (COSTIS) to determine release events for which ISCO was utilized as a partial or sole remediation approach. At all of the sites selected, ISCO was implemented along with or following the implementation of another active remedial technology (i.e. excavation, air sparge/soil vapor extraction, dual-phase extraction, or bioremediation). ISCO was implemented at these sites generally because a remedial approach (including monitored natural attenuation) failed to completely remediate the contamination. The types of oxidants that were injected at the 20 sites consist of:
• Hydrogen peroxide (10 sites). • Fenton’s solution (4 sites). • Persulfate and catalyst (1 site). • Hydrogen peroxide with persulfate and catalyst (1 site). • Proprietary modified Fenton’s solutions (4 sites).
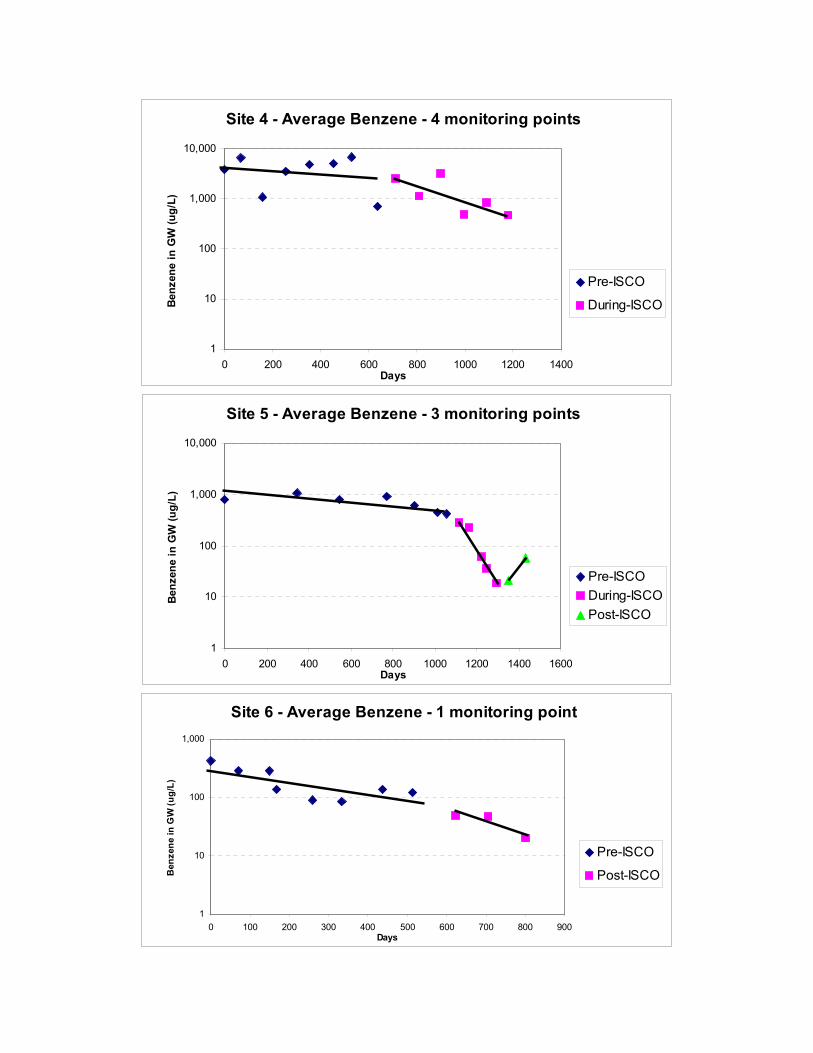
Prior to determining the reasons for success or failure of the ISCO applications, OPS first identified sites at which the ISCO application was successful. The process used to determine which ISCO applications were successful is discussed in the following section. 3.1 Evaluation of ISCO Success Successful ISCO applications result in the significant destruction of contaminant mass through initial oxidation and subsequent enhanced biodegradation in groundwater brought on by increased dissolved oxygen. Therefore, OPS determined ISCO application success at the Colorado sites by evaluating contaminant concentration reductions in groundwater. Because benzene is usually the driver for remediation and site closure in Colorado, reduction in benzene was used as the primary success indicator. An important factor in determining whether the ISCO application is the source of COC destruction is the presence or absence of other remedial activities, including natural attenuation, occuring prior to and during ISCO applications. At 13 of the 20 sites, other remedial methods (excluding MNA) were implemented and shutdown at least two years prior to ISCO applications. Remediation (other than ISCO) at five of the remaining seven sites was implemented within two years prior to ISCO, although due to the distance upgradient of the ISCO applications and COC concentration trends prior to ISCO, it was determined that the effect of these remediation technologies had minimal effect on results attributed to ISCO. At sites 8 and 10, other remedial approaches were conducted in conjunction with ISCO applications, although remediation (regardless of the technology) was not considered successful.
15
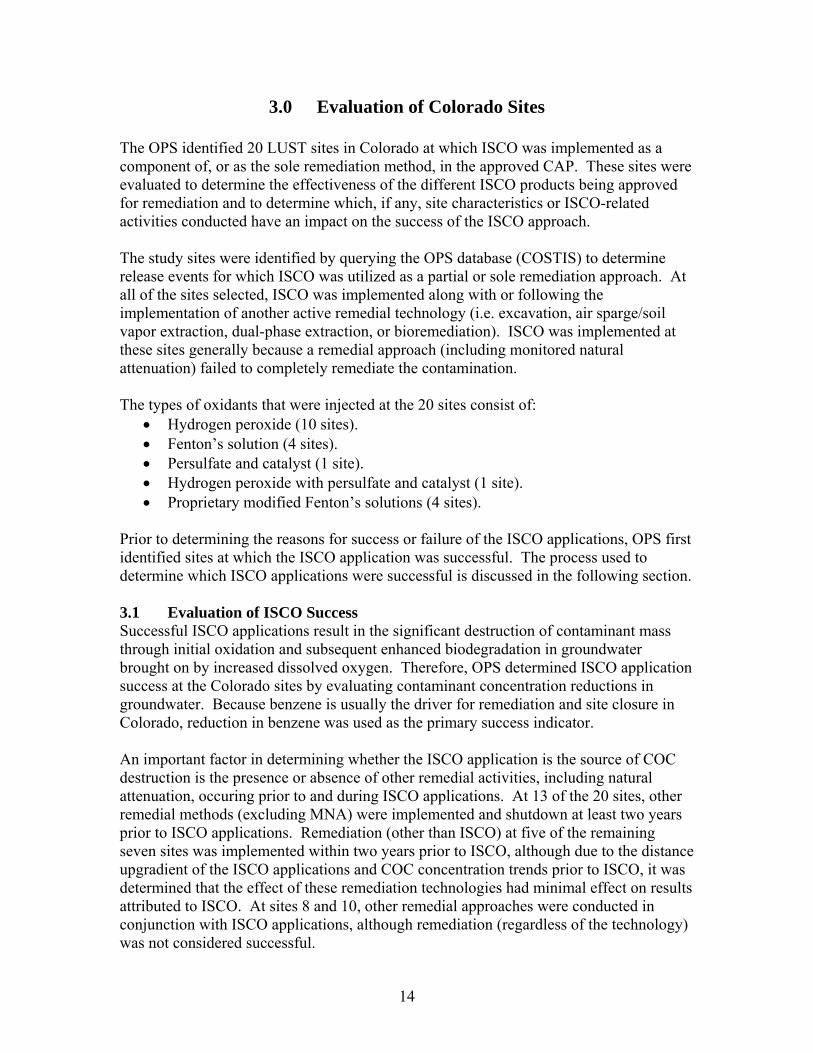
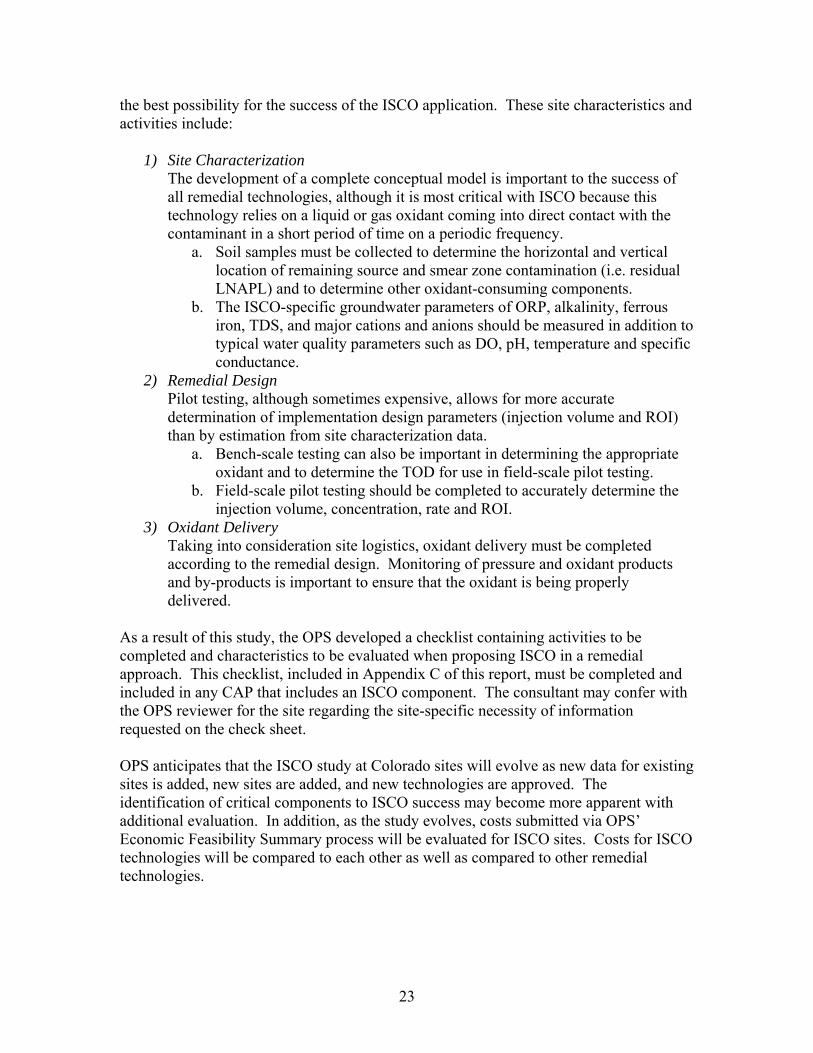
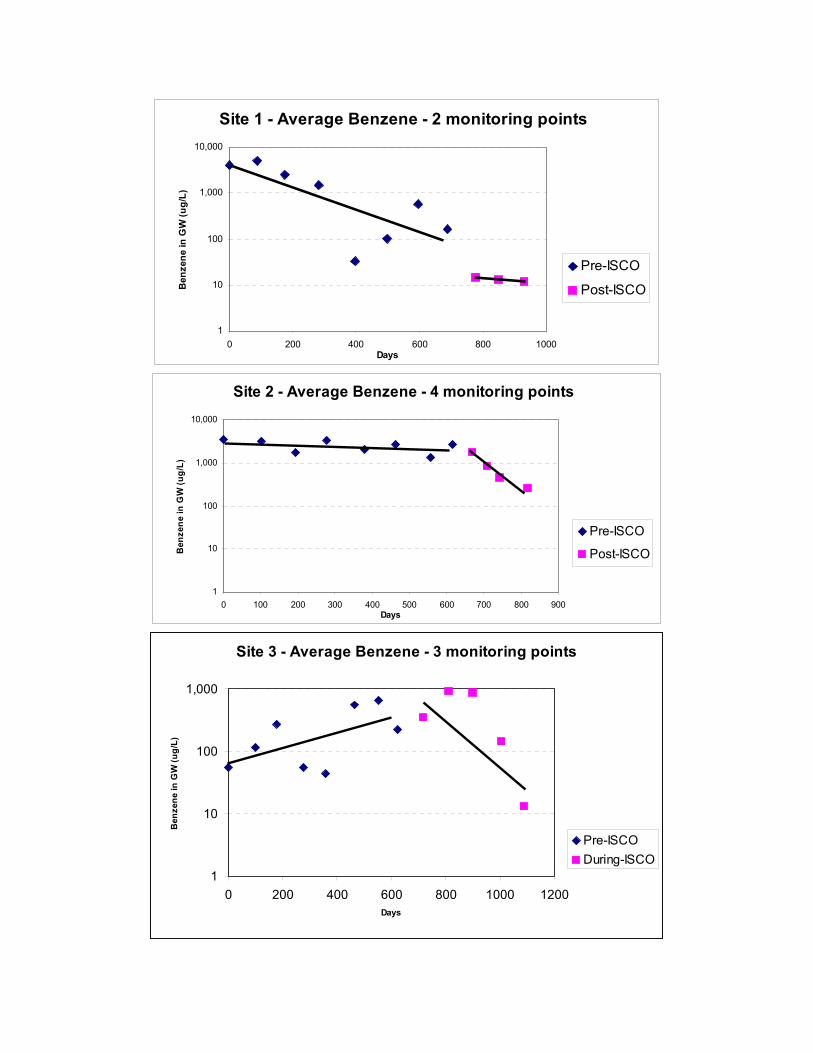
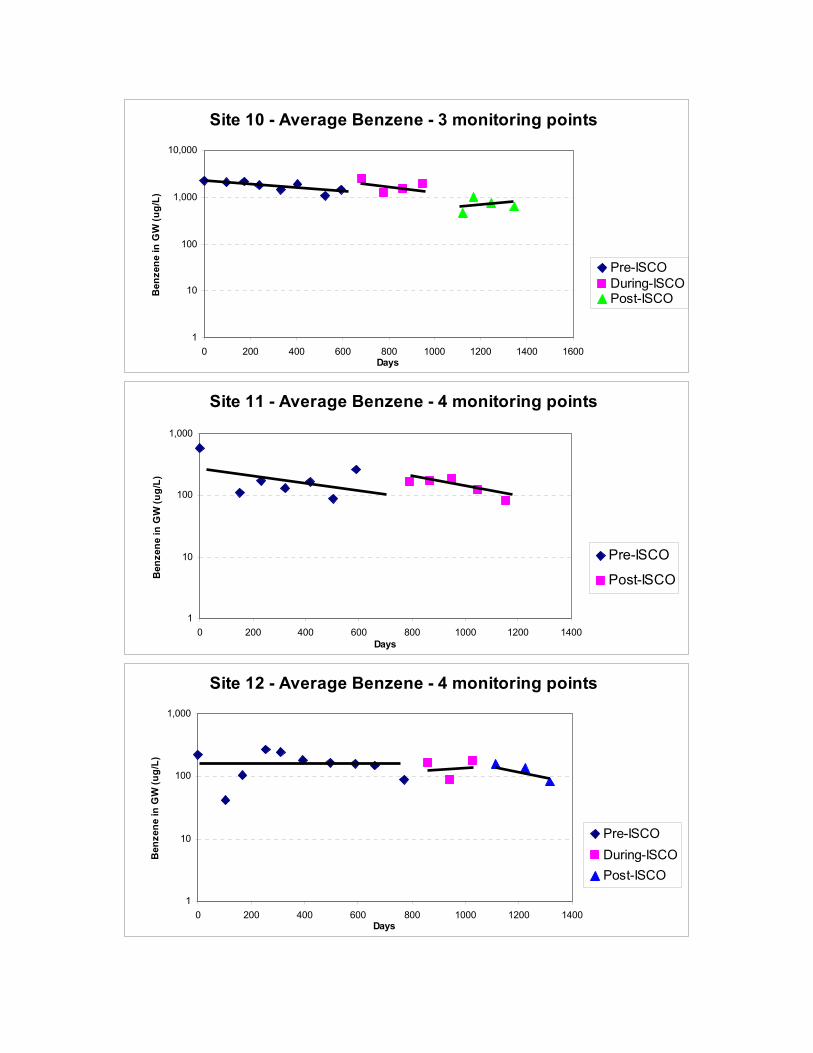
For each of the 20 sites, benzene concentrations were logarithmically plotted against linear time and trend lines were added to the data. Each of these plots are included in Appendix B. A site was deemed successful if the contaminant concentrations were significantly reduced from pre-ISCO concentrations and if natural attenuation did not appear to have a significant impact on this reduction as illustrated by the pre-ISCO trend line. Results of the trend evaluations for all sites are illustrated in Table 3-1. OPS determined that ISCO had a significant effect at reducing benzene concentrations at only three sites (2, 1, and 3), and future data may indicate ISCO success at two additional sites (4 and 5). Table 3-1. ISCO Success at Colorado Sites as a Result of Benzene Trend Evaluation Results of Trend Evaluation Number of Sites ISCO application had significant effect on dissolved benzene concentrations in groundwater apart from natural attenuation or other factors.
3
Future data may indicate that ISCO application had significant effect on dissolved benzene concentrations.
2
ISCO application had no significant effect in reducing benzene concentrations apart from natural attenuation or other factors.
15
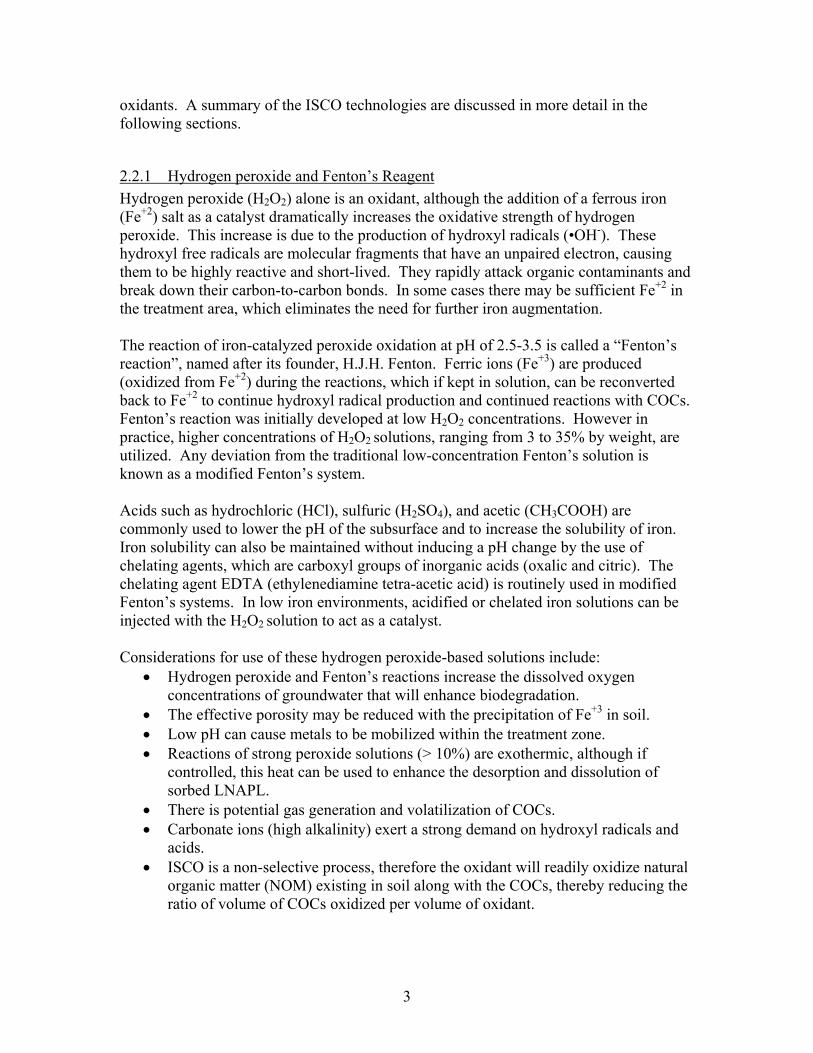
Total number of sites evaluated 20 Four examples of the trend analysis described above are illustrated in Figures 3-1 through Figure 3-4. Figure 3-1 shows pre-ISCO and post-ISCO benzene concentrations and trend lines for site 2, clearly indicating insignificant natural attenuation prior to ISCO implementation and significant reduction of benzene concentrations following ISCO. Therefore, ISCO at this site was considered successful. Figure 3-1. Average Benzene Concentrations at Site 2
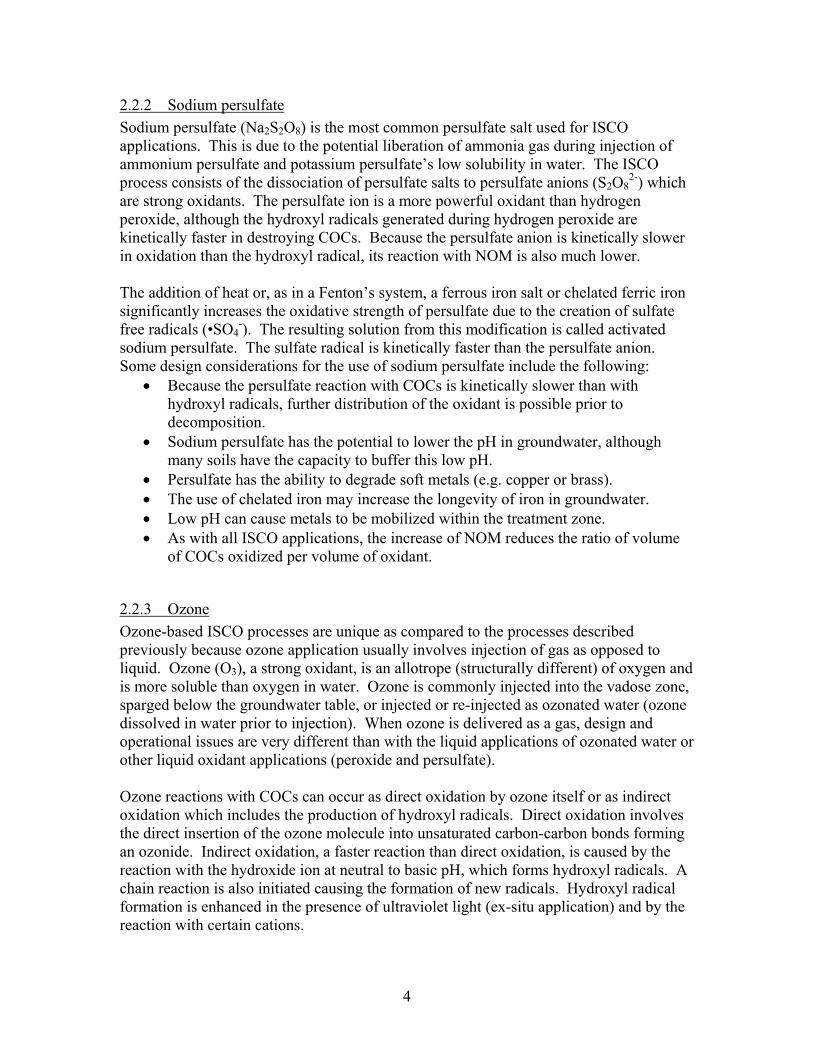
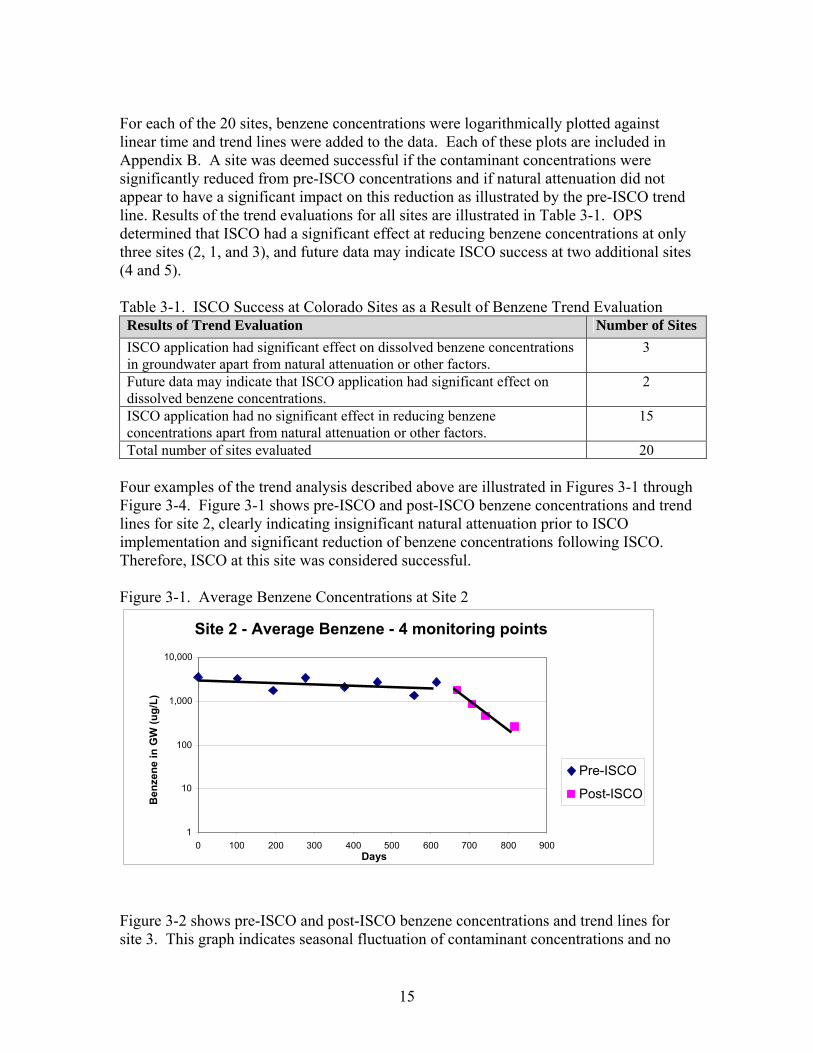
Figure 3-2 shows pre-ISCO and post-ISCO benzene concentrations and trend lines for site 3. This graph indicates seasonal fluctuation of contaminant concentrations and no
Site 2 - Average Benzene - 4 monitoring points
1
10
100
1,000
10,000
0 100 200 300 400 500 600 700 800 900Days
Ben
zene
in G
W (u
g/L)
Pre-ISCO
Post-ISCO
16
identified natural attenuation prior to ISCO implementation. It appears that the ISCO application caused initial desorbing of contamination from soil to dissolved phase, followed by destruction of this contamination. Therefore, ISCO at this site was considered successful. Figure 3-2. Average Benzene Concentrations at Site 3
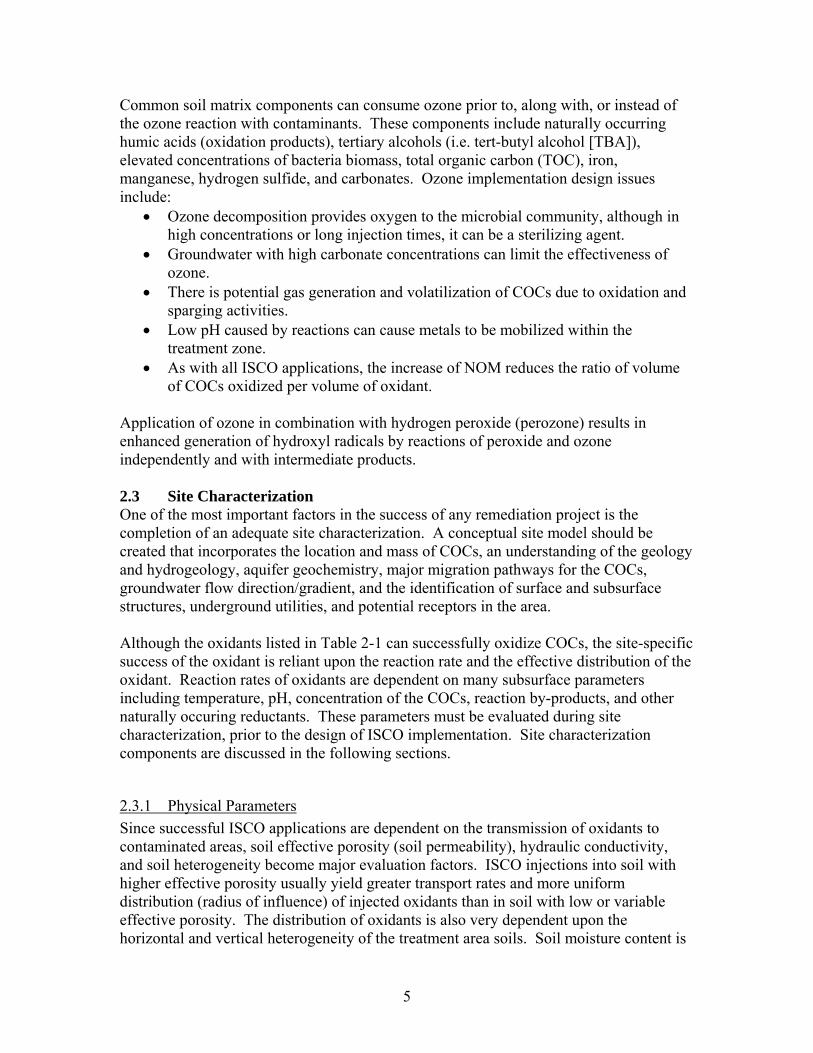
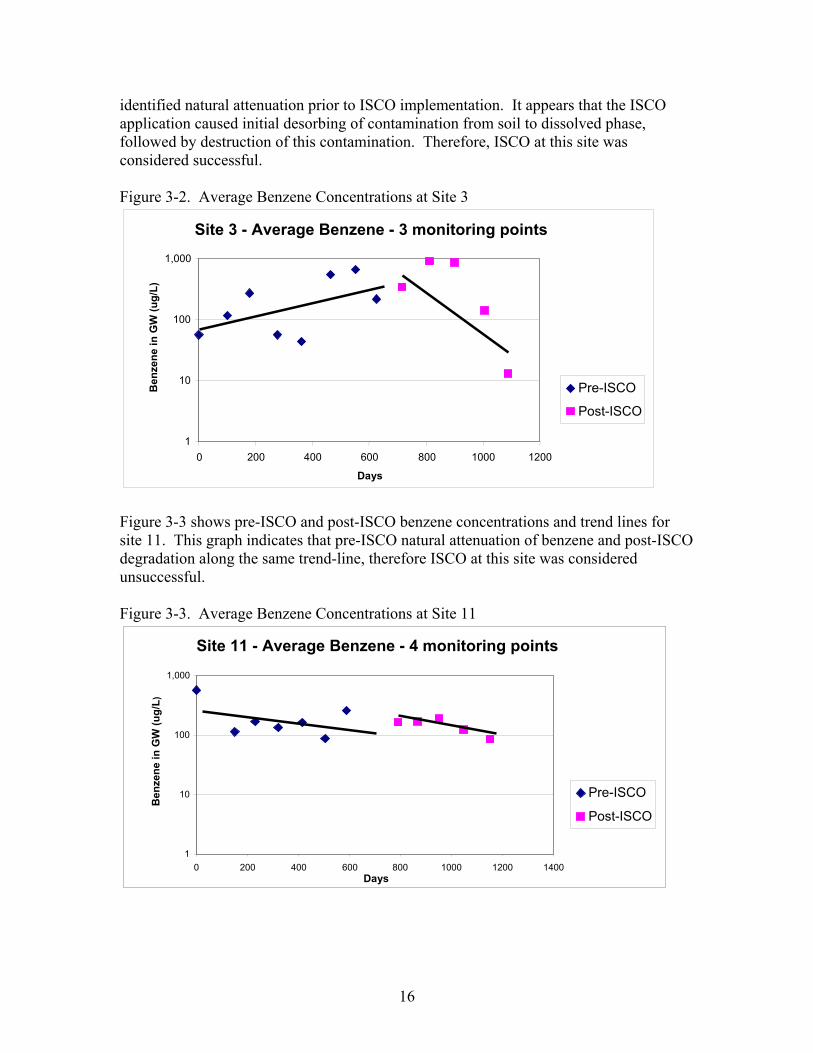
Figure 3-3 shows pre-ISCO and post-ISCO benzene concentrations and trend lines for site 11. This graph indicates that pre-ISCO natural attenuation of benzene and post-ISCO degradation along the same trend-line, therefore ISCO at this site was considered unsuccessful. Figure 3-3. Average Benzene Concentrations at Site 11
Site 3 - Average Benzene - 3 monitoring points
1
10
100
1,000
0 200 400 600 800 1000 1200
Days
Ben
zene
in G
W (u
g/L)
Pre-ISCO
Post-ISCO
Site 11 - Average Benzene - 4 monitoring points
1
10
100
1,000
0 200 400 600 800 1000 1200 1400Days
Ben
zene
in G
W (u
g/L)
Pre-ISCO
Post-ISCO
17
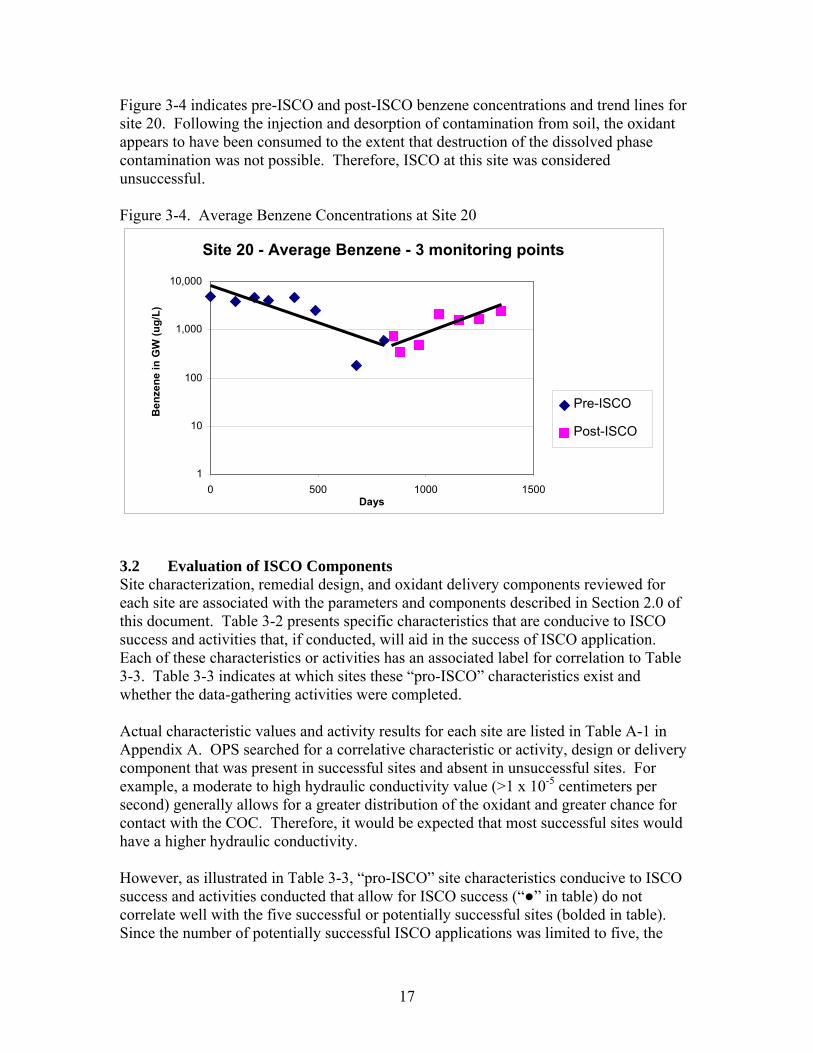
Figure 3-4 indicates pre-ISCO and post-ISCO benzene concentrations and trend lines for site 20. Following the injection and desorption of contamination from soil, the oxidant appears to have been consumed to the extent that destruction of the dissolved phase contamination was not possible. Therefore, ISCO at this site was considered unsuccessful. Figure 3-4. Average Benzene Concentrations at Site 20
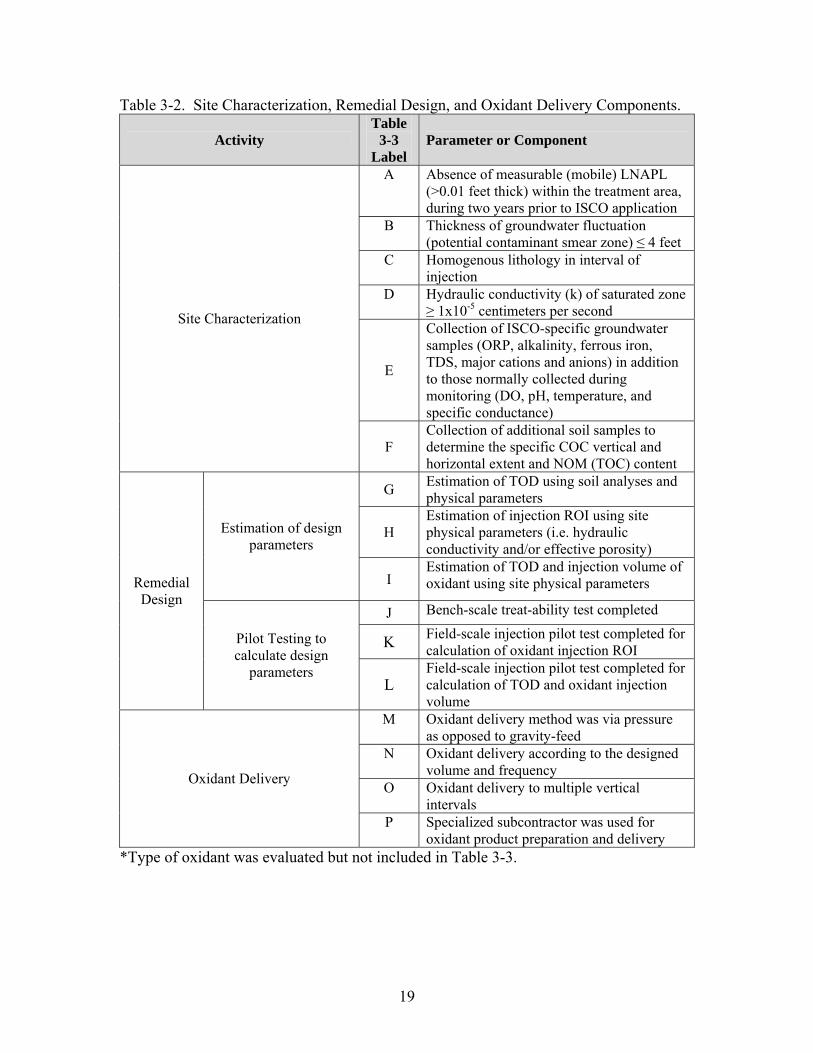
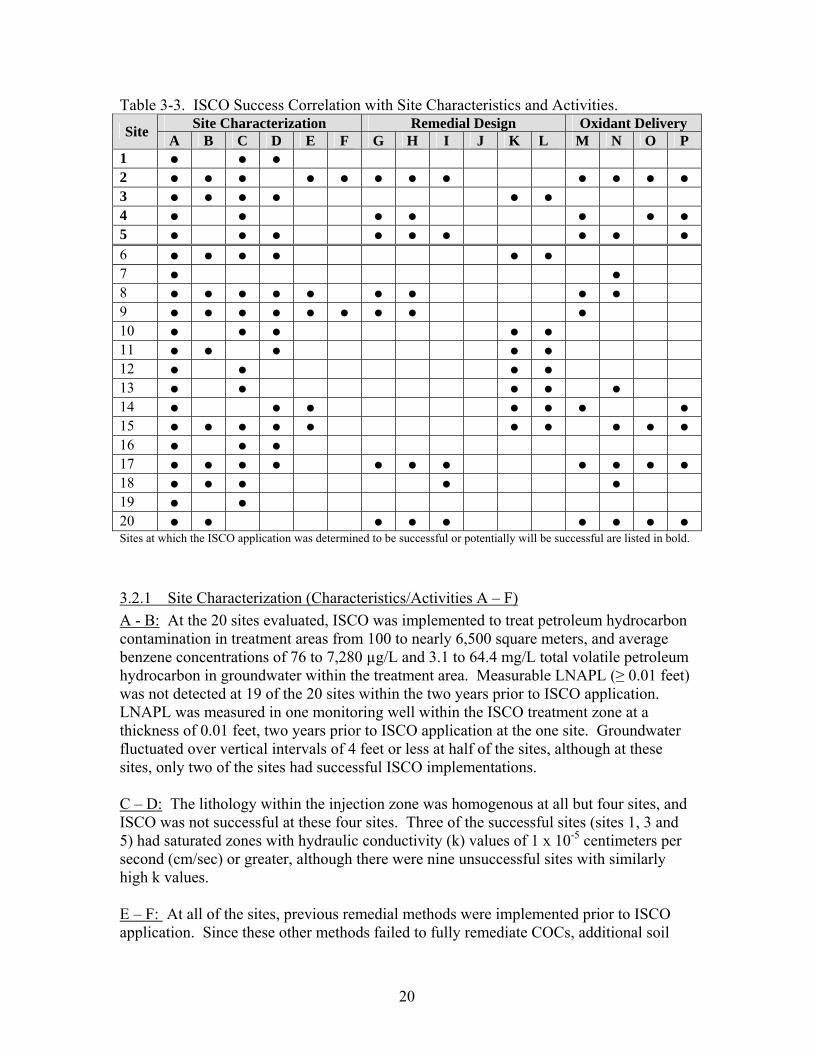
3.2 Evaluation of ISCO Components Site characterization, remedial design, and oxidant delivery components reviewed for each site are associated with the parameters and components described in Section 2.0 of this document. Table 3-2 presents specific characteristics that are conducive to ISCO success and activities that, if conducted, will aid in the success of ISCO application. Each of these characteristics or activities has an associated label for correlation to Table 3-3. Table 3-3 indicates at which sites these “pro-ISCO” characteristics exist and whether the data-gathering activities were completed. Actual characteristic values and activity results for each site are listed in Table A-1 in Appendix A. OPS searched for a correlative characteristic or activity, design or delivery component that was present in successful sites and absent in unsuccessful sites. For example, a moderate to high hydraulic conductivity value (>1 x 10⁻⁵ centimeters per second) generally allows for a greater distribution of the oxidant and greater chance for contact with the COC. Therefore, it would be expected that most successful sites would have a higher hydraulic conductivity. However, as illustrated in Table 3-3, “pro-ISCO” site characteristics conducive to ISCO success and activities conducted that allow for ISCO success (“●” in table) do not correlate well with the five successful or potentially successful sites (bolded in table). Since the number of potentially successful ISCO applications was limited to five, the
Site 20 - Average Benzene - 3 monitoring points
1
10
100
1,000
10,000
0 500 1000 1500Days
Ben
zene
in G
W (u
g/L)
Pre-ISCO
Post-ISCO

18
OPS evaluated the components in an attempt to determine the reasons for the overwhelming failure of these ISCO applications. Evaluation results of site characteristics and activities presented in Tables 3-2 and 3-3 are discussed in Sections 3.2.1 through 3.2.3.
19
Table 3-2. Site Characterization, Remedial Design, and Oxidant Delivery Components.
Activity Table
3-3 Label
Parameter or Component
A Absence of measurable (mobile) LNAPL (>0.01 feet thick) within the treatment area, during two years prior to ISCO application
B Thickness of groundwater fluctuation (potential contaminant smear zone) ≤ 4 feet
C Homogenous lithology in interval of injection
D Hydraulic conductivity (k) of saturated zone ≥ 1x10⁻⁵ centimeters per second
E
Collection of ISCO-specific groundwater samples (ORP, alkalinity, ferrous iron, TDS, major cations and anions) in addition to those normally collected during monitoring (DO, pH, temperature, and specific conductance)
Site Characterization
F Collection of additional soil samples to determine the specific COC vertical and horizontal extent and NOM (TOC) content
G Estimation of TOD using soil analyses and physical parameters
H Estimation of injection ROI using site physical parameters (i.e. hydraulic conductivity and/or effective porosity)
Estimation of design parameters
I Estimation of TOD and injection volume of oxidant using site physical parameters
J Bench-scale treat-ability test completed
K Field-scale injection pilot test completed for calculation of oxidant injection ROI
Remedial Design
Pilot Testing to calculate design
parameters L
Field-scale injection pilot test completed for calculation of TOD and oxidant injection volume
M Oxidant delivery method was via pressure as opposed to gravity-feed
N Oxidant delivery according to the designed volume and frequency
O Oxidant delivery to multiple vertical intervals
Oxidant Delivery
P Specialized subcontractor was used for oxidant product preparation and delivery
*Type of oxidant was evaluated but not included in Table 3-3.
20
Table 3-3. ISCO Success Correlation with Site Characteristics and Activities. Site Characterization Remedial Design Oxidant Delivery Site A B C D E F G H I J K L M N O P
1 ● ● ● 2 ● ● ● ● ● ● ● ● ● ● ● ● 3 ● ● ● ● ● ● 4 ● ● ● ● ● ● ● 5 ● ● ● ● ● ● ● ● ● 6 ● ● ● ● ● ● 7 ● ● 8 ● ● ● ● ● ● ● ● ● 9 ● ● ● ● ● ● ● ● ● 10 ● ● ● ● ● 11 ● ● ● ● ● 12 ● ● ● ● 13 ● ● ● ● ● 14 ● ● ● ● ● ● ● 15 ● ● ● ● ● ● ● ● ● ● 16 ● ● ● 17 ● ● ● ● ● ● ● ● ● ● ● 18 ● ● ● ● ● 19 ● ● 20 ● ● ● ● ● ● ● ● ● Sites at which the ISCO application was determined to be successful or potentially will be successful are listed in bold.
3.2.1 Site Characterization (Characteristics/Activities A – F) A - B: At the 20 sites evaluated, ISCO was implemented to treat petroleum hydrocarbon contamination in treatment areas from 100 to nearly 6,500 square meters, and average benzene concentrations of 76 to 7,280 µg/L and 3.1 to 64.4 mg/L total volatile petroleum hydrocarbon in groundwater within the treatment area. Measurable LNAPL (≥ 0.01 feet) was not detected at 19 of the 20 sites within the two years prior to ISCO application. LNAPL was measured in one monitoring well within the ISCO treatment zone at a thickness of 0.01 feet, two years prior to ISCO application at the one site. Groundwater fluctuated over vertical intervals of 4 feet or less at half of the sites, although at these sites, only two of the sites had successful ISCO implementations. C – D: The lithology within the injection zone was homogenous at all but four sites, and ISCO was not successful at these four sites. Three of the successful sites (sites 1, 3 and 5) had saturated zones with hydraulic conductivity (k) values of 1 x 10⁻⁵ centimeters per second (cm/sec) or greater, although there were nine unsuccessful sites with similarly high k values. E – F: At all of the sites, previous remedial methods were implemented prior to ISCO application. Since these other methods failed to fully remediate COCs, additional soil
21
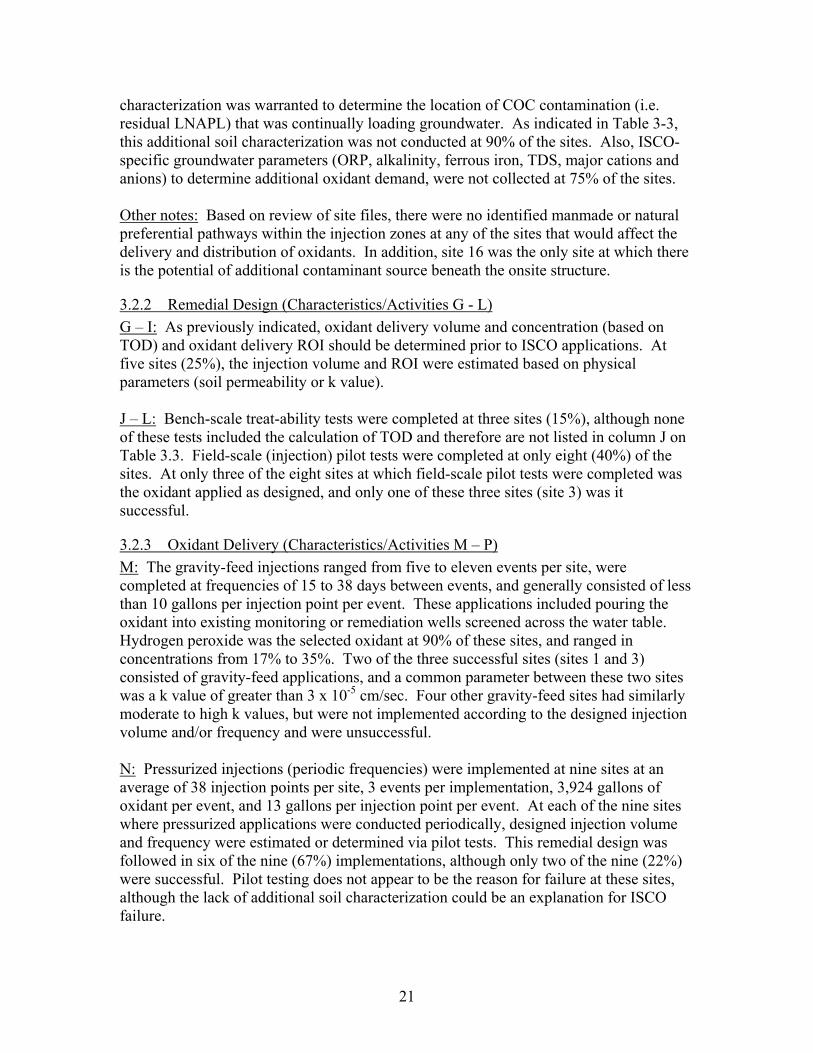
characterization was warranted to determine the location of COC contamination (i.e. residual LNAPL) that was continually loading groundwater. As indicated in Table 3-3, this additional soil characterization was not conducted at 90% of the sites. Also, ISCO-specific groundwater parameters (ORP, alkalinity, ferrous iron, TDS, major cations and anions) to determine additional oxidant demand, were not collected at 75% of the sites. Other notes: Based on review of site files, there were no identified manmade or natural preferential pathways within the injection zones at any of the sites that would affect the delivery and distribution of oxidants. In addition, site 16 was the only site at which there is the potential of additional contaminant source beneath the onsite structure.
3.2.2 Remedial Design (Characteristics/Activities G - L) G – I: As previously indicated, oxidant delivery volume and concentration (based on TOD) and oxidant delivery ROI should be determined prior to ISCO applications. At five sites (25%), the injection volume and ROI were estimated based on physical parameters (soil permeability or k value). J – L: Bench-scale treat-ability tests were completed at three sites (15%), although none of these tests included the calculation of TOD and therefore are not listed in column J on Table 3.3. Field-scale (injection) pilot tests were completed at only eight (40%) of the sites. At only three of the eight sites at which field-scale pilot tests were completed was the oxidant applied as designed, and only one of these three sites (site 3) was it successful.
3.2.3 Oxidant Delivery (Characteristics/Activities M – P) M: The gravity-feed injections ranged from five to eleven events per site, were completed at frequencies of 15 to 38 days between events, and generally consisted of less than 10 gallons per injection point per event. These applications included pouring the oxidant into existing monitoring or remediation wells screened across the water table. Hydrogen peroxide was the selected oxidant at 90% of these sites, and ranged in concentrations from 17% to 35%. Two of the three successful sites (sites 1 and 3) consisted of gravity-feed applications, and a common parameter between these two sites was a k value of greater than 3 x 10⁻⁵ cm/sec. Four other gravity-feed sites had similarly moderate to high k values, but were not implemented according to the designed injection volume and/or frequency and were unsuccessful. N: Pressurized injections (periodic frequencies) were implemented at nine sites at an average of 38 injection points per site, 3 events per implementation, 3,924 gallons of oxidant per event, and 13 gallons per injection point per event. At each of the nine sites where pressurized applications were conducted periodically, designed injection volume and frequency were estimated or determined via pilot tests. This remedial design was followed in six of the nine (67%) implementations, although only two of the nine (22%) were successful. Pilot testing does not appear to be the reason for failure at these sites, although the lack of additional soil characterization could be an explanation for ISCO failure.
22
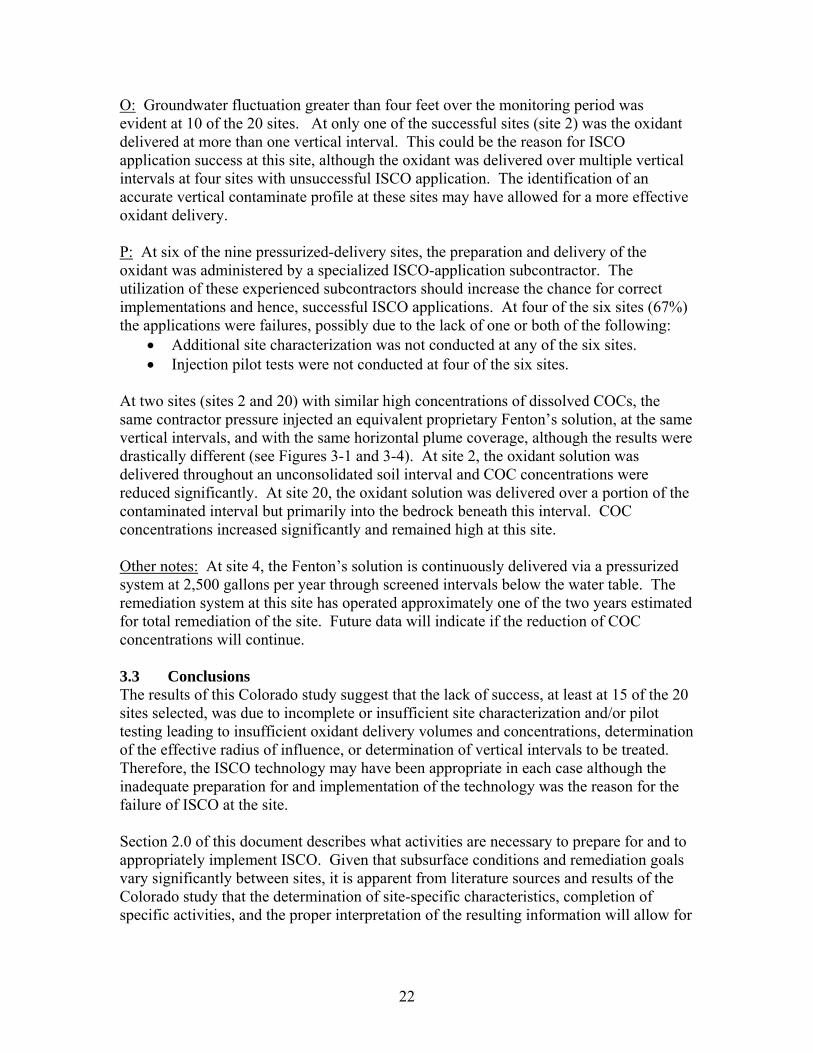
O: Groundwater fluctuation greater than four feet over the monitoring period was evident at 10 of the 20 sites. At only one of the successful sites (site 2) was the oxidant delivered at more than one vertical interval. This could be the reason for ISCO application success at this site, although the oxidant was delivered over multiple vertical intervals at four sites with unsuccessful ISCO application. The identification of an accurate vertical contaminate profile at these sites may have allowed for a more effective oxidant delivery. P: At six of the nine pressurized-delivery sites, the preparation and delivery of the oxidant was administered by a specialized ISCO-application subcontractor. The utilization of these experienced subcontractors should increase the chance for correct implementations and hence, successful ISCO applications. At four of the six sites (67%) the applications were failures, possibly due to the lack of one or both of the following:
• Additional site characterization was not conducted at any of the six sites. • Injection pilot tests were not conducted at four of the six sites.
At two sites (sites 2 and 20) with similar high concentrations of dissolved COCs, the same contractor pressure injected an equivalent proprietary Fenton’s solution, at the same vertical intervals, and with the same horizontal plume coverage, although the results were drastically different (see Figures 3-1 and 3-4). At site 2, the oxidant solution was delivered throughout an unconsolidated soil interval and COC concentrations were reduced significantly. At site 20, the oxidant solution was delivered over a portion of the contaminated interval but primarily into the bedrock beneath this interval. COC concentrations increased significantly and remained high at this site. Other notes: At site 4, the Fenton’s solution is continuously delivered via a pressurized system at 2,500 gallons per year through screened intervals below the water table. The remediation system at this site has operated approximately one of the two years estimated for total remediation of the site. Future data will indicate if the reduction of COC concentrations will continue. 3.3 Conclusions The results of this Colorado study suggest that the lack of success, at least at 15 of the 20 sites selected, was due to incomplete or insufficient site characterization and/or pilot testing leading to insufficient oxidant delivery volumes and concentrations, determination of the effective radius of influence, or determination of vertical intervals to be treated. Therefore, the ISCO technology may have been appropriate in each case although the inadequate preparation for and implementation of the technology was the reason for the failure of ISCO at the site. Section 2.0 of this document describes what activities are necessary to prepare for and to appropriately implement ISCO. Given that subsurface conditions and remediation goals vary significantly between sites, it is apparent from literature sources and results of the Colorado study that the determination of site-specific characteristics, completion of specific activities, and the proper interpretation of the resulting information will allow for
23
the best possibility for the success of the ISCO application. These site characteristics and activities include:
1) Site Characterization The development of a complete conceptual model is important to the success of all remedial technologies, although it is most critical with ISCO because this technology relies on a liquid or gas oxidant coming into direct contact with the contaminant in a short period of time on a periodic frequency.
a. Soil samples must be collected to determine the horizontal and vertical location of remaining source and smear zone contamination (i.e. residual LNAPL) and to determine other oxidant-consuming components.
b. The ISCO-specific groundwater parameters of ORP, alkalinity, ferrous iron, TDS, and major cations and anions should be measured in addition to typical water quality parameters such as DO, pH, temperature and specific conductance.
2) Remedial Design Pilot testing, although sometimes expensive, allows for more accurate determination of implementation design parameters (injection volume and ROI) than by estimation from site characterization data.
a. Bench-scale testing can also be important in determining the appropriate oxidant and to determine the TOD for use in field-scale pilot testing.
b. Field-scale pilot testing should be completed to accurately determine the injection volume, concentration, rate and ROI.
3) Oxidant Delivery Taking into consideration site logistics, oxidant delivery must be completed according to the remedial design. Monitoring of pressure and oxidant products and by-products is important to ensure that the oxidant is being properly delivered.
As a result of this study, the OPS developed a checklist containing activities to be completed and characteristics to be evaluated when proposing ISCO in a remedial approach. This checklist, included in Appendix C of this report, must be completed and included in any CAP that includes an ISCO component. The consultant may confer with the OPS reviewer for the site regarding the site-specific necessity of information requested on the check sheet. OPS anticipates that the ISCO study at Colorado sites will evolve as new data for existing sites is added, new sites are added, and new technologies are approved. The identification of critical components to ISCO success may become more apparent with additional evaluation. In addition, as the study evolves, costs submitted via OPS’ Economic Feasibility Summary process will be evaluated for ISCO sites. Costs for ISCO technologies will be compared to each other as well as compared to other remedial technologies.

Appendix A Table A-1. Site Parameters Evaluated for Colorado Sites

Appendix B Benzene Concentration Plots for Colorado Sites
Site 1 - Average Benzene - 2 monitoring points
1
10
100
1,000
10,000
0 200 400 600 800 1000Days
Ben
zene
in G
W (u
g/L)
Pre-ISCO
Post-ISCO
Site 2 - Average Benzene - 4 monitoring points
1
10
100
1,000
10,000
0 100 200 300 400 500 600 700 800 900Days
Ben
zene
in G
W (u
g/L)
Pre-ISCO
Post-ISCO
Site 3 - Average Benzene - 3 monitoring points
1
10
100
1,000
0 200 400 600 800 1000 1200Days
Ben
zene
in G
W (u
g/L)
Pre-ISCODuring-ISCO
Site 4 - Average Benzene - 4 monitoring points
1
10
100
1,000
10,000
0 200 400 600 800 1000 1200 1400Days
Benz
ene
in G
W (u
g/L)
Pre-ISCO
During-ISCO
Site 5 - Average Benzene - 3 monitoring points
1
10
100
1,000
10,000
0 200 400 600 800 1000 1200 1400 1600Days
Ben
zene
in G
W (u
g/L)
Pre-ISCODuring-ISCOPost-ISCO
Site 6 - Average Benzene - 1 monitoring point
1
10
100
1,000
0 100 200 300 400 500 600 700 800 900Days
Ben
zene
in G
W (u
g/L)
Pre-ISCO
Post-ISCO
Site 7 - Average Benzene - 1 monitoring points
1
10
100
1,000
0 100 200 300 400 500 600Days
Ben
zene
in G
W (u
g/L)
Pre-ISCO
During-ISCO
Site 8 - Average Benzene - 4 monitoring points
1
10
100
1,000
10,000
0 200 400 600 800 1000 1200 1400 1600Days
Ben
zene
in G
W (u
g/L)
Pre-ISCODuring-ISCOPost-ISCO
Site 9 - Average Benzene - 2 monitoring points
1
10
100
1,000
0 50 100 150 200 250 300 350Days
Ben
zene
in G
W (u
g/L)
During-ISCO
Post-ISCO
Site 10 - Average Benzene - 3 monitoring points
1
10
100
1,000
10,000
0 200 400 600 800 1000 1200 1400 1600Days
Ben
zene
in G
W (u
g/L)
Pre-ISCODuring-ISCOPost-ISCO
Site 11 - Average Benzene - 4 monitoring points
1
10
100
1,000
0 200 400 600 800 1000 1200 1400Days
Ben
zene
in G
W (u
g/L)
Pre-ISCO
Post-ISCO
Site 12 - Average Benzene - 4 monitoring points
1
10
100
1,000
0 200 400 600 800 1000 1200 1400Days
Ben
zene
in G
W (u
g/L)
Pre-ISCODuring-ISCOPost-ISCO
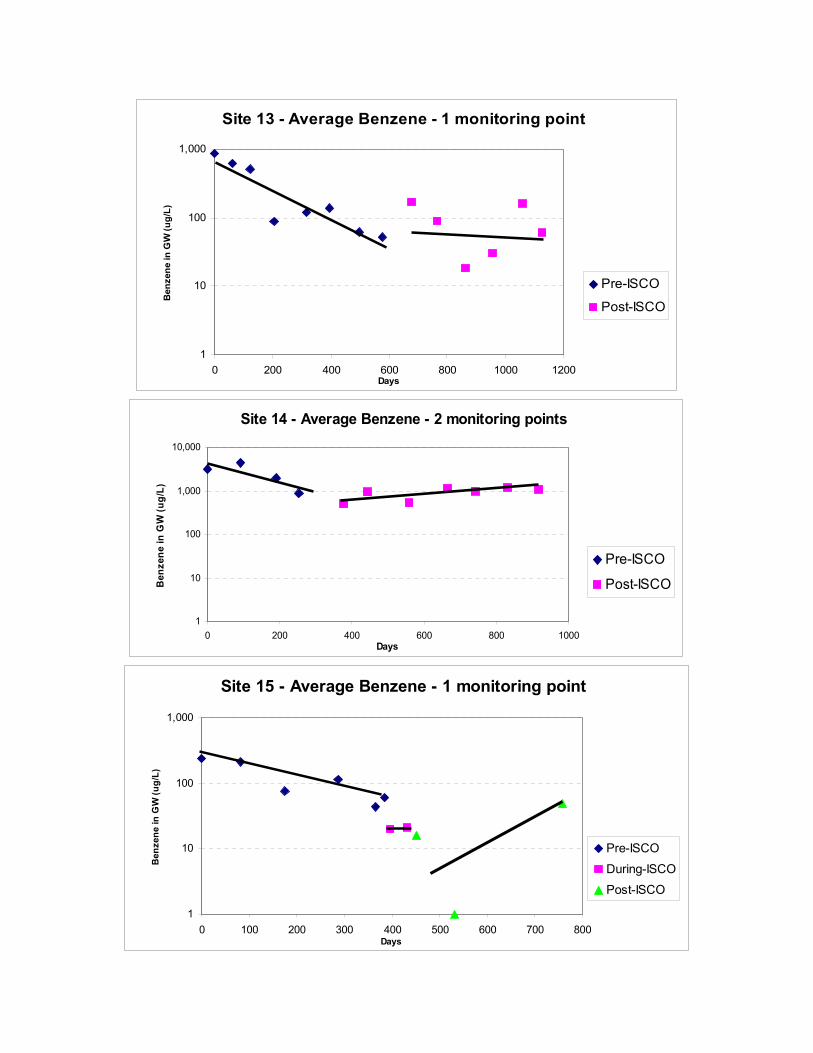
Site 13 - Average Benzene - 1 monitoring point
1
10
100
1,000
0 200 400 600 800 1000 1200Days
Ben
zene
in G
W (u
g/L)
Pre-ISCO
Post-ISCO
Site 14 - Average Benzene - 2 monitoring points
1
10
100
1,000
10,000
0 200 400 600 800 1000Days
Ben
zene
in G
W (u
g/L)
Pre-ISCO
Post-ISCO
Site 15 - Average Benzene - 1 monitoring point
1
10
100
1,000
0 100 200 300 400 500 600 700 800Days
Ben
zene
in G
W (u
g/L)
Pre-ISCO
During-ISCOPost-ISCO
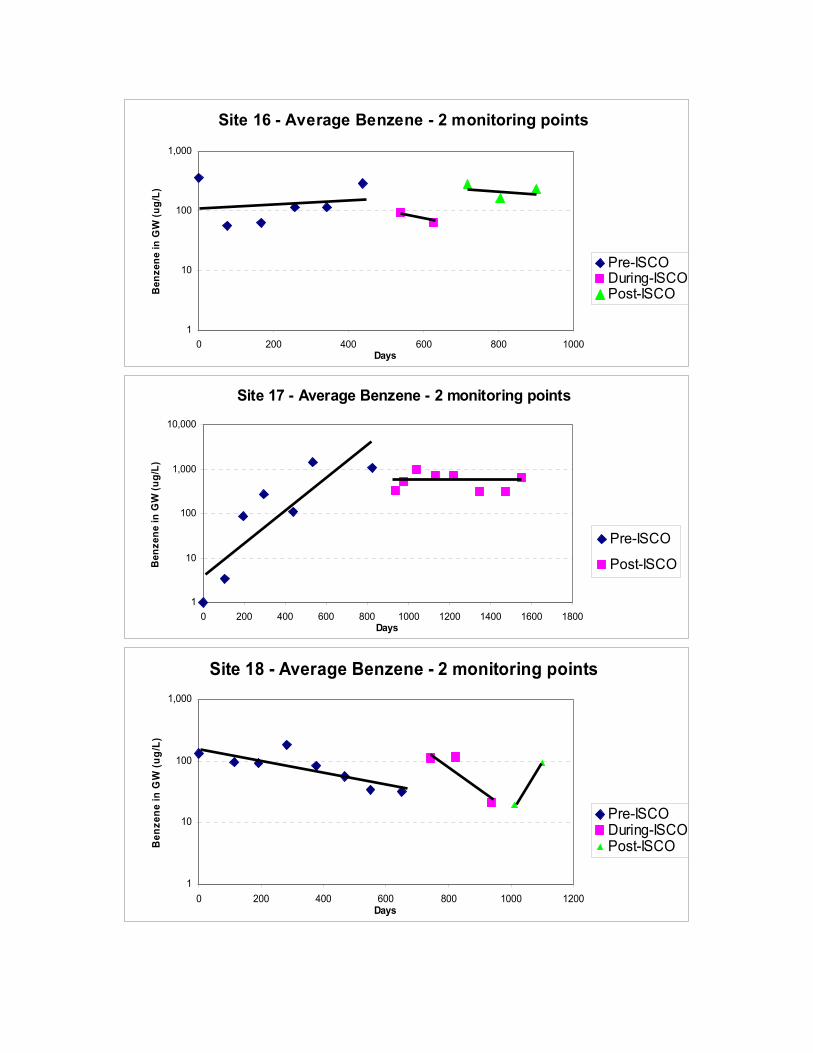
Site 16 - Average Benzene - 2 monitoring points
1
10
100
1,000
0 200 400 600 800 1000Days
Ben
zene
in G
W (u
g/L)
Pre-ISCODuring-ISCOPost-ISCO
Site 17 - Average Benzene - 2 monitoring points
1
10
100
1,000
10,000
0 200 400 600 800 1000 1200 1400 1600 1800Days
Ben
zene
in G
W (u
g/L)
Pre-ISCO
Post-ISCO
Site 18 - Average Benzene - 2 monitoring points
1
10
100
1,000
0 200 400 600 800 1000 1200Days
Ben
zene
in G
W (u
g/L)
Pre-ISCODuring-ISCOPost-ISCO
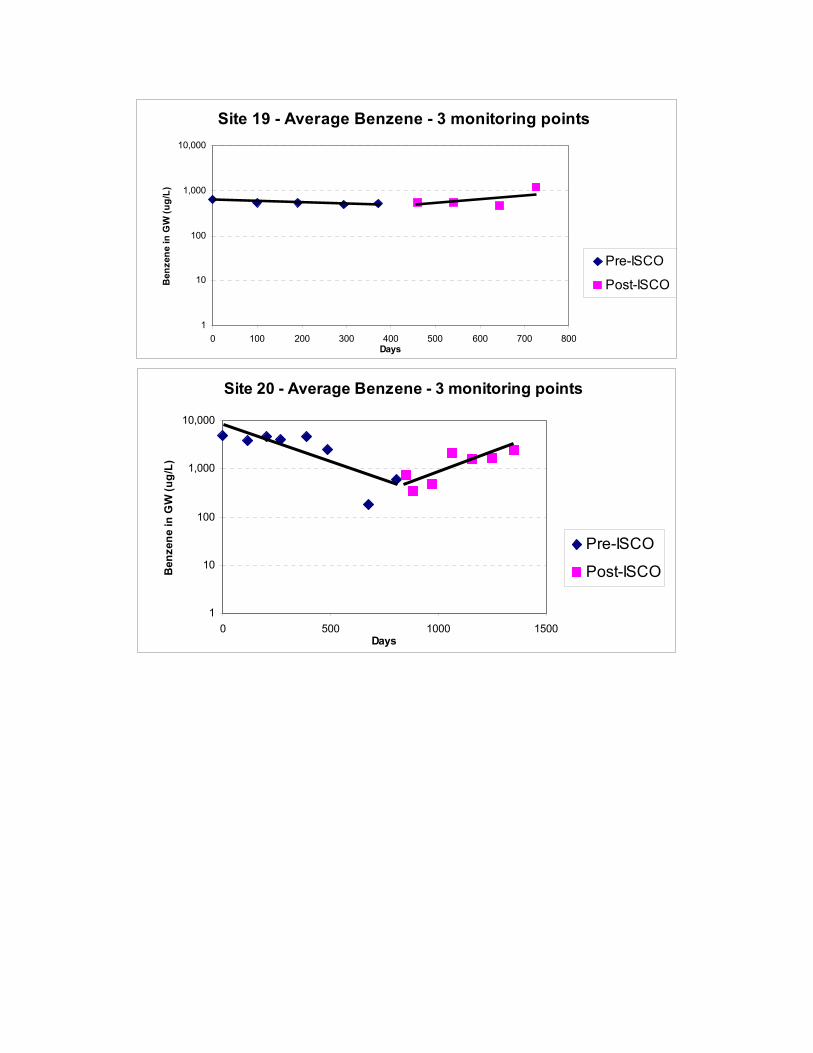
Site 19 - Average Benzene - 3 monitoring points
1
10
100
1,000
10,000
0 100 200 300 400 500 600 700 800Days
Ben
zene
in G
W (u
g/L)
Pre-ISCO
Post-ISCO
Site 20 - Average Benzene - 3 monitoring points
1
10
100
1,000
10,000
0 500 1000 1500Days
Ben
zene
in G
W (u
g/L)
Pre-ISCO
Post-ISCO

Appendix C Check sheet for CAP with ISCO Component
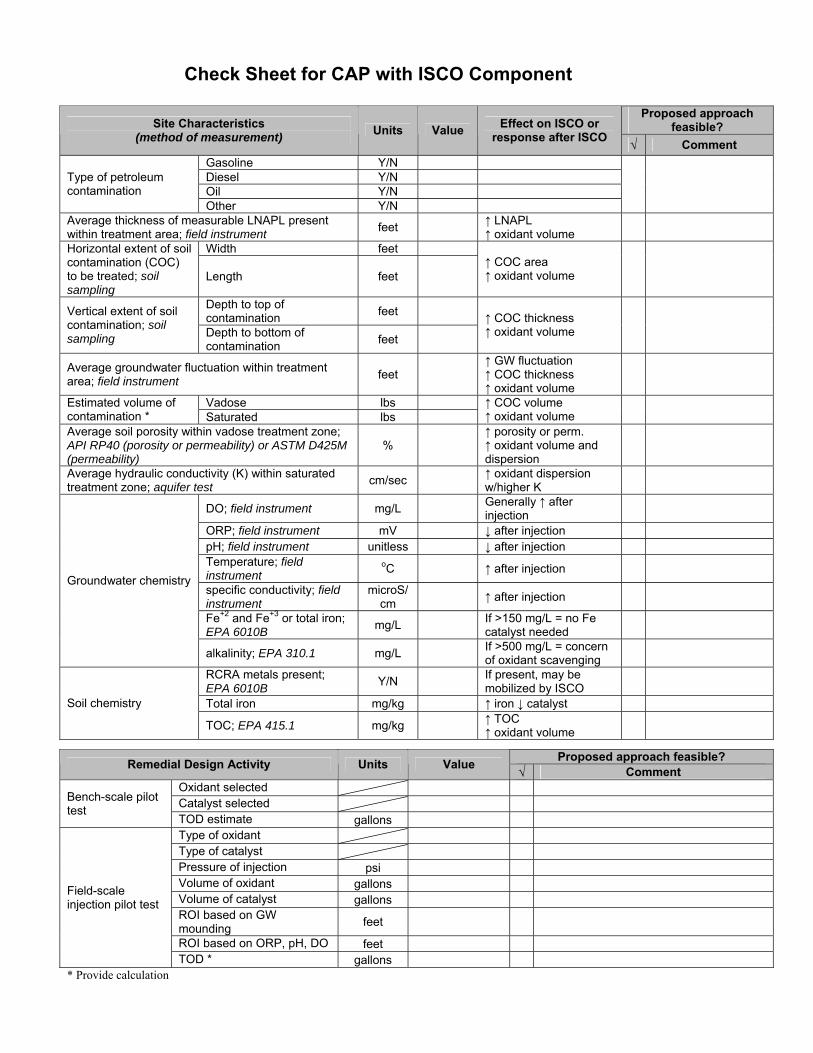
Check Sheet for CAP with ISCO Component
Proposed approach feasible? Site Characteristics
(method of measurement) Units Value Effect on ISCO or response after ISCO √ Comment
Gasoline Y/N Diesel Y/N Oil Y/N
Type of petroleum contamination
Other Y/N
Average thickness of measurable LNAPL present within treatment area; field instrument feet ↑ LNAPL
↑ oxidant volume
Width feet Horizontal extent of soil contamination (COC) to be treated; soil sampling
Length feet ↑ COC area
↑ oxidant volume
Depth to top of contamination feet Vertical extent of soil
contamination; soil sampling Depth to bottom of
contamination feet ↑ COC thickness ↑ oxidant volume
Average groundwater fluctuation within treatment area; field instrument feet
↑ GW fluctuation ↑ COC thickness ↑ oxidant volume
Vadose lbs Estimated volume of contamination * Saturated lbs
↑ COC volume ↑ oxidant volume
Average soil porosity within vadose treatment zone; API RP40 (porosity or permeability) or ASTM D425M (permeability)
% ↑ porosity or perm.
↑ oxidant volume and dispersion
Average hydraulic conductivity (K) within saturated treatment zone; aquifer test cm/sec ↑ oxidant dispersion
w/higher K
DO; field instrument mg/L Generally ↑ after injection
ORP; field instrument mV ↓ after injection pH; field instrument unitless ↓ after injection Temperature; field instrument
oC ↑ after injection
specific conductivity; field instrument
microS/cm
↑ after injection
Fe+2 and Fe+3 or total iron; EPA 6010B mg/L If >150 mg/L = no Fe
catalyst needed
Groundwater chemistry
alkalinity; EPA 310.1 mg/L If >500 mg/L = concern of oxidant scavenging
RCRA metals present; EPA 6010B Y/N If present, may be
mobilized by ISCO
Total iron mg/kg ↑ iron ↓ catalyst Soil chemistry
TOC; EPA 415.1 mg/kg ↑ TOC ↑ oxidant volume
Proposed approach feasible? Remedial Design Activity Units Value √ Comment Oxidant selected Catalyst selected Bench-scale pilot
test TOD estimate gallons Type of oxidant Type of catalyst Pressure of injection psi Volume of oxidant gallons Volume of catalyst gallons ROI based on GW mounding feet
ROI based on ORP, pH, DO feet
Field-scale injection pilot test
TOD * gallons * Provide calculation