Embed Size (px)
Citation preview

Petroleum Geology andReservoir Characterization ofthe Upper Devonian GordonSandstone, Jacksonburg-Stringtown Oil Field,Northwestern West Virginia
Michael E. Hohn, Editor
West Virginia Geological and EconomicSurveyPublication B-45
This is a summary. To obtain the complete report, contact theWest Virginia Geological Survey at 304 594-2331 or see
www.wvgs.wvnet.edu/www/services/servpubc.htm

CONTENTS OF REPORT
Chapter 1. Introduction Michael E. HohnStratigraphyHistory of Oil Production from Gordon Sandstone ReservoirsDepositional EnvironmentPlan of Report
Chapter 2. Discovery and Development Katharine Lee AvaryField HistoryDevelopment History
Chapter 3. Regional and Local Geology David L. MatchenRegional Structure and StratigraphyGeology of the FieldStratigraphy and Production
Chapter 4. Petrology and Petrophysics Ronald R. McDowellPetrologyPetrophysicsElectrofaciesComparison of Lithofacies with Electrofacies
Chapter 5. Study of Outcrop Analogs Ronald R. McDowell
Chapter 6. Permeability Distribution Prediction K. Aminian, Benjamin Thomas, AdemulaOyerkun, H. I. Bilgesu, and S. Ameri
IntroductionBackgroundData Collection and AnalysisPermeability Prediction with ANNUse of Porosity Data with ANNUse of Minipermeameter Data with ANN6Flow Unit ModelPerformance PredictionPermeability Distribution Prediction
Chapter 7. Application of Artificial Neural Networks to Reservoir CharacterizationK. Aminian, B. Thomas, V. Alla, H.I. Bilgesu and S. Ameri
IntroductionBackgroundSimulation of the Pilot WaterfloodDevelopment of General Model for the Reservoir
Chapter 8. Summary and Conclusions
References

Introduction
This report contains five papers summarizing principal findings of a three-year study of theJacksonburg-Stringtown field in northwestern West Virginia, funded by the U. S. Department of En-ergy. This field has produced oil since 1895 from the Upper Devonian Gordon sandstone interval. Thepurpose of the study was to spur development of economically attractive technologies for improvedreservoir extraction. We set out to study the types and degree of reservoir heterogeneity at severalscales, develop numerical techniques to define and predict geologic parameters, and present the resultsof our work to allow the results to be applied to other fields in the Gordon play as well as fields withsimilar geological characteristics.
In 1886, oil was discovered in a well on the Gordon farm in southwestern Pennsylvania; at the time,this was the world’s deepest well ata total depth of 2,392 feet (Clapp,1907). By 1890, oil and gas werebeing produced from Venango res-ervoirs in northern West Virginia.The Jacksonburg-Stringtown fieldwas one of the earliest, discoveredin 1895 (Whieldon and Eckard,1963). By the time of the First WorldWar, Gordon sandstones were pro-ducing oil from 18 fields in WestVirginia. The overall trend of Gor-don fields follows that of Gordoninterval thickness. In many fields,production is limited to the GordonStray, an interval of sandstone andconglomerate westward of the thickGordon trend and shallowerstratigraphically.
Discovery and Development
Discovered in 1895, theJacksonburg-Stringtown field is lo-cated in southeastern Wetzel, easternTyler, and northwestern Doddridgecounties, West Virginia. Original oilin place is estimated to be over 80million barrels of oil. More than 500wells were drilled between 1897 and1901, when annual oil productionreached over one million barrels.Initial production averaged 72 bar-
Figure 1. Location of the Jacksonburg-Stringtown field,as well as other fields with production form the Gordoninterval.

rels of oil per day. The typical well was completed open-hole at average depth of 3000 feet and wasstimulated with nitroglycerine shot. By 1910, production declined significantly and most wells wereabandoned.
The lease primary recovery ranges from 824 to 2700 barrels of oil and averages 1600 barrels of oilper acre. This equates to an average cumulative recovery of 23,000 barrels of oil per well. The primaryrecovery mechanism was solution gas drive.
From 1934 through the late 1960’s, a limited gas injection project was operated but did not contrib-ute significantly (less than 1 percent) to the primary recovery. The waterflood operation started with apilot in 1981 and continued in several stages of development. The estimated ultimate waterflood recov-
ery is 8 million barrels ofoil of which approximately2 million barrels has beenrecovered already.
Throughout the devel-opment of the Jacksonburg-Stringtown field, isolatedareas of new productionhave been discoveredwithin the field. After ini-tial discovery period for thefield (1887-1903), each ofthe next five periods of de-velopment shows intrafielddiscoveries of new produc-tion. Within the first decadeof drilling and production,two main trends in oil pro-duction were evident in thefield: a north-south trend ofrelatively high productionalong the western margin ofthe field, and a north-north-east trend in the easternhalf.
Regional and LocalGeology
Gordon sandstones arepart of the thick, UpperDevonian sedimentary sec-tion that correlates with
non-marine red shales and fluvial sandstones of the Hampshire Formation in the eastern outcrop belt ofWest Virginia, Maryland and Pennsylvania, and the marine Ohio Shale in the western outcrop belt ofKentucky and Ohio. In the area of Jacksonburg-Stringtown field, Gordon rocks are interpreted to beshoreline/shoreface sandstones that occupied a broad, arcuate trend at the time of maximum regression
Km.
Mi.
103-
103-
095-
095-
095-
095-859
095-741
095-
095-
Unit 1 Unit 3Unit 2
Km.
Mi.
103-
103-
095-
095-
095-
095-859
095-741
095-
095-
Unit 3Unit 2
Figure 2 Map of Jacksonburg-Stringtown field, with well loca-tions, outline of field (red line), production units as defined byPennzEnergy (color shading), and locations of cored wells (filledcircles with permit numbers).

of the Acadian clastic wedge.The Gordon interval is composed of three
parasequences comprising five lithofacies: fea-tureless sandstone, laminated sandstone, con-glomeratic sandstone, shale, and heterolithicbioturbated lithofacies. Thin shales define thevertical limits of each parasequence; theheterolithic bioturbated lithofacies overlies theGordon throughout the field.
Two types of compartmentalization arepresent in the field: structural and stratigraphic.A west-northwest to east-southeast fault in thesouthern part of the field appears to have suffi-cient throw to isolate reservoir rocks in the south-ern quarter of the field from reservoir sandstonesto the north. Within each parasequence, perme-able sandstone of the featureless lithofacies are
Figure 4. Reservoir sandstone relatedto estimated cumulative production andstructure. Areas A, B, and C have sig-nificant thickness of featureless sand-stone - the inferred reservoir - withincorresponding parasequences psA, psB,and psC.
Thompson Heirs #8
(95-1124)
Peter Horner #9 (95-741)
F R Ball #18 (95-1125)
F R Ball#19 (95-1126)
Lemasters O-13 (103-1547)
I Reilly #13 (103-1315)
Parasequence A: Fine-grained sandstone and conglomerate
Parasequence B: Fine-grained sandstone and shale
Post-Gordon: Fine-grained sandstone, conglomerate and shale, all bioturbated
Vertical Scale = 15
Figure 3. Correlation of all available cores, ordered roughly from east to west.

enclosed and interbedded with low permeability strata of the laminated sandstone, conglomeratic sand-stone, and shale lithofacies. Northeast to southwest trends in estimated cumulative production coin-cide with trends in the thickness of the featureless sandstone lithofacies within the parasequences.Some wells produced oil from more than one parasequence. Although communication between reser-voir compartments is generally hard to determine, it might exist in the eastern part of the field wherecompartments in two parasequences are in stratigraphic and geographic proximity.
Petrology and Petrophysics
Primary porosity observed in Gordon thin sections is intergranular; secondary porosity appears tooccur in association with dissolved or partially dissolved potassium feldspars. Cements in Gordonsamples consist of clay (primarily kaolinite associated with feldspars), calcite, silica, and siderite. Ingeneral, calcite and clay cements occur in an early, post-burial setting. Formation of clay cementcontinued with deeper burial and diagenesis as associated clays and feldspars were altered. Later,secondary quartz was precipitated in the form of euhedral overgrowths and pore-filling chert. Finally,siderite replaced earlier cements and filled remaining porosity in many Gordon samples. Presence ofabundant siderite cement may have serious implications for secondary development in the Gordonbecause chemical reactions between the composition of injected water and iron of cement must betaken into account.
Minipermeameter readings show considerably more variability than permeabilities measured fromeither core plugs or whole core because of the greater frequency of sampling with the minipermeameterand the smaller volume measured. Minipermeameter values generally exceed whole core values andare less than core plug values. Because whole core analysis samples a significantly larger volume of
Figure 5. Graph of permeability with depthin Peter Horner #9 (095-741). Permeabilityfrom minipermeameter is shown in red;permeability from core plugs is shown inblue; permeability from whole core is shownin green.

rock and may include sedimentary barriers to flow such as interbedded shales or stylolitic horizons, it isnot surprising that whole core permeabilities may be lower than those measured with theminipermeameter.
Detailed observation of Gordon core material led to the following conclusions: 1) core materialsclassified as pay sandstone based on log signature were found to have permeabilities ranging from 10to 200 mD; 2) permeability in non-pay sandstones identified by log signature range from less than thelevel of instrumental detection to 5 mD; 3) distribution of permeability within pay sandstones wasfairly uniform; 4) distribution of small amounts of permeability within non-pay sandstones was usuallyeither zoned parallel to bedding or “patchy”; 5) the conglomeratic material could take on the perme-ability characteristics of enclosing materials; 6) conglomeratic material was also found withpermeabilities exactly the opposite of enclosing materials, e. g., extremely low permeability conglom-erate in pay sandstone and high permeability conglomerate in non-pay or low permeability pay sand-stone. The last two observations imply that conglomeratic materials, often difficult to pick on geo-physical logs because of their thinness, can provide either an unexpected barrier to vertical flow or anunexpected path for horizontal flow.
Four electrofacies based on a linear combination of density and scaled gamma ray data best matchedcorrelations made independently based on visual comparison of geophysical logs. Electrofacies 4 withrelatively high permeability (mean value > 30 mD) appears to include the reservoir sandstone. Thiselectrofacies is relatively continuous across the pilot water flood area, used in flow simulations.Electrofacies cross-sections taken perpendicular to the syncline axis demonstrated a distinct asymme-try in distribution of electrofacies across the field. In particular, electrofacies 3 thickens dramaticallyfrom the center towards the eastern margin of the field, reflecting a general increase in grain size to theeast, the direction from which sediments were transported.
Permeability Distribution Prediction
Knowing the stratigraphic and well-to-well distribution of permeability is key to predicting reser-voir performance. The major difficulty in predicting permeability in mature reservoirs is lack of suffi-cient data, particularly core analyses. Because geophysical well logs are the most abundant source ofdata in a reservoir, a methodology for estimating permeability based on well logs represents a technicalas well as economic advantage.
Several artificial neural networks were designed and implemented utilizing geophysical log re-
095 - 1677095 - 1628
4368375m North
0 m 2000 m 4000 mWEST EAST
- 550 m
- 560 m
- 570 m
- 580 m
- 590 m
- 600 m
- 550 m
- 560 m
- 570 m
- 580 m
- 590 m
- 600 m
SECTION 3
Figure 6. Electrofacies cross section oriented perpendicular to the axis of the Gordon synclinewithin the Jacksonburg-Stringtown field. Cross-section views the reservoir “looking” north-east. Vertical exaggeration is 50:1.

sponse, core analysis results, minipermeameter measurements, geological interpretations, and statisti-cal methods. This approach led to development of reliable porosity and permeability distributions andidentification of productive zones in the reservoir.
Well log data and geological information were used to divide the formation into two flow units,leading to further improvements in the prediction of permeability. Results were verified by successfulsimulation of production performance for the reservoir. The flow unit model was used to map perme-ability within the reservoir in 3 dimensions.
The methodology developed in this work canserve as a new tool for characterizing heterogeneousreservoirs.
Reservoir Characterization with ArtificialNeural Networks
A simple reservoir model of the pilot water floodarea based on well records, well logs, available coreanalyses, and permeability estimated from the cor-
R2 = 0.81
0
1
10
100
1000
0 5 10 15 20 25 30
ANN Porosity, %
Per
mea
bili
ty, m
D
Figure 7. Correlation of measured permeability with ANN predicted porosity.
Figure 8. Permeability-Thickness of FlowUnit II.
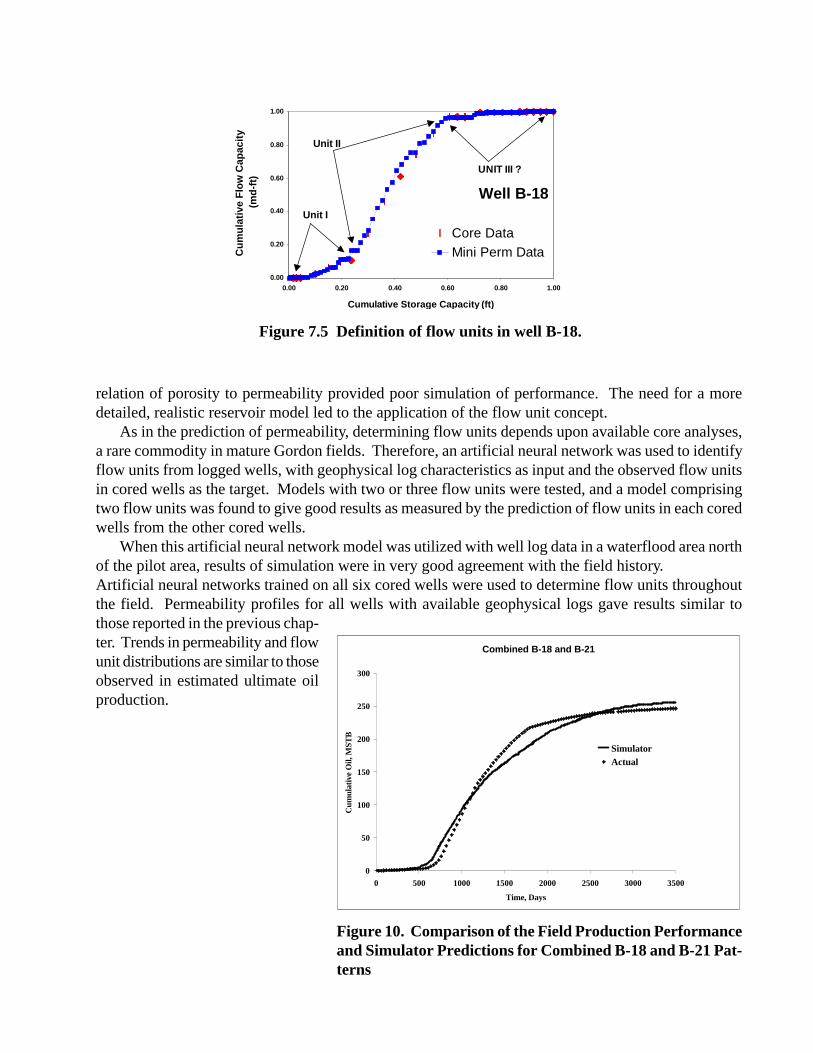
relation of porosity to permeability provided poor simulation of performance. The need for a moredetailed, realistic reservoir model led to the application of the flow unit concept.
As in the prediction of permeability, determining flow units depends upon available core analyses,a rare commodity in mature Gordon fields. Therefore, an artificial neural network was used to identifyflow units from logged wells, with geophysical log characteristics as input and the observed flow unitsin cored wells as the target. Models with two or three flow units were tested, and a model comprisingtwo flow units was found to give good results as measured by the prediction of flow units in each coredwells from the other cored wells.
When this artificial neural network model was utilized with well log data in a waterflood area northof the pilot area, results of simulation were in very good agreement with the field history.Artificial neural networks trained on all six cored wells were used to determine flow units throughoutthe field. Permeability profiles for all wells with available geophysical logs gave results similar tothose reported in the previous chap-ter. Trends in permeability and flowunit distributions are similar to thoseobserved in estimated ultimate oilproduction.
Combined B-18 and B-21
0
50
100
150
200
250
300
0 500 1000 1500 2000 2500 3000 3500
Time, Days
Cum
ulat
ive
Oil,
MST
B
SimulatorActual
Figure 10. Comparison of the Field Production Performanceand Simulator Predictions for Combined B-18 and B-21 Pat-terns
Well B-18
0.00
0.20
0.40
0.60
0.80
1.00
0.00 0.20 0.40 0.60 0.80 1.00
Cumulative Storage Capacity (ft)
Cu
mu
lati
ve F
low
Cap
acit
y (m
d-f
t)
Core Data
Mini Perm Data
Unit II
Unit I
UNIT III ?
Figure 7.5 Definition of flow units in well B-18.


![Guideline on good pharmacovigilance practices (GVP) · PDF fileeither one site or multiple sites, whether in one or more Member State [Dir 2001/20/EC Art 2(a)]. ... Sawyer’s Internal](https://img.dokumen.tips/doc/110x75/5ab739617f8b9ac10d8b7c13/guideline-on-good-pharmacovigilance-practices-gvp-either-one-site-or-multiple.jpg)


![The Bells of St. Mary's - stmaryswestcolumbia.com fileeither house but must pass both houses. Click here to see a graphic novel rendition of the legislative process of General Convention.[1]](https://img.dokumen.tips/doc/110x75/5e095b6290ecdb568e32cd76/the-bells-of-st-marys-house-but-must-pass-both-houses-click-here-to-see-a-graphic.jpg)


