Embed Size (px)
Citation preview
Australasian Transport Research Forum 2010 Proceedings 29 September – 1 October 2010, Canberra, Australia Publication website: http://www.patrec.org/atrf.aspx
1
Petrol prices in Australia
David Gargett
Bureau of Infrastructure, Transport and
Regional Economics, Canberra
Email for correspondence: [email protected]
Abstract
The objective of this paper is to model how Australian petrol prices are determined by
movements in world oil prices, the Australian exchange rate, and numerous other
components of the price chain. This paper examines five scenarios for the future of world oil
prices and shows how they would translate into movements in Australian retail petrol prices.
The findings suggest that petrol prices are likely to be restrained in this decade. However, in
the 2020‟s prices are likely to either rise under peak oil scenarios or continue constrained
under the more optimistic world oil supply scenarios.
1. Introduction
The transport of goods and people in Australia is affected by many trends.
One of the most important of these trends, given the dependence of mobility in Australia on
liquid fuels, is that of the price of fuel (petrol, diesel, LPG, aviation turbine fuel and avgas).
Using the retail petrol price as an example, the following analysis shows how these trends
can be conceptualised and simulated. The conceptual framework developed allows for an
understanding of the forces involved in generating trends in Australian fuel prices (in much
the same way as has been done for Australian wheat prices – Gargett 2005).
2. An overview of the fuel price chain
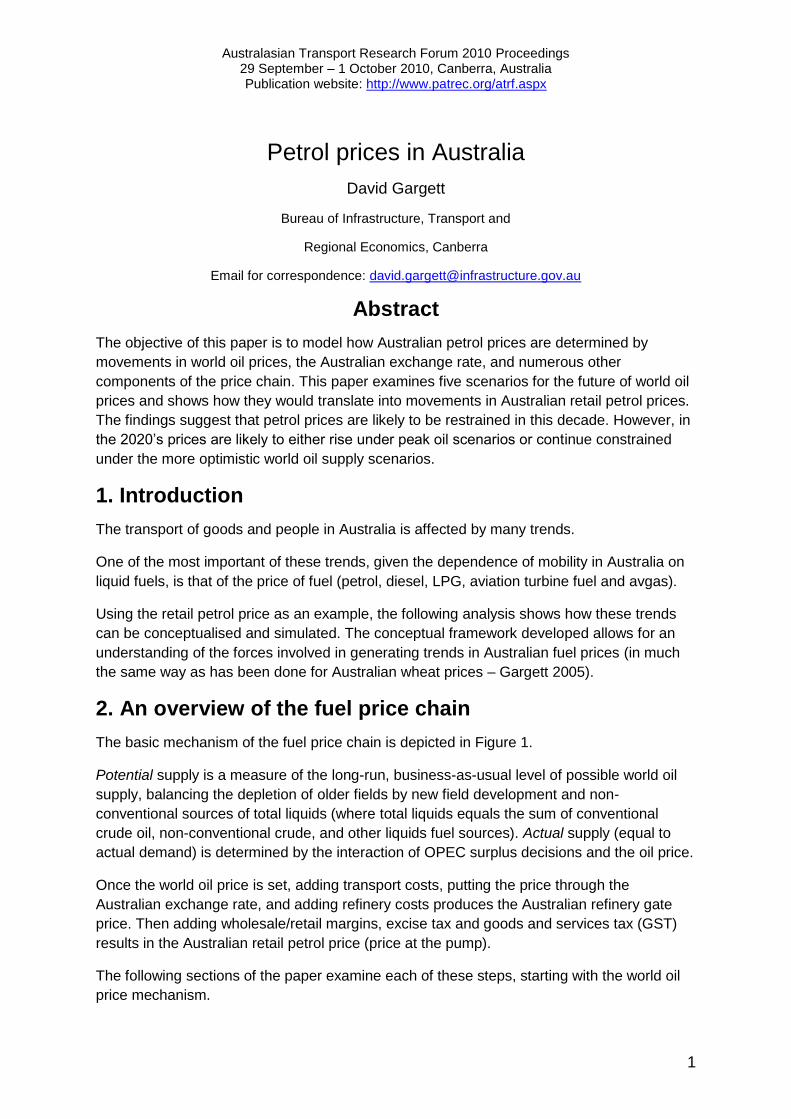
The basic mechanism of the fuel price chain is depicted in Figure 1.
Potential supply is a measure of the long-run, business-as-usual level of possible world oil
supply, balancing the depletion of older fields by new field development and non-
conventional sources of total liquids (where total liquids equals the sum of conventional
crude oil, non-conventional crude, and other liquids fuel sources). Actual supply (equal to
actual demand) is determined by the interaction of OPEC surplus decisions and the oil price.
Once the world oil price is set, adding transport costs, putting the price through the
Australian exchange rate, and adding refinery costs produces the Australian refinery gate
price. Then adding wholesale/retail margins, excise tax and goods and services tax (GST)
results in the Australian retail petrol price (price at the pump).
The following sections of the paper examine each of these steps, starting with the world oil
price mechanism.

ATRF 2010 Proceedings
2
Figure 1 The Fuel Price Chain
POTENTIAL OIL SUPPLY
less
OPEC SURPLUS
gives
ACTUAL OIL SUPPLY
equals
OIL DEMAND
at
WORLD OIL PRICE
plus
AUSTRALIAN EXCHANGE RATE,
TRANSPORT and REFINERY COSTS
gives
AUSTRALIAN REFINERY
GATE FUEL PRICES
plus
MARGIN, EXCISE, GST
gives
AUSTRALIAN RETAIL PETROL PRICES

Fuel prices in Australia
3
3. World oil supply, demand and price
The potential world oil supply is equivalent to the long-run supply forecasts generated by
various agents, for example the International Energy Agency (IEA 2009). Actual supply in
the short-run (equal to demand) is determined by the additional interaction of levels of OPEC
surplus with the price of oil.
Figure 2 shows the close relationship between changes in the 3-year average of the ratio of
world oil demand to world GDP, and the real oil price expressed in real Special Drawing
Rights (SDRs) per barrel of West Texas Intermediate (WTI). Special Drawing Rights are an
international currency unit calculated by the International Monetary Fund averaging five
major Western currencies. As such, SDR‟s attempt to avoid the effects of currency
fluctuations in measuring oil prices.
Figure 2 World oil demand/price relationship
-6
-5
-4
-3
-2
-1
0
1
2
3
0
10
20
30
40
50
60
70
80
1972
1974
1976
1978
1980
1982
1984
1986
1988
1990
1992
1994
1996
1998
2000
2002
2004
2006
2008
2010
annu
al p
er c
ent
chan
ge in
rat
io
real
200
9 SD
Rs p
er b
arre
l WTI
real oil price (left)
change in oil/GDP ratio
The following equation is the result of a regression on the change in world oil/GDP ratio
using the log of the real SDR oil price, an „echo‟ variable (last year‟s change less that of 3
years ago) and dummies .
%ch oil/GDP ratio = constant – b1*ln oil price + b2*echo + b3*seventiesdum + b4*9092dum
+ b5*postGFCdum
The „seventiesdum‟ implies that the period before 1980 saw generally less reduction in the
oil/GDP ratio for any oil price. It was really after 1980 that the effects of the two major oil
price shocks fed through to investments in and technological development to support energy
efficiency gains.
THE „9092dum‟ and the „postGFCdum‟ are probably both capturing periods of crisis in the
world economy when investment in energy efficiency collapsed (along with most other forms
of investment). The GFCdum has been taken off over the 3 years it is judged that a revival in
investment will occur.

ATRF 2010 Proceedings
4
Table 1 Change in 3-year average of world oil/GDP ratio as a function of the real SDR oil price
Regression Statistics
Multiple R 0.95722898
R Square 0.91628733
Adjusted R Square 0.90360359
Standard Error 0.43268759
Observations 39
ANOVA
df SS MS F Significance F
Regression 5 67.6243816 13.52488 72.24111 8.36666E-17
Residual 33 6.178212282 0.187219
Total 38 73.80259388
Coefficients Standard Error t Stat P-value Lower 95% Upper 95%
Intercept 2.16095845 0.580110237 3.725082 0.000729 0.980715304 3.341201594
ln real oil price -1.28168456 0.167200683 -7.66555 7.96E-09 -1.621856902 -0.941512211
echo 0.26778187 0.043121243 6.209976 5.21E-07 0.180051045 0.355512703
seventiesdum 2.11275251 0.178755376 11.81924 2.1E-13 1.749071961 2.47643305
9092dum 1.01689056 0.26646501 3.816225 0.000565 0.474763425 1.559017697
postGFCdum 0.71730975 0.325337619 2.204817 0.034546 0.055405394 1.379214115
The fit of the prediction from the equation to the actual ratio changes is shown in Figure 3.
Figure 4 shows the fit of the resulting predicted oil/GDP ratio to the actual ratio.
Figure 3 Actual and predicted annual percentage change in the world oil/GDP ratio
-6
-5
-4
-3
-2
-1
0
1
2
3
4
1972
1974
1976
1978
1980
1982
1984
1986
1988
1990
1992
1994
1996
1998
2000
2002
2004
2006
2008
2010
%change oil/GDP ratio
predicted

Fuel prices in Australia
5
Figure 4 Actual and predicted world oil/GDP ratio
1.5
2.0
2.5
3.0
3.5
4.019
72
1974
1976
1978
1980
1982
1984
1986
1988
1990
1992
1994
1996
1998
2000
2002
2004
2006
2008
2010
oil/GDP ratio
predicted
Using the equation in Table 1 and world GDP forecasts, a price of oil can be predicted that
will balance demand and actual supply (potential supply less OPEC surplus).
But to do that, it is first necessary to specify the likely future path of the potential world
supply of oil. The literature on the likely future potential supply of oil is extensive. One of the
best summaries was published by the OECD International Transport Forum in 2008
(OECD/ITF 2008). Opinions vary from those optimistic about supply continuing to expand to
those suggesting that world oil production will peak near the end of this decade.
Figure 5 shows four different scenarios for potential world oil supply (defined as total liquids)
to 2030, plus a scenario for higher world GDP growth. The highest line on the supply graphs
is potential supply. The lower line is actual supply when OPEC cuts have been removed.
Also shown are the oil prices per barrel implied by the equation in Table 1.
The highest supply scenario comes from a peak oil optimist (Odell 2003). A lower supply
scenario is from a peak oil proponent (Laherrere 2007). The IEA scenario has already been
mentioned. The „IEA adjusted‟ potential supply scenario corrects what some believe are
optimistic IEA assumptions regarding supply in the next two decades from non-conventional
sources and from fields discovered and developed in that time (Aleklett 2009 – IEA non-
conventional growth has been reduced to 75 per cent of what was forecast and
discovery/development growth to 50 per cent). These four scenarios have been chosen to
represent different views on the likely trend of potential supply to 2030 (increase/decrease,
timing of turning points, different methodologies, etc).
A fifth scenario, the „IEA high GDP‟ scenario, lifts assumed long-run world GDP growth, from
3.7 per cent per year in the other scenarios to 4.5 per cent. The aim is to show the effect that
higher assumed world GDP growth can have on predicted oil prices. Potential supply is the
same as in the „IEA‟ scenario, but now the oil price must rise more quickly to cancel out the
increased demand pressure.

ATRF 2010 Proceedings
6
Figure 5 World oil supply .............................................. and price scenarios
80
85
90
95
100
105
110
115
120
20
07
20
09
20
11
20
13
20
15
20
17
20
19
20
21
20
23
20
25
20
27
20
29
mill
ion
bar
rels
pe
r d
ay
ODELL
80
85
90
95
100
105
110
115
120
20
07
20
09
20
11
20
13
20
15
20
17
20
19
20
21
20
23
20
25
20
27
20
29
mill
ion
bar
rels
pe
r d
ay
LAHERRERE
80
85
90
95
100
105
110
115
120
2007
2009
2011
2013
2015
2017
2019
2021
2023
2025
2027
2029
mill
ion
barr
els
per d
ay
IEA ADJUSTED
80
85
90
95
100
105
110
115
120
20
07
20
09
20
11
20
13
20
15
20
17
20
19
20
21
20
23
20
25
20
27
20
29
mill
ion
bar
rels
pe
r d
ay
IEA
80
85
90
95
100
105
110
115
120
20
07
20
09
20
11
20
13
20
15
20
17
20
19
20
21
20
23
20
25
20
27
20
29
mill
ion
bar
rels
pe
r d
ay
IEA hi GDP
0
50
100
150
200
250
300
350
400
20
07
20
09
20
11
20
13
20
15
20
17
20
19
20
21
20
23
20
25
20
27
20
29
20
09
US$
pe
r b
arre
l WTI
0
50
100
150
200
250
300
350
400
20
07
20
09
20
11
20
13
20
15
20
17
20
19
20
21
20
23
20
25
20
27
20
29
20
09
US$
pe
r b
arre
l WTI
0
50
100
150
200
250
300
350
400
20
07
20
09
20
11
20
13
20
15
20
17
20
19
20
21
20
23
20
25
20
27
20
29
20
09
US$
pe
r b
arre
l WTI
0
50
100
150
200
250
300
350
400
20
07
20
09
20
11
20
13
20
15
20
17
20
19
20
21
20
23
20
25
20
27
20
29
20
09
US$
pe
r b
arre
l WTI
0
100
200
300
400
500
600
20
07
20
09
20
11
20
13
20
15
20
17
20
19
20
21
20
23
20
25
20
27
20
29
20
09
US$
pe
r b
arre
l WTI
IEA hi GDP

Fuel prices in Australia
7
Table 2 shows the calculations behind the world oil price-setting mechanism, using the IEA
high GDP potential supply projections.
In forecasting mode (from 2010 onwards), the price of oil (to the nearest dollar) is varied until
there is an approximate balance between actual supply and demand. Inventory is assumed
unchanged from year to year. Judgement must be made as to the price OPEC will defend
and whether the implied OPEC production cuts are achievable.
Table 2 World oil supply/demand/price framework, IEA hi GDP scenario for potential supply
WORLD 000 barrels per day 2009 2009 WTI
m Geary- US$ US$ SDR ln nom
potential OPEC actual annual 3yr aver %ch Khamis $ 3yrmovav oilgdp oilgdp pred real oil per real oil real oil dum dum dum US oilprice
supply Cuts supply demand demand GDP GDP GDP ratio pred %ch % ch price SDR price price echo 7279 9092 GFC cpi US$
1969 42485 42485 42684 13102 12589 3.390 19.39 1 19.39 21.31 3.35
1970 46066 46066 44276 5.07 13766 13735 3.224 -4.92 18.34 0.966 18.99 22.53 3.35
1971 48596 48596 45716 4.14 14336 13735 3.328 3.25 18.67 1.02 18.30 23.52 3.56
1972 52144 52144 48935 4.76 15018 14374 3.405 3.395 2.28 1.99 18.09 1.065 16.99 2.83 3.00 1 0 0 24.27 3.56
1973 56325 56325 52355 6.64 16015 15123 3.462 3.521 1.68 3.43 18.53 1.196 15.49 2.74 7.21 1 0 0 25.78 3.87
1974 55491 55491 54653 2.33 16388 15807 3.458 3.440 -0.13 -0.64 44.69 1.203 37.15 3.61 -1.57 1 0 0 28.63 10.37
1975 54991 54991 55603 1.53 16638 16347 3.401 3.428 -1.62 -0.86 44.06 1.212 36.35 3.59 -2.41 1 0 0 31.24 11.16
1976 58427 58427 56303 4.88 17450 16825 3.346 3.356 -1.62 -1.34 47.74 1.154 41.37 3.72 -3.31 1 0 0 33.04 12.79
1977 60604 60604 58007 4.05 18157 17415 3.331 3.318 -0.46 -0.83 50.11 1.169 42.86 3.76 -1.49 1 0 0 35.19 14.30
1978 63221 63221 60750 4.40 18955 18187 3.340 3.336 0.28 0.15 48.38 1.258 38.46 3.65 1.16 1 0 0 37.86 14.85
1979 64381 64381 62735 3.58 19633 18915 3.317 3.339 -0.71 -0.05 65.55 1.294 50.66 3.93 1.90 1 0 0 42.16 22.40
1980 61841 61841 63148 2.02 20030 19540 3.232 3.198 -2.56 -3.59 96.34 1.299 74.17 4.31 -0.24 0 0 0 47.85 37.38
1981 59911 59911 62044 1.96 20423 20029 3.098 3.091 -4.15 -4.37 85.68 1.176 72.86 4.29 -2.84 0 0 0 52.79 36.67
1982 58193 58193 59981 1.11 20648 20367 2.945 2.961 -4.93 -4.43 74.04 1.102 67.18 4.21 -3.44 0 0 0 56.04 33.64
1983 57920 57920 58675 2.84 21236 20769 2.825 2.829 -4.07 -3.94 64.82 1.067 60.75 4.11 -2.37 0 0 0 57.84 30.40
1984 59145 59145 58420 4.56 22204 21363 2.735 2.737 -3.20 -3.12 59.85 1.023 58.50 4.07 0.08 0 0 0 60.34 29.28
1985 59391 59391 58819 3.45 22970 22137 2.657 2.667 -2.84 -2.49 55.22 1.024 53.93 3.99 1.73 0 0 0 62.49 27.97
1986 61147 61147 59894 3.54 23782 22985 2.606 2.619 -1.93 -1.43 29.15 1.179 24.72 3.21 1.24 0 0 0 63.65 15.04
1987 62439 62439 60992 3.83 24694 23815 2.561 2.564 -1.72 -1.58 35.83 1.301 27.54 3.32 1.27 0 0 0 65.97 19.16
1988 64238 64238 62608 4.29 25753 24743 2.530 2.529 -1.20 -1.23 28.66 1.343 21.34 3.06 1.12 0 0 0 68.70 15.96
1989 65588 65588 64088 3.20 26576 25674 2.496 2.488 -1.35 -1.67 33.56 1.284 26.14 3.26 0.73 0 0 0 72.01 19.59
1990 66855 66855 65560 2.10 27134 26488 2.475 2.467 -0.84 -1.17 39.80 1.359 29.29 3.38 0.37 0 1 0 75.90 24.49
1991 66864 66864 66436 1.33 27494 27068 2.454 2.453 -0.84 -0.89 33.50 1.368 24.49 3.20 0.36 0 1 0 79.09 21.48
1992 67547 67547 67089 2.12 28077 27569 2.434 2.438 -0.85 -0.69 31.13 1.408 22.11 3.10 0.51 0 1 0 81.48 20.56
1993 67408 67408 67273 2.19 28694 28088 2.395 2.399 -1.58 -1.44 27.13 1.396 19.44 2.97 -0.01 0 0 0 83.91 18.46
1994 68705 68705 67886 3.50 29698 28823 2.355 2.360 -1.66 -1.47 24.63 1.437 17.14 2.84 -0.74 0 0 0 86.06 17.19
1995 69841 69841 68651 4.19 30942 29778 2.305 2.321 -2.12 -1.47 25.68 1.522 16.87 2.83 -0.81 0 0 0 88.50 18.43
1996 71489 71489 70012 3.39 31990 30877 2.267 2.266 -1.65 -1.70 29.99 1.451 20.67 3.03 -0.54 0 0 0 91.11 22.15
1997 73598 73598 71643 3.91 33242 32058 2.235 2.234 -1.44 -1.47 27.26 1.373 19.86 2.99 0.01 0 0 0 93.21 20.60
1998 73939 73939 73008 1.69 33803 33012 2.212 2.219 -1.04 -0.70 18.75 1.358 13.81 2.63 0.68 0 0 0 94.66 14.39
1999 75573 75573 74370 3.53 34997 34014 2.186 2.187 -1.14 -1.13 24.55 1.365 17.98 2.89 0.61 0 0 0 96.75 19.25
2000 76340 76340 75284 4.83 36688 35163 2.141 2.144 -2.08 -1.93 37.37 1.317 28.38 3.35 0.30 0 0 0 100.00 30.30
2001 76904 76904 76273 2.86 37739 36475 2.091 2.096 -2.33 -2.11 31.09 1.271 24.46 3.20 -1.04 0 0 0 102.85 25.92
2002 77829 77829 77025 3.40 39021 37816 2.037 2.047 -2.60 -2.11 30.81 1.299 23.72 3.17 -1.19 0 0 0 104.47 26.10
2003 79296 79296 78010 4.58 40810 39190 1.991 1.996 -2.27 -2.02 35.95 1.404 25.60 3.24 -0.52 0 0 0 106.85 31.14
2004 82111 82111 79746 5.25 42950 40927 1.948 1.947 -2.11 -2.17 46.60 1.481 31.46 3.45 0.06 0 0 0 109.70 41.44
2005 84500 84500 81969 4.73 44983 42914 1.910 1.900 -1.97 -2.47 61.41 1.473 41.69 3.73 0.48 0 0 0 113.41 56.47
2006 85100 85100 83904 5.24 47341 45091 1.861 1.858 -2.58 -2.72 69.65 1.473 47.28 3.86 0.30 0 0 0 117.07 66.10
2007 86200 100 86100 86100 85233 4.37 49411 47245 1.804 1.805 -3.05 -3.00 74.17 1.534 48.35 3.88 -0.47 0 0 0 120.35 72.36
2008 87017 717 86300 86300 85833 3.16 50974 49242 1.743 1.739 -3.38 -3.59 99.27 1.584 62.67 4.14 -1.07 0 0 0 123.72 99.57
2009 87835 2935 84900 84900 85767 -0.80 50566 50317 1.705 1.706 -2.21 -2.12 61.69 1.542 40.01 3.69 -0.80 0 0 1 123.35 61.69
2010 88652 2504 86148 86148 85783 3.88 52526 51355 1.670 1.670 -2.00 -2.10 85.00 1.542 55.12 4.01 0.88 0 0 1 127.62 87.94
2011 89470 2448 87022 87022 86023 4.29 54778 52623 1.635 -2.14 85.00 1.542 55.12 4.01 1.49 0 0 0.67 131.45 90.58
2012 90287 2400 87887 87860 87010 4.50 57243 54849 1.586 -2.96 92.00 1.542 59.66 4.09 -0.02 0 0 0.33 135.39 100.98
2013 91104 2400 88704 88715 87866 4.50 59819 57280 1.534 -3.30 84.00 1.542 54.47 4.00 -0.86 0 0 0 139.45 94.97
2014 91922 2400 89522 89526 88701 4.50 62510 59857 1.482 -3.40 84.00 1.542 54.47 4.00 -1.17 0 0 0 143.64 97.82
2015 92739 1700 91039 91012 89751 4.50 65323 62551 1.435 -3.17 84.00 1.542 54.47 4.00 -0.44 0 0 0 147.95 100.75
2016 93557 1150 92407 92400 90980 4.50 68263 65366 1.392 -3.00 84.00 1.542 54.47 4.00 0.13 0 0 0 152.38 103.77
2017 94374 850 93524 93500 92304 4.50 71335 68307 1.351 -2.91 84.00 1.542 54.47 4.00 0.40 0 0 0 156.96 106.89
2018 95191 300 94891 94919 93606 4.50 74545 71381 1.311 -2.96 84.00 1.542 54.47 4.00 0.26 0 0 0 161.67 110.09
2019 96009 0 96009 96002 94807 4.50 77899 74593 1.271 -3.08 87.00 1.542 56.42 4.03 0.04 0 0 0 166.52 117.44
2020 96826 0 96826 96803 95908 4.50 81405 77950 1.230 -3.20 90.00 1.542 58.37 4.07 -0.17 0 0 0 171.51 125.14
2021 97643 0 97643 97653 96820 4.50 85068 81457 1.189 -3.40 101.00 1.542 65.50 4.18 -0.24 0 0 0 176.66 144.65
2022 98461 0 98461 98461 97639 4.50 88896 85123 1.147 -3.50 106.00 1.542 68.74 4.23 -0.32 0 0 0 181.96 156.36
2023 99278 0 99278 99254 98456 4.50 92896 88953 1.107 -3.51 107.00 1.542 69.39 4.24 -0.30 0 0 0 187.41 162.57
2024 100096 0 100096 100089 99268 4.50 97077 92956 1.068 -3.52 112.00 1.542 72.63 4.29 -0.11 0 0 0 193.04 175.27
2025 100913 0 100913 100916 100086 4.50 101445 97139 1.030 -3.52 114.00 1.542 73.93 4.30 -0.02 0 0 0 198.83 183.76
2026 101730 0 101730 101738 100914 4.50 106010 101511 0.994 -3.51 114.00 1.542 73.93 4.30 -0.01 0 0 0 204.79 189.27
2027 102548 0 102548 102565 101739 4.50 110781 106079 0.959 -3.52 115.00 1.542 74.58 4.31 0.00 0 0 0 210.94 196.66
2028 103365 0 103365 103360 102554 4.50 115766 110852 0.925 -3.54 116.00 1.542 75.23 4.32 -0.01 0 0 0 217.26 204.32
2029 104183 0 104183 104183 103369 4.50 120975 115841 0.892 -3.55 116.00 1.542 75.23 4.32 -0.03 0 0 0 223.78 210.45
2030 105000 0 105000 105032 104192 4.50 126419 121053 0.861 -3.54 116.00 1.542 75.23 4.32 -0.02 0 0 0 230.50 216.76
4. From world oil prices to Australian petrol prices
What do wor ld oi l pr ices mean for Austral ian petrol prices? The leve l of Australian petrol pr ices at the pump is currently heavily affected by excise and Goods and Services (GST) taxes. As well there are the wholesale and retai l margins, before one gets back to an est imate of the „ref inery gate‟ price.

ATRF 2010 Proceedings
8
And this pr ice is determined not in Austral ia, but by oi l and petroleum prices overseas.
Thus, an analysis has been conducted to work backward f rom the pump pr ice and forward f rom the overseas oi l pr ice.
Table 3 presents the results f rom working backward f rom the pump price for petrol in Australia. The f irst column is the price of petrol at the pump from 1970. Working back towards the ref inery, State and Federal excise taxes, wholesaler and retai ler margins, and GST have to be deducted (shaded numbers in Table 3 are interpolat ions, extrapolat ions or est imates).
The result is an est imate of the ref inery gate price (c/ l i t re) in the lef t of middle column of Table 3.
The procedure for working forward by „ landing‟ overseas oi l pr ices is also presented in Table 3. Here the base is the wor ld oil pr ice in US$/barrel (WTI unti l 1996, then Tapis) . This is transported to Australia and then converted into Australian dol lars, and a roughly est imated ref ining cost is added on to approximate a “ landed price” of imported crude at the ref ine ry gate, in dol lars per barrel (r ight of middle column in Table 3).
Table 3 Austral ian petrol prices and world oi l prices
Australian petrol prices c/l Oil costs/prices $/barrel
pump price oil price ref cost
state back to landed to incl qual on the shipping shipping world
pump federal excise/ margin refin gate refin gate premium wharf US$/$A non-fuel fuel oil price
cal year price excise subsidy c/l GST c/litre $A/b $A/b $A/b US$/b US$/b US$/b cal year
1970 9.15 3.04 0.00 1.06 0.00 5.05 4.40 0.97 3.43 1.116 0.38 0.10 3.35 1970
1971 9.82 3.59 0.00 1.12 0.00 5.11 4.58 1.03 3.55 1.142 0.40 0.10 3.56 1971
1972 10.10 3.81 0.00 1.19 0.00 5.10 4.50 1.09 3.41 1.198 0.42 0.10 3.56 1972
1973 10.94 4.36 0.00 1.30 0.00 5.28 4.30 1.19 3.10 1.429 0.46 0.10 3.87 1973
1974 12.89 4.91 0.00 1.50 0.00 6.48 9.07 1.38 7.69 1.430 0.53 0.08 10.37 1974
1975 15.28 4.91 0.00 1.73 0.00 8.64 10.68 1.59 9.10 1.307 0.61 0.11 11.16 1975
1976 16.64 4.91 0.00 1.96 0.00 9.77 13.05 1.80 11.25 1.210 0.70 0.13 12.79 1976
1977 17.61 5.03 0.00 2.15 0.00 10.43 15.55 1.98 13.57 1.120 0.77 0.14 14.30 1977
1978 19.68 5.16 0.00 2.34 0.00 12.18 15.96 2.15 13.81 1.148 0.83 0.17 14.85 1978
1979 26.82 5.16 0.00 2.59 0.00 19.08 23.50 2.38 21.12 1.116 0.92 0.25 22.40 1979
1980 32.07 5.16 0.30 2.85 0.00 23.76 36.52 2.62 33.90 1.142 1.02 0.32 37.38 1980
1981 35.49 5.16 0.64 3.11 0.00 26.59 36.07 2.86 33.22 1.148 1.11 0.36 36.67 1981
1982 38.96 5.66 0.94 3.40 0.00 28.95 37.93 3.13 34.80 1.011 1.21 0.34 33.64 1982
1983 43.73 7.55 1.95 3.74 0.00 30.48 39.00 3.44 35.56 0.901 1.33 0.31 30.40 1983
1984 47.51 9.39 2.15 3.98 0.00 32.00 38.98 3.65 35.33 0.877 1.42 0.29 29.28 1984
1985 52.63 9.82 2.50 4.25 0.00 36.06 46.32 3.91 42.41 0.701 1.52 0.24 27.97 1985
1986 52.07 17.72 3.07 4.64 0.00 26.64 29.45 4.27 25.19 0.671 1.65 0.21 15.04 1986
1987 54.91 19.88 3.71 5.03 0.00 26.29 34.75 4.62 30.13 0.701 1.79 0.17 19.16 1987
1988 53.23 21.06 3.83 5.38 0.00 22.96 27.80 4.94 22.86 0.790 1.92 0.18 15.96 1988
1989 55.55 22.70 4.13 5.71 0.00 23.02 32.94 5.24 27.70 0.788 2.03 0.20 19.59 1989
1990 68.05 24.50 4.69 6.07 0.00 32.79 40.03 5.58 34.45 0.780 2.16 0.22 24.49 1990
1991 66.47 25.70 5.32 6.29 0.00 29.15 36.52 5.79 30.74 0.779 2.24 0.22 21.48 1991
1992 67.71 26.15 5.45 6.42 0.00 29.69 37.43 5.90 31.53 0.731 2.29 0.20 20.56 1992
1993 67.45 26.35 5.20 6.55 0.00 29.35 36.97 6.02 30.94 0.678 2.33 0.19 18.46 1993
1994 66.74 30.94 6.11 6.67 0.00 23.03 32.99 6.13 26.86 0.735 2.38 0.18 17.19 1994
1995 69.28 33.00 6.51 6.90 0.00 22.86 34.85 6.35 28.51 0.739 2.46 0.19 18.43 1995
1996 71.05 33.75 6.66 7.10 0.00 23.54 38.25 6.52 31.72 0.785 2.53 0.21 22.15 1996
1997 72.34 34.50 7.50 7.21 0.00 23.13 39.99 6.62 33.36 0.737 2.57 0.19 21.84 1997
1998 68.41 34.80 8.12 7.29 0.00 18.20 33.98 6.70 27.28 0.629 2.60 0.18 14.37 1998
1999 70.66 35.20 8.20 7.39 0.00 19.87 38.08 6.79 31.28 0.644 2.63 0.20 17.31 1999
2000 87.22 36.74 -1.54 7.62 7.24 37.17 63.39 7.00 56.39 0.576 2.71 0.24 29.53 2000
2001 87.06 38.14 -1.54 7.85 7.20 35.42 64.40 7.21 57.19 0.513 2.80 0.27 26.26 2001
2002 85.84 38.14 -1.54 8.08 7.07 34.09 60.06 7.43 52.63 0.546 2.88 0.27 25.59 2002
2003 89.72 38.14 -1.61 8.31 7.40 37.48 58.52 7.63 50.89 0.657 2.96 0.32 30.17 2003
2004 97.22 38.14 -1.76 8.50 8.07 44.27 68.88 8.32 60.56 0.736 3.03 0.43 41.14 2004
2005 110.38 38.14 -1.98 10.00 9.13 55.09 88.76 8.16 80.60 0.761 3.11 0.56 57.63 2005
2006 124.24 38.14 -2.21 11.90 10.21 66.20 107.92 10.32 97.60 0.757 3.22 0.68 70.02 2006
2007 124.29 38.14 -2.16 12.00 10.21 66.10 104.94 8.08 96.86 0.843 3.30 0.84 77.52 2007
2008 141.00 38.14 -2.39 12.00 11.73 81.52 133.64 6.24 127.40 0.853 3.44 0.82 104.41 2008
2009 119.61 38.14 -1.01 12.00 9.78 60.70 97.66 11.20 86.46 0.799 3.50 0.82 64.76 2009

Fuel prices in Australia
9
Figure 6 shows that the agreement in movement between the two “ref inery gate” series is fair ly good. An equation l inking the two series is:
Ln ( f rom pump pr ice) = constant + b 1* ln ( f rom oi l pr ice) + b 2*dum7073
+b3*dum8693 + b 4*dum9602 +b 5*dum03on
Figure 6 The two ref inery-gate series
0
20
40
60
80
100
120
140
160
19
70
19
72
19
74
19
76
19
78
19
80
19
82
19
84
19
86
19
88
19
90
19
92
19
94
19
96
19
98
20
00
20
02
20
04
20
06
20
08
Ac/lit
re , $
A/b
arr
el
from pump price
from oil price
Fitt ing this equation gives the results shown in Table 4. The equation results in a f it to the total pump price (using wor ld oi l pr ice plus the t ransmission f ramework) that is quite good – see Figure 7 and Table 4.
Figure 7 Actual and predicted petrol prices
0
20
40
60
80
100
120
140
160
19
70
19
72
19
74
19
76
19
78
19
80
19
82
19
84
19
86
19
88
19
90
19
92
19
94
19
96
19
98
20
00
20
02
20
04
20
06
20
08
Pu
mp
pri
ce
c/li
tre
actual
f it

ATRF 2010 Proceedings
10
Table 4 Regression l ink ing log of t he ‘ est imat ed’ ref inery gat e pr ice in r eal
c/ l i t re t o t he log of t he ‘ l anded’ pr ice in real $ A / bar r el , 1 9 7 0 t o 2 0 0 9
Regression Statistics
Multiple R 0.982675639
R Square 0.965651411
Adjusted R Square 0.960600147
Standard Error 0.06489228
Observations 40
ANOVA
df SS MS F Significance F
Regression 5 4.025097926 0.805019585 191.1702841 7.19656E-24
Residual 34 0.14317427 0.004211008
Total 39 4.168272196
Coefficients Standard Error t Stat P-value Lower 95%
Intercept -0.444399349 0.196326765 -2.263569869 0.030097582 -0.843383337
ln real landed price 1.033043161 0.044696664 23.11231031 2.26223E-22 0.942208612
dum7073 0.469315068 0.049742302 9.434928648 5.06333E-11 0.368226549
dum8693 0.08272343 0.031752131 2.605287514 0.013521372 0.018195337
dum9602 -0.263778617 0.0322242 -8.185730569 1.50459E-09 -0.329266069
dum03on -0.176860594 0.031657574 -5.586675485 2.96751E-06 -0.241196525
5. The Australian exchange rate
In Table 3, before the world oil price is landed on the wharf in Australia, we come to the
Australian dollar ($A) exchange rate, which plays a crucial part in determining Australian fuel
prices. But what determines the value of the Australian dollar?
The Australian dollar used to be a commodity currency within the US dollar block of
currencies. But since the introduction of the Euro in 1999, the Australian dollar has joined
the ranks of the US dollar alternative currencies. Its value is, for the most part, set by the
value of the US currency in terms of a basket of Western currencies – the so-called „Special
Drawing Rights‟ (SDRs). As Figure 8 shows, there is an inverse relationship between the
SDR values of the US and Australian currencies. Figure 9 shows what this means for the
bilateral US$/$A exchange rate. When the US dollar depreciates 10 per cent against the
basket of Western currencies (the SDR), then the Australian dollar rises 20 per cent against
the US dollar (see Gargett 2005). The strength of the US dollar is what took our currency to
50 cents against the US dollar in 2001, and its subsequent weakness is what took the
Australian dollar, just over two years later, to 80 cents. This cycle then repeated itself with
the US dollar strengthening with the flight to safety at the onset of the Global Financial Crisis
(GFC), and then weakening again with the recovery. The Australian dollar did the opposite,
but also independently weakened some more, as a result of the GFC. This negative effect
has worn off, with the US dollar currently at about 0.64 SDRs/US$, which from Figure 9
should mean an US/Australian exchange rate of about 88 cents – close to current (February
2010).

Fuel prices in Australia
11
Figure 8: Movements in the SDR Values of the US and Australian Dollars
0.3
0.4
0.5
0.6
0.7
0.8
0.9Ja
n-0
0
Ja
n-0
1
Ja
n-0
2
Ja
n-0
3
Ja
n-0
4
Ja
n-0
5
Ja
n-0
6
Ja
n-0
7
Ja
n-0
8
Ja
n-0
9
SD
Rs
$A
US$
GFC
Figure 9: Resulting Relationship between the Two Currencies
45
50
55
60
65
70
75
80
85
90
95
100
0.6 0.65 0.7 0.75 0.8
US
c/$
A
SDRs/US$
GFC
To understand why this relationship holds, we need to consider the fact that the Australian
dollar/US dollar is the fifth most traded currency pair in the world. This is not due to the
volume of our exports and imports. Rather, think of the Australian dollar as a car park.
Carscome in off the street, park in a parking space, and then leave back to the street. There
is a constant flow in and out. But this car park is special - the price of parking spaces rises
when more cars are coming in than are leaving. The street is the US dollar, the cars are

ATRF 2010 Proceedings
12
money flows, and the price of parking spaces is the value of the Australian dollar. When the
US dollar is depreciating, more money wants to escape the street and comes and parks in
the Australian dollar, driving up its value, and vice versa. This is the best analogy I can think
of, to explain the relationship shown in Figures 8 and 9.
An equation to explain the Australian exchange rate is as follows:
SDRs/$A = constant + b1*ussdrinv +b2*chnetals+b3*chir+b4*usdev+b5*curs+b6*chxrl11
+b7*compd1 + b8*compd2 + b9*nz$dum
Table 5 presents the results of a regression from January 2000 to June 2007 using daily
data. The dependent variable is the value of the Australian dollar in SDR‟s. The main
explanatory variable is the inverse of the value of the US dollar in SDR‟s (ussdrinv), adjusted
by the ratio of G7 to Australian consumer price indices (22 week moving average).
There are also five acceleration components that are associated with the shorter-term
movements in the currency:
1. chmetals - the 3-month rate of change in an index of spot metal prices on the London Metals Exchange (expressed in SDRs).
2. chir - the 3-month rate of change in the Australian 3 year bond rate. 3. usdev - the change in the current US dollar per SDR rate from that of the last 22 days. 4. currs - the 3-month change in three currencies that the market treats similarly to the
Australian dollar, i.e. the New Zealand dollar, the Canadian dollar and the Korean Won. 5. chxrl11 - the 6-week change in the value of the Australian dollar itself, lagged 2 weeks.
This captures some of the feed-back dynamics in short-run changes to the $A.
Finally, there are three dummy variables necessary to explain factors causing fairly long-
lived shifts in the dollar‟s value:
1. compd1 - a commodity boom dummy coming on from 0 at April 25, 2005 to 1.0 at June 14, and then being held constant. This simulates the realization by the market that Australia would benefit from much higher contract prices for its commodities, iron and coal especially. It has a positive effect.
2. compd2 - another commodity boom dummy coming on from 0 at May 31 2007 to 1.0 at June 14, and then being held constant. This simulates the next rise in contract prices for Australian commodities. It has a positive effect.
3. nz$dum - a New Zealand dollar collapse dummy that mirrors the V-shaped collapse and partial recovery of the New Zealand dollar from March 20, 2006 to April 18, then remains constant to June 2006, and then reduces to zero by June 2007. It has a negative effect.

Fuel prices in Australia
13
Table 5 Equation for the daily value of the Australian dollar in SDR’s
Regression Statistics
Multiple R 0.9855159
R Square 0.9712416
Adjusted R Square 0.9711086
Standard Error 0.007816
Observations 1956
ANOVA
df SS MS F Significance F
Regression 9 4.014866489 0.446096 7302.357 0
Residual 1946 0.118879892 6.11E-05
Total 1955 4.13374638
Coefficients Standard Error t Stat P-value Lower 95% Upper 95%
Intercept -0.0593279 0.003660351 -16.2082 1.61E-55 -0.066506487 -0.052149246
ussdrinv 0.8174874 0.005803674 140.8569 0 0.806105348 0.82886949
chmetals 0.1059773 0.005280123 20.07099 1.36E-81 0.095622009 0.116332592
chir 0.2327521 0.007714786 30.16962 2.3E-164 0.21762202 0.247882244
usdev 0.7926556 0.066632254 11.89598 1.5E-31 0.661977546 0.92333373
currs 0.3385629 0.023556329 14.37248 1.36E-44 0.292364642 0.384761221
chxrl11 0.0029278 0.000249509 11.7342 9.02E-31 0.002438452 0.003417117
compd1 0.0356738 0.000579142 61.59759 0 0.034537965 0.036809574
compd2 0.0172621 0.002062399 8.369931 1.09E-16 0.013217393 0.021306879
nz$dum 0.9751488 0.036024498 27.06905 3.2E-137 0.904498181 1.045799499
Figure 10 shows 1) the fit of the equation during the period of estimation, from January 2000
to June 2007, and then 2) the fit in the two and a half years subsequent - to December 2009.
The equation fits the daily data remarkably well until the onset of the global financial crisis
(GFC) in October 2008. The gap between actual and fit in the period from October 2008 to
October 2009 can be understood as measuring the effect of the GFC on the Australian
dollar, and is linked to the collapse and subsequent recovery in commodity prices. Figure 11
shows the ex-sample period in more detail.
Figure 10 Fit and ex-sample fit of exchange rate equation, 2000 to 2009
45
50
55
60
65
70
75
80
85
90
95
100
105
jan00 jan01 jan02 jan03 jan04 jan05 jan06 jan07 jan08 jan09
US
c/$A
USc/$A
fit
ex-smpl fit

ATRF 2010 Proceedings
14
Figure 11 Fit and ex-sample fit of exchange rate equation, 2007 to 2009
60
65
70
75
80
85
90
95
100
apr
may jun jly
aug
sep
oct
nov
dec
jan0
8
feb
mar ap
r
may jun jly
aug
sep
oct
nov
dec
jan0
9
feb
mar ap
r
may jun jly
aug
sep
oct
nov
dec
US
c/$A
USc/$A
fit
ex-smpl fit
6. Australian retail petrol price scenarios
Table 6 shows the calculated landed refinery gate price (in real 2009 A$/barrel from 2009 on), derived from the IEA adjusted scenario for projected world oil prices (Tapis set at 1.05 times WTI), with shipping fuel costs varying proportionally to oil prices and the Australian dollar held constant against the US dollar. The result is the scenario for the total Australian petrol price also presented in the table. This involves adding in forecasts for excise, GST and margins (real 2009Ac/l from 2009 on). The GST is taken as 10 per cent of the refinery gate price plus excise. Excise (under current legislation) is held constant in nominal terms, and so is progressively diminished, with inflation assumed to be 2.5 per cent per year. Finally, the margin is assumed to be a constant fraction of refinery gate price plus GST.
Table 6 Translating the IEA adjusted scenario into Australian retail petrol prices (2009 c,$)
Australian petrol prices c/l Oil costs/prices $/barrel
petrol price oil price ref cost
state landed to landed to incl qual on the shipping shipping Tapis
pump federal excise/ refin gate refin gate premium wharf US$/$A non-fuel fuel oil price
cal year price excise subsidy margin GST c/litre $A/b $A/b $A/b US$/b US$/b US$/b cal year
2007 124.29 38.14 -2.16 12.00 10.21 66.10 104.94 8.08 96.86 0.84 3.30 0.84 77.52 2007
2008 141.00 38.14 -2.39 12.00 11.73 81.52 133.64 6.24 127.40 0.85 3.44 0.82 104.41 2008
2009 119.61 38.14 -1.01 12.00 9.78 60.70 97.71 11.20 86.51 0.80 3.50 0.86 64.76 2009
2010 134.24 37.21 -0.01 14.28 10.91 71.86 114.36 10.40 103.96 0.90 3.50 0.81 89.25 2010
2011 133.32 36.30 -0.01 14.28 10.82 71.93 114.47 10.40 104.07 0.90 3.50 0.92 89.25 2011
2012 139.18 35.42 -0.01 15.27 11.26 77.24 122.64 10.40 112.24 0.90 3.50 0.91 96.60 2012
2013 130.37 34.55 -0.01 14.10 10.57 71.16 113.28 10.40 102.88 0.90 3.50 0.90 88.20 2013
2014 125.49 33.71 -0.01 13.50 10.18 68.10 108.57 10.40 98.17 0.90 3.50 0.85 84.00 2014
2015 124.59 32.89 -0.01 13.49 10.10 68.12 108.59 10.40 98.19 0.90 3.50 0.87 84.00 2015
2016 132.53 32.09 -0.01 14.78 10.70 74.97 119.16 10.40 108.76 0.90 3.50 0.93 93.45 2016
2017 139.65 31.30 -0.01 15.94 11.25 81.17 128.68 10.40 118.28 0.90 3.50 1.10 101.85 2017
2018 169.54 30.54 -0.01 20.45 13.55 105.00 165.10 10.40 154.70 0.90 3.50 1.33 134.40 2018
2019 194.61 29.79 -0.01 24.25 15.49 125.09 195.58 10.40 185.18 0.90 3.50 1.46 161.70 2019
2020 176.02 29.07 -0.01 21.62 14.04 111.30 174.67 10.40 164.27 0.90 3.50 1.55 142.80 2020
2021 191.15 28.36 -0.01 23.95 15.20 123.65 193.40 10.40 183.00 0.90 3.50 1.60 159.60 2021
2022 206.54 27.67 -0.01 26.32 16.38 136.18 212.34 10.40 201.94 0.90 3.50 1.85 176.40 2022
2023 245.96 26.99 -0.01 32.22 19.43 167.33 259.20 10.40 248.80 0.90 3.50 2.02 218.40 2023
2024 237.26 26.33 -0.01 31.03 18.75 161.16 249.93 10.40 239.53 0.90 3.50 2.08 210.00 2024
2025 222.53 25.69 -0.01 28.96 17.60 150.29 233.60 10.40 223.20 0.90 3.50 2.08 195.30 2025
2026 243.95 25.07 -0.01 32.20 19.25 167.44 259.36 10.40 248.96 0.90 3.50 2.17 218.40 2026
2027 260.56 24.45 -0.01 34.74 20.53 180.85 279.45 10.40 269.05 0.90 3.50 2.39 236.25 2027
2028 285.11 23.86 -0.01 38.44 22.42 200.40 308.64 10.40 298.24 0.90 3.50 2.41 262.50 2028
2029 248.26 23.28 -0.01 33.10 19.56 172.33 266.69 10.40 256.29 0.90 3.50 2.46 224.70 2029
2030 272.17 22.71 -0.01 36.70 21.41 191.36 295.16 10.40 284.76 0.90 3.50 1.83 250.95 2030

Fuel prices in Australia
15
Australian petrol price projections from all five scenarios are shown in Figure 12. The price of a litre of petrol varies from around $1 up to $2.50 to $3.50 under the different scenarios.
Figure 12 Australian retail petrol price scenarios
0.00
0.50
1.00
1.50
2.00
2.50
3.00
3.50
2007
2009
2011
2013
2015
2017
2019
2021
2023
2025
2027
2029
2009
$A p
er li
tre
laherrere
IEAadj
IEA hi GDP
IEA
odell
7. Conclusions and Implications
There are several conclusions to be drawn from the above analysis:
There exist very divergent views on the future potential supply of oil onto world markets.
These generate very divergent scenarios regarding the future path of world oil prices.
There is a fairly stable translation mechanism from world oil prices to Australian petrol prices.
A key element of this translation mechanism is the value of the Australian dollar, which is shown to depend in the long run on the value of the US currency, plus shifts in long-run expectations about commodity prices received by Australia.
The divergent supply scenarios have 2030 oil prices (in 2009US$) varying from $65 to $300 per barrel.
At a constant Australian dollar exchange rate, this generates a variation in Australian petrol prices at the pump (in 2009$A) of from $1 to $3.30 per litre
The obvious conclusion: it all depends on what you assume!
But, that said, there exists a fairly stable mechanism for translating assumptions about world oil markets into retail petrol prices at the pump in Australia.
There are also some implications that can be drawn for Australian transport:
All but one of the scenarios have petrol prices restrained for the rest of this decade.
But in the 2020s the major difference that emerges is between the IEA and Odell scenarios and the two peak oil scenarios. Under the former, Australian petrol prices are likely to be fairly flat in the range of $1 per litre. But under the latter they would rise by 2030 to the range $2.50 to $3.50 per litre.

ATRF 2010 Proceedings
16
If an average Australian household drives 375 kilometres per week, with an average fuel efficiency of the light vehicle fleet in 2010 of 11 litres per 100 kilometres and 9 litres per 100 kilometres in 2030, the peak oil scenarios would see the weekly cost of petrol rise from $55 today to between $90 and $110 in 2030.
The price and cost of petrol would be higher under all scenarios if the world economy grows faster in the future.
Increases in the fuel efficiency of the vehicle fleet will be an important factor in mitigating the effects on consumers of any rise in petrol prices, but such increases are very slow given the longevity of the Australian fleet.
The demand for urban public transport in liable to rise significantly if some of the higher petrol price scenarios are realised. But given urban public transport is only some 10 per cent of metropolitan trips, and the nature of our cities is unlikely to change substantially in 20 years, the impact of any petrol price rises would still be felt.
References
Australian Automobile Association 2010 Issues for motorists: petrol prices . http://www.aaa.asn.au/issues/petrol.htm
Australian Bureau of Statistics 2010 On-line database . http://www.abs.gov.au/AUSSTATS/[email protected]/viewcontent?readform&view=ProductsbyCatalogue&Action=expandwithheader&Num=1
Australian Competition and Consumer Commission 2007 Petrol prices and Australian consumers: report of the ACCC inquiry into the price of unleaded petrol, http://www.accc.gov.au/content/index.phtml/itemId/806216
Aleklett, K. 2009, Future transportation fuels without ‘business as usual’ as an option, http://www.aspo-australia.org.au/References/Aleklett/20090610Sydney1Smart2009.pdf
Baumeister, C. and Peersman, G. 2010 Sources of the volatility puzzle in the crude oil market, Ghent University . http://www.feb.ugent.be/FinEco/christiane/documents/BP2_volatility.pdf
BP Global 2010 Statistical review of world energy 2009 . http://www.bp.com/productlanding.do?categoryId=6929&contentId=7044622
Economagic database 2010 http://www.economagic.com/fedstl.htm
Gargett, D. 2005, Freight rates and competitiveness, Grains West Expo, Scarborough Beach, Western Australia. http://www.bitre.gov.au/info.aspx?ResourceId=187&NodeId=64
Graham, P. and Reedman, L. (2010) Peak oil and energy security: can alternative fuels and vehicles save us? International Journal of Global Energy Issues, vol. 33, nos. 1/2.
International Energy Agency 2010 Oil market report: world demand, . http://omrpublic.iea.org/demandsearch.asp
International Monetary Fund 2010 World economic outlook update: a policy-driven, multi-speed recovery, http://www.imf.org/external/pubs/ft/weo/2010/update/01/index.htm
Laherrere 2007 Uncertainty of data and forecasts for fossil fuels, paper given at the Universidad de Castilla-La Mancha http://www.hubbertpeak.com/laherrere/Castilla200704.pdf

Fuel prices in Australia
17
London Metal Exchange 2010 Data and prices http://www.lme.co.uk/2531.asp
Maddison, A. 2009 World GDP website http://www.ggdc.net/Maddison/
Odell, P. 2003, Why carbon fuels will dominate the 21st century’s global energy economy, Multi-Science Publishing, Essex, U.K.
OECD/ITF 2008 Oil dependence: Is transport running out of affordable fuel? Roundtable 139,.Paris, France
Reserve Bank of Australia 2010 Statistical tables . http://www.rba.gov.au/statistics/tables/index.htmlxr