Embed Size (px)
Citation preview

Monitoring of the Australian petroleum industry
Report of the ACCC into the prices, costs and profits of unleaded petrol in Australia
DECEMBER 2012
Monitoring of the Australian petroleum industry 1

ISBN 978 1 921973 36 9
Australian Competition and Consumer Commission 23 Marcus Clarke Street, Canberra, Australian Capital Territory, 2601
© Commonwealth of Australia 2012
This work is copyright. In addition to any use permitted under the Copyright Act 1968, all material contained within this work is provided under a Creative Commons Attribution 3.0 Australia licence, with the exception of:• the Commonwealth Coat of Arms• the ACCC and AER logos• any illustration, diagram, photograph or graphic over which the Australian Competition and Consumer Commission does not hold
copyright, but which may be part of or contained within this publication.
The details of the relevant licence conditions are available on the Creative Commons website, as is the full legal code for the CC BY 3.0 AU licence.
Requests and inquiries concerning reproduction and rights should be addressed to the Director, Internal Communication and Publishing Services, ACCC, GPO Box 3131, Canberra ACT 2601, or [email protected].
Important notice
The information in this publication is for general guidance only. It does not constitute legal or other professional advice, and should not be relied on as a statement of the law in any jurisdiction. Because it is intended only as a general guide, it may contain generalisations. You should obtain professional advice if you have any specific concern.
The ACCC has made every reasonable effort to provide current and accurate information, but it does not make any guarantees regarding the accuracy, currency or completeness of that information.
Parties who wish to re-publish or otherwise use the information in this publication must check this information for currency and accuracy prior to publication. This should be done prior to each publication edition, as ACCC guidance and relevant transitional legislation frequently change. Any queries parties have should be addressed to the Director, Internal Communications and Publishing Services, ACCC, GPO Box 3131, Canberra ACT 2601, or [email protected].
ACCC 12/12_630
www.accc.gov.au
Monitoring of the Australian petroleum industry 2

Key points
In 2011−12 movements in the retail price of petrol in Australia continued to be driven by movements in international prices. Overall, both international refined petrol and domestic retail prices exhibited characteristic volatility and, on an annual basis, reached historically high levels. While prices in mid-2012 were off their highs of early 2012, they nevertheless remained at relatively high levels despite a weaker global economy.
International factors the key to Australian petrol prices
The main influences on Australian retail petrol prices are international prices and the exchange rate
International prices of crude oil largely drive international refined petrol prices and it is the international prices of refined petrol that drive retail petrol prices in Australia.
In the medium to long term retail prices are overwhelmingly determined by international market prices and because international prices are expressed in USD, changes in the AUD–USD exchange rate also affect domestic retail prices.
In 2011−12 average annual international prices of crude oil and refined petrol were the highest on record.
International producers of crude oil have been the major beneficiaries of higher petrol prices in recent years. From 2008−09 to 2011−12 annual average retail prices have risen 15.7 cents per litre (cpl). Of this increase, 11.8 cpl flowed to the owners of crude oil, 1.4 cpl is accounted for by taxes and 2.5 cpl accrued to Australian petrol companies.
Australian post-tax prices are low by international standards
Australian petrol prices are among the lowest in the OECDCrude oil and refined petrol are internationally traded commodities and their prices form the basis for the setting of retail prices in most countries.
Relatively low levels of petrol taxes in Australia result in petrol prices in Australia being among the lowest in the OECD.1
1 Bureau of Resources and Energy Economics (2012), Australian Petroleum Statistics, issue number 194, September 2012.
Monitoring of the Australian petroleum industry 3

Key international factorsWith Australia being a net importer of refined petrol, it is the international benchmark price of imports into Australia that forms the basis for prices in Australia. The most appropriate benchmark price for regular unleaded petrol (RULP) sold to Australian consumers is the price of Singapore Mogas 95 Unleaded (Mogas 95).
Australian retail petrol prices have tracked the price of Mogas 95 very closely. Between the June 2002 quarter and the June 2012 quarter, average retail prices of RULP (excluding taxes and subsidies) in Australia’s five largest capital cities increased by around 120 per cent while the price of Mogas 95 increased by around 122 per cent.
Crude oil is an internationally traded commodity and ultimately is a key driver of the price of refined petrol in the long run. Australian refineries generally pay a price for crude oil that is based on the price of Brent crude (a heavily traded crude oil marker) or Tapis crude (the crude oil marker traditionally used in the Asia-Pacific region).
In 2011−12 world crude oil prices were volatileCrude oil prices were volatile during 2011−12 but generally moved in phases corresponding with different economic and geo-political climates:
from July to November 2011, prices fluctuated in response to uncertainty in countries in the eurozone and to general concerns over the world economy
from December 2011 to April 2012 international crude oil prices rose substantially as a result of increased demand due to a cold northern hemisphere winter, concerns over the effects of sanctions against Iran on global supplies and the easing of concerns about a US recession
from April to June 2012 prices of crude oil decreased in response to evidence that the Chinese and Indian economies were slowing and that problems in the eurozone would be difficult to address
from July to September 2012, crude oil prices rose again due to supply disruptions in the North Sea and renewed hopes for economy recovery in the US.
Despite some price reductions in April to June, 2011−12 saw the highest ever annual average crude oil prices
Average crude oil prices during 2011−12 have remained at historically high levels. The comparatively lower prices seen in June 2012 were still significantly above average prices for the previous 20 years. Average annual crude oil prices during 2011−12 were the highest on record.
Crude oil prices are likely to remain relatively high as lower-cost traditional oil fields continue to be depleted and crude oil is increasingly extracted from unconventional and more costly sources, including shale oil and tar sand deposits.
Monitoring of the Australian petroleum industry 4

Profits
Profits in the downstream industry do not seem excessiveConsolidated profits across all products and all sectors in the downstream petroleum industry fell in 2011−12 to around $408 million, 81 per cent lower than the profit of $2.2 billion in 2010−11.
On a cents per litre basis, consolidated net profit for the downstream industry was 0.46 cpl in 2011−12, compared with 2.54 cpl the previous year. Over the last 10 years, the entire downstream petroleum industry has earned an average annual net profit of 1.82 cpl across all products sold in Australia.
On the other hand, petrol products (regular unleaded, premium unleaded and ethanol blended petrol) incurred a net loss of 0.03 cpl across all sectors in the downstream petroleum industry.
Lower industry profits in 2011−12 reflect poor financial results in the refinery and total supply sectors due to higher costs, the effects of unplanned refinery shutdowns, losses on the values of inventory holdings and losses on foreign exchange transactions.
These sectors continue to be affected by competition from more efficient refineries in the Asia-Pacific region. In 2011−12 the refinery sector incurred a loss of about $596 million. If the recent write-downs of asset values were included in profit calculations, the refining sector would have shown a loss of $2.8 billion in 2011−12.
The wholesale and retail sectors continued their recent trend of improving profits.
Domestic refining
Refinery sector facing challengesThe ACCC has found that the Australian petroleum refining sector has in general recorded comparatively low net profits and rates of return since the global financial crisis.
With domestic petrol prices set on the basis of import parity, Australian refiners (and suppliers) have little scope to pass on costs that are out of line with international best practice for refinery production.
The Australian refinery sector is facing a challenging future due to competition from the newer Asian mega refineries, as evidenced by the recent write down of the values of the Caltex and Shell refinery assets, the closure of the Shell Clyde refinery, the announced closure of the Caltex Kurnell refinery and the review of the Shell refinery in Geelong.
The long term average return on assets for the entire downstream petroleum industry has been generally comparable with other Australian industries and international downstream petroleum businesses.
Independent imports
Independent imports continued to increase
Monitoring of the Australian petroleum industry 5

Imports by independent wholesalers continued to increase in 2011−12. Since 2007−08 independent imports have increased more than four-fold, accounting for about 30 per cent of total imports in 2011−12, compared with less than 5 per cent in 2007−08.
One of the key factors driving the growth in independent imports has been greater access to import terminals in the capital cities and to dependable sources of Australian standard refined petrol from overseas refineries.
In the past five years, at least four independent wholesalers have imported refined petrol from various overseas markets. Currently, three of the monitored independent wholesalers—Ausfuel, United and Neumann—own, or have access to, import infrastructure.
Petrol price cycles
Price cycles continue to be a concern for consumersPetrol price cycles in the larger capital cities are of concern to many consumers due to the large price increases that can occur in a single day, and across most retail sites, on a regular basis. However, some consumers seem to take advantage of the low point in the price cycle to purchase petrol at relatively low prices.
These price cycles are not caused by changes in international benchmark prices, rather they are driven by the pricing policies of retailers. The ACCC has expressed concern with the level of coordination apparent in petrol price cycles.
The typical pattern of the petrol price cycle in recent years has been one where prices rise quickly at the outset (over one to three days) and then steadily decline over the rest of the cycle (between six and nine days); that is, they move in a ‘sawtooth’ pattern.
The duration of price cycles in the eastern capital cities has been increasing over the last few years. In 2009 the average duration of price cycles in these cities was around seven days, whereas it had increased to over 12 days by the end of the September 2012 quarter. This has made the price cycle less predictable and means that it is not as easy for consumers to take advantage of the low points in the cycle. ACCC analysis has shown that the upward phase has generally been led by BP or Caltex.
Petrol price cycles have been a feature of retail markets in Australia’s largest cities for many years. The ACCC has also found evidence of petrol price cycles in a small number of cities in the US and Canada. Evidence presented in this report suggests that the average price cycle increase in Australia is higher than in these cities in the US and Canada.
ACCC investigation into information sharing
The ACCC is progressing its investigations of the price sharing arrangements and shopper docket discounting schemes in the retail sector
The ACCC is examining price information sharing arrangements in relation to the retail petrol sector. The ACCC is concerned that such arrangements may breach the
Monitoring of the Australian petroleum industry 6

Competition and Consumer Act 2010 (the Act). In particular, the ACCC is concerned that these arrangements may lessen price competition in petrol retailing to the detriment of consumers.
These price sharing arrangements allow for the private and very frequent exchange of comprehensive retail price information between the major petrol companies. The ACCC is concerned that this allows petrol retailers to quickly signal price movements, monitor competitors’ responses, and react to them.
ACCC investigation into shopper docket discounting schemesThe ACCC is also currently examining the effects of shopper docket discounting schemes on competition and log-term consumer welfare having regard to the size (value), frequency and duration of these offers.
The ACCC’s investigations of these arrangements require a full assessment of the purposes and likely effects of the conduct and the application of the Act to any such conduct. The ACCC is yet to finalise its view as to whether information sharing and shopper docket discounting schemes in the petrol industry may contravene any provisions of the Act; both investigations are continuing.
Regional pricesRetail prices in regional locations are largely driven by international benchmark prices and the AUD–USD exchange rate, just as they are in the larger capital cities. However, prices in regional locations in Australia tend to be higher and more stable than in capital cities.
Higher regional fuel prices are generally due to structural issues such as less competition, lower volumes and higher transport costs
In many regional locations, there is a lag between movements in capital city prices and local prices. This lag arises because the turnover of petrol stocks is lower in the country than in the capital cities due to lower volume of sales in regional areas. As a result, price changes in the five largest cities take some time to be passed on to regional locations.
An example of this lag occurred in May and June 2012, when the city-country price differential increased, as prices decreased significantly in the capital cities. In Victoria, this differential was compounded by a period of substantial discounting in Melbourne, which made the city-country differential even higher.
The difference between regional petrol prices and those in the larger capital cities is principally due to the following factors in regional locations:
a lower number of retail sites and therefore a lower level of local competition
lower volumes of fuel sold
distance/location factors
lower convenience store sales.
Monitoring of the Australian petroleum industry 7

The ACCC takes allegations of anti-competitive behaviour very seriously and will investigate and take action through the courts where appropriate
However, results of comparative analysis of regional and capital city prices need to be treated with caution. Short-term comparisons of prices in a regional location with those in a capital city can be distorted when price cycles in the capital cities have failed or the capital city is at an extreme end of its cycle.
The ACCC is aware of, and sensitive to, the concerns of motorists in regional locations about the relatively higher prices of petrol in some regional locations. The ACCC actively monitors petrol prices in around 180 locations throughout Australia and also monitors competition issues in those locations. The ACCC will continue to monitor regional Australian petrol prices and where any regional market looks to be of concern, it will not hesitate to thoroughly investigate pricing and local market dynamics.
As many regional locations have a small number of retail sites, the ACCC also pays particular attention to potential changes in ownership of retail sites in regional locations to ensure that the sale will not result in a substantial lessening of competition in that market.
The ACCC welcomes any information or evidence that local businesses or the public have in relation to changes in the ownership of retail sites in regional locations that may result in increased market concentration.
Ethanol blended petrol
Sales of ethanol blended petrol decreased in 2011−12 and, supplies of ethanol appear adequate to meet Australian demand
Ethanol is added to petrol to produce various grades of ethanol blended petrol (EBP). The most common EBP is E10, which is RULP containing up to 10 per cent ethanol. Total sales of EBP in Australia decreased in 2011−12, reversing the trend of previous years. Sales remained broadly stable in NSW but decreased significantly in Queensland and Victoria. Similarly the number of retail sites selling E10 across Australia decreased in 2011−12.
The largest volume of EBP is sold in NSW, which accounts for over 80 per cent of the Australian EBP market. This is largely the result of the ethanol mandate in that state, which from October 2011, has required that 6 per cent of the total volume of petrol sold in NSW should be ethanol.
Across all locations monitored by the ACCC in 2011−12, average RULP prices were higher than average E10 prices by around 1.8 cpl.
In previous years the ACCC has expressed concern about the supply of ethanol and that there are only three suppliers. However, in 2011−12 there appeared to be sufficient supply to meet demand. The ACCC will continue to closely monitor the market for EBP over the coming year.
Monitoring of the Australian petroleum industry 8

Shortened terms
7-Eleven 7-Eleven Stores Pty Ltd
AUD Australian dollars
ABS Australian Bureau of Statistics
ACCC Australian Competition and Consumer Commission
AIP Australian Institute of Petroleum
APAC APAC biofuel consultants (a joint venture of EnergyQuest Pty Ltd and Ecco Consulting Pty Ltd)
APS Australian Petroleum Statistics
Ausfuel Ausfuel Group
ASX Australian Securities Exchange
avg. average
bl barrel (equals 158.9873 litres)
BP BP Australia Pty Ltd
BREE Bureau of Resources and Energy Economics
CAD Canadian dollars
CBA Commonwealth Bank of Australia
CIA Central Intelligence Agency
Monitoring of the Australian petroleum industry 9

Caltex Caltex Australia Ltd
Coles Express Coles Express Pty Ltd
Coogee Chemicals Coogee Chemicals Pty Ltd
cpl Australian cents per litre
SEWPaC Department of Sustainability, Environment, Water, Population and Communities
E10 see EBP
E85 see EBP
EBIT earnings before interest and tax
EBP ethanol blended petroleum, of which E10 (unleaded petrol with 10 per cent ethanol) is a common blend. E85 is a petrol blend containing 70 per cent to 85 per cent ethanol.
EUR euros
excl. excluding
FCAI Federal Chamber of Automotive Industries
FFV flex fuel vehicle
FOB free on board
FuelCC Fuel Consultative Committee
GIRDs gross indicative retail differences
GL gigalitres
GST goods and services tax
Monitoring of the Australian petroleum industry 10

Gull Gull Petroleum Group (now part of Ausfuel Group)
IEA International Energy Agency
Informed Sources Informed Sources (Australia) Pty Ltd
IPP import parity price/pricing
JTA joint terminal arrangement
JV joint venture
KBD thousand barrels per day
KL kilolitres (thousand litres)
LHS left-hand side
Liberty Liberty Oil Pty Ltd
LPG automotive liquefied petroleum gas
mbpd million barrels per day
MMA McLennan Magasanik Associates Pty Ltd
Marstel Marstel Terminals Pty Ltd
ML megalitre (million litres)
MOC market on close
Mobil Mobil Oil Australia Pty Ltd
Mogas motor gasoline
MON motor octane number
Monitoring of the Australian petroleum industry 11

MOPS mean of Platts Singapore (refer to Platts in the glossary)
MTBE methyl tertiary butyl ether (a fuel additive and octane enhancer)
na not applicable
Neumann Neumann Petroleum Pty Ltd
NZRC New Zealand Refining Company
OECD Organisation for Economic Co-operation and Development
On the Run retail trading name of Peregrine Corporation
OPEC Organization of the Petroleum Exporting Countries
pa per annum
PSA Prices Surveillance Authority
PULP premium unleaded petrol
RBA Reserve Bank of Australia
RBOB Reformulated Gasoline Blendstocks for Oxygenate Blending
RET Department of Resources, Energy and Tourism
RFS Renewable Fuels Scheme (United States)
RHS right-hand side
Rio Tinto Rio Tinto Ltd
RON research octane number
RULP regular unleaded petrol
Monitoring of the Australian petroleum industry 12

Saudi CP Saudi contract price
SEP Strasburger Enterprises (Properties) Pty Ltd
Shell Shell Company of Australia Ltd
SMP Sydney Metropolitan Pipeline Pty Ltd
TGP terminal gate price
the Act Competition and Consumer Act 2010(formerly the Trade Practices Act 1974)
Trafigura Trafigura Services Australia Pty Ltd
United United Petroleum Pty Ltd
USD United States dollars
USD/bl United States dollars per barrel
US EIA United States Energy Information Administration
US FTC United States Federal Trade Commission
Vopak Vopak Terminals Australia Pty Ltd
Woolworths Woolworths Ltd
WSFR Worldscale flat rate
WTI West Texas Intermediate
Monitoring of the Australian petroleum industry 13

Glossary
2007 ACCC petrol inquiry report the report of the ACCC’s 2007 public inquiry into the price of unleaded petrol: Petrol prices and Australian consumers: Report of the ACCC inquiry into the price of unleaded petrol, December 2007.
2008 ACCC petrol monitoring report the ACCC’s 2008 petrol monitoring report, Monitoring of the Australian petroleum industry: Report of the ACCC into the prices, costs and profits of unleaded petrol in Australia, December 2008.
2009 ACCC petrol monitoring report the ACCC’s 2009 petrol monitoring report, Monitoring of the Australian petroleum industry: Report of the ACCC into the prices, costs and profits of unleaded petrol in Australia, December 2009.
2010 ACCC petrol monitoring report the ACCC’s 2010 petrol monitoring report, Monitoring of the Australian petroleum industry: Report of the ACCC into the prices, costs and profits of unleaded petrol in Australia, December 2010.
2011 ACCC petrol monitoring report the ACCC’s 2011 petrol monitoring report, Monitoring of the Australian petroleum industry: Report of the ACCC into the prices, costs and profits of unleaded petrol in Australia, December 2011.
automotive fuel includes petrol, diesel and automotive LPG.
Alaska North Slope crude oil a crude oil used as the benchmark for the acquisition cost of composite crude oil for California refineries.
barrel a traditional measure used by the oil industry: one barrel is equivalent to 158.987 litres.
Monitoring of the Australian petroleum industry 14

benchmark pricing the practice of pricing to an identified crude or product price; for instance, the Tapis crude oil pricing benchmark.
biodiesel a diesel fuel based on vegetable oil or animal fat, typically made in combination with alcohol.
Brent crude a type of oil sourced from the North Sea and usually refined in northwest Europe. The Brent crude oil marker, also known as Brent blend, London Brent and Brent petroleum, remains the major benchmark for other crude oils in Europe and Africa.
buy–sell arrangements arrangements between domestic refinery owners for the purchase and sale of petroleum products.
city–country differential the difference between the average country retail price of petrol and the average city retail price of petrol.
commission agent an arrangement whereby an agent receives a commission for selling a product owned by another; in the downstream petroleum sector a commission agent often operates a retail site owned by a petrol refiner or wholesaler.
Consumer Consultative Committee established in 2001 by the ACCC to provide a forum for consumer representatives and the ACCC to discuss and collaboratively address consumer protection issues.
crude oil a naturally occurring flammable liquid found in rock and other geological formations, consisting of hydrocarbons and other organic compounds. Common crude oil benchmarks include Tapis (Malaysia), which Australia has traditionally used as its benchmark, West Texas Intermediate (US) and Brent (North Sea).
diesel (automotive distillate) fuel designed to run in diesel engines, widely used in the mining and transport sectors, as well as in some passenger motor vehicles.
distributor a transport company that picks up petroleum products from refineries, terminals and depots for delivery to retailers and end users.
Monitoring of the Australian petroleum industry 15

downstream the refining, importing, distribution and marketing of petroleum products.
Dubai crude a crude oil benchmark price used in New Zealand. A cheaper heavier crude oil sourced from the Middle East suited for the only refinery in New Zealand.
earnings before interest and tax (EBIT)
a measure of a company’s profits that excludes interest and tax expenses.
EBIT margin EBIT divided by sales revenue.
EBP (ethanol blended petrol) unleaded petrol that includes a proportion of ethanol (for instance, E10 is an unleaded petrol that includes up to 10 per cent ethanol).
Edmonton Par crude oil spot price a benchmark for the price of crude oil in Canada.
Euro-Super 95 a RON 95 grade of petrol largely sold throughout European countries.
exclusive dealing a type of conduct prohibited in certain circumstances by section 47 of the Competition and Consumer Act 2010 which broadly speaking involves one trader imposing restrictions on another’s freedom to choose with whom, or in what or where it deals.
five largest cities Sydney, Melbourne, Brisbane, Perth and Adelaide.
fixed costs costs that do not vary with output.
free on board (FOB) arrangement whereby the seller pays for transportation of goods to the port of shipment, plus loading costs, with the buyer responsible for the cost of marine freight transport, insurance, unloading and transportation from the arrival port to the final destination.
fuel automotive, aviation, marine and other transport fuels, and non-transport fuels such as butane and heating oil.
Monitoring of the Australian petroleum industry 16

Fuel Consultative Committee (FuelCC)Established in 2010 by the ACCC to provide a forum for the ACCC, the fuel industry and motoring organisations to discuss fuel related issues and to assist the ACCC in undertaking its role under the Act on issues related to competition and consumer protection in the fuel industry.
fuel quality premium additional price added to a price benchmark to reflect the higher quality of Australian-grade fuel relative to the Singapore benchmark price.
gantry a facility used to transfer fuel products from a refinery or terminal to trucks or rail tankers.
gas liquid petroleum gas or LPG, including automotive LPG.
gasoline crack the difference between the price of refined petrol and the price of a barrel of crude oil, adjusted for volume differences.
gross profit the difference between the revenue received from the sale of products and the cost of producing or purchasing them.
import parity pricing (IPP) the setting of prices of domestically refined petrol in the wholesale market at a price comparable to the cost of importing fuel into a given location in Australia.
import terminal a major terminal with a direct pipeline connection to a port—most fuel at import terminals is received via ship.
independent retailers retailers (owning single or multiple sites) other than supermarket retailers and refiner-marketers. Independent retailers can sell petrol under the brand name of one of the refiner-wholesalers or under their own brand name.
Informed Sources company that collects pricing information on various fuels and provides it to subscribers.
large independent chains companies—other than refiner-wholesalers and supermarket chains—that import, wholesale and/or retail fuel in Australia; these include Ausfuel, United, Neumann, Liberty, 7-Eleven and On The Run.
Monitoring of the Australian petroleum industry 17

light, sweet crude crude oil with low viscosity (light) and relatively low levels of sulphur (sweet). These oils are preferred by refiners because of their ease of handling and relatively high yields of high-value products such as petrol, diesel and jet fuel.
major terminal a fuel storage terminal connected to a port or a refinery by one or more pipelines. There are two broad types of major terminals—import terminals and refinery-pipeline terminals.
marginal cost the additional cost to produce one extra unit of output.
Mean of Platts Singapore (MOPS) the average of prices reported by Platts for Singapore traded commodities, for instance Tapis MOPS.
mogas motor gasoline (the commonly used international term for petrol). It is used in oil markets as the benchmark for unleaded petrol in the Asia-Pacific region, including Australia.
nameplate capacity the potential output of a refinery running at optimum utilisation.
New York Harbour conventional gasoline spot price
Platts established benchmark price for unleaded petrol in North America and Canada.
notification a process under the Competition and Consumer Act 2010 by which a person who engages in exclusive dealing conduct may obtain prior legal protection from the application of the Act for that conduct.
oil sands see tar sands
Oilcode a prescribed mandatory industry code of conduct under section 51AE of the Competition and Consumer Act 2010. It regulates the conduct of suppliers, distributors and retailers in the downstream petroleum industry.
other fuels includes kerosene, biodiesel, LPG, lead replacement and aviation fuels.
other oil-based products includes LPG, aviation fuels, industrial and marine fuels,
Monitoring of the Australian petroleum industry 18

heating oil, fuel oil, lubricant oils, greases, basestocks and bitumen.
petrol unleaded petrol—includes RULP (RON 91), PULP (RON 95 and above) and E10. The terms ‘unleaded petrol’ and ‘petrol’ are used interchangeably in this report.
petroleum products any oil-based products derived from crude oil, as it is processed in oil refineries.
Platts a provider of energy market information including price benchmarks for the oil, petrol and other energy markets.
Platts assessed price for MOPS the mean of the high and low components of a Platts assessment for oil cargoes loading from Singapore; a free onboard price for completed deals in a particular commodity, quoted in USD.
PULP premium unleaded petrol, such as RON 95 and above.
price support rebate provided to a petrol retailer to compensate for periods of price discounting.
RBOB Reformulated Gasoline Blendstocks for Oxygenate Blending
a wholesale price for a base gasoline in California designed to be blended with an oxygenate to comply with environmental regulations for finished reformulated gasoline.
refining the production of petroleum products from crude oil.
refiner margin the petroleum product revenues received by a company, less all costs for raw materials (crude oil, catalysts etc.), product input costs and processing costs per barrel of product sold.
refiner-marketer a company that refines, imports, wholesales and retails fuel. There are currently two refiner-marketers operating in Australia—BP and Caltex.
refiner-wholesaler a company that refines, imports and wholesales fuel; in Australia these are BP, Caltex, Mobil and Shell.
Monitoring of the Australian petroleum industry 19

refinery exchange arrangements between refiner-marketers before July 2002 for the swap of a volume of product in one location for an equivalent volume in another location where they did not operate a refinery.
refinery-pipeline terminal a major terminal with a direct or indirect pipeline connection to a refinery that supplies most of its fuel.
refinery products fuel and other oil-based products such as lubricants and bitumen.
regional centres and country towns around 180 regional centres and country towns which the ACCC monitors.
retail the sale of petroleum products to the public through retail sites.
retail margin the difference between the cost of acquiring a product from a wholesaler and the retail selling price of that product. Effectively the retailer’s gross margin.
return on assets figure calculated by dividing net profit by total assets, expressed as a percentage, which shows how effectively a company’s assets are being used to generate profit.
return on capital employed figure calculated by dividing net profit by the sum of total assets minus current liabilities and expressed as a percentage. This measure compares earnings with the capital invested in the company.
return on sales figure calculated by dividing net profit by total sales, expressed as a percentage, which shows how much profit is being produced per dollar of sales.
RULP regular unleaded petrol—RON 91; includes low-aromatic unleaded petrol.
RON research octane number, a measure of the efficiency of petrol at resisting engine knocking. In Australia, grades of petrol typically include RON 91 (regular) and RON 95 and
Monitoring of the Australian petroleum industry 20

higher (premium grades).
Rotterdam (ARA) Platts established benchmark price for unleaded petrol in Europe.
shopper docket an offer to consumers to supply petrol or diesel at a reduced price if the consumer has spent a certain amount in one purchase on grocery goods or has acquired certain identified goods from a nominated supermarket or retailer.
smaller capital cities Darwin, Hobart and Canberra.
supermarket retailer supermarkets that sell fuel under their own name/brand.
Tapis crude a light, sweet crude oil from Malaysia; it is used in oil markets as the benchmark for crude oil in the Asia-Pacific region, which includes Australia.
terminal a storage facility from which fuel is received via ship and/or refinery and distributed to retailers, distributors and end users.
tar sands naturally occurring bitumen soaked sands that can be refined to produce a range of liquid hydrocarbons.
terminal gate price (TGP) price for a spot purchase of petrol from a terminal; used as a benchmark price; the TGP is the price a purchaser expects to pay, usually in cash, when they arrive at a wholesaler’s terminal wanting to purchase a tanker load of 30 000 litres of petrol.
terminal throughput the annual volume received and then distributed by a refinery or terminal via truck or rail gantry.
terminal turnover the number of times a terminal is effectively filled and emptied during a year (that is, annual throughput divided by physical capacity).
third line forcing a form of exclusive dealing conduct prohibited by section 47 of the CCA. It involves either a supply of goods or services,
Monitoring of the Australian petroleum industry 21

or a supply at a particular price, on the condition that the purchaser acquires goods or services from a particular third party, or a refusal to supply goods or services to the purchaser because the purchaser will not agree to acquire the goods or services from the particular third party.
tight oil a term used to describe oil embedded in low-permeable sandstone, carbonate, and shale rock.
total supply sector the fuel industry sector that imports and exports petroleum products and purchases petroleum products from Australian refineries. This sector also imports crude oil for use by refineries.
unleaded petrol see ‘petrol’—the terms ‘unleaded petrol’ and ‘petrol’ are used interchangeably in this report.
vertical integration the undertaking by a single company of successive stages in the process of production and/or supply.
wholesale the sale and movement of petroleum products from a wholesaler to other wholesalers, to retailers or to end users such as transport, agricultural and mining companies.
West Texas Intermediate (WTI) a type of crude oil; also known as Texas Light Sweet. WTI crude is traded on the New York Mercantile Exchange. Prices have been affected by build up of excess supplies as a result of infrastructure bottlenecks at the land-locked trading hub of Cushing, Oklahoma. As a result the price of WTI is no longer a useful indicator of world demand and supply conditions for crude oil.
Worldscale a provider of shipping freight price and other freight market information. Freight rates are quoted by ship and port combination. The freight rate for a given ship and port combination reflects market demand and the availability of shipping.
Monitoring of the Australian petroleum industry 22

Summary
This is the fifth monitoring report into the prices, costs and profits of the Australian downstream petroleum industry since the ACCC was directed by the Minister to undertake monitoring in December 2007. This summary highlights the findings of the current report. Further in-depth analysis of each of the topics covered in this summary can be found in the relevant chapters of the report.
Australian retail petrol prices follow international benchmark prices and are influenced by the exchange rateIn previous monitoring reports, the ACCC noted that retail petrol prices were predominantly determined by the international price of refined petrol. During 2011−12, the international price of refined petrol continued to be the main determinant of Australian petrol prices.
Chart 1 displays the major downstream industry components of the average annual retail price of regular unleaded petrol (RULP) during 2011−12. The chart clearly shows the continued importance of the international price of refined petrol (Singapore Mogas 95 unleaded) in the determination of retail prices in Australia.
Chart 1 Total downstream components of the average annual retail RULP price of 142.8 cents per litre: five largest cities, 2011−12 (components are to scale)
Source: ACCC calculations based on Informed Sources, Platts and RBA data, and information provided by monitored companies
Note: Costs and margins for RULP include a net loss of 0.7 cpl across all sectors of the downstream petroleum industry. Costs and margins include components for the quality premium, freight, wharfage and other wholesale/retail costs and margins.
Monitoring of the Australian petroleum industry 23

Australian petrol prices are among the lowest in the OECDRetail petrol prices in Australia are still comparatively low when compared with similar countries such as those in the Organisation for Economic Co-operation and Development (OECD) (chart 2). In the June 2012 quarter, Australia had the fourth-lowest petrol prices in the OECD.
The main factor in lower petrol prices in Australia is the relatively low level of fuel taxation compared with other countries. When taxes are removed, Australian petrol prices are around the median of OECD countries.
Monitoring of the Australian petroleum industry 24

Chart 2 Petrol prices and taxes in OECD countries: Australian cents per litre, June quarter 2012
Source: Bureau of Resources and Energy Economics (BREE), Australian Petroleum Statistics; issue no. 194, September 2012
Notes: Care must be taken when making international comparisons as fuel quality standards (for example, octane rating and the content of MTBE and sulphur) for the most commonly used form of petrol in each market differ between countries.
Monitoring of the Australian petroleum industry 25

The role of the Singapore Mogas 95 Unleaded petrol benchmark price
In Australia, as in most developed countries, domestic petrol prices are based on international benchmark prices of refined petrol. Prices in different countries are based on different international benchmarks depending on their proximity to the world’s major trading regions. The relevant benchmark for Australian petrol prices is the price of Singapore Mogas 95 Unleaded (Mogas 95), which is the price of unleaded petrol with a Research Octane Number (RON) of 95 that is loaded free on board in Singapore.
As Singapore is the regional hub for the pricing and sale of a number of petroleum products, most local Australian petroleum companies use the benchmark price of Mogas 95 as the basis for calculating the price of unleaded petrol products in Australia.
Analysis of retail prices in the largest capital cities on a seven-day rolling average basis shows that over the past five years, retail prices followed closely movements in the price of Mogas 95.2 The analysis shows that movements in Australian retail prices are driven by international pricing movements.
Chart 3 shows daily average retail prices over the period since July 2007 compared with the Mogas 95 benchmark.
Chart 3 Daily retail RULP prices, adjusted retail RULP prices and Mogas 95 prices:1 July 2007 to 30 September 2012
Source: ACCC calculations based on Informed Sources, Platts and RBA data
Note: The chart uses seven day rolling average retail prices in the five largest cities. The Mogas 95 benchmark has been lagged 10 days. The chart also shows adjusted retail prices where excise and GST have been removed.
Although international refined petrol benchmark prices are usually the most important influence on
2 A seven-day rolling average price is the average of the current day’s price and the prices on the six previous days. In the case of retail prices it is the average of calendar days but in the case of Mogas 95 it is the average of working days (i.e. Monday to Friday). The refiner-wholesalers use a rolling average for Mogas 95 prices when determining their wholesale prices.
Monitoring of the Australian petroleum industry 26
domestic petrol prices, other influences can also be significant. Factors such as the level of competition at the wholesale and retail levels, the amount of excise applied to petrol products, freight and quality premium costs and even petrol price cycles in some cities have a significant influence on retail prices.
Refined petrol and crude oil prices
While Australian petrol prices are linked to the price of Mogas 95, the latter is linked to world crude oil prices. The prices of crude oil and refined petrol are closely linked by virtue of the fact that in a typical refinery operation, the cost of crude oil inputs can be expected to contribute around 85 to 90 per cent of total costs.
In South East Asia, a common crude oil marker used for pricing purposes is Tapis, a Malaysian light sweet crude oil. Over the past few years, the Brent crude oil marker has also progressively become a popular benchmark. The close link between the prices of the Brent and Tapis crude oil markers and Mogas 95 is shown in chart 4.
There are times when the prices of Mogas 95 and crude oil markers can move independently from each other depending on factors that may impact on global crude oil supply and demand and the state of the regional refining industry. However, on average, there is a very close relationship between the prices of Mogas 95 and crude oil markers.
Chart 4 Weekly average prices of Mogas 95 and Brent and Tapis crude oil: 1 July 1993 to 30 June 2012
Source: ACCC calculations based on Platts data
It comes as no surprise that, given the nexus between crude oil and refined petrol prices, the surge in crude oil prices has been the principal reason for higher petrol (and diesel) prices, not just in 2011−12, but over most of the previous decade.
Monitoring of the Australian petroleum industry 27

Crude oil prices during 2011−12
The price of a barrel of crude oil in the short term is affected by a number of factors including concerns over short-term economic growth, geo-political tensions and commodity speculation. In the longer term, the price of crude oil is influenced by international demand and supply.
In 2011−12 crude oil prices were relatively high and experienced distinct periods of variability. Crude oil prices during 2011−12 can be considered in terms of three phases:
1. During the second half of 2011, from July to November, daily Brent crude oil prices were volatile, ranging from a high of around USD 118 per barrel in early July to a low of around USD 101 per barrel in October. The main factors affecting crude oil prices included:
uncertainty regarding the future of Greece and the eurozone
concerns with the health of the US and emerging Asian economies.
2. The second phase was roughly from December 2011 to April 2012 when crude oil prices increased significantly. Daily Brent crude prices ranged from around USD 104 per barrel in December 2011 to a high of around USD 127 per barrel in February. Reasons for this increase included:
easing of concerns about a possible US recession
increased oil demand due to a cold northern winter in Europe
supply worries due to the impending trade sanctions on Iran.
3. The third phase was from May 2012 to the end of June 2012 when daily Brent crude oil prices decreased substantially to a low of around USD 89 per barrel in mid June 2012. Reasons for the decrease included:
ample global supplies
the large build up of inventories in the United States with near record refinery utilisation rates
the slowing of the Chinese and Indian economies.
4. More recently, between July and September 2012, daily Brent crude prices increased to around USD 118 per barrel. This increase was influenced by:
supply disruptions in the North Sea
ongoing instability in the Middle East (particularly in Syria) heightening concern over potential disruptions to supply, and
monetary easing measures announced in the US in mid-September.
International prices high despite weak global economic conditions
Despite a generally weak global economy, and lower crude oil prices in mid-2012, average prices for the financial year 2011−12 have remained at historically high levels. Indeed, average annual prices during 2011−12 were the highest on record and have followed a strongly upwards trend, evident since 1998−99. This trend can be seen in chart 5 which presents the average of price of Brent crude oil since 1990−91.
Monitoring of the Australian petroleum industry 28

Chart 5 Average annual price of Brent crude oil: 1990−91 to 2011−12
Source: ACCC calculations based on Platts data
While the development of unconventional crude oil deposits such as tar sands and shale/tight reserves3 may help global markets avoid future short term scarcity, they are unlikely to be so abundant and cheap to extract as to put substantial downward pressure on prices in the long term. Indeed, many future developments of unconventional deposits rely on relatively high crude oil prices to be economically viable.
As noted, crude oil prices peaked in April 2012 and then declined slightly over the course of 2011−12. Further price falls may be possible in the short term if the present uncertain global economic conditions continue. However, in the medium to long term, the price of crude oil is likely to continue to rise.
While in the short term, prices can be expected to continue to be volatile, in the absence of significant and unforseen economic circumstances, it is unlikely that prices such as USD 20 to USD 30 per barrel that existed prior to the last decade will be seen again.
Crude oil benchmarks
Both Tapis and Brent are common crude oil markers used in the Asia-Pacific region. Tapis has been the traditional crude oil marker for South-East Asia and the broader region. However, declining production of Tapis in recent years has seen the emergence of Brent as a key marker for pricing of crude oil cargoes in the region.
In theory, crude oil markers such as Tapis and Brent are to some degree, interchangeable commodities in the global market and in the medium to longer term their prices should vary little from each other, other than for quality differences.
3 Tight oil refers to liquid oil embedded in low-permeable sandstone, carbonate, and shale rock (US Energy Information Administration, Annual Energy Outlook 2012, p. 95).
Monitoring of the Australian petroleum industry 29

Chart 6 presents price data for these two main crude oil markers over the past 30 years. The chart highlights two fundamental themes: one being the increase in the benchmark prices after 2000 with substantial rises over average prices for the previous decades; and the other showing how movements in the prices of the two crude oil markers appear closely correlated.
Chart 6 Average annual benchmark prices of Brent and Tapis crude oil: 1980 to 2012
Source: Crude price data from BP Statistical review of world energy 2012
The ACCC continues to be concerned about references in the Australian media to West Texas Intermediate (WTI) when reporting crude oil price movements. The more appropriate crude oil markers for Australia are either Brent or Tapis crude oil.
For some time now, WTI prices have been distorted by the build-up of excess supplies as a result of infrastructure bottlenecks at the land-locked trading hub for WTI at Cushing, Oklahoma. Consequently, the price of WTI is no longer representative of broader global demand and supply conditions and cannot be considered a relevant crude oil marker for countries in the Asia-Pacific region.
Effect of the AUD–USD exchange rate on petrol pricesDuring 2011−12, the strength of the Australian dollar somewhat protected motorists from higher retail petrol prices than they otherwise may have faced. Since the highs of July 2011, the AUD–USD exchange rate has declined marginally, although it is still above recent long term averages.
Unlike in 2010−11, the exchange rate remained comparatively stable during 2011−12. Chart 7 highlights the effect of the AUD–USD exchange rate on retail petrol prices. The chart shows seven-day rolling average retail prices for the five largest cities from July 2007 to September 2012. The upper line represents what retail prices would have been if the AUD–USD exchange rate had been held constant at the lowest daily exchange rate over the period (that is, around USD 0.61 in October 2008), everything else being equal. The lower line represents what retail prices would have been if the AUD−USD
Monitoring of the Australian petroleum industry 30

exchange rate had been held constant at the highest exchange rate over the period (that is, around USD 1.11 in July 2011), everything else being equal. In between these is the actual price.
The chart shows that in 2011−12:
retail prices were at their highest in April 2012 at around 153 cpl. The AUD–USD exchange rate was around USD 1.03 at this time. If the exchange rate had been at its minimum level at this time, retail prices would have been around 215 cpl (or 62 cpl higher)
retail prices were at their lowest in June 2012 at around 131 cpl. The AUD–USD exchange rate was around USD 1.01 at this time. If the exchange rate had been at its maximum level at this time, retail prices would have been around 124 cpl (or 7 cpl lower)
a strong AUD–USD exchange rate throughout most of 2011−12 protected consumers to a substantial degree from very high international refined petrol prices.
Chart 7 Seven-day rolling average retail RULP prices in the five largest cities—based on actual, minimum and maximum AUD–USD exchange rates: 1 July 2007 to 30 September 2012
Source: ACCC calculations based on Informed Sources, Platts and RBA data
Petrol price cyclesRetail petrol price cycles continue to be a source of frustration to many motorists.4 However, some consumers seem to take advantage of the low point in the price cycle to purchase petrol at relatively low prices.
4 A petrol price cycle is a movement in price from a trough to a peak to a subsequent trough. See chart 10.1 in chapter 10. The ACCC defines a price cycle as having occurred when the increase in price from the trough to the peak is 3 per cent or more of that trough price, and the decrease in price to the subsequent trough is also 3 per cent or more of the initial trough price. A price cycle increase is the increase in price from the initial trough to the peak. Petrol price cycles are discussed in more detail in chapter 10.
Monitoring of the Australian petroleum industry 31

Petrol price cycles have been observed in a number of Australian retail petrol markets for many years. In the larger capital cities, retail petrol prices move in regular cyclical patterns, which are not reflective of movements in underlying costs, wholesale prices or international benchmark prices.
The typical pattern of the petrol price cycle in recent years has been one where prices rise quickly at the outset (over one to three days) and then steadily decline over the rest of the cycle (between six and nine days); that is, they move in a ‘sawtooth’ pattern.
The duration of price cycles in the eastern capital cities has been increasing over the last few years. In 2009 the average duration of price cycles was around seven days whereas by the end of the September 2012 quarter it had increased to over 12 days. In addition, the lowest price day in these cities has moved from Wednesdays in 2009 to other days in the week. Previously consumers could use the regularity of the price cycle to predict low-price days and purchase petrol at relatively low cost. Predicting troughs in the price cycle has become increasingly difficult. This may hinder consumers’ ability to take advantage of low-price days.
In contrast, Perth has had more predictable petrol price cycles with the duration of price cycles consistently being seven days in recent years. Unlike other states, Western Australia has fuel price regulations under which retail sites must keep their prices constant for a 24-hour period and the price at each retail site is publicly available on the FuelWatch website.
Chart 8 shows daily average petrol prices over a seven-week period during May and June 2012 and indicates the price cycles that occurred during this period.
Chart 8 Daily average RULP prices in the five largest cities: 13 May 2012 to 30 June 2012
Source: ACCC based on Informed Sources data
Although not as pronounced as in previous years, the regular pattern of these cycles is clearly evident in chart 8. Also clearly evident are the failed price cycles in Melbourne (which have also occurred a
Monitoring of the Australian petroleum industry 32

number of times in other capital cities in recent years).5
The regularity of price cycles and the ability to source real-time pricing data from competitors has enabled the refiner-marketers and other major retailers to understand and predict their competitors’ likely response to changes in their own behaviour.6
Analysis has shown that the two refiner-marketers, that is, those integrated refiners with a presence in the retail sector, Caltex or BP have generally led the price cycle up by raising prices at several retail sites in a city by a significant amount and then waited for the market to respond. If the other major retailers respond to this move with a similar increase (which is generally the case) then the price cycle is continued. In some cases where competitors do not respond or delay in responding, the price cycle breaks down and prices can remain low for an entire week or more. The number of price cycles across the five largest cities in 2011−12 has decreased compared with 2010−11.
While they generally do not initiate the discount phase, Woolworths and a number of the independent retailers have been active in this phase of the price cycle.
Retail pricing in the petrol industryRetail petrol price cycles in Australia are not driven by movements in underlying costs or wholesale prices. Rather, retail price cycles appear to be entirely due to the pricing policies employed by the local petrol retailers. The ACCC observed in its 2007 inquiry report that petrol price cycles do occur in some other countries but those in Australia tend to be larger in amplitude and more consistent. Data is presented in this report on price cycles in certain cities in the US and Canada. Analysis of this data suggests that price cycle increases in Australia are larger than in these cities in the US and Canada.
Information sharing arrangements in the petrol industryThe ACCC has been concerned for some time about the presence of price information sharing arrangements in relation to the retail petrol sector and their potential impact on competition. The petrol price sharing arrangements allow for the private and very frequent exchange of comprehensive retail price information between the major petrol companies. The ACCC has been concerned that this allows petrol retailers to quickly signal price moves, monitor competitors’ responses and react to them.
The ACCC is concerned that such arrangements may lessen price competition in petrol retailing to the detriment of consumers.
The ACCC has acted on these concerns and announced in May 2012 that it has commenced an investigation into the competition effects of price information sharing arrangements in relation to the retail petrol sector.
5 A failed petrol price cycle occurs when there is a small (or no) increase in price, at a time when an increase might have been expected, and the magnitude of the price increase (if any) does not meet the 3 per cent definition of a price cycle (noted in the previous footnote).
6 ‘Refiner-marketers’ is the traditional term referring to the four integrated fuel companies (BP, Shell, Caltex and Mobil) which used to refine, wholesale and retail fuel in the Australian market. While BP and Caltex continue to directly retail fuel, Mobil and Shell, while still marketing proprietary fuels, have effectively withdrawn from direct retailing. Given its historical use, the term refiner-marketer is used throughout this report to refer to the two companies that are still integrated from refining to retailing, BP and Caltex. The other two companies, Mobil and Shell are in involved refining and wholesaling. As these four companies account for all of refining output and the vast majority of wholesale sales, as a group they are referred in this report as ‘refiner-wholesalers’.
Monitoring of the Australian petroleum industry 33

The ACCC has not reached a final view on the possible effects of information sharing arrangements in the petrol industry and its investigation is continuing.
Shopper docket discounting schemesShopper docket discounting schemes generally offer discounts on fuel purchases based on purchases at an attached convenience store or from an associated or third-party business. Sales of petrol involving a shopper docket can account for a significant proportion of a petrol retailer’s total fuel sales.7
Shopper docket discounting schemes involving petrol have been operated by the two major Australian supermarket retailers, Coles and Woolworths, for a number of years. Discounts of 4 cpl are offered on petrol purchases when a minimum amount is spent on purchases at their supermarkets, typically $30. At various times over the past 12 months, the supermarkets have had discount offers greater than 4 cpl.
In the past, other retailers such as BP, Caltex, United and other independent retailers have also conducted shopper docket discounting schemes. Some of these schemes have been linked to purchases at a local independent supermarket while others combine purchases from their convenience store with offers of fuel discounts.
While the ACCC supports initiatives that aim to provide benefits to consumers, it is necessary to assess such schemes to consider their long term effect on competition and prices. Consequently, in 2012 the ACCC commenced an investigation into the effects of shopper docket discounting schemes on competition and long term consumer welfare. The ACCC is investigating the effects of the size (value), frequency and duration of the discounts offered at retail outlets.
The ACCC has not reached a final view on the possible effects of shopper docket discount schemes and its investigation is continuing.
Retail prices over 2011−12In 2011−12 retail petrol prices across the five largest cities were higher, but less volatile, than in 2010−11.
Average annual prices in 2011−12 were around 143 cpl, which was around 11 cpl higher than in 2010−11. Moreover, during 2011−12, retail petrol prices were at their highest levels since October 2008.
Chart 9 shows daily average retail prices, as well as seven-day rolling average prices, across the five largest cities over the period 1 July 2011 to 30 September 2012. The regular price cycle is clearly evident.
7 The ACCC’s 2007 inquiry into the price of unleaded petrol reported that around 60 per cent of fuel sold at Woolworths’ service stations involved a shopper docket.ACCC (2007), Petrol prices and Australian consumers: Report of the ACCC inquiry into the price of unleaded petrol, December, p. 181http://www.accc.gov.au/content/index.phtml/itemId/790921
Monitoring of the Australian petroleum industry 34

Chart 9 Daily average retail RULP prices and seven-day rolling average retail prices, five largest cities: 1 July 2011 to 30 September 2012
Source: ACCC calculations based on Informed Sources data
Prices varied from a low of around 128 cpl in July 2012 to a high of around 153 cpl in April 2012—a range of 25 cpl. In 2010−11 the range between the highest and lowest prices was 31 cpl.
Retail prices in regional locations
Retail prices in regional locations are largely driven by international benchmark prices and the AUD−USD exchange rate, just as they are in the larger capital cities. However, prices in regional locations in Australia tend to be higher than in capital cities. The ACCC is aware of, and sensitive to, the concerns of motorists in regional locations about the relatively higher prices of petrol in some regional locations.
Prices in regional locations are generally higher than in the capital cities for a number of reasons, including:
lower number of retail sites and therefore a lower level of local competition
lower volumes of fuel sold
distance/location factors
lower convenience store sales.
These factors also explain differences in petrol prices between regional locations. Price movements in regional locations tend to lag those in the five largest cities. Prices also tend to be more stable in regional locations than in the five largest cities. Only a very small number of regional locations have regular price cycles. These tend to be the larger population centres or locations very close to them.
Chart 10 shows daily average retail prices across all of the regional locations in Australia monitored by the ACCC and daily average retail prices in the five largest cities over the period 1 July 2011 to
Monitoring of the Australian petroleum industry 35

30 September 2012.8 It can be seen that:
prices in regional locations in aggregate broadly follow prices in the five largest cities
regional locations in aggregate do not have retail price cycles that are evident in the five largest cities
the difference between prices in the largest cities and in regional locations tends to widen when prices change rapidly, such as occurred in May and June 2012.
Chart 10 Daily average retail RULP prices in the five largest cities and the regional locations in aggregate: 1 July 2011 to 30 September 2012
Source: ACCC calculations based on Informed Sources data
ProfitsAs part of the analysis of the downstream petroleum industry, the ACCC collects extensive financial data by sector from the four refiner-wholesalers and major independent wholesalers and retailers.
Financial data for the period from 2002−03 to 2011−12 was analysed and used to produce estimates on the profitability of the total downstream industry and for each sector, including total supply (which includes the refining sub-sector along with imports and buy sell transactions), wholesale and retail. The ACCC produces estimates of revenues, costs and profits for all products and also for petrol products alone (that is, regular unleaded, premium unleaded and ethanol blended petrol), on a consolidated basis for the entire downstream industry and for each sector.
During 2011−12, total consolidated profits earned by monitored companies across all products in all sectors were $408 million, compared with $2.2 billion net profit for 2010−11.9 The total supply sector
8 The specific regional locations monitored by the ACCC in each state and the Northern Territory are listed in appendix F. It also provides average annual prices for RULP, diesel and LPG in 2011−12 for each regional location.
9 Note that these profits have been reported on a historical cost basis.
Monitoring of the Australian petroleum industry 36

recorded a loss of $1116 million (including losses of around $600 million from domestic refining). The wholesale and retail sectors earned net profits of around $1084 million and $400 million respectively.
On a cents per litre basis, the refinery and total supply sectors recorded losses of 1.6 cpl and 1.54 cpl, while the wholesale and retail sectors made net profits of 2.07 cpl and 2.44 cpl respectively.10
The lower profits during 2011−12 partly reflect weaker results in the refinery sector. However, the other key sectors including wholesale and retail continued the trend of improved profits. Average annual total profits accruing to shareholders in the industry over the last 10 years have been around $1.45 billion per annum (see chart 11).
Chart 11 Total downstream net profit (adjusted EBIT), all products: 2002−03 to 2011−12
Source: ACCC analysis based on data obtained from firms monitored through the ACCC’s monitoring process
Downstream profits on petrol products are a small proportion of retail prices
The ACCC has estimated profitability per litre of petrol products (that is, regular unleaded, premium unleaded and ethanol blended petrol) sold in the entire downstream industry—this is a measure of the difference between the average revenue per litre of petrol sold and the average cost for the entire industry to purchase crude oil and process and market/sell refined petrol.
The ACCC has found that only a small proportion of the final petrol bowser price has been retained as profits by the entire downstream petroleum industry.
During 2011−12, petrol products recorded a unit net loss of 0.03 cents on each litre sold compared with a unit net profit of 2.17 cpl in 2010−11 as shown in chart 12. Over the past 10 years unit net profits earned by petrol companies from the sale of a litre of petrol averaged around 1.43 cpl for the entire downstream petroleum industry.
10 Sector by sector profits may not equate to consolidated profits as they reflect the performance of each sector acts as a stand-alone enterprise. In practice, some companies are integrated across sectors and transact internally between sectors. Consolidated profits take into account these transactions.
Monitoring of the Australian petroleum industry 37

Chart 12 Total downstream unit net profit, petrol products (RULP, PULP and EBP) (cents per litre): 2002−03 to 2011−12
Source: ACCC analysis based on data obtained from firms monitored through the ACCC’s monitoring process
Australian refinery sector profits
The Australian petroleum refinery sector has in general, recorded comparatively low net profits and rates of return, particularly since the global financial crisis (GFC).
The refinery sector incurred losses of around $600 million during 2011−12 compared with a net profit of $348 million in 2010−11. Chart 13 shows net profit in the refinery sector since 2002−03.
The financial performance of the refinery sector in 2011−12 was adversely affected by higher costs, reflecting an increase in operating and conversion costs, the effects of unplanned refinery shutdowns, losses on the values of inventory holdings and foreign exchange transactions. If the recent refinery write downs in refinery asset values were included in profit calculations, the refining sector would have shown a loss for the year of $2.8 billion.
Chart 13 highlights two distinct phases of financial performance of the refinery sector over the past 10 years. This sector experienced higher profits in the years prior to the GFC (2002−03 to 2007−08) than in the aftermath of the GFC. Annual net profits pre-GFC averaged around $1120 million compared to the average annual post-GFC loss of $156 million. The recent write down of the value of the Caltex and Shell refinery assets (and the closure of the Shell Clyde refinery, and the announced closure of the Kurnell refinery in Sydney) are evidence of an industry that is facing an uncertain future with relatively low profits and fierce international competition from more modern refineries in the Asia-Pacific region for fuel refined to Australian standards.
Monitoring of the Australian petroleum industry 38

Chart 13 Refinery sector net profit, all products: 2002−03 to 2011−12
Source: ACCC calculations based on data obtained from firms monitored through the ACCC’s monitoring process
Costs
Nominal components of cost
Although petrol retailers have some discretion in determining their prices, the largest components of the pump price, the international price of refined petrol and taxes (excise and GST), are outside the control of local retailers and other petrol companies.
The two largest components of petrol, diesel and LPG prices are:
the respective international benchmark prices for refined petrol, diesel and LPG
GST and excise (for petrol and diesel—there is currently minimal excise imposed on LPG).
In 2011−12, international benchmark prices and taxes accounted for around 88 per cent of the average annual retail price of petrol. That is, of an annual average retail price of 142.8 cpl, 126.0 cpl is directly attributable to the cost of refined petrol and taxes (see chart 14).
For diesel, these two components also accounted for 88 per cent of the bowser price in 2011−12 (see chart 15).
For LPG, the international benchmark price and GST accounted for 79 per cent, in part reflecting the lower level of excise on LPG (see chart 16).
Other costs and margins therefore accounted for around 17 cpl of the retail price of petrol, 18 cpl for diesel and 15 cpl for LPG. This amount covers a number of costs including transport and freight, salaries, repair and maintenance, storage and terminal costs, across all sectors of the downstream petroleum industry.
Monitoring of the Australian petroleum industry 39
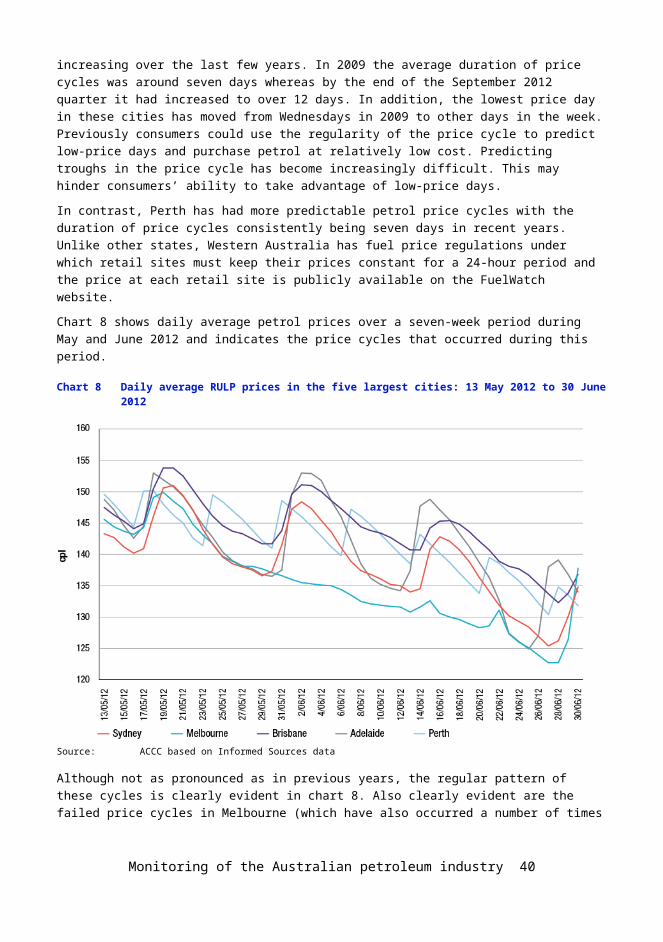
Chart 14 Nominal components of Australian retail RULP prices in the five largest cities: 2011−12
Source: ACCC calculations based on Informed Sources, Platts and RBA data
Chart 15 Nominal components of Australian retail diesel prices in the five largest cities: 2011−12
Source: ACCC calculations based on Informed Sources, Platts and RBA data
Monitoring of the Australian petroleum industry 40

Chart 16 Nominal components of Australian retail LPG prices in the five largest cities: 2011−12
Source: ACCC calculations based on Informed Sources, LPG Australia and RBA data
Components of the pump priceChart 17 shows a more detailed breakdown of the components of the annual average retail price of RULP across the five largest cities from 2007−08 to 2011−12.
Each bar represents the annual average retail price disaggregated into the following:
Tapis crude oil—the benchmark for crude oil in the Asia-Pacific region (including Australia)
excise (which is set at a constant 38.14 cpl) and GST
gasoline crack—the difference between the price of Mogas 95 and Tapis crude oil
wholesale costs and margins (excluding excise and GST)11
retail costs and margins (excluding GST).
11 Note that prior to July 2009, the Queensland Government provided a subsidy at the retail level of 8.4 cpl (around 9.2 cpl when GST is included). Therefore, terminal gate prices prior to July 2009 in Brisbane have been reduced by 9.2 cpl to put the wholesale and retail prices on a consistent basis.
Monitoring of the Australian petroleum industry 41

Chart 17 Components of annual average retail RULP prices in the five largest cities: 2007−08 to 2011−12
Source: ACCC calculations based on Informed Sources, Platts, RBA and WA FuelWatch data, and information provided by monitored companies
Chart 17 shows that changes in the international price of crude oil have been overwhelmingly responsible for movements in average retail petrol prices over the last five years. The components attributable to excise and GST and to the local petrol companies have been relatively stable over the period.
The price of crude oil is one of the main factors driving international refined petrol prices. Because costs associated with the exploration and development of crude oil deposits are largely fixed in the short term, it is the owners of crude oil that accrue the greatest benefits as international prices rise over time.
Between 2008−09 (when international prices began to rise in the aftermath of the GFC) and 2011−12, the average annual pump price of RULP increased by around 15.7 cpl. Most of this increase, 11.8 cpl, has flowed back to the suppliers (owners and extractors) of crude oil. By contrast, the amount flowing back to the domestic petrol companies over the same period increased by about 2.5 cpl, to cover increased operating costs in refining and in the wholesale and retail sectors. Taxes accounted for 1.4 cpl of the increase in average annual prices since 2008−09.
Conclusion: prices, costs and profits Movements in the international price of crude oil have driven movements in regional refined
petrol prices (as reflected in the benchmark price of Mogas 95) which in turn have driven movements in Australian retail petrol prices.
In any particular week, retail price cycles in the largest capital cities may cause divergences from the benchmark prices, depending on the phase of the price cycle.
Total net profits for the entire downstream petroleum industry in 2011−12 were significantly down on the previous year.
Most of the benefits from higher fuel prices in recent years have been captured by the
Monitoring of the Australian petroleum industry 42

owners and producers of crude oil.
Recent developments in the fuel industry
Ethanol blended petrol
Ethanol is added to petrol to produce various grades of ethanol blended petrol (EBP). The most common EBP is E10, which is RULP containing up to 10 per cent ethanol.
Total sales of EBP in Australia decreased in 2011−12, reversing the trend of previous years. Sales remained broadly stable in NSW but decreased significantly in Queensland and Victoria. Similarly the number of retail sites selling E10 across Australia decreased in 2011−12. The largest volume of EBP is sold in NSW, which accounts for over 80 per cent of the Australian EBP market.
Chart 18 shows EBP sales as a proportion of total petrol sales in the major states and Australia as a whole during the period 2005−06 to 2011−12. It shows that in 2011−12:
in NSW there was a marginal increase (by 1 percentage point to 36 per cent) in the share of EBP of total petrol sales
in Queensland there was a significant decrease (by 8 percentage points to 11 per cent)
in Victoria there was a decrease (by 2 percentage points to 1 per cent)
across Australia as a whole there was a decrease (by 2 percentage points to 14 per cent).
Chart 18 Ethanol blended petrol sales as a proportion of total petrol sales in the major states and Australia: 2005−06 to 2011−12
Source: ACCC calculations based on the Department of Resources, Energy and Tourism (RET) and BREE, Australian Petroleum Statistics, various issues
Across all locations monitored by the ACCC in 2011−12, average RULP prices were higher than average E10 prices by around 1.8 cpl. In previous years the ACCC has expressed concern about the supply of ethanol. However, in 2011−12 there appeared to be sufficient supply to meet demand.
Monitoring of the Australian petroleum industry 43

There is no Australian Government mandate covering the supply of EBP in Australia. NSW is the only state government to introduce a mandate on the supply of EBP.
The NSW ethanol mandate was introduced in 2007 and required that, from 1 October 2007, 2 per cent of the total volume of petrol sold in NSW be ethanol. On 1 January 2010 the mandated level increased to 4 per cent and on 1 October 2011 it increased to 6 per cent. The final phase of the NSW mandate (i.e. requiring all RULP to be replaced with E10) was set to be introduced on 1 July 2012. However, on 31 January 2012 the NSW Government announced that it would introduce legislation to remove this requirement and that the ethanol mandate would remain at 6 per cent of total fuel sales. Legislation to this effect was passed by the NSW Parliament in May 2012.
The operation of the NSW ethanol mandate has had some significant impact on consumers:
The mandate has reduced the availability of RULP from many retail sites but consumers have been able to source RULP from the retail sites excluded from the requirements of the legislation (retail sites are excluded if they are part of an operation of 20 or fewer sites). These retail sites comprise around 25 per cent of retail sites in NSW.12
The 2011 ACCC petrol monitoring report noted that some motorists who cannot use E10 may be forced to use PULP. The amendment to the NSW legislation means that motorists who cannot use E10 in their vehicles will now not be forced to switch to PULP.
While the review by the NSW Independent Pricing and Regulatory Tribunal into ethanol supply and demand in NSW found that supply is likely to be sufficient to meet demand, it noted that as there are only three ethanol suppliers in Australia (and one supplier provides two-thirds of total supply), supply may be unreliable if one of the suppliers is unable to produce.
In the past, the ACCC has acknowledged industry concerns about the potential impact of the ethanol mandate on supply and prices. The ACCC intends to continue to closely monitor the market for EBP in the coming year.
Refining
The structure of the domestic market continues to evolve broadly in line with international trends. Integrated refiner-marketer oil companies continue to move away from lower margin downstream activities to concentrate on oil exploration and extraction.
This year saw a number of important developments in the Australian refining industry. Generally the Australian petroleum refining industry seems to be facing a challenging future as some refiner-wholesalers reassess their refinery operations.
Prior to the GFC the refining sector in Australia was characterised by larger volume production and higher profits and rates of return than have been seen in the post-GFC period. Conditions in the pre-GFC period were characterised by:
buoyant economic conditions and growth
Australian fuel market being short (or shorter) on product due to the cessation of refining operations at Mobil’s Port Stanvac refinery in 2003
difficulty in sourcing Australian standard product for importing, particularly in the Asia-Pacific
12 Independent Pricing and Regulatory Tribunal (2012), Ethanol supply and demand in NSW—Other Industries—Final Report, March 2012, p. 4.
Monitoring of the Australian petroleum industry 44

region
limited access by independent importers to import terminals.
In contrast, the post-GFC period for Australian refining is characterised by comparatively smaller production volumes and lower profits and rates of return. The reasons for this include:
weaker economic conditions and flat growth
the impact of large complex refineries in emerging economies, such as Jamnagar in India, with the capacity to refine petrol to Australian standards at competitive prices. Further planned openings of refineries in China and Saudi Arabia are likely to add to the availability of Australian standard petrol
the ability of independent wholesalers to access storage capacity in import terminals and to import refined fuel at competitive prices.
In early 2012, there were seven refineries operating in Australia. By mid-2014 Australia will have five refineries in operation. Shell brought forward the closure of its Clyde refinery by nine months and closed the refinery in October 2012. Shell will convert the refinery, along with the Gore Bay terminal into an import facility. Shell has stated that the Clyde refinery was no longer regionally competitive against Asian mega-refineries.13 Recent media reports suggest that Shell is also considering the future of its Geelong refinery.14
The Caltex review of its refinery operations saw the announcement in July that in 2014 its Sydney refinery at Kurnell will be closed permanently and turned into an import terminal. Caltex will be left operating only one refinery located in Brisbane. The announcement means that Sydney will have no refineries and all petroleum products will have to be sourced internationally or from refineries located in other states.15
Evidence from Australia and overseas suggests that the Australian refinery sector may be facing a challenging future. The US Energy Information Administration noted, as refineries around the world become larger and more complex, small and older refineries (such as those still operating in Australia) will find it increasingly difficult to remain viable.16
As petrol prices are set on the basis of import parity, Australian refiners have little scope to increase prices to cover domestic costs that may be out of line with international best practices. Being older and smaller than newly constructed refineries in the Asia-Pacific region, Australian refineries will continue to face a tough competitive climate in the foreseeable future.
Increase in independent imports
Imports by independent wholesalers continued to increase in 2011−12. However, due to increased import activity by the refiner-wholesalers, independent imports accounted for a slightly smaller share of
13 Shell Media Release (2011), ‘Shell to cease refining at Clyde’, 27 Julyhttp://www.shell.com.au/home/content/aus/aboutshell/media_centre/news_and_media_releases/archive/2011/clyde_cease_refining_27072011.htmlhttp://www.caltex.com.au/Media%20Items/ASX%20-%20Caltex%20Announces%20Supply%20Chain%20Restructure.pdf.
14 See Australian Financial Review: Shell’s Geelong refinery in doubt, 18 September 2012, p 19; and Competitiveness Key: Baillien, 19 September 2012, p. 4.
15 Caltex Media Release (2012), ‘Caltex announces supply side restructuring’, 26 Julyhttp://www.caltex.com.au/Media%20Items/ASX%20-%20Caltex%20Announces%20Supply%20Chain%20Restructure.pdf.
16 US Energy Information Administration, (2012), Annual Energy Outlook, p. 44.
Monitoring of the Australian petroleum industry 45

total imports in 2011−12 compared with 2010−11. In 2011−12 independent imports accounted for about 30 per cent of total imports, compared with over 40 per cent in 2010−11. Independent imports have increased more than four-fold since 2007−08 when they represented less than 5 per cent of total imports.
While still relatively small, independent imports continue to provide an increasingly strong source of competitive discipline on the larger players.
One of the key factors driving the growth in independent imports has been greater access to import terminals. There has been a significant increase in the number, capacity and accessibility of independently-owned import terminals. The bulk of new investment in import terminals in the last few years has been undertaken by independent terminal owners. Reflecting this trend, refiner-wholesalers as well as smaller wholesalers/importers are increasing their use of independently-owned terminals.
In the past five years, at least four independent wholesalers have imported refined petrol from various overseas markets. Currently, three of the monitored companies—Ausfuel, United and Neumann—own, or have access to, import infrastructure.
Retail
While the retail sector was relatively stable during 2011−12 compared with previous years, some rationalisation of sites occurred. Ausfuel acquired retail sites in Queensland while 7-Eleven continued the conversion of ex-Mobil retail sites to 7-Eleven branding and convenience facilities.
Table 1 displays the current share of retail volume between the refiner-marketers, supermarkets and independent retail chains.
Table 1 Share of volume of retail petrol sales by brand: 2002−03 to 2011−12
BP
%
Caltex
%
Mobil
%
Shell
%
Coles Express/Shell(co-branded)%
Woolworths/ Caltex(co-branded)%
Independent retail chains
%
2002−03 20 24 19 20 – 10 6
2003−04 20 22 17 3 16 14 7
2004−05 18 18 12 3 25 18 6
2005−06 19 16 11 3 25 20 6
2006−07 19 16 11 3 22 22 7
2007−08 20 17 11 2 20 22 8
2008−09 19 16 10 2 22 23 9
2009−10 17 16 10 2 22 23 10
2010−11 19 18 – 2 22 23 17
2011−12 16 18 – 2 23 24 17
Source: ACCC analysis and estimates based on data obtained from firms monitored through the ACCC’s monitoring process.
Monitoring of the Australian petroleum industry 46

Notes: Data is only for monitored companies, so does not include the total volume of retail sales in Australia.
Independent retail chains are: 7-Eleven, On The Run, and the retail operations of Neumann, United and Ausfuel. In 2002−03 Woolworths was not co-branded with Caltex. Totals may not add to 100 per cent due to rounding.
The significant increase in independent retailers’ share of retail sales in 2010−11 was due to the effects of the acquisition by 7-Eleven and On The Run of the Mobil retail network during October 2010.
Role of the ACCCThe ACCC considers that competitive markets generally provide consumers with the lowest sustainable prices. This is true for petrol products also.
The downstream petroleum industry is not regulated by the ACCC and it has no role in setting petrol prices. Petrol prices in Australia are set by market forces.
The ACCC has two broad roles in relation to the petrol industry:
1. The ACCC enforces competition and consumer protection laws across Australia
The ACCC is an independent statutory authority that administers the Competition and Consumer Act 2010 (formerly the Trade Practices Act 1974) (the Act) and other laws. The purpose of the Act is to enhance the welfare of Australians through the promotion of competition and fair trading and provision for consumer protection. These laws apply to all industry sectors, including the fuel industry.
The most relevant work of the ACCC in the fuel industry relates to its role in enforcement and compliance with the Act, assessing mergers and acquisitions and authorisations and notifications.
2. Monitoring the prices, costs and profits relating to the supply of unleaded petroleum products in the petroleum industry
In December 2007, the minister directed the ACCC to undertake monitoring of the prices, costs and profits relating to the supply of unleaded petroleum products in the Australian petroleum industry for three years to the end of 2010. On 13 May 2010, the minister subsequently extended the direction for a further year to the end of 2011. On 10 May 2011, the minister issued a further direction for the ACCC to prepare a monitoring report to the end of 2012. An additional direction issued by the Minister on 6 July 2012, means that the ACCC will be required to prepare a sixth monitoring to the end of 2013. The ACCC provides the minister with a report on its monitoring activities in December each year. A copy of the minister’s direction for 2011−12 is at appendix A.
The ACCC collects fuel prices in each capital city and around 180 regional locations. The ACCC reviews these prices and compares them with the international benchmarks. Each year, the ACCC also obtains revenue, cost and profit information from monitored petrol companies. The ACCC uses this information to compare Australian prices, revenues, costs and profits against international benchmarks. The minister has also asked the ACCC to focus on the prices of diesel and LPG.
If ACCC analysis indicates there are factors impairing competition in fuel markets it can alert the government and community to the problem, as it did with its concerns on the prices and supply of EBP.
Monitoring of the Australian petroleum industry 47

Enforcement and compliance
Misleading conduct and false representations
Many of the contacts the ACCC received in 2011−12 about compliance with the Act related to alleged misleading and deceptive conduct and false or misleading representations. Conduct will be in breach of the Act where it misleads, deceives or is likely to mislead or deceive consumers. Such conduct may include lying to consumers, leading them to a wrong conclusion, creating a false impression or making false or inaccurate claims.
The main issues raised by consumers regarding the downstream fuel industry included the high price of fuel (around 53 per cent of all complaints), and allegations of potential compliance issues under the Act (around 23 per cent).
Price information sharing
During 2012, the ACCC commenced a formal investigation into price information sharing arrangements in relation to the retail petrol sector. The ACCC is concerned that such arrangements may be in breach of the Act. The petrol price sharing arrangements allow for the private and very frequent exchange of comprehensive retail price information between the major petrol companies.
The ACCC is concerned that the information sharing arrangements may allow petrol retailers to signal price movements, monitor competitor responses and then react to them. The ACCC’s review of these arrangements is continuing.
Petrol shopper docket discounting schemes
The ACCC is examining whether competition issues arise from the size (value), frequency and duration of discounts offered through shopper docket discounting schemes. Competition concerns arising from the increased use of shopper docket petrol vouchers, the extended periods of discounting as well as the value of the discounts have been raised with the ACCC.
While the ACCC’s 2007 inquiry into the price of unleaded petrol concluded that the introduction of shopper docket discounts offered by the major supermarket retailers appeared to have delivered a net benefit to consumers, the report also noted that the ACCC would continue to consider developments in the petrol retail sector. In particular, the ACCC noted that it would continue to monitor changes in the nature and extent of any impact of shopper docket discounting schemes on competition.
The ACCC’s 2012 review of shopper docket discounting schemes is continuing.
Business to Business dealings
The ACCC has conducted a number of investigations into fuel quality issues, including actual fuel testing at some retail locations. Further testing at these locations subsequently revealed that the fuel met required standards and no action was taken. The ACCC has also investigated fuel labelling standards at some retail sites during 2012.
During this time the ACCC assessed a number of matters; however, no allegations were able to be substantiated.
Monitoring of the Australian petroleum industry 48

Markets in regional Australia
As part of its monitoring activities in 2011−12, the ACCC continued to actively monitor fuel prices in around 180 regional locations throughout Australia.
The ACCC uses this information to assess the competitiveness of fuel prices in regional areas. Where there is an allegation of anti-competitive conduct, it will make targeted inquiries to investigate the issue. After making inquiries, if there is information available to the ACCC that a breach of the Act is likely to have occurred, it may take legal action to enforce the Act.
Given that regional locations may only have a limited number of retail sites the ACCC pays particular attention to potential changes in ownership of service stations in regional locations to ensure that the sale would not result in a substantial lessening of competition in that particular market.
Mergers and acquisitions
Section 50 of the Act prohibits acquisitions that would have the effect, or likely effect, of substantially lessening competition in a market. The ACCC administers and enforces the merger provisions under Part IV of the Act. Over 2011−12, the ACCC completed public reviews of four fuel-related merger proposals.
Authorisations and notificationsIn certain circumstances, the ACCC can grant protection from legal action for certain anti-competitive conduct where that conduct delivers an offsetting public benefit. Businesses may obtain protection from legal action by applying for an authorisation or lodging a notification with the ACCC. All authorisation applications and notifications are available on a public register and on the ACCC’s website.
Authorisations
Authorisation is a process under which protection can be provided for potential breaches of the competition provisions of the Act, except for misuse of market power, if the ACCC is satisfied the conduct delivers a net public benefit. There were no fuel-related authorisations lodged with the ACCC in 2011−12.
Exclusive dealing notifications
For certain types of conduct, including exclusive dealing, protection from legal action under the Act can also be obtained by lodging a notification with the ACCC. Exclusive dealing involves placing restrictions on the supply of goods or services such as requiring a person to purchase goods from a third-party supplier (known as third line forcing).
In 2011−12, the ACCC considered 11 fuel-related third line forcing exclusive dealing notifications, all of which were allowed. The third line forcing conduct under the notifications fell into two broad categories:
shopper docket arrangements involving IGA supermarkets
supply arrangements requiring the acquisition of goods or services from nominated suppliers.
Monitoring of the Australian petroleum industry 49

Administration of the Oilcode
The Oilcode aims to regulate the conduct of suppliers, distributors and retailers in the downstream petroleum retail sector. It came into effect on 1 March 2007 as a prescribed industry code of conduct under the Act. In 2009, the Department of Resources, Energy and Tourism released its review of the Oilcode and made 11 recommendations. The recommendations were accepted by the government in 2011 and amendments came into effect on 3 July 2012. A further review of the Oilcode will be conducted in 2013.17
The ACCC’s role is to ensure compliance with the Oilcode and the Act by informing downstream petroleum industry participants of their rights and obligations under the law and by enforcing the law where necessary. In 2011−12, the ACCC received one complaint and four inquiries about the Oilcode. The complaint was not pursued because there was insufficient evidence to establish a breach of the Oilcode or the Act.
Level of compliance with the ActDuring 2011−12, the ACCC Infocentre received a total of 197 963 phone calls, 70 891 emails and 18 389 letters during 2011−12. Of these, just over 1300 contacts raised issues in respect of fuel. The majority of these complaints related simply to the fact that market prices were high rather than allegations of a breach of the Act. The ACCC, however, undertook a number of investigations into conduct that may breach the Act.
The ACCC will continue to monitor the operation of the petroleum industry and will take appropriate action where there is evidence of any breaches of the Act.
17 Further information is available on the Department of Resources, Energy and Tourism website, at http://www.ret.gov.au/resources/fuels/petroleum_refining_and_retail/downstream_petroleum_legislation/oilcode_review/Pages/OilcodeReview.aspx
Monitoring of the Australian petroleum industry 50


![Untitled-2 [petrol-is.org.tr]petrol-is.org.tr/sites/default/files/akademi.pdf · PROTOKOL TARAFLAR A-Petrol- i; Sendikasl Türkiye Petrol Kimya Lastik i;çileri Sendikast "PETROL-i$](https://img.dokumen.tips/doc/110x75/5e032b70d9e2ea2f204214f9/untitled-2-petrol-isorgtrpetrol-isorgtrsitesdefaultfiles-protokol-taraflar.jpg)