Embed Size (px)
Citation preview
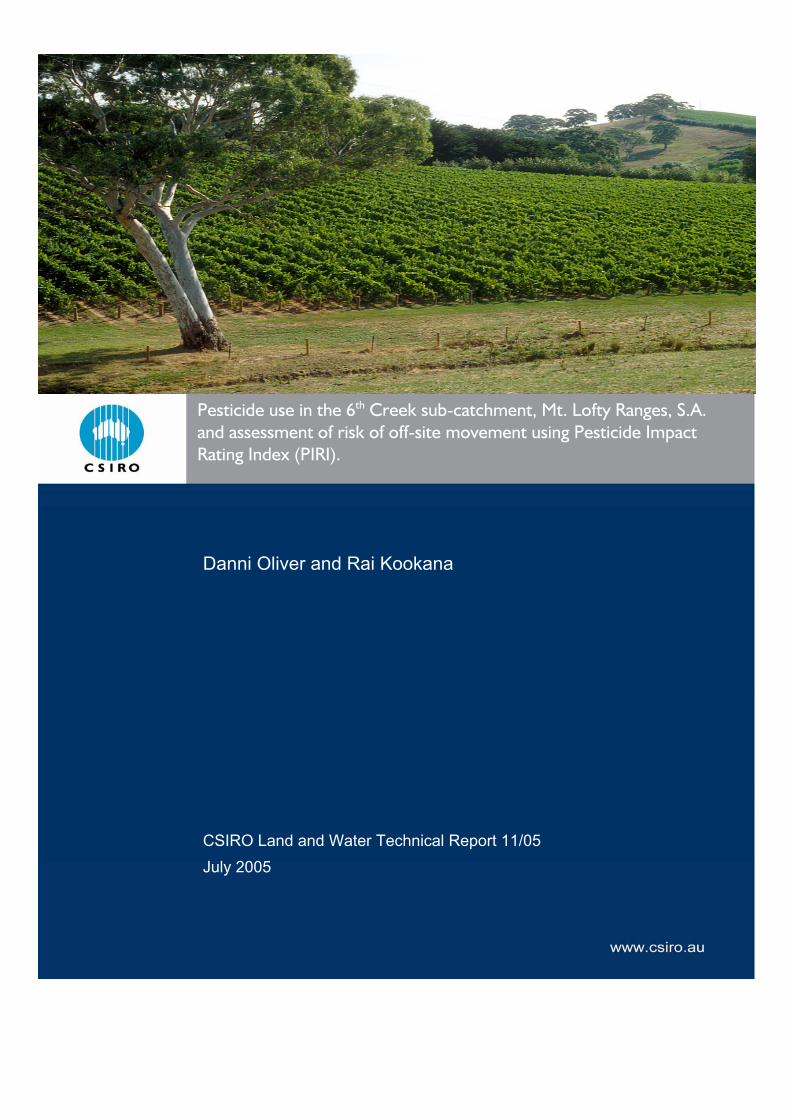
Pesticide use in the 6th Creek sub-catchment, Mt. Lofty Ranges, S.A. and assessment of risk of off-site movement using Pesticide Impact Rating Index (PIRI).
Danni Oliver and Rai Kookana
CSIRO Land and Water Technical Report 11/05 July 2005
Copyright and Disclaimer © 2005 CSIRO To the extent permitted by law, all rights are reserved and no part of this publication covered by copyright may be reproduced or copied in any form or by any means except with the written permission of CSIRO. Important Disclaimer: CSIRO advises that the information contained in this publication comprises general statements based on scientific research. The reader is advised and needs to be aware that such information may be incomplete or unable to be used in any specific situation. No reliance or actions must therefore be made on that information without seeking prior expert professional, scientific and technical advice. To the extent permitted by law, CSIRO (including its employees and consultants) excludes all liability to any person for any consequences, including but not limited to all losses, damages, costs, expenses and any other compensation, arising directly or indirectly from using this publication (in part or in whole) and any information or material contained in it. Cover Photograph: From CSIRO Land and Water Image Gallery: www.clw.csiro.au/ImageGallery/ File: PDC00421_013.jpg Description: Grape vines in the Mt Lofty Ranges, South Australia. Photographer: Willem van Aken © 2005 CSIRO
CSIRO Land and Water Page i
Pesticide use in the 6th Creek sub-catchment, Mt. Lofty Ranges, S.A. and assessment of risk of off-site movement using Pesticide Impact Rating Index (PIRI). Danni Oliver and Rai Kookana CSIRO Land and Water PMB 2 Glen Osmond SA 5064 CSIRO Land and Water Technical Report 11/05 July2005
CSIRO Land and Water Page ii
Acknowledgements Sincere thanks to the growers in the 6th Creek sub-catchment who willingly participated in this survey of pesticide use and gave so much of their time to discuss their spray practices. Thanks also to Mr Ian Daynes, Lenswood Rural, who provided highly valuable feedback about data collected and seasonal variability in spraying practices. Australian Centre for International Agricultural Research (ACIAR) are gratefully acknowledged for funding this project. The screening tool, Pesticide Impact Rating Index (PIRI), has been developed by Dr Rai Kookana (CSIRO Land and Water) and Dr Ray Correll and Ms Ros Miller (CMIS).
CSIRO Land and Water Page iii
Executive Summary The Mt Lofty Ranges are the main catchment area for Adelaide’s drinking water supply and
concerns have been raised about the detection of certain pesticides in creeks that run into
the main reservoirs. Consequently, an inventory of pesticide use was made for the main
landuses in the 6th Creek sub-catchment in the Mt. Lofty Ranges, S.A., namely apples,
lemons, grapes, strawberries and cherries. This data was collected during interviews with 1
to 2 growers for each landuse and cross-checked with the major chemical supplier in the
region. A risk assessment was then made for each landuse using Pesticide Impact Rating
Index (PIRI) to determine the potential for the chemicals to move off-site to surface water and
toxicity impacts based on LC50 values for Rainbow trout and USEPA Health Advisory
Guidelines. Different rates of application and/or frequency of application of chemicals occur
from year to year depending upon environmental conditions. Several scenarios were run
through PIRI for each landuse covering the lowest and highest rates of application and/or
frequency of applications and different soil organic carbon contents and slopes. It should be
noted that PIRI has not yet been validated specifically in the Mt. Lofty Ranges. It is planned
in future work to monitor selected creeks for specific chemicals identified in the initial
assessment to validate PIRI. A summary of the main chemicals of concern in each landuse,
rated by PIRI as having high potential for off-site migration as well as toxicity to fish is given
below:
Risk of surface water contamination
Landuse Main chemicals of concern
Apples Mancozeb, paraquat, diquat, ethefon, thiram, metiram, Cherries Mancozeb, paraquat, diquat, pirimicarb Grapes Mancozeb, paraquat, diquat, Lemons Paraquat, diquat, triclopyr Strawberries Maldison, methomyl, iprodione, dimethoate
CSIRO Land and Water Page iv
Toxicity Risk based on LC50 values for Rainbow Trout (this assessment is restricted by the number of chemicals for which there are LC50 values for Rainbow Trout) Landuse Main chemicals of concern Apples Captan, mancozeb, endosulfan, chlorpyrifos, thiram, abamectin, propargite, ,
azinphos methyl. Cherries Captan, mancozeb Grapes Esfenvalerarate, mancozeb Lemons Strawberries Maldison, endosulfan, abamectin, captan The risk assessment based on USEPA Health Advisory Levels (HAL) does not take into account any removal of chemicals of compounds during water treatment processes. The assessment made in this report provides an indicative risk for untreated drinking water. A summary is given below: Toxicity Risk based on USEPA Health Advisory Levels (HAL) (this assessment is restricted by the limited number of chemicals that have HAL values) Landuse Main chemicals of concern Apples Parathion methyl, diquat, paraquat, simazine, chlorpyrifos, carbaryl Cherries Paraquat, diquat, carbaryl Grapes Paraquat, diquat, simazine, carbaryl Lemons Paraquat, diquat Strawberries Methomyl The intention of this risk assessment is to enhance current pesticide monitoring and management programmes in the Mt. Lofty Ranges. This study will be made available to S.A. Water so their current monitoring programme can be adjusted as needed to include any pesticides that have been identified by PIRI as posing a potential risk but are not currently monitored.
CSIRO Land and Water Page v
TABLE OF CONTENTS Copyright and Disclaimer i Acknowledgements ii Executive Summary iii 1. BACKGROUND 1 2. MAJOR LANDUSES IN THE SIXTH CREEK SUBCATCHMENT 1 3. BRIEF OVERVIEW OF PESTICIDE IMPACT RATING INDEX (PIRI) 5 4. METHOD OF DATA COLLECTION 5
4.1 PESTICIDE USE DATA 5 4.2 OTHER INPUT PARAMETERS NEEDED FOR PIRI ASSESSMENT 7
5. DATA USED FOR 6TH CREEK SUB-CATCHMENT 10 6. FACTORS THAT AFFECT THE PIRI ASSESSMENT 12
6.1 VARIABILITY IN PESTICIDE DATA 12 6.2 VARIABILITY IN ENVIRONMENTAL FACTORS. 13 6.3 EXCLUSION OF CERTAIN PESTICIDES FROM ASSESSMENT 13
7. RESULTS OF PIRI ASSESSMENT 16 7.1 APPLES 16 7.2 CHERRIES 21 7.3 GRAPES 25 7.4 LEMONS 28 7.5 STRAWBERRIES 31 7.6 SUMMARY OF PIRI ASSESSMENT ACROSS LANDUSES 34
APPENDIX 1 36 Pesticide Impact Rating Index (PIRI) : 36
APPENDIX 2 42
CSIRO Land and Water Page 1
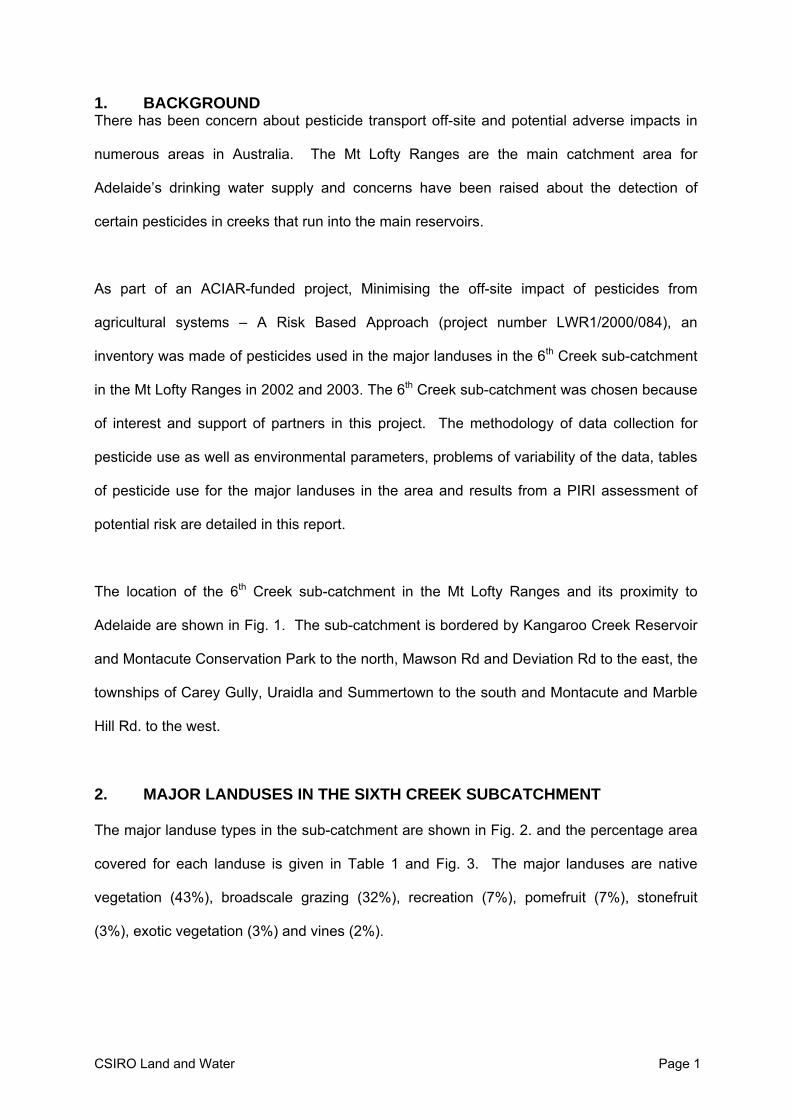
1. BACKGROUND There has been concern about pesticide transport off-site and potential adverse impacts in
numerous areas in Australia. The Mt Lofty Ranges are the main catchment area for
Adelaide’s drinking water supply and concerns have been raised about the detection of
certain pesticides in creeks that run into the main reservoirs.
As part of an ACIAR-funded project, Minimising the off-site impact of pesticides from
agricultural systems – A Risk Based Approach (project number LWR1/2000/084), an
inventory was made of pesticides used in the major landuses in the 6th Creek sub-catchment
in the Mt Lofty Ranges in 2002 and 2003. The 6th Creek sub-catchment was chosen because
of interest and support of partners in this project. The methodology of data collection for
pesticide use as well as environmental parameters, problems of variability of the data, tables
of pesticide use for the major landuses in the area and results from a PIRI assessment of
potential risk are detailed in this report.
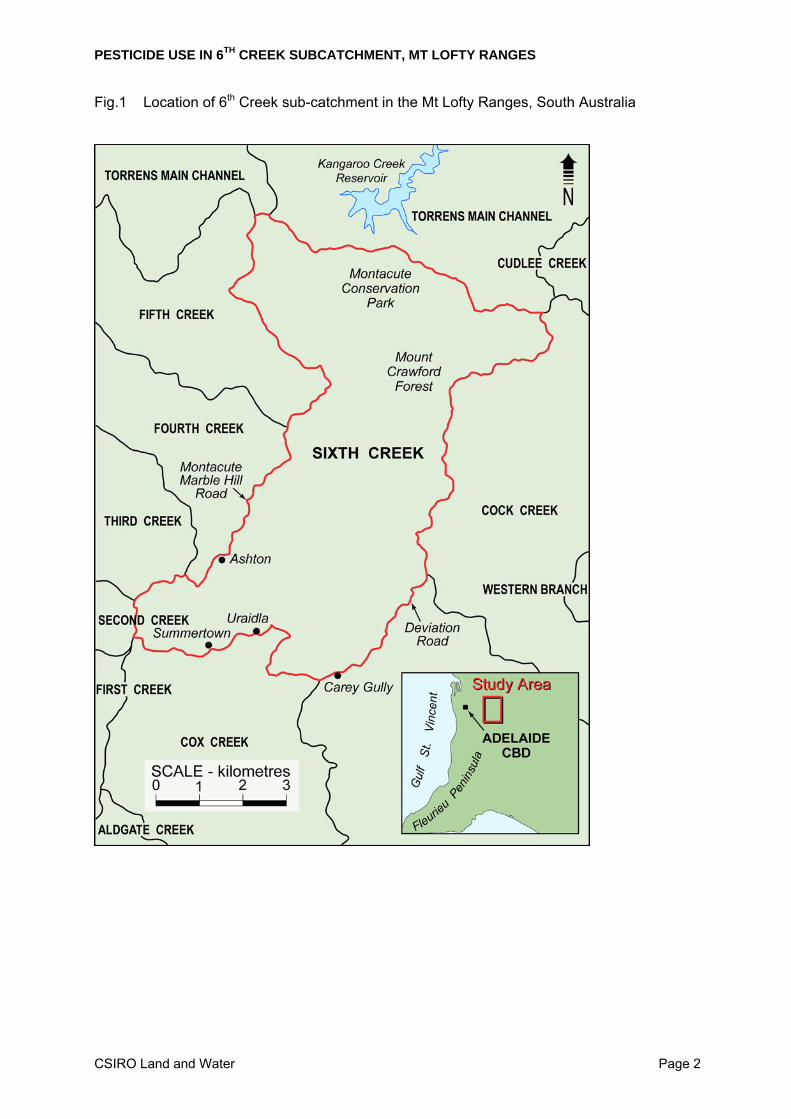
The location of the 6th Creek sub-catchment in the Mt Lofty Ranges and its proximity to
Adelaide are shown in Fig. 1. The sub-catchment is bordered by Kangaroo Creek Reservoir
and Montacute Conservation Park to the north, Mawson Rd and Deviation Rd to the east, the
townships of Carey Gully, Uraidla and Summertown to the south and Montacute and Marble
Hill Rd. to the west.
2. MAJOR LANDUSES IN THE SIXTH CREEK SUBCATCHMENT
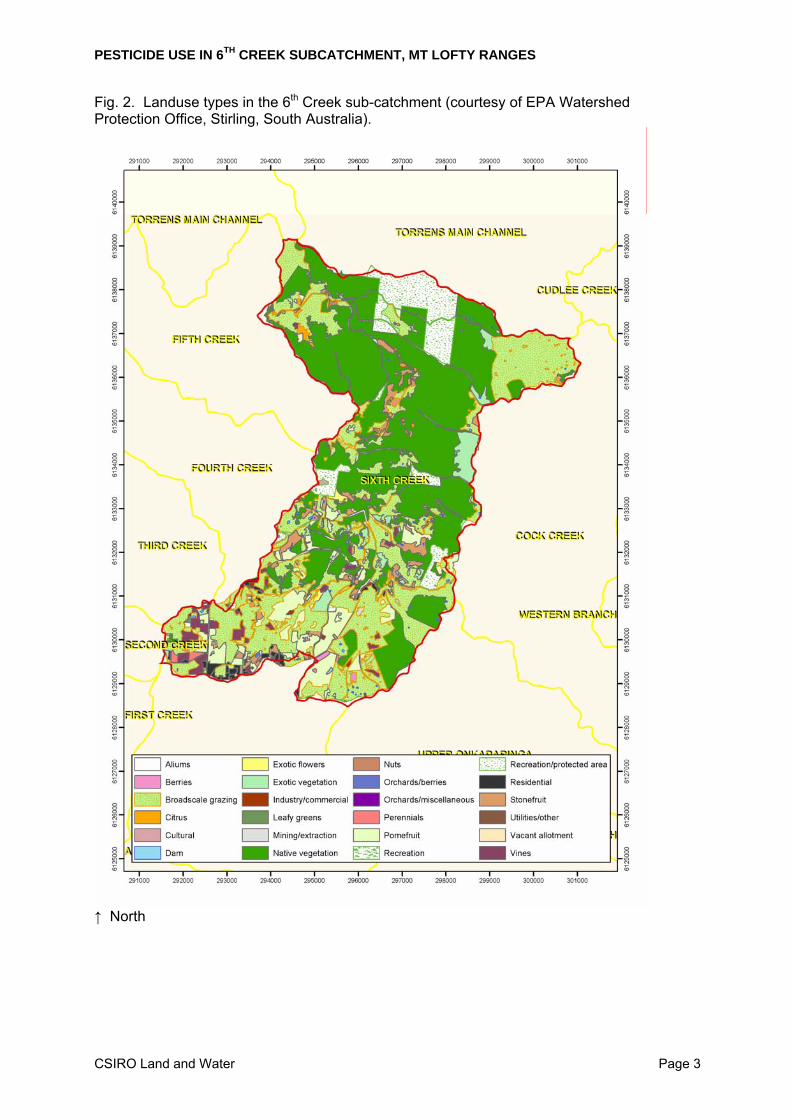
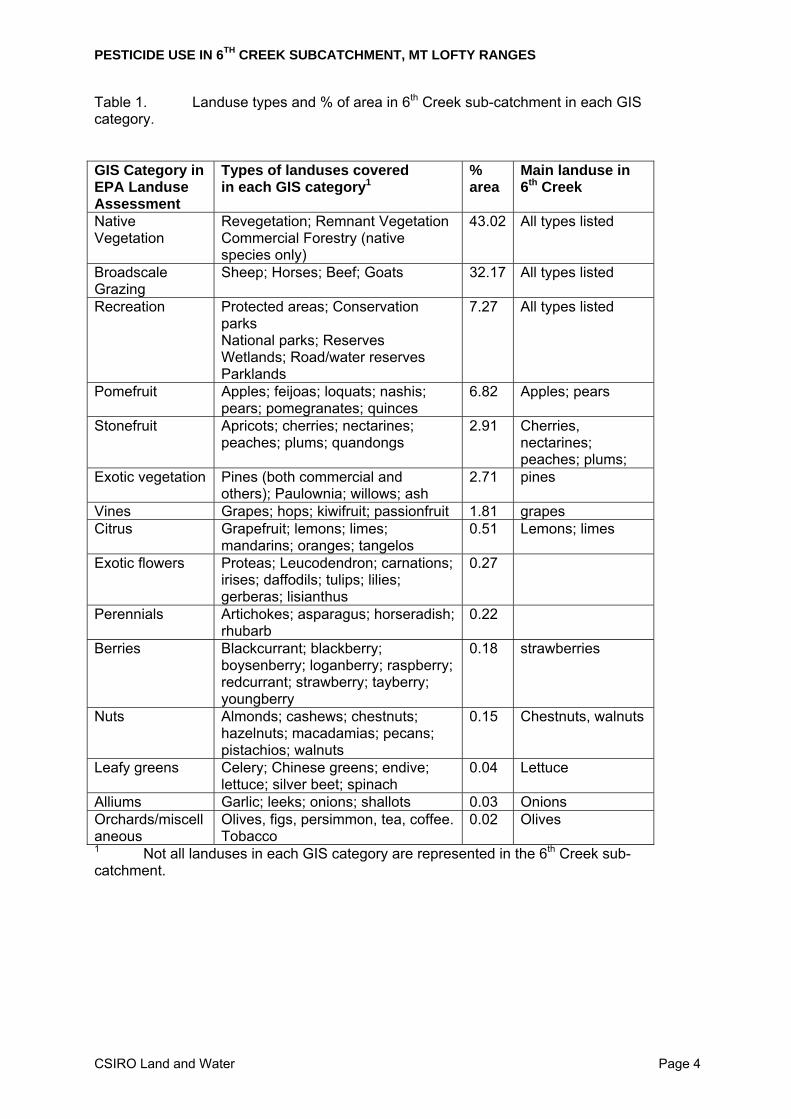
The major landuse types in the sub-catchment are shown in Fig. 2. and the percentage area
covered for each landuse is given in Table 1 and Fig. 3. The major landuses are native
vegetation (43%), broadscale grazing (32%), recreation (7%), pomefruit (7%), stonefruit
(3%), exotic vegetation (3%) and vines (2%).
PESTICIDE USE IN 6TH CREEK SUBCATCHMENT, MT LOFTY RANGES
CSIRO Land and Water Page 2
Fig.1 Location of 6th Creek sub-catchment in the Mt Lofty Ranges, South Australia
PESTICIDE USE IN 6TH CREEK SUBCATCHMENT, MT LOFTY RANGES
CSIRO Land and Water Page 3
Fig. 2. Landuse types in the 6th Creek sub-catchment (courtesy of EPA Watershed Protection Office, Stirling, South Australia).
↑ North
PESTICIDE USE IN 6TH CREEK SUBCATCHMENT, MT LOFTY RANGES
CSIRO Land and Water Page 4
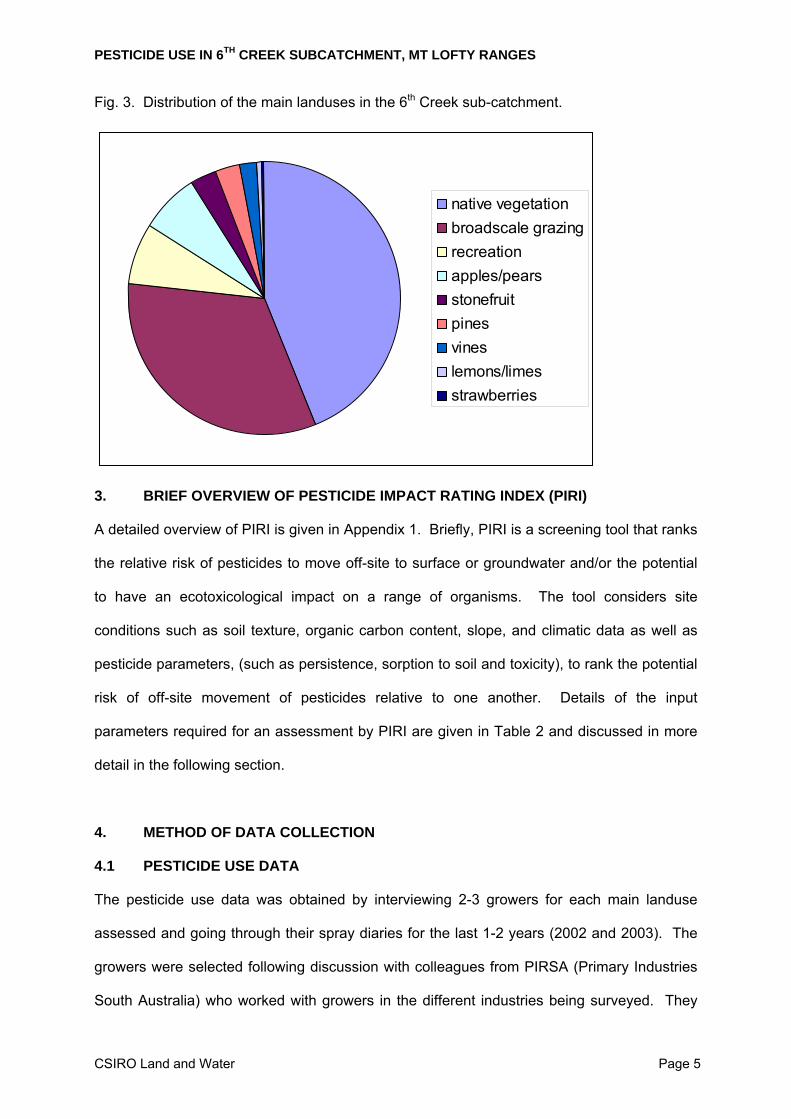
Table 1. Landuse types and % of area in 6th Creek sub-catchment in each GIS category. GIS Category in EPA Landuse Assessment
Types of landuses covered in each GIS category1
% area
Main landuse in 6th Creek
Native Vegetation
Revegetation; Remnant Vegetation Commercial Forestry (native species only)
43.02 All types listed
Broadscale Grazing
Sheep; Horses; Beef; Goats 32.17 All types listed
Recreation Protected areas; Conservation parks National parks; Reserves Wetlands; Road/water reserves Parklands
7.27 All types listed
Pomefruit Apples; feijoas; loquats; nashis; pears; pomegranates; quinces
6.82 Apples; pears
Stonefruit Apricots; cherries; nectarines; peaches; plums; quandongs
2.91 Cherries, nectarines; peaches; plums;
Exotic vegetation Pines (both commercial and others); Paulownia; willows; ash
2.71 pines
Vines Grapes; hops; kiwifruit; passionfruit 1.81 grapes Citrus Grapefruit; lemons; limes;
mandarins; oranges; tangelos 0.51 Lemons; limes
Exotic flowers Proteas; Leucodendron; carnations; irises; daffodils; tulips; lilies; gerberas; lisianthus
0.27
Perennials Artichokes; asparagus; horseradish; rhubarb
0.22
Berries Blackcurrant; blackberry; boysenberry; loganberry; raspberry; redcurrant; strawberry; tayberry; youngberry
0.18 strawberries
Nuts Almonds; cashews; chestnuts; hazelnuts; macadamias; pecans; pistachios; walnuts
0.15 Chestnuts, walnuts
Leafy greens Celery; Chinese greens; endive; lettuce; silver beet; spinach
0.04 Lettuce
Alliums Garlic; leeks; onions; shallots 0.03 Onions Orchards/miscellaneous
Olives, figs, persimmon, tea, coffee. Tobacco
0.02 Olives
1 Not all landuses in each GIS category are represented in the 6th Creek sub-catchment.
PESTICIDE USE IN 6TH CREEK SUBCATCHMENT, MT LOFTY RANGES
CSIRO Land and Water Page 5
Fig. 3. Distribution of the main landuses in the 6th Creek sub-catchment.
native vegetationbroadscale grazingrecreationapples/pearsstonefruitpinesvineslemons/limesstrawberries
3. BRIEF OVERVIEW OF PESTICIDE IMPACT RATING INDEX (PIRI)
A detailed overview of PIRI is given in Appendix 1. Briefly, PIRI is a screening tool that ranks
the relative risk of pesticides to move off-site to surface or groundwater and/or the potential
to have an ecotoxicological impact on a range of organisms. The tool considers site
conditions such as soil texture, organic carbon content, slope, and climatic data as well as
pesticide parameters, (such as persistence, sorption to soil and toxicity), to rank the potential
risk of off-site movement of pesticides relative to one another. Details of the input
parameters required for an assessment by PIRI are given in Table 2 and discussed in more
detail in the following section.
4. METHOD OF DATA COLLECTION
4.1 PESTICIDE USE DATA
The pesticide use data was obtained by interviewing 2-3 growers for each main landuse
assessed and going through their spray diaries for the last 1-2 years (2002 and 2003). The
growers were selected following discussion with colleagues from PIRSA (Primary Industries
South Australia) who worked with growers in the different industries being surveyed. They
PESTICIDE USE IN 6TH CREEK SUBCATCHMENT, MT LOFTY RANGES
CSIRO Land and Water Page 6
recommended growers on the basis of their willingness to participate in the survey and their
representation of “usual” practice in the specific industry. The data compiled from the
growers was then discussed with the main chemical supplier in the Adelaide Hills for
verification about rates of use and frequency of application. When there was a range in rates
of use or frequency of application of a chemical the PIRI assessment was conducted using
the highest and lowest rates and/or frequencies supplied by the growers. These options are
indicated on the summaries of the PIRI assessment.
The main landuses assessed using PIRI were:
• apples Malus domestica Borkh.,
• cherries Prunus avium L.,
• vines Vitis spp.,
• lemons Citrus limon and
• strawberries Fragaria virginiana.
Details of the rates and frequency of application of the pesticides used in the main landuses
studied are given in Appendix 2.
Although native vegetation covered the largest percentage of the area in the 6th Creek sub-
catchment the use of pesticides in this landuse is sporadic and limited to spot spraying of
woody weeds, such as blackberries, Rubus sp. and broom, Cytisus sp. These weeds are
controlled, as required, by spot applications of Garlon (triclopyr) or Brushoff (ammonium
sulfamate) or Grazon (10.2% picloram triisopropanolamine salt and 39.6% 2,4-D
triisopropanolamine salt). Other weeds are controlled by spot applications of Roundup
(glyphosate). Owing to the method of application and the intermittent frequency of
application (i.e. only applied on an “as-needs” basis) it was not possible to conduct a PIRI
assessment for this landuse.
PESTICIDE USE IN 6TH CREEK SUBCATCHMENT, MT LOFTY RANGES
CSIRO Land and Water Page 7
The next largest landuse on the basis of percentage area was broadscale grazing. Generally
very few, if any, pesticides are used on pastures in the Mt Lofty Ranges. A chemical supplier
suggested the following chemicals (MCPA and Tebutreen, or Bromoxynil, or Tigrex or Le
Mat) might be used on pastures but discussions with growers revealed negligible chemical
use. Consequently no PIRI assessment was made for this landuse.
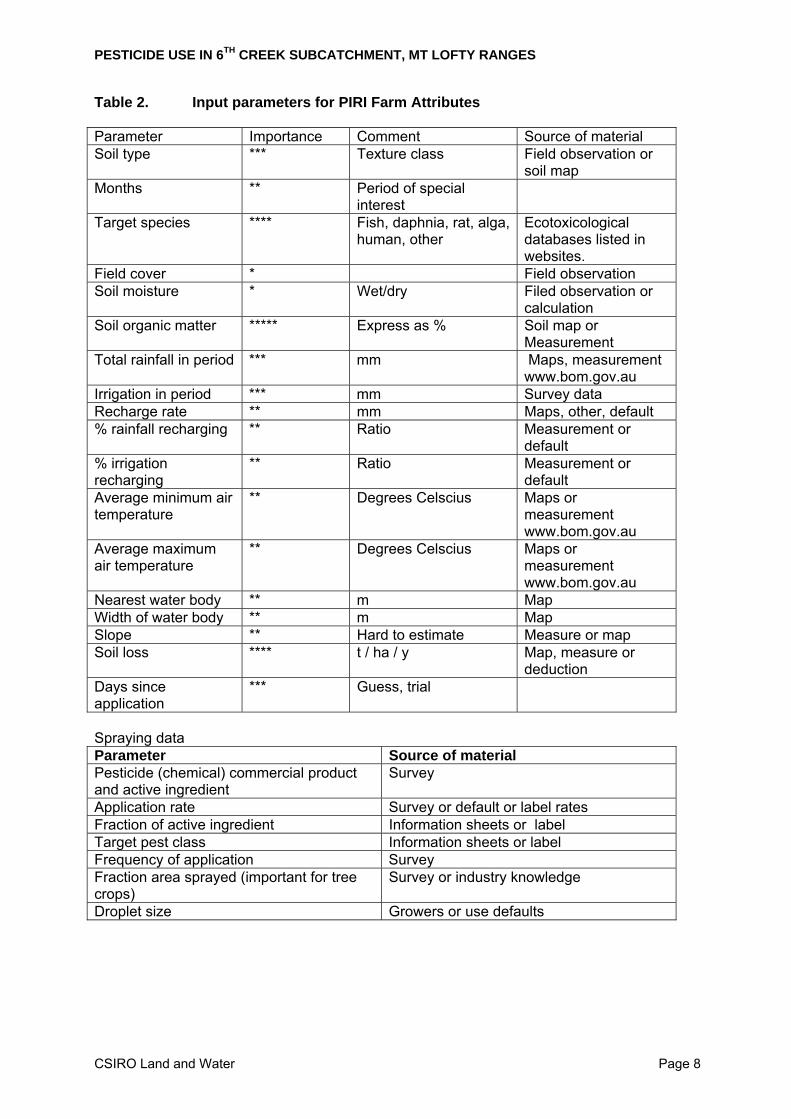
4.2 OTHER INPUT PARAMETERS NEEDED FOR PIRI ASSESSMENT
The input parameters needed to use the PIRI tool to assess the risk of off-site movement of
pesticides are given in Table 2. The sources of information for each parameter are also
given in Table 2. For many of the input parameters only a few options may be available in
PIRI e.g. for soil texture the user must select one of a selection of soil textural classes, while
for other parameters e.g. minimum average air temperature, specific values are required
from the user.
PESTICIDE USE IN 6TH CREEK SUBCATCHMENT, MT LOFTY RANGES
CSIRO Land and Water Page 8
Table 2. Input parameters for PIRI Farm Attributes
Parameter Importance Comment Source of material Soil type *** Texture class Field observation or
soil map Months ** Period of special
interest
Target species **** Fish, daphnia, rat, alga, human, other
Ecotoxicological databases listed in websites.
Field cover * Field observation Soil moisture * Wet/dry Filed observation or
calculation Soil organic matter ***** Express as % Soil map or
Measurement Total rainfall in period *** mm Maps, measurement
www.bom.gov.au Irrigation in period *** mm Survey data Recharge rate ** mm Maps, other, default % rainfall recharging ** Ratio Measurement or
default % irrigation recharging
** Ratio Measurement or default
Average minimum air temperature
** Degrees Celscius Maps or measurement www.bom.gov.au
Average maximum air temperature
** Degrees Celscius Maps or measurement www.bom.gov.au
Nearest water body ** m Map Width of water body ** m Map Slope ** Hard to estimate Measure or map Soil loss **** t / ha / y Map, measure or
deduction Days since application
*** Guess, trial
Spraying data Parameter Source of material Pesticide (chemical) commercial product and active ingredient
Survey
Application rate Survey or default or label rates Fraction of active ingredient Information sheets or label Target pest class Information sheets or label Frequency of application Survey Fraction area sprayed (important for tree crops)
Survey or industry knowledge
Droplet size Growers or use defaults
PESTICIDE USE IN 6TH CREEK SUBCATCHMENT, MT LOFTY RANGES
CSIRO Land and Water Page 9
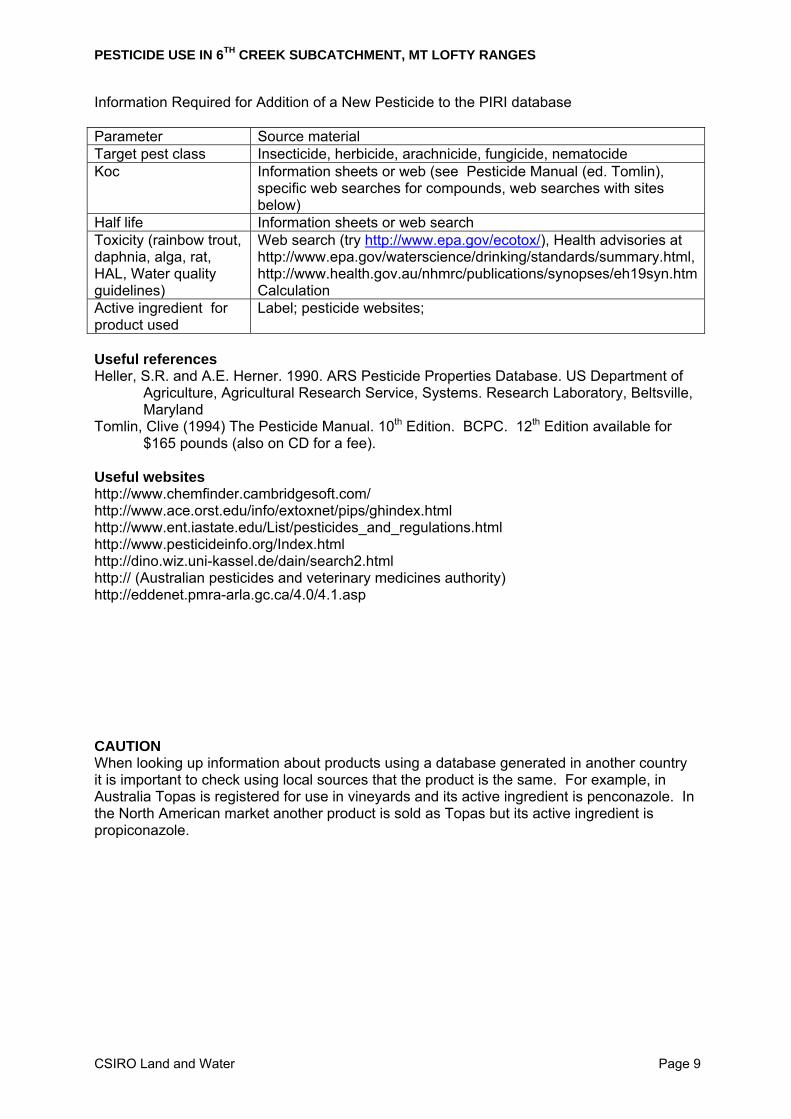
Information Required for Addition of a New Pesticide to the PIRI database Parameter Source material Target pest class Insecticide, herbicide, arachnicide, fungicide, nematocide Koc Information sheets or web (see Pesticide Manual (ed. Tomlin),
specific web searches for compounds, web searches with sites below)
Half life Information sheets or web search Toxicity (rainbow trout, daphnia, alga, rat, HAL, Water quality guidelines)
Web search (try http://www.epa.gov/ecotox/), Health advisories at http://www.epa.gov/waterscience/drinking/standards/summary.html, http://www.health.gov.au/nhmrc/publications/synopses/eh19syn.htm Calculation
Active ingredient for product used
Label; pesticide websites;
Useful references Heller, S.R. and A.E. Herner. 1990. ARS Pesticide Properties Database. US Department of
Agriculture, Agricultural Research Service, Systems. Research Laboratory, Beltsville, Maryland
Tomlin, Clive (1994) The Pesticide Manual. 10th Edition. BCPC. 12th Edition available for $165 pounds (also on CD for a fee).
Useful websites http://www.chemfinder.cambridgesoft.com/ http://www.ace.orst.edu/info/extoxnet/pips/ghindex.html http://www.ent.iastate.edu/List/pesticides_and_regulations.html http://www.pesticideinfo.org/Index.html http://dino.wiz.uni-kassel.de/dain/search2.html http:// (Australian pesticides and veterinary medicines authority) http://eddenet.pmra-arla.gc.ca/4.0/4.1.asp CAUTION When looking up information about products using a database generated in another country it is important to check using local sources that the product is the same. For example, in Australia Topas is registered for use in vineyards and its active ingredient is penconazole. In the North American market another product is sold as Topas but its active ingredient is propiconazole.
PESTICIDE USE IN 6TH CREEK SUBCATCHMENT, MT LOFTY RANGES
CSIRO Land and Water Page 10
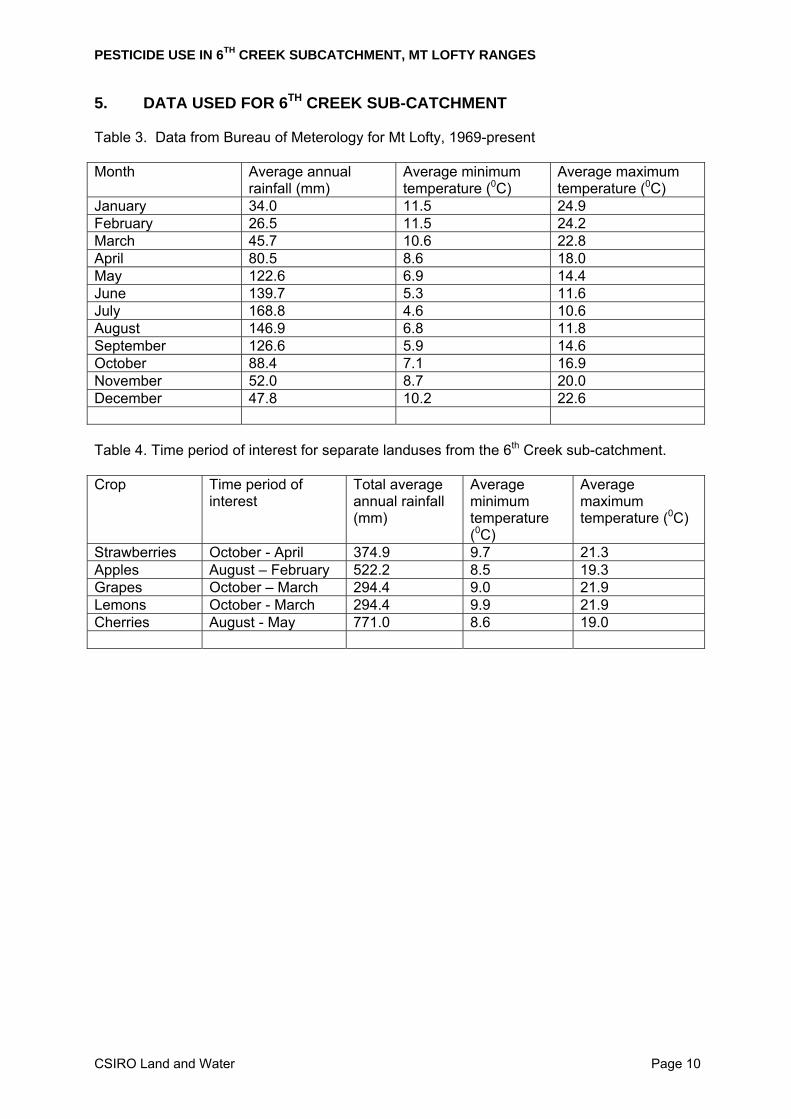
5. DATA USED FOR 6TH CREEK SUB-CATCHMENT Table 3. Data from Bureau of Meterology for Mt Lofty, 1969-present Month Average annual
rainfall (mm) Average minimum temperature (0C)
Average maximum temperature (0C)
January 34.0 11.5 24.9 February 26.5 11.5 24.2 March 45.7 10.6 22.8 April 80.5 8.6 18.0 May 122.6 6.9 14.4 June 139.7 5.3 11.6 July 168.8 4.6 10.6 August 146.9 6.8 11.8 September 126.6 5.9 14.6 October 88.4 7.1 16.9 November 52.0 8.7 20.0 December 47.8 10.2 22.6 Table 4. Time period of interest for separate landuses from the 6th Creek sub-catchment. Crop Time period of
interest Total average annual rainfall (mm)
Average minimum temperature (0C)
Average maximum temperature (0C)
Strawberries October - April 374.9 9.7 21.3 Apples August – February 522.2 8.5 19.3 Grapes October – March 294.4 9.0 21.9 Lemons October - March 294.4 9.9 21.9 Cherries August - May 771.0 8.6 19.0
PESTICIDE USE IN 6TH CREEK SUBCATCHMENT, MT LOFTY RANGES
CSIRO Land and Water Page 11
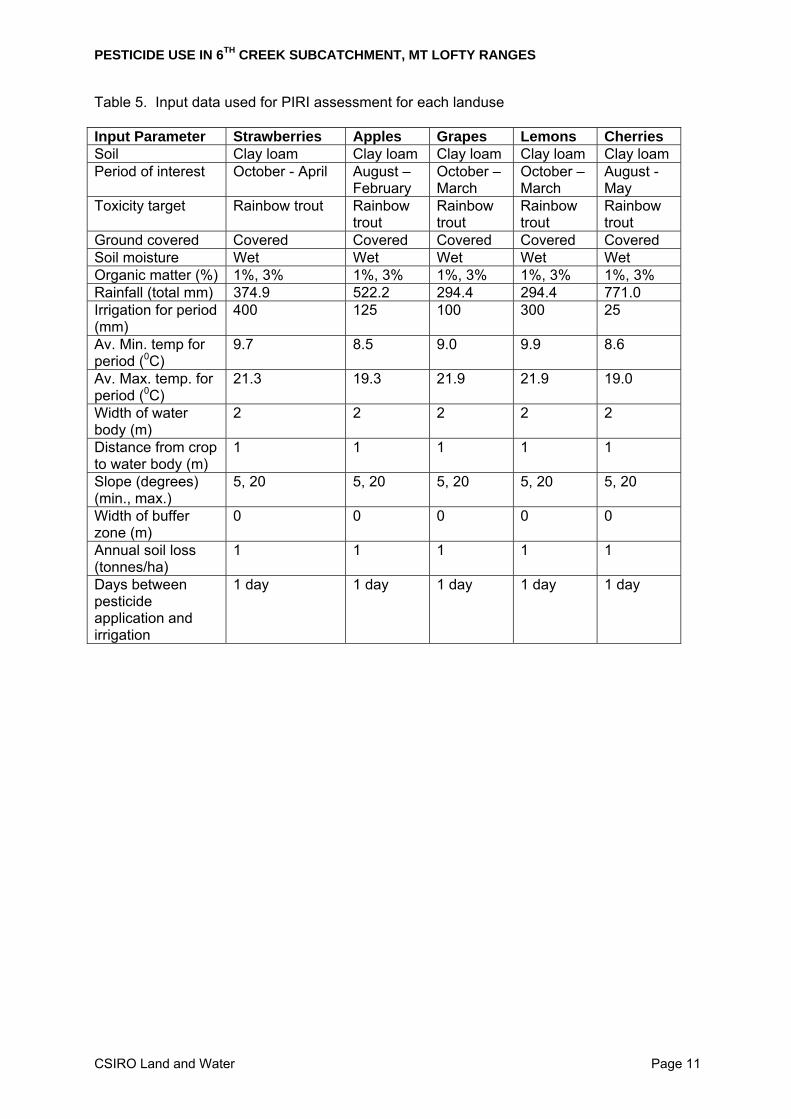
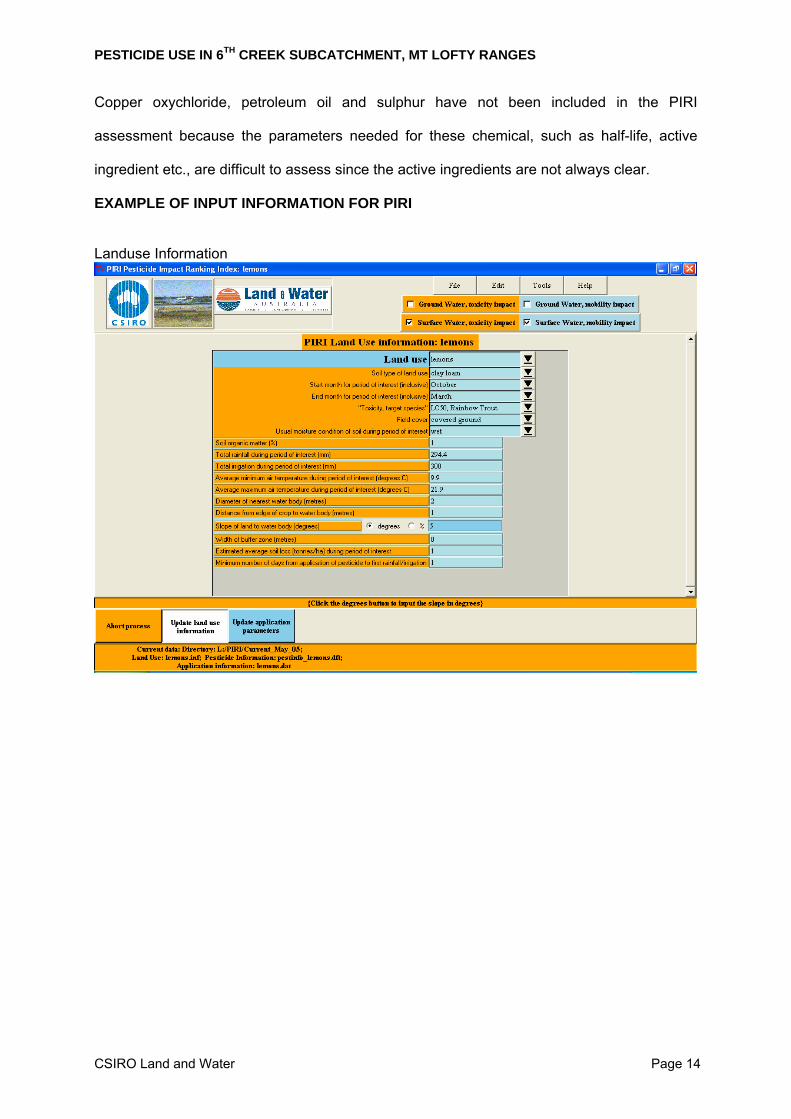
Table 5. Input data used for PIRI assessment for each landuse Input Parameter Strawberries Apples Grapes Lemons Cherries Soil Clay loam Clay loam Clay loam Clay loam Clay loam Period of interest October - April August –
February October – March
October – March
August - May
Toxicity target Rainbow trout Rainbow trout
Rainbow trout
Rainbow trout
Rainbow trout
Ground covered Covered Covered Covered Covered Covered Soil moisture Wet Wet Wet Wet Wet Organic matter (%) 1%, 3% 1%, 3% 1%, 3% 1%, 3% 1%, 3% Rainfall (total mm) 374.9 522.2 294.4 294.4 771.0 Irrigation for period (mm)
400 125 100 300 25
Av. Min. temp for period (0C)
9.7 8.5 9.0 9.9 8.6
Av. Max. temp. for period (0C)
21.3 19.3 21.9 21.9 19.0
Width of water body (m)
2 2 2 2 2
Distance from crop to water body (m)
1 1 1 1 1
Slope (degrees) (min., max.)
5, 20 5, 20 5, 20 5, 20 5, 20
Width of buffer zone (m)
0 0 0 0 0
Annual soil loss (tonnes/ha)
1 1 1 1 1
Days between pesticide application and irrigation
1 day 1 day 1 day 1 day 1 day
PESTICIDE USE IN 6TH CREEK SUBCATCHMENT, MT LOFTY RANGES
CSIRO Land and Water Page 12
6. FACTORS THAT AFFECT THE PIRI ASSESSMENT
6.1 VARIABILITY IN PESTICIDE DATA
The amount or frequency of application of pesticides is not constant from season to season
but will vary for a number of reasons which are discussed below.
Seasonal factors play an important role in the development of fungal diseases and pest
loads. The risk of a fungal outbreak is greater in seasons when there is a combination of rain
and warm weather. So the number of sprays of fungicides will be greater if there is a “wet
and warm” November/December/January period. For example, the “usual” number of sprays
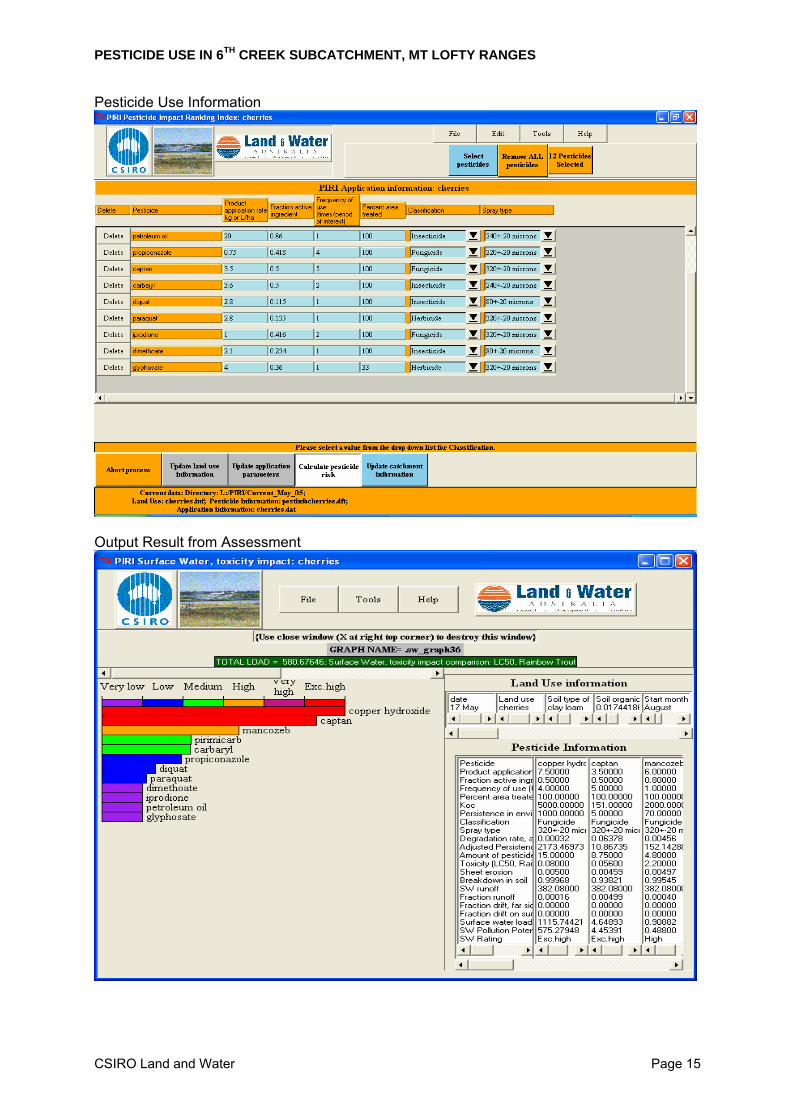
of Captan (a fungicide, active ingredient captan) on cherries is 2 to 3 but in 2001/2002 there
was a higher and more frequent rainfall in December, so Captan was sprayed 5 times. In
South Australia a network of automatic weather stations have been established at strategic
locations in vineyards. These stations monitor temperature, humidity and rainfall in the
vineyard and the data are automatically sent to the CropWatch SA computer. The data are
checked for accuracy before being processed by AusVit, the decision support software that
advises growers of the risk of downy mildew outbreaks and whether to spray or not. Details
of these programmes can be found at www.cropwatchonline.com and
www.crcv.com.au/products/pamausvit.
Furthermore, certain areas have a higher average rainfall than other areas so there will be
differences in the number of sprays for fungal diseases depending on the location of the farm
and the average rainfall, temperature and humidity in that area during the growing season.
The use of pheromones as part of an integrated pest management (IPM) programme will
also affect the number, types and frequency of insecticides used. Approximately 30% of
apple growers in the Mt Lofty Ranges (Ian Daynes, pers. comm.) do not use pheromone
baiting to control insect pests so these growers will use more insecticides than those that
incorporate IPM into their management programme.
PESTICIDE USE IN 6TH CREEK SUBCATCHMENT, MT LOFTY RANGES
CSIRO Land and Water Page 13
Also the amount of fungicides like winter oil, copper hydroxide or copper oxychloride used on
tree crops such as apples, cherries or lemons, will vary on the size of the tree. Larger
quantities are used on larger trees.
In this assessment of risk of off-site transport of pesticides two options were used for each
landuse where the rates and/or frequency of application of a chemical varied. The options
were lowest rate and lowest frequency as a “best-case” scenario and highest rate and
highest frequency as a “worst-case” scenario.
6.2 VARIABILITY IN ENVIRONMENTAL FACTORS.
The parameters used in the PIRI assessment will vary from season to season or location to
location in the Mt. Lofty Ranges. To cater for the large number of combinations of factors
that would impact on the assessment the parameters that had a large impact on the
assessment (as indicated by importance in Table 2) were varied. In this assessment soil
organic matter and slope were the two parameters that were varied. The total average
monthly rainfall, and average minimum and maximum temperatures were used for the
irrigation period. The irrigation during the growing season was obtained from growers during
the interviews but this would vary seasonally with the rainfall during the period of interest.
6.3 EXCLUSION OF CERTAIN PESTICIDES FROM ASSESSMENT
It was not possible to include some chemicals in the PIRI assessment because they were
only used for spot spraying of woody weeds such as blackberries, Rubus sp., and broom,
Cytisus sp, and only on an as-need basis. Also for the PIRI tool to run information about
toxicity of the chemical to the organism of interest, degradation (half-life values), sorption
behaviour (KOC values) and active ingredient of chemical in the commercial product must be
supplied. In some cases one or more of these parameters was not available so these
pesticides were not included in the assessment.
PESTICIDE USE IN 6TH CREEK SUBCATCHMENT, MT LOFTY RANGES
CSIRO Land and Water Page 14
Copper oxychloride, petroleum oil and sulphur have not been included in the PIRI
assessment because the parameters needed for these chemical, such as half-life, active
ingredient etc., are difficult to assess since the active ingredients are not always clear.
EXAMPLE OF INPUT INFORMATION FOR PIRI
Landuse Information
PESTICIDE USE IN 6TH CREEK SUBCATCHMENT, MT LOFTY RANGES
CSIRO Land and Water Page 15
Pesticide Use Information
Output Result from Assessment
PESTICIDE USE IN 6TH CREEK SUBCATCHMENT, MT LOFTY RANGES
CSIRO Land and Water Page 16
7. RESULTS OF PIRI ASSESSMENT
7.1 APPLES
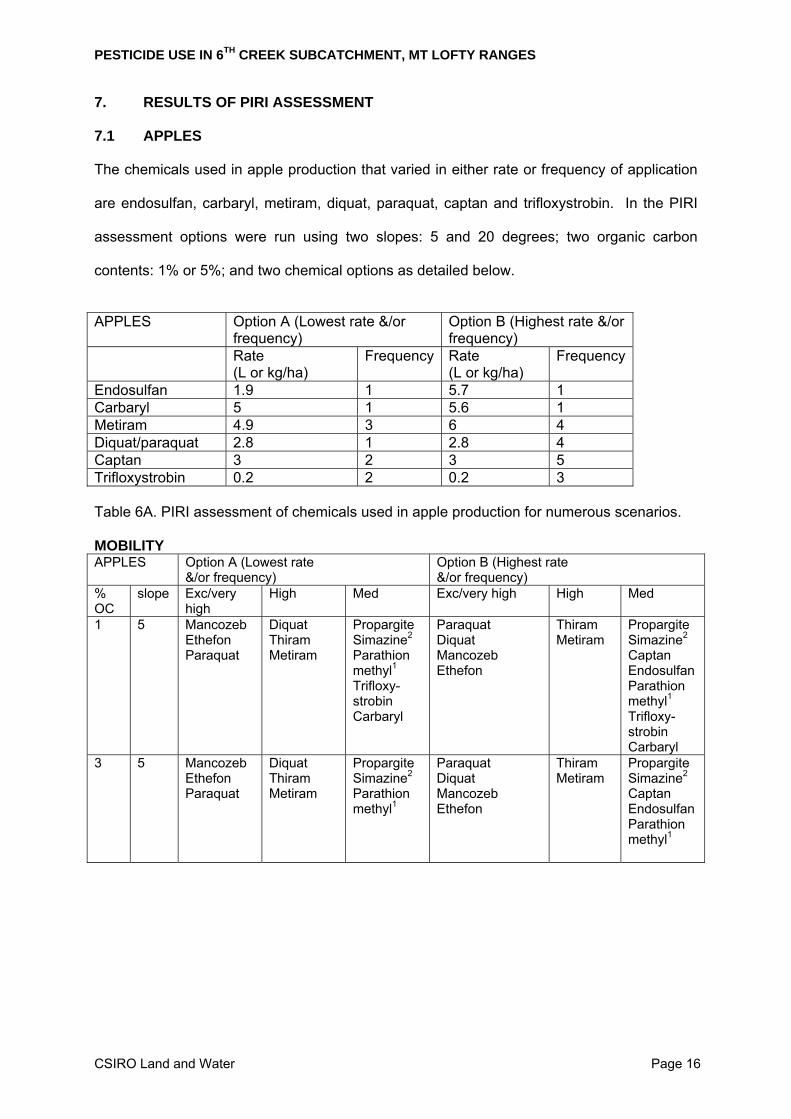
The chemicals used in apple production that varied in either rate or frequency of application
are endosulfan, carbaryl, metiram, diquat, paraquat, captan and trifloxystrobin. In the PIRI
assessment options were run using two slopes: 5 and 20 degrees; two organic carbon
contents: 1% or 5%; and two chemical options as detailed below.
APPLES
Option A (Lowest rate &/or frequency)
Option B (Highest rate &/or frequency)
Rate (L or kg/ha)
Frequency Rate (L or kg/ha)
Frequency
Endosulfan 1.9 1 5.7 1 Carbaryl 5 1 5.6 1 Metiram 4.9 3 6 4 Diquat/paraquat 2.8 1 2.8 4 Captan 3 2 3 5 Trifloxystrobin 0.2 2 0.2 3 Table 6A. PIRI assessment of chemicals used in apple production for numerous scenarios. MOBILITY APPLES Option A (Lowest rate
&/or frequency) Option B (Highest rate &/or frequency)
% OC
slope Exc/very high
High Med Exc/very high High Med
1 5 Mancozeb Ethefon Paraquat
Diquat Thiram Metiram
Propargite Simazine2 Parathion methyl1
Trifloxy-strobin Carbaryl
Paraquat Diquat Mancozeb Ethefon
Thiram Metiram
Propargite Simazine2 Captan Endosulfan Parathion methyl1 Trifloxy-strobin Carbaryl
3 5 Mancozeb Ethefon Paraquat
Diquat Thiram Metiram
Propargite Simazine2 Parathion methyl1
Paraquat Diquat Mancozeb Ethefon
Thiram Metiram
Propargite Simazine2 Captan Endosulfan Parathion methyl1
PESTICIDE USE IN 6TH CREEK SUBCATCHMENT, MT LOFTY RANGES
CSIRO Land and Water Page 17
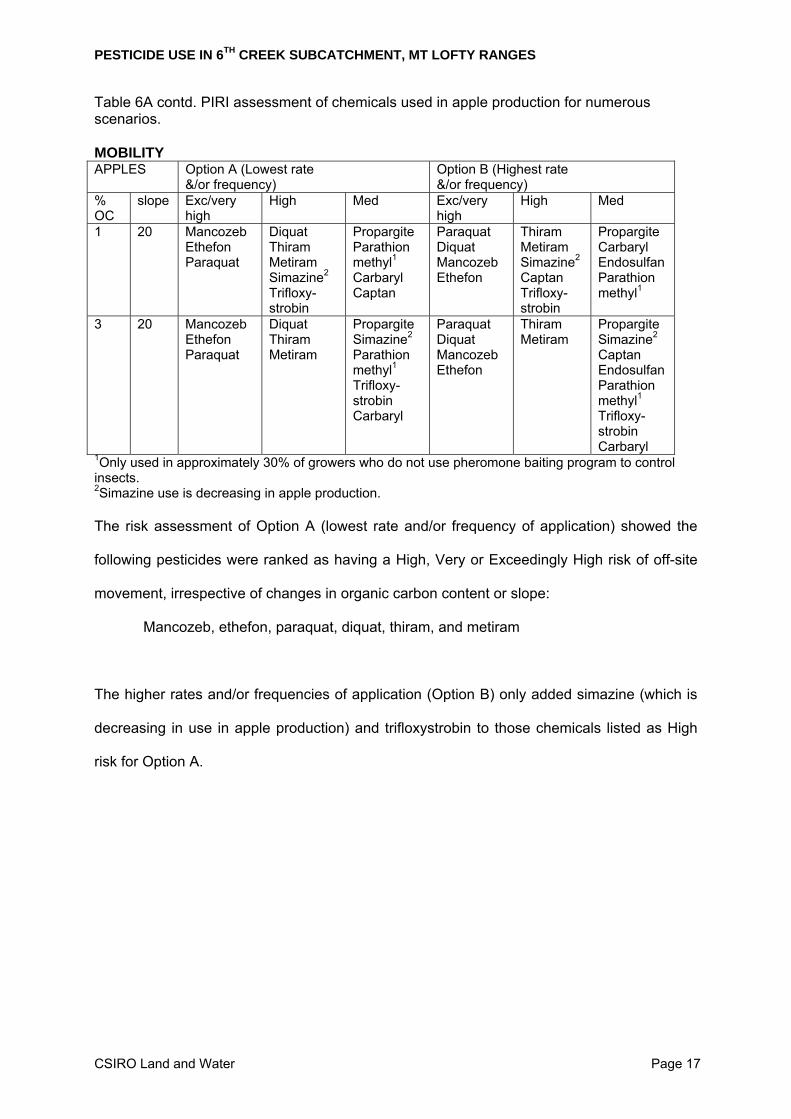
Table 6A contd. PIRI assessment of chemicals used in apple production for numerous scenarios. MOBILITY APPLES Option A (Lowest rate
&/or frequency) Option B (Highest rate &/or frequency)
% OC
slope Exc/very high
High Med Exc/very high
High Med
1 20 Mancozeb Ethefon Paraquat
Diquat Thiram Metiram Simazine2 Trifloxy-strobin
Propargite Parathion methyl1 Carbaryl Captan
Paraquat Diquat Mancozeb Ethefon
Thiram Metiram Simazine2 Captan Trifloxy-strobin
Propargite Carbaryl Endosulfan Parathion methyl1
3 20 Mancozeb Ethefon Paraquat
Diquat Thiram Metiram
Propargite Simazine2 Parathion methyl1 Trifloxy-strobin Carbaryl
Paraquat Diquat Mancozeb Ethefon
Thiram Metiram
Propargite Simazine2 Captan Endosulfan Parathion methyl1 Trifloxy-strobin Carbaryl
1Only used in approximately 30% of growers who do not use pheromone baiting program to control insects. 2Simazine use is decreasing in apple production. The risk assessment of Option A (lowest rate and/or frequency of application) showed the
following pesticides were ranked as having a High, Very or Exceedingly High risk of off-site
movement, irrespective of changes in organic carbon content or slope:
Mancozeb, ethefon, paraquat, diquat, thiram, and metiram
The higher rates and/or frequencies of application (Option B) only added simazine (which is
decreasing in use in apple production) and trifloxystrobin to those chemicals listed as High
risk for Option A.
PESTICIDE USE IN 6TH CREEK SUBCATCHMENT, MT LOFTY RANGES
CSIRO Land and Water Page 18
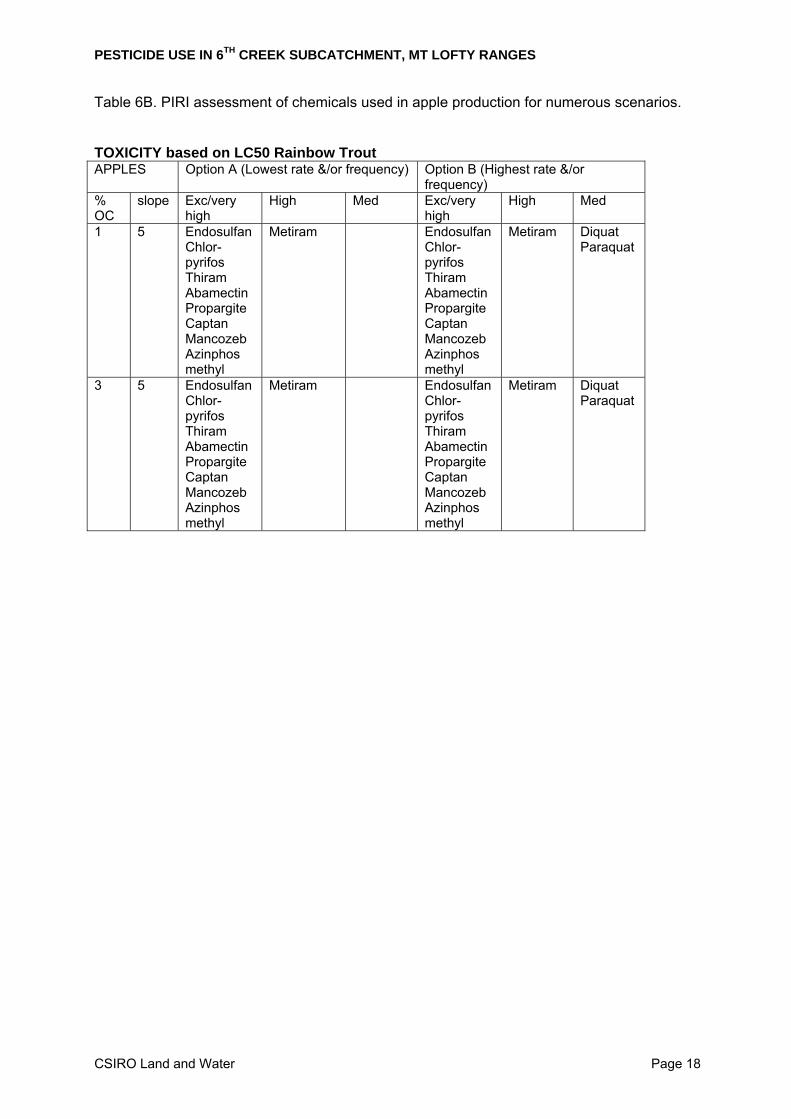
Table 6B. PIRI assessment of chemicals used in apple production for numerous scenarios.
TOXICITY based on LC50 Rainbow Trout APPLES Option A (Lowest rate &/or frequency) Option B (Highest rate &/or
frequency) % OC
slope Exc/very high
High Med Exc/very high
High Med
1 5 Endosulfan Chlor-pyrifos Thiram Abamectin Propargite Captan Mancozeb Azinphos methyl
Metiram Endosulfan Chlor-pyrifos Thiram Abamectin Propargite Captan Mancozeb Azinphos methyl
Metiram Diquat Paraquat
3 5 Endosulfan Chlor-pyrifos Thiram Abamectin Propargite Captan Mancozeb Azinphos methyl
Metiram Endosulfan Chlor-pyrifos Thiram Abamectin Propargite Captan Mancozeb Azinphos methyl
Metiram Diquat Paraquat
PESTICIDE USE IN 6TH CREEK SUBCATCHMENT, MT LOFTY RANGES
CSIRO Land and Water Page 19
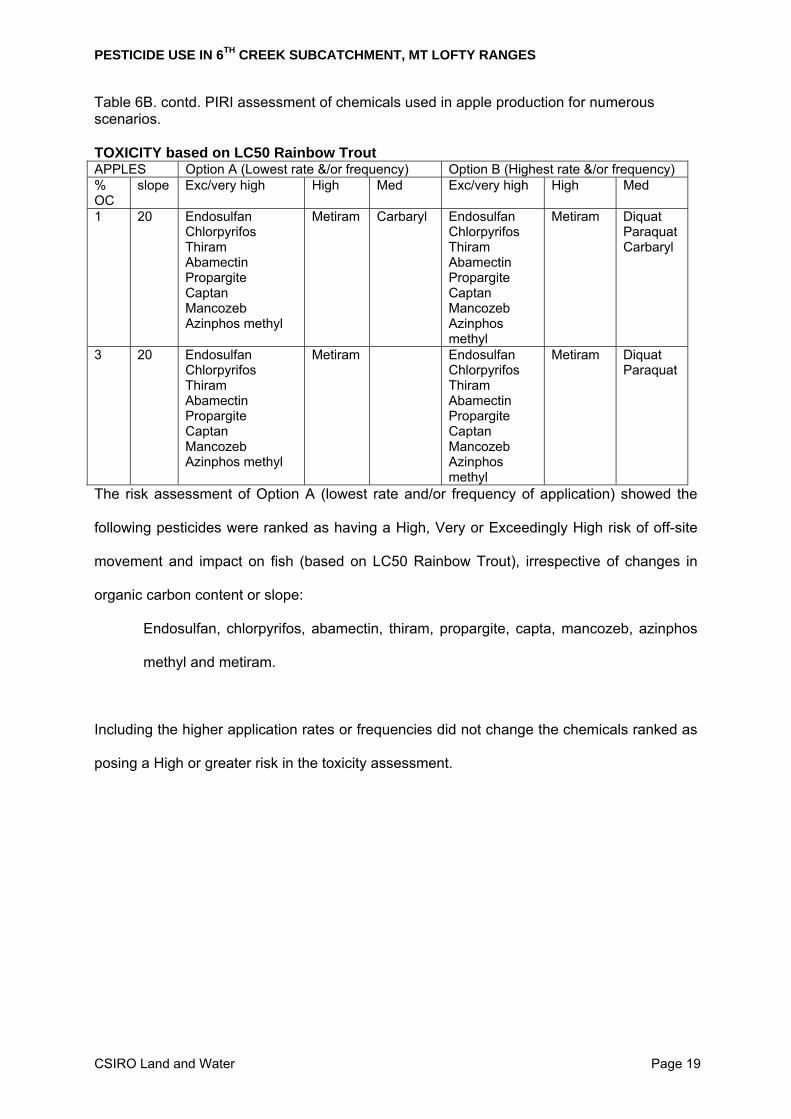
Table 6B. contd. PIRI assessment of chemicals used in apple production for numerous scenarios. TOXICITY based on LC50 Rainbow Trout APPLES Option A (Lowest rate &/or frequency) Option B (Highest rate &/or frequency) % OC
slope Exc/very high High Med Exc/very high High Med
1 20 Endosulfan Chlorpyrifos Thiram Abamectin Propargite Captan Mancozeb Azinphos methyl
Metiram Carbaryl Endosulfan Chlorpyrifos Thiram Abamectin Propargite Captan Mancozeb Azinphos methyl
Metiram Diquat Paraquat Carbaryl
3 20 Endosulfan Chlorpyrifos Thiram Abamectin Propargite Captan Mancozeb Azinphos methyl
Metiram Endosulfan Chlorpyrifos Thiram Abamectin Propargite Captan Mancozeb Azinphos methyl
Metiram Diquat Paraquat
The risk assessment of Option A (lowest rate and/or frequency of application) showed the
following pesticides were ranked as having a High, Very or Exceedingly High risk of off-site
movement and impact on fish (based on LC50 Rainbow Trout), irrespective of changes in
organic carbon content or slope:
Endosulfan, chlorpyrifos, abamectin, thiram, propargite, capta, mancozeb, azinphos
methyl and metiram.
Including the higher application rates or frequencies did not change the chemicals ranked as
posing a High or greater risk in the toxicity assessment.
PESTICIDE USE IN 6TH CREEK SUBCATCHMENT, MT LOFTY RANGES
CSIRO Land and Water Page 20
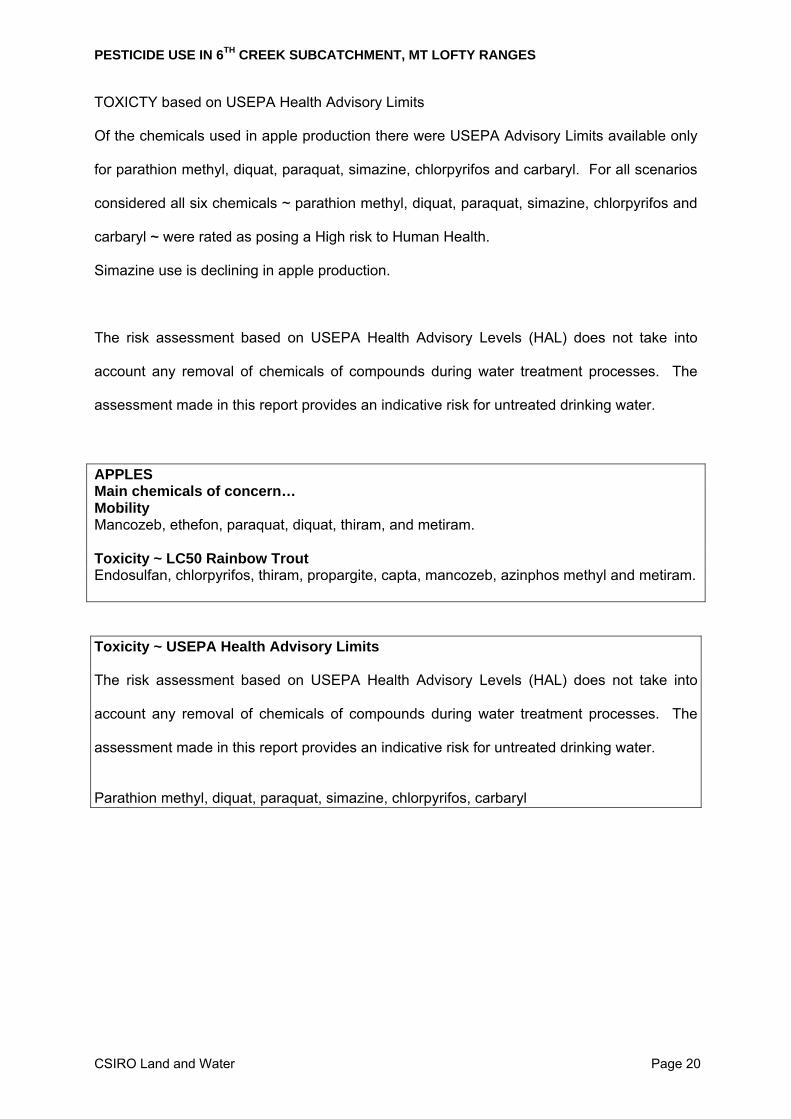
TOXICTY based on USEPA Health Advisory Limits
Of the chemicals used in apple production there were USEPA Advisory Limits available only
for parathion methyl, diquat, paraquat, simazine, chlorpyrifos and carbaryl. For all scenarios
considered all six chemicals ~ parathion methyl, diquat, paraquat, simazine, chlorpyrifos and
carbaryl ~ were rated as posing a High risk to Human Health.
Simazine use is declining in apple production.
The risk assessment based on USEPA Health Advisory Levels (HAL) does not take into
account any removal of chemicals of compounds during water treatment processes. The
assessment made in this report provides an indicative risk for untreated drinking water.
APPLES Main chemicals of concern… Mobility Mancozeb, ethefon, paraquat, diquat, thiram, and metiram. Toxicity ~ LC50 Rainbow Trout Endosulfan, chlorpyrifos, thiram, propargite, capta, mancozeb, azinphos methyl and metiram.
Toxicity ~ USEPA Health Advisory Limits The risk assessment based on USEPA Health Advisory Levels (HAL) does not take into
account any removal of chemicals of compounds during water treatment processes. The
assessment made in this report provides an indicative risk for untreated drinking water.
Parathion methyl, diquat, paraquat, simazine, chlorpyrifos, carbaryl
PESTICIDE USE IN 6TH CREEK SUBCATCHMENT, MT LOFTY RANGES
CSIRO Land and Water Page 21
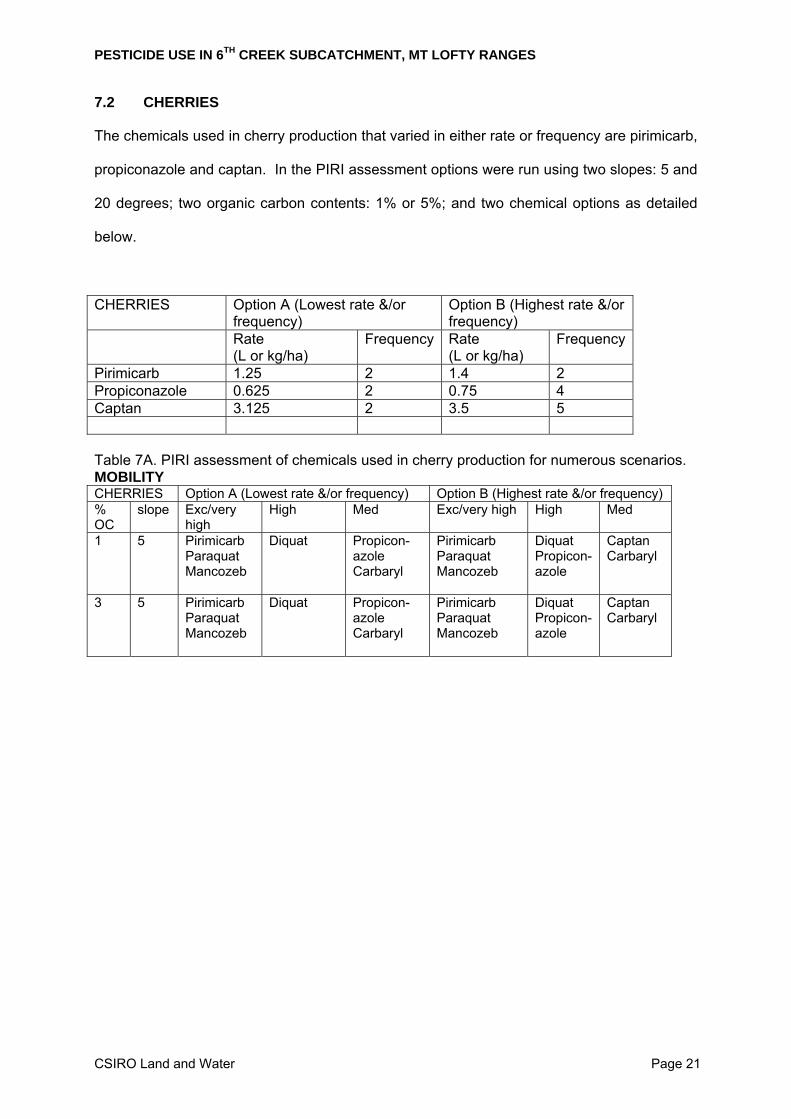
7.2 CHERRIES
The chemicals used in cherry production that varied in either rate or frequency are pirimicarb,
propiconazole and captan. In the PIRI assessment options were run using two slopes: 5 and
20 degrees; two organic carbon contents: 1% or 5%; and two chemical options as detailed
below.
CHERRIES Option A (Lowest rate &/or frequency)
Option B (Highest rate &/or frequency)
Rate (L or kg/ha)
Frequency Rate (L or kg/ha)
Frequency
Pirimicarb 1.25 2 1.4 2 Propiconazole 0.625 2 0.75 4 Captan 3.125 2 3.5 5 Table 7A. PIRI assessment of chemicals used in cherry production for numerous scenarios. MOBILITY CHERRIES Option A (Lowest rate &/or frequency) Option B (Highest rate &/or frequency) % OC
slope Exc/very high
High Med Exc/very high High Med
1 5 Pirimicarb Paraquat Mancozeb
Diquat
Propicon-azole Carbaryl
Pirimicarb Paraquat Mancozeb
Diquat Propicon-azole
Captan Carbaryl
3 5 Pirimicarb Paraquat Mancozeb
Diquat
Propicon-azole Carbaryl
Pirimicarb Paraquat Mancozeb
Diquat Propicon-azole
Captan Carbaryl
PESTICIDE USE IN 6TH CREEK SUBCATCHMENT, MT LOFTY RANGES
CSIRO Land and Water Page 22
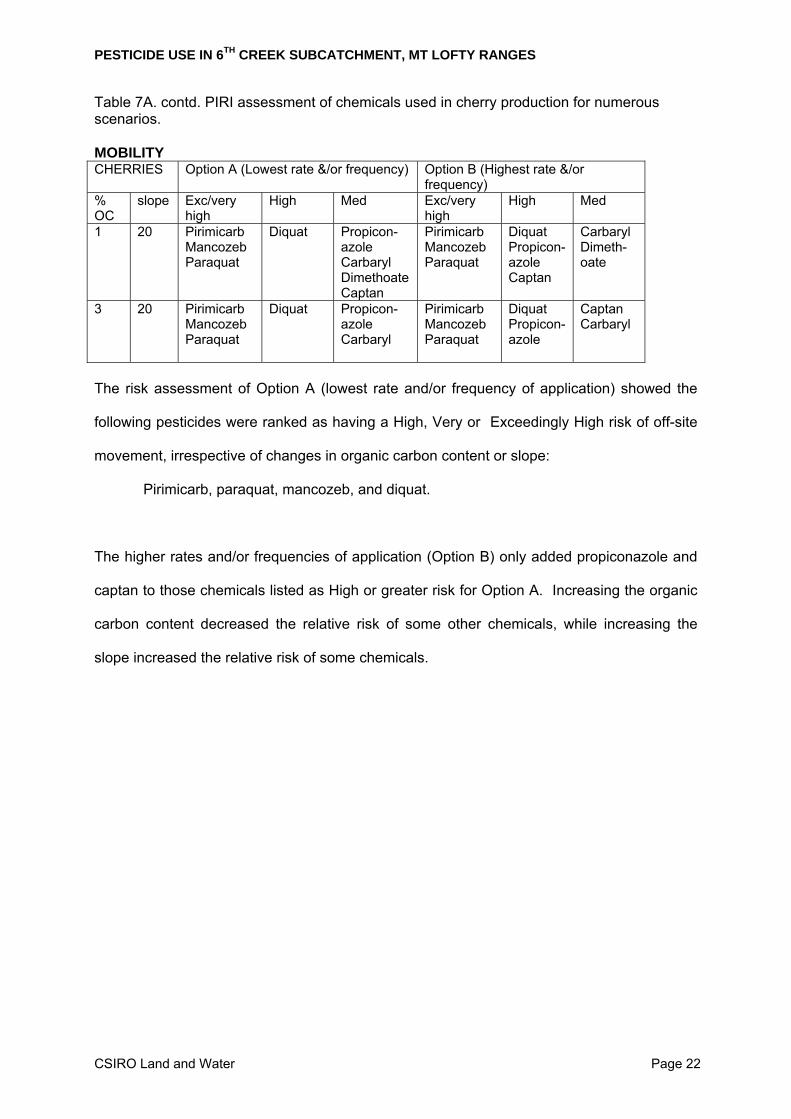
Table 7A. contd. PIRI assessment of chemicals used in cherry production for numerous scenarios. MOBILITY CHERRIES Option A (Lowest rate &/or frequency) Option B (Highest rate &/or
frequency) % OC
slope Exc/very high
High Med Exc/very high
High Med
1 20 Pirimicarb Mancozeb Paraquat
Diquat
Propicon-azole Carbaryl Dimethoate Captan
Pirimicarb Mancozeb Paraquat
Diquat Propicon-azole Captan
Carbaryl Dimeth-oate
3 20 Pirimicarb Mancozeb Paraquat
Diquat
Propicon-azole Carbaryl
Pirimicarb Mancozeb Paraquat
Diquat Propicon-azole
Captan Carbaryl
The risk assessment of Option A (lowest rate and/or frequency of application) showed the
following pesticides were ranked as having a High, Very or Exceedingly High risk of off-site
movement, irrespective of changes in organic carbon content or slope:
Pirimicarb, paraquat, mancozeb, and diquat.
The higher rates and/or frequencies of application (Option B) only added propiconazole and
captan to those chemicals listed as High or greater risk for Option A. Increasing the organic
carbon content decreased the relative risk of some other chemicals, while increasing the
slope increased the relative risk of some chemicals.
PESTICIDE USE IN 6TH CREEK SUBCATCHMENT, MT LOFTY RANGES
CSIRO Land and Water Page 23
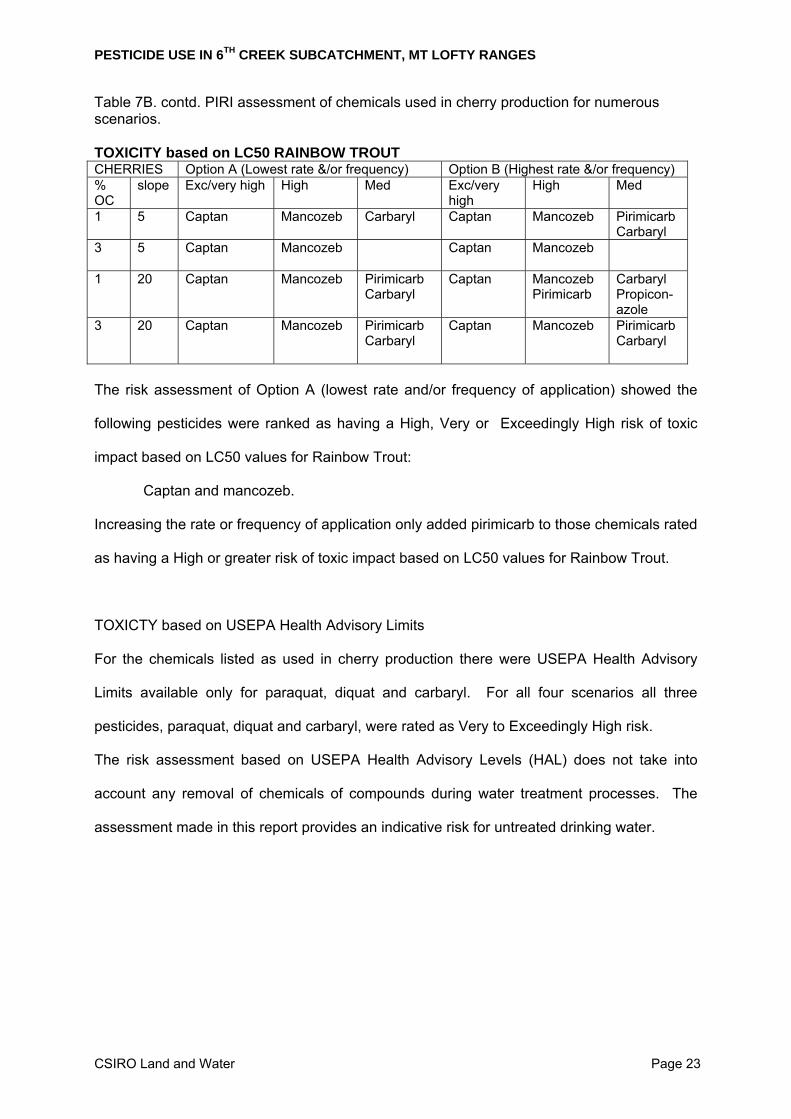
Table 7B. contd. PIRI assessment of chemicals used in cherry production for numerous scenarios. TOXICITY based on LC50 RAINBOW TROUT CHERRIES Option A (Lowest rate &/or frequency) Option B (Highest rate &/or frequency) % OC
slope Exc/very high High Med Exc/very high
High Med
1 5 Captan Mancozeb Carbaryl
Captan Mancozeb Pirimicarb Carbaryl
3 5 Captan
Mancozeb Captan Mancozeb
1 20 Captan
Mancozeb Pirimicarb Carbaryl
Captan Mancozeb Pirimicarb
Carbaryl Propicon- azole
3 20 Captan
Mancozeb Pirimicarb Carbaryl
Captan Mancozeb
Pirimicarb Carbaryl
The risk assessment of Option A (lowest rate and/or frequency of application) showed the
following pesticides were ranked as having a High, Very or Exceedingly High risk of toxic
impact based on LC50 values for Rainbow Trout:
Captan and mancozeb.
Increasing the rate or frequency of application only added pirimicarb to those chemicals rated
as having a High or greater risk of toxic impact based on LC50 values for Rainbow Trout.
TOXICTY based on USEPA Health Advisory Limits
For the chemicals listed as used in cherry production there were USEPA Health Advisory
Limits available only for paraquat, diquat and carbaryl. For all four scenarios all three
pesticides, paraquat, diquat and carbaryl, were rated as Very to Exceedingly High risk.
The risk assessment based on USEPA Health Advisory Levels (HAL) does not take into
account any removal of chemicals of compounds during water treatment processes. The
assessment made in this report provides an indicative risk for untreated drinking water.
PESTICIDE USE IN 6TH CREEK SUBCATCHMENT, MT LOFTY RANGES
CSIRO Land and Water Page 24
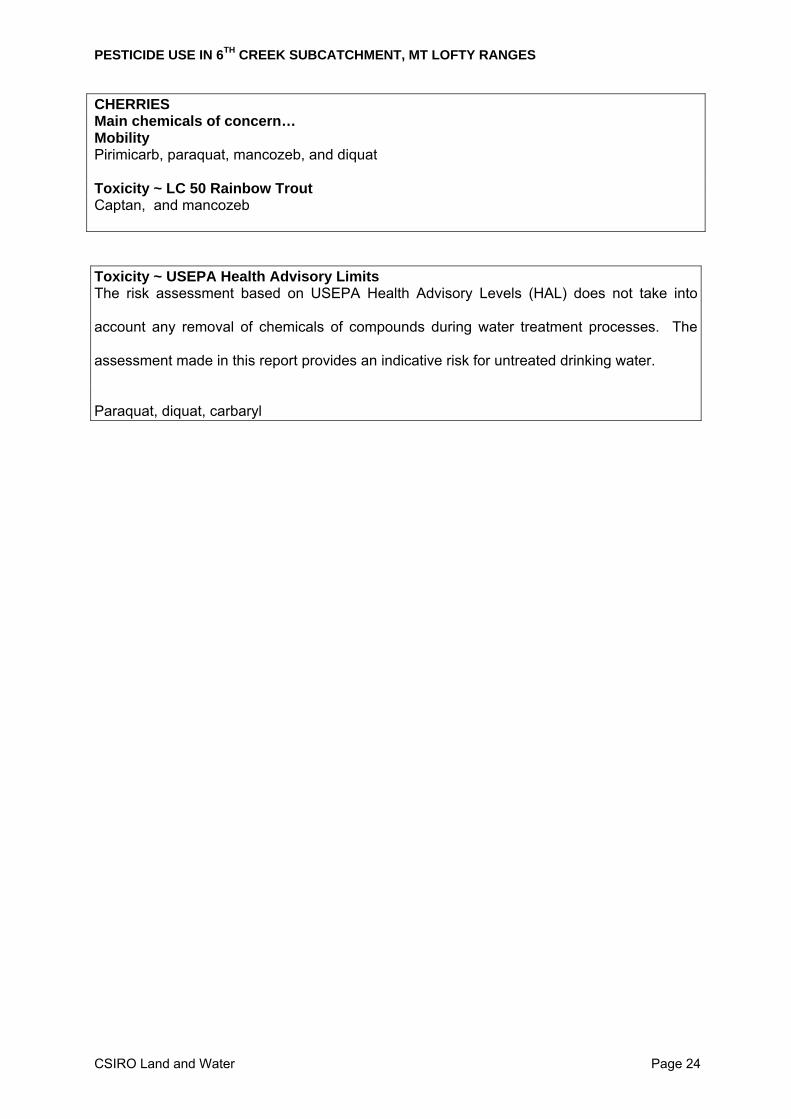
CHERRIES Main chemicals of concern… Mobility Pirimicarb, paraquat, mancozeb, and diquat Toxicity ~ LC 50 Rainbow Trout Captan, and mancozeb
Toxicity ~ USEPA Health Advisory Limits The risk assessment based on USEPA Health Advisory Levels (HAL) does not take into
account any removal of chemicals of compounds during water treatment processes. The
assessment made in this report provides an indicative risk for untreated drinking water.
Paraquat, diquat, carbaryl
PESTICIDE USE IN 6TH CREEK SUBCATCHMENT, MT LOFTY RANGES
CSIRO Land and Water Page 25
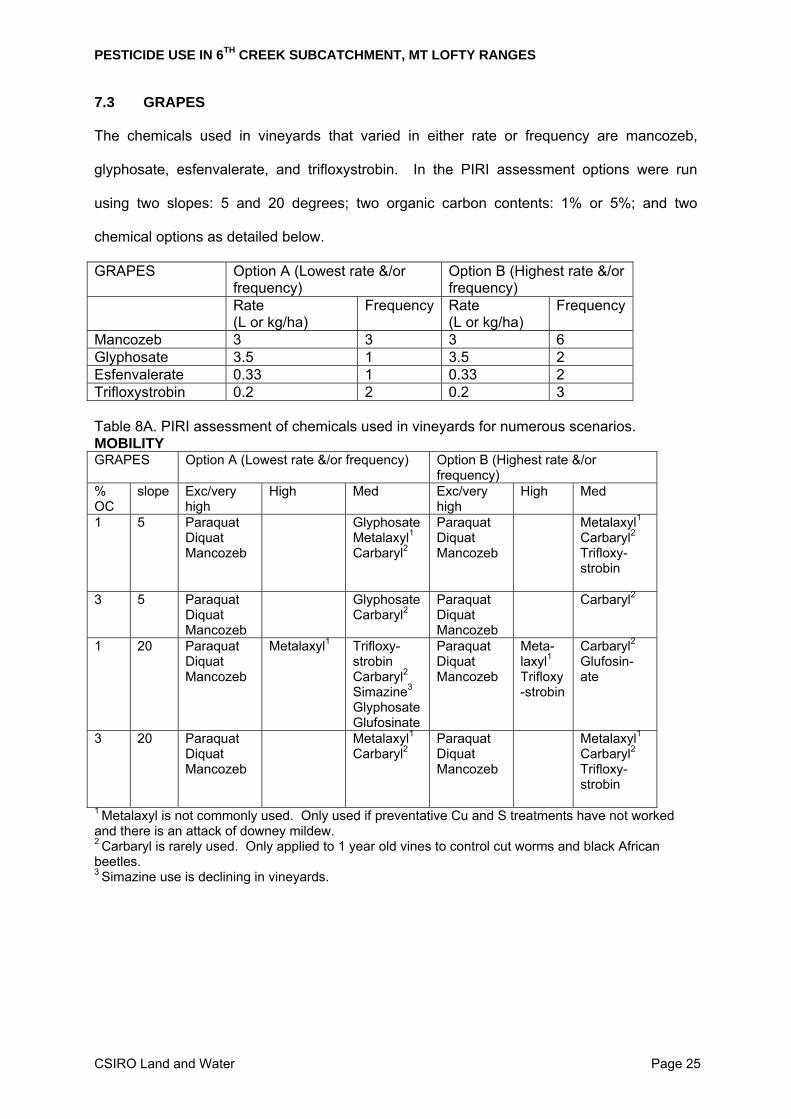
7.3 GRAPES
The chemicals used in vineyards that varied in either rate or frequency are mancozeb,
glyphosate, esfenvalerate, and trifloxystrobin. In the PIRI assessment options were run
using two slopes: 5 and 20 degrees; two organic carbon contents: 1% or 5%; and two
chemical options as detailed below.
GRAPES Option A (Lowest rate &/or frequency)
Option B (Highest rate &/or frequency)
Rate (L or kg/ha)
Frequency Rate (L or kg/ha)
Frequency
Mancozeb 3 3 3 6 Glyphosate 3.5 1 3.5 2 Esfenvalerate 0.33 1 0.33 2 Trifloxystrobin 0.2 2 0.2 3 Table 8A. PIRI assessment of chemicals used in vineyards for numerous scenarios. MOBILITY GRAPES Option A (Lowest rate &/or frequency) Option B (Highest rate &/or
frequency) % OC
slope Exc/very high
High Med Exc/very high
High Med
1 5 Paraquat Diquat Mancozeb
Glyphosate Metalaxyl1
Carbaryl2
Paraquat Diquat Mancozeb
Metalaxyl1 Carbaryl2 Trifloxy-strobin
3 5 Paraquat Diquat Mancozeb
Glyphosate Carbaryl2
Paraquat Diquat Mancozeb
Carbaryl2
1 20 Paraquat Diquat Mancozeb
Metalaxyl1 Trifloxy-strobin Carbaryl2 Simazine3 Glyphosate Glufosinate
Paraquat Diquat Mancozeb
Meta-laxyl1 Trifloxy-strobin
Carbaryl2 Glufosin-ate
3 20 Paraquat Diquat Mancozeb
Metalaxyl1 Carbaryl2
Paraquat Diquat Mancozeb
Metalaxyl1 Carbaryl2 Trifloxy-strobin
1 Metalaxyl is not commonly used. Only used if preventative Cu and S treatments have not worked and there is an attack of downey mildew. 2 Carbaryl is rarely used. Only applied to 1 year old vines to control cut worms and black African beetles. 3 Simazine use is declining in vineyards.
PESTICIDE USE IN 6TH CREEK SUBCATCHMENT, MT LOFTY RANGES
CSIRO Land and Water Page 26
The following pesticides were ranked as having an exceedingly or very high risk of off-site
movement, irrespective of changes in organic carbon content or slope:
Mancozeb, paraquat and diquat.
The higher rates and/or frequencies of application (Option B) only added paraquat and
carbaryl to those chemicals listed for Option A. Increasing the organic carbon content
decreased the relative risk of some other chemicals, while increasing the slope increased the
relative risk of some chemicals.
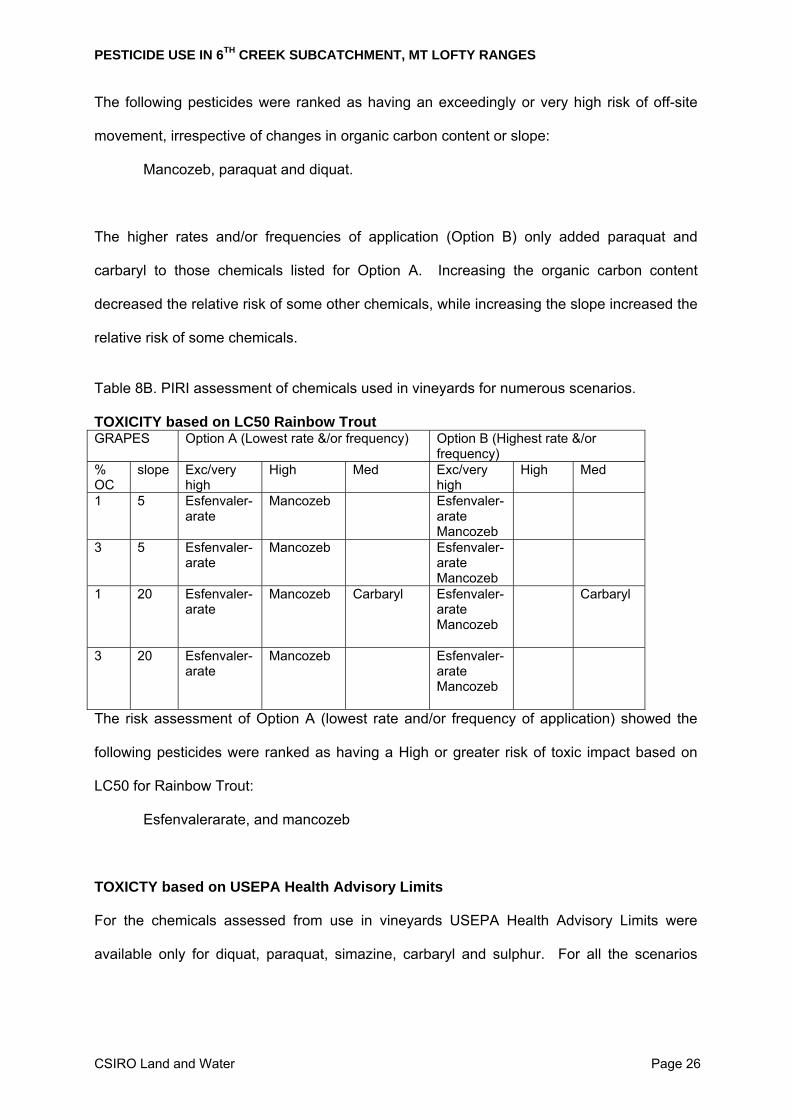
Table 8B. PIRI assessment of chemicals used in vineyards for numerous scenarios. TOXICITY based on LC50 Rainbow Trout GRAPES Option A (Lowest rate &/or frequency) Option B (Highest rate &/or
frequency) % OC
slope Exc/very high
High Med Exc/very high
High Med
1 5 Esfenvaler-arate
Mancozeb Esfenvaler-arate Mancozeb
3 5 Esfenvaler-arate
Mancozeb Esfenvaler-arate Mancozeb
1 20 Esfenvaler-arate
Mancozeb
Carbaryl Esfenvaler-arate Mancozeb
Carbaryl
3 20 Esfenvaler-arate
Mancozeb Esfenvaler-arate Mancozeb
The risk assessment of Option A (lowest rate and/or frequency of application) showed the
following pesticides were ranked as having a High or greater risk of toxic impact based on
LC50 for Rainbow Trout:
Esfenvalerarate, and mancozeb
TOXICTY based on USEPA Health Advisory Limits
For the chemicals assessed from use in vineyards USEPA Health Advisory Limits were
available only for diquat, paraquat, simazine, carbaryl and sulphur. For all the scenarios
PESTICIDE USE IN 6TH CREEK SUBCATCHMENT, MT LOFTY RANGES
CSIRO Land and Water Page 27
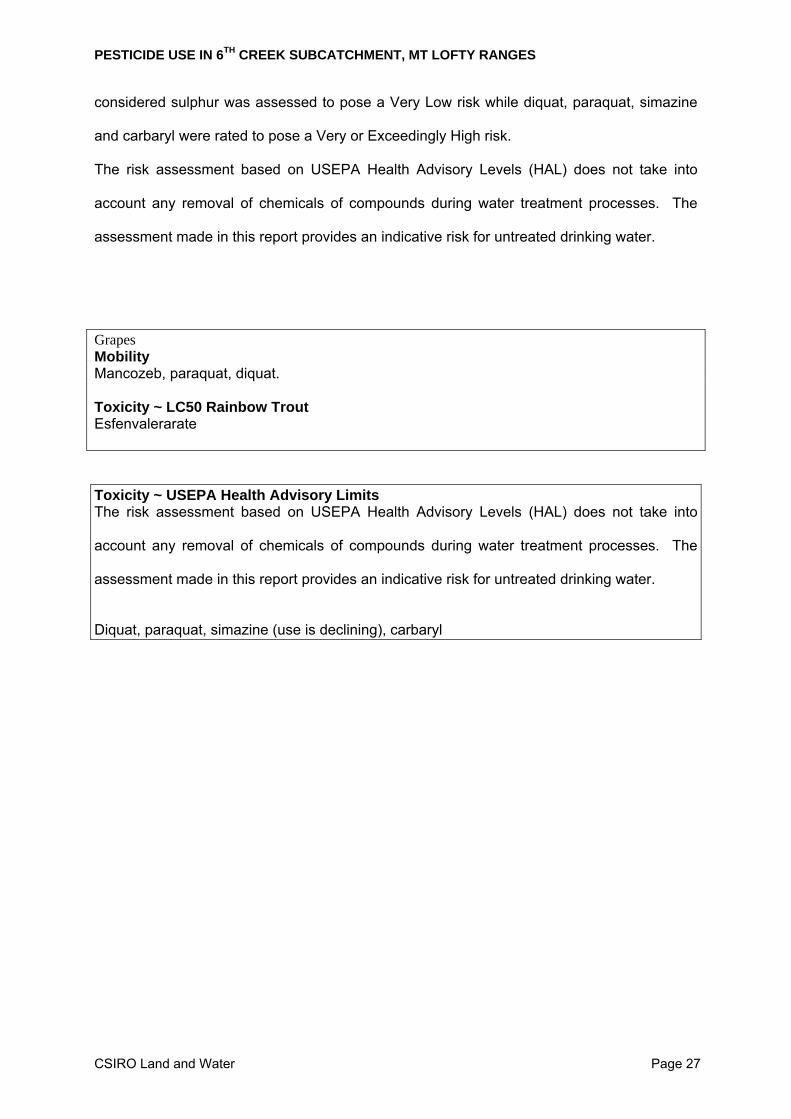
considered sulphur was assessed to pose a Very Low risk while diquat, paraquat, simazine
and carbaryl were rated to pose a Very or Exceedingly High risk.
The risk assessment based on USEPA Health Advisory Levels (HAL) does not take into
account any removal of chemicals of compounds during water treatment processes. The
assessment made in this report provides an indicative risk for untreated drinking water.
Grapes Mobility Mancozeb, paraquat, diquat. Toxicity ~ LC50 Rainbow Trout Esfenvalerarate
Toxicity ~ USEPA Health Advisory Limits The risk assessment based on USEPA Health Advisory Levels (HAL) does not take into
account any removal of chemicals of compounds during water treatment processes. The
assessment made in this report provides an indicative risk for untreated drinking water.
Diquat, paraquat, simazine (use is declining), carbaryl
PESTICIDE USE IN 6TH CREEK SUBCATCHMENT, MT LOFTY RANGES
CSIRO Land and Water Page 28
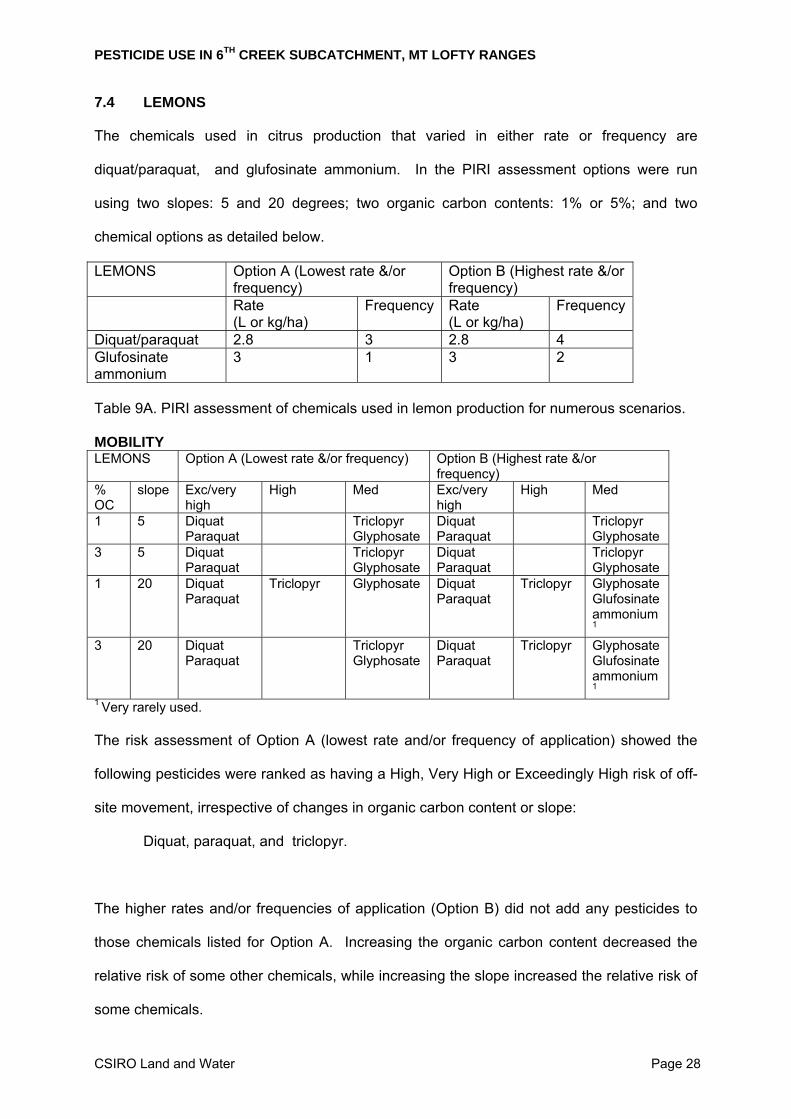
7.4 LEMONS
The chemicals used in citrus production that varied in either rate or frequency are
diquat/paraquat, and glufosinate ammonium. In the PIRI assessment options were run
using two slopes: 5 and 20 degrees; two organic carbon contents: 1% or 5%; and two
chemical options as detailed below.
LEMONS Option A (Lowest rate &/or frequency)
Option B (Highest rate &/or frequency)
Rate (L or kg/ha)
Frequency Rate (L or kg/ha)
Frequency
Diquat/paraquat 2.8 3 2.8 4 Glufosinate ammonium
3 1 3 2
Table 9A. PIRI assessment of chemicals used in lemon production for numerous scenarios. MOBILITY LEMONS Option A (Lowest rate &/or frequency) Option B (Highest rate &/or
frequency) % OC
slope Exc/very high
High Med Exc/very high
High Med
1 5 Diquat Paraquat
Triclopyr Glyphosate
Diquat Paraquat
Triclopyr Glyphosate
3 5 Diquat Paraquat
Triclopyr Glyphosate
Diquat Paraquat
Triclopyr Glyphosate
1 20 Diquat Paraquat
Triclopyr
Glyphosate Diquat Paraquat
Triclopyr Glyphosate Glufosinate ammonium1
3 20 Diquat Paraquat
Triclopyr Glyphosate
Diquat Paraquat
Triclopyr Glyphosate Glufosinate ammonium1
1 Very rarely used. The risk assessment of Option A (lowest rate and/or frequency of application) showed the
following pesticides were ranked as having a High, Very High or Exceedingly High risk of off-
site movement, irrespective of changes in organic carbon content or slope:
Diquat, paraquat, and triclopyr.
The higher rates and/or frequencies of application (Option B) did not add any pesticides to
those chemicals listed for Option A. Increasing the organic carbon content decreased the
relative risk of some other chemicals, while increasing the slope increased the relative risk of
some chemicals.
PESTICIDE USE IN 6TH CREEK SUBCATCHMENT, MT LOFTY RANGES
CSIRO Land and Water Page 29
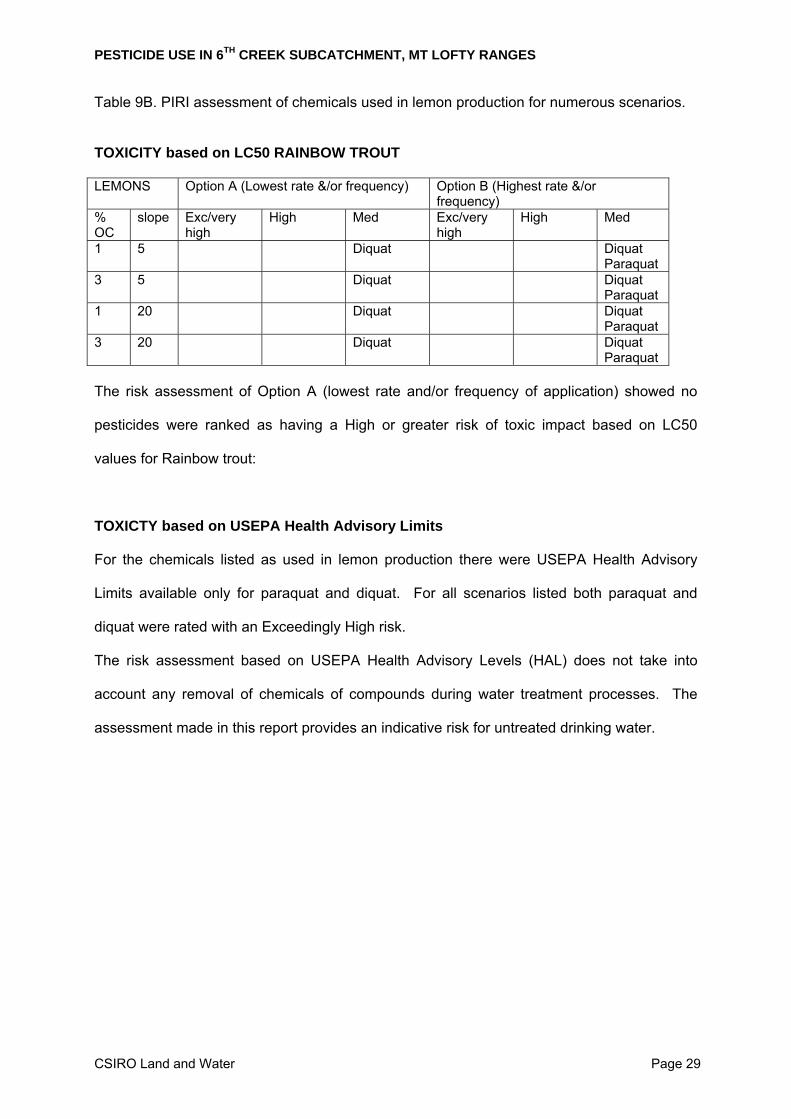
Table 9B. PIRI assessment of chemicals used in lemon production for numerous scenarios.
TOXICITY based on LC50 RAINBOW TROUT LEMONS Option A (Lowest rate &/or frequency) Option B (Highest rate &/or
frequency) % OC
slope Exc/very high
High Med Exc/very high
High Med
1 5 Diquat Diquat Paraquat
3 5 Diquat Diquat Paraquat
1 20 Diquat Diquat Paraquat
3 20 Diquat Diquat Paraquat
The risk assessment of Option A (lowest rate and/or frequency of application) showed no
pesticides were ranked as having a High or greater risk of toxic impact based on LC50
values for Rainbow trout:
TOXICTY based on USEPA Health Advisory Limits
For the chemicals listed as used in lemon production there were USEPA Health Advisory
Limits available only for paraquat and diquat. For all scenarios listed both paraquat and
diquat were rated with an Exceedingly High risk.
The risk assessment based on USEPA Health Advisory Levels (HAL) does not take into
account any removal of chemicals of compounds during water treatment processes. The
assessment made in this report provides an indicative risk for untreated drinking water.
PESTICIDE USE IN 6TH CREEK SUBCATCHMENT, MT LOFTY RANGES
CSIRO Land and Water Page 30
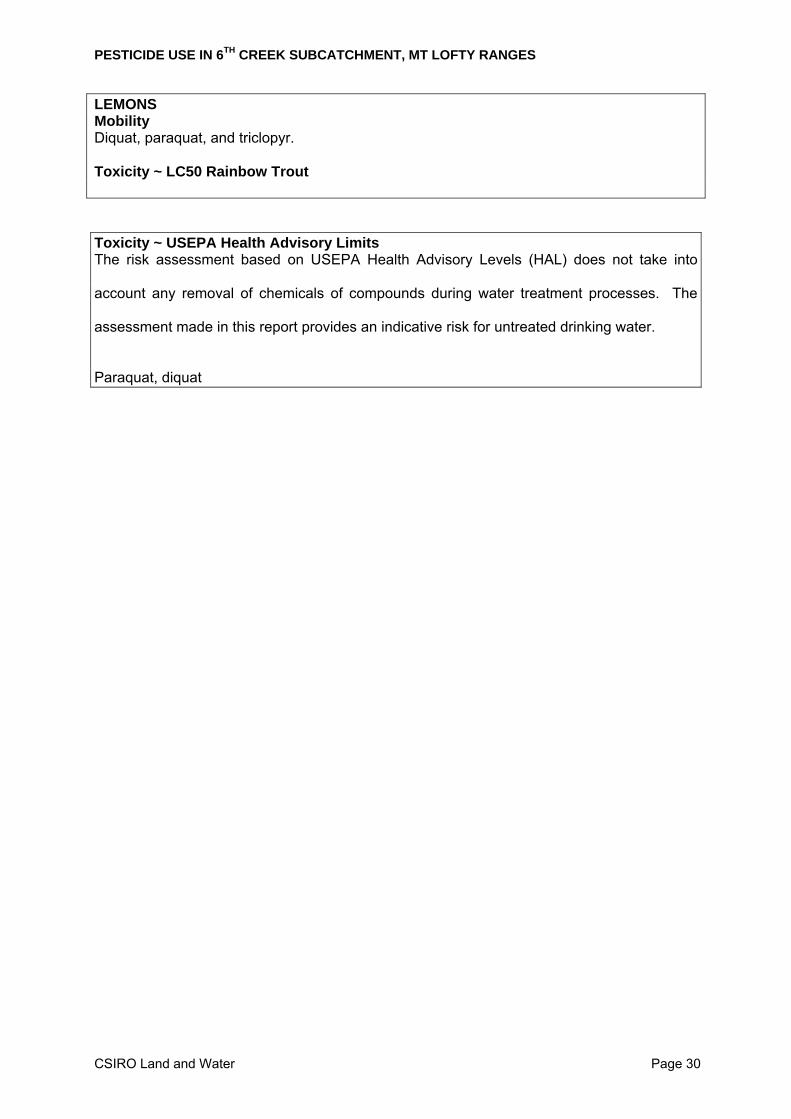
LEMONS Mobility Diquat, paraquat, and triclopyr. Toxicity ~ LC50 Rainbow Trout
Toxicity ~ USEPA Health Advisory Limits The risk assessment based on USEPA Health Advisory Levels (HAL) does not take into
account any removal of chemicals of compounds during water treatment processes. The
assessment made in this report provides an indicative risk for untreated drinking water.
Paraquat, diquat
PESTICIDE USE IN 6TH CREEK SUBCATCHMENT, MT LOFTY RANGES
CSIRO Land and Water Page 31
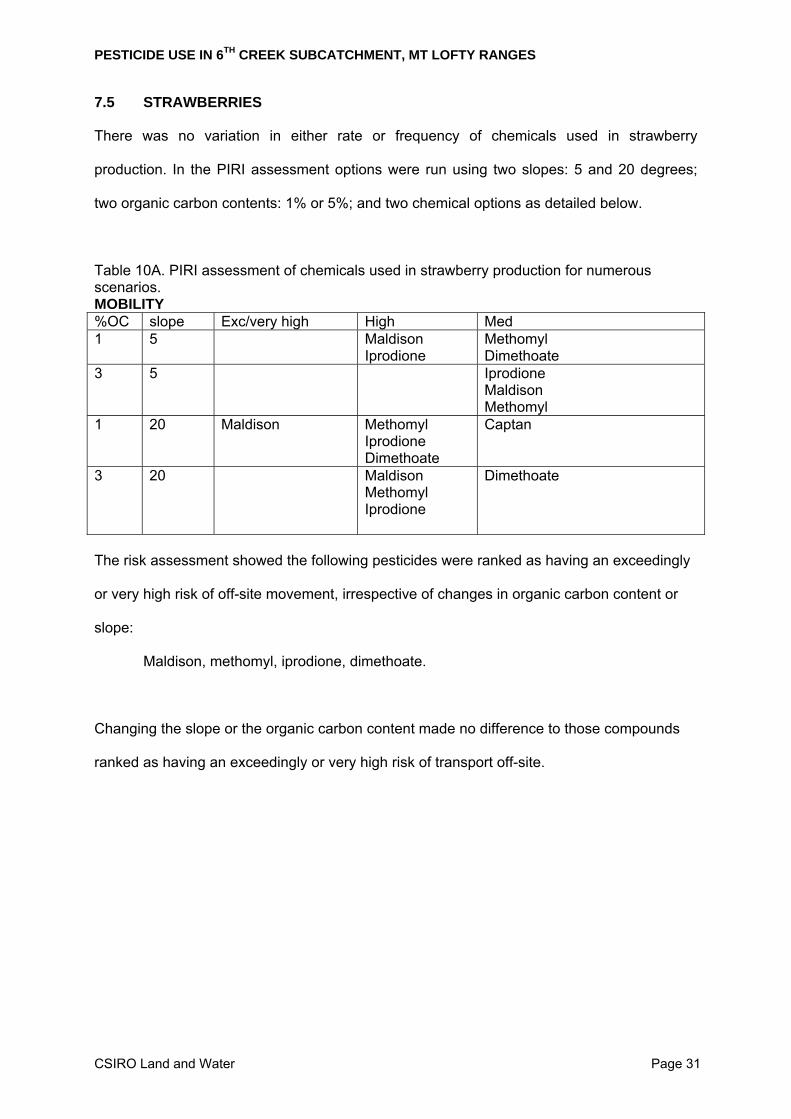
7.5 STRAWBERRIES
There was no variation in either rate or frequency of chemicals used in strawberry
production. In the PIRI assessment options were run using two slopes: 5 and 20 degrees;
two organic carbon contents: 1% or 5%; and two chemical options as detailed below.
Table 10A. PIRI assessment of chemicals used in strawberry production for numerous scenarios. MOBILITY %OC slope Exc/very high High Med 1 5 Maldison
Iprodione Methomyl Dimethoate
3 5 Iprodione Maldison Methomyl
1 20 Maldison Methomyl Iprodione Dimethoate
Captan
3 20 Maldison Methomyl Iprodione
Dimethoate
The risk assessment showed the following pesticides were ranked as having an exceedingly
or very high risk of off-site movement, irrespective of changes in organic carbon content or
slope:
Maldison, methomyl, iprodione, dimethoate.
Changing the slope or the organic carbon content made no difference to those compounds
ranked as having an exceedingly or very high risk of transport off-site.
PESTICIDE USE IN 6TH CREEK SUBCATCHMENT, MT LOFTY RANGES
CSIRO Land and Water Page 32
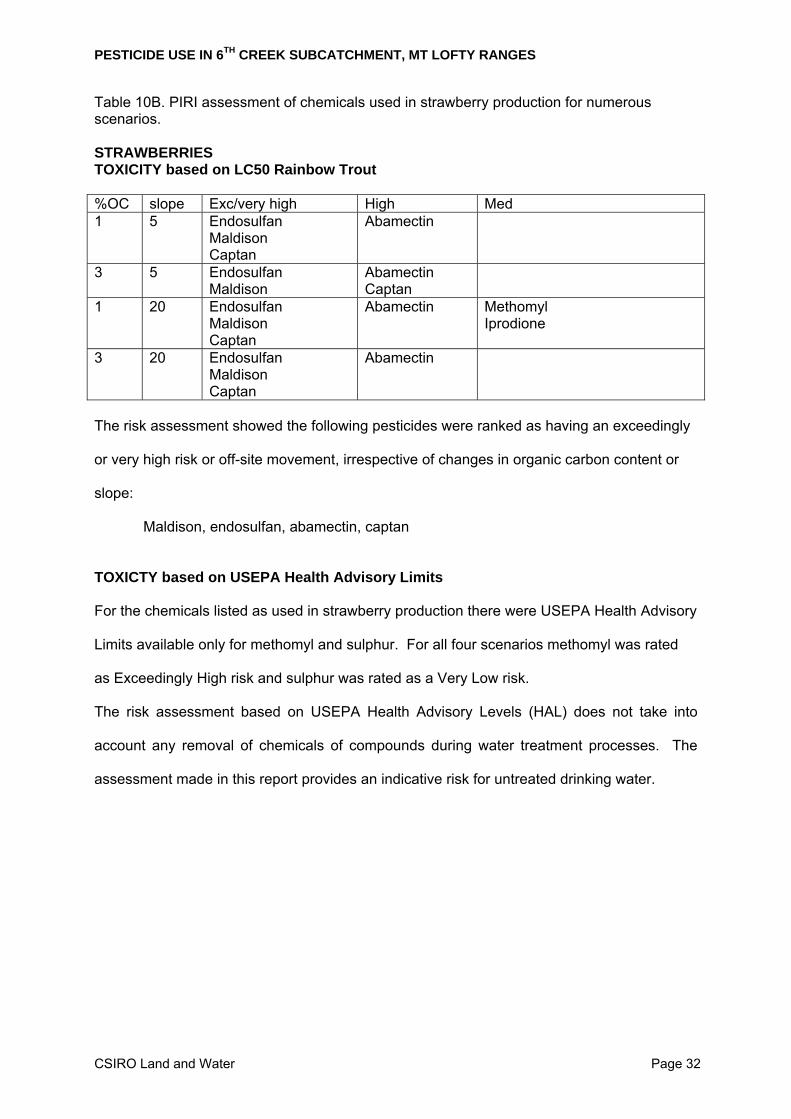
Table 10B. PIRI assessment of chemicals used in strawberry production for numerous scenarios. STRAWBERRIES TOXICITY based on LC50 Rainbow Trout %OC slope Exc/very high High Med 1 5 Endosulfan
Maldison Captan
Abamectin
3 5 Endosulfan Maldison
Abamectin Captan
1 20 Endosulfan Maldison Captan
Abamectin
Methomyl Iprodione
3 20 Endosulfan Maldison Captan
Abamectin
The risk assessment showed the following pesticides were ranked as having an exceedingly
or very high risk or off-site movement, irrespective of changes in organic carbon content or
slope:
Maldison, endosulfan, abamectin, captan TOXICTY based on USEPA Health Advisory Limits
For the chemicals listed as used in strawberry production there were USEPA Health Advisory
Limits available only for methomyl and sulphur. For all four scenarios methomyl was rated
as Exceedingly High risk and sulphur was rated as a Very Low risk.
The risk assessment based on USEPA Health Advisory Levels (HAL) does not take into
account any removal of chemicals of compounds during water treatment processes. The
assessment made in this report provides an indicative risk for untreated drinking water.
PESTICIDE USE IN 6TH CREEK SUBCATCHMENT, MT LOFTY RANGES
CSIRO Land and Water Page 33
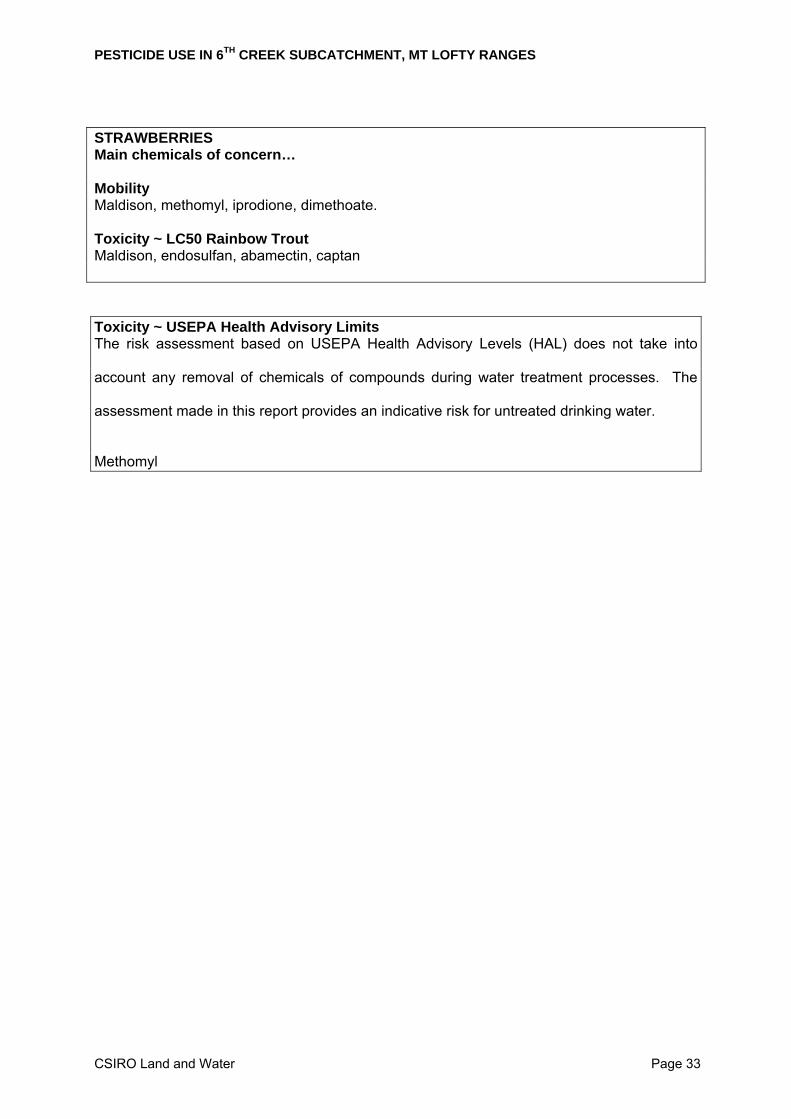
STRAWBERRIES Main chemicals of concern… Mobility Maldison, methomyl, iprodione, dimethoate. Toxicity ~ LC50 Rainbow Trout Maldison, endosulfan, abamectin, captan
Toxicity ~ USEPA Health Advisory Limits The risk assessment based on USEPA Health Advisory Levels (HAL) does not take into
account any removal of chemicals of compounds during water treatment processes. The
assessment made in this report provides an indicative risk for untreated drinking water.
Methomyl
PESTICIDE USE IN 6TH CREEK SUBCATCHMENT, MT LOFTY RANGES
CSIRO Land and Water Page 34
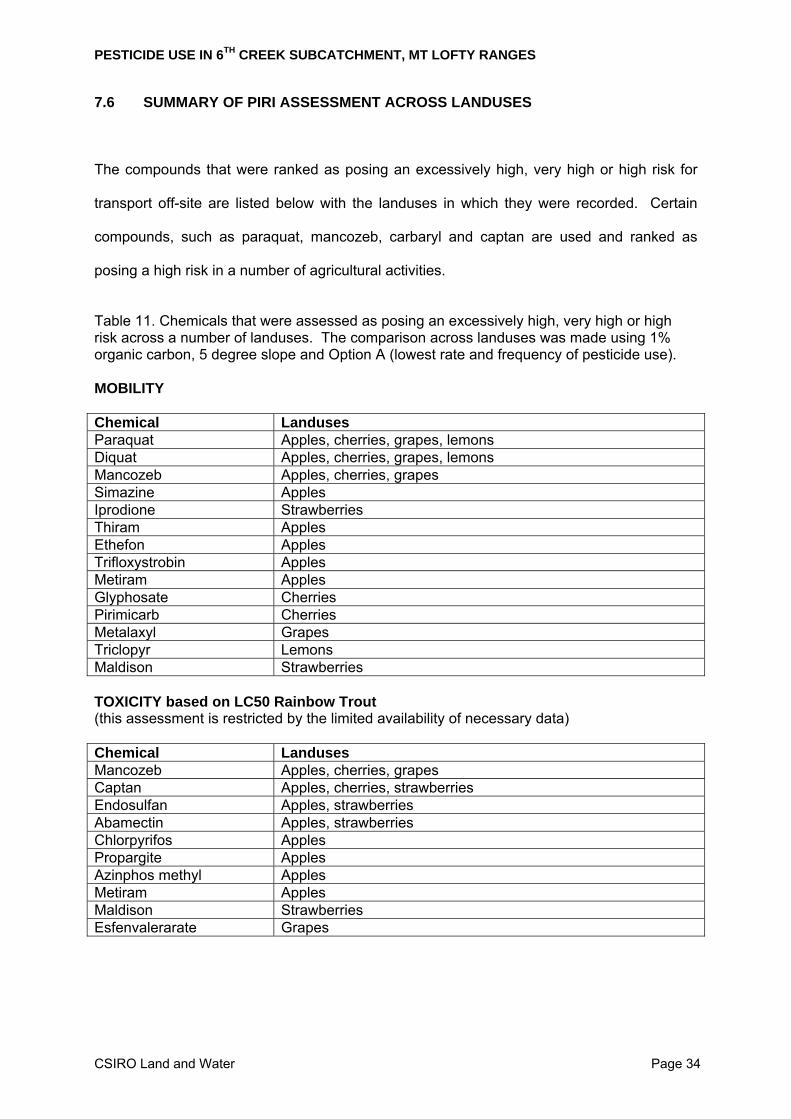
7.6 SUMMARY OF PIRI ASSESSMENT ACROSS LANDUSES
The compounds that were ranked as posing an excessively high, very high or high risk for
transport off-site are listed below with the landuses in which they were recorded. Certain
compounds, such as paraquat, mancozeb, carbaryl and captan are used and ranked as
posing a high risk in a number of agricultural activities.
Table 11. Chemicals that were assessed as posing an excessively high, very high or high risk across a number of landuses. The comparison across landuses was made using 1% organic carbon, 5 degree slope and Option A (lowest rate and frequency of pesticide use). MOBILITY Chemical Landuses Paraquat Apples, cherries, grapes, lemons Diquat Apples, cherries, grapes, lemons Mancozeb Apples, cherries, grapes Simazine Apples Iprodione Strawberries Thiram Apples Ethefon Apples Trifloxystrobin Apples Metiram Apples Glyphosate Cherries Pirimicarb Cherries Metalaxyl Grapes Triclopyr Lemons Maldison Strawberries TOXICITY based on LC50 Rainbow Trout (this assessment is restricted by the limited availability of necessary data) Chemical Landuses Mancozeb Apples, cherries, grapes Captan Apples, cherries, strawberries Endosulfan Apples, strawberries Abamectin Apples, strawberries Chlorpyrifos Apples Propargite Apples Azinphos methyl Apples Metiram Apples Maldison Strawberries Esfenvalerarate Grapes
PESTICIDE USE IN 6TH CREEK SUBCATCHMENT, MT LOFTY RANGES
CSIRO Land and Water Page 35
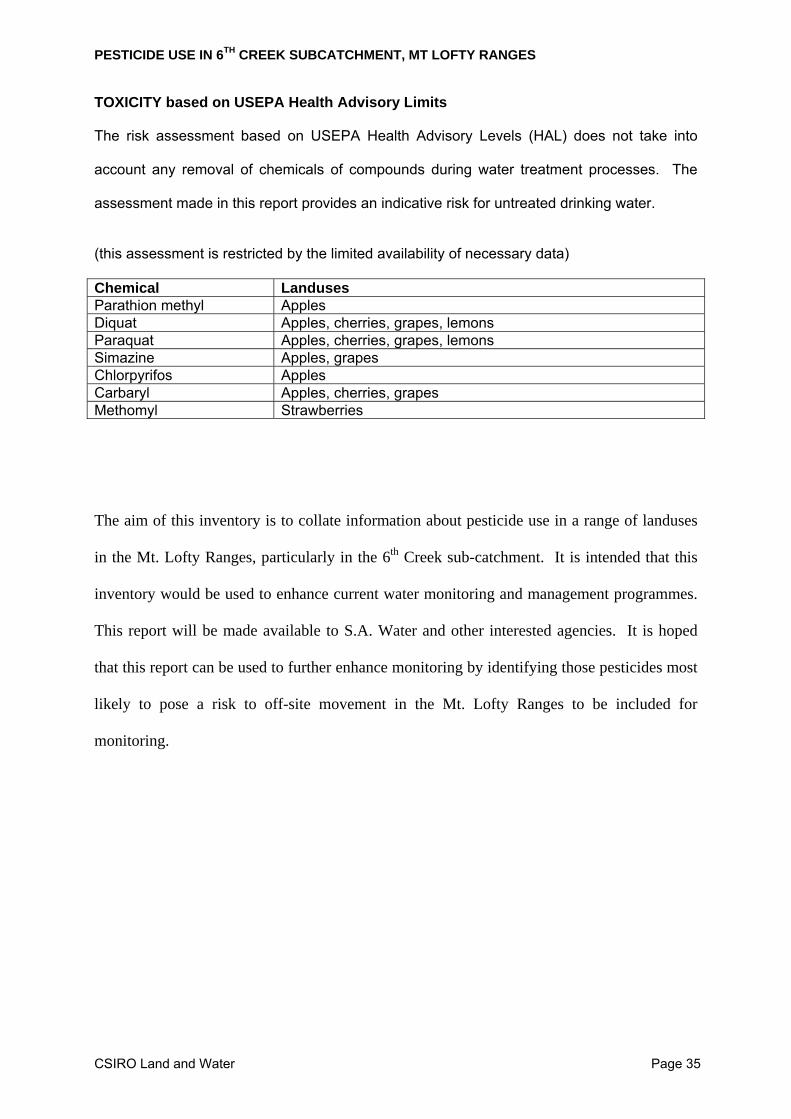
TOXICITY based on USEPA Health Advisory Limits The risk assessment based on USEPA Health Advisory Levels (HAL) does not take into
account any removal of chemicals of compounds during water treatment processes. The
assessment made in this report provides an indicative risk for untreated drinking water.
(this assessment is restricted by the limited availability of necessary data) Chemical Landuses Parathion methyl Apples Diquat Apples, cherries, grapes, lemons Paraquat Apples, cherries, grapes, lemons Simazine Apples, grapes Chlorpyrifos Apples Carbaryl Apples, cherries, grapes Methomyl Strawberries
The aim of this inventory is to collate information about pesticide use in a range of landuses
in the Mt. Lofty Ranges, particularly in the 6th Creek sub-catchment. It is intended that this
inventory would be used to enhance current water monitoring and management programmes.
This report will be made available to S.A. Water and other interested agencies. It is hoped
that this report can be used to further enhance monitoring by identifying those pesticides most
likely to pose a risk to off-site movement in the Mt. Lofty Ranges to be included for
monitoring.
PESTICIDE USE IN 6TH CREEK SUBCATCHMENT, MT LOFTY RANGES
CSIRO Land and Water Page 36
APPENDIX 1
Pesticide Impact Rating Index (PIRI) : For Minimising Off-Site Impacts of Pesticides
Rai Kookana, CSIRO Land and Water,
Ray Correll and Ros Miller, CSIRO Mathematics and Information Sciences,
PMB No 2, Glen Osmond, 5064, Australia
Systematic methods that allow a relative assessment of potential impact of pesticides on water quality are of great value to both pesticide users and regulators in choosing the pesticides and practices with the least detrimental impact. A water quality risk indicator for pesticides, namely Pesticide Impact Rating Index (PIRI), has been developed by CSIRO with support from Land and Water Australia and other agencies. PIRI is a simple screening tool to assess relative risk of pesticides or cropping systems in terms of their potential impact on surface water or groundwater quality and ecosystem health. How is PIRI structured? PIRI is based on three components, namely: Source(s) of threat (pesticide Load) to the asset (L), Transport pathways through which the threat is released to the asset (T), and Value of the asset (water resources threatened) (V). The detriment to water quality is assumed to be the product of L, T and V, where L and T are summed over all the pesticides used on a catchment, i.e.
)LT(Vpesticides∑=Detriment
How are these components quantified? The components L and T are quantified using pesticide characteristics (toxicity, amount used, sorption and persistence in soil) and soil, environmental and other site conditions (water input, soil loss, slope, recharge rate, water table depth etc.). Pesticide load The calculation of pesticide load (L) requires knowledge of the amount of pesticide applied in an area or catchment. This is determined from the total area of the crop, the dosage of active ingredient and the frequency of application during the season. Given that the chemical nature of pesticides is an important determinant of its impact on a water resource, the toxicity of each pesticide, its sorption and half-life in soil is taken into account to estimate total toxic load. Transport The transport factor (T) is assessed separately for surface and ground waters because the associated transport pathways are different. For the ground water component of PIRI, the loss of pesticide during its transport is assessed by the modified version of the commonly used attenuation factor (AF)
PESTICIDE USE IN 6TH CREEK SUBCATCHMENT, MT LOFTY RANGES
CSIRO Land and Water Page 37
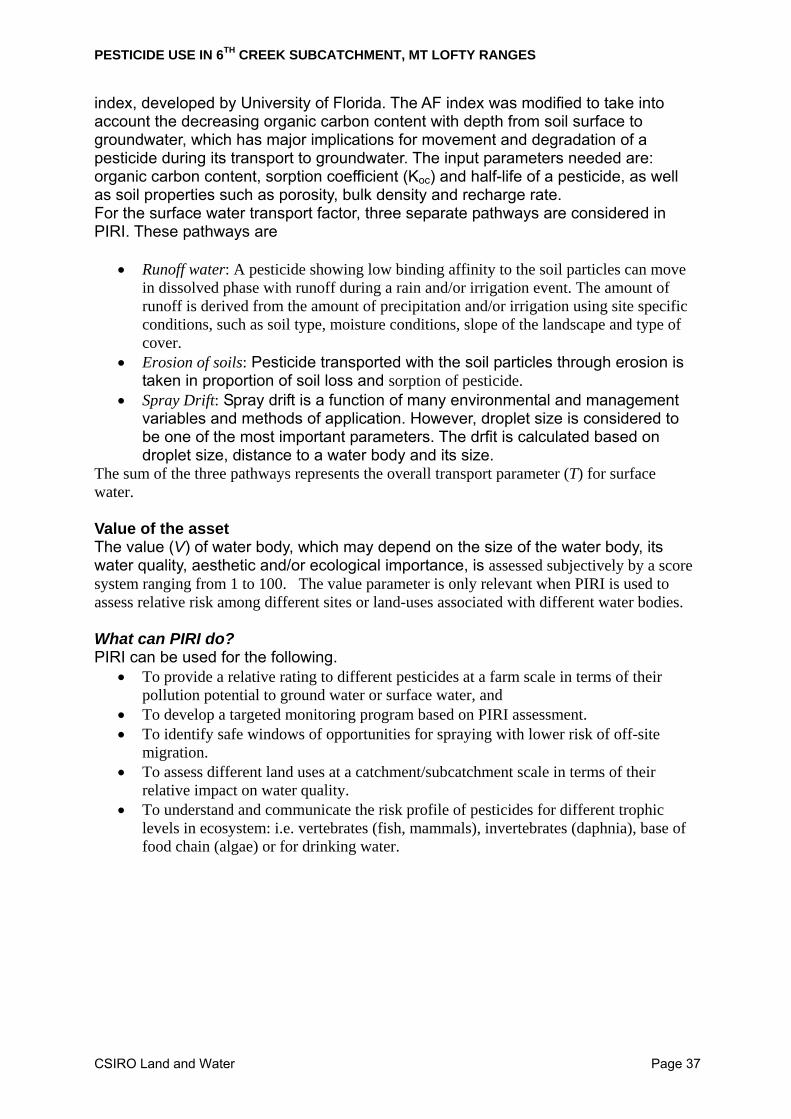
index, developed by University of Florida. The AF index was modified to take into account the decreasing organic carbon content with depth from soil surface to groundwater, which has major implications for movement and degradation of a pesticide during its transport to groundwater. The input parameters needed are: organic carbon content, sorption coefficient (Koc) and half-life of a pesticide, as well as soil properties such as porosity, bulk density and recharge rate. For the surface water transport factor, three separate pathways are considered in PIRI. These pathways are
• Runoff water: A pesticide showing low binding affinity to the soil particles can move in dissolved phase with runoff during a rain and/or irrigation event. The amount of runoff is derived from the amount of precipitation and/or irrigation using site specific conditions, such as soil type, moisture conditions, slope of the landscape and type of cover.
• Erosion of soils: Pesticide transported with the soil particles through erosion is taken in proportion of soil loss and sorption of pesticide.
• Spray Drift: Spray drift is a function of many environmental and management variables and methods of application. However, droplet size is considered to be one of the most important parameters. The drfit is calculated based on droplet size, distance to a water body and its size.
The sum of the three pathways represents the overall transport parameter (T) for surface water. Value of the asset The value (V) of water body, which may depend on the size of the water body, its water quality, aesthetic and/or ecological importance, is assessed subjectively by a score system ranging from 1 to 100. The value parameter is only relevant when PIRI is used to assess relative risk among different sites or land-uses associated with different water bodies. What can PIRI do? PIRI can be used for the following.
• To provide a relative rating to different pesticides at a farm scale in terms of their pollution potential to ground water or surface water, and
• To develop a targeted monitoring program based on PIRI assessment. • To identify safe windows of opportunities for spraying with lower risk of off-site
migration. • To assess different land uses at a catchment/subcatchment scale in terms of their
relative impact on water quality. • To understand and communicate the risk profile of pesticides for different trophic
levels in ecosystem: i.e. vertebrates (fish, mammals), invertebrates (daphnia), base of food chain (algae) or for drinking water.
PESTICIDE USE IN 6TH CREEK SUBCATCHMENT, MT LOFTY RANGES
CSIRO Land and Water Page 38
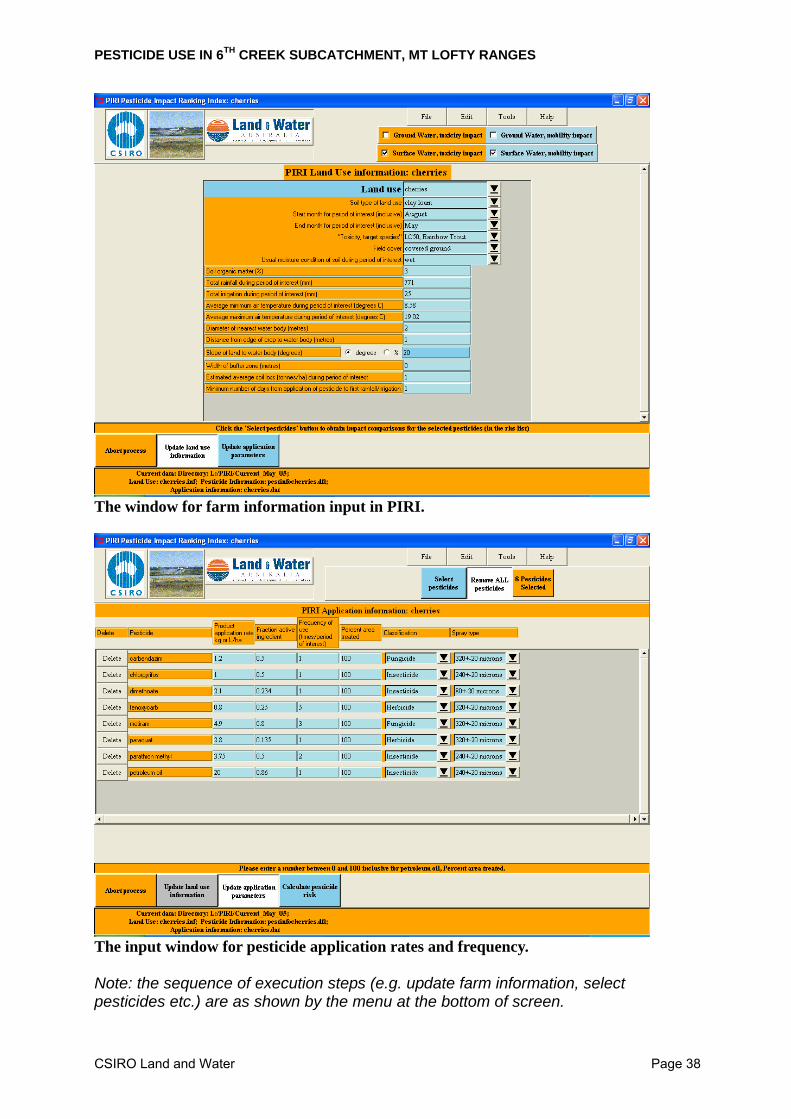
The window for farm information input in PIRI.
The input window for pesticide application rates and frequency. Note: the sequence of execution steps (e.g. update farm information, select pesticides etc.) are as shown by the menu at the bottom of screen.
PESTICIDE USE IN 6TH CREEK SUBCATCHMENT, MT LOFTY RANGES
CSIRO Land and Water Page 39
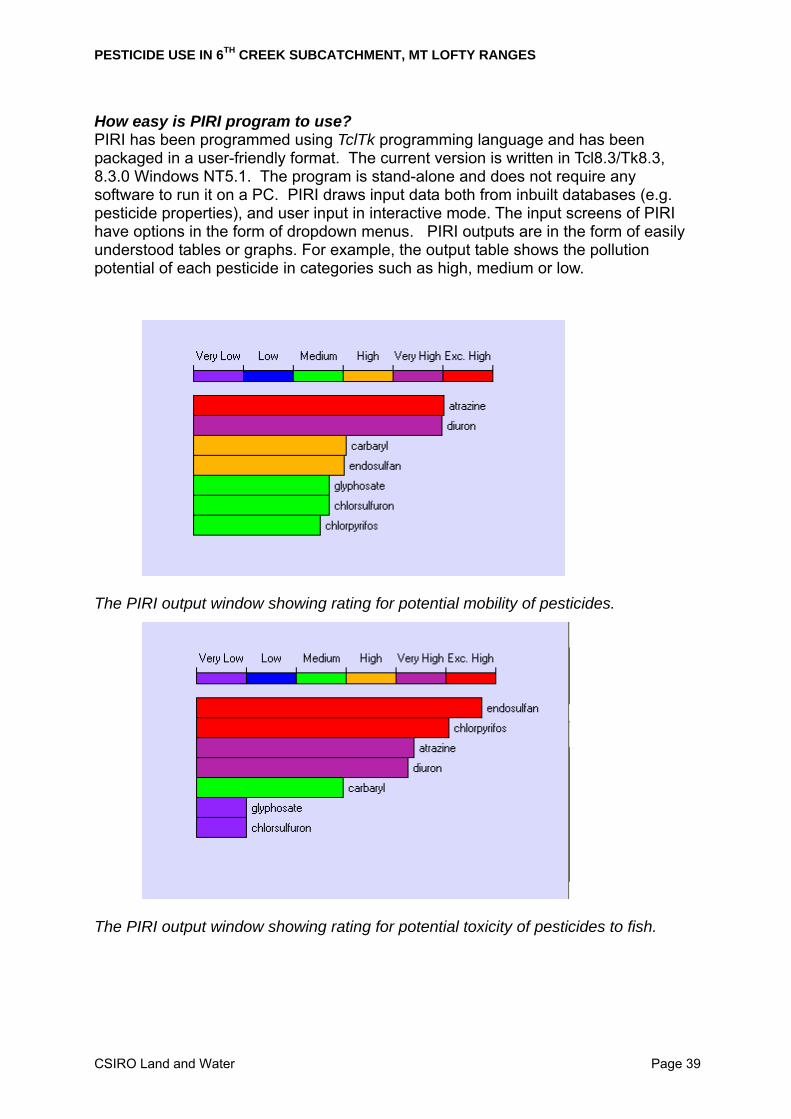
How easy is PIRI program to use? PIRI has been programmed using TclTk programming language and has been packaged in a user-friendly format. The current version is written in Tcl8.3/Tk8.3, 8.3.0 Windows NT5.1. The program is stand-alone and does not require any software to run it on a PC. PIRI draws input data both from inbuilt databases (e.g. pesticide properties), and user input in interactive mode. The input screens of PIRI have options in the form of dropdown menus. PIRI outputs are in the form of easily understood tables or graphs. For example, the output table shows the pollution potential of each pesticide in categories such as high, medium or low.
The PIRI output window showing rating for potential mobility of pesticides.
The PIRI output window showing rating for potential toxicity of pesticides to fish.
PESTICIDE USE IN 6TH CREEK SUBCATCHMENT, MT LOFTY RANGES
CSIRO Land and Water Page 40
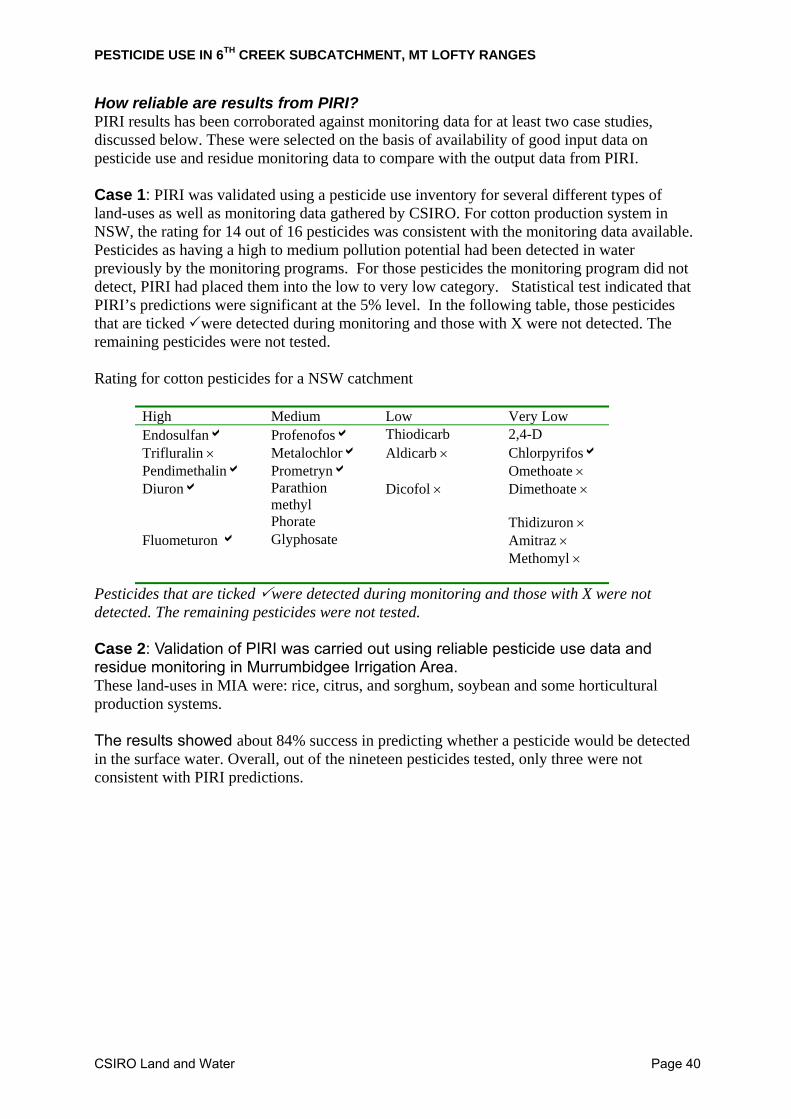
How reliable are results from PIRI? PIRI results has been corroborated against monitoring data for at least two case studies, discussed below. These were selected on the basis of availability of good input data on pesticide use and residue monitoring data to compare with the output data from PIRI. Case 1: PIRI was validated using a pesticide use inventory for several different types of land-uses as well as monitoring data gathered by CSIRO. For cotton production system in NSW, the rating for 14 out of 16 pesticides was consistent with the monitoring data available. Pesticides as having a high to medium pollution potential had been detected in water previously by the monitoring programs. For those pesticides the monitoring program did not detect, PIRI had placed them into the low to very low category. Statistical test indicated that PIRI’s predictions were significant at the 5% level. In the following table, those pesticides that are ticked were detected during monitoring and those with X were not detected. The remaining pesticides were not tested. Rating for cotton pesticides for a NSW catchment
High Medium Low Very Low Endosulfana Profenofosa Thiodicarb 2,4-D Trifluralin × Metalochlora Aldicarb × Chlorpyrifosa Pendimethalina Prometryna Omethoate × Diurona Parathion
methyl Dicofol × Dimethoate ×
Phorate Thidizuron × Fluometuron a Glyphosate Amitraz ×
Methomyl ×
Pesticides that are ticked were detected during monitoring and those with X were not detected. The remaining pesticides were not tested. Case 2: Validation of PIRI was carried out using reliable pesticide use data and residue monitoring in Murrumbidgee Irrigation Area. These land-uses in MIA were: rice, citrus, and sorghum, soybean and some horticultural production systems. The results showed about 84% success in predicting whether a pesticide would be detected in the surface water. Overall, out of the nineteen pesticides tested, only three were not consistent with PIRI predictions.
PESTICIDE USE IN 6TH CREEK SUBCATCHMENT, MT LOFTY RANGES
CSIRO Land and Water Page 41
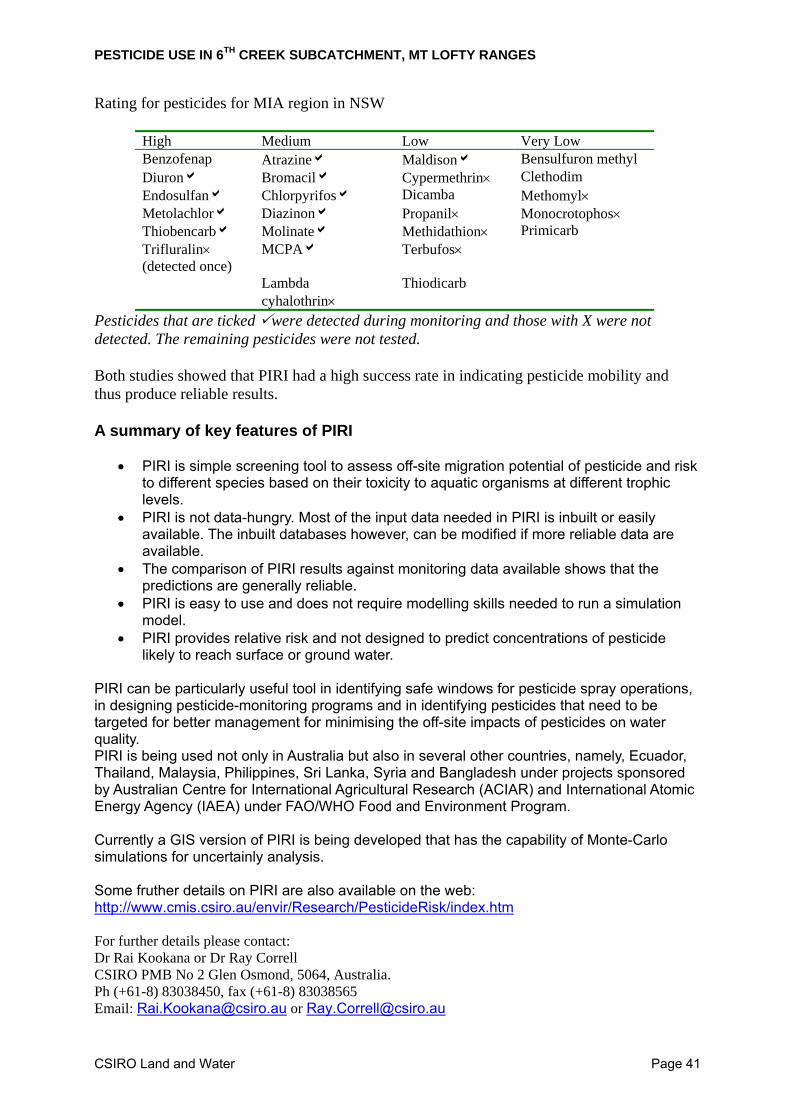
Rating for pesticides for MIA region in NSW
High Medium Low Very Low Benzofenap Atrazinea Maldisona Bensulfuron methyl Diurona Bromacila Cypermethrin× Clethodim Endosulfana Chlorpyrifosa Dicamba Methomyl× Metolachlora Diazinona Propanil× Monocrotophos× Thiobencarba Molinatea Methidathion× Primicarb Trifluralin× (detected once)
MCPAa Terbufos×
Lambda cyhalothrin×
Thiodicarb
Pesticides that are ticked were detected during monitoring and those with X were not detected. The remaining pesticides were not tested. Both studies showed that PIRI had a high success rate in indicating pesticide mobility and thus produce reliable results. A summary of key features of PIRI
• PIRI is simple screening tool to assess off-site migration potential of pesticide and risk to different species based on their toxicity to aquatic organisms at different trophic levels.
• PIRI is not data-hungry. Most of the input data needed in PIRI is inbuilt or easily available. The inbuilt databases however, can be modified if more reliable data are available.
• The comparison of PIRI results against monitoring data available shows that the predictions are generally reliable.
• PIRI is easy to use and does not require modelling skills needed to run a simulation model.
• PIRI provides relative risk and not designed to predict concentrations of pesticide likely to reach surface or ground water.
PIRI can be particularly useful tool in identifying safe windows for pesticide spray operations, in designing pesticide-monitoring programs and in identifying pesticides that need to be targeted for better management for minimising the off-site impacts of pesticides on water quality. PIRI is being used not only in Australia but also in several other countries, namely, Ecuador, Thailand, Malaysia, Philippines, Sri Lanka, Syria and Bangladesh under projects sponsored by Australian Centre for International Agricultural Research (ACIAR) and International Atomic Energy Agency (IAEA) under FAO/WHO Food and Environment Program. Currently a GIS version of PIRI is being developed that has the capability of Monte-Carlo simulations for uncertainly analysis. Some fruther details on PIRI are also available on the web: http://www.cmis.csiro.au/envir/Research/PesticideRisk/index.htm For further details please contact: Dr Rai Kookana or Dr Ray Correll CSIRO PMB No 2 Glen Osmond, 5064, Australia. Ph (+61-8) 83038450, fax (+61-8) 83038565 Email: [email protected] or [email protected]
PESTICIDE USE IN 6TH CREEK SUBCATCHMENT, MT LOFTY RANGES
CSIRO Land and Water Page 42
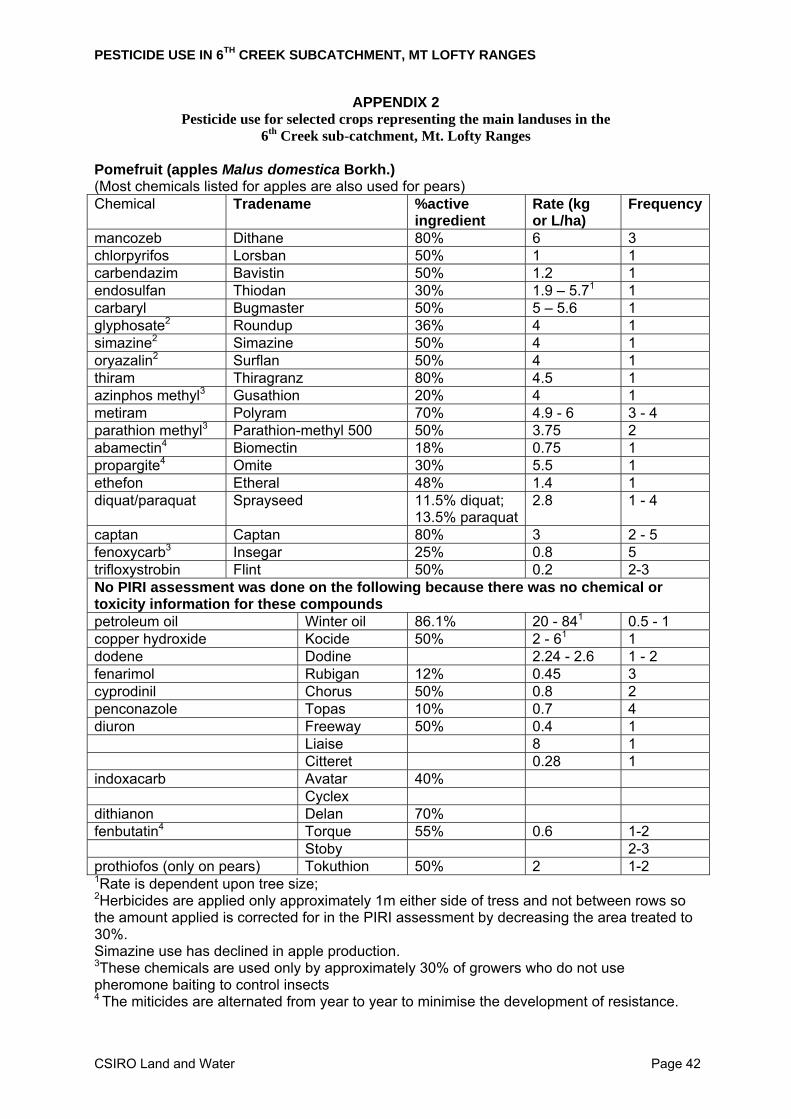
APPENDIX 2 Pesticide use for selected crops representing the main landuses in the
6th Creek sub-catchment, Mt. Lofty Ranges Pomefruit (apples Malus domestica Borkh.) (Most chemicals listed for apples are also used for pears) Chemical Tradename %active
ingredient Rate (kg or L/ha)
Frequency
mancozeb Dithane 80% 6 3 chlorpyrifos Lorsban 50% 1 1 carbendazim Bavistin 50% 1.2 1 endosulfan Thiodan 30% 1.9 – 5.71 1 carbaryl Bugmaster 50% 5 – 5.6 1 glyphosate2 Roundup 36% 4 1 simazine2 Simazine 50% 4 1 oryazalin2 Surflan 50% 4 1 thiram Thiragranz 80% 4.5 1 azinphos methyl3 Gusathion 20% 4 1 metiram Polyram 70% 4.9 - 6 3 - 4 parathion methyl3 Parathion-methyl 500 50% 3.75 2 abamectin4 Biomectin 18% 0.75 1 propargite4 Omite 30% 5.5 1 ethefon Etheral 48% 1.4 1 diquat/paraquat Sprayseed 11.5% diquat;
13.5% paraquat2.8 1 - 4
captan Captan 80% 3 2 - 5 fenoxycarb3 Insegar 25% 0.8 5 trifloxystrobin Flint 50% 0.2 2-3 No PIRI assessment was done on the following because there was no chemical or toxicity information for these compounds petroleum oil Winter oil 86.1% 20 - 841 0.5 - 1 copper hydroxide Kocide 50% 2 - 61 1 dodene Dodine 2.24 - 2.6 1 - 2 fenarimol Rubigan 12% 0.45 3 cyprodinil Chorus 50% 0.8 2 penconazole Topas 10% 0.7 4 diuron Freeway 50% 0.4 1 Liaise 8 1 Citteret 0.28 1 indoxacarb Avatar 40% Cyclex dithianon Delan 70% fenbutatin4 Torque 55% 0.6 1-2 Stoby 2-3 prothiofos (only on pears) Tokuthion 50% 2 1-2 1Rate is dependent upon tree size; 2Herbicides are applied only approximately 1m either side of tress and not between rows so the amount applied is corrected for in the PIRI assessment by decreasing the area treated to 30%. Simazine use has declined in apple production. 3These chemicals are used only by approximately 30% of growers who do not use pheromone baiting to control insects 4 The miticides are alternated from year to year to minimise the development of resistance.
PESTICIDE USE IN 6TH CREEK SUBCATCHMENT, MT LOFTY RANGES
CSIRO Land and Water Page 43
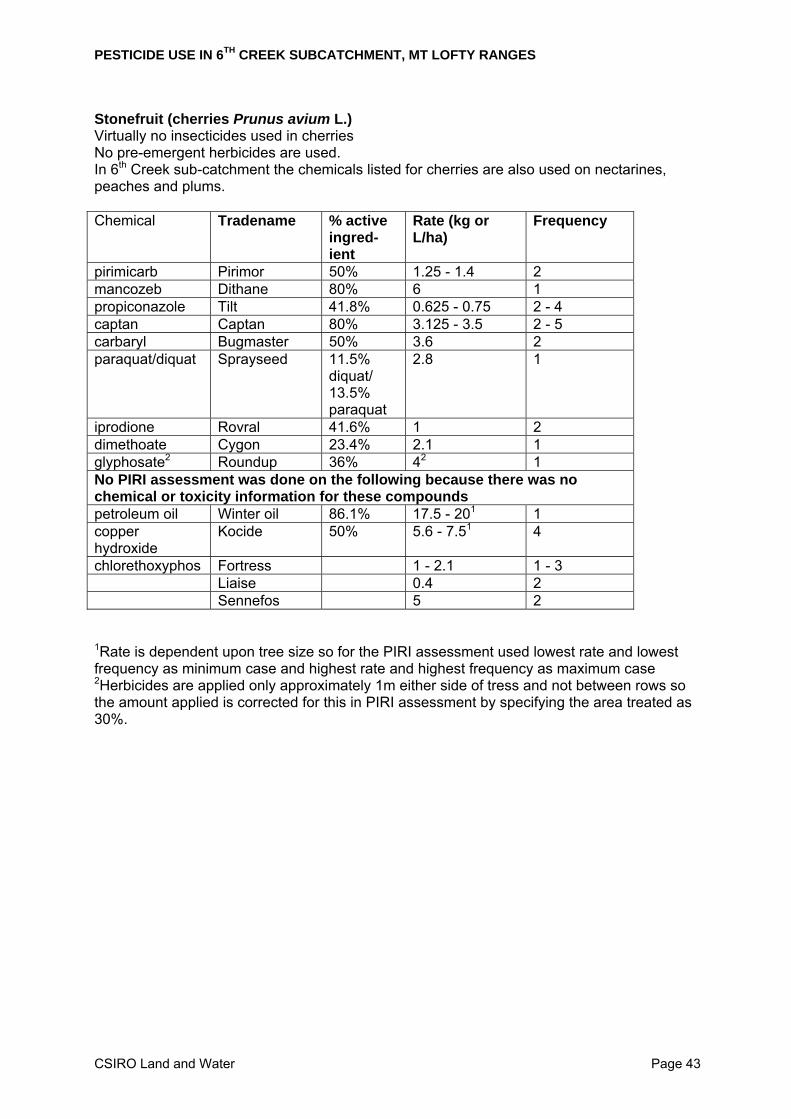
Stonefruit (cherries Prunus avium L.) Virtually no insecticides used in cherries No pre-emergent herbicides are used. In 6th Creek sub-catchment the chemicals listed for cherries are also used on nectarines, peaches and plums. Chemical Tradename % active
ingred-ient
Rate (kg or L/ha)
Frequency
pirimicarb Pirimor 50% 1.25 - 1.4 2 mancozeb Dithane 80% 6 1 propiconazole Tilt 41.8% 0.625 - 0.75 2 - 4 captan Captan 80% 3.125 - 3.5 2 - 5 carbaryl Bugmaster 50% 3.6 2 paraquat/diquat Sprayseed 11.5%
diquat/ 13.5% paraquat
2.8 1
iprodione Rovral 41.6% 1 2 dimethoate Cygon 23.4% 2.1 1 glyphosate2 Roundup 36% 42 1 No PIRI assessment was done on the following because there was no chemical or toxicity information for these compounds petroleum oil Winter oil 86.1% 17.5 - 201 1 copper hydroxide
Kocide 50% 5.6 - 7.51 4
chlorethoxyphos Fortress 1 - 2.1 1 - 3 Liaise 0.4 2 Sennefos 5 2
1Rate is dependent upon tree size so for the PIRI assessment used lowest rate and lowest frequency as minimum case and highest rate and highest frequency as maximum case 2Herbicides are applied only approximately 1m either side of tress and not between rows so the amount applied is corrected for this in PIRI assessment by specifying the area treated as 30%.
PESTICIDE USE IN 6TH CREEK SUBCATCHMENT, MT LOFTY RANGES
CSIRO Land and Water Page 44
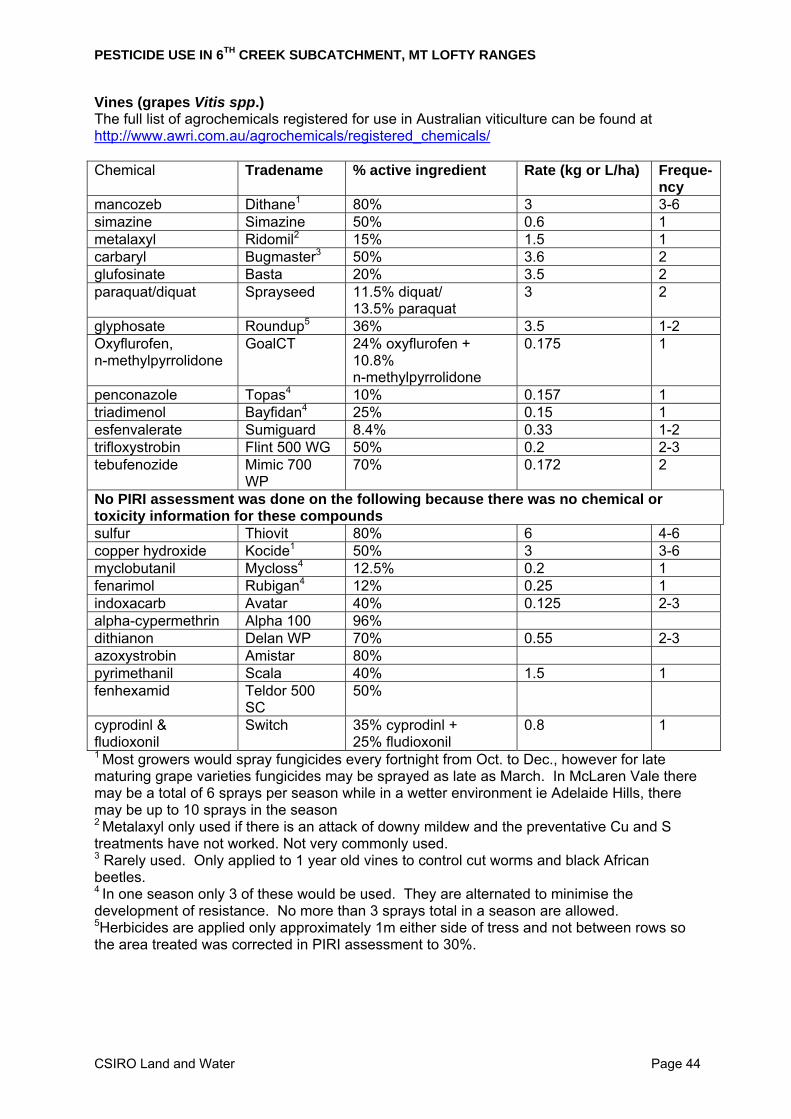
Vines (grapes Vitis spp.) The full list of agrochemicals registered for use in Australian viticulture can be found at http://www.awri.com.au/agrochemicals/registered_chemicals/ Chemical Tradename % active ingredient Rate (kg or L/ha) Freque-
ncy mancozeb Dithane1 80% 3 3-6 simazine Simazine 50% 0.6 1 metalaxyl Ridomil2 15% 1.5 1 carbaryl Bugmaster3 50% 3.6 2 glufosinate Basta 20% 3.5 2 paraquat/diquat Sprayseed 11.5% diquat/
13.5% paraquat 3 2
glyphosate Roundup5 36% 3.5 1-2 Oxyflurofen, n-methylpyrrolidone
GoalCT 24% oxyflurofen + 10.8% n-methylpyrrolidone
0.175 1
penconazole Topas4 10% 0.157 1 triadimenol Bayfidan4 25% 0.15 1 esfenvalerate Sumiguard 8.4% 0.33 1-2 trifloxystrobin Flint 500 WG 50% 0.2 2-3 tebufenozide Mimic 700
WP 70% 0.172 2
No PIRI assessment was done on the following because there was no chemical or toxicity information for these compounds sulfur Thiovit 80% 6 4-6 copper hydroxide Kocide1 50% 3 3-6 myclobutanil Mycloss4 12.5% 0.2 1 fenarimol Rubigan4 12% 0.25 1 indoxacarb Avatar 40% 0.125 2-3 alpha-cypermethrin Alpha 100 96% dithianon Delan WP 70% 0.55 2-3 azoxystrobin Amistar 80% pyrimethanil Scala 40% 1.5 1 fenhexamid Teldor 500
SC 50%
cyprodinl & fludioxonil
Switch 35% cyprodinl + 25% fludioxonil
0.8 1
1 Most growers would spray fungicides every fortnight from Oct. to Dec., however for late maturing grape varieties fungicides may be sprayed as late as March. In McLaren Vale there may be a total of 6 sprays per season while in a wetter environment ie Adelaide Hills, there may be up to 10 sprays in the season 2 Metalaxyl only used if there is an attack of downy mildew and the preventative Cu and S treatments have not worked. Not very commonly used. 3 Rarely used. Only applied to 1 year old vines to control cut worms and black African beetles. 4 In one season only 3 of these would be used. They are alternated to minimise the development of resistance. No more than 3 sprays total in a season are allowed. 5Herbicides are applied only approximately 1m either side of tress and not between rows so the area treated was corrected in PIRI assessment to 30%.
PESTICIDE USE IN 6TH CREEK SUBCATCHMENT, MT LOFTY RANGES
CSIRO Land and Water Page 45
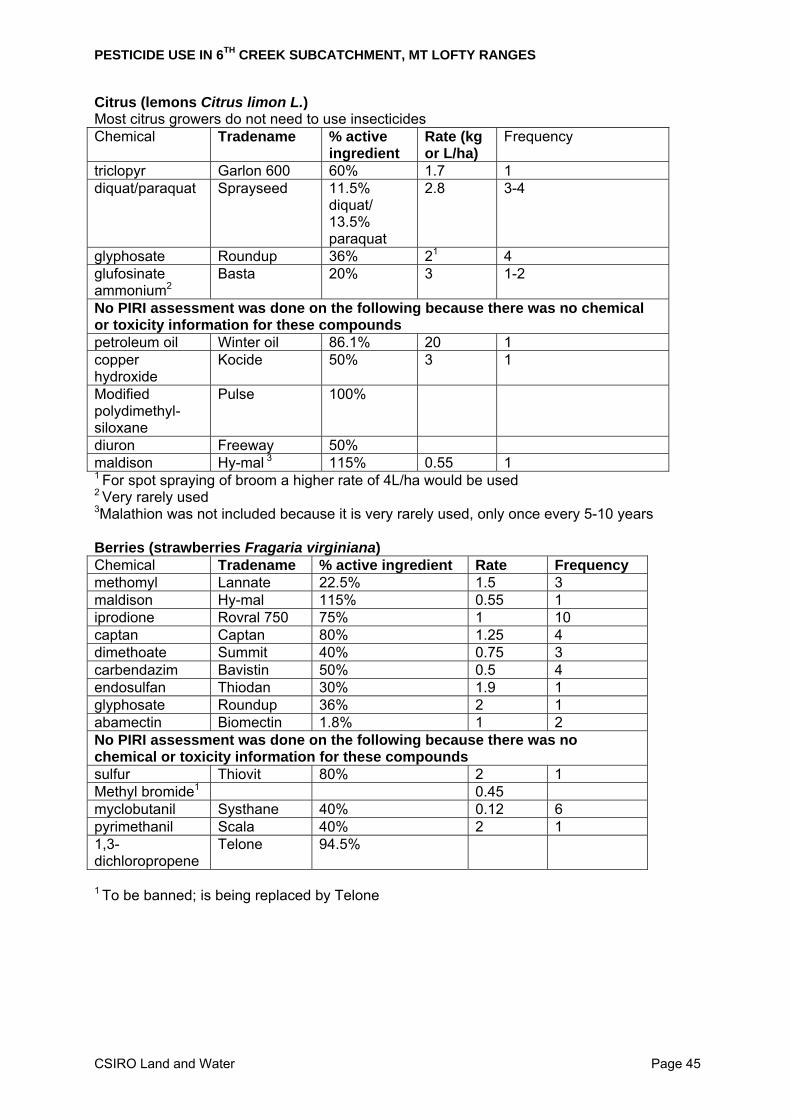
Citrus (lemons Citrus limon L.) Most citrus growers do not need to use insecticides Chemical Tradename % active
ingredient Rate (kg or L/ha)
Frequency
triclopyr Garlon 600 60% 1.7 1 diquat/paraquat Sprayseed 11.5%
diquat/ 13.5% paraquat
2.8 3-4
glyphosate Roundup 36% 21 4 glufosinate ammonium2
Basta 20% 3 1-2
No PIRI assessment was done on the following because there was no chemical or toxicity information for these compounds petroleum oil Winter oil 86.1% 20 1 copper hydroxide
Kocide 50% 3 1
Modified polydimethyl-siloxane
Pulse 100%
diuron Freeway 50% maldison Hy-mal 3 115% 0.55 1 1 For spot spraying of broom a higher rate of 4L/ha would be used 2 Very rarely used 3Malathion was not included because it is very rarely used, only once every 5-10 years Berries (strawberries Fragaria virginiana) Chemical Tradename % active ingredient Rate Frequency methomyl Lannate 22.5% 1.5 3 maldison Hy-mal 115% 0.55 1 iprodione Rovral 750 75% 1 10 captan Captan 80% 1.25 4 dimethoate Summit 40% 0.75 3 carbendazim Bavistin 50% 0.5 4 endosulfan Thiodan 30% 1.9 1 glyphosate Roundup 36% 2 1 abamectin Biomectin 1.8% 1 2 No PIRI assessment was done on the following because there was no chemical or toxicity information for these compounds sulfur Thiovit 80% 2 1 Methyl bromide1 0.45 myclobutanil Systhane 40% 0.12 6 pyrimethanil Scala 40% 2 1 1,3-dichloropropene
Telone 94.5%
1 To be banned; is being replaced by Telone