Embed Size (px)
Citation preview

1
Perturbation of Retinoid Homeostasis Increases Malformation Risk in
Embryos Exposed to Pregestational Diabetes
Short title: Retinoid homeostasis in diabetic embryopathy
Leo M.Y. Lee,1,2,3
Maran B.W. Leung1, Rachel C.Y. Kwok
1, Yun-Chung Leung
3,
Chi-Chiu Wang1,2
, Peter J. McCaffery4, Andrew J. Copp
5 and Alisa S.W. Shum
1
1School of Biomedical Sciences,
2Department of Obstetrics and Gynaecology, Faculty
of Medicine, The Chinese University of Hong Kong, Hong Kong
3Department of Applied Biology and Chemical Technology, The Hong Kong
Polytechnic University, Hong Kong
4Institute of Medical Sciences, University of Aberdeen, Aberdeen AB25 2ZD, United
Kingdom
5Newlife Birth Defects Research Centre, Institute of Child Health, University College
London, London WC1N 1EH, United Kingdom
Corresponding author:
Alisa S.W. Shum
School of Biomedical Sciences, The Chinese University of Hong Kong, Hong Kong
Tel: (852) 39436840 Fax: (852) 39420990 e-mail: [email protected]
(7 Figures, 1 Table, 7 Supplementary Figures, 3 Supplementary Tables)
Page 1 of 47 Diabetes
Diabetes Publish Ahead of Print, published online January 13, 2017

2
ABSTRACT
Pregestational diabetes is highly associated with increased risk of birth defects. However,
factors that can increase or reduce expressivity and penetrance of malformations in
diabetic pregnancies remain poorly identified. All-trans retinoic acid (RA) plays crucial
roles in embryogenesis. Here, we find that Cyp26a1, which encodes a key enzyme for
catabolic inactivation of RA required for tight control of local RA concentrations, is
significantly down-regulated in embryos of diabetic mice. Embryonic tissues expressing
Cyp26a1 show reduced efficiency of RA clearance. Diabetes-exposed embryos are thus
sensitized to RA and more vulnerable to the deleterious effects of increased RA
signalling. Susceptibility to RA teratogenesis is further potentiated in embryos with a
pre-existing genetic defect of RA metabolism. Increasing RA clearance efficiency by a
pre-conditioning approach can counteract the increased susceptibility to RA
teratogenesis in embryos of diabetic mice. Our findings provide new insight into
gene-environment interactions that influence individual risk in manifestation of
diabetes-related birth defects, and shed light on the environmental risk factors and genetic
variants for a stratified medicine approach to screen diabetic women of childbearing age
and assess risk of birth defects during pregnancy.
Page 2 of 47Diabetes

3
Offspring of women with pregestational diabetes show markedly increased risk of
birth defects (1). While the cause of diabetic embryopathy is known to be multifactorial,
previous investigations mainly focussed on the effect of maternal diabetes alone on the
embryo. Genetic and environmental factors that can influence expressivity and
penetrance of congenital malformations in diabetic pregnancies remain far from clear
(2,3). Interestingly, some malformations found in the offspring of diabetic mothers (4-6)
are very similar to those anomalies in humans and animals arising from exposure to
excess retinoids (vitamin A and its analogues) (7-9). For instance, a large-scale study of
18 population-based congenital anomaly registries shows that the odds ratio for caudal
regression in diabetic versus non-diabetic pregnancy (odds ratio: 26.4; 95% confidence
interval: 8.98-77.64) is well above other malformations (4), which strengthens the
conclusion of previous studies that caudal regression is a characteristic anomaly
associated with diabetic pregnancy (5,6). Caudal regression also commonly occurs with
retinoid teratogenesis in animal studies (9-11).
Many of the functions of vitamin A in embryogenesis are mediated via its
metabolite all-trans retinoic acid (RA), which is a key signalling molecule controlling the
development of multiple organ systems. Different embryonic tissues/organs show
variations in requirement for RA, thus tight regulation of local RA concentrations is
critical to ensure precise levels of RA signalling required for normal embryo
development. An important mechanism to control local RA concentrations is via
catabolic inactivation by the CYP26 enzymes belonging to the cytochrome P450 family.
Three Cyp26 genes, namely Cyp26a1, b1 and c1, are expressed in specific embryonic
tissues and attenuate deleterious effects of excessive RA signalling. Among them,
CYP26A1 is the key RA catabolizing enzyme in many tissues and the only subtype that
Page 3 of 47 Diabetes

4
is expressed in the tailbud region of the embryo (12), where caudal regression arises (11).
Homozygous deletion of Cyp26a1 in mice results in lethality at mid-late gestation, with
embryos exhibiting caudal truncation (13,14). Similarly, we and others have
demonstrated that mouse embryos exposed to excess RA develop caudal truncation and
various phenotypes, including specific renal, anorectal, caudal spinal cord and lower
extremity malformations (10,11,15) commonly associated with caudal regression in
humans (16,17). Moreover, we find that maternal diabetes potentiates the effect of RA to
cause caudal regression in mice (18). This similarity in phenotypes resulting from genetic
and environmental disturbances therefore led us to speculate that maternal diabetes may
perturb embryonic CYP26A1 function in maintaining a tight regulation of local RA
concentrations in specific tissues. We hypothesized that such tissues will be vulnerable to
perturbation of RA levels and exhibit increased susceptibility to RA teratogenesis. Here,
we provide evidence to support this hypothesis using a mouse model of pregestational
diabetes. Notably, our findings show that interaction between a genetic predisposition
and an environmental agent to disrupt RA homeostasis can potentiate maternal
diabetes-induced deregulated RA catabolism in increasing malformation risk.
Page 4 of 47Diabetes

5
RESEARCH DESIGN AND METHODS
Animals
All animal experimentation was conducted following the guidelines set by The Chinese
University of Hong Kong. Diabetes was induced in ICR female mice by streptozotocin
injections according to our established protocols (18). Mice with blood glucose
concentration ≥16.7 mmol/L were classified as manifestly diabetic (MD). Untreated,
age-matched female ICR mice were employed as the non-diabetic (ND) control. Mice
were kept in a 12:12 h light-dark cycle with the light cycle commenced at 11:00am.
Pregnancies were obtained by timed mating for 2 h (9:00-11:00am) between MD/ND
female ICR mice and male ICR mice, or male Cyp26a1+/-
mice in 129/C57BL/6Cr/DBA
mixed background (a gift from Prof. Hamada, 14). The time of finding a copulation plug
at 11:00am was defined as embryonic day (E) 0. Mice were checked for blood glucose
levels prior to embryo collection to confirm that MD mice remained diabetic during
pregnancy (Supplementary Table 1).
Gene Expression
Whole embryos were subjected to in situ hybridization (ISH) for Cyp26a1, Cyp26b1 or
Cyp26c1 with digoxygenin-labeled RNA probes (19). The mRNA expression levels of
various genes were determined by real-time qRT-PCR. To minimize differences in
expression levels due to variations in the developmental stage, only embryos within the
same somite-range (9-10 somite-stage for E8 embryos; 19-21 somite-stage for E9
embryos) in each litter were collected. This criterion was adopted for embryo collection
Page 5 of 47 Diabetes

6
in other experiments. For crossing between ICR male and ICR female mice, all embryos
at appropriate somite-stage from the same litter were pooled as one sample. For crossing
between Cyp26a1+/-
male and ICR female mice, embryos were individually collected.
After DNA genotyping of the yolk sac by PCR using primers as described (14), embryos
of the same genotype (Cyp26a1+/+
or Cyp26a1+/-
) from the same litter were pooled as one
sample. Total RNA was extracted from the whole embryo or tailbud (defined as the
caudal end of the embryo up to one somite-length posterior to the last somite) samples
using the RNeasy Mini Kit (Favorgen). An equal amount of RNA (250 ng) was
reverse-transcribed into first-strand cDNA using the High Capacity cDNA Reverse
Transcription Kit (Applied Biosystems). The cDNA yielded from reverse transcription of
1.67 ng RNA was subjected to quantitative PCR using ABI 7900HT Fast Real-Time PCR
system (Applied Biosystems), with SYBR Green PCR Master Mix (Applied Biosystems).
β-actin was used as internal control for normalization. The PCR conditions and primer
sequences were listed in Supplementary Table 2.
In Vitro RA Degrading Efficiency
Using an assay modified from Yamamoto (20), four tailbuds of E9 embryos from the
same litter were pooled as one sample and lysed in 5 µl of DMEM by trituration with a
pipette tip, followed by 5 cycles of freezing in liquid nitrogen and thawing in a water bath
at 37oC for 1 min. The whole lysate was added to 50 µl of a reaction mixture containing
50 nM all-trans RA (Sigma-Aldrich), with or without 1.6 mg/ml NADPH (cofactor of
cytochrome P450 enzyme), 0.3 mg/ml DTT (reducing agent for optimal cytochrome
P450 enzyme function) and CYP26 specific inhibitor R115866 (21) at a concentration of
1, 10 or 100 nM in a culture medium (DMEM supplemented with 10% fetal bovine
Page 6 of 47Diabetes

7
serum). The reaction mixture was then incubated in a 5% CO2 incubator at 37oC for 2 h,
during which the exogenous RA in the medium was degraded by the RA catabolizing
enzyme in the tailbud lysate. After incubation, the amount of RA remaining was
determined by adding the reaction mixture, diluted 30-fold with the culture medium, in
triplicate to a 96-well plate containing RA reporter cells, which are F9 cells transfected
with a RA response element that drives β-galactosidase expression (22). Serially diluted
RA standard solutions at concentrations from 10-6
M to 10-11
M were added in triplicate to
the same 96-well plate. After culturing for 24 h, cells were stained with X-gal and the
intensity of the blue product was measured using a microplate spectrophotometer. RA in
the sample was quantified using a standard curve constructed with the serially diluted RA
solutions (Supplementary Figure 1).
In Vivo Clearance of RA
To determine in vivo efficiency of RA clearance, at various time points post-injection of
50 mg/kg body weight of RA at E9, the tailbud was collected under dim yellow light.
Tailbuds were individually placed in 300 µl of the culture medium added with 100 nM
R115866 to inhibit endogenous CYP26 enzymes. After 24 h of incubation in 5% CO2 at
37oC, to allow maximum release of RA from the tailbud into the medium, RA in the
medium was quantified using the RA reporter cell line. A preliminary study demonstrated
that the culture conditions did not cause significant degradation of RA (Supplementary
Figure 2). To validate that RA measured using the RA reporter cell line measures RA
released from tissues that can modulate RA levels, the tailbud of E9 embryos was
collected 3 h post-injection of RA. The midbrain, which does not express any Cyp26
Page 7 of 47 Diabetes

8
genes in untreated or RA-treated conditions, was also collected from these embryos as a
control. Tissues from the same litter were pooled as one sample. RA in the sample was
quantified using HPLC (23).
Detection of Bioactive RA in Tailbud
The caudal-most portion of the tailbud of E9 embryo of MD and ND mice was excised
under dim yellow light and individually placed on top of RA reporter cells grown on a
96-well plate in the culture medium added with 100 nM R115866 to inhibit endogenous
CYP26 enzymes. After 24 h of culture, cells were stained with X-gal. The number of
positively stained cells around the tailbud explant was counted under a stereomicroscope.
Susceptibility to RA Teratogenesis
The teratogenic effect of RA is dose- and stage-dependent (9). To determine the
susceptibility to RA teratogenesis, MD or ND mice at E8 or E9 received an
intraperitoneal injection of 25 mg/kg RA or equivalent volume of suspension vehicle
(peanut oil) as a control, and their embryos were examined at E13. Embryos treated with
RA at E9 were examined for the extent of caudal truncation, which was expressed as the
ratio of tail length to crown-rump length as used in our previous studies (18). Embryos
treated with RA at E8 were examined for exencephaly and spina bifida. Near-term E18
fetuses maternally treated with 40 mg/kg RA at E9 were examined for various types of
renal malformations as described in our previous studies (24). Maternal pre-conditioning
with low dose RA (0.625 or 1.25 mg/kg) or suspension vehicle (peanut oil) as a control
was achieved by oral gavage 2 h before receiving intraperitoneal injection of teratogenic
Page 8 of 47Diabetes

9
dose of RA.
Statistics
Statistical differences between two groups were analyzed by unpaired Student’s t test.
Differences between multiple groups of data were analysed by one-way ANOVA,
followed by Bonferroni post-hoc test, or by using Contrast test for assessing extent of
differences. Dose response was analyzed by linear regression. The best-fit curves were
compared by nonlinear regression. Data were presented as mean ± SEM, with P < 0.05
considered as statistically significant. All statistical analyses were conducted using the
SPSS software (SPSS Inc.), except nonlinear regression analysis, which was conducted
using the Prism software (GraphPad Software).
Page 9 of 47 Diabetes

10
RESULTS
Cyp26a1 Expression Levels and RA Degrading Efficiency are Reduced in Embryos
of Diabetic Mice
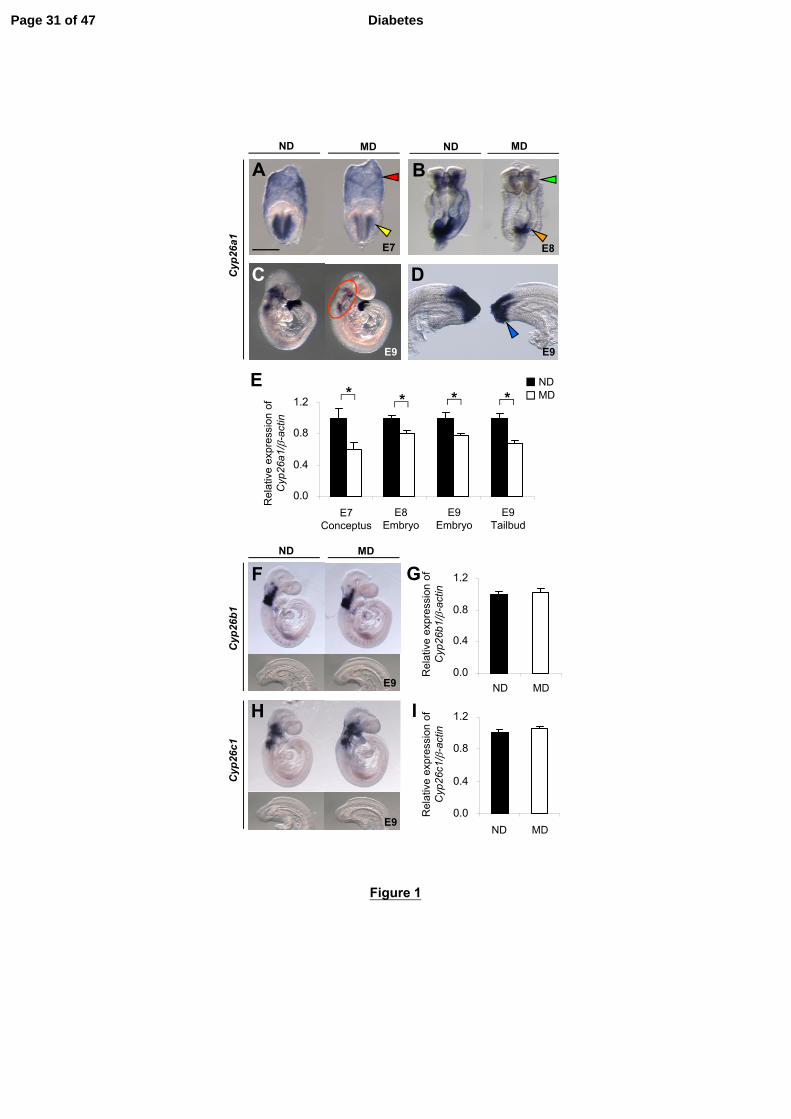
During early mouse post-implantation development, Cyp26a1 is initially expressed in
the headfold mesenchyme (Fig. 1A), and then extends to the caudal neural plate and
primitive streak (Fig. 1B). As development proceeds, Cyp26a1 expression persists at the
caudal end (Fig. 1C and D), now called the tailbud, which contains progenitor cells for
forming various posterior structures. Rostrally, it is expressed in the craniofacial,
cervical and branchial arch mesenchyme (Fig. 1C). Embryos of manifestly diabetic
(MD) mice exhibit a significant decrease in Cyp26a1 mRNA transcripts in all of these
regions compared with embryos of non-diabetic (ND) mice (Fig. 1A-E). In contrast,
Cyp26b1 and Cyp26c1 are expressed predominantly in the cranial region but not in the
tailbud (Fig. 1F and H), and show no significant difference in expression levels
between embryos of MD and ND mice (Fig. 1G and I).
To determine whether a decrease in Cyp26a1 expression results in reduced
efficiency of RA catabolism, we employed an in vitro assay to compare the RA
degrading efficiency of the tailbud, which exclusively expresses Cyp26a1, but not
Cyp26b1 and Cyp26c1, from E9 embryos of MD and ND mice. Results showed that
only a low level of RA degrading activity was detected when tailbud lysate alone was
applied (Fig. 2A). However, in the presence of NADPH and DTT for optimal activity of
CYP26 enzymes, 66% of added RA was degraded within 2 h. In contrast, co-treatment
with 1-100 nM of R115866, a potent CYP26-specific inhibitor (21), resulted in a
Page 10 of 47Diabetes

11
significant dose-dependent inhibition of RA degradation. Notably, while there was no
significant difference in the protein content of the excised tailbuds from embryos of MD
and ND mice (Supplementary Figure 3), tailbud lysate of the MD group exhibited only
45% of activity of the ND group.
To further compare the efficiency of in vivo clearance of RA, MD and ND mice
were injected with an exogenous dose of 50 mg/kg RA at E9, followed by measurement
of RA in individual tailbuds at hourly intervals using the RA reporter cell line (Fig. 2B),
which showed results comparable with quantification of RA using HPLC
(Supplementary Table 3). Despite a similar response time-course in MD and ND groups,
the amount of RA in tailbuds of the MD group was significantly higher than the ND
group at all time-points studied (Fig. 2B). Moreover, by determining the area under the
concentration-time curve (AUC), which is considered as the most appropriate
pharmacokinetic correlate of embryotoxicity of RA (25), there was a two-fold difference
between MD (AUC0-8h: 25.59 nM x h, calculated by the Prism 5 software, GraphPad
Software) and ND (AUC0-8h: 12.70 nM x h) groups, implying that the efficiency of in
vivo RA clearance in tailbuds of diabetes-exposed embryos was reduced by 50%. In
contrast, the E9 midbrain, which does not express any of the three Cyp26 genes in both
untreated and RA-treated conditions (Supplementary Figure 4A), exhibited no differences
in RA levels between embryos of MD and ND mice at 3 h post-injection of RA
(Supplementary Figure 4B).
RA Levels are Increased in Tailbuds of Embryos of Diabetic Mice
To determine whether reduction in RA degrading efficiency would lead to a rise in
Page 11 of 47 Diabetes

12
endogenous RA levels, we excised the caudal-most part of the tailbud (Fig. 3A) furthest
away from the RA source in adjacent trunk tissues, and put it directly on the RA reporter
cells to detect bioactive RA release (22). Reporter cells exposed to RA expressed
β-galactosidase and turned blue with X-gal staining. There were hardly any positively
stained cells around tailbuds from embryos of ND mice (Fig. 3B and C), which agrees
with previous findings that the tailbud is normally devoid of RA (26). However, stained
cells were observed around more than half the tailbuds from embryos of MD mice. The
number of stained cells varied from under 10 to over 40, implying a varying magnitude of
elevation of RA level in tailbuds of diabetes-exposed embryos.
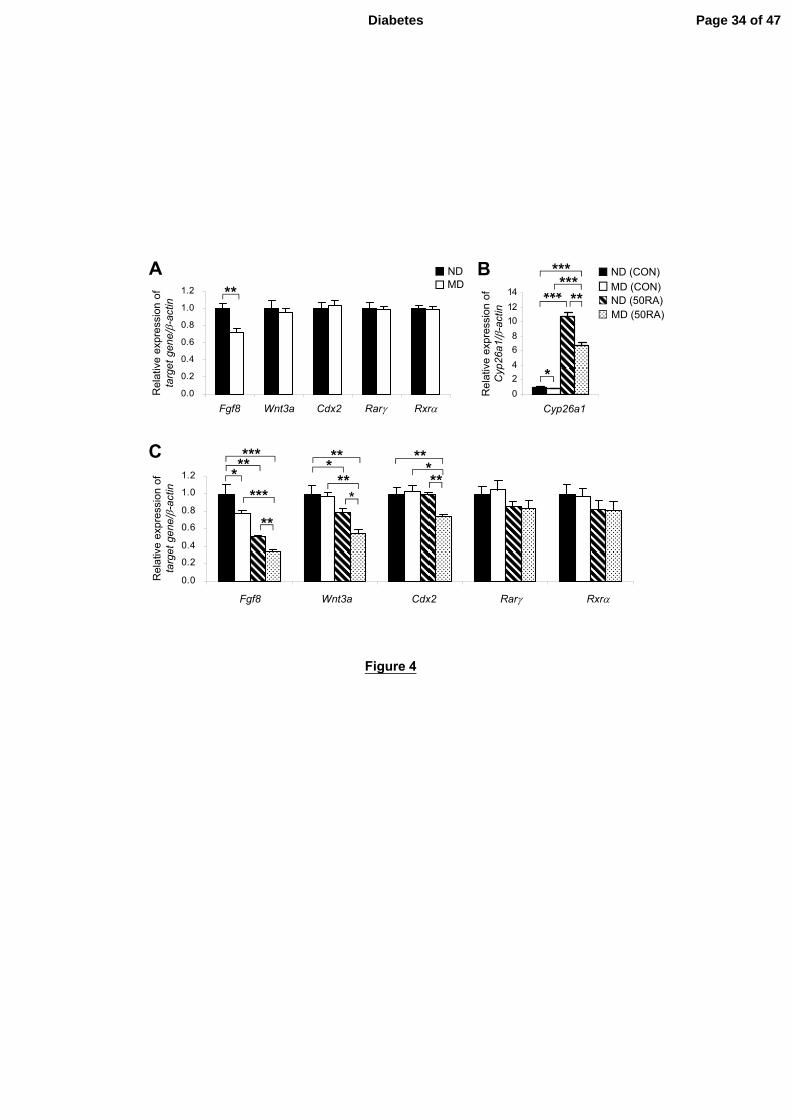
Several genes including Fgf8, Wnt3a and Cdx2 are indispensable key players in
caudal development (27). Excessive RA has been demonstrated to down-regulate these
genes and cause axial truncation (11,26,28). However, of these genes, only Fgf8 was
significantly down-regulated in the tailbud of embryos of MD mice (Fig. 4A). It is
possible that the magnitude of increase in RA levels may not have reached the threshold
for causing detectable alteration in the expression of some of these genes. We therefore
challenged embryos with 50 mg/kg of RA to test whether deregulated catabolism of RA
would sensitize embryos of MD mice to RA. At 4 h post-injection of RA, there was a
dramatic increase in mRNA levels of Cyp26a1 in the tailbud (Fig. 4B), showing that
Cyp26a1 is highly inducible by RA. However, the magnitude of up-regulation of
Cyp26a1 in tailbuds of the MD group was significantly less than the ND group (P < 0.05,
Contrast test), which further exacerbated the difference between these two groups.
Concomitantly, there was a marked down-regulation of Fgf8, with expression levels in
tailbuds of the RA-treated MD group reduced to less than one-third of the ND group
without RA treatment (Fig. 4C). Consistent with our previous findings (18), though there
Page 12 of 47Diabetes
13
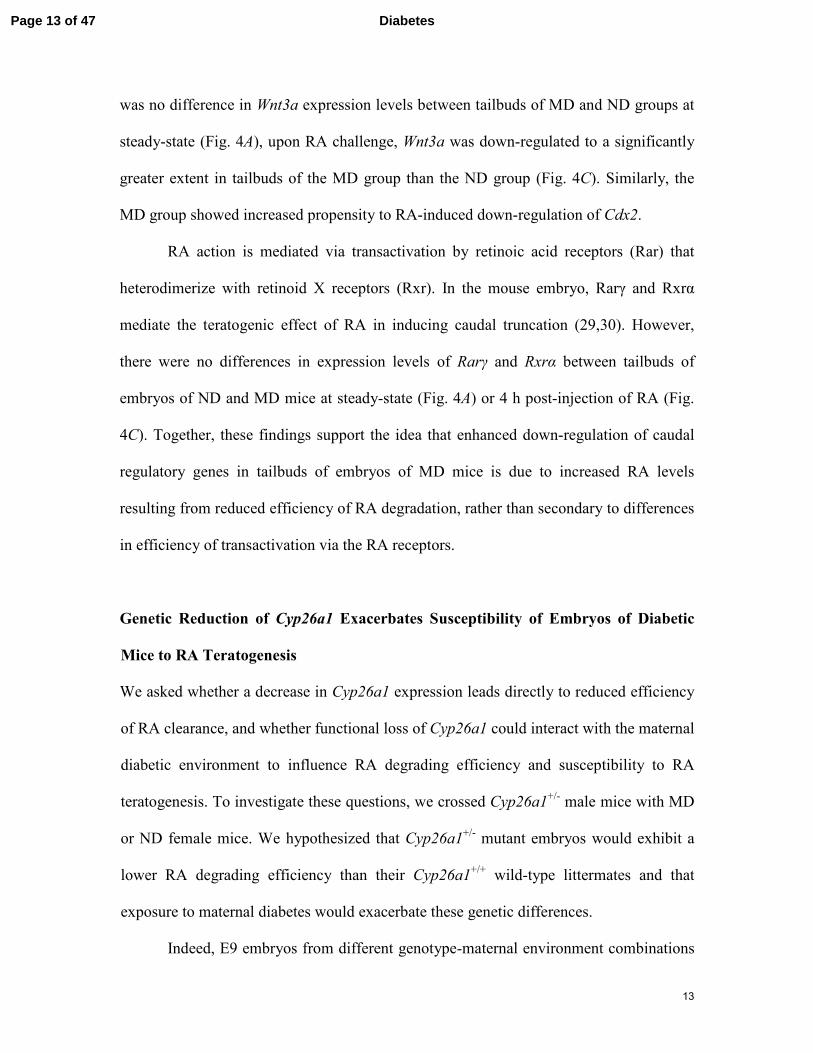
was no difference in Wnt3a expression levels between tailbuds of MD and ND groups at
steady-state (Fig. 4A), upon RA challenge, Wnt3a was down-regulated to a significantly
greater extent in tailbuds of the MD group than the ND group (Fig. 4C). Similarly, the
MD group showed increased propensity to RA-induced down-regulation of Cdx2.
RA action is mediated via transactivation by retinoic acid receptors (Rar) that
heterodimerize with retinoid X receptors (Rxr). In the mouse embryo, Rarγ and Rxrα
mediate the teratogenic effect of RA in inducing caudal truncation (29,30). However,
there were no differences in expression levels of Rarγ and Rxrα between tailbuds of
embryos of ND and MD mice at steady-state (Fig. 4A) or 4 h post-injection of RA (Fig.
4C). Together, these findings support the idea that enhanced down-regulation of caudal
regulatory genes in tailbuds of embryos of MD mice is due to increased RA levels
resulting from reduced efficiency of RA degradation, rather than secondary to differences
in efficiency of transactivation via the RA receptors.
Genetic Reduction of Cyp26a1 Exacerbates Susceptibility of Embryos of Diabetic
Mice to RA Teratogenesis
We asked whether a decrease in Cyp26a1 expression leads directly to reduced efficiency
of RA clearance, and whether functional loss of Cyp26a1 could interact with the maternal
diabetic environment to influence RA degrading efficiency and susceptibility to RA
teratogenesis. To investigate these questions, we crossed Cyp26a1+/-
male mice with MD
or ND female mice. We hypothesized that Cyp26a1+/-
mutant embryos would exhibit a
lower RA degrading efficiency than their Cyp26a1+/+
wild-type littermates and that
exposure to maternal diabetes would exacerbate these genetic differences.
Indeed, E9 embryos from different genotype-maternal environment combinations
Page 13 of 47 Diabetes

14
showed prominent differences in Cyp26a1 levels (Fig. 5A). The Cyp26a1 mRNA levels
in tailbuds of Cyp26a1+/-
embryos of MD mice were reduced to half of the level in
Cyp26a1+/+
embryos of ND mice (Fig. 5B), with a corresponding decrease in
CYP26-mediated RA degrading efficiency (Fig. 5C). When RA levels were raised, via
maternal challenge with 25 mg/kg of RA, a 50% reduction in Cyp26a1 expression levels
and RA degrading efficiency in tailbuds of Cyp26a1+/-
embryos of MD mice resulted in
exposure to an eight-fold higher effective concentration of RA in comparison to tailbuds
of Cyp26a1+/+
embryos of ND mice (Fig. 5D). This effect was noted 3 h after RA
injection, when accumulation of RA had reached peak level (Fig. 2B). In agreement with
these findings, Cyp26a1+/-
embryos of MD mice were most sensitized to RA-induced
caudal truncation (Supplementary Figure 5), as indicated by the smallest ratio of tail
length (TL) to crown-rump length (CRL) (Fig. 5E). TL/CRL ratio was used as a
‘surrogate’ both for regression of multiple caudal structures in mice and for the analogous
‘caudal regression’ process that affects species without tails, such as humans. In addition
to caudal truncation, renal malformations are commonly associated with caudal regression
(15,16). Indeed, we also found a twelve-fold increase in incidence (Fig. 5F) and severity
(Table 1) of renal malformations in near-term Cyp26a1+/-
fetuses exposed to maternal
diabetes compared with wild-type fetuses in non-diabetic pregnancy when being
challenged with a teratogenic dose of RA.
Enhancing RA Degrading Efficiency Counteracts Increased Susceptibility to RA
Teratogenesis Induced by Maternal Diabetes
Cyp26a1 is highly RA-inducible, as it contains multiple RA response elements (31). Thus,
as a proof-of-principle, we attempted to ‘pre-condition’ embryos of MD mice by using an
Page 14 of 47Diabetes

15
exogenous sub-teratogenic RA dose to up-regulate Cyp26a1 expression, in order to
determine whether pre-conditioning could lead to a protective effect against RA
teratogenesis. Previous findings showed that maternal oral administration of 2.5 mg/kg
RA is sufficient to achieve near full rescue of mid-gestation mouse embryos lacking
Raldh2, the principal RA synthetic enzyme (32). Therefore, we pre-conditioned pregnant
mice with 0.625 or 1.25 mg/kg RA via oral feeding. These dosages are far below the
teratogenic concentration range, but yielded a dose-dependent increase in Cyp26a1
mRNA levels in tailbuds of embryos by 2 h after administration (Fig. 6A). Notably,
supplementation with 0.625 mg/kg RA did not induce changes in Fgf8, Wnt3a and Cdx2
expression (Supplementary Figure 6), but up-regulated the expression of Cyp26a1 in
tailbuds of the MD group to a level similar to that of the ND group fed with vehicle (Fig.
6A), with a concomitant normalization of RA degrading efficiency (Fig. 6B). Then, when
maternally challenged with an intraperitoneal injection of a teratogenic dose of 25 mg/kg
RA, we found the severity of caudal truncation to be significantly reduced, as shown by
the significantly higher TL/CRL ratio in embryos of RA-pre-conditioned mice than in
embryos from vehicle-fed mice in both MD and ND conditions (Fig. 6C). Even the
higher (1.25 mg/kg) pre-conditioning dose of RA was non-teratogenic and by itself did
not affect the TL/CRL ratio of the embryo. While it could have had other effects on the
embryo, in addition to up-regulating Cyp26a1, the highly comparable pattern of
dose-dependent up-regulation of Cyp26a1 and dose-dependent increase in the TL/CRL
ratio, in the absence of changes in the key caudal regulatory genes, suggests a specific
effect of pre-conditioning. These findings support the idea that pre-conditioning the
embryo via enhancing RA degrading efficiency can offer a protective effect against RA
teratogenesis and abolish the increased propensity of embryos from diabetic pregnancy to
Page 15 of 47 Diabetes

16
RA-induced caudal truncation.
Amongst the most frequent congenital anomalies associated with maternal
diabetes are neural tube defects (NTDs) (4). Expression levels of Cyp26a1 in the cranial
mesenchyme and the caudal neural plate are prominently reduced in E8 embryos of MD
mice (Fig. 1B). Moreover, Cyp26a1-/-
embryos exhibit exencephaly and spina bifida
(13,14), suggesting the importance of CYP26A1 enzyme in protecting these tissues from
the deleterious effects of ectopic RA signalling. We found that injection of 25 mg/kg of
RA at E8 induced around 6.7% exencephaly (Fig. 7A) and 4.4% spina bifida (Fig. 7B) in
Cyp26a1+/+
embryos of ND mice. However, the incidence of RA-induced exencephaly
and spina bifida was markedly increased by six- and seven-fold respectively in
Cyp26a1+/+
embryos exposed to diabetes. Similar trend was found in embryos of ICR x
ICR background (Supplementary Figure 7). The penetrance of NTDs was further
exacerbated to 75.0% exencephaly and 71.3% spina bifida in Cyp26a1+/-
embryos of MD
mice with a pre-existing genetic defect of RA catabolism. Similar to caudal truncation,
the increase in susceptibility to RA-induced exencephaly and spina bifida caused by
maternal diabetes was significantly reduced when embryos were pre-conditioned by
maternal feeding of low dose RA. Together, these findings support the idea that
deregulated RA catabolism resulting from reduced levels of Cyp26a1 expression acts to
sensitize embryos of diabetic pregnancy to fluctuations in RA levels.
Page 16 of 47Diabetes

17
DISCUSSION
In the present study, we found that the embryonic expression of the key RA catabolizing
enzyme Cyp26a1 is significantly down-regulated under maternal diabetes. This leads to a
decrease in RA inactivation efficiency and enhances the deleterious effect of excessive
RA signalling on key caudal regulatory genes, such as Fgf8, Wnt3a and Cdx2, which are
required for continued axial elongation (27). We previously demonstrated that enhanced
RA-induced down-regulation of Wnt3a exacerbated apoptosis in the tailbud of mouse
embryos exposed to a diabetic or hyperglycemic condition, leading to premature
termination of caudal development (18,33). This resulted in absence of lower vertebrae,
imperforate anus, clubfeet, renal and caudal spinal cord malformations, all of which are
commonly associated with caudal regression (10,11,15-17).
The most frequent anomalies in pregnancies complicated by pregestational
diabetes are NTDs and congenital heart defects (CHDs) (4,5). Results of this study
support the idea that a decrease in Cyp26a1 expression also significantly increases the
propensity of embryos from diabetic pregnancy to exencephaly and spina bifida when RA
homeostasis is perturbed. Although we have not examined heart development, Cyp26a1
is expressed in the cardiac neural crest cells, primitive heart tube and outflow tract, and
Cyp26a1-/-
embryos exhibit CHDs (13,14). Specific subgroups of CHD associated with
improper RA signalling (8,9) are highly similar to those showing increased frequencies in
the offspring of mothers with pregestational diabetes (4,34). As tight regulation of RA
signalling is critical for many developmental processes, deregulated RA catabolism in
early embryonic life can perturb the development of multiple organ systems, which is in
line with the finding that specific multiple congenital anomalies are common in affected
Page 17 of 47 Diabetes

18
offspring of mothers with pregestational diabetes (4,5).
In our diabetic mouse colony, around 5% of embryos developed NTDs. However,
there are large variations in congenital malformation frequencies between different
laboratories, with the frequency of NTDs reaching over 50% in some reports (35). While
genetic background affects the susceptibility to diabetic embryopathy (2,36), recent
studies demonstrate that different types of rodent chow could significantly alter the
frequency of NTDs in embryos of diabetic mice, which supports the idea that maternal
diet is an important modifier of penetrance of malformation (3). Individual malformation
risk will therefore depend on the interaction between genetic and environmental
influences, which affects the developmental threshold of gene expression for normal
development.
Many genetic and environmental factors can affect embryonic RA homeostasis
and signalling pathways to potentiate the effect of maternal diabetes in increasing
malformation risk in the offspring. In humans, genetic polymorphisms of CYP26A1 that
exhibit significantly lower degrading efficiency of RA have been identified (37,38).
Duplication and polymorphisms of human ALDH1A2 gene (encoding the principal RA
synthetic enzyme during embryogenesis) are associated with increase in serum RA levels
(39) and various types of congenital anomalies including CHDs and NTDs (40). Thus,
common genetic variants involved in RA metabolism and signalling pathways could
potentially be used as markers to identify diabetic pregnancies with increased
malformation risk.
Retinoids are recognized human teratogens (41). Various forms of retinoids are in
clinical use or under study for treatment of a variety of diseases, including skin disorders,
obesity, diabetes and related complications (42). A well-known example is isotretinoin
Page 18 of 47Diabetes

19
(13-cis RA) prescribed for treatment of severe acne. It has been shown that the
teratogenic threshold for isotretinoin is much lower in humans (0.5 mg/kg) (43) than in
mice (100 mg/kg) (44). Human embryos are highly sensitive to isotretinoin, with a
pattern of malformations (8) similar to that seen in animals exposed to all-trans RA
teratogenesis (9). In fact, the teratogenic effect of 13-cis RA has been demonstrated in
animals and suggested for humans to be mediated via its conversion to all-trans RA,
which then binds to the nuclear RA receptors to regulate gene expression (45). Moreover,
our previous (18) and present studies show that maternal diabetes can enhance RA
teratogenicity. Thus the teratogenic threshold for isotretinoin in embryos of women with
pregestational diabetes may be even lower than the 0.5 mg/kg figure previously quoted
(43).
Other than direct exposure to retinoids, medications, such as the anti-convulsant
valproic acid, and fluconazole for treating fungal and yeast infections, have been shown
to increase embryonic RA levels and induce malformations (46,47). Maternal smoking
may also impose increased risk since recent studies suggest that the teratogenic effect of
nicotine on embryonic development is highly associated with suppression of Cyp26a1
and perturbation of RA signalling (48). In fact, many chemicals can modulate RA
homeostasis. As such, neural tube and axial defects mediated by modulation of RA
homeostasis is proposed to be adopted as an Adverse Outcome Pathway (AOP)
framework for assessing developmental toxicity of chemicals (49).
There is a global trend that type 2 diabetes increasingly affects children and
adolescents (50). As the prevalence of diabetes in women of childbearing age continues
to rise, the number of pregnancies complicated by pregestational diabetes is likely to
increase exponentially. The partial penetrance and variable expressivity of diabetic
Page 19 of 47 Diabetes

20
embryopathy underscore its multifactorial nature, implicating interactions between
genetic make-up of the embryo, maternal factors and environmental influence. It is
therefore of utmost importance to identify risk factors so as to reduce malformations in
diabetic pregnancy. The present study is the first to show that RA catabolism is
deregulated in embryos exposed to diabetes and suggests that pregnancies of diabetic
women may be more vulnerable to perturbation in RA homeostasis and signalling. This
may highlight the need to be cautious in assessing the upper safe levels of drugs,
supplements and potential teratogens for women with pregestational diabetes, particularly
those that have effects on RA homeostasis and signalling. Association studies should be
conducted to determine whether specific genetic variants or peri-conceptional exposure to
environmental agents that perturb RA homeostasis and signalling could be potentiation
factors that increase individual malformation risk in the offspring of diabetic mothers.
Identifying these targets could contribute to genetic screening and preventive healthcare
for diabetic women with childbearing potential. Furthermore, as a proof-of-principle, we
have demonstrated the protective effect of correcting RA catabolism in embryos of
diabetic mice. This finding may form the basis for developing stratified medicine to
reduce the risk of congenital anomalies in pregnancies complicated by pregestational
diabetes.
Page 20 of 47Diabetes

21
Acknowledgements. The authors thank Prof. Hiroshi Hamada of RIKEN Center for
Developmental Biology for the gift of Cyp26a1 mutant mice, and Cyp26a1, b1 and c1
mouse cDNA plasmids; Johnson & Johnson Pharmaceutical Research & Development
for the gift of R115866; Dr. M. Wagner of Howard Hughes Medical Institute for the gift
of RA reporter cell line. The authors thank the anonymous reviewers for their extensive
and valuable input which greatly improved the paper.
Funding. This work was supported by funding from Hong Kong Research Grants
Council General Research Fund project reference 441606 and 474109 to A.S.W.S.,
Y.C.L., C.C.W., P.J.M. and A.J.C..
Duality of Interest. No potential conflicts of interest relevant to this article were
reported.
Author Contributions. L.M.Y.L. researched data and wrote the manuscript. M.B.W.L.
and R.C.Y.K. researched data. Y.C.L. provided technical advice and contributed research
materials. C.C.W contributed to discussion. P.J.M. provided technical advice, contributed
research materials and edited the manuscript. A.J.C. contributed to discussion and edited
the manuscript. A.S.W.S. designed the study and wrote the manuscript. A.S.W.S. is the
guarantor of this work, and as such, had full access to all the data in this study and takes
responsibility for the integrity of the data and the accuracy of the data analysis.
Page 21 of 47 Diabetes

22
References
1. Correa A, Gilboa SM, Besser LM, et al. Diabetes mellitus and birth defects. Am J
Obstet Gynecol 2008;199:237.e1-9
2. Pani L, Horal M, Loeken MR. Polymorphic susceptibility to the molecular causes
of neural tube defects during diabetic embryopathy. Diabetes 2002;51:2871-2874
3. Kappen C, Kruger C, MacGowab J, Salbaum JM. Maternal diet modulates the risk
for neural tube defects in a mouse model of diabetic pregnancy. Reprod Toxicol
2011;31:41-49
4. Garne E, Loane M, Dolk H, et al. Spectrum of congenital anomalies in pregnancies
with pregestational diabetes. Birth Defects Res A Clin Mol Teratol
2012;94:134-140
5. Martinez-Frias ML. Epidemiological analysis of outcomes of pregnancy in diabetic
mothers: identification of the most characteristic and most frequent congenital
anomalies. Am J Med Genet 1994;51:108-113
6. Kucera J. Rate and type of congenital anomalies among offspring of
diabeticwomen. J Reprod Med 1971;7:73-82
7. Rothman KJ, Moore LL, Singer MR, Nguyen US, Mannino S, Milunsky A.
Teratogenicity of high vitamin A intake. N Engl J Med 1995;333:1369-1373
8. Lammer EJ, Chen DT, Hoar RM, et al. Retinoic acid embryopathy. N Engl J Med
1985;313:837-841
9. Shenefelt RE. Morphogenesis of malformations in hamsters caused by retinoic acid:
relation to dose and stage at treatment. Teratology 1972;5:103-118
10. Padmanabhan R. Retinoic acid-induced caudal regression syndrome in the mouse
fetus. Reprod Toxicol 1998;12:139-151
11. Shum AS, Poon LL, Tang WW, et al. Retinoic acid induces down-regulation of
Wnt-3a, apoptosis and diversion of tailbud cells to a neural fate in the mouse
embryo. Mech Dev 1999;84:17-30
12. Fujii H, Sato T, Kaneko S, et al. Metabolic inactivation of retinoic acid by a novel
P450 differentially expressed in developing mouse embryos. EMBO J
1997;16:4163-4173
13. Abu-Abed S, Dollé P, Metzger D, Beckett B, Chambon P, Petkovich M. The
retinoic acid-metabolizing enzyme, CYP26A1, is essential for normal hindbrain
patterning, vertebral identity, and development of posterior structures. Genes Dev
2001;15:226-240
14. Sakai Y, Meno C, Fujii H, et al. The retinoic acid-inactivating enzyme CYP26 is
essential for establishing an uneven distribution of retinoic acid along the
anterio-posterior axis within the mouse embryo. Genes Dev 2001;15:213-225
15. Tse HK, Leung MB, Woolf AS, et al. Implication of Wt1 in the pathogenesis of
nephrogenic failure in a mouse model of retinoic acid-induced caudal regression
syndrome. Am J Pathol 2005;166:1295-1307
16. Duhamel B. From the mermaid to anal imperforation: the syndrome of caudal
regression. Arch Dis Child 1961;36:152-155
17. Pang D. Sacral agenesis and caudal spinal cord malformations. Neurosurgery
1993;32:755-778
18. Chan BW, Chan KS, Koide T, et al. Maternal diabetes increases the risk of caudal
regression caused by retinoic acid. Diabetes 2002;51:2811-2816
Page 22 of 47Diabetes

23
19. Wilkinson DG. Whole mount in situ hybridization of vertebrate embryos. In situ
hybridization: A Practical Approach, IRL Press, Oxford. 1992;75-83
20. Yamamoto M, Dräger UC, McCaffery P. A novel assay for retinoic acid catabolic
enzymes shows high expression in the developing hindbrain. Brain Res Dev Brain
Res 1998;107:103-111
21. Stoppie P. R115866 inhibits all-trans-retinoic acid metabolism and exerts retinoidal
effects in rodents. J Pharmacol Exp Ther 2000;293:304-312
22. Wagner M, Han B, Jessell TM. Regional differences in retinoid release from
embryonic neural tissue detected by an in vitro reporter assay. Development
1992;116:55-66
23. Schmidt CK, Brouwer A, Nau H. Chromatographic analysis of endogenous
retinoids in tissues and serum. Anal Biochem 2003;315:36-48
24. Lee LM, Leung CY, Tang WW, et al. A paradoxical teratogenic mechanism for
retinoic acid. Proc Natl Acad Sci U S A 2012;109:13668-13673
25. Tzimas G, Thiel R, Chahoud I, Nau H. The area under the concentration-time curve
of all-trans-retinoic acid is the most suitable pharmacokinetic correlate to the
embryotoxicity of this retinoid in the rat. Toxicol Appl Pharmacol
1997;143:436-444
26. Iulianella A, Beckett B, Petkovich M, Lohnes D. A molecular basis for retinoic
acid-induced axial truncation. Dev Biol 1999;205:33-48
27. Neijts R, Simmini S, Giuliani F, van Rooijen C, Deschamps J. Region-specific
regulation of posterior axial elongation during vertebrate embryogenesis. Dev Dyn
2014;243:88-98
28. Kumar S, Duester G. Retinoic acid controls body axis extension by directly
repressing Fgf8 transcription. Development 2014;141:2972-2977
29. Lohnes D, Kastner P, Dierich A, Mark M, LeMeur M, Chambon P. Function of
retinoic acid receptor gamma in the mouse. Cell 1993;73:643-658
30. Kastner P, Mark M, Ghyselinck N, et al. Genetic evidence that the retinoid signal is
transduced by heterodimeric RXR/RAR functional units during mouse development.
Development 1997;124:313-326
31. Zhang Y, Zolfaghari R, Ross AC. Multiple retinoic acid response elements
cooperate to enhance the inducibility of CYP26A1 gene expression in liver. Gene
2010;464:32-43
32. Niederreither K, Subbarayan V, Dollé P, Chambon P. Embryonic retinoic acid
synthesis is essential for early mouse post-implantation development. Nat Genet
1999;21:444-448
33. Leung MB, Choy KW, Copp AJ, Pang CP, Shum AS. Hyperglycaemia potentiates
the teratogenicity of retinoic acid in diabetic pregnancy in mice. Diabetologia
2004;47:515-522
34. Lisowski LA, Verheijen PM, Copel JA, et al. Congenital heart disease in
pregnancies complicated by maternal diabetes mellitus. An international clinical
collaboration, literature review, and meta-analysis. Herz 2010;35:19-26
35. Fine EL, Horal M, Chang T, Fortin G, Loeken MR. Evidence that elevated glucose
causes altered gene expression, apoptosis, and neural tube defects in a mouse model
of diabetic pregnancy. Diabetes 1999;48:2454-2562
36. Ejdesjö A, Wentzel P, Eriksson UJ. Genetic and environmental influence on
diabetic rat embryopathy. Am J Physiol Endocrinol Metab 2011;300:E454-467
Page 23 of 47 Diabetes

24
37. Lee SJ, Perera L, Coulter SJ, Mohrenweiser HW, Jetten A, Goldstein JA. The
discovery of new coding alleles of human CYP26A1 that are potentially defective
in the metabolism of all-trans retinoic acid and their assessment in a recombinant
cDNA expression system. Pharmacogenet Genomics 2007; 17:169-180
38. Rat E, Billaut-Laden I, Allorge D, et al. Evidence for a functional genetic
polymorphism of the human retinoic acid-metabolizing enzyme CYP26A1, an
enzyme that may be involved in spina bifida. Birth Defects Res A Clin Mol Teratol
2006;76:491-498
39. El Kares R, Manolescu DC, Lakhal-Chaieb L, et al. A human ALDH1A2 gene
variant is associated with increased newborn kidney size and serum retinoic acid.
Kidney Int 2010;78:96-102
40. Deak KL, Dickerson ME, Linney E, et al. Analysis of ALDH1A2, CYP26A1,
CYP26B1, CRABP1, and CRABP2 in human neural tube defects suggests a
possible association with alleles in ALDH1A2. Birth Defects Res A Clin Mol
Teratol 2005;73:868-875
41. Soprano DR, Soprano KJ. Retinoids as teratogens. Annu Rev Nutr
1995;15:111-132
42. Villarroya F, Iglesias R, Giralt M. Retinoids and retinoid receptors in the control of
energy balance: novel pharmacological strategies in obesity and diabetes. Curr Med
Chem 2004;11:795-805
43. Rosa FW, Wilk AL, Kelsey FO. Teratogen update: vitamin A congeners.
Teratology 1986;33:355-364
44. Kraft JC, Kochhar DM, Scott WJ, Nau H. Low teratogenicity of 13-cis-retinoic acid
(isotretinoin) in the mouse corresponds to low embryo concentrations during
organogenesis: comparison to the all-trans isomer. Toxicol Appl Pharmacol
1987;87:474-482
45. Nau H. Teratogenicity of isotretinoin revisited: species variation and the role of
all-trans-retinoic acid. J Am Acad Dermatol 2001;45:S183-187
46. Chuang CM, Chang CH, Wang HE, et al. Valproic acid downregulates RBP4 and
elicits hypervitaminosis A-teratogenesis - a kinetic analysis on retinol/retinoic acid
homeostatic system. PLoS One 2012;7:e43692
47. Di Renzo F, Broccia ML, Giavini E, Menegola E. Citral, an inhibitor of retinoic
acid synthesis, attenuates the frequency and severity of branchial arch abnormalities
induced by triazole-derivative fluconazole in rat embryos cultured in vitro. Reprod
Toxicol 2007;24:326-332
48. Feltes BC, de Faria Poloni J, Notari DL, Bonatto D. Toxicological effects of the
different substances in tobacco smoke on human embryonic development by a
systems chemo-biology approach. PLoS One 2013;8:e61743
49. Tonk EC, Pennings JL, Piersma AH. An adverse outcome pathway framework for
neural tube and axial defects mediated by modulation of retinoic acid homeostasis.
Reprod Toxicol 2015;55:104-113
50. Reinehr T. Type 2 diabetes mellitus in children and adolescents. World J Diabetes
2013;4:270-281
Page 24 of 47Diabetes

25
Table 1. Frequency of various phenotypes (categorized according to the severity of
malformations) in E18 Cyp26a1 heterozygous null (+/-) and wild-type (+/+) fetuses from
non-diabetic (ND) and manifestly diabetic (MD) mice induced by in vivo challenge with 40
mg/kg RA at E9
Maternal state ND MD
Genotype of fetuses +/+ +/- +/+ +/-
No. of litters 11 11
No. of live fetuses 68 61 48 49
Two normal kidneys 91.2% 80.3% 62.5% 36.7%
Unilateral non-agenesis renal malformations
(contralateral kidney being normal)
2.9% 9.8% 16.7% 26.5%
Bilateral non-agenesis renal malformations 2.9% 8.2% 12.5% 10.2%
Unilateral renal agenesis (solitary kidney being normal) 1.5% 1.6% 0 8.2%
Unilateral renal agenesis (solitary kidney with
non-agenesis malformations
1.5% 0 4.2% 6.1%
Bilateral renal agenesis 0 0 4.2% 12.2%
Page 25 of 47 Diabetes

26
FIGURE LEGENDS
Figure 1 - Embryos of diabetic mice exhibit specific down-regulation of Cyp26a1. A-D,F
and H: Whole-mount ISH patterns of Cyp26 genes in embryos of manifestly diabetic
(MD) mice compared with those of non-diabetic (ND) mice. Cyp26a1 mRNA transcripts
are seen in extraembryonic endoderm (red arrowhead) and headfold mesenchyme (yellow
arrowhead) of E7 conceptuses (A), cranial mesenchyme (green arrowhead) and caudal
neural plate (orange arrowhead) of E8 embryos (B), craniofacial, cervical and branchial
arch mesenchyme (circled) (C), and tailbud (blue arrowhead) of E9 embryos (D).
Cyp26b1 (F) and Cyp26c1 (H) are expressed in the cranial but not in the tailbud region of
E9 embryos. At least 20 embryos from 5-6 litters were examined for each group. Scale
bar = 0.05 mm (A), 0.1 mm (B), 0.7 mm (C), 0.2 mm (D), 0.7 mm for whole embryo and
0.35 mm for caudal region (F and H). E,G,I: Quantification of mRNA levels of Cyp26a1
(E), Cyp26b1 (G) and Cyp26c1 (I), normalized to β-actin, and expressed relative to ND,
which was set as 1 (n = 5 from 5 litters). *P < 0.05, Student’s t test. Error bars represent
mean ± SEM.
Figure 2 - Embryos of diabetic mice show reduced efficiency of RA catabolism. A: In
vitro RA degrading efficiency, presented as % of RA in the medium being degraded by
the tailbud lysate, in the presence or absence of cofactor (NADPH) and reducing agent
(DTT) for optimal activity of CYP26 enzymes, and varying concentrations of R115866
(CYP26 inhibitor) (n = 18 in ND and MD groups with NADPH-DTT, and n = 3-9 in
other groups, from 20 ND and 18 MD litters). *P < 0.001, Student’s t test; †R
2 = 0.742
Page 26 of 47Diabetes

27
and P = 0.001, linear regression. B: In vivo RA clearance measured as the amount of RA
released from individual tailbuds, using a RA reporter cell line, at hourly intervals after
injection of 50 mg/kg RA at E9 (n = 16-42 from 3-8 litters). *P < 0.001 vs ND; Student’s
t test and nonlinear regression. Error bars represent mean ± SEM.
Figure 3 - Tailbuds of E9 embryos of diabetic mice have increased levels of endogenous
RA detected using a RA reporter cell line. A: Figure to illustrate the caudal-most portion
of the tailbud (boundary marked by dotted line) as excised for detection of bioactive RA.
B: Percentage of tailbuds excised from embryos of non-diabetic (ND) and manifestly
diabetic (MD) mice that have induced different numbers of positively stained cells in the
RA reporter cell line (n = 19 for ND and 22 for MD from 3 and 4 litters respectively). C:
Representative figures of excised tailbuds that were placed directly on the RA reporter
cells and have induced different numbers of stained cells in the RA reporter cell line.
Figure 4 - Tailbuds of E9 embryos of diabetic mice exhibit a greater magnitude of
suppression of key genes for caudal development induced by RA. A: Quantification of
mRNA levels of various caudal regulatory genes and RA nuclear receptors, normalized to
β-actin, and expressed relative to ND, which was set as 1, in tailbuds of embryos of
non-diabetic (ND) and manifestly diabetic (MD) mice at E9 (n = 5 from 5 litters). **P <
0.01, Student’s t test. B and C: Quantification of mRNA levels of Cyp26a1 (B), and
various caudal regulatory genes and RA nuclear receptors (C), normalized to β-actin, and
expressed relative to ND (CON), which was set as 1, in tailbuds of embryos of ND and
MD mice 4 h after maternal injection of 50 mg/kg RA (50RA) or vehicle as control (CON)
Page 27 of 47 Diabetes
28
at E9 (n = 5 from 5 litters). *P < 0.05; **P < 0.01; ***P < 0.001, one-way ANOVA
followed by Bonferroni test. Error bars represent mean ± SEM.
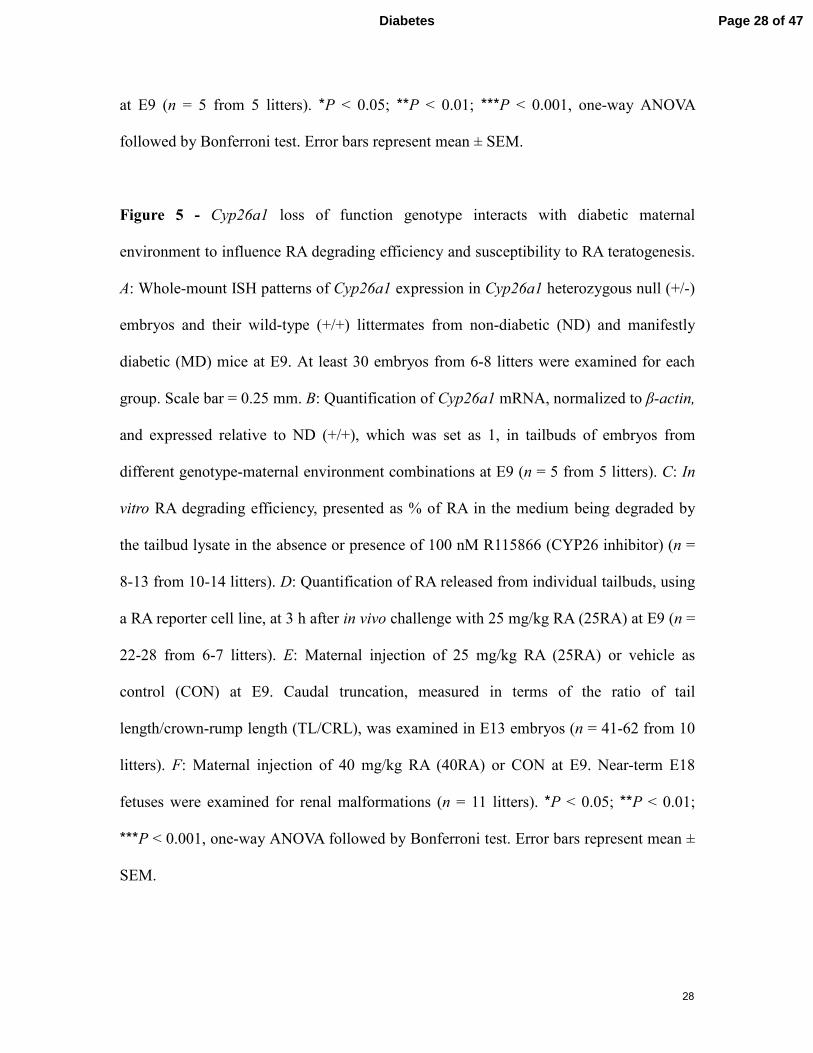
Figure 5 - Cyp26a1 loss of function genotype interacts with diabetic maternal
environment to influence RA degrading efficiency and susceptibility to RA teratogenesis.
A: Whole-mount ISH patterns of Cyp26a1 expression in Cyp26a1 heterozygous null (+/-)
embryos and their wild-type (+/+) littermates from non-diabetic (ND) and manifestly
diabetic (MD) mice at E9. At least 30 embryos from 6-8 litters were examined for each
group. Scale bar = 0.25 mm. B: Quantification of Cyp26a1 mRNA, normalized to β-actin,
and expressed relative to ND (+/+), which was set as 1, in tailbuds of embryos from
different genotype-maternal environment combinations at E9 (n = 5 from 5 litters). C: In
vitro RA degrading efficiency, presented as % of RA in the medium being degraded by
the tailbud lysate in the absence or presence of 100 nM R115866 (CYP26 inhibitor) (n =
8-13 from 10-14 litters). D: Quantification of RA released from individual tailbuds, using
a RA reporter cell line, at 3 h after in vivo challenge with 25 mg/kg RA (25RA) at E9 (n =
22-28 from 6-7 litters). E: Maternal injection of 25 mg/kg RA (25RA) or vehicle as
control (CON) at E9. Caudal truncation, measured in terms of the ratio of tail
length/crown-rump length (TL/CRL), was examined in E13 embryos (n = 41-62 from 10
litters). F: Maternal injection of 40 mg/kg RA (40RA) or CON at E9. Near-term E18
fetuses were examined for renal malformations (n = 11 litters). *P < 0.05; **P < 0.01;
***P < 0.001, one-way ANOVA followed by Bonferroni test. Error bars represent mean ±
SEM.
Page 28 of 47Diabetes

29
Figure 6 - Pre-conditioning with low dose RA up-regulates Cyp26a1, increases RA
degrading efficiency, and protects against RA-induced caudal truncation. A:
Quantification of Cyp26a1 mRNA, normalized to β-actin, and expressed relative to ND
(CON), which was set as 1, in tailbuds of E9 embryos from non-diabetic (ND) and
manifestly diabetic (MD) mice 2 h after maternal oral feeding with low dose RA of 0.625
mg/kg (0.625RA) or 1.25 mg/kg (1.25RA), or with vehicle as control (CON) (n = 5 from
5 litters). B: In vitro RA degrading efficiency, presented as % of RA in the medium being
degraded by the tailbud lysate from embryos with or without preconditioned with
0.625RA (n = 5 from 3-5 litters). C: Embryos, with or without preconditioned with low
dose RA, were maternally challenged with a teratogenic dose of 25 mg/kg RA (25RA) at
E9, and examined for caudal truncation, measured in terms of the ratio of tail
length/crown-rump length (TL/CRL) at E13 (n = 34-60 from 3-5 litters). *P < 0.01; **P <
0.001, Student’s t test. †R
2 = 0.900 and P < 0.001;
††R
2 = 0.869 and P < 0.001;
†††R
2 =
0.610 and P < 0.001; ††††
R2 = 0.729 and P < 0.001, linear regression. Dotted line
represents no significant difference between the two groups. Error bars represent mean ±
SEM.
Figure 7 - Increased susceptibility of embryos of diabetic mice to RA-induced neural
tube defects is abolished by pre-conditioning with low dose RA. A and B: Incidence rates
of exencephaly (A) and spina bifida (B) in E13 Cyp26a1 heterozygous null (+/-) and
wild-type (+/+) embryos from non-diabetic (ND) and manifestly diabetic (MD) mice (n =
8-9 litters). Effect of pre-conditioning by oral feeding of low dose 0.625 mg/kg RA
(0.625RA) is compared with vehicle-fed control (CON) or no treatment (NT) group, 2 h
Page 29 of 47 Diabetes

30
prior to in vivo challenge with a teratogenic dose of 25 mg/kg RA (25RA) at E8. *P <
0.05; **P < 0.01; ***P < 0.001, one-way ANOVA followed by Bonferroni test. Dotted line
represents no significant difference between the two groups. Error bars represent mean ±
SEM.
Page 30 of 47Diabetes
0.0
0.4
0.8
1.2
0.0
0.4
0.8
1.2
ND MD
0.0
0.4
0.8
1.2
ND MD
ND MD
E7
ND MD
E8
E9E9
Rel
ativ
e ex
pres
sion
of
Cyp
26a1
/ -a
ctin
A B
C D
E ND MD
E7Conceptus
E8Embryo
E9Embryo
E9Tailbud
Cyp
26b
1 C
yp26
a1
F
ND MD
Cyp
26c1
H I
G
E9
E9
* * * *
E9
Figure 1
Rel
ativ
e ex
pres
sion
of
Cyp
26b1
/ -a
ctin
Rel
ativ
e ex
pres
sion
of
Cyp
26c1
/-a
ctin
ND MD
ND MD
Page 31 of 47 Diabetes

0
20
40
60
80
100
0
2
4
6
8
0 1 2 3 4 5 6 7 8 9
Tailbud lysate
NADPH-DTT
CYP26 inhibitor (nM)
ND
-
-
ND
+
-
ND
+
1
ND
+
10
ND
+
100
MD
+
-
MD
+
100
% R
A in
med
ium
bei
ng d
egra
de
d
†
A
Am
ount
of
RA
rel
ease
d fr
om
indi
vidu
al t
ailb
ud (
nM)
No. of hours post-injection of RA
BMDND
**
ND MD
Figure 2
*
*
*
**
*
*
*
Page 32 of 47Diabetes

0
20
40
60
80
100
ND MD
(-) (+) (++) (+++)
A B
C
> 40 stained cells (+++)
21-40 stained cells (++)
10-20 stained cells (+)
< 10 stained cells (-)% o
f ta
ilbud
s
Figure 3
ND MD
Page 33 of 47 Diabetes
0
2
4
6
8
10
12
14
Cyp26a1
0.0
0.2
0.4
0.6
0.8
1.0
1.2
Fgf 8 Wnt3a Cdx2 RARg RXRa
Figure 3
Rar RxrFgf8 Wnt3a Cdx2 Cyp26a1
BND MD
ND (CON)
MD (CON) ND (50RA) MD (50RA)
0.0
0.2
0.4
0.6
0.8
1.0
1.2
Fgf 8 Wnt3a Cdx2 RARg RXRaRxrCdx2Fgf8 Wnt3a Rar
***
***
*C
**
******
**
*
**
*** ***
Rel
ativ
e ex
pres
sion
of
targ
et g
ene/-
actin
Rel
ativ
e ex
pres
sion
of
Cyp
26a1
/-a
ctin
Rel
ativ
e ex
pres
sion
of
targ
et g
ene/-
actin
***** **
***A
Figure 4
Page 34 of 47Diabetes

0.0
0.2
0.4
0.6
0.8
1.0
ND SD
0
10
20
30
40
50
60
70
ND SD Inhibitor0.0
0.2
0.4
0.6
0.8
1.0
1.2
ND MD
**
0
20
40
60
80
100
ND MD
ND (+/+) MD (+/+) MD (+/-)ND (+/-)
A
B
ND MD
**
****
ND (+/+) ND (+/-) MD (+/+) MD (+/-)
Rel
ativ
e ex
pres
sion
of
Cyp
26a1
/ -a
ctin
***
TL/
CR
L
E
0.0
0.1
0.2
0.3
0.4
0.5
0.6
ND MD ND MDND NDMD MD(CON) (CON) (25RA) (25RA)
***
******
***
****
D
ND MD
******
******
(25RA) (25RA)
***C
% R
A in
med
ium
bei
ngde
grad
ed
ND MD
**
**
***
***%
em
bryo
s pe
r lit
ter
with
re
nal m
alfo
rmat
ions
ND(40RA)
MD(40RA)
******
***
**
F
Figure 5
***
Am
ount
of
RA
rel
ease
d fr
om in
divi
dual
tai
lbud
(nM
)
ND +CYP26 inhibitor
Page 35 of 47 Diabetes

0.0
0.5
1.0
1.5
2.0
2.5
3.0
3.5
CON
0.62
5RA
1.25
RACO
N
0.62
5RA
1.25
RA
0.0
0.1
0.2
0.3
0.4
0.5
CON
1.25
RA
CON +
25R
A
0.62
5RA + 2
5RA
1.25
RA + 2
5RACO
N
1.25
RA
CON +
25R
A
0.62
5RA + 2
5RA
1.25
RA + 2
5RA
0
20
40
60
80
100
CON
0.62
5RACO
N
0.62
5RA
% R
A in
med
ium
be
ing
degr
ade
d
TL/
CR
L
***
††† ††††
TL/
CR
L
**
†††
*A B
C
**
ND MD
Figure 6
Rel
ativ
e ex
pres
sion
of
Cyp
26a1
/ -a
ctin
** *** *
Page 36 of 47Diabetes

0
20
40
60
80
100
CTL CTL CTL-OF SD SD SD-OF
0
20
40
60
80
100
CTL CTL CTL-OF SD SD SD-OF
A
% e
mbr
yos
per
litte
r w
ith
spin
a bi
fida
% e
mbr
yos
per
litte
r w
ith
exen
cep
hal
y
**
**
***
B**
**
*
**
**
*
**
** **
ND (+/+)
ND (+/-)
MD (+/+) MD (+/-)
Figure 7
***
***
*
*
*
Page 37 of 47 Diabetes

0.0
0.5
1.0
1.5
2.0
2.5
-12-11-10-9-8-7-6
OD
600
Log RA concentration (M)
Supplementary Figure 1. A representative standard curve showing the response ofthe RA reporter cell line to serially diluted RA solutions from 10-6M to 10-11M. Alinear dose-response is present from 10-7M to 10-10M. RA concentration of the samplewas plotted against the standard curve within the linear range. R2 represents thecoefficient of determination for linear regression analysis.
R2 = 0.9994
Page 38 of 47Diabetes

0
2
4
6
8
10
12
Immediatelyfrozen
37 °C 20hr
Supplementary Figure 2. RA was stable at 37°C for 24 h. RA was added to theculture medium at a concentration of 10 nM. The medium was either immediatelyfrozen and stored at -80°C (n = 4) or incubated at 37°C for 24 h in a 5% CO2 incubator(n = 4). The RA concentrations of the two groups of samples were then determined bythe RA reporter cell line. There was no significant degradation of RA in the samplethat had been incubated at 37°C for 24 h when compared with the immediately frozensample.
Am
ount
of
RA
(nM
)
Immediatelyfrozen
37oC for 24 h
Page 39 of 47 Diabetes

0
1
2
3
4
ND MD
Am
ount
of
prot
ein
per
tailb
ud (
µg)
Supplementary Figure 3. No significant difference in the protein content of theexcised tailbuds from embryos of non-diabetic (ND) and manifestly diabetic (MD)mice. Total protein in individual tailbuds measured using Bradford assay (n = 18-20from 3 litters). Error bars represent mean ± SEM.
ND MD
Page 40 of 47Diabetes

Supplementary Figure 4. The midbrain, which does not express any of the threeCyp26 genes, exhibits no difference in RA levels between embryos of diabetic andnon-diabetic mice after RA treatment. A: In situ hybridization on E9 embryosdemonstrates that all three Cyp26 genes (Cyp26a1, Cyp26b1 and Cyp26c1) do notexpress in the midbrain (MB) with or without (No RA) being maternally treated with50 mg/kg RA (50RA). Scale bar = 0.4 mm. B: Amount of RA in the tailbud andmidbrain of E9 embryos 3 h post-injection of 50RA, measured using HPLC (n = 7-9from 7-9 litters). The tailbud of embryos of manifestly diabetic (MD) mice withreduced Cyp26a1 expression had a significantly greater amount of RA than inembryos of non-diabetic (ND) mice. In contrast, the midbrain, without Cyp26expression, showed no difference in the amount of RA between embryos of MD andND mice. *P < 0.001, Student’s t test. Error bars represent mean ± SEM.
0
4
8
12
16
Tailbud Midbrain
MB MB
Cyp26a1 Cyp26b1 Cyp26c1
MB
No
RA
50R
A
MBMB MB
MBMB
Am
ount
of
RA
(nM
)
A
B *
ND MD
Tailbud(50RA)
Midbrain(50RA)
Page 41 of 47 Diabetes

Supplementary Figure 5. Heterozygosity for Cyp26a1 loss of function exacerbatesincreased susceptibility to RA-induced caudal truncation in embryos exposed todiabetes. Morphology of the caudal region of E13 Cyp26a1 heterozygous null (+/-)embryos and their wild-type (+/+) littermates from non-diabetic (ND) and manifestlydiabetic (MD) mice that were challenged in vivo with 25 mg/kg RA (25RA) or vehicleas control (CON) at E9. Embryos of different genotype-maternal environmentcombinations showed prominent differences in susceptibility to RA-induced caudaltruncation. Scale bar = 0.1 cm.
ND (+/-) MD (+/-)
ND (+/+) MD (+/+)
ND (+/+) MD (+/+)
25R
AC
ON
Page 42 of 47Diabetes
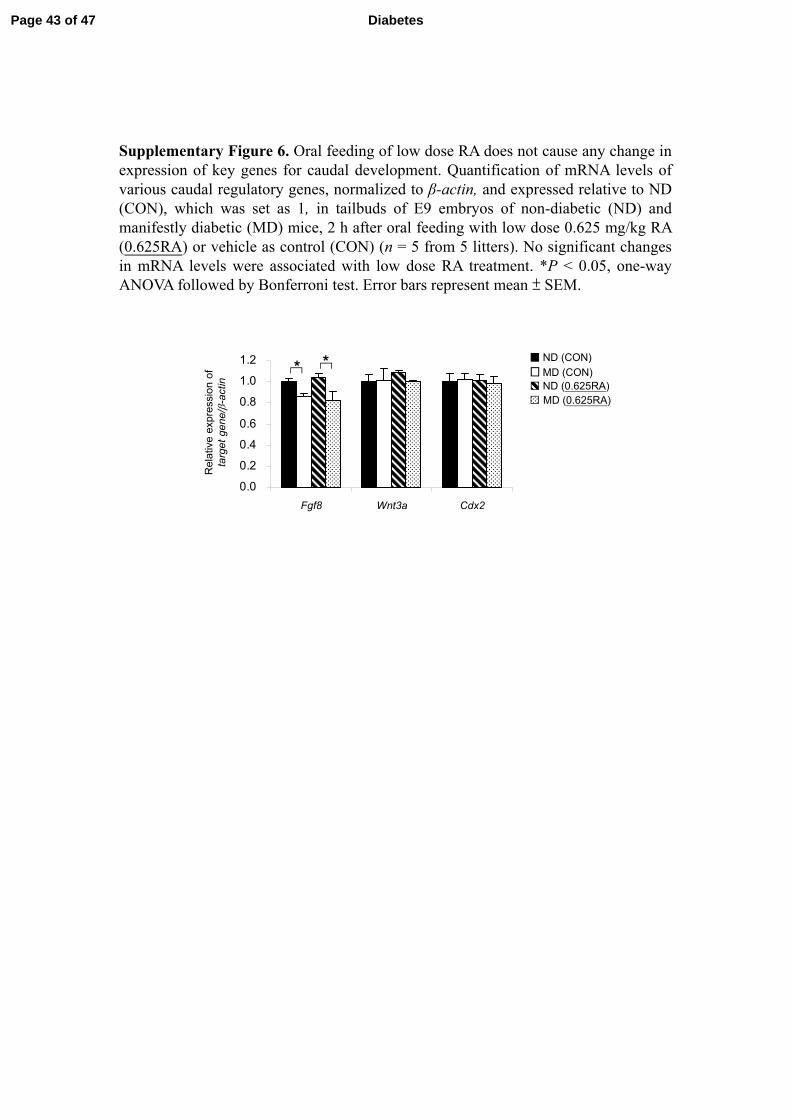
Supplementary Figure 6. Oral feeding of low dose RA does not cause any change inexpression of key genes for caudal development. Quantification of mRNA levels ofvarious caudal regulatory genes, normalized to β-actin, and expressed relative to ND(CON), which was set as 1, in tailbuds of E9 embryos of non-diabetic (ND) andmanifestly diabetic (MD) mice, 2 h after oral feeding with low dose 0.625 mg/kg RA(0.625RA) or vehicle as control (CON) (n = 5 from 5 litters). No significant changesin mRNA levels were associated with low dose RA treatment. *P < 0.05, one-wayANOVA followed by Bonferroni test. Error bars represent mean ± SEM.
0.0
0.2
0.4
0.6
0.8
1.0
1.2
Fgf8 Wnt3a Cdx2Fgf8 Wnt3a Cdx2
* * ND (CON)
MD (CON) ND (0.625RA) MD (0.625RA)
Rel
ativ
e ex
pres
sion
of
targ
et g
ene/-
actin
Page 43 of 47 Diabetes
0
5
10
15
20
25
30
35
No RA 25RA
% e
mbr
yos
per
litte
rw
ith e
xenc
eph
aly
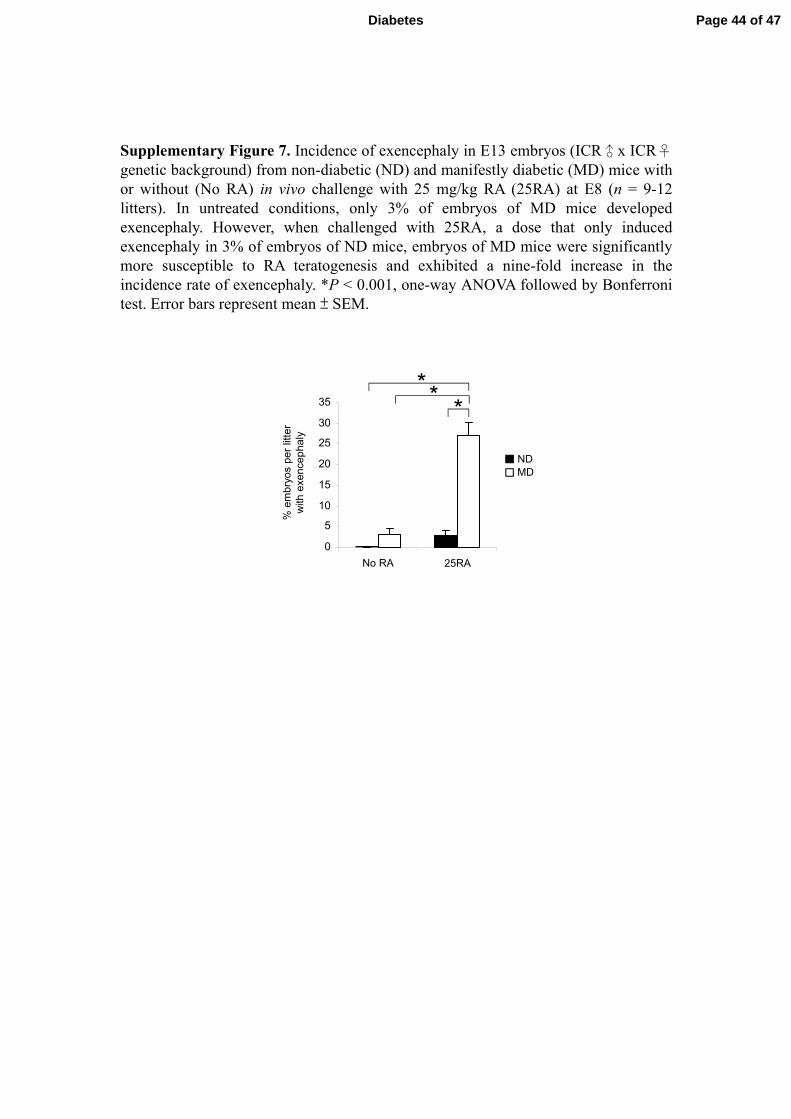
Supplementary Figure 7. Incidence of exencephaly in E13 embryos (ICR♂x ICR♀genetic background) from non-diabetic (ND) and manifestly diabetic (MD) mice withor without (No RA) in vivo challenge with 25 mg/kg RA (25RA) at E8 (n = 9-12litters). In untreated conditions, only 3% of embryos of MD mice developedexencephaly. However, when challenged with 25RA, a dose that only inducedexencephaly in 3% of embryos of ND mice, embryos of MD mice were significantlymore susceptible to RA teratogenesis and exhibited a nine-fold increase in theincidence rate of exencephaly. *P < 0.001, one-way ANOVA followed by Bonferronitest. Error bars represent mean ± SEM.
***
ND MD
No RA 25RA
Page 44 of 47Diabetes

Supplementary Table 1. Blood glucose levels of non-diabetic (ND) and manifestly diabetic (MD) mice before pregnancy and on the day of embryo collection
ND
Before pregnancy
ND Day of embryo collection (E9)
MD Before
pregnancy
MD Day of embryo Collection (E9)
Blood glucose levels (mmol/L) mean ± SEM
Not determined
6.08 ± 0.12 (n = 12 )
21.56 ± 0.32 (n = 101)
27.53 ± 0.51* (n = 67)
Remarks: The blood glucose levels of MD mice on the day of embryo collection at E9 were significantly higher than MD mice before pregnancy (*P < 0.001, Student’s t test), with none of them having blood glucose levels lower than 16.7 mmol/L. Similarly, there were hardly any MD mice that exhibited blood glucose levels lower than 16.7 mmol/L on the day of embryo collection at other stages (E8, E13 and E18). These findings supported that embryos of MD mice were exposed to a hyperglycemic milieu throughout development.
Page 45 of 47 Diabetes

Supplementary Table 2. PCR conditions and primer sequences
The PCR conditions included initiation at 95oC for 10 minutes, followed by 40 cycles comprising of denaturation at 95°C for 15 seconds, annealing at 55°C for 30 seconds and extension at 72°C for another 30 seconds. Primers sequences, designed by the Primer Express Software (Applied Biosystems), for detecting various mouse genes were:
Gene Primer Sequences
β-actin forward: 5’-TGT TAC CAA CTG GGA CGA CA-3’
reverse: 5’-GGG GTG TTG AAG GTC TCA AA-3’
Cdx2 forward: 5’-AAA CTC CAC TGT CAC CCA GT-3’
reverse: 5’-CCT GAG GTC CAT AAT TCC AC-3’
Cyp26a1 forward: 5’-CAG TGC TAC CTG CTC GTG AT-3’
reverse: 5’-AGA GAA GAG ATT GCG GGT CA-3’
Cyp26b1 forward: 5’-TTC AGT GAG GCA AGA AGA CA-3’
reverse: 5’-CTG GGA GGA GGT GCT AAG TA-3’
Cyp26c1 forward: 5’-GGG ACC AGT TGT ATG AGC AC-3’
reverse: 5’-AGC CAA CTC CTT CAG CTC TT-3’
Fgf8 forward: 5’-AGA GAT CGT GCT GGA GAA CA-3’
reverse: 5’-AAG GGC GGG TAG TTG AGG AA-3’
Rarγ forward: 5’-AGG CAG CAG ACT GAC CAT TT-3’
reverse: 5’-TTC TGG TAG GTG TGC AGC AG-3’
Rxrα forward: 5’-TCA CCA TCC TCG CCA TCT TT-3’
reverse: 5’-CTC CAA ACA GAG GTG CCA TG-3’
Wnt3a forward: 5’-CTG GCA GCT GTG AAG TGA AG-3’
reverse: 5’-GCC TCG TAG TAG ACC AGG TC-3’
Page 46 of 47Diabetes

Supplementary Table 3. RA in individual tailbuds of embryos of non-diabetic (ND) and manifestly diabetic (MD) mice 3 h post-injection of 50 mg/kg RA at E9, measured using the RA reporter cell line or HPLC
Amount of RA per tailbud (nM)
Method of measurement ND MD Difference between
ND and MD
RA reporter cell line 4.21 0.13 (n = 36)*
6.71 0.20 (n = 42)*
59.38%
HPLC 7.88 0.62 (n = 7)**
12.80 0.79 (n = 9)**
62.44%
* One tailbud in each sample ** Tailbuds from one litter of embryos were pooled as one sample Remarks: The data for the RA reporter cell line was extracted from Fig. 2B. The HPLC experiment was conducted in a separate study to validate the result in Fig. 2B. In analyzing the result, it is more relevant to compare the difference between ND and MD groups using the two RA detection methods, rather than the absolute amount of RA in the tailbud.
Page 47 of 47 Diabetes