Embed Size (px)
Citation preview

Persuasive and Informative Advertising: A Classroom Experiment
Beth A. Freeborn College of William and Mary
Jason P. Hulbert College of William and Mary
College of William and Mary Department of Economics Working Paper Number 85
June 2009
COLLEGE OF WILLIAM AND MARY DEPARTMENT OF ECONOMICS WORKING PAPER # 85 June 2009
Persuasive and Informative Advertising: A Classroom Experiment
Abstract This paper outlines a pair of classroom activities designed to provide an intuitive foundation to the theoretical introduction of advertising in monopoly markets. The roles of both informative and persuasive advertising are covered. Each student acts as a monopolist and chooses the number of (costly) advertisements and price. The experiments are intended for intermediate microeconomics or industrial organization courses, though may be utilized in any course that covers advertising models. JEL Codes: Classroom experiment, Advertising, Monopolist, Undergraduate Industrial Organization Keywords: A22, C90, D21, L10 Beth A. Freeborn College of William and Mary Department of Economics Williamsburg, VA 23187 [email protected]
Jason P. Hulbert College of William and Mary Department of Economics Williamsburg, VA 23187 [email protected]
1. Introduction
Advertising is an important aspect of many markets; consumers are bombarded daily with print,
TV, radio, and internet advertising. While most undergraduate students are quite familiar with
advertising in their role as consumers, the coverage of advertising in many intermediate
microeconomics and industrial organization classes is often small relative to the pervasiveness of
advertising. One possible reason for this disconnect may be the various roles advertising can
play and the different theoretical models those roles can imply. A quick perusal of the treatment
of advertising in intermediate and industrial organization textbooks shows demand curves
shifting without providing much intuition for the demand shifts. We develop a pair of classroom
activities to give students a more ‘hands-on’ look at advertising that is both consistent with the
popular treatments of advertising in undergraduate texts and intuitively appealing given students’
everyday experiences with advertisements.1
Most undergraduate textbook treatments of advertising distinguish between persuasive
advertising and informative advertising (Cabral 2005, Shy 1996, Carlton and Perloff, 2005).2
Generally, persuasive advertising increases the consumers’ willingness to pay for the product
and thus shifts the product’s demand curve. A simple model of persuasive advertising is one of a
monopolist with a demand curve that shifts outwards with increases in advertising expenditures.
Informative advertising conveys information to uninformed consumers regarding a product’s
characteristics, price, or even existence. These two types of advertising can differ in how they
1 Several papers illustrate how students benefit from classroom experiments relative to students who do not participate in experiments, including Frank (1997), Gremmen and Potters (1997), Emerson and Taylor (2004), Dickie (2006) and Durham, McKinnon and Schulman (2007). 2 Pepall, Richards and Norman (2002) present a model of advertising as providing crowd appeal, a scenario similar to the view of persuasive advertising where the demand curve rotates along the price-axis with advertising.
1
enter the model of firm behavior and thus may result in different implications regarding welfare
effects and market price and quantity. 3
This paper outlines a classroom experiment that complements the discussion of
persuasive and informative advertising. The student is placed in the role of a monopolist and
must choose the optimal number of advertisements to send to consumers and what price to
charge. Introducing advertising to the familiar monopoly model allows students to analyze the
effects of advertising on price, quantity, and consumer surplus. For a more advanced discussion,
students may address issues related to the optimal amount of advertising and discuss how the
results might change if the market were characterized as an oligopoly.
The experiment consists of two treatments that differ in how advertising affects consumer
demand (i.e., persuasive advertising and informative advertising). Within each treatment,
students face two scenarios that differ only in the marginal cost of advertising. Students therefore
observe how the addition of advertising to the familiar monopolist’s problem affects the
equilibrium price, quantity, consumer surplus, and profits, as well as gain an understanding of
how these effects vary with the role and cost of advertising. Additionally, the informative
advertising activity introduces uncertainty to the monopolist’s optimization problem, allowing it
to contribute to a discussion on decision making under uncertainty and risk preferences.4
This experiment can be applied to any size class and in any type of classroom, though in
larger classes the instructor may wish to recruit student assistants to facilitate implementation.
3 For example, Shy (1996) discusses the model of Dixit and Norman (1978), which presents a simple method for evaluating the impact of persuasive advertising. Shy proposes that this model implies the socially optimal level of persuasive advertising is above the equilibrium level in a monopoly market, but cautions students that this holds only for a very specific model. 4 If decision making under uncertainty is covered at some point prior to the advertising activity, the instructor may wish to remind students of the assumption that firms are risk neutral. On the other hand, if advertising is presented before decision making under uncertainty, the instructor can use the outcome of the advertising activity to address how the assumption of firm risk-neutrality affects predicted behavior. For a discussion of risk preferences, the instructor may note that a student’s attitudes towards risk may affect the outcome of the classroom activity.
2

Preparation prior to class is minimal and consists of photocopying the instructions/record sheets,
which are included at the end of the paper, and writing numbers on poker chips. Buyer decisions
are simulated, so every student acts as the decision-making firm. In order to illustrate the
differences in outcomes implied by the different roles of advertising, the treatments of persuasive
and informative advertising are structured to be as similar as possible. Students may be assigned
homework questions evaluating the outcomes of the experiment. Appendix A provides some
questions that can be assigned for homework or used to stimulate classroom discussion, as well
as the graphs that were used in our own classroom discussion following implementation of the
experiment.
2. Experimental Design
In this section, we present the experimental procedures for the two treatments. Prior to class,
instructors should photocopy the instructions/record sheets available in Appendix B. The first
treatment is titled “Activity A” and represents the persuasive advertising activity. 5 The next
treatment, “Activity B”, represents the informative advertising activity. In addition, preparation
for the informative advertising activity requires the instructor to number poker chips 1 through
5 Alternatively, the persuasive treatment (Activity A) can be given as a homework assignment prior to doing the informative treatment (Activity B) in class. Assigning Activity A as homework may be useful in shorter classes, allowing for more class time to be devoted to Activity B and in-class discussion. An additional benefit of assigning Activity A as homework is that it provides students with ample time to search for the optimal price-advertising combination. Alternatively, prior to Activity A, the instructor may assign a homework that gives the students the demand schedule for 0 ads and the demand schedule for 10 ads. Students could determine the optimal price and quantity for each demand schedule and be asked how much the firm would be willing to pay to face the higher demand schedule. This type of pre-class exercise will help ensure that students understand the problem they face in Activity A.
3

10.6 Prior to beginning the activities, students should be informed of any in-class incentive
structure.7
Activity A: Persuasive Advertising
The instructions for Activity A begin by informing students that they are the only seller in a
hypothetical market for widgets. There are ten (simulated) consumers in the market, and each has
an initial integer-valued willingness-to-pay for exactly one widget. The students are provided the
following values that each consumer places on the widget prior to advertising:
Cons1 Cons2 Cons3 Cons4 Cons5 Cons6 Cons7 Cons8 Cons9 Cons10Initial Value of Widget 10 9 8 7 6 5 4 3 2 1
These initial values generate the downward sloping demand curve that occurs with zero
advertising. However, each consumer’s willingness to pay increases by $1 with each unit of
advertising; the more the firm advertises, the greater the value each consumer places on
consuming a widget. This persuasive advertising thus shifts the demand curve outward.
Production is assumed to occur at zero marginal cost; the only cost to firms is the cost of
advertising and the marginal cost of advertising is increasing. Students are asked to determine,
based on the initial demand and the advertising costs, how much to advertise their product and
what price to charge.
6 For convenience and speed of implementation, we recommend the instructor number several sets of poker chips prior to the class, so that several student assistants may use the numbered poker chips to run the activity. In a class of 20 students, we used 4 sets of numbered poker chips to implement the informative advertising activity. 7 Incentive structures for in-class activities vary from instructor to instructor and can include monetary incentives, candy, and/or class participation or extra credit points. For the results presented in this paper, we used the common strategy of providing a monetary incentive; students were informed that a randomly selected student would be paid a percentage of their total earnings (1%) at the end of the class period. Under this payment structure, however, the marginal expected monetary prize of a change in ads is quite small.
4
Activity A1
Activity A1 presents a low advertising cost scenario; the marginal cost of advertising increases
from $2.50 for the 1st advertisement to $11.50 for the 10th advertisement (see Table 1 below).
The scenario is repeated for three rounds, so that students fully understand the particulars of the
experiment. In each round, students are instructed to first select the amount to advertise and
record the number of advertisements on their record sheet. Students are then instructed to
calculate the demand resulting from this selected advertising effort (by adding of the number of
advertisements to the initial consumer value of a widget). Students must then determine the
price to charge consumers given this post-advertising demand curve and record this on the record
sheet. Once advertising and price are determined, the record sheet guides students in a step-by-
step computation of sales, total revenue, advertising costs, profits, consumer surplus, and social
surplus. Each round takes approximately 4-5 minutes.
Conditional on advertising choice, the activity is one of a price setting monopolist, with
which most students in intermediate microeconomics and/or industrial organization course are
familiar. To maximize profits gross of advertising expenditures, a monopolist with linear inverse
demand curve P = A – bQ and zero marginal costs will set price P = A/2, sell quantity Q = A/2b,
and attain profits π = A2/4b. Price, quantity, and gross profits are all increasing in advertising
through the effects of advertising on the intercept A. Profits net of advertising, however, are
concave in A under certain restrictions on the advertising cost function.8 These restrictions are
satisfied by the advertising cost structure of Activity A1.
8 In order for profits to be concave in advertising expenditures, the second derivative of A(a)2/4b-C(a), where a is the number of advertisements, A(a) is the vertical intercept of the inverse demand, and C(a) is total advertising costs, must be negative. Concavity of profits net of advertising therefore requires advertising costs C(a) to be sufficiently convex.
5

Activity A2
Activity A1 differs from Activity A2 only in the costs of advertising; the marginal advertising
costs are higher in the second scenario. Both sets of marginal costs are depicted in Table 1 and
Table 2 presents the equilibrium in each of these two scenarios. The increase in marginal
advertising costs results in fewer ads, lower prices, lower quantities, and lower total profit.
Table 1: Marginal Advertising Costs Number of Ads 1 2 3 4 5 6 7 8 9 10 Activity A1 2.5 3.5 4.5 5.5 6.5 7.5 8.5 9.5 10.5 11.5Activity A2 3.5 4.5 5.5 6.5 7.5 8.5 9.5 10.5 11.5 12.5
Table 2: Activity A Equilibrium Outcomes Activity A1 Activity A2
Ads 7 5 Price 9 8 Quantity 9 8 Profit 42.5 36.5
Activity B: Informative Advertising
Activity B begins by informing students they are the only seller in a hypothetical market for
widgets. Each of ten consumers has an initial integer-valued willingness-to-pay for one widget
given by:9
Cons1 Cons2 Cons3 Cons4 Cons5 Cons6 Cons7 Cons8 Cons9 Cons10Value of Widget 20 19 18 17 16 15 14 13 12 11
9 Note that the consumers in Activity B begin with higher initial willingness to pay than consumers in Activity A. This allows for the post-advertising demand curve given maximum advertising to be identical across treatments.
6

In this second treatment, consumers only buy a widget if they receive an advertisement (i.e. are
informed about the widget) and their willingness to pay for the good exceeds the price set by the
student.
Activity B1
Activity B1 is the low advertising cost scenario; the marginal cost of advertising increases from
$2.50 for the 1st advertisement to $11.50 for the 10th advertisement. The scenario is repeated for
three rounds. At the beginning of each round, students are asked to simultaneously determine
how many advertisements they want to send out and what price to charge. After students record
both the number of advertisements and their chosen price on their record sheet, the instructor and
any student assistants visit each student with an opaque container of 10 numbered poker chips.
To simulate the random matching between advertisements and their recipients, one chip is drawn
(without replacement) for each advertisement sent and the corresponding consumer is circled on
the record sheet. Once the recipients of the advertisements are determined, the students are
asked to calculate surplus for each consumer that received an advertisement given the price
selected by the student at the beginning of round. Students then determine the quantity sold by
counting the number of consumers with non-negative surpluses. Finally, students follow a step-
by-step calculation of profits earned in the round given their decisions and the stochastic
matching of ads to recipients.
Activity B2
Activity B1 differs from Activity B2 only in the costs of advertising; the marginal advertising
costs are higher in the second scenario. The marginal advertising cost structure of Activities B1
and B2 are equal to those depicted in Table 1 for Activities A1 and A2.
7

Activity B Equilibria
If the maximum number of advertisements (10) is chosen in Activity B1 or B2, all consumers are
aware of widgets. If no informative ads are chosen, all consumers remain ignorant of the
widgets’ existence and consume zero widgets regardless of willingness to pay; demand is
therefore zero at any price. If the number of informative advertisements is between zero and the
maximum, then consumer demand is a function of the reservation prices of those consumers who
receive ads and is therefore random. Given that students choose price prior to knowing which
customers were hit with the advertisements, students are maximizing expected profits given
advertising expenditures.
Each consumer can receive at most one advertisement and consumers who have not
received an advertisement are equally likely to receive one. The probability of a specific
consumer with a particular willingness-to-pay receiving an advertisement is the inverse of the
number of advertisements sent. Therefore, the expected demand curve is rotating along the x-
axis with increases in the number of advertisements.10 The optimal choices of advertisements
and prices for Activity B1 and B2 are presented in Table 3, as well as the expected quantities and
profit.
Table 3: Activity B Equilibrium Outcomes Activity B1 Activity B2
Ads 9 8 Price 11 11 Quantity 9 8 Profit 40.5 32
10 Thus, one feature of this classroom experiment is that it provides a structural interpretation behind the textbook treatment of having the demand curve rotate out.
8

Due to the random nature of the informative advertising activity, instructors may wish perform
more rounds of Activity B than for the persuasive advertising (Activity A) to ensure students
understand the logistics.
3. Sample Results and Related Discussion
The experiment and class discussion took place in a 75-minute period.11 Tables 4 and 5 provide
the results from a 400-level industrial organization class with 18 students as an example of how
students may behave in the experiment, although results may vary with different classes.
Instructors may find it useful to share these results with students to facilitate discussion.
Table 4: Activity A Observed Student Choices Activity A1 Activity A2
Round R1 R2 R3 R1 R2 Mean Price 6.58 8.19 8.28 7.33 8.11 Median Price 7 8.5 8.5 8 8 Modal Price 5 9 9 8 8 Optimal Price 9 9 9 8 8
Mean Ads 4.28 6.28 5.94 4.61 5.78 Median Ads 4.5 6 6 4.5 5 Modal Ads 5 4 5 5 4 Optimal Ads 7 7 7 5 5
Difference from Optimal Price Given Advertisements -1.31 -0.81 -0.44 -0.72 -0.56
Notice from Table 4 that in Activity A1, students are relatively close to the optimal price of $9
but the mean, median and modal number of advertisements is always below 7, the optimal
11 Alternatively, the experiment could be performed in an hour long class with discussion during a separate class period, or each treatment (Activity A, Activity B) could be performed and discussed in separate class periods.
9

number of advertisements.12 A similar pattern is observed in Activity A2. Because the Activity
A treatments reduce to a monopoly maximization problem given a number of advertisements, we
can also generate the optimal price, given the number of advertisements actually chosen by the
students. The final row of Table 4 provides the average difference in price chosen by students
from the optimal price conditional on the chosen number of advertisements. For example, by the
third round of Activity A1, students were off their own optimal price by 44 cents on average.
Table 5: Activity B Observed Student Choices Activity B1 Activity B2
Round R1 R2 R3 R1 R2 R3 Mean Price 12.53 12.12 11.85 12.65 12.29 12.53 Median Price 13 13 11 13 12 13 Modal Price 13 11 11 13 11 11 Optimal Price 11 11 11 11 11 11
Mean Ads 6.29 7.00 7.76 6.94 6.29 6.47 Median Ads 6 6 9 8 7 7 Modal Ads 6 6 9 8 8 8 Optimal Ads 9 9 9 8 8 8
Table 5 presents the mean, median, and modal choices of number of advertisements and prices
for Activity B. Similar to the results of the persuasive treatment, students are relatively close to
the optimal prices, but are choosing less than the optimal number of advertisements on average.
Appendix A includes a list of sample discussion questions that may be used for in-class
discussion or assigned as homework. In addition, instructors may want to include graphs of the
demand curve and profit function in the classroom discussion. Copies of these graphs are also
available in Appendix A. Many instructors incorporate empirical findings into their lectures so
that students are able to more concretely understand the material or see the relevance for the real
12 Instructors may wish to direct their students to the optimal result by asking a question such as “if your price is $9, what will happen to profits if you increase your advertisements by 1?”
10

world. The theoretical and empirical literature on advertising is vast, but there are a few papers
that may be of particular interest to students after completing the classroom activity. Ackerberg
(2001, 2003) uses the introduction of a new brand of yogurt and household level data to analyze
whether advertising was primarily informative or persuasive. Because he finds that advertising
affected inexperienced consumers more than consumers who had previously consumed the
brand, he concludes that advertising affected yogurt consumers by giving them information
about the product’s characteristics. In discussing the potential benefits of advertising, instructors
may wish to incorporate Avery et. al. (2007). Their analysis shows that increasing the
advertising of smoking cessation products (nicotine patches, gum, etc.) would increase the
number of smokers who quit smoking, both through an increased use of smoking cessation
products and through spillover effects (smokers may quit after being exposed to information on
the health benefits contained in the advertisements without buying the cessation products).
Clarke (2007) analyzes the effects of a ban on advertising children’s cereals in Quebec and
shows that because prices are higher when advertising is banned, the informative effect of
advertising dominates the persuasive role of advertising.
4. Concluding Remarks
The use of classroom experiments to teach economics has been increasing and many new
innovative experiments have been developed to supplement the instruction of microeconomics.
Examples of classroom experiments designed for concepts taught in industrial organization
courses include asymmetric information (Wolf and Myerscough 2007), predation (Capra,
Goeree, Gomez and Holt 2000), duopoly, (Mason 2006) entry in oligopoly markets (Gächter,
Thöni, Tyran 2006), vertical integration (Badasyan et. al., 2005) and price discrimination
11
(Basuchoudhary et. al 2008). At this time, however, we are aware of no classroom experiment
designed to instruct students on models of advertising. The objective of this pair of classroom
experiments is to complement the discussion of advertising, specifically the models of persuasive
and informative advertising. The experiments are simple to run and preparation outside of class
is limited to photocopying and numbering poker chips. Students gain a stronger understanding of
the two models of advertising by acting as price setting firms that choose the optimal number of
advertisements. These experiments may also lead to interesting classroom discussion on the
impact or effectiveness of advertising and whether or not persuasive advertising is a bad thing
for consumers.
12

References
Ackerberg, Daniel (2001). “Empirically Distinguishing Informative and Prestige Effects of Advertising,” RAND Journal of Economics, 33(2): 100-118.
Ackerberg, Daniel (2003). “Advertising, Learning, and Consumer Choice in Experience Good
Markets: A Structural Empirical Examination,” International Economic Review, 44(3): 1007-1040.
Avery, Rosemary, Donald Kenkel, Dean Lillard, and Alan Mathios (2007). “Private Profits and
Public Health: Does Advertising of Smoking Cessation Products Encourage Smokers to Quit?” Journal of Political Economy, 115(3): 447-481.
Badasyan, Narine, Jacob K. Goeree, Monica Hartmann, Charles Holt, John Morgan, Tanya
Rosenblat, Maros Servatka, and Dirk Yandell (2005). “Vertical Integration of Successive Monopolists: A Classroom Experiment.” Perspectives on Economic Education Research, forthcoming.
Basuchoudhary, Atin, Christopher Metcalf, Kai Pommerenke, David Reiley, Christian Rojas,
Marzena Rostek, and James Stodder (2008). “Price Discrimination and Resale: A Classroom Experiment.” Journal of Economic Education, 39(3): 229-244.
Cabral, Luis M. B. (2000). Introduction to Industrial Organization, Cambridge, Massachusetts:
The MIT Press. Capra, C. Monica, Jacob K. Goeree, Rosario Gomez, Charles A. Holt (2000). “Predation,
Asymmetric Information and Strategic Behvaior in the Classroom: An Experimental Approach to the Teaching of Industrial Organization.” International Journal of Industrial Organization, 18: 205-225.
Carlton, Dennis W. and Jeffrey M. Perloff (2005). Modern Industrial Organization, Fourth
Edition. U.S.A.: Pearson Addison-Wesley. Clark, C. Robert (2007). “Advertising Restrictions and Competition in the Children’s Breakfast
Cereal Industry,” Journal of Law and Economics, 50: 757-780. Dickie, Mark (2006). “Do Classroom Experiments Increase Learning in Introductory
Microeconomics.” Journal of Economic Education, 37(3): 267-288. Dixit, Avinash and Victor Norman (1978). “Advertising and Welfare.” The Bell Journal of
Economics, 9(1): 1-17. Durham, Yvonne, Thomas McKinnon, and Craig Schulman (2007). “Classroom Experiments:
Not Just Fun and Games,” Economic Inquiry. 45(1): 162-178.
13

Emerson, Tisha L. N. and Beck A. Taylor (2004). “Comparing Student Achievement across Experimental and Lecture-Oriented Sections of a Principles of Microeconomics Course,” Southern Economic Journal. 70(3): 672-693.
Frank, Bjorn (1997). “The Impact of Classroom Experiments on the Learning of Economics: An
Empirical Investigation,” Economic Inquiry. 35(4): 763-69. Gächter, Simon, Christian Thöni, and Jean-Robert Tyran (2006). “Cournot Competition and Hit-
and-Run Entry in a Teaching Experiment.” Journal of Economic Education, 37(4): 418-430. Gremmen, H. and J. Potters (1997). “Assessing the Efficacy of Gaming in Economic Education.”
Journal of Economic Education. 28: 323-43. Mason, Charles F. (2006). “Experimental Duopoly in the Classroom.” Journal of Industrial
Organization Education, 1(1): Article 4. Available at www.bepress.com/jioe/vol1/iss1/4 Shy, Oz (1996). Industrial Organization: Theory and Applications. Cambridge, Massachusetts:
The MIT Press. Wolf, James R. Jr. and Mark A. Myerscough (2007). “Reputations in Markets with Asymmetric
Information: A Classroom Game.” Journal of Economic Education, 38(4): 393-405.
14
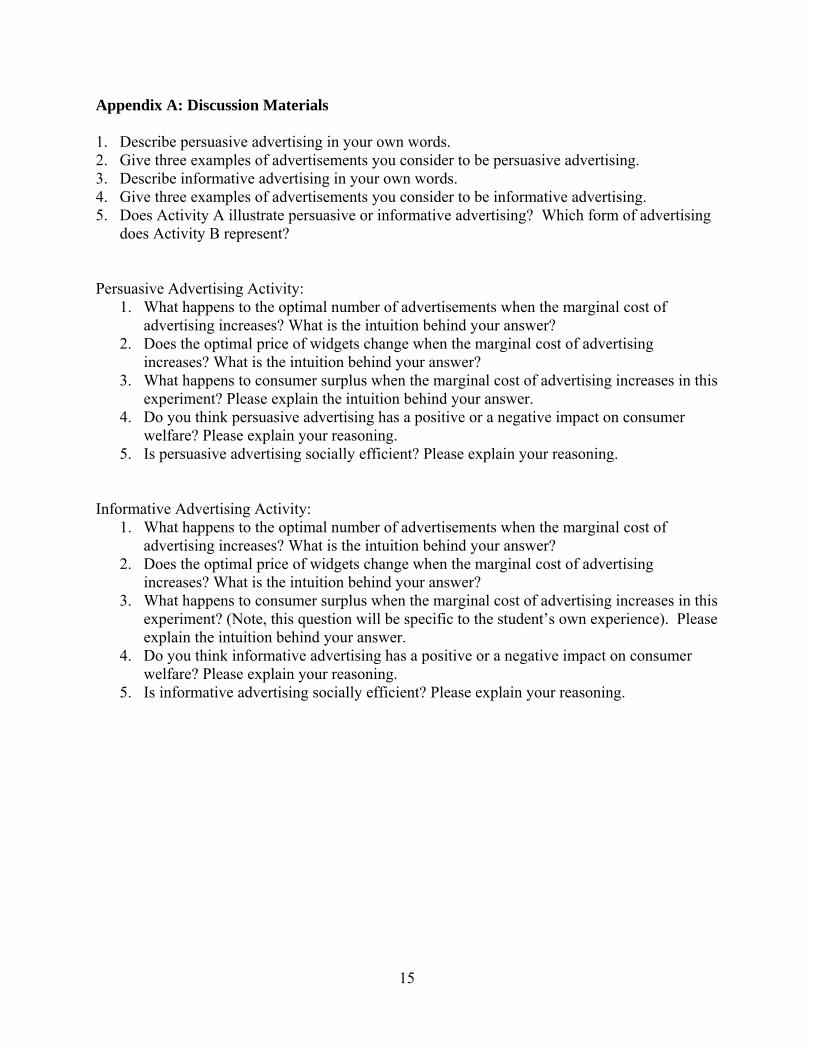
Appendix A: Discussion Materials 1. Describe persuasive advertising in your own words. 2. Give three examples of advertisements you consider to be persuasive advertising. 3. Describe informative advertising in your own words. 4. Give three examples of advertisements you consider to be informative advertising. 5. Does Activity A illustrate persuasive or informative advertising? Which form of advertising
does Activity B represent? Persuasive Advertising Activity:
1. What happens to the optimal number of advertisements when the marginal cost of advertising increases? What is the intuition behind your answer?
2. Does the optimal price of widgets change when the marginal cost of advertising increases? What is the intuition behind your answer?
3. What happens to consumer surplus when the marginal cost of advertising increases in this experiment? Please explain the intuition behind your answer.
4. Do you think persuasive advertising has a positive or a negative impact on consumer welfare? Please explain your reasoning.
5. Is persuasive advertising socially efficient? Please explain your reasoning. Informative Advertising Activity:
1. What happens to the optimal number of advertisements when the marginal cost of advertising increases? What is the intuition behind your answer?
2. Does the optimal price of widgets change when the marginal cost of advertising increases? What is the intuition behind your answer?
3. What happens to consumer surplus when the marginal cost of advertising increases in this experiment? (Note, this question will be specific to the student’s own experience). Please explain the intuition behind your answer.
4. Do you think informative advertising has a positive or a negative impact on consumer welfare? Please explain your reasoning.
5. Is informative advertising socially efficient? Please explain your reasoning.
15
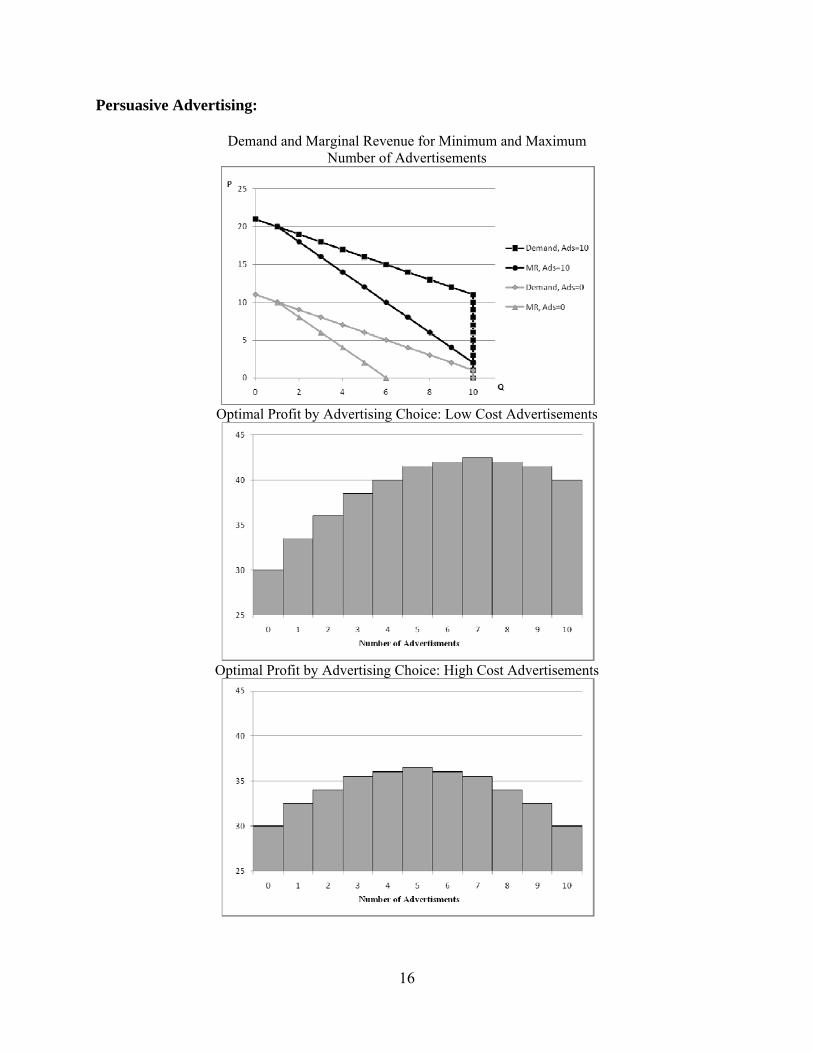
Persuasive Advertising:
Demand and Marginal Revenue for Minimum and Maximum Number of Advertisements
Optimal Profit by Advertising Choice: Low Cost Advertisements
Optimal Profit by Advertising Choice: High Cost Advertisements
16

Informative Advertising:
Expected Demand for Minimum and Maximum Number of Advertisements
Optimal Profit by Advertising Choice: Low Cost Advertisements
Optimal Profit by Advertising Choice: High Cost Advertisements
17

Appendix B: Instructions Name___________________
Activity A Instructions: You are a firm that sells a single product, which we will call widgets. You are the only firm that sells widgets. You must choose what price to charge consumers and also how many advertisements for widgets to send to consumers. There are 10 consumers in the market. Each consumer knows the value she places on widgets. However, you can increase the value that consumers place on widgets through advertising. The more you advertise, the greater the value consumers place on widgets. If a consumer purchases a widget, she will purchase only one widget. Each advertisement you send increases the value a consumer places on widgets by $1. When a consumer purchases a widget, the consumer receives a surplus equal to the value she places on a widget minus its price. If your price is greater than the value she places on the widget the consumer will not purchase and will earn a surplus of zero. If the price is exactly equal to the value the consumer places on widgets, however, she will purchase the widget and earn a surplus of zero. Your record sheet will contain a table similar to the following that lists the values that the 10 consumers initially place on a widget.
Cons1 Cons2 Cons3 Cons4 Cons5 Cons6 Cons7 Cons8 Cons9 Cons10Initial Value of Widget 10 9 8 7 6 5 4 3 2 1
You will begin by choosing the number of advertisements to send out. Once you have determined the number of advertisements to send, calculate the value each consumer places on a widget as that consumer’s initial value plus the $1 for every advertisement you choose to send. Next you will choose a widget price. A consumer will purchase one widget if her surplus is greater than (or equal to) zero. If her surplus is less than zero, she will not purchase a widget. Record the number of advertisements and the price you charge for your good in the space provided on the record sheet. Write down the total number of units you sell (N) in the space provided on your worksheet. Your revenue is the price chosen multiplied by the number of units you sell: p * N. Your total advertising cost is determined by the number of advertisements you choose. The cost of advertising increases and each advertisement incurs an additional cost greater than the previous advertisement. For example, the first advertisement has a cost CA1, the second advertisement has a cost CA2, and so on, where CA1 < CA2 < CA3, etc. The total advertising cost is provided on the record sheet. If you choose A* number of advertisements, the total cost of
18
advertising is CA*. The production cost for each widget is $0. Therefore, your total cost is determined solely by the total cost of advertising. Your profits are Total Revenue minus Total Cost: (p * N) – CA* If you have a question, raise your hand and we will come to your desk. You are making these choices independently, so please do not talk to one another or try to see the choices of your neighbors.
19

Record Sheet for Scenario A1 The total cost for number of advertisements is given below:
# of Advertisements 0 1 2 3 4 5 6 7 8 9 10 Marginal Cost of Advertising 0 2.5 3.5 4.5 5.5 6.5 7.5 8.5 9.5 10.5 11.5
Total Cost of Advertising 0 2.5 6 10.5 16 22.5 30 38.5 48 58.5 70
For example, if you choose to send out three advertisements, your total cost of advertising will be $10.50 and if you choose to send out 7 advertisements, your total cost of advertising is $38.50 A1 Round 1: Step 1: Make Advertising Choice Number of Advertisements _______
Once you have made your choice on the number of advertisements, calculate each consumer’s new value of a widget after advertising and record the new value in the spaces provided in line (2). Each advertisement increases the value to a consumer by $1. For example, if you choose to send 3 advertisements, each consumer’s value of a widget will increase by $3.
Cons1 Cons2 Cons3 Cons4 Cons5 Cons6 Cons7 Cons8 Cons9 Cons10(1) Initial Value of Widget 10 9 8 7 6 5 4 3 2 1
(2) Value of Widget After Advertising (Initial Value + NA)
(3) Surplus of Consumer (Widget Value – Price Chosen)
Step 2: Make Price Choice Price of Widgets ________ Step 3: Write the consumer surplus in the spaces provided in line (3). Number of units you sell (N): Number of cells with surplus ≥ 0 ______________________ Total Revenue (P * N): ______________________ Total Cost of Advertisements (CA*) : ______________________ Profit (Total Revenue – Total Costs): (P * N) – CA* ______________________ Total Consumer Surplus (sum surplus for each consumer who purchases widget) ______________________ Social Surplus (sum consumer surplus and profit) ______________________ STOP AT THIS POINT AND WAIT FOR INSTRUCTIONS
20

21
A1 Round 2: Step 1: Make Advertising Choice Number of Advertisements _______
Once you have made your choice on the number of advertisements, calculate each consumer’s new value of a widget after advertising and record the new value in the spaces provided in line (2).
Cons1 Cons2 Cons3 Cons4 Cons5 Cons6 Cons7 Cons8 Cons9 Cons10(1) Initial Value of Widget 10 9 8 7 6 5 4 3 2 1
(2) Value of Widget After Advertising (Initial Value + NA)
(3) Surplus of Consumer (Widget Value – Price Chosen)
Step 2: Make Price Choice Price of Widgets ________ Step 3: Write the consumer surplus in the spaces provided in line (3). Number of units you sell (N): Number of cells with surplus ≥ 0 ______________________ Total Revenue (P * N) : ______________________ Total Cost of Advertisements (CA*) : ______________________ Profit (Total Revenue – Total Costs): (P * N) – CA* ______________________ Total Consumer Surplus (sum surplus for each consumer who purchases widget) ______________________ Social Surplus (sum consumer surplus and profit) ______________________ STOP AT THIS POINT AND WAIT FOR INSTRUCTIONS A1 Round 3: Step 1: Make Advertising Choice Number of Advertisements _______
Cons1 Cons2 Cons3 Cons4 Cons5 Cons6 Cons7 Cons8 Cons9 Cons10(1) Initial Value of Widget 10 9 8 7 6 5 4 3 2 1
(2) Value of Widget After Advertising (Initial Value + NA)
(3) Surplus of Consumer’s (Widget Value – Price Chosen)
Step 2: Make Price Choice Price of Widgets ________ Step 3: Write the consumer surplus in the spaces provided in line (3). Number of units you sell (N): Number of cells with surplus ≥ 0 ______________________ Total Revenue (P * N): ______________________ Total Cost of Advertisements (CA*) : ______________________ Profit (Total Revenue – Total Costs): (P * N) – CA* ______________________ Total Consumer Surplus (sum surplus for each consumer who purchases widget) ______________________ Social Surplus (sum consumer surplus and profit) ______________________

22
Record Sheet for Scenario A2 The total cost for number of advertisements is given below:
# of Advertisements 0 1 2 3 4 5 6 7 8 9 10 Marginal Cost of Advertising 0 3.5 4.5 5.5 6.5 7.5 8.5 9.5 10.5 11.5 12.5
Total Cost of Advertising 0 3.5 8 13.5 20 27.5 36 45.5 56 67.5 80
For example, if you choose to send out three advertisements, your total cost of advertising will be $13.50 and if you choose to send out 7 advertisements, your total cost of advertising is $45.50 A2 Round 1: Step 1: Make Advertising Choice Number of Advertisements _______
Once you have made your choice on the number of advertisements, calculate each consumer’s new value of a widget after advertising and record the new value in the spaces provided in line (2). Each advertisement increases the value to a consumer by $1. For example, if you choose to send 3 advertisements, each consumer’s value of a widget will increase by $3.
Cons1 Cons2 Cons3 Cons4 Cons5 Cons6 Cons7 Cons8 Cons9 Cons10(1) Initial Value of Widget 10 9 8 7 6 5 4 3 2 1
(2) Value of Widget After Advertising (Initial Value + NA)
(3) Surplus of Consumer’s (Widget Value – Price Chosen)
Step 2: Make Price Choice Price of Widgets ________ Step 3: Write the consumer surplus in the spaces provided in line (3). Number of units you sell (N): Number of cells with surplus ≥ 0 ______________________ Total Revenue (P * N): ______________________ Total Cost of Advertisements (CA*) : ______________________ Profit (Total Revenue – Total Costs): (P * N) – CA* ______________________ Total Consumer Surplus (sum surplus for each consumer who purchases widget) ______________________ Social Surplus (sum consumer surplus and profit) ______________________ STOP AT THIS POINT AND WAIT FOR INSTRUCTIONS

23
A2 Round 2: Step 1: Make Advertising Choice Number of Advertisements _______
Once you have made your choice on the number of advertisements, calculate each consumer’s new value of a widget after advertising and record the new value in the spaces provided in line (2).
Cons1 Cons2 Cons3 Cons4 Cons5 Cons6 Cons7 Cons8 Cons9 Cons10(1) Initial Value of Widget 10 9 8 7 6 5 4 3 2 1
(2) Value of Widget After Advertising (Initial Value + NA)
(3) Surplus of Consumer’s (Widget Value – Price Chosen)
Step 2: Make Price Choice Price of Widgets ________ Step 3: Write the consumer surplus in the spaces provided in line (3). Number of units you sell (N): Number of cells with surplus ≥ 0 ______________________ Total Revenue (P * N): ______________________ Total Cost of Advertisements (CA*) : ______________________ Profit (Total Revenue – Total Costs): (P * N) – CA* ______________________ Total Consumer Surplus (sum surplus for each consumer who purchases widget) ______________________ Social Surplus (sum consumer surplus and profit) ______________________ STOP AT THIS POINT AND WAIT FOR INSTRUCTIONS A2 Round 3: Step 1: Make Advertising Choice Number of Advertisements _______
Cons1 Cons2 Cons3 Cons4 Cons5 Cons6 Cons7 Cons8 Cons9 Cons10
(1) Initial Value of Widget 10 9 8 7 6 5 4 3 2 1
(2) Value of Widget After Advertising (Initial Value + NA)
(3) Surplus of Consumer’s (Widget Value – Price Chosen)
Step 2: Make Price Choice Price of Widgets ________ Step 3: Write the consumer surplus in the spaces provided in line (3). Number of units you sell (N): Number of cells with surplus ≥ 0 ______________________ Total Revenue (P * N): ______________________ Total Cost of Advertisements (CA*) : ______________________ Profit (Total Revenue – Total Costs): (P * N) – CA* ______________________ Total Consumer Surplus (sum surplus for each consumer who purchases widget) ______________________ Social Surplus (sum consumer surplus and profit) ______________________

24
Name___________________ Activity B Instructions: You are a firm that sells a single product, which we will call widgets. You are the only firm that sells widgets. You must choose what price to charge consumers and also how many advertisements for widgets to send to consumers. There are 10 consumers in the market. However, a consumer does not have information about widgets unless she receives an advertisement for widgets. When a consumer receives an advertisement, she learns all the characteristics of a widget (including price) and the value she places on widgets. Note that the consumer’s value of a widget does not change with advertisements. An advertisement makes consumers aware of the existence of a widget. If a consumer receives advertisement for widgets, she will purchase exactly one widget as long as the value she places on it exceeds its price. When she purchases the widget, the consumer receives a surplus equal to the value she places on the widget minus its price. If your price is greater than the value she places on the widget, or if the consumer does not receive an advertisement, she will not purchase and will earn a surplus of zero. If the price is exactly equal to the value the consumer places on widgets, she will purchase the widget and earn a surplus of zero. Each advertisement you send will be received by exactly one consumer, and each consumer can receive at most one advertisement. Consumers that have not already received an advertisement are equally likely to receive each advertisement. For example, if you choose to send out one advertisement, there is a 10% chance it will reach Consumer 1, a 10% chance it will reach Consumer 2, and so on. If you choose to send out 2 advertisements, there is a 20% chance that Consumer 1 will receive an advertisement, a 20% chance Consumer 2 will receive an advertisement, and so on. Your record sheet will contain a table similar to the following lists the values that the 10 consumers place on a widget.
Cons1 Cons2 Cons3 Cons4 Cons5 Cons6 Cons7 Cons8 Cons9 Cons10Value of Widget 20 19 18 17 16 15 14 13 12 11
You will simultaneously choose the number of advertisements to send out and the price to charge for the widget. When a consumer receives an advertisement for a widget, she also learns the price of a widget. You will record the number of advertisements and the price you charge in the space provided on the record sheet. After you have determined the number of advertisements to send and the price of a widget, we will place 10 poker chips numbered 1 through 10 in an opaque container. We will draw one poker chip from the container for each advertisement you send without replacement (because you reach exactly one consumer with each advertisement). For example, if you choose three advertisements, we will draw three poker chips. The number written on the poker chip corresponds to the consumer number. The consumers your advertisements reach correspond to the numbered poker chips that are drawn from the container.

25
Once the poker chips are drawn, circle each consumer you reach and calculate the surplus they receive given your price. If a consumer receives an advertisement from you, she will purchase one widget if her surplus is greater than or equal to zero. If her surplus is less than zero, or she did not receive an advertisement for widgets, she will not purchase. Write down the total number of units you sell (N) in the space provided on your worksheet. Your total revenue is the price chosen multiplied by the number of units you sell: p * N. Your total advertising cost is determined by the number of advertisements you choose. The cost of advertising increases and each advertisement incurs an additional cost greater than the previous advertisement. For example, the first advertisement has a cost CA1, the second advertisement has a cost CA2, and so on, where CA1 < CA2 < CA3, etc. The total advertising cost is provided on the record sheet. If you choose A* number of advertisements, the total cost of advertising is CA*. The production cost for each widget is $0. Therefore, your total cost is solely the total cost of advertising. Your profits are Total Revenue minus Total Cost: (P * N) – CA* If you have a question, raise your hand and we will come to your desk. You are making these choices independently, so please do not talk or try to see the choices of your neighbors.

26
Record Sheet for Scenario B1 The total cost for number of advertisements is given below:
# of Advertisements 0 1 2 3 4 5 6 7 8 9 10 Marginal Cost of Advertising 0 2.5 3.5 4.5 5.5 6.5 7.5 8.5 9.5 10.5 11.5
Total Cost of Advertising 0 2.5 6 10.5 16 22.5 30 38.5 48 58.5 70
For example, if you choose to send out three advertisements, your total cost of advertising will be $10.50 and if you choose to send out 7 advertisements, your total cost of advertising is $38.50 B1 Round 1: Begin by making Choices: Number of Advertisements _______ Price of Widgets ________ Once you have made your choice, raise your hand and we will come around the room to draw poker chips out of the opaque container. The numbers on the poker chips determine which consumers you reach with advertisements. Circle the number of the consumer you reached and write their surplus in the empty spaces provided in line (2):
Cons1 Cons2 Cons3 Cons4 Cons5 Cons6 Cons7 Cons8 Cons9 Cons10(1) Value of Widget 20 19 18 17 16 15 14 13 12 11 (2) Surplus of Consumer’s
Reached (Value above – Price Chosen)
Number of units you sell (N): Number of cells with surplus ≥ 0 ______________________ Total Revenue (P * N): ______________________ Total Cost of Advertisements (CA*) : ______________________ Profit (Total Revenue – Total Costs): (P * N) – CA* ______________________ Total Consumer Surplus (sum surplus for each consumer who purchases widget) ______________________ Social Surplus (sum consumer surplus and profit) ______________________ STOP AT THIS POINT AND WAIT FOR INSTRUCTIONS

27
B1 Round 2: Begin by making Choices: Number of Advertisements _______ Price of Widgets ________ Once you have made your choice, raise your hand and we will come around the room to draw poker chips out of the opaque container. The numbers on the poker chips determine which consumers you reach with advertisements. Circle the number of the consumer you reached and write their surplus in the empty spaces provided in line (2):
Cons1 Cons2 Cons3 Cons4 Cons5 Cons6 Cons7 Cons8 Cons9 Cons10(1) Value of Widget 20 19 18 17 16 15 14 13 12 11 (2) Surplus of Consumer’s
Reached (Value above – Price Chosen)
Number of units you sell (N): Number of cells with surplus ≥ 0 ______________________ Total Revenue (P * N): ______________________ Total Cost of Advertisements (CA*) : ______________________ Profit (Total Revenue – Total Costs): (P * N) – CA* ______________________ Total Consumer Surplus (sum surplus for each consumer who purchases widget) ______________________ Social Surplus (sum consumer surplus and profit) ______________________ STOP AT THIS POINT AND WAIT FOR INSTRUCTIONS B1 Round 3: Begin by making Choices: Number of Advertisements _______ Price of Widgets ________ Once you have made your choice, raise your hand and we will come around the room to draw poker chips out of the opaque container. The numbers on the poker chips determine which consumers you reach with advertisements. Circle the number of the consumer you reached and write their surplus in the empty spaces provided in line (2):
Cons1 Cons2 Cons3 Cons4 Cons5 Cons6 Cons7 Cons8 Cons9 Cons10(1) Value of Widget 20 19 18 17 16 15 14 13 12 11 (2) Surplus of Consumer’s
Reached (Value above – Price Chosen)
Number of units you sell (N): Number of cells with surplus ≥ 0 ______________________ Total Revenue (P * N): ______________________ Total Cost of Advertisements (CA*) : ______________________ Profit (Total Revenue – Total Costs): (P * N) – CA* ______________________ Total Consumer Surplus (sum surplus for each consumer who purchases widget) ______________________ Social Surplus (sum consumer surplus and profit) ______________________ STOP AT THIS POINT AND WAIT FOR INSTRUCTIONS
28
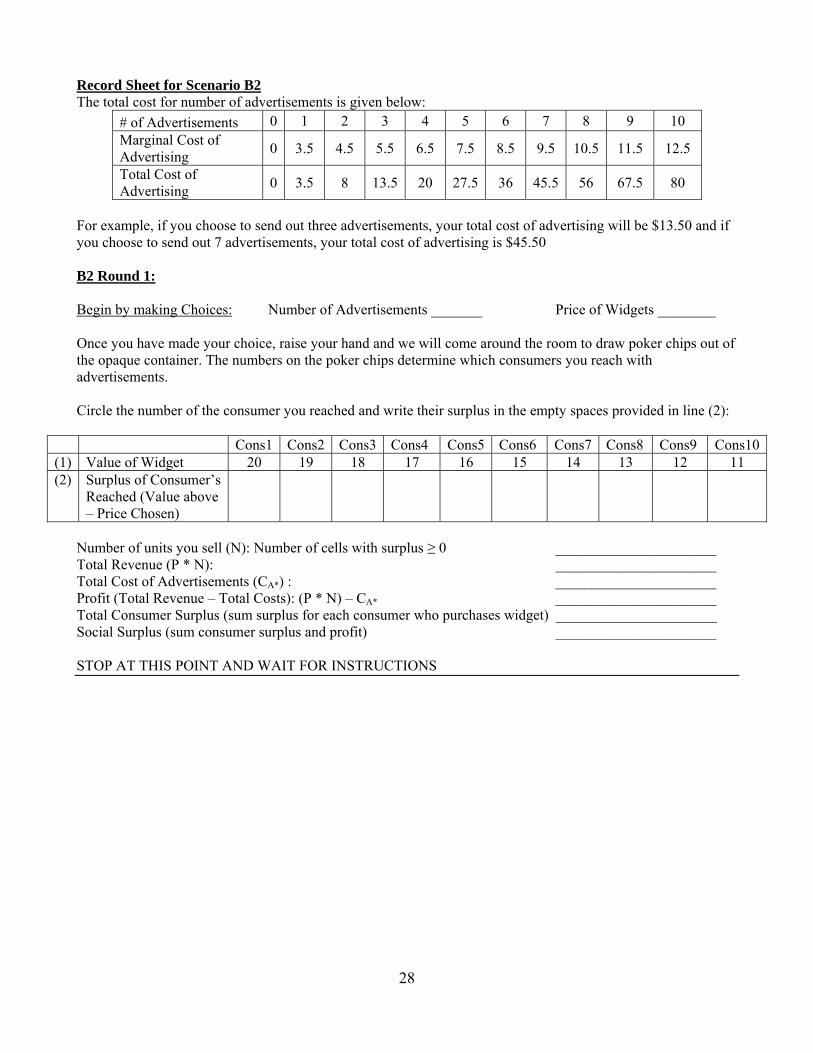
Record Sheet for Scenario B2 The total cost for number of advertisements is given below:
# of Advertisements 0 1 2 3 4 5 6 7 8 9 10 Marginal Cost of Advertising 0 3.5 4.5 5.5 6.5 7.5 8.5 9.5 10.5 11.5 12.5
Total Cost of Advertising 0 3.5 8 13.5 20 27.5 36 45.5 56 67.5 80
For example, if you choose to send out three advertisements, your total cost of advertising will be $13.50 and if you choose to send out 7 advertisements, your total cost of advertising is $45.50 B2 Round 1: Begin by making Choices: Number of Advertisements _______ Price of Widgets ________ Once you have made your choice, raise your hand and we will come around the room to draw poker chips out of the opaque container. The numbers on the poker chips determine which consumers you reach with advertisements. Circle the number of the consumer you reached and write their surplus in the empty spaces provided in line (2):
Cons1 Cons2 Cons3 Cons4 Cons5 Cons6 Cons7 Cons8 Cons9 Cons10(1) Value of Widget 20 19 18 17 16 15 14 13 12 11 (2) Surplus of Consumer’s
Reached (Value above – Price Chosen)
Number of units you sell (N): Number of cells with surplus ≥ 0 ______________________ Total Revenue (P * N): ______________________ Total Cost of Advertisements (CA*) : ______________________ Profit (Total Revenue – Total Costs): (P * N) – CA* ______________________ Total Consumer Surplus (sum surplus for each consumer who purchases widget) ______________________ Social Surplus (sum consumer surplus and profit) ______________________ STOP AT THIS POINT AND WAIT FOR INSTRUCTIONS

29
B2 Round 2: Begin by making Choices: Number of Advertisements _______ Price of Widgets ________ Once you have made your choice, raise your hand and we will come around the room to draw poker chips out of the opaque container. The numbers on the poker chips determine which consumers you reach with advertisements. Circle the number of the consumer you reached and write their surplus in the empty spaces provided in line (2):
Cons1 Cons2 Cons3 Cons4 Cons5 Cons6 Cons7 Cons8 Cons9 Cons10(1) Value of Widget 20 19 18 17 16 15 14 13 12 11 (2) Surplus of Consumer’s
Reached (Value above – Price Chosen)
Number of units you sell (N): Number of cells with surplus ≥ 0 ______________________ Total Revenue (P * N): ______________________ Total Cost of Advertisements (CA*) : ______________________ Profit (Total Revenue – Total Costs): (P * N) – CA* ______________________ Total Consumer Surplus (sum surplus for each consumer who purchases widget) ______________________ Social Surplus (sum consumer surplus and profit) ______________________ STOP AT THIS POINT AND WAIT FOR INSTRUCTIONS B2 Round 3: Begin by making Choices: Number of Advertisements _______ Price of Widgets ________ Once you have made your choice, raise your hand and we will come around the room to draw poker chips out of the opaque container. The numbers on the poker chips determine which consumers you reach with advertisements. Circle the number of the consumer you reached and write their surplus in the empty spaces provided in line (2):
Cons1 Cons2 Cons3 Cons4 Cons5 Cons6 Cons7 Cons8 Cons9 Cons10(1) Value of Widget 20 19 18 17 16 15 14 13 12 11 (2) Surplus of Consumer’s
Reached (Value above – Price Chosen)
Number of units you sell (N): Number of cells with surplus ≥ 0 ______________________ Total Revenue (P * N): ______________________ Total Cost of Advertisements (CA*) : ______________________ Profit (Total Revenue – Total Costs): (P * N) – CA* ______________________ Total Consumer Surplus (sum surplus for each consumer who purchases widget) ______________________ Social Surplus (sum consumer surplus and profit) ______________________