Embed Size (px)
Citation preview

196
PERSONNEL STATISTICS AND SICKNESS- ABSENCE STATISTICS
BY F. H. SPRATLING, F.I.A.
Staff Administration Officer, London Transport Executive
AND
F. J. LLOYD, B.Sc., F.I.A. of the London Transport Executive
[Submitted to the Institute, 26 February 1951]
As an organization increases in size, so must its management increasingly depend on statistical measurement of performance and statistical presentation of fact. The nature and range of the statistics will be governed largely by the functions of the organization concerned but, if the staff is of more than modest size, personnel statistics will certainly be among them.
2. Most routine requirements of management are satisfied by simple enumerations—numbers of staff in various categories at a given date, numbers who enter and leave the service in a given period, numbers in training, numbers absent for various reasons, and so on. For some purposes, enumerations may be supported by percentages, such as the percentage of staff employed who leave the employer’s service in the course of a year (usually called ‘the annual rate of turnover of labour’), or the percentage of productive time lost through sickness absence.
3. But the management of a large organization must concern itself with more than routine. In the development of staff policy, it must take a long view. It must, for example, ensure that a nucleus of skilled and experienced staff is built up in each branch of its service, so that efficiency can be maintained as the older staff retire. It must be informed on matters concerning recruitment to and wastage from its service. In the interests of the physical health and general well-being of its staff, it must pursue an active policy in relation to working conditions in the broadest sense.
4. Suitable statistical data contribute much to the informed consideration of such matters. They are essential for many financial purposes; reliable estimates of the cost of pensions and sick pay, for example, cannot be prepared without a solid statistical foundation. In the same way, the operation of an industrial medical service is greatly assisted by statistical analysis of sickness absence and by subdivision of sickness absence into broad diagnostic groups, so that the relationship between different occupations and different causes of sickness may be studied. From time to time the Industrial Health Research Board of the Medical Research Council has made studies of sickness absence in particular occupations, but a positive approach to questions of industrial health in large organizations demands systematic collection of sickness-absence data.
5. Age-distributions of particular groups of staff are at least as important as their numbers in considering long-term staffing problems. The proportion

Personnel Statistics and Sickness-Absence Statistics 197
of staff resigning from employment is likely to be several times as high in the first year or two of service as it is after five years or more at the same job. Among men, at least, the yearly amount of sickness causing absence from work increases with age; the normal amount of sickness absence for men in the late fifties is about two or three times as much as it is in the twenties and early thirties. The sickness absence of women is normally more than that of men, and that of married women more than that of unmarried women.
6. For these reasons, simple statements of numbers of staff and crude over-all percentages are at best inadequate for managerial purposes. It is as if the serious demographer were expected to be satisfied with crude birth-rates and death-rates per 1000 population. Numbers of staff, wastage and sickness absence ought to be capable of analysis by age, length of service, sex and, for women, marital status, if they are to lead to a true appreciation of the matters on which they bear. Sickness-absence statistics ought to be capable of further subdivision into diagnostic groups.
7. The object of this paper is to discuss principles and methods of collection and analysis of personnel statistics and sickness-absence statistics, with special reference to a system developed in the undertaking of the London Transport Executive to meet administrative, financial and medical requirements. Punched-card methods are used, for they permit reliable and informative data to be prepared in greater detail than can be compiled at reasonable cost by ordinary clerical methods. The sickness-absence statistics are found incidentally to serve purposes beyond those of the undertaking itself; in several applications they are proving of value to the wider purposes of medical research.
8. The Central Record of Staff Statistics, as it is called in London Transport, acknowledges and preserves the intimate relationship that exists in fact between the statistics of manpower, wastage and sickness absence. Principles and methods developed by actuaries for other purposes prove to be well- suited to the requirements of the work, although their detailed application must obviously be governed by the circumstances and structure of the organiza- tion concerned.
THE NATURE OF THE PROBLEM
9. The staff of London Transport numbers about 100,000. They are employed in many different types of work with no common hours of duty. Drivers and conductors of the road vehicles, porters, ticket collectors and other grades of operating staff generally work on a rotating shift basis. Maintenance of vehicles, equipment and plant goes on at all hours of the day and night. The staff in the overhaul works are employed substantially under factory conditions, with a five-day week. Most of the clerical staff work normal office hours on five and a half days a week. To obtain valid statistical comparisons, it is necessary to consider the staff in homogeneous occupational groups subject to common, or closely comparable, conditions of service.
10. The staff report for duty at, and are based for day-to-day administrative purposes on, many different places of employment spread over the London Transport Area of some 2000 square miles. The individual employees’ personal record files are normally built up progressively and held in the various employing departments, where they are maintained and used for

198 Personnel Statistics and Sickness-Absence Statistics
day-to-day purposes. The basic problem of the Central Record is to collect and to record at the centre of the organization all data relevant to a statistical presentation of facts relating to the staff employed at any time, recruitment, promotion, wastage and sickness absence of the staff as a whole and of parti- cular groups of staff. Until the Central Record was created, it was necessary to collect and collate non-routine statistical data by means of ad hoc returns prepared in the employing departments, a laborious and time-consuming process.
PRINCIPLES
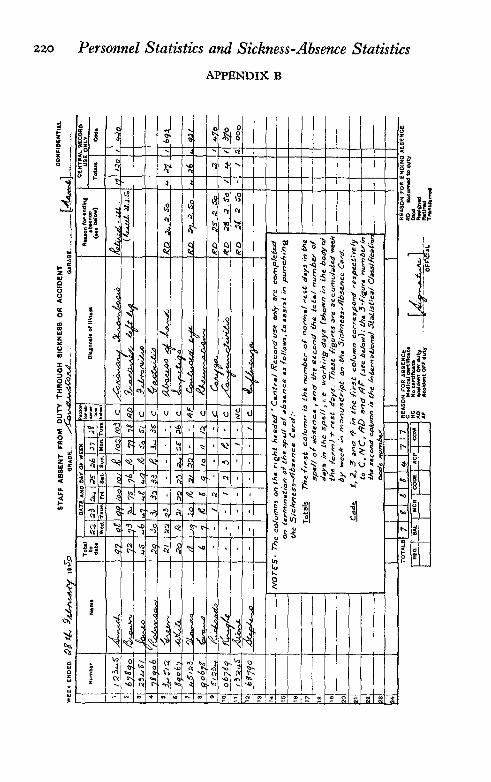
11. In the creation and maintenance of the Central Record, four basic principles have been, and are being, observed, namely:
(a) The Central Record must at all times, in total and in detail, be as accurate as possible.
(b) Only such facts as can be kept up to date accurately by normal admini- strative processes are punched into the Central Record cards.
(c) The collection of data for the Central Record must impose as small a burden as possible on the functional departments of the under- taking; any additional work entailed in providing such data should not be more than is commensurate with the value expected to be derived from the Central Record.
(d) For any series of observations capable of statistical analysis from the Central Record, the corresponding ‘exposed to risk’ must always be available.
12. Because it is of little value to provide the statistically inexpert with a mass of statistical raw material, provision has been made for the appreciation of statistics derived from the Central Record by suitably qualified staff.
13. Throughout, there has been close collaboration between the medical officer and the actuary on all matters involving medical considerations; such collaboration is essential if the best results are to be obtained.
OUTLINE OF SYSTEM
14. Basically, the Central Record consists of three files of punched cards called:
(a) The Main File; (b) the Wastage File; (c) the Sickness-Absence File.
The Main File, at any time, contains one card (the Main Card)’ for each employee then in the service. When an employee leaves the service or a change occurs in one or other of the facts recorded in the Main Card because, for example, the employee has been promoted, the date and nature of the event are punched into the card, which is then passed to the Wastage File. If the employee is still in the service, a fresh Main Card is created for him, punched with up-to-date particulars. The Main File becomes the source of statistical information about the active staff, while the Wastage File contains the data from which wastage of various kinds and promotion and transfer rates from one occupation, or grade as it is called, to another can be measured and analysed.

Personnel Statistics and Sickness-Absence Statistics 199
15. The Sickness-Absence File is built up on the general basis of a separate card (the Sickness-Absence Card) for each spell of sickness absence. The methods employed permit commencement or discontinuance of a Sickness- Absence File as occasion requires for particular groups of staff. It must be remembered, however, that the appreciation of sickness-absence statistics is a long-term undertaking. The experience of a single year is of limited value and may even be misleading; collection of data must continue for several years if results of real value are to be obtained.
The Main File and the Wastage File
16. The facts punched into each Main Card are set out below; except for the employee’s name and initials, suitable numerical codes have been developed for items not numerical in form.
Item Name and initials
Remarks
Identification number (if any) Sex Dates of
birth entry to service entry to grade
Department
Mr, Mrs or Miss
Normal place of reporting for duty Grade (occupation) Method of entry to Grade Direct entry, promotion, reduction in grade,
transfer from another grade for medical
Previous grade (if any) in London Transport service
reasons, or transfer for other reasons
Transport undertaking from which the employee was transferred to the service of the London Pas- senger Transport Board or the London Transport Executive, as the case may be
London Transport as it now exists was formed by amalgamation of many separate transport undertakings
17, Spare columns in the Main Cards are available for recording subsidiary data required for particular purposes from time to time, either of general application or of limited application to particular groups of staff. When a change occurs in any of the recorded facts for a particular employee, the additional information set out below is punched into the Main Card, which is then passed to the Wastage File.
Item Remarks Date of change Reason for change Dismissal, resignation, retirement (age), dis-
charge for medical reasons, death, transfer to another grade for medical reasons, transfer for other reasons, promotion, reductron in grade, change of name or number, or change of
Diagnostic code (only in cases of death, discharge for medical rea- sons, or transfer for medical rea- sons)
normal place of reporting for duty 3-figure International Statistical Classification (see paragraph 67)

200 Personnel Statistics and Sickness-Absence Statistics
18. The omission of the employee’s rate of pay from the Main Card may be a matter of comment. The desirability of including this, and incidentally certain other items, was carefully considered. Large numbers of staff are covered by incremental scales, some long and some short, related to age and/or to length of service in the grade, while from time to time new rates of pay simultaneously affecting large numbers of staff are introduced. It follows that inclusion of the rate of pay in the Main Card would substantially increase card turnover. Moreover, for many purposes, earnings are of more consequence than standard rates of pay. Earnings include additional payments for such items as week-end, night and Bank Holiday working, and vary from week to week for individual employees. Other and more appropriate means than those provided by the Central Record exist for obtaining statistics of earnings. It was therefore considered that inclusion of the standard rate of pay in the Main Card would have caused more complication than the information was worth,
19. The Main File was created in sections over a period of two years. For each section of staff, a date was fixed and a special collecting card was created showing the name, identification number (if any) and grade of each employee on the pay-roll at the relevant date. The data required for the Main Card were then extracted, case by case, from the employee’s personal record file and recorded in manuscript on the collecting card. Provisional Main Cards were then punched from the collecting cards and a thorough check imposed by comparing tabulations of the provisional Main Cards with the personal record files. The appropriate section of the Main File was then accepted as correct at the known date and handed over to normal maintenance with effect from that date.
20. Maintenance of the Main File is based on copies of documents called Change in Pay-roll Advices which are prepared each week to authorize changes in the pay-roll, that is to say addition of the names of new employees, deletion of the names of those who have left the service and authorization of all changes in status and rates of pay. These documents are prepared primarily for the purpose their title indicates. Simultaneous preparation of an additional copy for the Central Record causes no appreciable amount of extra work. The number of card movements, and so the number of punch operators required to maintain the Main File, is governed to some extent by the degree of detail reflected in the coding of such items as grade, department and normal place of reporting for duty, as well as the more significant facts of recruitment, promotion and wastage.
21. Great importance is attached to the care of the cards and to the need for accuracy. It is possible to organize work of this kind in alternative ways. In the flow, or progressive, system the work is arranged so that one punch operator completes one operation for all the cards; another punch operator completes another operation; and so on. The alternative system holds each punch operator responsible, among other things, for all the work involved in maintenance of a section of the Main File, and, of course, for the accuracy of the work. This latter method is used in the Central Record and is producing satisfactory results.
22. As an over-all numerical control of the cards, each punch operator records and compiles progressive totals of the number of entries in each Change

Personnel Statistics and Sickness-Absence Statistics 201
in Pay-roll Advice in a book in columnar form, similar in principle to the class-books maintained for controlling the accuracy of a life office’s valuation data. In addition, a positive check of part of the Main File is made against the current pay-roll each week, arranged on a system which ensures that each part of the Main File will be so checked at least once in every two years. Other less systematic checks arise incidentally in the course of the normal work.
23. It will be appreciated that the detailed content of the Main File is constantly changing. Because of the difficulty of making statistical analyses by reference to a changing file and, indeed, the impracticability of making retrospective analyses, it is a feature of the system that a duplicate pack of cards is reproduced from the existing Main File at 31 December each year. The new pack becomes the current and changing Main File for the ensuing year, while the old pack is used as a working pack, reflecting the staff position in detail at the relevant 31 December. The working pack is sorted, first by year of birth, and secondly by year of entry to service. Age to be attained and duration of service to be completed in the following year are then gang- punched into the cards. The reasons for using these particular methods for calculating age and duration of service, together with other related matters referred to later, are discussed in Appendix A.
The Sickness-Absence File
24. The Sickness-Absence File is supplemental to the Main File. It comprises a separate card for each spell of sickness absence. For an employee who goes sick, the information already punched into the Main Card (see paragraph 16) is reproduced in the Sickness-Absence Card with the addition of the following facts specific to the period of sickness absence to which the card relates:
Item Day of week and date of
commencement of absence termination of absence
Remarks
Number of calendar days of absence Number of normal rest days in the
Conditions governing rest days vary widely for different groups of staff in London Transport ;
period of absence it is necessary to record both items if a reliable measure of working days lost is to be obtained
Type of absence Whether sickness absence supported by a medical certificate, sickness absence not sup- ported by a medical certificate, absence due to accident on duty, or absence due to accident off duty
Diagnostic code 3-figure International Statistical Classification Reason for termination of absence Whether return to duty in same grade, return
to duty in another grade, discharge for medical reasons, retirement (age), death, dismissal, resignation, or grant of maternity leave
25. Employing departments render weekly returns of all sickness absence experienced by the appropriate groups of staff during the week. An example of the form used for the drivers and conductors of the Central Buses, i.e. the red buses, is reproduced in Appendix B with illustrative entries. It is compiled

202 Personnel Statistics and Sickness-Absence Statistics
daily in duplicate at the garage at which the drivers and conductors report for duty and serves three separate purposes:
( a ) the top copy is the weekly notification to the Central Record; ( b ) the duplicate copy, retained at the garage, is the permanent local record
of sickness absence; ( c ) the total number of days’ sickness absence shown at the foot of the form
day by day provides a check against the corresponding figure on a separate daily statement summarizing how the total manpower at the disposal of the official in charge of the garage has been deployed.
The letter R in the body of the form indicates that the day in question would have been the employee’s normal rest day if he had not been absent sick. The daily insertion of the progressive number of working days’ absence in each case serves two other purposes. On termination of the absence, the punch operators of the Central Record are provided with an indication of the length of absence to be punched into the card. Secondly, the local officials are automatically reminded of administrative action which has to be taken at various stages during a period of sickness absence.
26. When the weekly return is received in the Central Record, new Sickness- Absence Cards are created for absences which commenced during the week. If the absence terminated in the same week, the card can be completely punched in a single operation. If not, the partially completed card is held in suspense and checked week by week against the following entries on successive returns until the absence terminates, when the remaining data are punched into the card.
27. Originally, weekly returns were obtained showing complete details of the sickness absences which terminated in that week, and nothing more. This procedure was devised so that the employing department would have to make one return only for each period of sickness absence, however long it lasted. Experience of this method was unsatisfactory; it was found that a significant proportion of the sickness absences was omitted altogether. The method described in paragraph 25 involves slightly more work, but it is accurate and provides a record incidentally which is useful for other purposes.
THE NATURE OF WASTAGE
28. Wastage from a particular employer’s service is caused by dismissal, resignation, retirement on grounds of age, discharge for medical reasons and death. Wastage from particular grades of staff in the same employment also includes promotions, reductions in grade and transfers to other grades for medical or other reasons. In measuring wastage, methods must be used which have regard to the different characteristics of the various causes. Some of the more important of these characteristics will now be discussed.
29. Sex and, for women, marital status exert a profound influence on the experience, and it is axiomatic that separate statistics should be maintained for men, married women and unmarried women.
30. The statistical characteristics of wastage due to death, discharge for medical reasons and transfers to other grades for medical reasons are similar

Personnel Statistics and Sickness-Absence Statistics 203
in many respects. Rates of decrement from these causes vary with age and, in particular occupations, may vary independently with length of service, but the variations are unlikely to be abrupt with minor changes in either charac- teristic. It is of value to record the medical diagnosis of the cause of death or ill-health in individual cases. For this purpose the same internationally agreed 3-figure classification may be used as for sickness absence. If comparisons are sought to be made between the mortality and invalidity experience of groups of workers in different employments, it has to be remembered that the scope for absorption in alternative employment of employees who are partly in- capacitated varies greatly from one undertaking to another; they cannot, for example, be employed on work which entails responsibility for public safety. In particular cases, an employer’s policy may also be influenced by other considerations, including the nature of any pension arrangements that may exist. For some purposes it would be useful to examine mortality after retire- ment from particular employment, and to associate it with mortality during service and invalidity, but the necessary data do not become available to the employer unless domestically financed pension arrangements are in operation.
31. In times of stability, promotion rates and rates of transfer from one grade to another within the service of the same employer are governed largely by the policy of the employer. If, because of the influence of external circumstances, the undertaking expands or contracts rapidly from time to time, or is subjected to major changes of organization, promotion and transfer rates will be correspondingly affected. In general, the influence of age and length of service in particular grades will repay careful study. Dismissals and reduc- tions in grade are normally fairly infrequent and inadequacy of data prevents detailed examination; in such circumstances, simple enumerations or crude rates suffice. Waves of redundancy sometimes occur. When they do, the individual employees reduced in grade or declared redundant are usually determined by a formula which has regard both to age and length of service, but the incidence of redundancy is hardly a matter for statistical examination by methods appropriate to other causes of wastage.
32. Resignation is usually the most important single source of wastage. An unduly large number of resignations from employment are a source of social waste as well as a matter of concern and expense to the individual employer. Resignation rates vary with age and length of service, but normally length of service exercises much the more powerful influence of the two. Resignation rates are usually highest (and sometimes they are very high) after short durations of service but, as the length of service increases, the resignation rate normally reduces fairly rapidly until it reaches a relatively low level after five years or so of service.
33. To some extent, resignation rates are an index of the success or other- wise of the employer’s recruitment policy and methods of selection of staff. Circumstances external to the particular employment can exercise a consider- able influence; for example, resignation rates are likely to be much higher in conditions of full employment than when there is appreciable unemployment. Such circumstances change from time to time and from place to place. The experience of individual calendar years should therefore be recorded and examined separately. For undertakings whose activities are geographically dispersed, geographical subdivisions of the data are also of value.

204 Personnel Statistics and Sickness-Absence Statistics
34. In many occupations, seasonal influences affect the ebb and flow of labour, a possibility which must always be borne in mind and suitably provided for when examining wastage statistics.
35. An employer troubled by over-many resignations would be assisted by a reliable indication of the reasons which cause his employees to resign, for he would then know if a significant proportion were due to causes within his control. The true reasons for resignation are not, however, easy to ascertain. If the information is thought to be worth gaining, skilled interviewers must be given the task of interviewing employees who resign, or express the intention of resigning. Careful recording and analysis of the results of interviewing a properly selected sample of those resigning during a given period of time may yield useful information.
THE MEASUREMENT OF WASTAGE
36. The most commonly used statistical index of staff wastage is the annual rate of turnover of labour, to which an allusion has already been made in paragraph 2. The rate is calculated by the formula:
Annual rate of turnover of labour = (Total wastage for all causes in a year)/(Average number of staff employed during the year).
37. Because of the influence of age and length of service on wastage from various causes, this particular statistic shares many of the characteristics of a crude death-rate. It is useful up to a point, but it is not sufficiently informa- tive for many purposes. It does not, for example, provide a sound basis for comparisons between the experience of different undertakings or of different periods in the same undertaking. Its deficiencies are magnified if, as sometimes happens, the total wastage of a single month, or a period of three months, is used as the numerator and the resulting ratio is multiplied by 12 or 4, as the case may be, to obtain an equivalent annual rate, for the experience of a short period is seldom representative. Wastage due to different causes should be examined separately.
38. Because wastage rates due to death, discharge or transfer to other grades for medical reasons do not change abruptly with minor changes in age or length of service, it is probably sufficient to calculate decremental rates for these causes in 5-year age-groups, subdivided into 5-year length-of-service groups, and further subdivided, if the volume of data permits, into diagnostic groups. In practice, the degree of subdivision must be governed by the volume of data available and other relevant circumstances. A suitable formula is set out in Appendix A, paragraph 89. The rates so calculated are central rates. An advantage of this formula, in addition to its mechanical convenience, is that it is similar to that suggested subsequently for calculating sickness-absence rates (Appendix C, paragraph 107); consequently, the same exposed to risk can be used.
539. For wastage due to resignation, the methods of analysis described in the previous paragraph are usually sufficiently accurate where the duration of service exceeds five years. The results are again expressed in the form of central rates for 5-year age and length-of-service groups. For duration of service of less than five years, it is usually worth calculating resignation-rates

Personnel Statistics and Sickness-Absence Statistics 205 for individual years of service. For this purpose, it is necessary to relate the calculations to completed, or curtate, years of duration of service.
40. Provided that the anniversaries of entry of the respective populations under consideration are evenly spread over the period of observation (say a calendar year), then a modified method may reasonably be used to calculate the exposed to risk for central resignation-rates, for curtate durations of service. A suitable formula is set out in Appendix A, paragraph 91. By an appropriate adjustment, described in paragraph 95, the formula can still be applied when the anniversaries of entry are not evenly spread over the period of observation. Experience of the post-war years, where, in the particular organization with which the authors are associated, the intake of new entrants has been unevenly spread over successive calendar years, has shown the need for this adjust- ment. With punched-card techniques, both the modified method and the adjustments are convenient.
41. Over the first year or two of duration of service, the force of resignation, in the actuarial sense, may vary within fairly wide limits. If that is so, it will be informative to analyse resignations over short durational intervals, for example quarterly or even monthly. To calculate rates, or probabilities, of resignation over such short durational periods, more refined methods are required. These methods must, however, be used with caution in view of the factors described in paragraphs 33 and 34. The modified method can be used but this would require a census of population every quarter, or every month, and the durations of service would be more complicated to calculate and to punch into the cards. Another method is to build up the exposed to risk by tracing in detail the experience of new entrants in a given period over successive short durational intervals for the first year or two of their service. This method is described more fully in Appendix A, paragraph 98; it has the disadvantage of using part only of the available data.
42. When wastage rates have been calculated, their implications can be illustrated by applying the service-table technique to show the proportion of new entrants who would still remain in the service, or in the particular grade, after 5, IO or any other number of years’ service on the basis of the particular experience which has been examined. It is also useful to calculate ‘expected’ wastage in advance of the event and to compare expected with actual wastage when it occurs, so that a reliable indication can be obtained currently of an improving or a deteriorating trend.
THE NATURE OF SICKNESS ABSENCE 43. The term ‘sickness absence’ means absence from work ascribed by the
employer to sickness or accident. The statistical characteristics of sickness absence differ from those of other types of recorded sickness and it is important that the differences should be clearly appreciated by those who make use of sickness-absence statistics. The differences may be illustrated by a brief reference to the principal sources of sickness statistics and a consideration of their respective characteristics.
44. Since 1944, the Social Survey of the Central Office of Information has conducted a monthly survey of illness, injuries, incapacity and medical con- sultations experienced by representative samples of the population in England

206 Personnel Statistics and Sickness-Absence Statistics
and Wales. The survey is conducted by interviewing at the beginning of each month a sample of 4000 persons aged 16 and over, selected at random from the registers of the local National Registration Offices. Statistics so obtained have been included in the Registrar-General’s Quarterly Returns for England and Wales since 1946. These statistics cover
( a ) the whole population of England and Wales aged 16 and over;
( b ) all types of injury, illness and incapacity, including those suffered by persons who are not and never have been gainfully employed, and also injuries and illnesses which do not incapacitate the sufferer from following his or her normal activities;
but the statistics are subject to the limitations inherent in the method of collecting the data. In particular, diagnoses obtained during interviews must often be unreliable.
45. National Insurance statistics based on payment of sickness benefit are, of course, restricted to the population and to the span of life covered by sickness insurance in the national scheme. It seems likely that much short-term sickness, i.e. sickness of one, two or three days’ duration, will not be reported. On the other hand, long-term sickness, which for this purpose and for reasons subse- quently discussed may be regarded as sickness lasting four days or more, will include all sickness up to the age of 65 (men) or 60 (women) suffered by persons who fall sick in the course of their employment even though they do not return to work.
46. Friendly Society statistics are similar in principle to National Insurance statistics. The sickness experience of a particular society may, however, be influenced by special provisions in its rules governing the form, or the maximum amount, or the period, of sickness benefit.
47. The characteristics of sickness-absence statistics may be summarized as follow:
( a ) they are specific to the particular group of employees whose experience is recorded;
( b ) only so much sickness as is reflected in absence from work is included; such of the long-term and chronic sickness as occurs after termination of employment is excluded (the importance of the exclusion may be judged broadly from the fact that, out of a total of 26.7 million days of incapacitating sickness recorded for insured persons in Scotland in the year to 30 June 1937, 11.3 million days were ascribed to cases which lasted over the whole of the year);
( c ) subject to ( b ) above the amount of recorded sickness absence should be complete; in particular, sickness-absence statistics should include all the short absences of one, two or three days’ duration ascribed to sickness;
( d ) age, length of service, either in a particular employer’s service or in a particular grade or occupation, and the occupation itself should be accurately recorded, permitting correspondingly accurate analyses and subdivisions of data. The importance of this aspect of the matter is emphasized by a reference to Henry Brown’s note on the Registrar- General’s reports on occupational mortality in connexion with the 1921 and 1931 censuses.

Personnel Statistics and Sickness-Absence Statistics 207
48. A number of extraneous factors, related neither to sickness nor to such effects as working conditions may have on health, can profoundly influence the amount of sickness absence recorded in particular employments. The most important of these extraneous factors are:
( a ) the employer’s practice in determining the period for which employees absent sick are retained on his books as employees; a lenient practice in this respect would increase the recorded sickness-absence rates and probably also the recorded rates of mortality in service while reducing those of retirement due to ill-health, and conversely a strict practice would decrease the first two and increase the last-named;
( b ) the nature of the work to be done and the day-to-day standard of physical fitness it requires;
( c ) the nature and degree of the selective processes applied to persons seeking admission to the employment in question;
( d ) whether or not payment is made during sickness absence and, if so, on what scale and for how long.
49. It follows that there can be no such concept as an absolute rate of sickness absence. Factors such as those mentioned in paragraphs 47 and 48 must always be borne in mind in the assessment of a particular experience, or the comparison of one experience with another. For some comparisons, one or more of these factors may be common to each experience and, as it were, cancel out, but it is seldom that different experiences are directly comparable in all essential characteristics. Yet, provided due discretion is exercised, sickness-absence statistics gain greatly from comparisons. The methods of analysis discussed in the next section of this paper have been developed with the object of isolating some of the more important sources of heterogeneity, and so to provide as firm a basis as possible for comparisons between different experiences and between the experience of the same group of workers at different times.
50. There is a strong seasonal element in the incidence of sickness absence. Normally it may be expected to be highest in Great Britain in February and lowest in July and August. A calendar year is therefore the minimum period for which it is worth calculating sickness-absence rates, and the potential effect of epidemics on the experience of individual years should always be borne in mind.
THE MEASUREMENT OF SICKNESS ABSENCE
51. It has already been noted that sickness-absence statistics include all the short absences that National Insurance and Friendly Society statistics do not. This points to the need to separate short from long sickness absences for the purposes of statistical analysis. The statistics of long absences should then provide a firmer basis for comparisons between different experiences than either the short absences or the total sickness absence.
52. It therefore becomes necessary to determine where the dividing line between short and long sickness absences should be drawn. Under the National Insurance Act, 1946, the first three days of sickness rank for benefit if the period of sickness lasts for twelve days or more; in this assessment Sundays
AJ 14

208 Personnel Statistics and Sickness-Absence Statistics
are disregarded. Moreover, the twelve days need not be continuous for, in certain circumstances, the Act permits linking up of short spells of sickness. In dealing with industrial sickness-absence statistics, ‘linking-up’ provisions which would have the effect of ascribing days of successive absences notionally to different durations of absence would, it is considered, be out of place. A practical solution to the problem seems to be first, to treat each spell of sickness absence by itself, that is to avoid ‘linking-up’ altogether; and secondly, to regard absences lasting three days or less as short sickness absences. It follows that sickness absences lasting four days or more would be regarded as long absences. In the analysis of sickness absence, short and long absences would then be investigated separately.
53. This view is supported by practical experience, as it is found that the proportion of short to long absences varies with age and that different groups of employees exhibit markedly different characteristics in this respect. For example, in one experience the proportion of sickness absences which lasted three days or less ranged from 70% at ages below 25 to 30% at ages over 60, and another experience showed a proportion of short absences which was almost constant at, or slightly above, 50% with a slight bias to higher per- centages at the younger ages.
54. Although it rests on a different foundation, this suggestion is similar in principle to the method of recording sickness absence recommended in Report No. 85 of the Industrial Health Research Board. In that report, short sickness absence is defined as absence of ‘less than four consecutive working days’, i.e. of one, two or three working days. In view of the variation in the incidence and number of working days in a week in different occupations, it is considered preferable to record days of absence in terms of calendar days, on the basis of seven days to the week, and, for the reasons indicated earlier, to regard absences of three calendar days or less as short absences and those of four calendar days or more as long absences.
55. Statistics of short sickness absences of one, two or three days repay analysis even although many of the absences may not be supported by medical certificates. In such cases, the local supervisor must decide whether the absence should be accepted as uncertified sick leave or treated as absence without leave. It may well be that social, economic and administrative factors exert a greater influence than the purely medical on these absences. Examina- tion of the figures for quite small administrative units may yield useful as well as interesting results.
56. In examining long absences of four days or more, a further refinement is necessary. Different employers may adopt different practices in determining the period for which employees absent sick are retained on their books; this possibility has already been referred to in paragraph 48. But it is probably unlikely that responsible employers make a general practice of discharging employees after less than about six months’ continuous sickness absence. If that is so, the actuary’s old friend, the first six months’ sickness, expressed in terms of sickness absence, should provide a reasonably firm foundation for comparisons between different experiences.
57. Another reason can be adduced for focusing attention on the first six months’ sickness absence. In Friendly Society practice and under the old National Health Insurance Scheme, the first six months was the period for which sick pay at the full rate (sickness benefit as distinct from disablement

Personnel Statistics and Sickness-Absence Statistics 209
benefit under the National Health Insurance Scheme) was often paid. Watson’s Manchester Unity tables, and much of the statistical material derived from the working of the National Health Insurance Scheme, distinguish the first six months’ sickness from sickness of longer duration. This argument would, however, be irrelevant in relation to sickness absence if it were not that sickness of employed persons in the insurance and Friendly Society sense, and sickness absence, are probably identical for the first six months or so of sickness in the case of sickness absences lasting four days or more. Whatever the strict conditions governing payment of sickness benefit may be, it is likely that, at these earlier durations, benefit is paid when the claimant is incapacitated from following his normal employment.
58. The National Insurance Act, 1946, differs from earlier legislation and from established Friendly Society practice in not providing for a reduction in the rate of benefit after a limited period of sickness. Nevertheless, it is permis- sible to hope that, when statistics derived from the working of the Act are published, they will include separate figures for the first six months’ sickness for attacks lasting four days or more, or a near equivalent. Such figures would provide a valuable link with past experience and, if used with due discretion, seem to offer some prospect of providing a common basis for comparison of sickness-absence experiences.
59. For the reasons already given, the amount of sickness absence recorded after six months’ absence may vary considerably in different employments. The data should not, however, be discarded. For different groups of staff, following different occupations in the service of the same employer, the admini- strative practices governing retention of the employees may well be similar and it may be useful to compare the ‘after six months’ experience of different groups, as well as of the same group at different times.
60. The foregoing arguments suggest that the most practical course is to prepare separate sickness-absence statistics for
( a ) absences lasting three calendar days or less; ( b ) absences lasting four calendar days or more, but restricting the recorded
number of days of absence to those occurring within the first six months (182 days) of continuous absence;
( c ) absences lasting six months (182 days) or more, but restricting the recorded number of days of absence to those occurring after the first six months (182 days) of continuous absence;
and to treat each separate sickness absence as an independent entity.
61. Next must be considered the form of analysis to which the crude data can most suitably be subjected. The object must always be to ensure that, if the figures have a story to tell, they will tell it. Here again, methods well known to actuaries have been found to be of the utmost value. In his paper The Analysis of a Sickness Experience, Sir Alfred Watson presented his data in the form of sickness rates (weeks per insured person per annum) and then used to good purpose a method—which he attributed to R. P. Hardy—of subdividing the sickness rates into their two component parts, namely, the number of claimants per 100 members per annum and the average number of weeks of benefit paid within the year to each claimant for benefit. Similar methods of analysis can readily be applied to sickness-absence statistics in the manner indicated below.
14-2

210 Personnel Statistics and Sickness-Absence Statistics
Because of the special characteristics of sickness absence, it is suggested that sickness-absence functions warrant the dignity of special algebraic symbols:
( sa ) x = the rate of sickness absence per person per annum, in days = (the number of days of sickness absence during the year)/(exposed to
risk), ( aa ) x = the average number of sickness absences per person per annum
= (the number of separate absences commencing in the year)/(exposed to risk),
( la ) x, = the average length of each sickness absence during the year, in days = (the number of days’ sickness absence during the year)/(the number
of separate absences).
62. These three functions ( sa )x, ( aa ) x and ( la ) x may be shortly described as the sickness-absence rate, the attack rate and the average length of absence respectively. It will be seen that they are linked by the simple relationship
( sa ) x = ( aa ) x x ( la ) x. Appendix C includes a description of the methods of evaluating sickness-absence functions by reference to the data produced by the punched-card methods described in this paper.
63. The methods of analysis described above are general in application. They can, for example, be applied with equal facility to:
( a ) total sickness absence; ( b ) sickness absence grouped by age and/or length of service; ( c ) subdivisions of sickness absence according to duration of absence in the
manner suggested in paragraph 60; ( d ) subdivisions of sickness absence in diagnostic groups; ( e ) any desired combination of ( a ), ( b ), ( c ) and ( d ).
When comparing one sickness-absence experience with another, the first stage would normally be to calculate, for each experience, the three sickness-absence functions— ( sa ) x, ( aa ) x and ( la ) x —in 5-year age-groups for sickness absences of (4-182) days. If the sickness-absence rates differ, examination of the other two functions will indicate whether this feature is due to differing attack rates, or differing lengths of absence, or both. The position may vary for different age-groups. Provided the volume of data is adequate, a further stage might be to calculate similar functions for various diagnostic groups.
64. Large groups of homogeneous data warrant detailed examination. For relatively small groups, the technique of comparing actual and expected in total and in appropriate subdivisions must usually be relied upon, the ‘expected’ being calculated by reference to an experience of known characteristics,
65. To provide the basic material for these analyses, the sickness-absence cards for each calendar year must be punched with age and length of service and with certain special holes denoting the duration-of-absence group (see paragraph 60) in which the recorded days of sickness absence fall. Then the cards must be sorted and counted and the number of days’ sickness absence accumulated in appropriate groups, work which is quickly and effectively done by the machines. Appendix D contains a description of the methods which have been adopted in the London Transport Central Record to deal with these particular matters.

Personnel Statistics and Sickness-Absence Statistics 211
66. Within limits imposed only by the data punched into the cards, it is possible to make many other analyses of the basic data, such as
( a ) the proportion of employees who experience no sickness absence in the course of a year;
( b ) a frequency distribution, according to the number of sickness absences experienced by individual employees in a given period of time;
( c ) the selection of control groups, so that comparisons may be made between the history and experience of employees who suffer from certain specified diseases and that of an otherwise similar group who do not.
CODING OF MEDICAL DIAGNOSES
67. In the London Transport Central Record, the medical diagnoses of the causes of sickness absence, of death and of ill-health retirement are coded according to the 3-figure International Statistical Classification of Diseases and Injuries adopted in 1948 by the World Health Organization.
68. Normally, diagnostic information is obtained from certificates given by the employee’s general practitioner. Most of the certificates are found, as might be expected, to be of a somewhat general character; diagnoses such as cold, influenza and gastritis are frequent. Although Volume 1 of the International Classification has 656 disease codes and 188 accident codes, the alphabetical index of diseases and accidents in Volume 11 lists several thousand verbal descriptions covered by the 3-figure code. An investigation disclosed that a list of ninety-five verbal descriptions covered some 90% of all sickness absences. This short list, somewhat expanded with experience, is in daily use by the punch operators.
69. In cases of prolonged sickness absence, successive medical certificates nay, quite properly, reflect different conditions as the illness follows its course. For example, an absence may be recorged successively as due to influenza, pneumonia, debility. In other cases, the general practitioner’s diagnosis may be supplemented by specialist opinion. Employees of London Transport who have been absent sick for more than a defined period—four weeks for those whose duties involve responsibility for public safety, but longer for others- are not permitted to resume duty until certified fit to do so by one of the Executive’s Medical Officers. Consequently, for a single spell of sickness absence, more than one diagnosis may be received. The various diagnoses are scrutinized by a Medical Officer, who indicates which should be recorded for statistical purposes. A similar procedure is followed in the few cases where doubt or difficulty arises in deciphering certificates or coding the diagnoses. In London Transport’s experience, less than 2% of the certified sickness absences for men cannot be coded numerically because of illegible, ill-defined, or blank certificates. Continued advice and guidance from Medical Officers on coding problems is, however, essential.
70. The usefulness of any analysis into diagnostic groups depends on the degree of reliability which can be placed on the medical diagnoses. As explained n the previous paragraph, employees absent for more than a defined period are examined by a London Transport Medical Officer. This has given an opportunity for a statistical review of the diagnoses originally returned to the Central Record. Among some 2000 cases examined by the Medical Officers

212 Personnel Statistics and Sickness-Absence Statistics
in a recent period, i t was found that nearly 80% of the diagnoses on the general practi t ioners’ certif icates fell into the same broad diagnostic group—see para- graph 81—as the diagnosis of the London Transport Medical Officer. Where the diagnosis differed, there were, broadly speaking, three explanations. Clerical errors arose in deciphering certif icates—for example, the words ‘peptic’ and ‘septic’ were sometimes misread; where specialist opinion was obtained, i t sometimes differed from the general practi t ioner’s; and in some cases i t was clear that the general practi t ioner did not wish to disclose the nature of the i l lness to his patient.
71. The 3-figure International Code permits refinement of detail in the coded diagnosis. The lack of detail on many certif icates covering sickness absence causes a concentration of data under the code numbers corresponding to the more general descriptions of disease or accident with, presumably, corresponding shortages under the more precise descriptions. For example, acute bronchitis is Code 500; bronchitis unqualified is Code 501; and chronic bronchitis is Code 502. Very few medical certif icates qualify bronchitis , and consequently nearly all bronchitis is coded 501. The obvious statist ical remedy is to combine the data in suitable groups. Grouping of the data has other advantages and i t might appear unnecessary to use as detailed a code as the 3-figure International Classification. No completely satisfying solution to this problem of diagnostic grouping has, however, yet been found, and at the present stage, the abil i ty to transfer the data recorded under individual diagnostic codes from one broad group to another is alone of sufficient value to justify the use of the 3-figure code.
72. Ideally, the diagnostic groups should be homogeneous, statist ically and pathologically. If there are too many groups, the amount of data in some of them will be too small to justify statist ical inference, On the other hand, if the groups are too large, dist inctive characterist ics of some of the consti tuent diagnostic codes may be lost . Another problem arises from the size of the miscellaneous group which seems to be an unavoidable feature of any system of diagnostic grouping. The relative size of this group is governed to some extent by the number of groups, but i t is suggested that one of the tests of a grouping system should be that the miscellaneous group, apart from il legible, i l l-defined or blank certif icates, should not be unduly large, having regard to the number of groups. Tolerable maxima would seem to be about 10% of
the data if there are twenty groups, or 5% of the data if there are fif ty groups, 73. Report No. 85 of the Industrial Health Research Board recommended
the use of seven broad diagnostic groups for classification of industrial sickness absence, namely:
I . Influenza and colds; II . Diseases of the respiratory system;
III . Certain diseases of the digestive system; IV. The rheumatism group; V. Functional nervous disorders;
VI. Accidents at place of work; VII. Unclassified conditions.
Groups I to VI were said to include ‘only those common diseases. . . which may have some relation to the industrial environment’ and i t was added that ‘classes of disease falling in Group VII may also, if necessary, be classified separately’. Report No. 85 was purposely called a preliminary one and it was

Personnel Statistics and Sickness-Absence Statistics 213
expected that the grouping might have to be modified after practical experience had been gained. It is perhaps not surprising that, for a particular body of data, it was found that about 35% of the recorded sickness absence fell into Group VII, an unsatisfactory result judged by the standards of paragraph 72.
74. In addition to the 3-figure diagnostic code, the International Statistical Code includes two lists of ‘Cause Groups’, one called the A series of 150 cause groups and the other the C series of fifty cause groups. The A series of 150 cause groups is recommended for tabulation of morbidity and mortality data. It appears, however, to be too detailed for sickness-absence data. For example, there are thirty-eight groups relating to infectious and parasitic diseases and seventeen groups relating to neoplasms; this implies a degree of refinement in diagnosis not to be found or expected in general practitioners’ certificates. The C series of fifty cause groups is recommended for tabulation of morbidity data for social security purposes. Analysis of sickness-absence data in these fifty cause groups is again not entirely satisfactory judged by the standards of paragraph 72. Application to a particular body of sickness-absence data showed that the amount of data allocated to several of the C Series of cause groups was very small, while 14% of sickness absence remained in the miscellaneous group.
75. A reliable system of grouping sickness-absence data is, however, essential. The most hopeful line of approach appears to be to use a compressed and otherwise slightly modified version of the C series of the International Statis- tical Classification.
76. The first three modifications suggested relate to the miscellaneous group C49. This group includes all codes relating to symptoms, as distinct from diagnoses of specific conditions. Bearing in mind the general character of many of the medical certificates provided in cases of sickness absence, it seems desir- able to combine some of the symptom codes with the corresponding specific diagnoses. The following list of symptom codes which, in the body of data examined, included about half the data in the miscellaneous group should, it is suggested, be transferred from the miscellaneous group to the appropriate groups of specific diagnoses.
3-figure code number Symptoms referable to
780 Nervous system and special senses 782 783
Cardiovascular and lymphatic system Respiratory system
784 Upper gastro-intestinal tract 785 Abdomen and lower gastro-intestinal tract 787 Limbs and back 790 Nervousness and debility
77. The second modification suggested relates to diseases of the central nervous system. The following diseases have been transferred from the miscel- laneous group to the diagnostic group relating to organic nervous disorders.
3-figure code number
Diagnoses
340-345 Inflammatory diseases of central nervous system 350-357 Other diseases of central nervous system 360-369 Diseases of nerves and peripheral ganglia

214 Personnel Statistics and Sickness-Absence Statistics
78. The third modification suggested relates to diseases of the circulatory system. The following diseases have been transferred from the miscellaneous group to the diagnostic group relating to diseases of the circulatory system.
3-figure code number
Diagnoses
430-434 Other diseases of heart 450-456 Diseases of arteries 467-468 Other diseases of circulatory system
79. The fourth modification suggested relates to cause group C50, which includes all accidents. Accidents on duty and accidents off duty have different characteristics, and it is desirable to subdivide the accident group so that separate figures are compiled for these two sub-groups.
80. A further small modification which appears to be desirable involves separation of the miscellaneous group into
(i) defined diseases and symptoms,
(ii) ill-defined or unknown causes.
This latter group would include certificates which were illegible, or designated ‘under my care’ or ‘in hospital’, and ill-defined conditions which could not be precisely coded.
81. A provisional list of twenty-one broad diagnostic groups based on the above suggestions, which appears to provide a reasonable basis for the analysis of sickness absence data, is given in Appendix E. For the same body of data mentioned in paragraph 74 only 4% of sickness absence was placed in the miscellaneous group of defined diseases and symptoms and less than 2% in the group of ill-defined and unknown diseases. The suitability of this system of grouping will be tested further as more sickness-absence data become available. By the adoption of a suitable summary-card technique, it would be possible to regroup the data, if necessary, on the basis of the C series.
SAMPLING METHODS
82. This paper would be incomplete without some mention of sampling methods. The possibility of using them has not been overlooked. The Main File and the Wastage File are used for many administrative purposes and complete files are essential. For the recording and analysis of sickness absence, it may be that sampling techniques will in due course offer some prospect of limited saving in the labour of collecting data. But the ground to be covered is at present almost uncharted. Moreover, few groups of employees are individually large enough to offer the prospect of successful application of sampling methods, especially when analysis of the data into diagnostic groups is required. For reasons such as these it was thought wiser to start with full-scale investigations, leaving the possibilities of sampling to be judged later in the light of experience.

Personnel Statistics and Sickness-Absence Statistics 215
BY-PRODUCTS OF THE CENTRAL RECORD 83. The versatility and power of punched-card methods, with the facilities
they provide for grouping, reproduction, counting and tabulation of data at high speeds, have enabled the Central Record to undertake a number of administrative tasks which would have been too laborious to attempt by normal clerical processes or which, if they were essential, previously involved pro- tracted clerical labour and corresponding expense. Work of this kind would not, by itself, justify a punched-card installation, but it is a valuable by-product of an installation required for other purposes.
CONCLUSION
84. The methods described in this paper are not claimed to be final; they will no doubt be adapted and improved with growing experience. A card design is not, however, lightly to be altered when the basic file contains 100,000 cards and the main object of the system is to provide series of com- parable statistics over a prolonged period, nor should the procedures and methods be changed unnecessarily once they have been tried and found to yield satisfactory results. The outstanding lesson of experience is that a system of the kind described must be planned with foresight and care and in consider- able detail before the practical work is commenced.
85. The authors wish to record their thanks to the London Transport Executive for permission to publish the material in this paper; to Mr Anthony Bull, O.B.E., M.A., Chief Staff and Welfare Officer, for assistance and en- couragement in the establishment of the Central Record of Staff Statistics; to Dr L. G. Norman, M.D., B.Sc., M.R.C.P., D.P.H., Chief Medical Officer, and Dr P. A. B. Raffle, M.D., D.P.H., D.I.H., Senior Assistant Medical Officer, for their collaboration in regard to the medical aspects of the matter; and to Mr J. A. Mulligan, M.A., F.I.A., for assistance in preparation of the Appendices. They also wish to record their gratification that the paper happens to be presented to the Institute during Mr Menzler’s term of office as President, for it was he who, as Actuary of the London Passenger Transport Board, originally stimulated consideration of the problems involved in the scientific treatment of personnel statistics and sickness-absence statistics.

216 Personnel Statistics and Sickness-Absence Statistics
APPENDIX A
ANALYSIS OF WASTAGE STATISTICS
Methods of calculating wastage rates
86. Wastage covers the various methods of leaving a grade, namely, dis- missal, resignation, retirement on grounds of age, discharge for medical reasons, death, promotion, reduction in grade, or transfer to another grade for medical or other reasons. The symbol is used to denote the decrement from one or more of the components of wastage.
87. Statistical analysis of wastage must take account of either or both of two variables, namely, age, and length of service (either in the service as a whole or in a particular grade).
88. Where it is sufficient to analyse the experience in 5-year age-groups, subdivided into 5-year length-of-service groups, a measure of approximation may be accepted in ascribing observations to particular age and length-of- service groups for which functions are evaluated.
89. A convenient expression for calculating the central wastage rates is set out below for the decrement for the calendar year of exposure T, for the 5-year age-group x to ( X + 4) with length of service t to ( t + 4), x and t being as defined in (i) below. In practice, the rate may usually be taken as applying to age ( X + 2), length of service ( t + 2).
where
(1)
(i)
(ii)
( x, t ) is the wastage for the decrement in the year T and the age, x = T - calendar year of birth,
the length of service, t = T - calendar year of entry; T
P ( x,t ) is the population at 1 January of the year T at age x and length of service t, x and t being defined as above;
(iii) n and m each take all possible values from 0 to 4 in all possible com- binations; thus there are 50 terms in the denominator which, when added and divided by 2, correspond to the 25 terms in the numerator.
90. It will be noticed that ages and lengths of service are similarly defined for populations and for wastage. They can conveniently be derived by machine methods. For example, all the wastage cards for the year T would first be sorted into order of year of birth. Those cards with the same year of birth would then be gang-punched with the same attained age ( T - calendar year of birth) and similarly for length of service. This method is quick and accurate.
91. Where the wastage rates in successive years of service differ, or may differ, considerably, an expression of the following type may be used to examine the experience of each year of service separately in 5-year age-groups. This expression gives the central wastage rate for the decrement for the year of

Personnel Statistics and Sickness-Absence Statistics 217
exposure T for the 5-year age-group x to ( x + 4), x being defined as in (i) below, with length of service t to ( t + 1) exact. In practice it may usually be taken as applying to age ( X + 2), length of service ( t + ½).
T
where T
(i) ( x, t ) is the wastage for the decrement in the year T and the age, x = T - calendar year of birth,
the length of service, t = curtate duration at the date of the event; T
(ii) P ( x, t ) is the population at 1 January of the year T at age x and length of service t, x and t being defined as in (i).
It will be noticed that, while x is the same, t is calculated differently for the purposes of formulae (1) and (2).
92. This method can suitably be applied to the calculation of central rates of resignation for each of the first five years or so of service.
93. If, for any reason, it were desired to examine the experience of indi- vidual years of age separately, or of individual years of age subdivided into individual years of service, similar principles could be applied.
94. Theoretically, formula (2) applies only if anniversaries of entry of the respective populations in the exposed to risk (the denominator) are evenly spread over the calendar year T. In practice, this is never exactly realized, and a degree of approximation is inherent in a calculation of the form indicated.
95. If the degree of approximation is unacceptable, the denominator of formula (2) can be adjusted to the form
where
(i)
(ii)
(3)
( t ) is the proportion of the durational year’s exposure unexpired on 1 January of the year of observation T, evaluated by calculating for the relevant population the mean anniversary of entry in that year;
T +1 ( t ) is the proportion of the durational year’s exposure expired by
1 January of the year (T + 1), similarly evaluated for the relevant T + 1
population at that date, and = 1 - ( t ). The age x has been omitted from the formula.
be examined separately for broad groups of age. If necessary, the data would
96. Even with this refinement, the formula may not give satisfactory results in measurement of wastage after short periods of service if a rapidly changing force of wastage, in the actuarial sense, is associated with considerable fluctua- tions in recruitment in successive calendar years.
(2)

218 Personnel Statistics and Sickness-Absence Statistics
97. In certain circumstances, it may be desirable to calculate wastage rates for shorter periods of service than a year, for example for three-monthly periods. Theoretically, formulae similar to those described above could be used. In practice, censuses of population would have to be taken at corre- sponding intervals, and length of service would have to be calculated and punched into the population and wastage cards in multiples of the same interval. The work would be onerous and it might be more convenient to use an alter- native method such as that described in the following paragraphs, which traces the experience of a group of new entrants over successive short periods of service.
98. A diagram assists description of the method, thus:
99. If, for example, new entrants in the year T are followed through until 1 January in the year ( T + 1) the experience examined is represented by the triangle ABE, and it is clear that the volume of data is progressively less for each quarter-year of length of service.
100. To overcome this difficulty, it would be necessary to follow new entrants in the year T to the end of the first year of exposure. Observations would then extend to the end of the year (T + 1). The experience examined would be represented by the parallelogram ABDE. The experience for the first quarter-year’s exposure would then relate substantially to the calendar year T and that for the fourth quarter-year’s exposure would relate substantially to the calendar year ( T + 1), and intermediately for the second and third quarters.
101. If the same method were projected to cover the second year of service, observations would have to be extended to the end of the year ( T + 2), i.e. for three years.
102. It is important that considerations such as these should be borne in mind in practical work, for seasonal influences often affect the distribution of wastage over the individual calendar year, and the general level of wastage from year to year may be governed substantially by circumstances external to the particular employment for which the experience is being examined.
103. A formula of the following type is suitable for measurement of wastage over successive short periods of service. In the expression of the formula, age is ignored, though it can, of course, be brought into account. The length of

Personnel Statistics and Sickness-Absence Statistics 219
service t is measured in fractional parts of a year and the symbols, which in this case relate to new entrants in the year T, may be defined as follows:
T WE( t ) = exposed to risk for the interval t exact to ( t + 1) exact;
bT = new entrants into the grade;
T
n ( t ) = transfers into the grade during the interval t exact to ( t + 1) exact;
T w ( t ) = resignations during the same interval;
T
p ( t ) = a11 other wastage from the grade, excluding resignations, during the same interval.
Then
and generally
whence resignations in the interval t exact to ( t + 1) exact may be measured by the probability
(4)
104. In interpreting results obtained from the use of expression (4), it must be remembered that the probability of resignation calculated in this manner is not strictly comparable with the central rates calculated by expressions (1), (2) and (3).
T
220 Personnel Statistics and Sickness-Absence Statistics
APPENDIX B

Personnel Statistics and Sickness-Absence Statistics 221
APPENDIX C
ANALYSIS OF SICKNESS-ABSENCE STATISTICS
Methods of calculating exposed to risks and rates of sickness absence
105. The analysis takes account of two variables, namely, age and length of service (either in the service as a whole or in a particular grade). For many purposes it is sufficient to analyse the experience in 5-year age-groups sub- divided, where the volume of data permits, into 5-year length-of-service groups.
106. A spell of sickness absence may cover one or more years of age, one or more years of length of service, one or more calendar years, and any combina- tion of these three variables. In the formula which follows, the days of sickness absence are allocated precisely into separate calendar years, but a measure of approximation is accepted in ascribing observations to particular age and length-of-service groups for which functions are evaluated.
107. A convenient formula for calculating central rates of sickness absence is set out below, for the year of exposure T, the 5-year age-group x to ( x + 4) with length of service t to ( t + 4), x and t being as defined in (ii) below. In practice, the rate may usually be taken as applying to age ( x + 2), length of service ( t + 2). The brackets round the suffixes of the symbol ( Sa ) { x +2 }{ t +2 } are intended to denote that the numerical value is derived from the data for a group centering on the age and duration indicated.
(5)
where (i) the days of sickness absence in the numerator relate to the durational group to be examined, whether all sickness absence, sickness absence of three days or less, first six months of sickness absence lasting at least four days, or ‘after six months’, or whatever else may be required ;
(ii) days of sickness absence in year T are ascribed to age x and length of service t, where
x = T - calendar year of birth, t = T -calendar year of entry;
T (iii) P ( x, t ) is the population on 1 January of the year T at age x and
length of service t, x and t being defined as above;
(v) n and m each take all possible values from o to 4 in all possible combinations ; thus there are 50 terms in the denominator which, when added and divided by 2, correspond to the 25 terms in the numerator.
will be observed that age and length of service are similarly defined tions and for sickness absence. They can conveniently be derived
Days of sickness absence in the year T at ages x to (x+4)and length of service t to (t+4)

222 Personnel Statistics and Sickness-Absence Statistics
by machine methods. For example, all the Sickness-Absence cards for the year T would first be sorted into order of year of birth. Those cards with the same year of birth would then be punched with the same attained age ( T - calendar year of birth), and similarly for length of service. This method is quick and accurate.
109. A corresponding formula for calculating central attack rates is set out below for the year of exposure T for the 5-year age-group x to ( x +4) with length of service t to ( t +4), x and t being defined as above. In practice the rate may usually be taken as applying to age ( X + 2), length of service ( t + 2). The brackets round the suffixes have the same meaning as in paragraph 107.
where the symbols are defined in the same way as for formula (5). (6)
110. The length of absence can, of course, be calculated directly by dividing the days of sickness absence (the numerator of formula (5)) by the number of new attacks of sickness absence (the numerator of formula (6)), or indirectly from the relationship
(7)
111. If temporary effects of initial selection on sickness absence are to be examined, it may be desirable to calculate sickness-absence rates for individual years of length of service. Because of the method used to calculate length of service, formulae (5) and (6) would not be reliable if applied to a single year of length of service. It would be necessary to allocate the sickness absence precisely to separate years of length of service, although approximate 5-year age-groups could still be used.
Number of separate absence commencing in the year t atages x to (x+4) and length of service t to (t+4)

Personnel Statistics and Sickness-Absence Statistics 223
APPENDIX D
METHOD OF ALLOCATING SICKNESS ABSENCE TO SEPARATE CALENDAR YEARS, AND TO FIRST SIX
MONTHS’ DURATION AND THEREAFTER
112. If a spell of sickness absence commences in one calendar year and ends in another, the number of days of sickness absence occurring in each separate calendar year is allocated to that calendar year, and ascribed to the age and length of service, in integral years completed in that calendar year. Separate cards are punched for the period of absence in each calendar year. Also, if a spell of sickness absence lasts for more than six months (182 days), separate cards are punched for the period falling within the first six months (182 days) of absence, and for the remainder of the period. The combination of these possibilities leads to the cases shown in the table on p. 224.
113. When analysing the Sickness-Absence cards, a sorting on the columns representing the calendar year of the date of commencement will isolate all sickness absence occurring in a particular calendar year. Cards with Denoting Code 1 will include the number of days of sickness absence in that calendar year of all spells commencing in that calendar year and falling within the first six months of absence. The number of cards will indicate the number of new absences commencing in that calendar year. The cards with Denoting Code 2 will include the number of days of sickness absence in that calendar year of all absences extending from the previous calendar year and falling in the first six months of absence. The cards with Denoting Code 3 will include the number of days of sickness absence in that calendar year in excess of 182 days for all spells commencing in that calendar year or extending from the previous calendar year. Cards with Denoting Codes 2 and 3 will not be counted as new absences.
15 AJ

224 Personnel Statistics and Sickness-Absence Statistics

APPENDIX E
PROVISIONAL LIST OF BROAD DIAGNOSTIC GROUPS FOR ANALYSIS OF SICKNESS ABSENCE
Number of group
1 2
3 4
5
6 7 8
9
10 11
12
13 14
15 16 17
18 19 20
21
Tuberculosis Infective and parasitic diseases
Neoplasms Functional nervous disorders
1, 2 5-11
Organic nervous disorders
Diseases of the eye Diseases of the ear Diseases of the circulatory system
Colds and influenza
Bronchitis Other respiratory diseases
Diseases stomach and
Hernia of abdominal cavity Other diseases of the digestive system
37 36
Diseases of women Diseases of the skin Diseases of bones and organs of movement
Accidents on duty Accidents off duty Miscellaneous (defined diseases and symptoms)
Miscellaneous (ill-defined or unknown causes)
Short description
International statistical classifi- cation (3-figure code number)
OO1-019 036-138
140-239 300-318
790 330-369
780 370-389 390-398 400-468
782 470
472, 473, 510 480-483 500-502 490-493 763
471, 474, 475. 511-527
783 540-545
784 560, 561 550-553 530-539 570-587 764, 785
690-716 650-689
720-749 787
(N) 800-999 (N) 800-999
020-035 240-299 320-326 590-617 750-762 765-776 781,786 788,789 791-794
000 795
‘C’ list of cause groups
12, I3 19
49* 20, 49*
49* 21 22
23-27 49* 28 29 30 32 31
33, 34 49* 35 49*
38-40
42 b, 43 44, 45 46, 47 49* 50 50 3, 4
14-18,49’ 49*
41, 22, 49* 48
49*
No certificate 49*
* Selected from the Miscellaneous ‘C’ Cause group, C 49. † Cause group C 50 covers accidents classified according to external causes, but for
purposes of analysis of sickness-absence statistics, it is more important for the accidents to be classified according to their nature, i.e. the N classification of the International Statistical Classification.
† 795 is the code for illegible certificates or certificates showing ‘under my care’, or ‘in hospital‘, etc.
15-2
duodenum
226 Personnel Statistics and Sickness-Absence Statistics
REFERENCES
Registrar General’s Quarterly Return for England and Wales—Births, Deaths and Marriages, Infectious Diseases, Weather, Survey of Sickness. (Population Esti- mates No, 393, first quarter 1947 and thereafter.) (H.M.S.O.)
Medical Research Council. Industrial Health Research Board Report No. 85. The Recording of Sickness Absence in Industry. ([1944] H.M.S.O. 46-2-85.)
WATSON, SIR ALFRED W. An account of an investigation of the Sickness and Mortality Experience of the I.O.0.F Manchester Unity during the five years, 1893-1897.
Department of Health for Scotland. Seventh Report on Imupacitutitig Sickness in the insured population of Scotland, 1 July 1936 to 30 June 1937. ([1939] H.M.S.O. 88-1504-0-37.)
WATSON, SIR ALFRED W. The Analysis of a Sickness Experience. ( J.I.A. LXXX, 12.) BROWN, HENRY. A note on the Registrar-General’s Reports on occupational mortality
in England and Wales in connection with recent censuses. ( J.I.A. LXXI, 101.) World Health Organization. Geneva. Manual of the International Statistical Classifica-
tion of Diseases, Injuries and Causes of Death. Vol. 1: 3-Figure code; Vol. 11: Alphabetical index. (Sixth revision [1948]. Published in Great Britain in 1949 by H.M.S.O. 70-133-0-49.)
Medical Research Council. Industrial Health Research Board Report, no. 75. Sickness Absence and Labour Wastage. Part I by May Smith and Margaret A. Leiper. Part II by Major Greenwood and May Smith ([1936] H.M.S.O.)
International Labour Office. Statistical Methods for Measuring Occupational Morbidity and Mortality. [193o]

Personnel Statistics and Sickness-Absence Statistics 227
ABSTRACT OF THE DISCUSSION
Mr F. J. Lloyd, in introducing the paper, said that it had been deliberately restricted to a discussion of principles and methods. One important aim in statistical work was to facilitate the valid comparison of one group with another, or of one industry with another, and, unless statistical investigators used methods which permitted valid comparisons to be made, much of the value of the work was lost.
Over the previous two decades, a number of papers had been published on the subject under discussion, but the authors had refrained from mentioning them indi- vidually, excellent though some of them were, because they dealt with particular problems, and the methods of analysis used were so various that valid comparison of the results one with another was very difficult, if not impossible. For example, none of the papers dealing with sickness absence appeared to mention the period for which sick employees were retained on the strength, though that factor obviously had a very powerful influence on the amount of sickness absence which was recorded.
Deliberately, also, the authors had not attempted to include a complete bibliography. The list of references which appeared at the end of the paper was restricted to those actually mentioned in the text.
Mr G. A. Hosting, in opening the discussion, congratulated the authors on having brought before the Institute such a human paper. For himself, he found it much more interesting to read about bus conductors and bus drivers than to study members of the Manchester Unity Friendly Society who lived long before he was born. London Trans- port should be thanked for permitting publication of the details in the paper—for from an actuarial point of view he felt it was a very useful paper indeed, and the profession was grateful.
When reading the paper he had found himself looking at the subject from an employer’s point of view. From that point of view, it seemed to fall naturally into two parts—the sickness investigation and the labour-wastage investigation. The sickness investigation must have involved a great deal of work. According to the paper, 100,000 cards were punched each year or were reproduced from those at the end of the previous year. In addition, a card was punched for each period of sickness; so approximately a quarter of a million cards might be involved each year. All those cards had to be punched, sorted and filed, and no doubt they went through a number of other processes. With so much handling of cards the cost would be high. Then there were the forms used at the garages. The authors said that not a great deal of extra work was involved there and that they had made use, as far as possible, of forms which were already in existence.
What justification was there from the employer’s point of view for all that work? He hoped that the authors, in reply, would say something about that aspect. There were, of course, certain obvious uses. The statistics provided some check on working conditions, and it might be possible to reduce to some extent, by means of certain precautions, troubles which were indicated by the statistical results. No doubt, too, it was useful in workmen’s compensation claims to have a full record of sickness of the individual concerned. The sickness records might also affect employment policy. They might indicate, for instance, which jobs were more suited to young men and which to older men. If other organizations of comparable size had made similar investigations, it would be useful if the figures could be brought together for comparison.
The information about labour wastage was more useful to the employer, because labour wastage was more within control and might therefore be regarded as more worthy of examination. In current conditions, employment policy—at least in the employment of unskilled or semi-skilled labour—was of necessity a rather haphazard affair. But even so, it was important that the type of employee who was likely to leave should be put on the type of work where it cost least to train him. In times when there was no such full employment, however, investigations such as those described in the paper could have a very definite effect on employment policy.

228 Personnel Statistics and Sickness-Absence Statistics
The cost of labour turn-over in industry could be measured in terms either of cash or of social effects. A number of investigations into the cash cost of labour turn-over had been made. He had studied a few of those investigations, and they struck him as being rather unsatisfactory. But cost there was! First of all, there was loss of output. He wondered how much output was lost by the intending leaver between the time he decided to leave and the time he actually left. He suspected that quite a lot was lost, but it could hardly be measured. Also, what was the loss of output while there was an actual vacancy—when one employee had left and the man or woman who was filling the vacancy had not started? In one investigation it had been estimated that, but for such vacancies, output would have been 3% higher.
Then there was the time lost as a result of the arrival of a new employee. It depended on the type of work on which the new employee was engaged but, again in the investiga- tion to which he had referred, it was estimated that it took twenty days to train a new employee. It was assumed—probably somewhat arbitrarily—that on his first day the new employee spent 5% of his time usefully, on the second day 10%, on the third day
15%, and so on. On that basis it was estimated that production would have been 4% higher, had that time not been lost. There was a further loss of production because experienced employees had to train new ones; but, in the same investigation, the amount of time lost for that reason was not recorded.
In addition to output lost, it might be necessary to consider wastage of materials. New employees spoilt a good deal of material in the process of learning, and some of it might pass through damaged; at a later stage the time of experienced employees was lost because work was rejected on account of the damaged material.
Then there was the extra work which inevitably arose in the staff department—the work of preparing advertisements for the new employee; the cost of the advertisements; the time taken in interviewing the new employee; and the time spent subsequently in introducing him to his place of work. There was the extra work in the wages and the records departments—of closing down the wages sheets and records of one employee and issuing the P.A.Y.E. forms on leaving; and the extra work of starting up the records for the new employee. Then there were medical and welfare services to be considered, because it had been shown beyond doubt that the accident rate amongst new employees was higher than amongst experienced employees. In one case—not the one he had just mentioned—the investigation had gone so far as to include the whole cost of the pensions scheme as a cost to be charged against labour turn-over. That was, he thought, going too far.
In the original example he had quoted it was concluded that the gross profit of the company would have been 12½% higher had there been no labour turn-over. It was also estimated that each leaver cost £24. In another example in a different industry, the cost was as high as £58. Those two figures, though of somewhat doubtful value in themselves, did at least indicate that the cost of labour turn-over was very high indeed.
In an investigation into industries employing eight million people, it was shown that a quarter of a million changed their jobs every month. That represented a turn-over of 37½% per annum
Apart from the cash cost of labour turn-over, what were the social effects? Was it good for a man or woman to become a rolling stone? Was it possible for a man or woman to acquire an interest in his or her job if there were continual change? What was the total effect on human happiness? He did not think it could be suggested to the authors of the paper that they should try to measure such items statistically, but they were items to be taken into consideration, and it might be part of the contribution of the actuarial profession to industry that human happiness might be increased by such investigations as they were able to make.
The two main causes of labour turn-over were redundancy and resignation. Others which had been recorded were dismissal, health, death, retirement and so on. As the authors had said, there was not much point in measuring redundancy statistically. Sudden shortages of material came along quite unexpectedly and caused a certain amount of labour to become redundant almost overnight. The employer had then to face the alternatives of reducing the factory to a four-day week, as was happening in

Personnel Statistics and Sickness-Absence Statistics 229
the motor industry, or of discharging a proportion of his employees. The decision, no doubt, would rest upon a number of factors, but among the most important would be whether the shortage was expected to be temporary or permanent.
Turning to the other important cause, resignation, investigation had shown that the two most important causes of resignation were personal betterment and dis- satisfaction with the job or the pay. Those were two causes which the employer could do something about. He could compare his working conditions with those of his competitors—his pay conditions, his pension scheme and, what was perhaps the most important of all, whether his employees were being properly trained. It had been shown that a properly trained employee was far more likely to stay because he acquired a greater interest in his job. Other causes of resignation which were investigated were domestic responsibilities, marriage and other factors.
As the authors had shown, such an investigation was difficult, and the results must be regarded with a certain amount of suspicion, because of the difficulty of finding out the cause of resignation. Frequently the employee was not prepared to disclose to the labour officer the cause of his or her resignation. It often involved the use of special interviewers, and even then the results might not be reliable. In one investigation he had looked at recently, the expression ‘stability rate’ had been used, meaning the proportion of employees who were still in the company’s service after one year. In that particular case, the stability rate was 70% for males and 55% for females, again an indication of the high current rate of turn-over.
Mr M. B. Knowles had no doubt that those actuaries who, like the authors of the paper and the President himself, had widened the scope of the profession by joining the administrative services of the large industrial organizations would be very interested in that section of the paper which dealt with personnel management. The less adven- turous ones, like himself, who had kept to the home pastures would be more interested in the section dealing with sickness absence, and he would offer a few comments on that aspect of the paper.
As he saw it, the authors and the administrators of other industrial organizations employing large staffs wished to investigate, and as far as possible to control, the incidence of what was often called involuntary absenteeism amongst their staffs. For that purpose they proposed to obtain experience subdivided by age, sex and so on, and presumably also, as far as possible, by cause and occupation, Their objective was therefore distinct from that of the friendly-society actuary, who was interested primarily in the direct financial consequences of sickness.
Reading between the lines, he fancied that the authors were hoping for some national yardstick of sickness absence against which industrial organizations could measure their own sickness-absence results.
In paragraph 44, the authors mentioned the Social Survey of sickness. Whatever value the Survey might have from the point of view of the sociologist, it could not, in his opinion, be too strongly stressed that the Survey was of little use, and, indeed, might be most misleading, for purposes such as those under discussion. The authors had hinted at the various reasons which led to this conclusion. As he understood it, the Social Survey of sickness consisted of a carefully selected sample of what ordinary men and women were reported to recollect, after an interval of up to three months, of any real or imaginary aches and pains they might have suffered in that period—whether or not involving absence from work or, indeed, any incapacity whatever. To his mind, the results of such a survey, whatever its technical excellence, offered no substitute for adequate national statistics of sickness absence, and it would be dangerous to attempt to use the results for such a purpose.
The authors also mentioned the Manchester Unity experience. It was amazing that that gallant old war-horse, well over half a century old, was still dragged out of the stable whenever difficulties arose. What a tribute to Watson’s masterly work! But Watson would have been the last to claim that it should be set up as a standard of sickness absence under current conditions.
The authors proposed the abandonment of ‘linking-up’, and to that extent the

230 Personnel Statistics and Sickness-Absence Statistics
Manchester Unity experience, as published, was vitiated. Yet even there Watson was so thorough that he provided (J.I.A. xxxv, 268) an analysis showing the effect on the Manchester Unity sickness rates of the omission of any linking-up period.
Where, then, was a yardstick to be found? The authors clearly thought it might be obtained from the statistics of the working of the new and comprehensive national insurance scheme, covering over twenty million persons insured for sickness benefit. The presence of several senior officials of the Ministry of National Insurance gave actuaries the opportunity to say what statistics should be made available. He felt sure that members of the Institute would realize the difficulties under which the Ministry were operating, but he also felt sure that the officials of the Ministry, in collaboration with the Government Actuary, would do whatever lay in their power to produce any statistics that could be shown to be necessary. The fact that the Ministry was limited to essentials made it all the more important that actuaries should explain just what was essential and why. The good old days were past when informative statistics could be poured out just in case they might be of use to somebody. The members of the Govern- ment Actuary’s Department were naturally in close touch with the Ministry, but they would welcome suggestions and support from outside the service.
He had been interested in the description of the way in which the sickness-absence file was compiled. Would the authors say what checks were applied and what standard of accuracy was obtained in the weekly returns? His colleagues from the Ministry of National Insurance would also be interested in that, because they had a similar problem in gathering their information from about a thousand local offices.
Mr E. Jones said that many of the problems referred to in the paper were very similar to those met with in the Admiralty in dealing with statistics of naval personnel and of civilian personnel serving the Navy, although inevitably there were many differences.
Like London Transport, the Admiralty found it essential to have a central punched- card index covering all personnel, and he strongly supported the four basic principles for running such a card index which the authors had given in paragraph 11. If the Central Record was to be as accurate as possible, it was essential that the system for reporting changes should be comprehensive, accurate and speedy, but in a very large and complicated organization that was not always easy to achieve. Where it was possible to ensure that changes were reported via the pay system, as appeared to be the procedure in London Transport, the maximum degree of accuracy might be expected. He was interested to see that London Transport nevertheless found it essential—or at least advisable—to check their files once every two years. In the Admiralty it was evident that such problems were particularly difficult, because naval personnel were scattered all over the world in small and large groups, and the members were being drafted from one job to another at relatively frequent intervals.
As the authors had indicated, in the analysis of past experience of wastage and movements of various kinds—promotions, transfers and so forth—regard had to be paid not only to the usual statistical considerations, but also to the effects of any changes of policy which might have occurred. For example, an increase in rates of pay might have resulted in quite obvious reductions in rates of resignation while also contributing in a more subtle way to a reduction in promotion rates.
At the Admiralty it was necessary to devote much time to forecasting strengths at future dates allowing for engagements due to expire, for the proportions likely to re- engage, for wastage of various kinds, and so forth, and it was most essential to have an inside knowledge of all policy developments. For example, in the Navy, as possibly also in London Transport, there were certain categories which required several years of training. The problem might be to estimate what intake for training was required in the next year or two in order to build up the strength of the type of personnel concerned to the level wanted in, say, five or six years time. If plans were afoot to alter the standard required of the trainees so that a smaller proportion would be likely to qualify it was obviously no good working blindly on past experience.
For reasons of that sort, it should be stressed—and it could not be stressed too strongly—that the staff responsible for analysing and applying personnel statistics

Personnel Statistics and Sickness-Absence Statistics 231
should form part of the department in which the personnel policy was decided and should certainly not be working in isolation like a group of ‘backroom’ scientists.
There was one omission from the paper which he personally regretted: he had hoped that there would be a section on career planning. After all, people were highly interested in career prospects in the firm in which they were working, and a poor career prospect was probably one of the biggest inducements to leave. The subject of career planning was one of considerable theoretical interest, and it did seem to be quite important in practice. It certainly was so in the Navy.
In most organizations the numbers employed at the different grade levels were determined entirely—or almost entirely—by the needs of the work. But fixing the numbers at each such level meant, in effect, that the promotion prospects of both present staff and future entrants would also be fixed. For example, it was obvious that a branch of the Navy in which there were 20% of Chief Petty Officers offered far better promotion prospects to the new seaman recruit than one in which the proportion of such posts was only, say, 10% of the whole. By making suitable assumptions regarding entry ages and wastage rates and working on the basis of a stationary population, it was possible to examine the effects of alternative grade structures on career prospects by calculating the differences between the ages of promotion from one grade to another under the two plans; or, alternatively, if the promotion ages were kept constant, the effects of the alternative distributions of posts on the proportions who could be pro- moted from one grade to the next could be determined. Although the assumption of stationary conditions was never realistic, it was a useful technique, and he believed it could be extended to non-stationary conditions.
One reason why career planning was particularly important in naval personnel work was the variety of engagements on which a naval rating could be serving. One man might join for seven years, and another for twelve years with the option of signing on for ten years more, Variations in the proportions in which the 7-year and 12-year men were recruited, and in the proportions of 12-year men who re-engaged, could materially affect promotion prospects.
There were two aspects of the punched-card system that he wished to mention. First, he was somewhat puzzled by the need to produce a duplicate file at the end of
each year, and more so by the reference to the difficulty of making statistical analyses on a changing file. There were, of course, ways by which the punching of changes could be proceeding continuously, the file itself only being amended for such changes at, say, monthly or quarterly intervals by mechanical methods. There was a larger file of cards at the Admiralty, but it was possible to amend it at monthly intervals. The index was available for statistical analysis for all but a few days at the end of each month.
Secondly, it would be interesting from the point of view of the cost of running such installations to know how many machines and what types of machines the London Transport authorities found necessary for personnel-statistics work.
The comments on the 3-figure International Code of sickness had been helpful to officials of the Admiralty, because they had been considering whether they should employ that code or something simpler.
The authors’ comments made it clear that it was useless to adopt a coding system capable of recording more detail than could in practice be expected in doctors’ certificates.
Mr B. Benjamin welcomed the paper for two main reasons. First, it would be recalled that London Transport Executive and its predecessor the London Passenger Transport Board had for some time engaged actuaries to concern themselves with matters other than pension fund administrations, and the paper would surely encourage them to continue that policy. Secondly, it demonstrated that, in a large-scale industrial or utility undertaking where multiplicity of grades of staff, geographical dispersal of personnel and minor irritations like rotating rest-days rendered the production of staff and sickness statistics a complex problem, the problem could be reduced to simple terms by careful analysis—the type of analysis which lay at the root of all efficient organization. To actuaries, as the authors would doubtless agree, the paper preached
232 Personnel Statistics and Sickness-Absence Statistics
to the converted, at least in methodology if not in purpose. There were, however, many industrial executives who desired sickness and personnel statistics but who shrank from what appeared to be too formidable an undertaking. The authors might hope, he thought, to have allayed that fear.
The phrase ‘too formidable’, however, was sometimes used to mean ‘too expensive’, and like the previous speaker he thought it was a pity that the authors made no mention of costs, which were important, because few things were so essential as to be obtained regardless of expense. Were punched cards really necessary? Many employers would say that colds and coughs and sneezes covered the majority of absences, and the subdivision of the remainder by cause in very broad groups might be effected by manually compiled schedules. Such a method was, in fact, adopted in one large firm of multiple branch stores; but an over-simplified method permitted scant regard only to be paid to age or duration of service. A great deal depended on the amount of detail that was required and that, in turn, upon the purpose for which it was required. The authors said of a large organization that ‘in the interests of the physical health and general well-being of its staff, it must pursue an active policy in relation to working conditions in the broadest sense’. The statement reached parliamentary standards of vagueness far removed from the very clear objectives which were associated with Dr Norman, and he would have liked more detail than was given in paragraph 4.
It was necessary to distinguish between what the authors referred to as ‘routine requirements of management’ for which simple clerical methods sufficed, and the operation of an industrial medical service, that was to say, an attempt to isolate and measure occupational health hazards and to adjust working conditions so as to mitigate if not to eliminate them, for which purposes more complicated methods were essential. For the separation of occupational hazards from the manifold hazards of social life in- volved a ‘controlled’ investigation, that was to say, the incidence of a particular disease had to be compared as between two groups of different occupational environment but otherwise exactly similar in constitution—in age, sex, duration of service, hours of work, social status, and so on. Viewed in this light, the Central Record of Staff Statistics was an eminently justifiable overhead.
A little more might have been said about paragraph 12. Valuable material had too often been wasted or insufficiently exploited because of failure to express it in simple language.
Passing to the consideration of sickness, he disagreed with the authors on para- graph 50. A calendar year seemed too long a period for adequate assistance to be given to industrial medicine. A great deal of harm could accumulate in a year. Quarterly rates seemed to be preferable. Seasonal swing was well appreciated and easily measured, and comparisons in time were far less frequent or productive than comparisons between grades of staffs in the same period. Where time comparisons were necessary they could be carried out by comparisons of quarters of corresponding seasons.
He was also bothered by paragraphs 51-60. The National Health Service Act and the National Insurance Acts of 1946 had so altered the economic impact of sickness that comparison with earlier statistics was vitiated, and he—like Mr Knowles—could see no reason for harking back to the Manchester Unity experience. He thought it was wrong that any attempt should have been made to produce a priori reasons for the recommendations of paragraph 60. With sickness absences recorded on punched cards, what was more easy than to take out an actual distribution and to judge from that the most meaningful grouping? In J.I.A. LXXV there were two important papers on the distribution of sickness, one by Coward and the other by Beard and Perks. Both pointed to the need for data of the variance of sickness absences. Beard and Perks dealt with the distribution of ‘the proportion of those claiming who are sick for exactly duration t in the risk period’. He wished the authors had touched on that function, which he thought was more fundamental than (la)x, and he still hoped that they would shortly provide some data.
He was a little hesitant about paragraph 69. There was often a great deal of difference between the exact nature of a patient’s disease and the words written on a medical certificate. He implied no criticism of medical practitioners but only an acquaintance

Personnel Statistics and Sickness-Absence Statistics 233
with their difficulties. Correction applied only to absences exceeding a defined period might produce distortion in the classification of disease. Dyspepsia of three weeks’ duration would come within group 12, but if of longer duration and on review attributed to constipation it would go to group 14.
With regard to disease classification, the admittedly provisional grouping of Appendix E was too broad for general use. Tuberculosis should be separated into respiratory and non-respiratory. Standards of diagnosis appeared to differ for the two types, and they also probably differed in their epidemiology. He preferred to see intestinal infections separated, especially where canteens might be involved. It seemed somewhat confusing to find cerebral vascular lesions (diseases of degeneration) combined in group 5 with inflammatory diseases arising from infection and affecting young as much as if not more than old persons. Influenza and pneumonia might be separated. He was well aware that during an influenza epidemic certificates which would normally state ‘coryza’ were liable to be changed to ‘influenza’, but nevertheless they would appear to be important groups in themselves.
Group 15 ought at least to be split to show diseases of pregnancy, childbirth and puerperium separately from other diseases of women, since the ‘exposed to risk’ was clearly different. The problem, like that of absence duration, was best solved experi- mentally by taking out actual distributions—doubtless the way in which the London Transport Executive, with their flexible system, would solve it. They were doing invaluable pioneer work and deserved every encouragement.
Sir Geoffrey King, K.B.E., C.B., M.C. (Deputy Secretary of the Ministry of National Insurance, a visitor), referring to the statistics collected by the Ministry, said that they served two main purposes. First of all, they provided the Government Actuary with the information he needed to enable him to advise the Ministry on the actuarial and financial aspects of the scheme. Since the Government Actuary and most of his staff were present, he would say no more about that.
The other purpose was to get information of a statistical kind, particularly about sickness absence. A question which was often put to the Ministry was: have the new rates of benefit increased sickness absence? With one or two gentlemen who were present that evening, he had sat on a committee which had considered that question, and it had been extremely difficult to get any real guidance from the kind of sickness statistics that industry provided. Almost any bout of sickness would include a period when the man was definitely ill and not fit for work. About that part of sickness absence, neither employer nor anybody else could do very much, unless doctors could produce a genuine cure or, better still, a preventive for things such as the common cold. But almost every period of sickness absence also had another element in it, and that was the period extending beyond the date when the man would first be certified as fit to go back to work, were the doctor at hand. He was not talking about malingering, or anything of that kind. But there was undoubtedly room for more investigation of what he would call the marginal period of absence, because in common experience there were the type of man who got back as soon as he could, and the type of man who said, ‘Well, this is Thursday; let’s go back next Monday’. The doctor’s certificate covered the period, and it simply went down as sickness absence. As far as he could see, it was only in relation to that marginal period that payment of benefit might operate to induce people to stay away, or added wages or bonus schemes get them back more quickly. Unless it was possible by some statistical method to provide information of that kind (and he knew it was difficult), he felt that, while basic statistics about absences grouped in certain broad descriptions of disease were part of the essential stock-in- trade, a great deal had to be done before any important contribution could be made towards the measurement of what was really voluntary absence, masquerading as involuntary. That was one of the things at which the investigation to which he had referred was aimed—but without much success.
He did not want his remarks to be taken as a criticism of the paper, which he had read with the greatest interest. Rather, he would encourage the authors to go still further with an even more detailed analysis of the problem confronting them.

234 Personnel Statistics and Sickness- Absence Statistics
Dr L. G. Norman (Chief Medical Officer of the London Transport Executive, a visitor), referring first to Mr Benjamin’s remarks, emphasized the need for accuracy in the figures produced. That was why the authors had built an excellent system to provide accurate figures.
To give an example of the interpretation of the figures, a colleague of his, visiting some factories in Holland a year or two earlier, had asked about sickness absence and had been told that it was 5%—‘an absolute disgrace’. He had crossed the border into Belgium, where at another factory he had been told that sickness absence did not amount to very much, ‘only about 5%‘. The stage had been passed when one gross figure was sufficient. Something more was needed; a problem like‘ 5% sickness absence’ could not be tackled till more was known about the distribution and the causes of the sickness absence.
The first speaker had mentioned a figure of 12½% of production lost from wastage. That might be so in some instances. But throughout the country there was also an enormous loss of production through sickness and accidents—approximately 5% over-all. It amounted to a huge quantity of man-power, a problem which had to be tackled. In order to tackle it, accurate returns of sickness, its causes and its distribution were essential. There were no up to date British statistics of age-standardized sickness absence. Furthermore, it was a big task to split the figures by diagnosis, needing a very high degree of accuracy.
The diagnoses on certificates were reasonably accurate, provided no meticulous analysis was attempted. For instance, if lumbago and backache were called the same illness, the results would be pretty accurate, but the certified diagnoses were not sufficiently accurate to separate such conditions.
However, an accurate yardstick was necessary, and it was most important that all who worked in the field under discussion should have not only a national standard but also a means of comparison between different industries, so that the influence of environ- mental working conditions on sickness absence might be studied.
The influence of environmental conditions was considerable, and Sir Geoffrey King had not referred to the extensive preventive measures which could be taken against certain illnesses when the underlying causes were known. A good deal could be done, for example, to delay the onset of common illnesses such as bronchitis, the difficulties being largely administrative.
The ‘marginal’ period to which Sir Geoffrey King had referred was, of course, one of convalescence; it might be that because convalescent homes were left out of the National Health Service they did not attract so much attention. There was a ‘no man’s land’ after recovery from an illness when a man realized that he was fit to go back to work, yet not completely recovered. That ‘no man’s land’ between complete health on the one hand and absence of illness on the other was extensive and not much was known about it: it was hard to measure. It was important, because it might mean that a man with a family went back to work too soon, worked for a time, and then broke down again. The period before complete recovery, of convalescence for some days after first getting out of bed from an illness, was most important in getting a man completely fit and back to work without undue risk of further breakdown.
Dr C. G. Roberts (Principal Medical Officer to the Post Office, a visitor) said that the Post Office had, for a very long period of years, kept accurate though admittedly crude statistics of sickness absence and of retirement. They were available to him over a period of fifty years. During that period the conditions of employment in the Post Office had been remarkably stable with regard to sickness-absence payments, conditions of retirement, and so on.
It appeared from those statistics that over the years morbidity had increased rather than decreased, taking together sickness absence and retirement on grounds of ill- health. Members of the Institute would know better than anyone that during that same period there had been a marked increase in the expectation of life. It seemed, therefore, that advances in medicine over the period of fifty years had been in the direction of keeping people alive much longer, but it was doubtful whether similar success had been achieved in keeping people fit and able to work.

Personnel Statistics and Sickness-Absence Statistics 235
A measurement of the extent to which that had been done could be obtained only through accurate morbidity statistics, and he ventured to say that morbidity statistics were at about the stage vital statistics had reached a hundred years earlier. But he believed, as a fairly keen amateur who had read some of the literature in that field, that one of the best and deepest contributions so far was to be found in the paper under discussion. London Transport were to be congratulated on the encouragement which they had given to the work, and the foresight which they had shown in being—he believed—one of the first large employers to employ actuaries for the personnel statistics. It was an example to many.
Dr D. D. Reid (Reader in Epidemiology and Vital Statistics at the London School of Hygiene and Tropical Medicine, a visitor) had found the paper extremely efficient and stimulating. As the President had remarked in his Presidential Address, actuaries did not hold the sole patentee rights of the concept of ‘exposure to risk’—medical sta- tisticians had shown some interest in it. He doubted whether in epidemiology, where broad trends only could be considered, the elaborate calculations described in the paper were strictly necessary, but everyone would, he thought, agree that it was better to err on the side of being meticulous in the calculation of exposure to risk. That was some- thing which most doctors in industry could learn from actuaries.
In his introductory remarks Mr Lloyd had done less than justice to the work of Gafafer of the United States Public Health Service, who had produced a series of papers, among them one dealing with the use of the median in the measurement of duration of absence, an approach which took into account the fact that there was a cut- off after, say, six months’ absence.
As the opener had remarked, the clerical and hence the financial burden which the collection of mass statistics placed on an organization could be considerable. The problem of sampling had not yet been studied sufficiently closely in this field It had been tried tentatively in the Post Office with some success. In epidemiological work, broad trends could be appreciated without recourse to the meticulous accuracy which might be required from the point of view of pensions and sickness claims. The difficulty was that when, in a sample survey, the data were analysed by age, sex, length of service, and diagnosis, the resultant groups were so small as to be not particularly informative. But for the exhibition of broad trends a sample survey had a great deal to be said for it.
Of particular medical interest was the reference to the comparisons of the sickness- absence experience of men with different physical disabilities. The technique of linking the records for the same individual over a period of time was of some medical importance, and those who were interested in medical statistics would value the skilled opinion of the authors upon it.
Finally, a word of encouragement should be given to the authors lest they felt weary in their labours. In the study of the epidemiology of the common cold, comparisons were being made between the experience of common colds of people in different types of jobs—jobs having different degrees of contact with the public. It would be interesting to hear what was the experience of the common cold among conductors, who had a large, intimate and varied relationship with the public, compared with drivers in the same organizations,
Mr J. F. Bunford took up the question put by Sir Geoffrey King. Before attempting to estimate the effect of sickness rates of benefit on sickness experience, some knowledge was needed about the ‘no man’s land’—the marginal period to which Sir Geoffrey had referred. On the other hand, how was the mere collector of statistics to tell at what point the real sickness—to put it in that way-finished and the ‘no man’s land’ was entered upon? He understood from Sir Geoffrey’s definition that the whole of the period until a man went back to work was, in fact, covered by a certificate. But any statistics could only be based on information obtained medically, and he was rather at a loss, therefore, to understand how, without the doctor’s help, the answer could be found.

236 Personnel Statistics and Sickness-Absence Statistics
Mr N. C. Turner, in closing the discussion, said that the paper had its real emphasis and value in considerations outside the normal range of the professional discussions of the Institute. It had been a pleasure to him to see how well it had been received by all the previous speakers. There was evidence of the interest of the medical profession in their contributions to the discussion, and in the authors’ acknowledgements at the end of the paper. There could surely be no doubt of the interest of the even wider world of commerce and industry, since the paper was concerned with methods of scientific study of a problem which confronted every large business organization in the country.
The paper rightly, in his view, made little reference to the form of cure. The industrialist was primarily interested in the cure, but that was necessarily dependent on the precise circumstances of the individual case. What the authors had done was to provide, first, a method of diagnosis which was actuarially and therefore statistically sound, and which could provide a means for comparison of the results of different investigations. Secondly, the authors had provided for the skilled interpretation of their diagnosis and its explanation to the management. They referred to that in paragraph 12. The need, as in all statistical work, for skilled and unambiguous interpretation of results could not be over-estimated.
He had expected that someone, in the course of the discussion, would say that from the actuarial point of view the paper was elementary. Of course it was elementary, but anyone who felt that that was a valid criticism had, to his mind, entirely missed the fundamental point, which was that a limited use of pure actuarial technique could produce results of great value to medicine and to industry. The authors had, in fact, explained one way in which the actuarial profession could be of service to industry. He had no doubt whatsoever that they had every justification for making that claim, but they ought to ask themselves whether the claim was acceptable to and would be acceptable by industry.
It was assumed in the very first sentence of the paper that there would be automatic agreement with the principle of the use of statistics for managerial purposes. Whilst he agreed that enlightened management was making increasing use of statistical measure- ment of performance and statistical presentation of fact, he felt chat there should be placed on record in the discussion something more of the reasons which made that practice desirable. He believed that, in any business organization of more than modest size, the presentation of information in the form of statistics could provide for manage- ment the most satisfactory and complete picture of the functioning of the organization. Since management should always aim at improving its methods, it had to turn to statistical presentation for help in that improvement.
The next question was whether personnel statistics should form part of that new picture which was being provided for management. It was probable that no industrialist would question the need for some form of personnel statistics, even though his statistics were merely simple enumerations of staff. In deciding whether he needed more detailed personnel statistics, he should consider whether he wished to adopt what the authors had described as an ‘active policy’ in relation to working conditions. Surely no responsible industrialist could overlook the possibility of being able to reduce sickness absence (as distinct from true sickness) and the inevitable cost of finding and training staff replacements made necessary by an unduly high labour turn-over.
In considering the subject along such lines, both actuary and industrialist ought to consider how far the results were reliable. What size of organization was sufficient to provide an adequate statistical basis for the methods of investigation explained by the authors? Following the method of Coward’s paper, The distribution of sickness (J.I.A. LXXV, 12), it could be said in round figures that an exposure of 750 life years was needed if the standard deviation was not to exceed about 10% of the expected sickness rate for the first six months. An exposure of 3000 life years would be required to reduce the 10% to 5%. That suggested that detailed investigation of sickness-absence rates was out of place in the majority of the industrial organizations of the country. The Ministry of Labour Gazette for June 1950 contained an analysis of industrial establish- ments according to number of employees. Out of a total of 55,129 establishments, 75% employed less than 100 employees each. A further 15% employed between 100

Personnel Statistics and Sickness-Absence Statistics 237
and 250. Obviously the smaller number of larger organizations had between them a relatively larger proportion of the total employed population. There were 943 separate establishments with more than 1000 employees each and with a total of almost three million. That seemed to be an adequate field for investigation.
The authors had given a detailed explanation of the methods which they used to build up and maintain their main card file and their records of sickness absence. It should not be forgotten, however, that the system was constructed to fit into an existing organization. It did not follow that those precise methods would necessarily be applic- able in other organizations. It was possible that the main file might be some other form of punched-card record already in existence. For example, if punched cards were used for the central preparation of pay rolls, those same cards might also be used for the main card file.
Some people might have been surprised that no figures of results had been quoted by the authors, He for one was delighted that they had not quoted figures. He felt that it would have been a mistake to invite comparisons between the results of the authors’ investigations and the rates of some standard table. Such a comparison would have been misleading, since it would have been between two things which were fundamentally different—sickness absence and true sickness. The former was inevitably affected by the practice of an employer with regard to payment of wages during sickness and to the retention on his books of employees absent for reputed sickness for whom no payment was being made. The latter feature was not present in the standard table. For the same reason he questioned whether it was advisable to compare the observed rates of different industrial organizations. He was convinced that comparatively small differences in the practice of employers in dealing with sick employees could appreciably distort the comparative results.
He further questioned whether the use of the ‘first six months’ sickness rate was generally suitable. It was not unusual for an employer’s treatment of a sick employee to be influenced by the employee’s length of service, even to the extent of giving different treatment as between employees of, say, ten and twenty years’ service. The only adequate solution in such a case seemed to be the investigation of sickness-absence rates within successive short periods of sickness. The resultant dispersal of data might make the results meaningless, except in very large organizations.
As had been mentioned in the discussion, the twin subjects of sickness absence and of wastage statistics had been the subject of inquiry on a number of occasions by other professional bodies. There had been a London Regional Conference of the Institute of Cost and Works Accountants in December 1950 which had discussed the financial effects. There were various reports published by the Industrial Health Research Board. One was referred to at the end of the paper, and others had been mentioned in the discussion. There was also a recent publication of the British Institute of Management, which was sponsored by the Board of Trade and the Ministry of Labour, and which set out what was claimed to be a standard method of investigation of labour turnover rates. In his view, the method was so very elementary that it could conceivably produce misleading results.
In looking at the various inquiries and publications, he was struck chiefly by the differences and inconsistencies between the various methods adopted. For example, one report measured working days’ absence counting 5½ days to the week; another measured calendar days; another excluded from both exposure and sickness all those who joined or left the organization within the period of observation, and so on. Many other examples could be quoted. It seemed clear that the agreement of a number of professional and other bodies was necessary if a true standard practice was to be developed.
The economic effect of high wastage and sickness-absence rates was the continuous concern of every employer of labour. The economic and human effects were studied by various organizations whose members were concerned with the management of labour, such as the Institute of Personnel Management. Sickness rates and the incidence of sickness were the concern of the medical profession. The loss of skill resulting from high wastage rates, the loss of working hours resulting from high sickness absence, and

238 Personnel Statistics and Sickness-Absence Statistics the cost of sickness benefits were all the concern of Government. The methods of statistical investigation into both wastage and sickness were peculiarly part of actuarial technique. Was it too much to hope that all interested bodies would collaborate to produce agreed methods of investigation which would be both statistically correct and properly informative, so paving the way for a reduction in the social and economic loss which was being suffered?
The President (Mr F. A. A. Menzler, C.B.E.), in proposing a vote of thanks to the authors, said it was all the more pleasant to do so not only because they were his colleagues at London Transport but also because their paper recorded the realization of what seemed almost impossible of achievement fifteen years previously when Mr Spratling and he first started on the long road. The authors had made an all too kind reference to himself in the last sentence of the paper. He would rather put it that Mr Spratling and he had worked together and sketched out the first draft of a scheme before the war. The authors were entitled to both the credit and the satisfaction of converting the dream into reality.
Mr Turner had referred to the fact that to actuaries the techniques were not very profound. The methods were, in fact,—and he said this for the benefit of their friends from outside the profession—just the ordinary day-to-day, bread-and-butter techniques by which actuaries had been earning their livings for several generations. The novelty was not in the methods but in their application to problems of personnel management in a great undertaking with a staff of a hundred thousand. How other undertakings of the same size and complexity did without such statistics was beyond him. In the current conditions of ‘full employment‘, waste of man-power had to be avoided, whether the waste were due to ill-health or to excessive labour turnover, with the consequent loss of time and money for training. Those who had urged that there was greater scope for the employment of actuarial methods and approaches in industry were on firm ground so far as personnel management was concerned, and that was, of course, only a beginning.
But although the methods might not be profound to the more academically minded actuaries, their application to a large heterogeneous staff such as that of London Transport required skilled judgment and experience in the handling of statistical data. After all, as had been said that evening, the value and reliability of the ultimate statistics depended fundamentally on the accurate collection of the basic data in the first instance, and in the case under discussion much skilful planning and adaptation had been required.
But the appreciation of methods originally devised in connexion with the finance of cash benefits on the occurrence of death or sickness was of even wider importance from the social point of view. In industry, there was the rapidly growing service known as industrial medicine. Dr Norman was President of a body known as the Association of In- dustrial Medical Officers, which had seven hundred members. That was indicative of the development of such work in industry. There was great scope for the close association of actuaries with medical men and with medical statisticians in that field, and he need hardly say that friendly collaboration already existed in London Transport. He agreed with Dr Reid, however, that actuaries were not the only ones who were entitled to use the ‘exposed to risk’ concept. He need only make a passing reference to the work of Professor Major Greenwood, since it had already been referred to. There was also Dr Bradford Hill with whom he had had the pleasure of working some twenty odd years earlier. Dr Hill had, of course, produced very important studies on industrial sickness in the printing industry, the cotton industry, and so on, all of which would satisfy the most exacting actuarial tests.
The wider implications for medical research were obvious. It had already been possible for London Transport to supply data to medical research workers under the Medical Research Council. It was, if he might say so, for the doctors, who would be supplied in increasing measure with scientific data from the machine, to afford guidance in the application of the results to welfare policy, and to indicate further directions in which statistical research would be profitable.

Personnel Statistics and Sickness-Absence Statistics 239
Mr F. H. Spratling, in reply, expressed thanks on behalf of the authors for the cordial reception given to the paper.
First of all, what was the purpose of the Central Record? It was to assist in administra- tion and to make for better administration. If administration was to be good, it had to be intelligent; and if it was to be intelligent, it had to be informed. He felt sure that Dr Norman would not quarrel with him when he said that administration included the constructive work of the industrial medical officer. If the officer was to tackle his job positively, he must know to what particular types of sickness (if any) workers in different occupations were particularly prone, at what stages in their lives, and so on.
It seemed to him, as he watched the results coming from the Central Record, in terms of population, wastage, and sickness-absence statistics, that little by little the scales had been dropping from his eyes, as it were. There was so much more in it than the crude numbers showed.
The cost was very small. Not a single extra clerk had had to be employed anywhere in London Transport to provide the data required by the Central Record. The annual cost of the small staff and the small machine installation directly employed on the Central Record was of the order of 0.01% of the total revenue of the undertaking. The individual passenger would travel some thousands of miles before he contributed as much as one penny to the cost of the Central Record.
The accuracy of the data depended largely on the methods used. The methods described in the paper had been evolved, as Mr Turner had said, in relation to the particular circumstances of London Transport, and it was obvious that they could not be applied without modification in other circumstances. But the principles, he felt sure, could be applied to other organizations with comparable results.
It was true that an independent check was placed on the Main File progressively over two years, but so far the Main File had proved to be rather more accurate than the control data. How long that would continue remained to be seen. Even so, the check was valuable for, however good a system, the human element and minor machine faults could never be completely eliminated. There were some fairly good controls on the records of sickness absence. The quality of the control varied from one section of the organization to another; but in certain sections— and they were important ones—it was part of the daily job of the local official to prepare a statement of account, showing how he had used the man-power at his disposal. One of the items in that statement of account was the number of man-days lost on the day in question because of sickness absence, and care was taken to see that the number of days’ sickness absence returned to the Central Record agreed with what was claimed in the other context, and that was a very good check indeed. In other sections, it was possible to check the Central Record returns against records of time worked, maintained for payment purposes, either as part of the normal routine or as a periodical spot-check according to circumstances.
Sir Geoffrey King had asked whether any effect had been noticed on the general level of sickness absence as a result of national insurance. So far as London Transport was concerned, the answer was no; the evidence available did not suggest that there had been any substantial effect. A small item of interest was that people seemed reluctant to return to work on the fourteenth day of sickness. That was, of course, in many cases the twelfth benefit day, which was worth four days’ sickness benefit under the State scheme, because on that day the first three waiting days ranked for benefit. Sir Geoffrey King also mentioned the amount of time lost to industry at the end of a period of absence because people did not return to work as quickly as perhaps they might. Dr Norman had referred to the ‘no man’s land’ of convalescence. Analysis of the length of sickness absence by duration of absence showed that after the first few days people tended to come back at weekly intervals of duration. For the longer durations of sickness, the week tended to spread out to a fortnight. It might be that some time was lost to industry in that way, but it was not for him to say how that could be pre- vented.
He was grateful to Dr Reid for his reference to the American work on the subject, because the authors did not know of it, and they would study it with great interest. The answer to Dr Reid’s question about the common cold among drivers and conductors
AJ 16

240 Personnel Statistics and Sickness-Absence Statistics
was that from the limited statistics so far available, one year seemed to differ from another rather more than conductors differed from drivers. A particular year for which the figures had been examined was not recognized currently as an epidemic year, but it did show a considerably higher incidence of colds and influenza than the previous year.
Dr Reid had asked how the punched cards could be used to give a longitudinal result, showing the medical history in terms of sickness absence of an individual over a period of time. In London Transport, the individual’s history was recorded longi- tudinally on his personal staff record and the punched-card system of the Central Record had not been designed to produce information of that type. Yet they had found it could be done effectively by taking, for successive years, the sickness-absence cards for the group in which the individual was employed and sorting them according to date of birth (which was punched into the sickness-absence card). The chance of another person in the same group having been born on the same day was very small but, if such cases existed, the cards for the individuals concerned could be quickly segregated by reference to interpretations on the card or (if the object was to study a number of cases) from a list, prepared on the tabulator, in order of date of birth.
Mr Benjamin had referred to Appendix E. He himself did not think it would ever be possible to get general agreement on the statistical grouping of disease in that way. But it could be said in defence of the admittedly provisional list that it was devised with particular reference to the requirements of industrial sickness absence. In the service of London Transport, at any rate, hardly any sickness absence was attributed on the medical certificates to the diseases of women included in Group 15 of Appendix E, so that no purpose would be served by subdivision. Similarly, in relation to tuberculosis, it was meaningless to subdivide perhaps half-a-dozen cases in a year. But that was not to say that that group should not be subdivided for other purposes. It could be readily understood that for public health purposes, for example, a different approach would be necessary.
He had been particularly interested in Mr Turner’s suggestion that all interested bodies should collaborate to produce agreed methods of investigation of personnel statistics and sickness-absence statistics. To be quite frank, one of the principal motives for preparation of the paper was the hope that it would stimulate, or at least encourage, progress towards agreement on some common basis which might be applied to the treatment of those problems. On the question of preparing separate sickness-absence statistics for what had been called, in shorthand, as it were, sickness absence of 4 to 182 days— (b) of paragraph 60 of the paper—he was unrepentant. The method seemed to work with London Transport. From what he had learnt of the practices of other employers, he though it would work with others. The authors considered that the figures for 4 to 182 days should be comparable with national insurance statistics for the first 6 months’ sickness, for they thought that there was little difference between what was regarded as industrial sickness absence at those durations and what would appear in the national insurance records as sickness of employed persons. If the authors were right in their opinion, the national insurance statistics would provide a yardstick of comparison.
He would conclude by quoting from Major Greenwood. It was a thought he had expressed several times in the course of his life, and it seemed particularly apt to the problem under consideration.
Making the best the enemy of the good is a sure way to hinder any statistical progress. The scientific purist, who will wait for medical statistics until they are nosologically exact, is no wiser than Horace’s rustic waiting for the river to flow away.
The following written communications have been received.
From Mr A. Blackwell (Chief Statistical Officer, Ministry of National Insurance): Several references are made in the paper to the Ministry of National Insurance,
and within the Ministry we are conscious that the information which can be derived

Personnel Statistics and Sickness-Absence Statistics 241
from the administration of the National Insurance Acts can be of use to other establish- ments, such as London Transport Executive, in giving them a norm for the working population as a whole with which they can compare their own experiences. The paper is welcomed on the grounds that it not only places on record the form in which the London Transport Executive are keeping their own statistics, but gives the Ministry a lead as to the form in which the Ministry’s statistics when published might prove most helpful to other users.
The paper, whilst breaking down durations at two points, namely, at the end of three days and at the end of six months, appears to contemplate working in terms of average duration. Owing to the wide variation in the shapes of the distribution curves of duration for different diseases, we at the Ministry of National Insurance have come to the conclusion that it is preferable to use the median as the measure of central tendency and (say) the inter-quartile range as a measure of dispersion. In addition, we hope to publish detailed distributions of duration for each of the fifty disease groups given in the C list of the International Classification recommended by the World Health Organization, though, as in the London Transport Executive, the individual absences are being coded by the 3-figure list. These distributions will, of course, show amongst other things the breaks required by the London Transport Executive, viz., at three days and at six months. Without going into detail about the method by which National Insurance statistics of sickness absence are obtained, I would remark that it will be convenient to publish information relating to ( a ) those cases terminating within a given calendar year and ( b ) those cases current at the end of the year. With these divisions, it should be possible for the London Transport Executive to derive the required information.
The paper gives a list of 21 diagnostic groups which are, in the main, combinations of C list cause groups of the International List, but I notice that group C49 has been split into about a dozen sub-groups, which have been added to other C cause groups. Government departments are under an international obligation to publish their results in such a form that the total content of any disease group is the same as one or other of the cause groups given in the International List. Whilst no-one would suggest that the present International List should be the last word on the subject of diagnostic classifica- tion, the only way in which any modifications are likely to be made is by actual users sorting their information in two ways, ( a ) in accordance with the International List, and ( b ) in accordance with any other groupings which it is thought would be more useful, and then presenting the information thus derived in two ways to the appropriate authorities. (It may be sufficient to do one— or both— of these sortings for a sample of the available information,) Until such time as any modifications are introduced into the official International List, the statistics of incapacity due to sickness which the Ministry will publish will be in accordance with the International List (in general the C list).
Accidents on duty will, in general, appear in the Ministry’s statistics as claims to injury benefit, though accidents off duty will appear in the statistics of sickness benefit, being coded according to the N classification of the International List.
I was interested to notice that the London Transport Executive has the opportunity of carrying out medical examination by its own medical officers, and that 80% of the diagnoses on the general practitioners’ certificates fall into the same broad diagnostic groups. Where the diagnosis differed there were three explanations, namely clerical errors arising in deciphering certificates; differences between the opinions of the general practitioner and the consultant; and cases where the general practitioner clearly did not wish to disclose the nature of the illness to his patient. I suppose the second cause will be with us for some considerable time, but I may say that provision is made in the National Insurance Scheme for the general practitioner who does not wish to disclose the nature of the illness to his patient to inform (confidentially of course) the medical department of the Ministry, and so there exists the means of making the appropriate corrections to our statistics. As regards clerical errors arising in deciphering certificates, the remedy lies mainly with the medical profession itself and we can only hope that in the course of time, as the value of the insurance certificates for research purposes becomes appreciated, this apparent cause of discrepancy will gradually be eliminated.
16-2

242 Personnel Statistics and Sickness-Absence Statistics Finally, I would express my personal thanks to the actuarial profession, especially
the Government Actuary and his staff and the authors of this paper, for the great help they have given in setting up the statistical department of the Ministry of National Insurance.
From Mr Spratling and Mr Lloyd: We are grateful to the Editors for the opportunity to add a few remarks to those
made in reply to the discussion at the Institute meeting. Mr Hosking and Mr Jones referred to the reproduction of a duplicate pack from the
existing Main File at 31 December each year, as described in paragraph 23 of the paper. The principal purpose of the duplicate pack is to facilitate retrospective analysis of data for both personnel and sickness-absence statistics. There are so many different permuta- tions of the basic data punched into the Central Record cards that it would be quite uneconomic to analyse the cards in every way likely to be of future assistance at monthly, quarterly or even yearly intervals, and we are persuaded that, on balance, the duplicate pack economizes in machine time. Moreover, in dealing with wastage and sickness absence, subjects on which so little is known at the present time, it is frequently necessary in dealing with a single problem to pursue lines of inquiry which cannot be foreseen when the work is started. For such purposes, the duplicate Main File is invaluable. For example, the adjustments to formula (2) of Appendix A incorporated in formula (3) of paragraph 95 of Appendix A could not have been developed without a duplicate Main File.
We are interested in Mr Jones’s suggestion that the Main File might be frozen for, say, three weeks out of four, and that in the fourth week all the changes which have accrued in the four-weekly period should be carried into the Main File. This method would clearly present advantages were the Main File the only concern, but the situation becomes more complicated if other files, such as the Sickness-Absence File, are maintained in close relationship to the Main File. We propose, however, to study the matter further.
Mr Knowles commented on the references in the paper to the Manchester Unity experience. The references were intended to be in respectful homage to the excellence of Watson’s work. No actuarial discussion of sickness statistics, or a kindred subject, would be complete without a reference to the Manchester Unity and we have sought to base our work on Watson’s principles, so far as they appear to apply to sickness absence. We agree with Mr Knowles that the Manchester Unity sickness rates cannot be regarded as a standard of sickness absence in present conditions.
Mr Benjamin was critical of the function ( la ) x, the average length of each sickness absence. He pointed to the need for data of the variance of sickness absences. It is the nature of any statistical index to compress; it shares the faults, as well as the virtues, of a vitamin tablet, and as a matter of theory we agree with Mr Benjamin. But for the present, in the pioneer stage, we are satisfied with ( la ) x. It tells much that is not known. Later, more refinement of technique will, no doubt, be required in this and other ways. The data are in the cards should they be needed. Indeed, we think that niceties of sampling and elaborations of statistical method will find their places in the pursuit of special problems of research suggested, but not answered, by material prepared on the lines of the paper.
We appreciate Mr Benjamin’s doubts about paragraph 69, but again we are, on the whole, unrepentant. The principle followed in punching diagnoses into the sickness- absence cards is to punch into each card the most accurate diagnosis available. Acceptance of that principle leads to the procedure described in paragraph 69.
Mr Benjamin considered that a calendar year might be too long a period of exposure and suggested that rates should be calculated for quarterly periods so that the position could be closely watched. We still prefer the calendar year for two principal reasons. The first stems from the nature of the work we are attempting to do, which is to measure sickness absence on an occupational basis. Several years’ experience are necessary before reliance can be placed on the results in detail and, in these circum- stances, we consider that no good purpose would be served at present by taking out
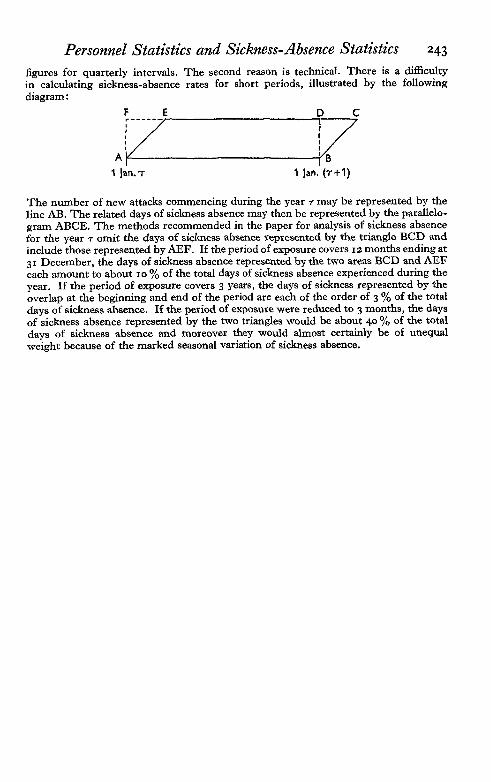
Personnel Statistics and Sickness-Absence Statistics 243
figures for quarterly intervals. The second reason is technical. There is a difficulty in calculating sickness-absence rates for short periods, illustrated by the following diagram:
The number of new attacks commencing during the year may be represented by the line AB. The related days of sickness absence may then be represented by the parallelo- gram ABCE. The methods recommended in the paper for analysis of sickness absence for the year omit the clays of sickness absence represented by the triangle BCD and include those represented by AEF. If the period of exposure covers 12 months ending at 31 December, the days of sickness absence represented by the two areas BCD and AEF each amount to about 10% of the total days of sickness absence experienced during the year. If the period of exposure covers 3 years, the days of sickness represented by the overlap at the beginning and end of the period are each of the order of 3% of the total days of sickness absence. If the period of exposure were reduced to 3 months, the days of sickness absence represented by the two triangles would be about 40% of the total days of sickness absence and moreover they would almost certainly be of unequal weight because of the marked seasonal variation of sickness absence.


![Sickness Absence: a Pan-European Study[1] SICKNESS ABSENCE: A PAN-EUROPEAN STUDY 1. Introduction The incidence and the level of sickness absence in the workplace is an important labour](https://img.dokumen.tips/doc/110x75/5fa706b7ddba8073614af31e/sickness-absence-a-pan-european-study-1-sickness-absence-a-pan-european-study.jpg)


![[Academy Name] Management of Sickness Absence](https://img.dokumen.tips/doc/110x75/61f02422231170415e5c7e4a/academy-name-management-of-sickness-absence.jpg)