Embed Size (px)
Citation preview

Personal Network Analysis Using Egonet
Chris McCartyUniversity of Florida
[email protected]: (352) 392-2908 x101
This presentation has four parts
1. Overview of social science research
2. Overview of social network analysis
3. Overview of whole network analysis
4. Overview of personal network analysis
5. Overview of Egonet

• Most social science research is designed to predict attitudes, behaviors or conditions of people based on their characteristics
• Social scientists ask questions or observe characteristics about respondents, then use the variability in those characteristics to explain the variability in outcome variables

Example of a study design
A social scientist may collect data on a sample of 500 respondents and try to predict their smoking behavior using variability in their age, education, income, height and weight
Age
Education
Income
Height
Weight
Number of cigarettes smoked per day
Independent variables Dependent variable

Conclusion
The researcher concludes that age, level of education and income are good predictors of how many cigarettes are smoked in a day while height and weight are not.
Age
Education
Income
Height
Weight
Number of cigarettes smoked per day
Independent variables Dependent variable

Social influence• Social scientists think that some outcome
variables are influenced by social factors
• For example, it is widely accepted that experimentation with smoking among adolescents is due to peer influences
• Since peer influence cannot be directly observed, social scientists craft questions that can be used as proxies for observing peer influence

Proxy questions
• Do either of your parents smoke? (PARENTS)
• Do most of your friends smoke? (FRIENDS)
• Have any of your friends ever offered you a cigarette? (OFFER)
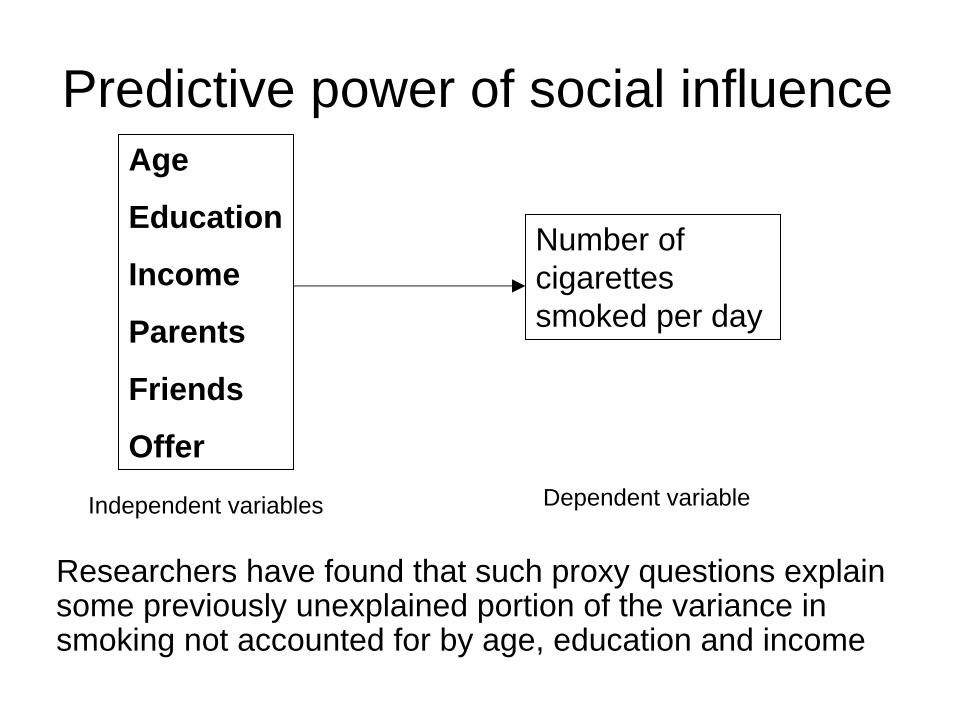
Predictive power of social influence
Researchers have found that such proxy questions explain some previously unexplained portion of the variance in smoking not accounted for by age, education and income
Age
Education
Income
Parents
Friends
Offer
Number of cigarettes smoked per day
Independent variables Dependent variable

Questions
• Would more detail about the social influence surrounding a respondent provide more explanatory power?
• What questions can we ask the respondent to gather this kind of detail?
• We propose using Social Network Analysis

Two kinds of Social Network Analysis
Whole Network Analysis
• Focus on interaction within a group
• Collect data from members of a group about their ties to other group members
Personal Network Analysis
• Focus on effects of network on individual attitudes, behaviors and conditions
• Collect data from respondent (ego) about interactions with network members (alters)

Whole network approach to smoking and social influence
• Select a group of students in a class
• Ask each student to rate on a scale of 1 to 5 how much they socialize with each of the others
• Ask each student whether they smoke

Adjacency Matrix of students
• Ratings of each person can be used to make a matrix representing the relations between members of the class
• Intersecting cells represent their assessment
• David says he socializes with Faith at a level 2
• Faith says she socializes with David at a level 1
David Faith Rosanna Antonio Napp Lem Jim Beth Mark Kent Amber ThomasDavid 5 2 2 0 0 1 0 3 1 0 2 0Faith 1 5 5 0 0 0 0 1 0 0 2 0
Rosanna 2 5 5 0 0 1 0 2 0 0 4 0Antonio 0 1 1 5 0 0 0 0 0 0 0 0
Napp 0 0 0 0 5 0 0 0 0 0 0 0Lem 2 0 2 0 0 5 5 2 0 0 2 0Jim 0 0 1 0 0 5 5 5 0 0 2 0
Beth 4 3 1 0 0 1 5 5 0 0 3 0Mark 1 0 0 1 0 0 0 0 5 0 1 0Kent 0 0 0 0 0 0 0 0 0 5 0 3
Amber 2 3 3 0 0 1 2 2 1 0 5 0Thomas 0 0 0 0 0 0 0 0 0 3 0 5

Network visualization
• We can use the matrix to visualize the structure of relations
• There is a large group in the middle
• Amber and Beth smoke
• Napp does not socialize with anybody and Thomas and Kent only socialize with each other
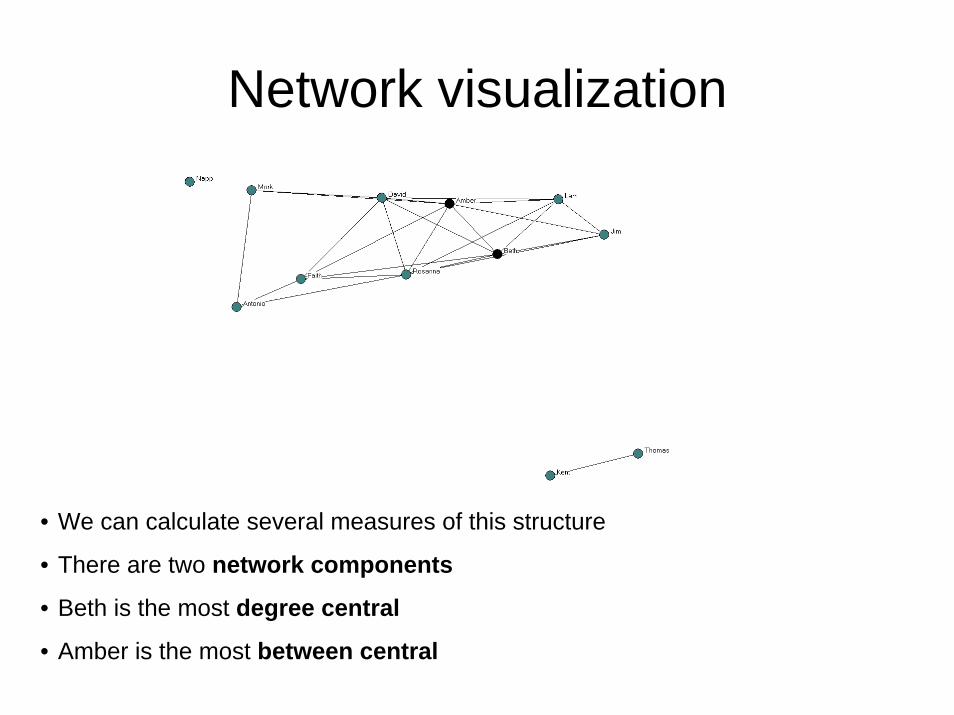
Network visualization
• We can calculate several measures of this structure
• There are two network components
• Beth is the most degree central
• Amber is the most between central

Conclusion• We may conclude that those in the group with
Beth and Amber are more likely to experiment with smoking
• Napp, Kent and Thomas are not
• This analysis says nothing about influences from outside of this group
• To study social influences across groups we use Personal Network Analysis

Tom has a Personal Network of 10 people

Tom met these people in three groups
FAMILYWORK
CLUB

Within the groups everybody knows each other
CLUB
WORKFAMILY

There are also some ties between the groups
FAMILY
WORK
CLUB

Sometimes personal networks can be complex
Overview of Personal Network Data Collection
1. Identify a population
2. Select a sample of respondents
3. Ask questions about respondent
4. Elicit network members
5. Ask questions about each network member
6. Ask respondent to evaluate ties between network members

Identify a population
Personal network analysis begins much like any social science research study. The first thing to do is clearly identify the population of interest. That could be smokers, the elderly, migrants or any other population where there is an outcome variable we think is impacted by their social environment.

Select a sample of respondents
Selecting a sample of respondents is also like any other social science research study. The exception is that personal network data collection can be a long interviewing process that sometimes requires special software. This may mean a trade-off between the representativeness of the sample and the detail about their personal networks.

Ask questions about respondent
Like any other social science research study, we are interested in knowing something about the respondent (called ego in the jargon of the field). We want to know about outcome variables of interest we think may be impacted by social influences (Do they smoke, are they depressed, how many times have they migrated). We also want to know about other possible explanatory variables that are not related to social influence (How old are they, how much education do they have, what is their income).
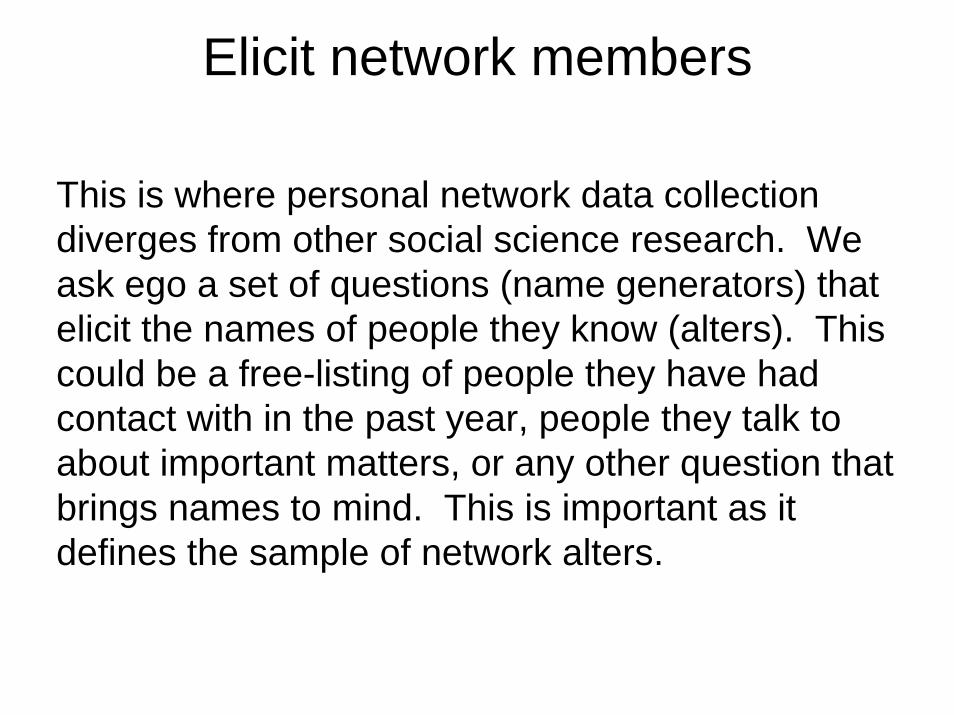
Elicit network members
This is where personal network data collection diverges from other social science research. We ask ego a set of questions (name generators) that elicit the names of people they know (alters). This could be a free-listing of people they have had contact with in the past year, people they talk to about important matters, or any other question that brings names to mind. This is important as it defines the sample of network alters.

Ask questions about each network member
We then want to ask ego a set of questions about each alter. Keep in mind that this is typically the longest part of the interview. If you elicit 50 alters from each respondent and want to know ten things about each one (e.g. sex, age, do they smoke, where do they live, etc.) then this becomes 500 questions. You must balance the number of alters and the amount of information you want to know about each one.

Ask respondent to evaluate ties between network members
Finally, we want to collect the structural data to form an adjacency matrix. This means that ego must evaluate all the possible ties between their alters. Fortunately we usually assume that the ties are symmetric, meaning that we just want to know if the two alters are tied. The number of ties to evaluate grows geometrically as alters are added.

Respondent burden as alters are added
Respondent burden by number of alters
0
200
400
600
800
1000
1200
1400
1 3 5 7 9 11 13 15 17 19 21 23 25 27 29 31 33 35 37 39 41 43 45 47 49
Alters
Alte
r pai
r eva
luat
ions

What kind of data do we get?
• Data on network composition. These are summaries of the attributes of network alters.
• Data on network structure. These are summary measures of the pattern of relations
• Combinations of composition and structure

Personal network compositionName Closeness Relation Sex Age Race Where Live Year_Met
Joydip_K 5 14 1 25 1 1 1994
Shikha_K 4 12 0 34 1 1 2001
Candice_A 5 2 0 24 3 2 1990
Brian_N 2 3 1 23 3 2 2001
Barbara_A 3 3 0 42 3 1 1991
Matthew_A 2 3 1 20 3 2 1991
Kavita_G 2 3 0 22 1 3 1991
Ketki_G 3 3 0 54 1 1 1991
Kiran_G 1 3 1 23 1 1 1991
Kristin_K 4 2 0 24 3 1 1986
Keith_K 2 3 1 26 3 1 1995
Gail_C 4 3 0 33 3 1 1992
Allison_C 3 3 0 19 3 1 1992
Vicki_K 1 3 0 34 3 1 2002
Neha_G 4 2 0 24 1 2 1990
. . . . . . . .
. . . . . . . .
. . . . . . . .
This ego has told us some things about each alter. For example, Joydip is a 25 year old male she met in 1994 that she is very close to.

Now we can create a set of compositional variables
• Average age of each alter (ALTAGE)• Proportion of alters that are women
(ALTWOMEN)• Proportion of alters that are family
(ALTFAMILY)• Average length of time ego has known
each alter (DURATION)• Proportion of alters that smoke
(ALTSMOKE)
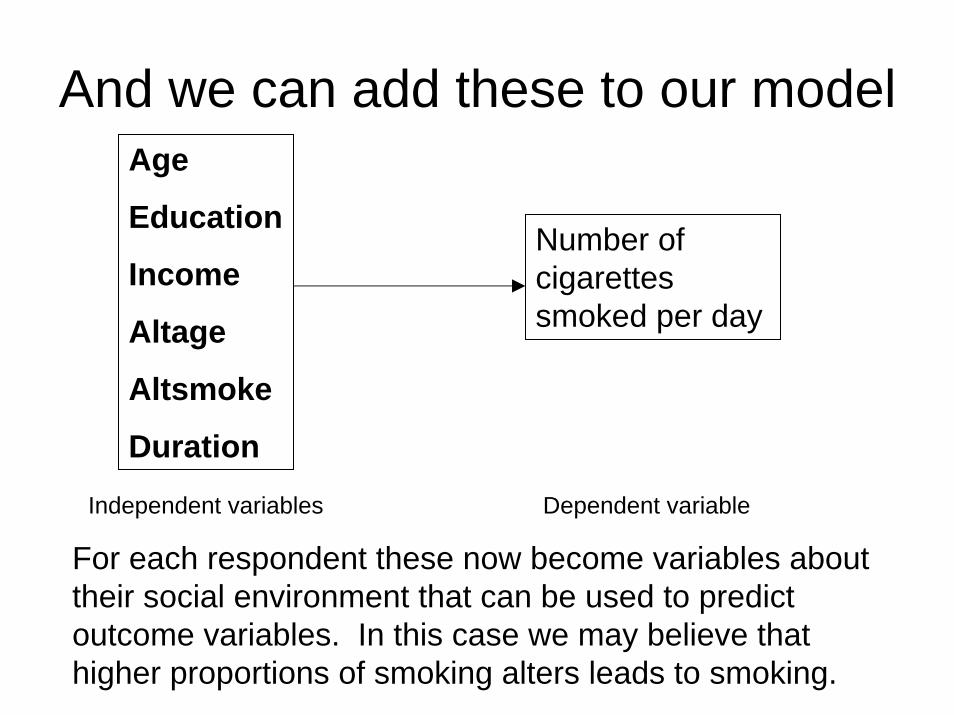
And we can add these to our modelAge
Education
Income
Altage
Altsmoke
Duration
Number of cigarettes smoked per day
Independent variables Dependent variable
For each respondent these now become variables about their social environment that can be used to predict outcome variables. In this case we may believe that higher proportions of smoking alters leads to smoking.

Personal Network StructureJoydip_K Shikha_K Candice_A Brian_N Barbara_A Matthew_A Kavita_G Ketki_G . . .
Joydip_K 1 1 1 1 0 0 0 0 . . .
Shikha_K 1 1 0 0 0 0 0 0 . . .
Candice_A 1 0 1 1 1 1 1 1 . . .
Brian_N 1 0 1 1 1 1 1 1 . . .
Barbara_A 0 0 1 1 1 1 0 0 . . .
Matthew_A 0 0 1 1 1 1 1 1 . . .
Kavita_G 0 0 1 1 0 1 1 1 . . .
Ketki_G 0 0 1 1 0 1 1 1 . . .
. . . . . . . . . . . .
. . . . . . . . . . . .
. . . . . . . . . . . .
The same Ego also evaluated the ties between their alters. We end up with an adjacency matrix for each ego. We can use this to calculate structural measures.

Now we can create a set of structural variables
• Number of components (COMP)• Average betweenness centrality
(BETWEEN)• Closeness centralization (CLOSCENT)• Number of alters in network core
(CORESIZE)

And these can be added to the modelAge
Education
Income
Altage
Altsmoke
Duration
Comp
Between
Coresize
Number of cigarettes smoked per day
Independent variables
Dependent variable
In this model we want to test whether the structure of the personal network impacts smoking. For example, betweenness centrality is a measure of bridging. Bridging represents exposure to different groups which may not tolerate smoking.

Some measures of personal network structure• Degree Centrality – An alter is highly degree-central to the extent he or she
is directly connected to many other alters.
• Closeness Centrality –An alter is highly close-central if he or she is connected by short paths to many other alters.
• Betweenness Centrality –An alter is highly between-central to the extent he or she lies on many geodesics (shortest paths) between alters.
• Components – A set of alters who are connected to one another directly or indirectly.
• Isolates – A node unconnected to any other node.
• Network-Degree Centralization – A measure of the extent to which the network is dominated by a single alter using degree centrality.
• Network-Closeness Centralization – A measure of the extent to which the network is dominated by a single alter using closeness centrality.
• Network-Betweenness Centralization – A measure of the extent to which the network is dominated by a single alter using betweenness centrality.

How do we collect and analyze these data?
• Many researchers develop paper instruments or computerized instruments that let them collect these data
• Compositional data are calculated using a statistical package (e.g. SAS or SPSS)
• Structural analyses are not typical and are often limited to personal network density, since it is an easy measure to program

Need for personal network software
• A standardized software package would offer many advantages
• It provides a computer interface that edits and standardized data input with complex skip patterns
• It automatically can calculate compositional and structural measures and export them to a data set compatible with a statistical package
• It makes it possible to analyze individual cases

Egonet design
• Egonet is written in Delphi and runs on a Windows platform
• There are two programs:1. Administrator program to create a study and
assemble a questionnaire2. Client program to collect data and analyze it
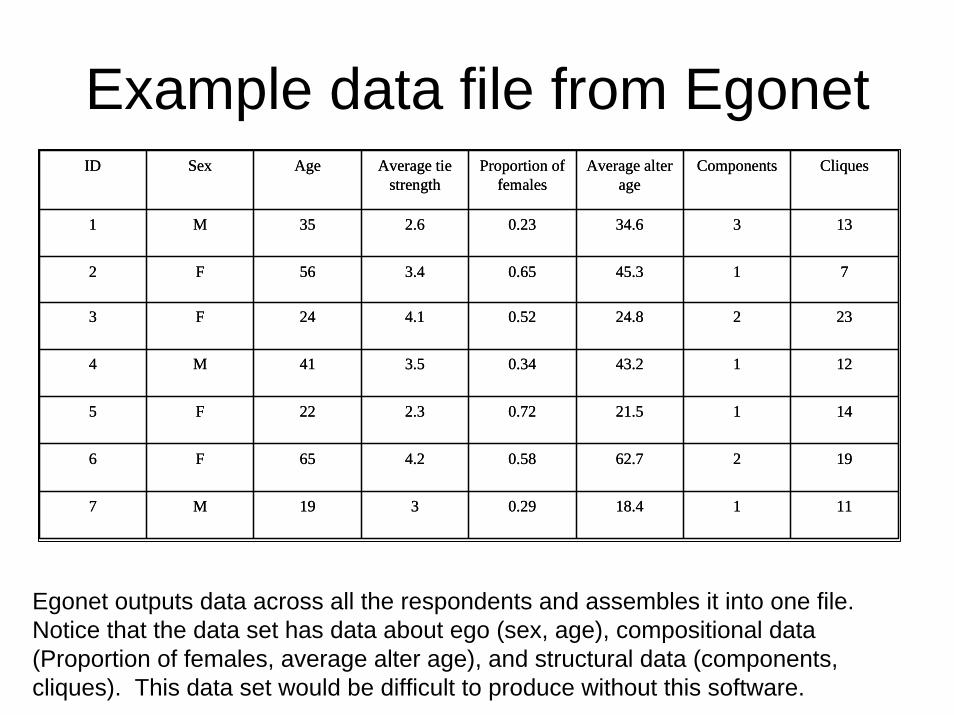
Example data file from Egonet
11118.40.29319M7
19262.70.584.265F6
14121.50.722.322F5
12143.20.343.541M4
23224.80.524.124F3
7145.30.653.456F2
13334.60.232.635M1
CliquesComponentsAverage alter age
Proportion of females
Average tie strength
AgeSexID
11118.40.29319M7
19262.70.584.265F6
14121.50.722.322F5
12143.20.343.541M4
23224.80.524.124F3
7145.30.653.456F2
13334.60.232.635M1
CliquesComponentsAverage alter age
Proportion of females
Average tie strength
AgeSexID
Egonet outputs data across all the respondents and assembles it into one file. Notice that the data set has data about ego (sex, age), compositional data (Proportion of females, average alter age), and structural data (components, cliques). This data set would be difficult to produce without this software.

Egonet can also visualize the personal network of a single Ego
This is the personal network of Merced, a 19-year-old second generation West African migrant in Spain. The dots represent her alters and the lines represent a connection between alters based on her evaluation of the ties.
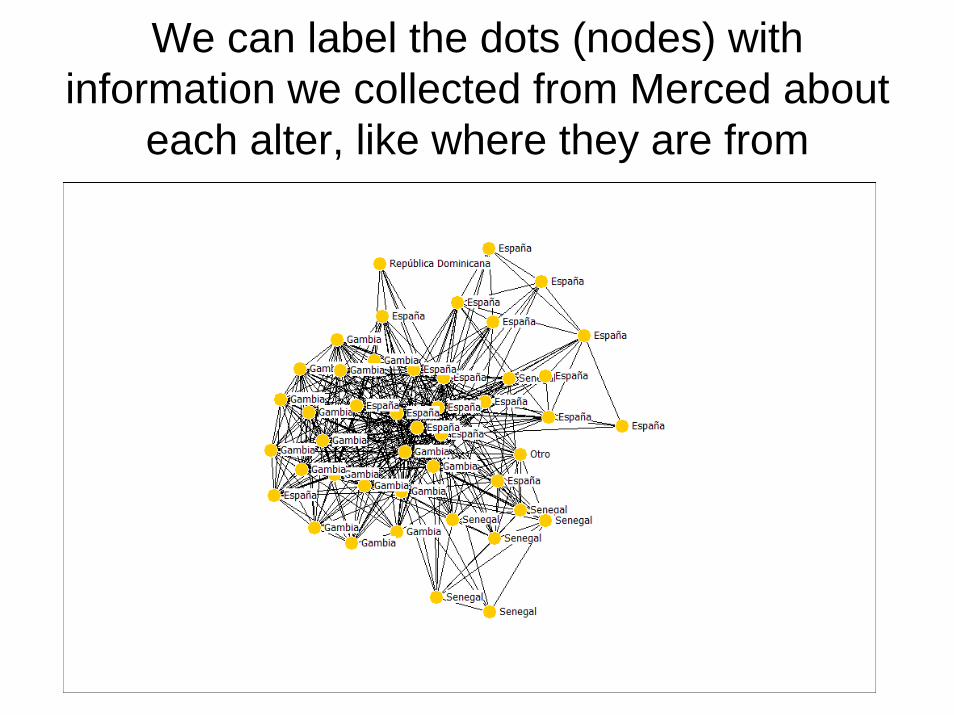
We can label the dots (nodes) with information we collected from Merced about
each alter, like where they are from

We can also size the nodes, in this case by Merced’s assessment of how close she is to each alter

And we can color the nodes, in this case by race

Finally, we can shape the nodes, in this case by whether they smoke (smokers are the squares)

We now have a picture we can use to interview Merced about her acculturation experience in Spain. See the potential influence of white, Spanish smokers in the upper right from her high school

Contrast this with the visualization of her 22 year old sister Laura, labeled, sized, colored and shaped with the same variables. Their acculturation experiences are different.
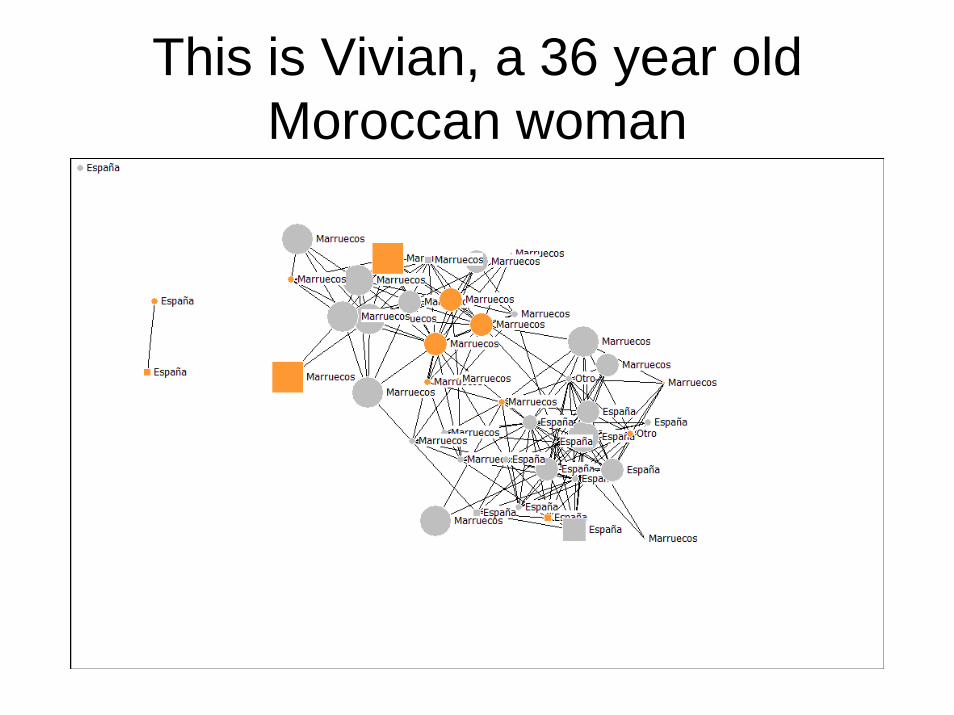
This is Vivian, a 36 year old Moroccan woman

And this is Jose, a 46 year old Dominican man

We can also use Egonet to visualize structural measures. Here is Merced’s network with nodes colored by betweenness centrality.

Here Merced’s network is colored by her relation type (blue nodes are relatives). Egonet has done a cluster analysis and circled nodes and labeled them with numbers.

Conclusion: Personal network analysis
• Personal network analysis provides a set of variables that capture the social environment surrounding a person
• Compositional variables summarize alter attributes
• Structural variables summarize the patterns of the relations
Conclusion: Egonet
• Egonet provides a way to design a personal network study and share the results with colleagues
• Egonet exports a data file that puts together variables about ego, compositional variables and structural variables
• Egonet provides a flexible visualization of individual networks that can be used to interview respondents about their personal networks


![Behavioral clusters in dynamic graphshpark/papers/dgraph15.pdfperforms graph anomaly detection using local (egonet) features, and RolX [21], which uses Nonnegative Matrix Factorization](https://img.dokumen.tips/doc/110x75/5f47775250df93536e3612e2/behavioral-clusters-in-dynamic-graphs-hparkpapersdgraph15pdf-performs-graph-anomaly.jpg)
![First-Person Action-Object Detection with EgoNet · explicitly using action recognition as is commonly done in prior work [37, 31]. II. RELATEDWORK Complementary Object and Activity](https://img.dokumen.tips/doc/110x75/5f4457c55c5dec53ef23aef6/first-person-action-object-detection-with-explicitly-using-action-recognition-as.jpg)


