Embed Size (px)
Citation preview

Permitting, Economic Value and Mining in the United States Prepared forThe National Mining Association


www.SNLmetals.com | 03Permitting, Economic Value and Mining in the United States
SNL Metals & Mining has in excess of three decades of experience in the resource sector, providing strategic consulting services to mineral explorers, mine developers, commodity producers, equipment suppliers, the service sector, financiers, trade associations and governments.
The SNL mining database covers more than 3,500 listed companies and 40,000 projects, and the consulting team augments this unrivalled source material with trend analysis, in-depth data assessment and industry surveys.
In early 2015, the National Mining Association commissioned SNL Metals & Mining to carry out a study to demonstrate the economic impact of mining project permitting delays in the United States. SNL Metals & Mining undertook the necessary research of selected mining projects at various stages of operations and permitting, in a number of states, to assess the delays that are associated with mine permitting.
In addition, SNL Metals & Mining constructed a generic model, based on the experiences of the U.S. mining sector, to quantify the magnitude of economic impacts due to mine permit delays.
The information presented in this report in relation to permitting should be used for material guidance only. Individual mining projects in the U.S. may require a number of permits and licenses that may not have been mentioned in this report.
Mark Fellows
Director, Consulting
SNL Metals & Mining
London
June 19, 2015
Project Brief

www.SNLmetals.com | 04Permitting, Economic Value and Mining in the United States
Acronyms
ADEQ Arizona Department of Environmental Quality
BLM Bureau of Land Management
CBJ City and Borough of Juneau
CEAA Canadian Environmental Assessment Agency
CEARIS Canadian Environmental Assessment Registry Internet Site
EIA Environmental Impact Assessment
EIS Environmental Impact Statement
EPA Environmental Protection Agency
MEPA Minnesota Environmental Policy Act
MPO Mine Plan of Operations
NAS National Academy of Sciences
NEPA National Environmental Policy Act
NMFS National Marine Fisheries Service
NoC Notice of Commencement
NPV Net Present Value
PoO Plan of Operation
RoD Record of Decision
TMM Twin Metals Minnesota
USACOE United States Army Corps of Engineers
USFS United States Forest Service
USFWS United States Fish and Wildlife Service

www.SNLmetals.com | 05Permitting, Economic Value and Mining in the United States
Contents
1. FACTORS AFFECTING MINING INVESTMENT 08
2. THE ECONOMICS OF MINING 09
3. THE FINANCIAL COST OF CHANGE 103.1 SCENARIO 1 - INCREMENTAL COSTS 103.2 SCENARIO 2 - PRODUCTION LAGS 143.3 SCENARIO 3 - ADDITIONAL RISK 17
4. OVERALL IMPACT OF DELAYS FOR REVENUE AND EXPENDITURE 21
5. MINING INVESTMENT ENVIRONMENT 22
6. LICENSING AND PERMITTING IN THE UNITED STATES 23
7. HOW LONG DO PERMITS TAKE IN OTHER COUNTRIES? 267.1 AUSTRALIA 267.2 CANADA 26
8. SUMMARY 28
ANNEX A: MODELING A GENERIC MINE 29
ANNEX B: EXPENDITURES AND REVENUES BY PROJECT STAGE 30
GLOSSARY 31
PROJECT BRIEF 03ACRONYMS 04CONTENTS 05LIST OF FIGURES 06LIST OF TABLES 06EXECUTIVE SUMMARY 07DISCLAIMER 32

www.SNLmetals.com | 06Permitting, Economic Value and Mining in the United States
Contentscontinued
1 Changes to Total Investment and Mine Value due to Incremental Costs 102 Changes to Rosemont Copper Mine Feasibility Studies 123 Changes to Total Investment and Mine Value due to Delayed Production 154 Changes to Kensington Mine Operations 155 Key Permits Required for Twin Metals Minnesota Project 186 Modeled Mine Valuation ($ million) 217 Average Timeframe for NEPA Process for Plans of Operations in the U.S. 258 Key Milestones for the Environment Assessment 27
1 Internal and External Factors Affecting Mining Investment 082 Effect of Incremental Costs on Cumulative Cash Flows 113 Projected Incremental Cost 114 Changes in Projected Cash Flow for Rosemont Copper Mine 135 Effect of Production Delays on Cumulative Cash Flow 156 Loss in Current Value of Expected Revenue from Delays 157 Twin Metals and Stages of the Permitting Process 198 Changes to Cumulative Cash Flows due to Delays 219 Mineral Exploration Budgets 2210 Mines Starting Production (2005-2014) 2211 EIS Process in the U.S. 24
LIST OF FIGURES
LIST OF TABLES

www.SNLmetals.com | 07Permitting, Economic Value and Mining in the United States
Executive Summary
Of all the developed nations, unexpected and often unnecessary delays in obtaining mining permits afflict the U.S. most severely. Despite being blessed with a vast reserve of mineral resources, the U.S. only accounts for 7 percent of world-wide spending on mineral exploration and production is currently reliant on a population of mature mining projects. The average remaining life of active mines in the U.S. and the share of projects in advance development have also fallen in recent years.
Meanwhile, the demand for minerals to supply the defense, advanced energy, high-tech electronics, medical, and transportation industries is rising. The U.S., while leading on the manufacturing of these technologies, is lagging in the production of the minerals needed to make them.
SNL Metals & Mining quantifies for the first time how much permitting delays impair and discourage investments in mineral development projects. It found that on average, a typical mining project loses more than one-third of its value as a result of unexpected delays in receiving the numerous permits needed to begin production. The longer the wait, the more the value of the investment is reduced, even to the extent that the project ultimately becomes an unviable investment. The report also shows the increasing likelihood of new mines stagnating at the exploration stage, with far fewer advancing to actual production, putting security of the country’s mineral supply at risk.
In the U.S., the requirement for multiple permits and multiple agency involvement is the norm, as is the involvement of other stakeholders, including local indigenous groups, the general public and nongovernmental organizations. As a consequence of the country’s inefficient permitting system, it takes on average seven to 10 years to secure the permits needed to commence operations in the U.S. To put that into perspective, in Canada and Australia, countries with similarly stringent environmental regulations, the average permitting period is two years.
In these countries, the timeline for the government to respond is more clearly outlined, the specification of lead agencies is clearer and the responsibility for preparing a well-structured environmental review is given to the mining company, not the government.
Mining is a long-term investment; from exploration to closure and site remediation, projects typically have a life span of several decades. Although geology and topography dictate where a deposit is located and how it is mined, it is economics that determines whether the
project proceeds or not. Even a large high-grade deposit will remain unmined if the revenue-cost balance and timetable are not advantageous.
Mining companies accept that there will always be some element of delay during the development period and will build appropriate contingency and mitigation measures into their business plan. However, delays for unforeseen reasons, or the delays to the expected process, are a real problem for the industry, and by extension, the U.S. economy as a whole.
KEY FINDINGS• Unexpected delays in the permitting process alone
reduce a typical mining project’s value by more than one-third.
• The higher costs and increased risk that often arise from a prolonged permitting process can cut the expected value of a mine in half before production even begins.
• The combined impact of unexpected, and open-ended, delays and higher costs and risks can lead to mining projects becoming financially unviable.
EXAMPLESThe Rosemont Copper project in Arizona continues in its attempts to secure permits, five years after the originally planned start date of 2010. Over this period, the value of the project has fallen from $18 billion to $15 billion despite much higher copper prices.
The Kensington gold mine in Alaska was plagued by permitting issues during development. It commenced production in 2010, nearly 20 years after the originally planned start date of 1993. By the time the mine opened, the capital cost of building the mine had increased by 49 percent, and the company had reduced planned gold production by nearly a third, to focus mining operations on the most profitable part of the deposit only.
Twin Metals Minnesota is still in a relatively early stage of the permitting process, completing a prefeasibility study in 2014. The developers have acknowledged that the delay in receiving permits, or the possibility of denial, could be a significant business risk to the project.

www.SNLmetals.com | 08Permitting, Economic Value and Mining in the United States
1. FACTORS AFFECTING MINING INVESTMENT
The decision to invest in a mining project is driven by a number of factors. Given the large amount of capital required and the long-term nature of such investments, these commitments are not undertaken lightly.
Elements informing this decision can be classified as those “internal” and “external” to the firm. Internal elements are those over which the company and investors have some degree of control and can plan for and design appropriate strategies to manage. These would include the scale of operation, type of equipment used, mining and processing techniques used and the management team. By choosing to operate in a particular country, companies accept the taxation and trade regime under which they will operate.
Other factors are external, over which the mining company can exert little control. These would include the international price of the metal/commodity produced, transport and fuel costs and the state of financial markets (sources of capital).
An “unexpected” or “unpredictable” element in any investment decision-making process increases the level of risk that investors ascribe to a project. Increased risk can have numerous effects. First, investors will require a higher rate of return to compensate for the higher risk the project faces. Second, to achieve investor returns more rapidly, the life of the mining operations may be shortened, extracting higher-grade and more profitable ore only. Third, investors may withdraw from the project completely and pursue other less risky projects in other countries. When higher risk perceptions become widespread in a given country, it becomes less attractive as an investment destination.
These unpredictable elements, external to the mining company, are essentially related to third parties or the global economy. Figure 1 categorizes some of these elements, including those internal and external to the firm, and shows where changes in factors can be reasonably predicted and/or controlled or are unpredictable.
Mine design and equipment selection, for example, are within the control of the company and therefore are internal and predictable. Ore grade/geology, although
internal, can be unpredictable, as exploration is never able to provide a complete understanding of an orebody. Permits and licenses are external to the company, and time duration can be predicted. Metal prices, on the other hand, are set by the forces of supply and demand in global markets and are therefore external and unpredictable.
FIGURE 1 INTERNAL AND EXTERNAL FACTORS AFFECTING MINING INVESTMENT
Predictable/Controllable
• Mine design• Equipment selection• Labor productivity• Management team
• Permits & licenses• Transport charges• Inflation • Finance raising
• Ore grade/geology • Fuel costs• Metal prices• Local community reaction• Legal challenges
Unpredictable/Uncontrollable
Exter
nal
Inter
nal
Source: SNL Metals & Mining
The larger the number of factors in the external/unpredictable quadrant, the greater the risk for the investment. When factors move across quadrants, for example, where the mine permitting regime becomes unpredictable, the risk profile for the project will increase and have an impact on investment decisions.
Consider the process for receiving permits and licenses for a mine. Companies can facilitate the process by providing the required information in a timely manner, cooperating with federal agencies and communicating with local communities. They can allow reasonable time frames within the project schedule for the approval of these permits; however, the final decision rests with third parties, often federal agencies.
When the permitting process becomes excessively long or unpredictable, it can lead to unexpected incremental costs, which have a serious impact on the economic viability of a project.

www.SNLmetals.com | 09Permitting, Economic Value and Mining in the United States
Geology and topography will determine the shape and size of a mining operation, while economics determine the viability of a project. A large, high-grade deposit will remain undeveloped if the projected return on investment is deemed unattractive by investors.
In most instances, the price of an extracted commodity is set by the market, and so it lies largely outside the control of the mining company. Some adjustment is possible as the mine-head price received for ore is the market price of the contained metal minus the milling, processing and transportation costs. Companies can therefore elect to beneficiate the extracted material and, for some metals, can fix future unit revenue by selling forward.
Generally, in trying to maximize the value of their investment, mine developers will attempt to design their mine incorporating the optimum production method, output capacity, capital cost of building the mine and operating and closure costs.
Capital costs are positively correlated with the size of the operation; whereas, the operating cost of extracting a unit of metal/coal will depend upon the mining method and may be lower for large-scale operations (due to economies of scale). For low-grade deposits, small increases in the capital and/or operating costs can render the venture uneconomic.
In evaluating a project, one of the first decisions facing a company is how much to spend on reducing investment risk by carrying out more intensive exploration to better define the mineral resource and therefore reduce uncertainty. This consideration also applies to environmental surveys and assessments.
Any mining project involves an initial, irreversible investment in the productive capacity. Once this investment has been made, the mine’s value (see box) will be maximized by reaching commercial production as soon as possible and operating at full capacity. Start-up delays, constraints on the total amount extracted, higher operating costs or an increase in perceived risk will all ultimately reduce the life of the mine and its current value.
A delay in the generation of revenue is particularly damaging to the value of a mine (see box). Indeed, projects can be put at risk by delaying the date by which the original investment is recouped (i.e., the start of positive cumulative cash flow).
VALUE OF A MINEThe financial value of a mine is usually quantified by estimating the stream of revenues from future production less the costs to achieve this flow. However, a dollar in your pocket now is worth more than a dollar promised in the future. This time factor is taken into account by discounting the future costs and earnings. The “time discount” rate used varies, depending most commonly on the perceived levels of inflation and the investment risk. For mining ventures, it is frequently at least 8 percent per year, even in secure countries such as the U.S.
CASH FLOWSNet cash flow is the difference between annual revenue and expenditure. Negative cash flow indicates that the financial outflow is larger that year than the inflow, while a positive cash flow indicates that revenue is greater than expenditure. Cumulative cash flows, where the amount from each year is carried forward, indicates the overall financial flow for the project over a given time period.
Expected delays can be perhaps best considered as lags in development, including unexpected technical issues causing a redesign of the mine, delayed equipment delivery or complications in environmental permitting.
Unexpected delays are the most invidious and can easily transform a promising new mine into a poor or unviable investment. Such delays can be caused by unforeseen complications in environmental permitting.
2. THE ECONOMICS OF MINING

www.SNLmetals.com | 10Permitting, Economic Value and Mining in the United States
There are a significant number of factors that affect the operating and financial performance of a mine as have been discussed in section two. To illustrate the importance of sequencing of revenue and expenditure over the life of a project, SNL has developed a financial model for a simulated gold mine: Enterprise. This hypothetical U.S. project was the subject of a Feasibility Study in 2015, which envisaged an 11-year mine life with production beginning in 2018 (see Annex A for model details).
To illustrate the impact permitting delays have on a project’s finances, three scenarios were developed:
Scenario 1. Incremental costs – Additional costs to meet unexpected permitting requirements are incurred but production is not delayed.
Scenario 2. Production lags – Development time for the mine is extended due to unexpected permitting delays, so production is “on hold” for a period.
Scenario 3. Additional risk – Prolonged delays lead to changes that affect the discount rate investors use to assess the mine’s value.
For each of these scenarios, the simulation contrasts the projected cash flows for the project with that of the original Feasibility Study. The impact of these changes are observed by taking “snap shots” of the mine’s finances at two-year intervals after the initial study.
3.1 SCENARIO 1 - INCREMENTAL COSTSHaving applied for environmental permits in 2015, the Enterprise project was originally expected to reach production in 2018. However, the findings from the environmental assessment required changes to the mine plan. The company, in order to meet its 2018 production deadline, spent more money during the construction and early-production phases.
In this model, the costs envisaged in the original study are increased on three subsequent occasions. Table 1 shows the extra costs required to meet the permit requirements, the impact this has on total investment and the resultant lower value of the project.
In the Feasibility Study, costs linked specifically to the environment were put at $50 million, with the total project investment estimated at $370 million. The feasibility study assessed the value of the mine at $291 million.
In this scenario, the timing of start-up, and the project’s assumed risk, are left unchanged.1
1 All project valuations are calculated at a discount rate of 8 percent
SIMULATED INCREMENTAL COSTS
2017 $15 million in environmental cost has been added in 2016 and 2017, and an annual $2 million water treatment charge is added for 10 years from 2018. This increases the total capital cost from the $370 million estimated in the Feasibility Study to $420 million. The extra costs reduce the project’s value by 12 percent, from $291 million to $256 million.
2018-2019 Additional environmental costs of $50 million are incurred in 2018 and $20 million in 2019. This increases the total capital cost to $490 million. The additional costs reduce the project’s value by a total 28 percent from $291 million to $209 million.
2020-2022 A further water treatment charge of $10 million was paid in 2020, and an extra annual $2 million is estimated for 16 years after 2022. This increases the total capital costs from the $370 million estimated in the Feasibility Study to $532 million. This ultimate cost of $532 million (44 percent more than the original estimate) is based on case studies from the North American mining industry.
3. THE FINANCIAL COST OF CHANGE
TABLE 1 CHANGES TO TOTAL INVESTMENT AND MINE VALUE DUE TO INCREMENTAL COSTS
Total Environmental Costs
($ million)
Total Investment ($ million)
Mine Value*
($ million)
Feasibility Study (2015) 50 ** 370 291
2017 100 420 256
2019 170 490 209
2021 212 *** 532 194
* Assuming all other factors unchanged, and discount rate of 8 percent** Includes $1 million per year water control costs*** Includes $3 million per year water control costs
Source: SNL Metals & Mining

www.SNLmetals.com | 11Permitting, Economic Value and Mining in the United States
3. THE FINANCIAL COST OF CHANGEcontinued
In aggregate, the additional costs reduce the project’s value by 33 percent from $291 million to $194 million. This calculated value represents only 37 percent of the capital invested in the project, compared with the 79 percent estimated in the Feasibility Study. These changes are certainly detrimental to the attractiveness of the venture but are probably not sufficient to render the project unviable (Figure 2).
To illustrate the extent these incremental costs impact the total financial flows for the mining firm, Figure 3 reflects these increases as relative to every $100 spent by the mine. Initially, it was assumed $100 would be spent in the construction of the mine in 2015, which would increase to $173 in the next year and so on. As the mine experiences its increased environmental permitting compliance cost, construction costs have increased to $203 in 2016 ($30 higher) than anticipated.
The incremental cost changes in 2016-2017 reflect the costs incurred as the company reacts to findings from the Environmental Impact Statement (EIS) and acts appropriately to qualify for its permits. In 2018, these extra costs fall as the company “holds” construction, awaiting its permits to come through.
In 2019, the full impact of these extra costs, induced by permitting requirements, can be seen. Within the original plan, the mine would have spent $236 in this year; instead, it needs to spend an additional $105, nearly 70 percent more than envisaged.
FIGURE 2 EFFECT OF INCREMENTAL COSTS ON CUMULATIVE CASH FLOWS
-400
-200
0
200
400
600
800
2015
20
16
2017
20
18
2019
20
20
2021
20
22
2023
20
24
2025
20
26
2027
20
28
2029
20
30
2031
20
32
2033
20
34
2035
20
36
2037
20
38
2039
20
40
$ M
illio
n
2015 2021
Reduced reward
Delays investmentpayback period
Source: SNL Metals & Mining
FIGURE 3 PROJECTED INCREMENTAL COST
0
50
100
150
200
250
300
350
400
2015 2016 2017 2018 2019 2020 2021 2022 2023 2024 2025 2026 2027 2028
$ 100
2015 2021
Source: SNL Metals & Mining
As the mine goes into production in 2018, the incremental production costs experienced each year can be seen in the Figure 3. While they taper off after 2020, for every $100 in costs the mine was expecting to spend, it has to face an additional $4 for each of the remaining years of production.
Incremental costs and the impact on the financial flows of the project, as a result of extensive changes required to meet permitting criterion, can be illustrated by a real mine: the Rosemont Copper mine in Arizona.
CASE STUDY: ROSEMONT COPPER MINE – ARIZONA
Location: 30 km southeast of Tucson, Arizona
Current owner: Hudbay Minerals Inc. (80 percent)
Discovery: 1985
Original planned start-up: 2010
Actual production: Awaiting permits
Source: SNL Metals & Mining
Rosemont Copper, owned by Hudbay Minerals Inc. (acquired from Augusta Resources Corp. in July 2014), is an open-pit copper/molybdenum/silver deposit located in Arizona. It is expected to be one of the largest copper mines in the U.S. and, as currently designed, could account for 10 percent of current U.S. copper production.
The Rosemont Copper deposit was discovered in the 1960s by Anaconda and Anamax, with Asarco purchasing the rights to the land and deposit in 1987-1988. In 1998, the company planned to bring the project into production by 2010.

www.SNLmetals.com | 12Permitting, Economic Value and Mining in the United States
3. THE FINANCIAL COST OF CHANGEcontinued
In 2005, the project changed hands once again, being acquired by Augusta for $20.8 million. The company estimated capital costs to develop the project at $636-806 million. In July 2007, the company submitted its mine plan to the U.S. Forest Service (USFS), which would initiate the EIS and public consultation processes. The company expected to receive approval for construction by 2009 and production to commence by 2010. By December of that year, Augusta had begun to place orders for the purchase and delivery of equipment required for the construction of the mine. By April 2008, the company had awarded a $56 million engineering procurement construction management contract.
By 2009, the mine development and processing facility construction were expected to cost $713 million, part of the $897 million required to develop the project as a whole. Mining was expected to start at the end of 2011, with the first copper cathode produced in March 2012.
By the end of 2009, the company had received its ground water withdrawal permit and state approval of its reclamation permit, but awaited three other major approvals (State Aquifer Protection Permit, Air Emissions Permit, and a United States Army Corps of Engineers [USACOE] Section 404 Permit) before construction could begin. The USFS initially informed the company of a delay in the draft EIS from November 2009 to February 2010, with the first draft
being finally delivered in November 2010. The company expected a final EIS and Record of Decision (RoD) to be submitted by early 2011. A few months after the USFS scheduled January 2012 for the RoD, the company continued to plan construction in the third quarter of 2012.
In April, it received its Aquifer Protection Permit from the Arizona Department of Environmental Quality (ADEQ), with the total number of key permits received rising to six. The Clean Water Act Section 404 and Air Quality remained the only major permits yet to be approved, although the company expected to receive these by the end of 2012. By November, 90 percent of the company’s permitting process was complete, and the final issuance of the EIS and RoD remained.
In January 2013, the Air Quality Permit was received, with only the Clean Water Act Section 404 Permit from the USACOE remaining. Augusta expected to receive this permit when the RoD on the Plan of Operations from the USFS was given. The company expected to start production in the summer of 2013. The company had, by this time, signed off-take agreements for nearly 70 percent of its projected mine output.
The final EIS and draft RoD were published in December 2013, two years later than intended, with objections to be filed by February 2014. With extensive comments and objections received to the final EIS, the
TABLE 2 CHANGES TO ROSEMONT COPPER MINE FEASIBILITY STUDIES
2007 2009 2012% Change
between 2007 and 2012
Mineral Production
Cathode (klb) 113,960 155,514 -
Copper (klb) 3,909,600 4,077,220 5,108,580 31
Gold (koz) 262 300 354 35
Silver (koz) 47,899 50,081 59,958 25
Molybdenum (klb) 81,000 95,016 112,680 39
Total Revenue ($ 1000) 13,133,132 13,028,594 19,216,579 46
Initial Capital Costs ($ 1000) 916,806 990,403 1,253,844 37
Operating Costs ($ 1000) 4,336,278 4,679,882 7,149,473 65
Pre-production Cost ($ 1000) 68,482 48,068 116,100 70
Reclamation Bond Fee ($ 1000) 17,956 18,974 11,043 -38
Reclamation Expenses ($ 1000) 23,941 25,298 34,657 45
Source: based on NI-401 Technical Reports issued by the company in 2007, 2009, 2012. Accessed via <www.SEDAR.com>

www.SNLmetals.com | 13Permitting, Economic Value and Mining in the United States
Regional Forester required more time than the 30-day period to draft his response. In May 2014, Coronado National Forest requested the U.S. Fish and Wildlife Service (USFWS) reinitiate formal consultation for the Rosemont Copper project to address issues of endangered species. The RoD would not be signed until the completion of the consultation.
In July 2014, Hudbay acquired control of Rosemont Copper from Augusta Resources (for $520 million), although its due diligence process reported that, “Hudbay believes Augusta’s management continues to be overly optimistic about the permitting timeline ... With Hudbay’s significant technical expertise and superior financial capacity, Hudbay believes it is better positioned than Augusta to advance the Rosemont Copper project through the final stages of permitting and into construction…”
In March 2015, litigation led to the revocation of Rosemont’s Air Quality Control Permit. As of this date, Hudbay lacks two major permits before it can move into construction, and still awaits the final RoD.
Three feasibility studies have been released for the Rosemont Copper mine, in 2007, 2009 and most recently in 2012. Each subsequent study has reassessed the mine operations, with resultant changes in production levels and revised estimates for costs of construction, production and revenues. Table 2 shows the changes in project plans in each subsequent feasibility study.
Between 2007 and 2012, as the project continued to wait for permits to be approved, the company’s mine plans changed. In terms of production, the most notable change is the removal of cathode production—a value added product from copper concentrate. Total projected revenues from the project rose by 46 percent, between 2007 and 2012. However, the initial capital costs to construct the project increased by 37 percent and the operating costs by a further 67 percent over the same time. Pre-production costs increased by 70 percent, with estimates for reclamation expenses up by 45 percent.
Each of the studies states the construction period to be three years; however, the start of production is delayed from the original 2010 (in the 2007 study) to 2015 (in the 2012 study). Figure 4 shows the changes in projected cash flows in the technical studies published in 2007 and 2012. The flows have shifted outwards reflecting the delay in production.
This delay reduced the project’s current value. If the project had proceeded, as scheduled in 2010, the value of the project to investors was $18 billion in 2007.2 With the delay to 2015, the value of the project for investors has fallen to $15 billion in 2007, even though expected revenues for the project had increased (Table 2). The investors will receive their returns later than expected, and thus the value of the project for them is lower. What is not reflected in Figure 4 is the holding cost for the company, incurred between 2007 and 2015.
FIGURE 4 CHANGES IN PROJECTED CASH FLOW FOR ROSEMONT COPPER MINE
-2
0
2
4
6
8
10
12
$ Bill
ion
Study 2012 Study 2007
2007
2009
2011
2013
2015
2017
2019
2021
2023
2025
2027
2029
2031
2033
2035
2037
Source: based on NI-401 Technical Reports issued by the company in 2007, 2009, 2012. Accessed via <www.SEDAR.com>
2 at a discount rate of 8 percent
3. THE FINANCIAL COST OF CHANGEcontinued

www.SNLmetals.com | 14Permitting, Economic Value and Mining in the United States
TIMELINE – ROSEMONT COPPER MINE
1987-1988 Asarco purchased the copper reserves and 486 hectares of Arizona land without mineral potential for $1 million in cash and conducted assessment work.
1993 Asarco reported no near-term plans to develop the project but continued to conduct assessment work annually.
1998 In February, plans for the copper mine were on hold due to low copper prices. Asarco stated that it must spend money on current operations rather than on future development. The company planned on bringing Rosemont Copper on stream in 2012.
2005 In June, Augusta entered into an agreement to acquire Rosemont Copper for $20.8 million payable over three years. In September, a prefeasibility study on a 54,000-73,000 tons/day copper-molybdenum mine and milling complex and a corresponding technical report were planned for completion in the March 2006 quarter.
2009 Augusta received state approval of its reclamation plan at Rosemont Copper. As of February 2009, Augusta had received a 20-year groundwater withdrawal permit. The company required five other major approvals before construction could commence, including a reclamation permit, state aquifer protection permit, air emissions permit, and an USACOE Section 404 permit.
2011 Rosemont Copper submitted to the ADEQ an application for an Air Quality Permit. Rosemont filed a lawsuit against Pima Country over permit delays, for not meeting the 30-day timeframe after the county declared application complete.
2012 The project obtained the Aquifer Protection Permit from ADEQ. The USFS published a draft EIS open to public comments. More than 25,000 comments were submitted and all substantive comments were identified, coded and organized.
2013 Rosemont received the Air Quality permit for the Rosemont project from ADEQ. Fourteen individuals and groups sued County Superior Court against water quality permit.
2014 Surface Water Quality Mitigation Plan approved by ADEQ. This meant that Rosemont Copper received its Clean Water 401 certificate, which is required before the 404 certificate from the USACOE.
2015 Superior Court of Arizona Maricopa reversed ADEQ decision to approve the Air Quality Permit. The permit application was ordered to return again to ADEQ for further consideration using the proper criteria.
3.2 SCENARIO 2 - PRODUCTION LAGS In the second simulation, the production from the Enterprise mine is delayed by one year on each of three subsequent occasions. The production lag is based on real examples in the North American mining industry and is considerably less onerous than the delays suffered by some projects, for example the Kensington gold mine in Alaska. The capital and operating costs and assumed risk of the mine are left unchanged. The model assumes an annual 8 percent discount rate to value the future cash flows.
SIMULATED PRODUCTION LAGS
2019 There is a one-year lag in reaching commercial production, which now commences in 2019 rather than 2018. The total capital costs remain unchanged at $370 million, as does the timing of this expenditure (although in reality, a delay would likely cause capital costs to increase slightly). The delay reduces the project’s calculated value by 14 percent from $291 million to $250 million.
2020 There is a further one-year lag in the start of commercial production, which is now expected to start in 2020. This reduces the project’s value by a total of more than 27 percent from $291 million to $211 million.
2021 Production is now expected in 2021, with all other factors remaining unchanged. This reduces the project’s value by almost 40 percent from $291 million to under $176 million. This value represents 47 percent of the capital invested in the project, compared with the 79 percent envisaged in the Feasibility Study.
Table 3 shows the total revenue and investment for the project, which have not been changed in this model. However, the delay in production shifts the revenue stream for the project further into the future, while costs remain as they were. The current value of the mine’s cash flow declines for each consecutive year of delay.
3. THE FINANCIAL COST OF CHANGEcontinued

www.SNLmetals.com | 15Permitting, Economic Value and Mining in the United States
3. THE FINANCIAL COST OF CHANGEcontinued
TABLE 3 CHANGES TO TOTAL INVESTMENT AND MINE VALUE DUE TO DELAYED PRODUCTION
Total Revenue ($ million)
Total Investment ($ million)
Mine Value* ($ million)
Feasibility Study (2015) 2,020 370 291
2017 2,020 370 250
2019 2,020 370 211
2021 2,020 370 176
*Discount rate of 8%
Source: SNL Metals & Mining
These changes are less detrimental to the financial attractiveness of the venture than the extra-cost scenario in the first model. Although the total delay of three years in the start of commercial production reduces the project’s value by almost 40 percent, it is not, in itself, a fatal development. Figure 5 shows the changed cash flow profile as production delays are experienced, resulting in a delayed breakeven year for the project.
FIGURE 5 EFFECT OF PRODUCTION DELAYS ON CUMULATIVE CASH FLOW
-400
-200
0
200
400
600
800
1,000
2015
2016
2017
2018
2019
2020
2021
2022
2023
2024
2025
2026
2027
2028
2029
2030
2031
2032
2033
2034
2035
2036
2037
2038
2039
2040
$ Mill
ion
2015 2021
Later breakeven point
Source: SNL Metals & Mining
In more simplified terms, to gauge the value of the delay in revenue stream, we assume the total revenue received from the mine has remained unchanged at $2,020 million
over the life of the mine. The value of that revenue to investors is only $1,036 million, as they are received later rather than sooner.
For every year of delay, the revenue stream is pushed further into the future and its value is reduced.
Figure 6 illustrates the loss in value to investors. The pie represents the value of the total revenue initially expected from the project ($1,036 million). A one-year delay causes revenues to lose 7 percent of their present value. A two-year delay in production increases this loss to 14 percent of the expected value, and three years exacerbates this to 21 percent.3
Therefore, for every $100 in revenue, a one-year delay reduces the value to $93, a two-year delay to $86 and a three-year delay to $79.
A real life example of this cost is provided by the Kensington gold mine in Alaska, which suffered persistent production delays due to permitting issues. Originally expected to start in 1993, the mine finally began production in 2010. As the revenue stream for the mine has been pushed out further, its design has been changed to accommodate the delay in production.
FIGURE 6 LOSS IN CURRENT VALUE OF EXPECTED REVENUE FROM DELAYS
Expected Revenue
1 yr delay -7%
2 yr delay -14%
3 yr delay -21%
Source: SNL Metals & Mining
3 assuming a discount rate of 8 percent
TABLE 4 CHANGES TO KENSINGTON MINE OPERATIONS
Feasibility Studies Expected Production Capital Cost
($ million)Cash Production Cost
($/oz.)Mined Output
(million tons/year)Milled Output
(oz./year)
Initial Plan (1990) 1993 195 225 1.32 200,000
Final Plan (2006) 2010 290 302 0.44 135,000
Source: SNL Metals & Mining

www.SNLmetals.com | 16Permitting, Economic Value and Mining in the United States
CASE STUDY: KENSINGTON GOLD MINE – ALASKA
Location: 72 km north of Juneau, Alaska
Current owner: Coeur Mining, Inc. (100 percent)
Discovery: 1897
Planned production: 1993
Actual production: 2010 (June)
Source: SNL Metals & Mining
The Kensington gold mine has a long history of exploration, design changes and permitting revisions. The property was acquired from a Texas-based oil company for $20 million in early 1987, and an equal joint venture was established between the operator Echo Bay Mines and Coeur Mining. The latter acquired Echo Bay’s 50 percent interest in 1995 for $32.5 million plus a scaled Net Smelter Return royalty payment.
Production was initially expected to start in 1993; however, with permitting delays, the mine only reached commercial production 17 years after planned. Table 4 shows the difference the delay in production meant for operations.
The mine was originally slated to cost $195 million to construct, with production costs expected to be $225 per ounce. The mine would excavate 1.32 million tons of ore, with an expected gold production of 200,000 ounces per year.
By the time of the feasibility study for the final mine plan in 2006, production had been delayed to 2010. The capital cost for constructing the mine had increased by 49 percent to $290 million. In the years between the initial and the final study, production costs had escalated, and it would now cost 34 percent more to produce an ounce of gold than initially forecasted. In the 2006 plan, the company downgraded its intended production, reducing the size of the mined ore output by nearly one-third, resulting in lower gold production each year.
Kensington’s 17-year production delay can be a traced back to a number of permitting issues. The mining company required the following major permits:
• USFS approval for Plan of Operation (PoO);
• USACOE’s Section 404 for tailing impoundment construction;
• Environmental Protection Agency’s (EPA) National Pollutant Discharge Elimination System (NPDES) Permit for the discharge of waste water;
3. THE FINANCIAL COST OF CHANGEcontinued
TIMELINE – KENSINGTON MINE1987 Property acquired for $20 million and JV
formed.
1990 First permits sought.
1991 EIS completed and favorable RoD by USFS. Appeals lodged.
1992 EIS approved and “Major Mine” permit issued. Appeals lodged.
1993 Engineering optimization and drilling occurred. Company expected all permits by 1994.
1994 EPA issued positive Technical Assistance Report in November.
1995 Coeur bought Echo Bay’s 50 percent for $32.5 million and a scaled net returns royalty.
1996-2000 Low gold price led to write-downs totaling $128 million in 1998 and 2001.
2003 Mine plan optimized and Supplemental EIS sought.
2004 USFS approved Supplemental EIS, which was appealed.
2005 $50.2 million spent but legal challenges persist.USFS rejected appeal by environmental group.EPA gave National Pollution Discharge Elimination System Permit. USACOE gave 404 Wetlands Permit.Permits received from Alaska Coastal Management and Department of Governmental Coordination.Two environmental groups filed a fresh appeal, which was rejected. This concluded the administrative appeal process.
2006 $2.2 million drilling program identified significant additional resource potential.
2007 Spending reached $270 million, with a further $50 million needed.Despite legal appeals, new EIS Permit upheld by USFS. Permits for construction obtained, but production delayed by litigation over tailings permit.Construction continued on activities not impacted by the legal challenge.
2008 Legal challenges continued to delay construction work.
2009 U.S. Supreme Court reversed Court of Appeals decision invalidating permit.
USACOE re-activated 404 Permit, clearing the way for tailings construction.
2010 Began processing ore, with commercial production in July 2010.

www.SNLmetals.com | 17Permitting, Economic Value and Mining in the United States
3. THE FINANCIAL COST OF CHANGEcontinued
• City and Borough of Juneau (CBJ) Large Mine Permit; and
• Numerous minor permits for construction and operations.
The USFS did not approve the PoO until mid-1992, and even then, an “administrative” appeal was immediately filed. This alleged that the EIS did not satisfy the requirements of the National Environmental Policy Act (NEPA) due to inadequacy of the baseline data used to analyze the environmental impact and failure to adequately consider alternative methods of mining and waste disposal. The USFS rejected the appeal.
In September 1992, parties opposed to the project requested the USFS to withdraw its approval on the grounds that the plan was not complete at the time of approval. In November 1992, these grounds were also rejected by the USFS. In the same month, the CBJ approved the Large Mine Permit, but in April 1993, a group filed a state appeal against this approval.
In July 1995, in response to concerns expressed by the environmental community, the company decided to make limited changes to the project. This triggered the need for a supplemental EIS and the amendment of key permits. The key changes involved relocating the effluent discharge point from Lynn Canal to Sherman Creek to a point adjacent to the tailings impoundment and construction of a water treatment plant.
In September 1995, Coeur entered into an agreement with the EPA and the Alaska Department of Environmental Conservation for a permitting process timeline. Coeur expected to receive draft permits by May 1996 and the final permits two months later.
In February 1996, Coeur entered into an agreement with a coalition of environmental groups that eliminated a potential legal challenge by the groups to the Kensington project, and encouraged them to drop a mooted Supreme Court appeal. Under the agreement, Coeur provided additional environmental input while maintaining its permitting schedule.
The low gold price in the late 1990s led to write-downs totaling $128 million in 1998 and 2001. This resulted in the re-design of the mine plans, and so a Supplemental EIS was required. In late 2004, the USFS approved the Supplemental EIS, and an appeal was denied. Coeur expected to receive the remaining permits by mid-2005, with commercial production in 2006.
Further delays resulted in the company disclosing, in 2009, that litigation had contributed to an increase in capital costs, and that a write-down could be necessary should the expectation of the long-term price for gold fall below $750 per ounce (as of end-February 2009 the gold price was $937).
Mine production finally commenced in mid-2010.
3.3 SCENARIO 3 - ADDITIONAL RISKIn this simulation, it is assumed that the perceived risk of the Enterprise venture has increased because of lack of clarity on when permitting may be completed. This raises the discount rate that investors would use to assess the likely current value of their investment. The timing of the production and the capital and operating costs of the mine are left unchanged from those envisaged by the Feasibility Study.
SIMULATED ADDITIONAL RISKDue to delays in obtaining permits, it is seen as appropriate by the investors to lift the discount rate from 8 to 10 percent. This reflects investor uncertainty in the long-term viability of the project. The total capital costs remain unchanged at $370 million, as does the timing of this expenditure and the resultant cash flow from the mine.
This raised risk profile can be appreciated by looking at the proposed Twin Metals Minnesota underground copper-nickel mine project in northeast Minnesota, which is at a very early stage of development. Though the proposed project enjoys substantial local community and state elected official support, the project is also facing resistance from environmental organizations, even though the company has as yet to apply for any of its major permits.
CASE STUDY: TWIN METALS POLY-METALLIC MINE – MINNESOTA
Location: 18 km northeast Babbitt, Minnesota
Current owner: Antofagasta Plc. (100 percent)
Discovery: 1996
Planned production: Pre-feasibility stage
Actual production: Awaiting feasibility study and permitting
Source: SNL Metals & Mining
The Twin Metals Minnesota (TMM) project is, of this date, at a pre-feasibility stage, and is developing its Mine Plan of Operations (MPO). The property is wholly owned by Antofagasta Plc., which completed its acquisition of Duluth

www.SNLmetals.com | 18Permitting, Economic Value and Mining in the United States
TABLE 5 KEY PERMITS REQUIRED FOR TWIN METALS MINNESOTA PROJECT
Regulatory Requirement Jurisdiction Agency
Mining-specific Permits
Permit to mine State Department of Natural Resources
Federal Mine Plan Operations Federal Bureau of Land Management (with US Forest Service input)
Environmental Permits
National Pollutant Discharge Elimination System/State Disposal System for process water and storm water discharges
State Minnesota Pollution Control Agency
Federal Environment Protection Agency
Injection of underground fluid Federal Environment Protection Agency
Discharge of dredged and fill materials/wetlands conservation Federal US Army Corps Engineers/Environment Protection Agency
State Department of Natural Resources
Water appropriation State Department of Natural Resources
Public waters work permit State Department of Natural Resources
Dam safety State Department of Natural Resources
Air emissions control State Minnesota Pollution Control Agency
Federal US Forest Service/Environment Protection Agency
Resource Conservation and Recovery Act/solid waste storage State Minnesota Pollution Control Agency
Federal Environment Protection Agency
HV transmission line State Minnesota Public Utilities Commission
Gas pipeline State Minnesota Public Utilities Commission
Special use and road use permits Federal US Forest Service
Local Permits
Conditional use County
Building County
Source: Twin Metals Minnesota, Technical Report on Pre-Feasibility Study, October 2014
3. THE FINANCIAL COST OF CHANGEcontinued
Metals Ltd. in January 2015. The proposed underground mine is expected to extract copper, nickel, platinum, palladium, gold and silver. The current life of mine is expected to be 30 years, however, as more detailed studies take shape, the mine may well continue for a longer period.
Of the case studies highlighted in this report, TMM is at the earliest stages of the mineral development process. Having completed a prefeasibility study in mid-2014, the company is now in the process of reviewing and optimizing the preliminary mine plan, which will be followed by the development of an MPO for submission to the Bureau of Land Management (BLM) and the Minnesota Department of Natural Resources. Once the MPO development is submitted, it will automatically start the EIS
process. Major permits will be awarded on the basis of the findings of the EIS.
The project will be subject to NEPA at the federal level and the Minnesota Environmental Policy Act (MEPA) at the state level, with a number of federal and state agencies as well as tribal councils and local governments feeding into the review and consultation process. The TMM team has been conducting environmental studies and assessments of key environmental issues over the past five years and continues to gather and analyze data that will feed into the EIS preparation.
The EIS review process and RoD are expected to take years, with the company’s latest pre-feasibility study noting: “… environmental review and permitting [processes],
www.SNLmetals.com | 19Permitting, Economic Value and Mining in the United States
3. THE FINANCIAL COST OF CHANGEcontinued
including the development and issuance of an EIS is likely to take several years, and the final decisions regarding the EIS program and permits are subject to appeal. This could cause significant delays to the commencement of the project.”
Concurrently to the EIS process, as necessitated by NEPA and MEPA, TMM also plans to file applications for a variety of other federal and state permits (see Table 5 for a list of key permits).
While, in terms of time management and project resources, it is prudent to initiate other permitting processes, the impact the EIS and its findings have on the overall project timelines can be disadvantageous. The EIS process may take longer than projected by the mining company due to the need for more information from the company by federal agencies, time for stakeholder consultation and comments, the length of the review process and the need to respond to appeals filed against the findings of the EIS.
Furthermore, the findings themselves can require changes to the mine design, which in turn may require new permits to be issued.
As the company proceeds to develop its technical and feasibility studies, including information for the EIS, the prefeasibility study outlines estimated expenditures of $57-74 million over the next few years.
The environmental cost component is estimated to be the largest within these costs:
• Environmental studies: $35-40 million
• Drilling: $11-16 million
• Engineering: $6-8 million
• On-going pilot plant program: $5-10 million
So what economic impact does a long, complex, unpredictable permitting process have for a “young” project like Twin Metals?
By the end of 2014, Duluth Metals Ltd. (co-owners of the project pre-2015) had invested more than $250 million in the project, with its joint venture partner. Estimates in the prefeasibility study indicate the preliminary mine plan would require another $2.77 billion to be spent in developing and constructing the mine prior to mining operations. Over its projected 30-year mine life, the preliminary mine plan is estimated to require a total capital expenditure of $5.41 billion.
Estimates for the preliminary mine plan include 12 million labor hours during a three-year construction period and 850 full-time jobs when the mine is in operation. In addition, an estimated 1,700 to 1,900 indirect jobs for the region’s economy are expected to be created.
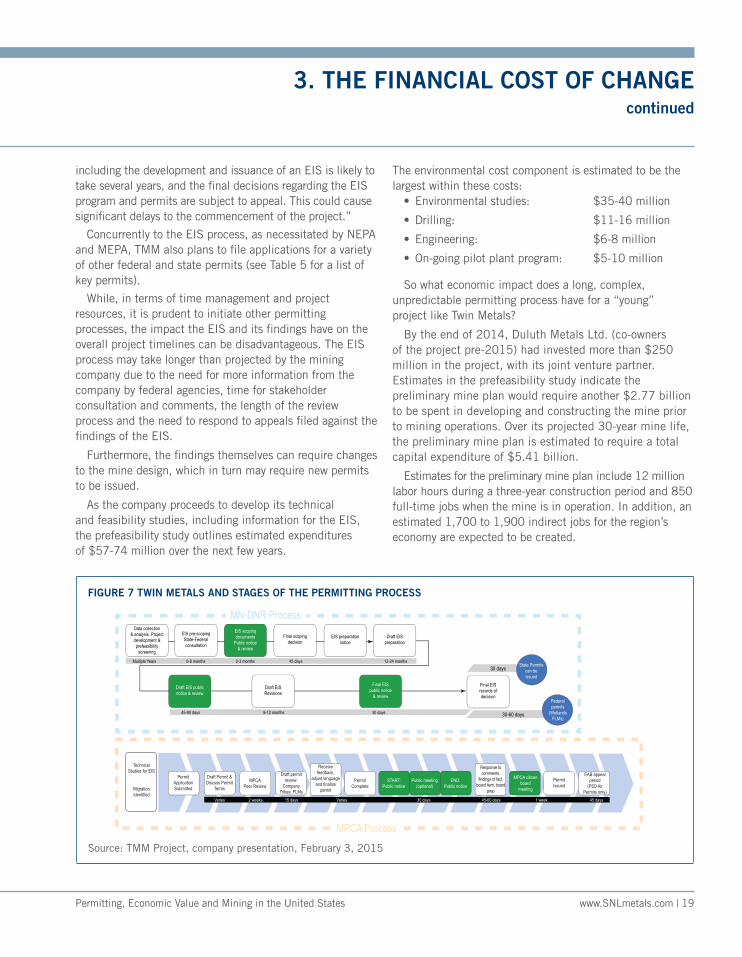
FIGURE 7 TWIN METALS AND STAGES OF THE PERMITTING PROCESS
DNR / MPCA
Public Input
Typical EIS & Environmental Permitting Process
Technical Studies for EIS
MPCA Process
MN-DNR Process
MigrationIdentified
Data collection& analysis. Project
development & prefeasibility
screening
EIS pre-scopingState-Federalconsultation
Final EISpublic notice
& review
Final EIS records ofdecision
Draft EISRevisions
Draft EIS public notice & review
EIS preparationnotice
Draft EISpreparation
EIS scopingdocuments
Public notice& review
Final scopingdecision
PermitApplicationSubmitted
Draft Permit &Discuss Permit
TermsMPCA
Peer ReviewPermit
CompleteSTART:
Public noticeEND:
Public notice
MPCA citizenboard
meeting
PermitIssued
EAB appealperiod
(PSD AirPermits only)
Public meeting(optional)
Draft permit review:
Company Tribes, FLMs
30-60 days
30 daysMultiple Years
Varies 2 weeks 15 days Varies 30 days 45-60 days 1 week 45 days
6-8 months 2-3 months 45 days 12-24 months
45-90 days 8-12 months 30 days
State Permits can be issued
Federalpermits
(Wetlands FLMs)
Response to comments,
findings of fact, board item, board
prep
Receive feedback,
adjust language and finalize
permit
Source: TMM Project, company presentation, February 3, 2015

www.SNLmetals.com | 20Permitting, Economic Value and Mining in the United States
3. THE FINANCIAL COST OF CHANGEcontinued
Given the early development stage of the TMM, the possible costs, incurred solely due to permitting delays, cannot be quantified. The company acknowledges environmental risks and permitting as business risks that are normal to the industry. It also acknowledges that there are no assurances that all permits and approvals required to proceed to construction and production will be obtained on reasonable terms and/or on a timely basis.
In speaking to the environmental legislation evolving in the U.S., the company expects stricter standards and enforcements to become more common, with increased fines and penalties for non-compliance, more stringent environmental assessments of proposed projects and a heightened degree of responsibility for the company.
In addition to TMM, Antofagasta Plc. has a number of other projects at various stages of development in Australia, Canada, Chile, Mexico and Portugal. As a public listed entity, the shareholder value for the company is important. The company, if faced with unmanageable delays to the Twin Metals project, may be required by its shareholders to prioritize other, less risky projects, where progress to construction and production is more likely to occur in a timely manner.
TIMELINE – TWIN METALS MINNESOTA PROJECT
2000 In April, Wallbridge completed an economic scoping study of the Nokomis deposit (renamed “Maturi Deposit” in 2012).
2006 In October, Duluth Metals began trading on the Toronto Stock Exchange after successfully completing its IPO and concurrent private placement for gross proceeds of C$11.65 million ($10.2 million), which would be used primarily to fund a two-phase exploration program on its Maturi Extension property.
2008 In January, a scoping study was completed on the Nokomis deposit (renamed “Maturi Deposit in 2012).
2010 Twin Metals Minnesota LLC founded as a joint venture of Duluth Metals Ltd. and Antofagasta plc.
2011 In April, Duluth Metals reported that the project was renamed the Twin Metals Minnesota Project, or “TMM,” and included the Nokomis deposit (renamed “Maturi Deposit” in 2012) and additional resources on newly acquired adjacent properties. A conceptual study was conducted.
2012 In late July, Twin Metals expected the capital investment to develop and build the TMM project to exceed $2 billion. Twin Metals submits a Special Use Permit (SUP) application to the USFS requesting access to federal lands in the Superior National Forest for the hydrogeology study.
2013 USFS starts preparing an environmental assessment under policies in the NEPA to review the SUP application. In October, USFS invites interested parties to provide comments to be submitted within one month.
2014 Prefeasibility study completed in June 2014.
2015 Antofagasta acquires Duluth and TMM.
4. OVERALL IMPACT OF DELAYS FOR REVENUE AND EXPENDITURE

www.SNLmetals.com | 21Permitting, Economic Value and Mining in the United States
The three scenarios for the Enterprise project isolate individually the impact of increased costs, production delays and the increased risk of the venture. In reality, all three scenarios are likely to occur together, generating a cumulative impact on the mine. The results from the three scenario models and the cumulative impact are illustrated in Table 6.
The combined scenario indicates that the changes in costs, mine production and risks would reduce the expected valuation of the mine to 51 percent of the amount as measured two years after the Feasibility Study. This valuation falls to 22 percent of the original in 2019 and only 6 percent of the predicted value in 2021.
These models contain realistic scenarios and illustrate that it is not necessarily any one set of adverse factors that can destroy the financial value of a mining project. Rather, it is likely to be the combined effect of increased costs, delayed cash flow and heightened perceptions of risk that can destroy the value of a project to investors.
TABLE 6 MODELED MINE VALUATION ($ MILLION)
Cost Rise1
Output Lag2
Project Risk3 Cumulative
Feasibility Study (2015) 291.4 291.4 291.4 291.4
2017 256.0 249.8 223.9 147.4
2019 209.4 211.3 223.9 65.4
2021 194.4 175.7 223.9 17.4
1 Additional environmental costs of $50 million, $70 million and $42 million in 2017, 2019 and 2021
2 One-year production delays (to 2019, 2020 and 2021)
3 Increased project risk causes a rise in the discount rate from 8 to 10 percent in 2017 and after
Note: In these models, the gold price and total mine revenue of $2,020 million was unchanged, as were the exploration, construction and operating costs.
Source: SNL Metals & Mining
To illustrate this impact, Figure 8 shows the cumulative net cash flow for the Enterprise project in the modeled scenarios.
FIGURE 8 CHANGES TO CUMULATIVE CASH FLOWS DUE TO DELAYS
-600
-400
-200
0
200
400
600
800
1000
2015 2017 2019 2021 2023 2025 2027 2029 2031 2033 2035 2037 2039
$ Mill
ion
Planned Flow Delayed Flow
Later breakeven point
Reduced reward (lower profit)
Extra risk (higher costs)
Source: SNL Metals & Mining
In the figure, the first cash-flow profile, “Planned Flow,” is when the Enterprise mine operates as scheduled. Costs are incurred during the mine development stage, when no revenue is available, resulting in negative cash flow. As the mine proceeds to production (2018 in this case), the cash flow position improves, and eventually becomes positive (2021 in this case) once the investment made in the early years has been recouped.
The second cash flow profile indicates what happens to the Enterprise venture when there are delays, higher costs and increased risk. Production now starts in 2021, rather than the originally planned 2018, and the company faces incremental costs and a heightened risk.
These changes result in the Enterprise venture seeing its worst-case annual negative cash flow increase by $153 million and its best-case annual positive cash flow reduced by $161 million. Overall, the mine generates a total cash flow of only $608 million, compared with the $770 million estimated in the original Feasibility Study.
Thus, there is a real financial cost to the company because of these modeled changes. This will have repercussions for the local economy, as well as secondary impacts for the U.S. mining sector as a whole. This, in turn, will affect the country’s minerals supply security.
4. OVERALL IMPACT OF DELAYS FOR REVENUE AND EXPENDITURE

www.SNLmetals.com | 22Permitting, Economic Value and Mining in the United States
5. MINING INVESTMENT ENVIRONMENT
As mentioned, there are two time-related issues with the permitting process: the first is length and the second is unpredictability.
When delays are longer than expected or become arbitrary, the effects go beyond the mining project itself. The mining company, which will normally be running multiple projects in multiple jurisdictions, may experience difficulties raising funds to advance its projects as the delayed project begins to weigh down on the company's stock market valuation. As delays continue, the project will increase the risk profile for the company, and investors can be expected to require a larger return to continue investing.
When planning project development, the mining industry generally assumes it will take one to six years to complete exploration, an additional two to four years for evaluation, two to four years for pre-development, and one to three years for construction. The normal permitting process extends over a two-year time period and is often run in parallel with technical planning. However, when the permitting process exceeds the time taken for the technical studies, to the extent the project is effectively on hold for permits to come through, it will have a negative impact on the mining project (see Annex B for details on mine project timelines).
The second issue relates to the unpredictability of the timeline for the permitting process. Project planning is most efficient where the time taken for the permitting process is known, even if it is longer than average. However, when the timeline becomes unpredictable or open-ended, project planning may become impossible.
A permitting process that appears to be “bogged down,” and takes longer than projected, increases the risk profile for the project. If investors associate the delay with the increased possibility the project may ultimately not proceed, or the delay will decrease the returns from their investment, they may re-evaluate their financial commitments to the project and withdraw their funds.
At any given time, there are a number of global mining operations competing for finance, and while the expected returns in the future from the delayed project may be high, the increased risk associated with the project will reduce its attractiveness. The mining company will be raising finance either through equity (stock markets) or debt (banks and other investor funds). A raised risk profile will increase the difficulty for the company in raising this finance. In finance-speak, the heightened project risk profile will increase the cost of capital.
The time taken to obtain a permit and the lack of certainty as to when these permits would be issued are often the result of overlapping requirements from different agencies, redundant reviews and multiple bureaucracies. Relative to Australia and Canada, which also have similar prospective geology, the U.S. mining sector appears to be slowing down. Between 2005 and 2014, the U.S.’s share of global exploration budgets has averaged at 8 percent, compared with Africa (16 percent), Australia (13 percent), Canada (14 percent) and Latin America (25 percent). The number of mines 4 starting production (including greenfield and brownfield projects) in 2005 through to 2014 was highest in Australia, 52 mines were commissioned in Canada, while the U.S. lagged at 39 (Figure 10). The next section provides a summary of the permitting process in the U.S.
4 Excludes coal and uranium
FIGURE 9 MINERAL EXPLORATION BUDGETS
0
500
1,000
1,500
2,000
2,500
3,000
3,500
2005 2006 2007 2008 2009 2010 2011 2012 2013 2014
$ Milli
on
Australia Canada USA
Source: SNL Metals & Mining
FIGURE 10 MINES STARTING PRODUCTION (2005-2014)
Australia Canada USA
0
5
10
15
20
25
2005 2006 2007 2008 2009 2010 2011 2012 2013 2014
Num
ber o
f sta
rtups
Source: SNL Metals & Mining

www.SNLmetals.com | 23Permitting, Economic Value and Mining in the United States
The purpose of the permitting process for any mining activity is to avoid, limit, control or offset the potential environmental damage that can occur where such activity takes place. For a major mining project on federal lands, for example, 30 or more federal, state and local regulatory programs may apply.
There are a range of permits and authorizations required within the U.S., granted by federal, state and local authorities. These include the following federal requirements:
• U.S. EPA Clean Air Act Permit • U.S. EPA Clean Water Act Section 502 (discharge)
Permit• U.S. EPA Safe Drinking Water Act (UIC) Permit • USACOE Clean Water Act Section 404 (Dredge and
Fill) Permit • USACOE Rivers and Harbors Act Section 10 Permit• U.S. DOI or FS Plans of Operations • Appropriate Federal Agency Completion of the National
Environmental Protection Act process• Appropriate Federal Agency Completion of National
Historic Preservation Act Section 106 Consultation • USFWS Endangered Species Act Consultation
An accurate assessment of mining project delays, therefore, does not end with the length of time to obtain the “mine permit” or “plan of operations approval,” but must include a broader look at the other permits or authorizations needed.
The permits required for a mine to proceed from development through to construction, start-up, operations and finally reclamation, can be categorized into four groups:
Environmental permits: Most major mining projects will require multiple permits pursuant to federal environmental or land use laws. Many of these laws trigger preparation of some type of environmental analysis, usually an EIS, pursuant to NEPA. EIS-based permits relate to the impact of the operations on the environment and consider alternative cases and develop mitigation plans. The RoD at the end of this process that will determine whether major permits are granted to the company.
Various development and operational permits: These can include federal and state permits for exploration activity, infrastructure required for the mine site (roads, power lines, gas supply, etc.), radio communication licenses, surface and access rights to the land and building and sewage permits.
Reclamation bonding: Reclamation bonds are a written contract to guarantee that lands disturbed by mining activities will be reclaimed, and must be for the minimal amount the BLM has calculated as the reclamation cost estimate for a plan of operations.
Reclamation related activities: A mine-land reclamation permit is associated with the activities at the end of the mine life. These permits tend to differ across states, but the general function is to review and assess reclamation costs and plans, to review deactivation and closure plans and to evaluate operations for reclamation.
Authorizing agencies: The main authorizing agencies for granting permission for a “Plan of Operations” (mining permit) on federal lands are the BLM and the USFS. The lead agencies will associate with a number of other agencies in reaching their final decision, which include, but are not limited to, the EPA, USFWS, National Park Service, and historic preservation offices.
NATIONAL ENVIRONMENTAL POLICY ACT The National Environmental Policy Act (1969) requires the integration of environmental values in the decision making of federal agencies. It does this by considering both the impacts of their proposed actions as well as reasonable alternatives to those actions. The timeline for NEPA associated with a plan of operations is generally considered the longest part of the mine permitting process. As found by the National Academy of Sciences (NAS)5, it is often the lack of coordination by all relevant agencies that results in excessive delays. In its 1999 “Hardrock Mining on Federal Lands” report, the NAS found “the lack of early, consistent cooperation and participation by all the federal, state and local agencies involved in the NEPA process results in excessive costs, delays and inefficiencies.”
The permit process (when involving EIS) will go through the following three phases:
• Scoping, which identifies significant issues and the scope of the EIS;
• Draft EIS and solicitation comments; and
• Draft the Final EIS and issue a public notice of its completion.
Within the NEPA process, the agency needs to consider all public comments made on the EIS, determine the least environmentally damaging practicable alternative and
5 National Academy of Sciences Report, pg. 111.
6. LICENSING AND PERMITTING IN THE UNITED STATES

www.SNLmetals.com | 24Permitting, Economic Value and Mining in the United States
FIGURE 11 EIS PROCESS IN THE U.S.
Develop pre-plan Notice of Intent Scoping
Alternativedevelopment &environmental
analysis
Prepare draft EIS Notice of availability Circulate draft EIS Public comment onDEIS
Respond tocomment and selectpreferred alternative
Prepare final EIS Notice of availability
30 day wait period Record of decision Notification ofavailability
Circulate FEIS
Source: BLM Manual, 2008
6. LICENSING AND PERMITTING IN THE UNITED STATEScontinued
mitigation of impacts. The lead agency will then announce a RoD that permits or denies the continuation of the project. All necessary permits are obtained or denied on the basis of the Final EIS and the RoD. No comments are solicited on the RoD.
It should be noted that NEPA is not the decision making-authority for the permits, it is the disclosure authority. Other statutes provide the basis for making the “decision” based on the NEPA analysis.
The completion of an EIS is not to be taken as assurance of being granted permits, although it will often be used as the basis for the granting of such permits.
HOW LONG DOES THE NEPA PROCESS FOR A PLAN OF OPERATIONS TAKE?On average, the NEPA process for plans of operations, starting from the EIS pre-scoping stage, can take between
three and five years. However, the draft and final stages of the EIS can require more studies to be undertaken, mine plans to be re-organized in light of the findings, and more time requested for consultation and analysis. In the U.S., the process can take more than seven years. When accounting for the other permits major mining projects require, the timeframe for obtaining all necessary permits to operate can easily exceed 10 years.
According to the Council on Environmental Quality’s regulations6, for a project to progress from notice of intent to prepare an EIS to a RoD, the NEPA comment and review requirements can be fulfilled in approximately six months. In practice, this process has been known to take anywhere from 18 months to eight years.
6 40 CFR § 1500

www.SNLmetals.com | 25Permitting, Economic Value and Mining in the United States
TABLE 7 AVERAGE TIMEFRAME FOR NEPA PROCESS FOR PLANS OF OPERATIONS IN THE U.S.
Stage Time Frame
Data collection and analysis
Project development and prefeasibility screening Multiple years
EIS pre-scoping
State/Federal consultation 6-8 months
EIS scoping documents
Public notice and review 2-3 months
Final scoping decision 45 days
EIS preparation notice
Draft EIS presentation 12-24 months
Draft EIS public notice and review 45-90 days
Draft EIS revisions 8-12 months
Final EIS public notice and review 30 days
Final EIS and RoD
State permits can be issued
Federal permits can be issued
30 days
30-60 days
Furthermore, the company must often change mine designs as a requirement of the permitting process, forcing agencies to re-evaluate the new mine plan and resulting in extended time periods spent on the EIS. The process was described by the Arizona Mining Permitting Guide (2011)7 as, “… extremely inefficient, confusing and frustrating for mining companies and agencies alike.”
In summary, U.S. mining projects require multiple permits and multiple agency involvement, as well as involvement of other stakeholders, including local indigenous groups, the general public and nongovernmental organizations. Mines located on federal lands must seek approval from the relevant federal land management agencies. This requires preparation of the appropriate level of environmental analysis pursuant to NEPA. NEPA analyses, which in and of themselves generally involve multiple agencies and many stakeholders, are often the lengthiest step in the
7 http://www.blm.gov/style/medialib/blm/az/pdfs/3809.Par.10193.File.dat/az-mine-permit-guide.pdf
permitting process due to a lack of agency co-ordination and unconstrained timeframes.
Additionally, even if a mine is located entirely on federal land, it will be subject to state laws and regulations and will therefore need to obtain multiple state permits (e.g. air and water quality permits). Alternatively, a mine located entirely on state or private lands frequently will need to obtain federal permits that trigger NEPA environmental analyses (i.e., Clean Water Act 404 Permit issued by USACOE). Even a mine that requires no federal permits may not escape a lengthy NEPA-like process as several key mining states have adopted a state equivalent of NEPA. The sheer number of permits required and the lack of coordination among the relevant agencies results in a seven to 10-year permit timeframe for mining projects in the U.S.
THE FUNCTIONAL EQUIVALENCE DOCTRINEThe National Environmental Policy Act (1969) requires federal agencies to consider the environmental impact of major actions that significantly affect the environment, including federal actions for the permitting and approval of mining activity.
Approval of major mining permits for activities on federal lands largely falls under the remit of the BLM and USFS. These federal permits assess environmental concerns, including air and water quality, wildlife and land degradation; similar to environmental assessments required to be undertaken under the NEPA process. The federal permitting process, therefore, independently includes environmental considerations and performance standards that are functionally equivalent to the NEPA process.
Functional equivalence doctrine assumes that as long as an agency’s environmental assessment satisfies the primary goal of NEPA, formal compliance with NEPA is not necessary. However, this equivalence is not being applied to the permitting decisions of the main permitting federal agencies (BLM, USFS).
Increased recognition of this functional equivalence doctrine, would eliminate duplication of efforts across agencies, and save both time and resources. An exemption, granted through legislation, would modernize the NEPA review process, streamline the permitting process and encourage the more effective and efficient use of federal resources.
6. LICENSING AND PERMITTING IN THE UNITED STATEScontinued

www.SNLmetals.com | 26Permitting, Economic Value and Mining in the United States
7. HOW LONG DO PERMITS TAKE IN OTHER COUNTRIES?
The environmental permitting process is based on information gathered over a period of time and by its nature, cannot be limited to a few months. Studying the mine site and its adjacent properties, as well as establishing baseline data can take up to two years. However, these factors in themselves do not account for the permit delays seen in the U.S. Other countries, such as Australia and Canada, who also maintain stringent environmental standards for their mining sectors, have efficient processes in place, which limit permitting processes to around two years.
7.1 AUSTRALIAAustralia, at the federal level, does not have a fully integrated permitting regime. Each project is individually assessed; its location and operational plans will determine what (if any) permits are required and whether these need to be granted by state or federal agencies.
Development, environmental and heritage permits are likely to be required by all proposed mining operations. However, in most Australian jurisdictions, a single permit or awarding authority may govern a number of relevant environmental concerns, such as noise, air, water and waste for each proposed mine operations.
The Environmental Impact Assessment (EIA), which is equivalent to the EIS in the U.S., is carried out by the mining company itself — unlike in the U.S. — and it is submitted to the relevant state or federal agency. In the U.S. an applicant may fund the lead agency for the assessment to be conducted and most companies will choose to do so to speed up the process. Once an EIA has been submitted in Australia, the relevant minister or delegated decision-maker informs the mining company if its project may or may not proceed. Appeals may be filed against the findings of an EIA.
Once the minister has made a decision, other decision-making authorities can grant their own approvals and issue permits. This is similar to the RoD process under NEPA in the U.S.
In terms of permitting times, each project will differ in Australia but, as a general rule, these permits are obtained much more quickly than in the U.S. For example, in Western Australia, the Department of Mines and Petroleum (DMP) for Mining Environmental Approvals has a target of 30 working days for assessing an exploration or mining proposal.
The DMP may seek advice from other agencies for these assessments. While these timelines will generally be negotiated, depending on the nature of the advice requested, the department aims to conduct such consultations within 20 business days. In addition, when the department needs to consult internally, for example when the Environment Division may seek geotechnical advice from the Resources Safety Division, such consultation is expected to work in parallel to the overall approval timeline.
In Queensland, an “environmental authority” is required when applying for a resource permit. One department, the Department of Environment and Heritage Protection (EHP), is the issuing agency for this permit as opposed to differing agencies in the U.S. The EIS process in Queensland is very similar to that of the U.S., except for the distinction of the EIS being prepared by the applicant and not the state/federal agency. In addition, the guidelines provided to the applicant state that the EIS must be prepared within a maximum time limit of 18 months (unless an extension is granted), whereas in the U.S. this is considered the minimum time for preparation of an EIS.
Australia continues to seek opportunities to improve its permitting process. As an example, in late 2013 the Australian Productivity Commission released a set of reforms with a roadmap to reduce the complexity and improve the efficiency of its environmental assessment and approval process for major infrastructure projects, including mines.
7.2 CANADAWithin Canada, each state maintains its own environmental permitting regime, with different regulations governing air, land and water discharges. In some cases, there may be integrated regulations.
An EIA is required for all major mining projects, although the scope of the EIA may differ across states. Final approval from the Canadian Environmental Assessment Agency (CEAA) is required, before a project can proceed. All other permit approvals, whether state or federal, are subject to the CEAA approval. In Canada, like Australia, the EIS is prepared by the applicant and the assessment is carried out by the CEAA. As with the U.S., time is allocated for consultations and feedback from stakeholders between the draft and final submissions of the EIS.

www.SNLmetals.com | 27Permitting, Economic Value and Mining in the United States
TABLE 8 KEY MILESTONES FOR THE ENVIRONMENT ASSESSMENT
Milestone for Hardrock Deposit (Gold) Lead Timeline/ Completion Date
1 NoC on CEARIS CEA Agency June 13, 2014
2 Public and Aboriginal group comment period on the draft EIS Guidelines CEA Agency June 13, 2014 – July 13, 2014
3 Finalize the EIS Guidelines and provide to the Proponent CEA Agency July 14, 2014 – August 5, 2014
4 Submit the EIS and EIS Summary Proponent To be determined by the Proponent
5 Perform conformity check of the EIS CEA Agency Day 45-51 (7 Days)
6 Public and Aboriginal group comment period on the EIS summary CEA Agency Starting between day 52 and 76 (for a duration of 30 Days)
7 Review and provide comments on the EIS to the CEA Agency Fas Day 52-91 (40 Days)
8 Review and provide information requests on the EIS to the Proponent CEA Agency Day 52-109 (57 days)
9 Submit response to information requests Proponent To be determined by the Proponent
10 Review and provide comments on the additional information to the CEA Agency Fas Day 110-139 (30 Days)
11 Review and provide information requests on the additional information to the Proponent CEA Agency Day 110-144 (35 Days)
12 Prepare the draft Environmental Assessment Report (EAR) CEA Agency Day 145-225 (81 Days)
13 Public and Aboriginal group comment period on the draft EAR CEA Agency Day 226-255 (30 Days)
14 Review and provide comments on the draft EAR to the CEA Agency Fas Day 226-260 (35 Days)
15 Finalize the EAR and submit to the Minister CEA Agency Day 261-335 (75 Days)
16 Minister makes EA decision Minister Day 336-365 (30 Days)
17 Issue and post the Minister’s EA decision statement on the CEARIS CEA Agency Day 365 (0 Day)
CEA: Canadian Environmental Assessment AgencyCEARIS: Canadian Environmental Assessment Registry Internet Site EAR: Environmental Assessment ReviewFA: Federal authoritiesNoC: Notice of Commencement
Source: The Canadian Environmental Assessment Agency
Unlike the U.S., the schedule for the federal review process, the roles and responsibilities for each agency and timeline-based targets are agreed to and published at the start of the application process. Therefore all parties involved have a predictable time schedule by which approval/denial of the required permits is expected. The timelines for the federal review state that the assessment, from the posting of the Notice of Commencement (NoC) on the Canadian Environmental Assessment Registry Internet Site (CEARIS) to the Minister of the Environment’s EIA decision statement about whether the project is likely to cause significant adverse environmental effects, need to be completed in 365 days (although exemptions may apply).
As an illustrative example, Table 8 shows the project agreement for a gold mine in Ontario (other agreements
reviewed tend to have a similar schedule). The timeline/completion dates for the federal agencies are very clearly outlined within this agreement; the only time periods not determined are for submissions to be made by the mining company itself. Therefore, any delays in the permitting process are more likely to be the responsibility of the mining company rather than the federal agency. In contrast, the timeline for publishing an EIS in the U.S. is firmly in the hands of the federal agencies.
In addition, the Canadian government continues to seek ways to improve its permitting process. For example, in 2012 Canada announced its “one project, one review” system for review of major projects by recognizing provincial processes as substitutes or equivalents to federal ones as long as they meet the requirements under the Canadian Environmental Assessment Act.
7. HOW LONG DO PERMITS TAKE IN OTHER COUNTRIES?continued

www.SNLmetals.com | 28Permitting, Economic Value and Mining in the United States
8. SUMMARY
Mining activity and its impact on the environment are legitimate concerns for governments. Responsible mining companies realize the importance of minimizing detrimental impacts on the environment and endeavor to plan their businesses accordingly.
However, cumbersome and unpredictable permitting processes significantly reduce the financial benefits generated by mining activities, in turn reducing the overall benefits of mining to the national economy.
This report has quantified the financial costs to mining companies when third-party changes to feasibility reports result in higher construction costs, delayed production and increased risk profiles.
Value is lost when:
• A project is required to increase spending to meet unexpected permitting requirements;
• Unexpected permitting requirements cause production delays; and
• Such impacts result in a higher perceived risk profile for the project.
A combination of these factors can lead to a project’s value being effectively reduced to zero.
The three case studies presented in this report, for Kensington gold, Rosemont Copper and Twin Metals poly-metallic mines, show that permitting delays have caused, or have the potential to cause, substantial erosion of the value of these projects.
The collective impact on the mining sector is also reflected by the state of the U.S. mining industry and project pipeline relative to the rest of the world. While in exploration and early-stage development, the U.S. has a good standing, as shown, but is falling behind Canada and Australia in the number of mines starting up in recent years.
Like the U.S., the environmental permitting process in other developed world mining countries, such as Australia and Canada, is very stringent. These countries also require consultation with local communities and give stakeholders the right to raise objections and appeals. However, in both countries, the processes for obtaining permits are swifter than those observed in the U.S.
This stems from a number of issues, mostly linked with the process itself rather than lax regulations. The timeline for the government to respond is more clearly outlined, the specification of lead agencies is clearer and the responsibility for preparing a well-structured EIS document is given to the applicant, rather than the government. Therefore, the mining company has equal responsibility in ensuring a timely permitting process.
Current U.S. mineral production is reliant on maturing mining projects. While the project pipeline is strong for early stage projects, a bottleneck exists, slowing the progression to full functioning mines. For the U.S. to maintain security of supply in the future, it needs to address this bottleneck. Ensuring environmental permitting timelines are not longer than necessary, or subject to unexpected delays, while upholding strong environmental standards is entirely possible.

www.SNLmetals.com | 29Permitting, Economic Value and Mining in the United States
ANNEX A: MODELING A GENERIC MINE
Enterprise has been set up as a mid-sized gold mine in the U.S. The following fixed input values are assumed for the simulations in section four:
Fixed Input Values:
• Recoverable gold - 2.0M ounces
• Mined ore - 1.3Mt per year
• Metal output - 200,000 ounces per year (50 percent in first and last years)
• Mine life - 11 years
• Total cash costs - $400 per ounce (but higher in first four years)
• Exploration - $30 million
• Construction - $250 million (12.5 percent of total gold revenue)
• Sustaining capital - $20 million (10 percent of annual gold revenue)
• Received gold price - $1,000 per ounce
• By-product revenue - 1 percent of gold revenue
In modeling the impact of delays for Enterprise, none of the internal factors or non-specific external factors have been varied. The assumed exploration expenditure, construction cost for the mine itself, unit extraction costs, ore grades, mill throughput (and so metal output), sustaining capital (including equipment purchases) and received metal price have not been varied.
These unchanged input values are based on a typical medium-sized gold deposit and average metals production but lower than average construction, operating and sustaining costs. This is specifically designed so as not to make the project unreasonably vulnerable to additional costs introduced by the modeled changes.
A discount rate of 8 percent has been used to determine the net present value (NPV) worth of cash flows and revenue and is typical for the rate used in many of the technical studies for U.S. mining operations.
Factors that have been varied in the model are the external ones that are site specific. These are reflected in three separate generic models:
1. Incremental costs – Additional costs to meet unexpected permitting requirements are incurred but production is not delayed.
2. Production lags – Development time for the mine is extended, due to unexpected permitting delays, so production is “on hold.”
3. Additional risk – Prolonged delays/protests lead to changes that affect the calculation of the mine's value.
Each model is flexed at several time periods by only altering the one set of factors. These three separate models are then combined into a single model to illustrate the impact of all three sets of changes. This impact is illustrated by graphing the cumulative cash flow from the operation and by tabulating the impact on the NPV of this cash flow (i.e., the current value of future income).

www.SNLmetals.com | 30Permitting, Economic Value and Mining in the United States
ANNEX B: EXPENDITURES AND REVENUES BY PROJECT STAGE
To understand the economic and financial impact of delays within a mining project, the table outlines the typical costs and revenues for a medium-sized, hypothetical mining project. The earlier stages will overlap to a certain extent and will tend to occur in parallel over time.
A mining project, from exploration to mine closure, goes through a number of stages, each with a different expenditure and revenue profile. The projected schedule for a particular mine will differ from this average depending on the size, location and complexity associated with the project.
A mining project may change hands during these stages, with exploration and junior mining companies often owning projects in the initial exploration stages, and with medium and larger mining companies acquiring projects and developing them further into the post feasibility stages.
TABLE AVERAGE EXPENDITURES AND REVENUES BY MINING PROJECT STAGE
Project StageElapsed Time
(years)Typical Expenditure
Range ($ million) RevenuesInitial Exploration 1 - 2 15 - 50 None
Advanced Exploration
5 - 6 25 - 100 None
Environmental Studies
7 - 9 10 - 30 None
Prefeasibility Study 7 - 9 5 - 15 None
Feasibility Study 9 - 11 10 - 40 None
Permitting 10 - 14 10 - 30 None
Financing 11 - 14 - None
Construction 13 - 16 Construction costs None
Operation <10 Sustaining capital Revenue stream
Payback period 2-5
Closure 1 None
Post-closure monitoring
>10 Reclamation & monitoring costs
None
Source: SNL Metals & Mining
Starting with initial exploration, an exploration company may spend $15-50 million over a two-year period. This focuses on examining surface mineralization by means of mapping, geochemistry and geophysics. The aim is to locate a promising mineralized area for further exploration activity.
If a promising mineralization is indicated, detailed exploration activity is carried out, requiring an intensive drilling and sampling program to understand the orebody. On average, such activity might take around four years, with expenditure of $25-100 million. Exploration/mining companies will also start collecting environmental data at
this time to start establishing baselines for future studies. These studies can take around six years and cost in the region of $10-30 million.
With suitable resources identified, a prefeasibility study is prepared. This will include information on the property description and location, geological setting and mineralization, accessibility, local resources and infrastructure, drilling results and metallurgical testing, mineral resource estimates and mining methods, details on environmental studies carried out, permits required and social impact on communities. In addition, it will include estimates of capital and operating costs and economic analysis of the project. These reports can take two years or more to produce and can cost $5-15 million or more.
The prefeasibility study, when reflecting a positive outcome for the project, will then be developed further into a feasibility study, where the project information will be elaborated in greater detail and depth. More drilling activity will be undertaken for this stage, and data collection on the environment will continue. The feasibility study will normally be used to raise finance for the project; on average it takes two years to prepare and can cost $10-40 million.
The permitting stage, if things go to plan, should take about three years and costs $10-30 million. As the mining company moves to raise capital, whether internally (company resources) or externally (debt or equity financing), the status of the permitting process will weigh heavily on the terms of securing such finance.
Until this stage of the mining process, the exploration/mining company will have seen outflows of $75-265 million, without any offsetting revenue. When finances have been raised and all permits obtained, the mine can advance to the construction stage and finally into production. Mine construction is likely to take at least two years and a typical mine will then operate for a period of at least 10 years. Once production starts, the cash flow generated will allow the investors to recoup their investment. This “payback” period averages three to 10 years, depending on the mineral and metal prices. Once this payback period is complete, the inflows can generate profits or dividends for the owners.
At the end of a mine’s life, the company will ensure the closure of the mine site meets regulatory and legal requirements and will attempt to rehabilitate the mine site as close to its natural state as possible. A mining company is required to continue the monitoring of closed mine sites to ensure no further degradation of the environment takes place.

www.SNLmetals.com | 31Permitting, Economic Value and Mining in the United States
GLOSSARY
Cash flow
Cash flow is the incomings and outgoings of cash, representing the operating activities of an organization. It is usually measured during a specified, limited period of time. Measurement of cash flow can be used for calculating other parameters that give information on a company's value and situation.
Discount rate
The discount rate is the rate at which an investment’s revenues and costs are discounted in order to calculate its present value. Different discount rates give different present values and the larger the discount rate, the lower the value in today's dollars.
Drilling
Drilling is a cutting process that uses a drill bit to cut or enlarge a hole of circular cross-section in solid materials. The drill bit is a rotary cutting tool, often multipoint. The bit is pressed against the work piece and rotated at rates from hundreds to thousands of revolutions per minute.
Net present value
The net present value (NPV) of anything is the amount today that equates to a stream of values in the future. This is most commonly applied to financing, where the NPV is the present value of future cash receipts from an investment.
This value is determined by discounting back to the current time the future cash amounts. This discount rate will reflect the value of cash-in-hand compared with the promise of future returns, and will clearly rise if the investment becomes more risky.
Operating costs
Operating costs include expenditures incurred at the mine sites that are equivalent to direct operating expenses, including mining and processing, waste stripping and mine site general and administrative (G&A) costs, less production royalties, mining taxes and by-product credits for payable metals recovered.
Payback period
Payback period is the time in which the initial investment is expected to be recovered from the revenues generated by the investment.

Disclaimer
This report is based on information and data provided to SNL Metals & Mining by third parties. In performing its analyses and preparing this report, SNL Metals & Mining has relied upon the accuracy, completeness and fair presentation of all information, data, advice, opinions and representations provided to it from private sources. SNL Metals & Mining has not independently verified such information and has assumed that information supplied and representations made by respondents are substantially accurate.
No representation or warranty, expressed or implied, is made by SNL Metals & Mining as to the accuracy, completeness or fairness of such information and nothing contained herein is, or shall be relied upon as, a promise or representation, whether as to the past or the future. Neither SNL Metals & Mining nor any of its affiliates takes any responsibility for the accuracy or completeness of any of the accompanying material. SNL Metals & Mining’s maximal liability for whatever reasons is limited to total fee paid for this study.
To the extent that any of the assumptions or any of the facts on which this report is based prove to be untrue in any material respect, this report cannot and should not be relied upon. Possession of this report does not carry with it the right of publication.
This report may not be used for any purpose by any entity other than the National Mining Association (NMA) of the United States, to whom it is addressed, without SNL Metals & Mining’s written consent, and, in any event, only with proper written qualifications and only in its entirety. Neither all nor any part of the contents of this report shall be disseminated to the public through advertising, public relations, news, sales, or other media without SNL Metals & Mining’s prior written consent and approval. NMA is granted the right to use this report for public engagement as it sees fit.
The analyses, opinions and conclusions presented in this report apply to this assignment only and may not be used out of the context presented herein. This report is furnished solely for the use and benefit of NMA and is not intended to, and does not, confer any rights or remedies upon any other person, and is not intended to be used, and may not be used, by any other person or for any other purpose, without SNL Metals & Mining’s express consent.
Permitting, Economic Value and Mining in the United StatesPrepared for the National Mining Association
Report is published by
SNL Metals & Mining
PRODUCTION
Roxanne Daniel
SNL Metals & Mining
7 Birchin Lane
London, EC3V 9BW
Tel: +44 (0)20 7398 1839
Email: [email protected]
Website: www.SNLmetals.com
CONTRIBUTORS
Dr. Masuma Farooki
Dr. Chris Hinde
Mark Fellows
Asa Borssen
Olof Lof