Embed Size (px)
Citation preview

DEPARTMENT OF PHYSICS, UNIVERSITY OF JYVÄSKYLÄ
RESEARCH REPORT No. 13/2013
PERMEABILITY PROPERTIES OF PAPER MATERIALS
by MARKO RASI
Academic Dissertation for the Degree of
Doctor of Philosophy
To be presented, by permission of the Faculty of Mathematics and Natural Sciences
of the University of Jyväskylä, for public examination in Auditorium FYS1 of the University of Jyväskylä on December 17, 2013
at 12 o’clock noon
Jyväskylä, Finland December 2013
ISBN 978-951-39-5560-1 (paper copy) ISBN 978-951-39-5575-5 (pdf)
ISSN 0075-465X

2
CONTENTS
Permeability proprties of paper materials ........................................................................................... 1 INTRODUCTION ........................................................................................................................................ 5 1 BACKGROUND ........................................................................................................................................ 7
1.1 Wood material ...................................................................................................................................... 7 1.2 Fibre network........................................................................................................................................ 9 1.3 Pore volume .........................................................................................................................................10
1.3.1 Intrafibre pores .............................................................................................................................12 1.3.2 Interfibre pores .............................................................................................................................13 1.3.3 Response of porosity to compression ...........................................................................................16
1.4 Flow in fibrous media ..........................................................................................................................17 1.4.1 Experimental results for fibrous media .........................................................................................18 1.4.2 Experimental results for paper materials ......................................................................................19
1.4.2.1 Effects of fibre and stock properties ......................................................................................19 1.4.2.2 Effects of fibre web properties...............................................................................................20 1.4.2.3 Interaction of fibre web and pressing surface ........................................................................21 1.4.2.4 Interaction of fluid flow with fibre web .................................................................................22
2 MODELS FOR PERMEABILITY OF FIBRE NETWORKS .............................................................23 2.1 Simple models of permeability ............................................................................................................23 2.2 Three-dimensional models and images of fibre networks ...................................................................25 2.3 Simulation results ................................................................................................................................30
3 THE PERMEABILITY DEVICE ...........................................................................................................39 3.1 General structure of the device ............................................................................................................39 3.2 Main components ................................................................................................................................39 3.3 Hydraulic cylinder ...............................................................................................................................41 3.4 Pressing chambers ...............................................................................................................................41 3.5 Pressing surfaces .................................................................................................................................41 3.6 Water circulation .................................................................................................................................44 3.7 Transducer system ...............................................................................................................................45 3.8 Assembly of the device........................................................................................................................46
4 MEASUREMENT TECHNIQUES .........................................................................................................46 4.1 Techniques of thickness measurement ................................................................................................46 4.2 Surface contact of the sample ..............................................................................................................48 4.3 Techniques of pressure measurements ................................................................................................50
5 ACCURACY OF THE MEASUREMENT SYSTEM ...........................................................................54 6 MEASUREMENT PROCEDURE ..........................................................................................................55
6.1 Preparations .........................................................................................................................................55 6.3 Permeability as a function of fibre volume fraction ............................................................................56 6.4 Permeability as a function of flow velocity .........................................................................................56
7 CHARACTERISATION OF THE SAMPLES ......................................................................................57 7.1 Sample materials .................................................................................................................................57 7.2 Characterisation methods ....................................................................................................................57 7.3 Chemical and mechanical pulp ............................................................................................................60 7.4 Beaten kraft .........................................................................................................................................62 7.5 Fractionated TMP ................................................................................................................................64 7.6 Kraft- groundwood mixtures ...............................................................................................................66 7.7 Mixtures with non-wood materials ......................................................................................................68
8 RESULTS ..................................................................................................................................................70 8.1 Expressions for permeability results ....................................................................................................70 8.1.1 Measurement resolution and sample uniformity...............................................................................71 8.2 The effect of basis weight ....................................................................................................................81
8.2.1 Basis weight effect in the literature ..............................................................................................88 8.2.2 Conclusions concerning the effect of basis weight .......................................................................91
8.3 The effect of sample composition ........................................................................................................92 8.3.1 The effect of beating .....................................................................................................................92

3
8.3.2 The effect of mechanical pulp fines ..............................................................................................94 8.3.3 Mixture of chemical and mechanical pulp ....................................................................................96 8.3.4 Mixtures with non-wood materials ...............................................................................................98 8.3.5 Permeability of a press felt .........................................................................................................104 8.3.6 Summary of different sample compositions ...............................................................................107 8.3.7 Discussion with respect to previous results on paper permeability ............................................109
8.4 Permeability as a function of flow velocity .......................................................................................117 8.4.1 Conclusions on the flow velocity effects ....................................................................................128
9 CONCLUSIONS .....................................................................................................................................130 APPENDIX 1 .............................................................................................................................................131 APPENDIX 2 .............................................................................................................................................133 10 REFERENCES .....................................................................................................................................136

4

5
INTRODUCTION Fluid flow in a porous medium is important in a wide range of natural and man-made processes. For example, fluid motion in a fibrous web appears in many parts of the papermaking process such as forming of paper from a dilute suspension, and dewatering by mechanical pressing and drying. In principle, fluid flow in a porous medium can be described by general flow equations where the frictional flow resistance of the porous structure is traditionally given by Darcy -type interaction terms [Scheidegger57]. Darcy's law for an incompressible single-phase flow in a porous substance with negligible inertial and gravitational effects is given by
pA
Qhkhpkv
flow∆−=⇔
∆−=
µµ
, (1)
where the average fluid velocity is v = Q/Aflow, i. e. the volumetric flow rate divided by the cross-sectional area of the flow, ∆p is the fluid pressure difference, µ the dynamic viscosity of the fluid, h the thickness of the material, and k is the permeability coefficient of the substance. In Eq. (1), the permeability coefficient k includes all information about the complicated microscopic porous structure of the substance. Much experimental and theoretical work has been devoted to finding relations between permeability k and other macroscopic properties that characterise the porous medium. For some applications, such as those in geophysics, which mostly deal with granular materials of hard constituents, the permeability does not often vary much within a given porous material or even in a class of materials. This is in contrast with the behaviour of highly deformable paper webs, whose permeability may vary by several orders of magnitude due to mechanical compression and the associated reduction of porosity. The permeability properties of paper also vary significantly due to properties of fibres such as size, flexibility and surface structure. Also, the uniformity of the disordered fibrous web and interaction between fluid and fibres can affect the flow resistance. The effects of these factors on permeability can best be analysed experimentally. The large variations in the permeability of paper as a function of various parameters emphasise the complexity of the phenomenon. Further theoretical and experimental work is needed, since at the microscopic level our understanding of the mechanisms that affect the permeability of a disordered medium is limited. Because of advances in numerical methods, in modelling fibrous structures and, most recently, in imaging the real fibrous structures, realistic computer simulations have become possible. Experimental results in combination with simulations can further shed light into these mechanisms. The basic constituents of paper are the fibres which are originally wood cells. Compositions of fibre pulp as well as the manufacturing processes of paper are mostly dictated by the intended use and the quality requirements of the final product. However, many properties of the fibres and particles, and the structure of the network, also affect the permeability. Properties which affect the porosity of the material are necessarily important for permeability, but the distribution of the pore volume also has a large effect, and it may be an even more variable property than porosity. The external dimensions and coarseness of the fibres affect their number density in a sheet, and the wetted surface area between the solid and liquid fraction. In addition to the biological factors, pulping process and further treatments of pulp change the fibre properties in a complex manner. Furthermore, the flexibility and collapsibility of fibres, as well as the properties of fibre surface and presence of fines, affect the compactness of the sheet and therefore its pore structure [Niskanen98].

6
The formation of paper from pulp in a paper machine is usually accomplished by introduction of a jet of a dilute fibre-water suspension into a moving fabric or into a gap between two moving fabrics. A velocity difference between the suspension jet and the fabric will cause fibres to settle preferably in the machine direction due to shear forces in the zone between the suspension and the fabric. On the other hand, turbulence in the shear zone reduces the orientation anisotropy. In the resulting fibre web the long axis of the fibres are well aligned along the plane of the web, and somewhat more in the machine direction than in the cross-direction [Niskanen98]. During the whole manufacturing process, moving fabrics support the accumulating fibre web, while receiving water expelled from the web by the actions of gravity, vacuum and mechanical compression. The majority of the water coming from the headbox is already removed during formation. It is likely that this water is expelled mostly from voids between the fibres. During formation, long fibres probably settle quite rapidly due to numerous contacts with other fibres. Instead, small particles are generally assumed to be able to accumulate in the vicinity of the trailing surface due to their better mobility, while being carried by the expelling water. In mechanical dewatering, a significant amount of water is removed also from small pores in the fibre walls. This flattens the fibres and compresses the network so that, during wet pressing, its solids contents can approach 50 %. Fluid flow, induced by mechanical compression, is also known to compress the fibre web so that its density increases in the direction of the fluid flow [Szikla92]. Further drying of paper takes place mainly by evaporation, which also changes the structure of the web and fibres. The objective of this Thesis was to characterise the properties of the permeability device of the University of Jyväskylä, Department of Physics (JYFL), so as to develop a proper procedure for permeability measurements, and then to carry out reference measurements with the device. This Thesis consists of nine chapters. The background of the topic is treated in Chapter 1. This chapter includes the structure of fibres and pores in paper, and phenomena that are involved with fluid flow in paper. In Sections 2.1 and 2.2, permeability models introduced previously in the literature are briefly described, and in Section 2.3, previous and present results of simulations for fluid flow in paper are presented. Description of the experimental work carried out in this Thesis is divided into four main areas. First we give a detailed description of the techniques involved in the permeability measurements with the present device. This topic is treated in Chapters 3 – 6. Special attention is paid to the roughness of the contact surfaces facing the sample, since this has a strong effect on the results of measurements. Pressing surfaces are described in Section 3.5, and their effect on permeability in Sections 8.2.1 and 8.2.2. The second main area is the effect of the basis weight of the sample on its permeability. Basically, basis weight can affect the permeability of a sample of any composition, depending on the roughness of the contact surfaces. Therefore, this topic is also treated in Section 8.2, including comparison with previous results reported in the literature. The third area is accumulation of permeability data for different sample compositions, as measured with the present device. Altogether more than 20 different sample materials were studied. Most were paper grades with a varying composition or treatment of the pulp, but also a synthetic felt and papers with non-wood additives were studied. Sample materials are described in Chapter 7. Their permeabilities are reported in Section 8.3, including comparison with previous results reported in the literature, including numerical (also the present ones) and theoretical results. The fourth area is the effects on permeability caused by the fluid flow itself. Although such effects are usually tried to be avoided in the studies of permeability they are studied here, since the effects of flow velocity can be quite large and can occur at rather moderate velocities. This problem is treated in Section 8.4. Sections 8.2.2, 8.3.6, 8.3.7 and 8.4.1 of the Results chapter contain summaries and conclusions of the topics mentioned above. Finally, in Chapter 9, the overall conclusions of the study are drawn. The author of this Thesis did some improvements in the permeability device, its characterisation, all the measurements and their analyses, and their reporting (this manuscript). The author also analysed the results of the fluid flow simulations (has thus produced, e.g., Figs. 8, 9, 11 and 12)
7
1 BACKGROUND In this Chapter properties of wood fibres, pulps made of them, and the permeability related properties of the fibre networks composed of them, are briefly described. The porosity of and fluid motion in a fibrous network in particular are described in great detail. The ambiguities in the determination of porosity of paper and in its classification into intrafiber and interfiber porosities are recognised. Vulnerability of the wood fibre networks to deformation as a result of application of mechanical or hydrodynamic forces is also discussed. Thus, the significance of the inter-fibre porosity and the coverage of the fibre network, and their disorder induced variations, are emphasized.
1.1 WOOD MATERIAL Growing of a conifer takes place outwards in the cambium layer of living plant cells inside the bark, leaving mature, full-developed conifer thracheids on the inside. Thracheids are elongated in shape with angular cross-sections and layered and lignified cell walls. The thracheids are vertically aligned and attached to the neighbouring thracheids with lignin bonding, forming the stiff stem of the tree. Up to 95 % of the entire wood volume can be composed of thracheids. When wood thracheids are separated into loose fibres in the pulping process, they are the most important ingredients of the wood from a paper manufacturing point of view. Thracheids Wood thracheids are mainly composed of cellulose, hemicelluloses and lignin. These materials form a layered cell wall around the lumen, the hollow interior of the thracheid. Starting from the outside, the layers of the softwood fibre cell wall are the middle lamella (M), primary wall (P), the outer secondary wall (S1), the secondary wall (S2), and the tertiary or interior secondary wall (T). In layers from P to T cellulose molecules are arranged in ribbonlike fibrils or microfibrils, among the amorphous material which consists mainly of lignin and hemicellulose. The middle lamella M consists mainly of lignin and acts as a bonding between thracheids in the wood structure. The orientation of the fibrils differs in different layers of the cell wall. In layer P fibrils form a more or less random network, but in S1 two layers of fibrils are coiled in opposite directions, both orientated nearly perpendicularly to the long axis of the thracheid. In the S2 layer the fibrils are orientated into a right-handed helix. In the T layer the fibrils in many species form a left-handed helix. During the pulping processes, layer M is usually removed and the lignin-rich layer P can be partly removed. Of the remaining layers, secondary wall S2 is the most important one as for the fibre properties, since it contains most of the cellulose and comprises most of the thickness of the entire wall [Forgacs63]. Externally, a common property of all wood thracheids is their elongated shape, the length-to-width ratio being 50 – 100 [Niskanen98]. The largest perimeter of the fibre is in the middle, tapering towards the ends. Otherwise, most morphological properties of wood fibres vary widely depending on a number of factors: Specie, growth rate, age and maturity of the tree, general climate of its growth place and the season of the year. However, some regularities can be found in thracheid morphology when their geometrical shape is observed rather than the dimensions, and when distribution of the thracheid properties in the trunk is taken into account. In the long time scale the dimensions of softwood thracheids increase. The length of the Finnish pine and spruce thracheids and, to some extent, cell wall thickness, perimeter and cell wall density, increase with increasing cambium maturity. Therefore, the dry mass per fibre length, or coarseness, also increases with cambium maturity. The length and coarseness display the largest variation during ageing, both increasing with a factor of 2 to 4 within a century.

8
Fibres in chemical pulp In the pulping processes the original structure of natural wood is destroyed, basically due to separation of the wood tracheids as fibres of the pulp. In this context a fibre can be defined as an elongated pulp particle containing a recognisable tubular and layered structure of the parent thracheid. However, the pulping process, and other mechanical and chemical treatments, can significantly change the structure and properties of original tracheids. Two basic approaches for releasing the fibres are the mechanical and the chemical pulping process. In chemical sulphite or sulphate (kraft) cooking, heat and solvents dissolve the lignin that bonds the middle lamellae between the tracheids, causing an easier release of the fibres. Dissolving the lignin affects also the layers next to the middle lamellae, thinning the cell wall by up to tens of percent and loosening the layered structure of the fibre wall [Paavilainen93a]. Partial removal of the lignin-rich S1 layer allows water molecules to migrate between the fibrils, often causing dimensional expansion of the cell wall, i.e. swelling of the fibre in the cross-sectional direction. Pores in the fibre wall involved in the swelling are rather small, their hydrostatic radius being estimated to be in the nanometer scale [Maloney97]. Another consequence of chemical pulping is delignification of the S2 layer, which increases the flexibility of the fibre [Paavilainen93a]. A number of process parameters affects considerably the chemical and structural composition of the fibre wall, but to a large extent the layered and tubular structure of the parent thracheid is retained. Therefore, despite of pulping, the morphological variations in pulp fibres reflect those of the source wood. Smaller wood cells, e.g. parenchyma and ray cells, are often considered as the primary fines released by the pulping process, although the fraction of these particles can be only a few percent in chemical softwood pulp [Paavilainen93b]. Chemical pulp fibres are treated mechanically in beating process in order to provide better bonding. Beating causes shearing, bending and compressive forces on the fibres, introducing deformations at the fibre surface and inside the fibre cell wall. During beating, shortening of fibres occurs as well as peeling of material from the fibre wall, although changes in the cross-sectional dimensions are small [Paavilainen93a]. Occurrence of these effects greatly depends on the properties of the source fibres, cooking parameters, consistency of the suspension, and the type of beating machinery and its operating parameters [Ljungkvist83]. Fibrils are detached partially or completely from the exposed layers of the fibre wall, producing external fibrillation and fines, respectively. Delamination, or breaking of bonds between lamellas within the layered structure of the fibre wall, increases the fibre flexibility and tendency to collapse [Paavilainen93a]. Delamination also means that new small-scale pores are introduced in the fibre wall, increasing swelling of the fibres [Maloney97]. During the beating process, deformations propagate inwards from the outmost layer. First, the remains of layer P are detached as sheet-like particles, and next the thin S1 layer is delaminated and fibrillated. During the process a whole layer can eventually detach, contributing to the formation of fines. Delamination and fibrillation can propagate in the S2 layer, while the upper layer is still attached [Nanko89]. Secondary fines produced by beating generally have a fibrillar appearance, and they also have a considerable amount of small scale pores, which causes a high degree of swelling [Maloney98]. The percentage of small particles in chemical pulp, i. e. primary and secondary fines, usually remains relatively low, approaching 20 % only after excessive beating in the case of Finnish pine pulp [Paavilainen90]. Natural variation in the wood also affects the fibre response to mechanical treatment. External fibrillation and tendency to shorten are more substantial, and production of fines is much larger in thick-walled and narrow latewood pine fibres than in earlywood fibres [Paavilainen90]. However, after moderate beating, earlywood pine fibres are still about four times more flexible and about three times more collapsible (as determined by the aspect ratio of the fibre cross-section) than latewood fibres [Paavilainen93a].

9
Fibres in mechanical pulp In mechanical pulping heat and mechanical work are used to soften the bonding lignin between the tracheids and to shear the fibres off from the wood structure. Again, the actual method and the process parameters affect considerably the composition of particles that are formed [Forgacs63]. In the grinding process fibres are mainly separated from wood perpendicularly to the axis of the fibres, so that short fibres are produced with considerable deformation in their fibre walls. Groundwood (GW) pulps are produced in this way. Instead, in refining process shearing occurs more randomly in all directions so that fibres are mainly detached along the axis of the fibre, which produces longer and more intact fibres than the grinding method. Thermomechanical pulps (TMP) are produced in this way. In addition to whole fibres, considerable numbers of individual fibrils, bundles of fibrils, pieces of fibre wall and pieces of fibre are also produced. Three distinct morphological groups can be distinguished amongst the constituents of mechanical pulps. One of the groups is whole fibres, which retain the structural properties of the parent thracheids. Generally, mechanical fibres are considered to be considerably stiffer longitudinally than the chemical fibres. Of mechanical fibres, those manufactured by refining are generally longer and less damaged [Reme98]. In Scandinavian spruce TMP, c. 45 % of the fibres have an unfibrillated surface, c. 40 % have a fibrillated surface, and c. 5 % have a fibre wall split or cracked after refining [Koljonen95]. In groundwood fibres, c. 30 % of the fibres have a split fibre wall [Reme98]. Fibres of mechanical pulp also have small scale pores in the fibre wall, although in refined spruce fibres less than in the chemically pulped fibres [Maloney98]. The most characteristic particles of mechanical pulps are the fines, which are often defined as the fraction of pulp that passes through the 200-mesh screen of a pulp fractionating device, in which the opening of the sieve is comparable to a circular hole of a diameter of 76 µm [Luukko99]. Fines are abundant in mechanical pulps, their weight fraction ranging from less than 25 % for some TMP pulps up to 50 % for some GW pulps. Despite of the wide variation in shape, size and origin, mechanical pulp fines can be coarsely divided into two morphological groups according to their appearance and paper technological effects [Luukko99]. Fibrillar fines contain flexible fibrils, ribbons and thin lamellae particles, originating especially from the S2 layer of the fibre wall. Fibrillar fines are elongated in shape, with a length to width ratio of approximately 100 [Mörseburg99]. Increasing the specific energy consumption in mechanical pulping is known to strongly increase the proportion of the fibrillar fines [Luukko99].The non-fibrillar fines are shorter, wider, granular or flaked particles. They have a variable origin: fragments of fibre wall, pieces of middle lamella, ray cells etc. [Mörseburg99, Luukko99]. Due to their large specific surface area and high cellulose content, fibrillar fines in particular increase the bonding of long fibres, and thus the strength properties and density of the paper. Instead, non-fibrillar fines with lower specific surface area and higher lignin and extractives contents, strongly increase the light scattering properties of paper [Retulainen93, Luukko99]. It has been found that the fibrillar fines of softwood TMP and those of softwood kraft pulp both affect positively the strength properties but not significantly the light scattering. This suggests that non-fibrillar fines are the main difference between the fines of chemical and mechanical pulp [Luukko99].
1.2 FIBRE NETWORK Paper is usually manufactured by applying a dilute suspension of wood fibres and water onto a porous supporting fabric, so that fibres are captured by the fabric and excess water is drained through it. In the paper machine this process is continuous as a dilute fibre-water suspension jet is applied onto a moving fabric or between two moving fabrics. In this formation process, several factors affect the structure of the fibre web which is subsequently created in such a process. A moderate velocity difference between the suspension jet and the fabric(s) causes fibres to settle preferably in the machine direction due to shear forces in the zone where suspension lands onto the fabric or onto an already formed fibre network, causing anisotropic fibre orientation in the plane of the web. In the thickness direction anisotropy exists, but less than in the planar directions, related to the felted structure of the web in contrast to a layered structure with fibres parallel to the plane of the web.

10
The tendency of the fibres to gather into flocs, especially in higher pulp consistencies, increases spatial variation of the basis weight of the sheet, thereby degrading the formation. On the other hand, turbulence of suitable size scale in the suspension, especially in the shear zone, breaks the flocs and reduces anisotropy of the fibre orientation. Turbulence can be generated e. g. by increasing the jet velocity or increasing the velocity difference between the jet and the fabric(s), and it can also be deliberately generated in the headbox. Hydrodynamic forces can also smoothen the formation of the fibre web in the filtration process due to a larger flow rate through low basis weight spots in the growing web. This, in turn, accelerates deposition of fibres in the low basis weight spots [Niskanen98]. At the lowest basis weights, the fibre network is essentially two-dimensional so that pores among the fibres have polygonal shape. If the fibres have random position and orientation, the average polygon has four sides of arbitrary length, and the distribution of the area of the pores is approximated by an exponential one. In the case of real flocculated paper-like structures, properties of the fibre distribution are more complicated, and have larger variations than in the random case [Dodson96]. When the basis weight increases, the average number of fibres in the thickness (z) direction, i. e. the coverage (c), increases. Voids also begin to form in the z direction due to finite flexibility of the fibres. Coverage is found to follow the Poisson distribution, and at larger c its distribution becomes similar to the Gaussian one. According to the Poisson distribution, the frequency of empty spots depends on the coverage, being equal to e-c. Also, the standard deviation of local thickness grows as a square root of the coverage, so that fibres must increasingly bend to make contact with other fibres as the basis weight increases. Transformation of an essentially 2D structure to a 3D one can be expected to happen for coverage values between 2 and 10, depending on the flexibility and the aspect ratio of the cross section of the fibres [Niskanen98]. This suggests that paper, within the typical range of basis weight, can possess a two- or three-dimensional pore structure depending on fibre properties, basis weight, formation and other manufacturing processes, like wet pressing or calendering, which can affect the voids between the fibres. Paper can thus be characterised as a consolidated, compressible fibrous medium with semi-random and partially three-dimensional structure. Pore structure, which affects the flow resistance properties, is naturally closely related to the structure of the fibre network. Therefore, structural factors which affect the porosity or the distribution of pore volume in the fibre network, potentially affect its permeability, too. The initial fibre properties, distributions of the external dimensions and coarseness, determine the starting point to the number density and volume fraction of fibres in relation to the basis weight. Furthermore, the pulping method and treatments of the fibres affect their flexibility, collapsibility, external fibrillation and fines production, which in turn affect the compactness of the sheet and thereby the pore structure.
1.3 PORE VOLUME Due to the highly irregular structure of fibres and the fibre web, no unambiguous definition exists for thickness, density or porosity of paper [Niskanen98]. Although all of these properties can be measured, the results strongly depend on the measurement method and its resolution. Applying the general definition of porosity to paper, pore volume consists of all the space outside the solid materials included in the paper. This volume can be roughly divided into two categories: the interfibre volume that consists of the space between the fibres, and the intrafibre volume that consists of the pore volume within the fibre. According to this definition, intrafibre pore volume consists of the volume of lumen and small voids in the fibre cell wall, e. g. cracks between lamellas and still smaller voids within lamellas. The dimensions of these micro- and macropores of the cell wall are considerably smaller than the typical fibre dimensions. The dimensions of the lumens are of the same order of magnitude as the dimensions of fibres, but their structure is closed, orientation is mainly lateral and they have a tendency to collapse under the compressive loading or drying. Due to these restrictions of the intrafibre pores, the permeability of the fibre network is assumed to be chiefly governed by the properties of the interfibre pore volume, even in a highly compressed state.

11
Ambiguities may arise when determining e.g. the location of the boundary of the sheet and division of the void volume between an interfibre and intrafibre fraction at the surfaces of the fibres. Practical solutions to these ambiguities can be provided by the resolutions of the measurement methods and devices used for characterising the porosity related properties. Permeability is a meaningful quantity only if fluid flow is possible through the fibre network. Thus, a connected interfibre pore volume must exist through the system; i. e. the pore system must percolate. Since variation in the basis weight and coverage exist in paper, the tortuosity of the possible flow paths apparently varies, too. Also, distributions of the interfibre pore dimensions are apparently very wide. This suggests that all the interfibre pore volume does not necessarily take equally part in conducting the fluid flow even if the whole interfibre volume were saturated due to diffusive motion of the fluid. The pore volume that conducts the fluid flow through the sample may be only a fraction of the whole interfibre porosity. Measurement of total porosity For the determination of porosity as the ratio of pore volume and total volume of the sample, several methods are used. Sometimes porosity is defined as the result of a standardised test which only somehow depends on porosity, requiring calibration if the actual porosity is needed. For example, air permeability tests are used to measure porosity as given by the capillary equation [Knauf86]. For the determination of total porosity, two quantities of the following three are required: the total volume of the sample, the volume of the pore space and the complementary volume to the solid phase. The volume of the sample is typically deduced from its external dimensions. Traditionally, the volume of the solid fraction is deduced from the dry mass and the density of the solid fraction, whereas direct determination of pore volume requires filling of the pores with a fluid whose volume or mass can be determined. Unfortunately determination of the dimensions and volume fractions of paper is not straightforward. Even elementary properties like thickness of the paper or density of the fibres are strongly dependent on the measurement method and measurement conditions. The apparent thickness of the sheet, which is measured by a standardised procedure with large, hard plates, is typically 10 % - 20 % higher than the effective thickness as determined from the average of the surface profile of paper [Niskanen98]. The fibre or cell wall density is usually deduced from fibre coarseness and cross-sectional area, or measured directly by a pycnometer or by a density gradient column. In a pycnometer, the solid volume of the fibre material is determined from difference in the gas pressure caused by the solid fraction of fibres in an exactly known measurement volume, in comparison to the empty volume. In the latter method, a predictable density gradient is created in a vertical vessel by the mixture of suitable liquids. Density of fibres is determined by the maximum sinking depth of fibres, in which their buoyancy and weight are equal. A widely used value for the density of wood fibres has been 1550 kg/m3, close to the pycnometric density of cellulose [Rance82]. This result also agrees rather well with density gradient [Carlsson83] and mercury intrusion [Moura05] measurements. Instead, in an optical measurement of fibre dimensions, at least the microscopic intrafibre porosity can be included in solid fraction due to limitations in measurement resolution. Thus, optically determined fibre or cell wall densities varies from rather low values (950 kg/m3 – 760 kg/m3, [Paavilainen93b]) to close to the pycnometric result (1400 kg/m3 – 940 kg/m3, [Niskanen99]), apparently depending on the amount of the intrafibre porosity in the measured fibres. Measurements in which pore volume is determined by the amount of liquid absorbed by pores are typically utilised in pore size distribution measurements, or when separating inter- and intrafibre porosities. These measurements are described in following sections. Finally, two-dimensional light or electron microscope images and, quite recently, three-dimensional tomographic images can be analysed so as to find the solid and pore volumes. Again, resolution of the images is most probably insufficient for detecting microscopic cell wall pores, especially if a relevant volume of the fibre web is imaged. While different methods of porosity determination can produce somewhat different results, the porosity of paper itself also varies considerably depending on fibre properties and treatment of the pulp and web. A typical porosity for most paper grades is found to be about 0.7, while the extremes range from 0.1 for glassine paper to 0.87 for filter

12
paper. For these values, a density of 1550 kg/m3 is assumed for the fibre material [Rance82].
1.3.1 INTRAFIBRE PORES Although the intrafibre pore volume probably does not contribute significantly to permeability of the fibre web, it can form a significant fraction of the total pore volume, thus indirectly affecting the permeability which is often estimated on the basis of the total porosity. Most methods used to quantify the small-scale intrafibre porosity usually utilise water, either as a carrier medium or directly as the object of measurement. However, due to the hydrophilic nature of wood fibres, water saturation changes considerably the internal porous structure of the fibres. Solute exclusion techniques are based on the migration of probe molecules into the pores of fibres in a water suspension. A given probe molecule can enter only pores larger than its molecular diameter, and under mechanical pressing water extruded from inaccessible pores dilute the initial concentration of the probe molecules. Nuclear magnetic resonance (NMR) and differential scanning calorimetric (DSC) methods are based on changes in the molecular dynamic properties of water due to close proximity of cellulose [Maloney97]. The DSC method measures the freezing or melting energies as functions of temperature, and the fraction of water which has an altered freezing and melting temperature is considered to be located in small-scale voids within the fibre wall [Weise96]. Due to differences in the basic principles of these methods, and the need of considerable interpretation of the results before pore sizes can be deduced, they give somewhat different results [Maloney97, Maloney99]. Any of these methods do not itself discern intrafibre and interfibre pores. Separation between these categories comes from the inevitable size difference between typical intra- and interfibre pores, and from resolution of the measurement method. Since interfibre voids are spaces between fibres, which have cross-sectional dimensions of the order of 10 µm and finite collapsibility and flexibility, it is justified to assume that the relevant interfibre pores are roughly similar in size. Instead, the pores recognised by probe molecule methods or molecular dynamical methods, are in nanometer scale, i.e. several orders of magnitude smaller than the relevant interfibre pores. For example, an about 1 nm capillary is the largest that can carry completely non-freezing water in DSC measurements, while an about 100 nm capillary can be used to recognise on altered freezing temperature [Weise96, Maloney99]. Thus, the non-freezing water represents most probably the intrafibre porosity, but water with an altered freezing temperature does not necessarily. Typically, the pores recognised by DSC measurements occupy less than 0.8 g of water per 1 g of dry fibre material, of which the non-freezing fraction is 0.4 g/g or less. The non-freezing fraction is nearly independent on the stock material, pulping method and even drying-rewetting sequence. Furthermore, non-freezing water is practically unaffected by mechanical pressing by about one MPa, suggesting the mobility of non-freezing water to be highly restricted. Instead, larger pores recognized by DSC measurements are also created by pulping and accompanying pulp treatments. This water fraction decreases due to collapse of intrafibre pores, already at a mechanical pressure of one MPa. These pores are also subject to “hornification”, irreversible closure during water removal [Weise96, Maloney98, Maloney99]. Solute exclusion results roughly agree with DSC results since the intrafibre pore volume corresponding to a moisture ratio of 0.4 g/g is inaccessible for 1 nm probe molecules. This fraction is also unaffected by a mechanical pressure of about 10 MPa. The pore volume corresponding to a moisture ratio of 0.8 g/g is inaccessible for 3 nm probe molecules, but this fraction is reduced by 50 % at a mechanical pressure o about 10 MPa [Carlsson83]. Finally, the results of centrifugal water retention measurements also roughly agree with the above results, since c. 0.5 g/g is considered as the upper limit of moisture ratio achievable by mechanical means [Lindsay94]. Intrafibre porosity φi corresponding to the non-freezing DSC fraction can be estimated from results for TMP and unbleached softwood kraft (UBSK) [Maloney98]. At a mechanical pressure of c. 6 MPa, φi ≈ 0.25 for never-dried USBK, and φi ≈ 0.30 for never-dried TMP, and also for dried – resaturated USBK. If the total porosity is estimated from the total moisture content using a density of 1550 kg/m3 for the fibre material, intrafibre porosity is 55 - 65 % of the total porosity under c. 6 MPa of mechanical pressure.

13
1.3.2 INTERFIBRE PORES Since the size of interfibre pores is necessarily larger than that of intrafibre pores in the cell wall of the fibre, different measurement methods are used to analyse them. If the interfibre pore structure of paper is assumed to be two-dimensional, pore sizes could be approximated simply by areas of polygons bordered by fibre segments [Niskanen98]. Since the interfibre pore volume of paper usually does not consist of physically separated passages through the sample, but of a three-dimensional interconnected network of irregular openings between fibres, the definition of an interfibre pore is more problematic [Scheidegger57, Niskanen98]. Visualizations by light or electron microscopy, or X-ray tomographic imaging enable valuable direct observation of the interfibre pore system for dry, or even saturated samples. Image analysis methods can provide the porosity and well-defined pore dimensions from different angles of view, and also more elaborated characterisations of how voids between fibres are connected to each other [Ramaswamy01, Aaltosalmi04]. A typical resolution of approximately 1 µm appears to be insufficient for details like the fines or the surface topography of the fibres and for the intrafibre pores within cell walls of the fibres. Traditional methods for determining the interfibre pore sizes involve introduction of a liquid, for example mercury or water, into the pore volume of the paper. Determination of pore sizes and the volume fraction of a given pore size is based on increasing the pressure difference or driving force, e.g. by centrifuging, so as to overcome the viscotic or capillary forces which resist the fluid motion, and measuring the corresponding amount of penetrated, permeated or removed fluid [Rance82]. The volume fraction of a given pore size can be determined from the change in the flux or flow rate between the successive values of force or pressure difference. For these methods, there are no basic limitations in sample size or resolution. Determination of pore size is based on the assumption that fluid motion in or out of pores of a given size requires a certain pressure or driving force, which then represents an effective pore size, affected in practise by the narrowest passage along the flow path. However, the absolute values for pore dimensions deduced from fluid penetration or permeation measurements are usually based on equations derived for capillary force or laminar flow resistance in straight channels of circular cross-section. For a disordered three-dimensional pore structure, the reality of such assumptions can be questioned [Lindsay93a, Maloney97]. In any case, since the definition of pore size differs in different methods, also their results may vary. In the thickness direction of paper, the average pore height in cross-sections, obtained by light microscopy views of paper, and also the hydraulic radius of the pores (pore area/pore perimeter) as determined from X-ray tomographic images appears to be few micrometers [Paavilainen94, Niskanen99, Ramaswamy01, Holmstad05]. Instead, the average hydraulic radius of pores for in the planar directions appears to be several times larger than the former hydraulic radius, with a much wider distribution [Ramaswamy01, Holmstad05]. Furthermore, for machine-made papers, the hydraulic radius of the pores is slightly larger in the cross-direction (CD) than in the machine direction (MD) [Holmstad05]. Qualitatively similar proportions for voids between fibres are also found in light diffraction measurements, which describe the interfibre voids as ellipsoids with a transverse eccentricity (MD/z-direction) of 2.2 - 2.6 and with a planar eccentricity (MD/CD) of 1.1 - 1.6 [Niskanen98].
14
Incidentally, in penetration or permeation measurements of a non-swelling liquid, the average pore size also turns out to be a few micrometers for typical paper materials [Rance82], although the pore size distributions or average values found by mercury intrusion porosimetry do not systematically agree with results of tomographic imaging in any direction [Ramaswamy01]. However, both imaging and fluid penetration/permeation results agree with the important aspect that the variation of pore size or height increases with the average value [Dodson96, Niskanen99]. Although the distributions of pore sizes as determined by fluid based methods and of pore heights as determined from microscopic cross-sections, often seem to resemble an exponential or log-normal distribution functions [Dodson96, Niskanen99], analysis of tomographic images suggests a rather symmetric distribution in all directions for hydraulic radius [Ramaswamy01, Holmstad05]. Some mercury intrusion results show complicated pore size distributions with one or two maxima in the size range 1 – 10 µm and one maximum in the size range 10 - 100 µm [Görres01, Moura05]. Finally, 3D images provide a unique possibility for characterisation of the connectivity of the interfibre pore system. Utilising image processing methods, the pore space can be skeletonised into a branching line which follow the local centreline of the pore space. In the sample analysed in [Ramaswamy01] each pore was connected to slightly more than three other pores on the average. Another characterisation for flow conductivity is tortuosity, the ratio of the length of the flow path to the distance between end points. In the analysis of [Aaltosalmi04] tortuosity of the samples analysed was 2 – 5 in the transverse direction, and 1 – 2 in the planar directions. The porosities determined by microscopical or tomographical methods represent most probably the interfibre porosity. For samples made from kraft or mechanical pulp, porosities have been 0.4 – 0.6 at most. Only for some special stock material or paper grades, porosity has exceeded 0.6 [Paavilainen94, Niskanen99, Aaltosalmi04, Holmstad05]. Similarly, mercury intrusion results for samples made of hardwood and softwood kraft as well as mechanical pulp have shown porosities in the range of 0.5 - 0.6 [Görres01, Moura05]. Furthermore, by observing the propagation of a known volume of dyed liquid in the pore space of paper, it has been estimated that up to 10 % of the interfibre pore volume makes little or no contribution to fluid flow [Lindsay94]. Factors affecting the interfibre pore size Some of factors affecting the interfibre pore size are closely related to fibre properties and pulp treatment, while other factors are more general fibre network properties. Basis weight of the paper represents the latter type. For decreasing basis weight from 176 g/m2 to 52 g/m2, the average interfibre pore size was found to increase in water permeation measurements from 17 µm to 25 µm with standard deviation doubled [Dodson96]. Furthermore, the probability of pinholes obviously increases with decreasing coverage as suggested by the observed increase in the maximum pore size from 20 µm to 147 µm while decreasing the basis weight from 97 g/m2 to 20 g/m2 [Rance82]. Another network property which affects the pore size is formation of the sheet. When formation was changed from layered to heavily flocculated, both interfibre pore size and its standard deviation was found to be doubled [Dodson96]. Large morphological differences exist between fibres of different wood species, and also within the specie due to seasonal differences in growth. Therefore, source specie and fractionation of the pulp can strongly affect the network properties of the sheet. For 60 g/m2 samples of low-coarseness earlywood fraction and high-coarseness latewood fraction, the coverage and the average interfibre pore height varied from 15 and 4 µm to 9 and 22 µm, respectively. The lower flexibility and bonding tendency of the coarser fraction in comparison with the finer fraction also resulted a higher interfibre porosity (0.65 vs. 0.41) and sheet thickness (136 µm vs. 102 µm) [Paavilainen94, Paavilainen93a].

15
Similarly, the pulping method and treatments of pulp which lead to changes in fibre flexibility, bonding tendency and size distribution, also affect the interfibre pore properties of the web. Beating of the fibres increases their flexibility and bonding tendency, and produces fines. Thus, it also decreases the porosity and change the pore size distribution. The beating level of the pulp can be characterised by laboratory beater revolutions, (typically up to 4000 – 8000), or by filtration test results (typically up to SR 80 or CSF 300) [Paavilainen94, Maloney97, Niskanen99, Ramaswamy01, Lieshout06]. Due to beating of the pulp, the interfibre porosity of the sheet is typically reduced by 30 – 60 % in comparison with the sheet made of an essentially unbeaten pulp. The reduction of porosity is concentrated on larger interfibre pores. In microscopic or X-ray tomographic images of sheets made of beaten pulp, distributions for pore height and pore diameter were found to shift slightly towards smaller pores [Paavilainen94, Niskanen99, Ramaswamy01], while in mercury intrusion studies the pore size distributions shifted strongly towards smaller pores and become narrower for increasing beating [Niskanen98, Ramaswamy01, Lieshout06]. In centrifugal water removal measurements beating also decreased the volume of large interfibre pores, but the volume of small interfibre pores was increased. When fines of chemical pulp were present, this effect was even more pronounced: In comparison with unbeaten sample, the volume of large pores is reduced by c. 30 % while the volume of small pores was increased by c. 65 % [Maloney97]. Generally, the presence of small pulp constituents (say, those passing through the Bauer-McNett sieve size 48) increased the interfibre porosity of the sheet, reduced the mercury intrusion pore sizes in the range of 1 – 10 µm but increased sizes in the range of 10 – 100 µm. With small constituents, interfibre porosity was found to increase by 40 - 50 % for TMP samples, and by 5 - 25 % for softwood or hardwood kratft samples [Görres01]. Qualitatively, the difference found between unbeaten kraft sheets and TMP sheets in a centrifugal dewatering test was similar. The total interfibre porosity was slightly larger in the TMP sheets, but the volume of their small interfibre pores was twice as large [Maloney97]. Pore characterisation by surface area Due to difficulties in defining and determining the relevant pore properties of paper, many characterisation methods have been developed. Perhaps the best known quantity in the characterisation of the pore structure is the surface area of solid fraction, possibly because of the widespread use of the capillary model to relate pore properties with permeability. Since the capillary model assumes that the pore structure is that of an assembly of straight tubes, the amount of surface area involved in the conduction of a fluid is the total area of the tube surfaces, which is then the hydrodynamic surface area. However, even if the capillary model is expressed in a form seemingly independent of the dimensional details of the pores, it is still based on the assumption of capillary pores, which is not a very realistic description of the disordered three-dimensional pore structure of paper. Since the capillary model is affected by uncertainty in the determination of flow-conducting porosity (Sec. 1.3), this uncertainty also affects the surface area. The surface area of fibres is usually presented in terms of specific surface area, whereby it is scaled with the mass or the volume of the solid phase or solid fraction of the medium, so as to provide a material-dependent quantity. Since the fibre surface area also affects other properties like light scattering and interfibre bonding, other measurement methods also exist, with different resolution and “penetration”. In comparison with fluid permeability, the resolution of the light scattering method is considered to be lower and that of the nitrogen adsorption method higher. Thus, for paper, conversion factors of 1.4 and 2.0 have been suggested when comparing optical and hydrodynamic specific surfaces, and optical and gas adsorption results, respectively [Wood96]. Fibre surface area per volume should increase as a function of reducing the fibre size if the shape and proportions of the fibres remain the same. Especially the fines are expected to increase considerably the surface area due to their small size. This seems to be true for nitrogen adsorption and light scattering measurements and also for water permeability, provided that the strong bonding tendency of fines is somehow prevented. Water permeability of pulp pads of several screen-fractionated mechanical refiner and groundwood pulps have shown the general trend of increasing surface area per unit mass for reducing size of the fractions [Forgacs63]. Also, water permeability of softwood kraft pulp pads have shown that increase in the surface area per unit mass for increasing beating energy per unit mass is mainly due to fines

16
production. Without the fines, increase in the surface area was small [Ljungkvist83]. For a freeze-dried material with minimal bonding, nitrogen adsorption surface area per mass was found to be as high as 20 m2/g for fines of chemical pulp, while it was 8 m2/g for mechanical fines. A typical value for fibres is 1 m2/g [Niskanen98]. Instead, typically chemical pulp fines bond nearly completely during drying, losing thereby their free surface area, while some free surface is retained for typical mechanical fines. Thus, the light scattering coefficient of normally dried sheets did not change when 15 % of kraft fines was added among long kraft fibres, but using TMP fines instead, more than a 35 % increase in the light scattering coefficient was observed [Niskanen98]. It is also probable that the free surface area lost in drying due to bonding does not return completely if the sample is resaturated. Usually the free surface area is decreased when the bonded area of fibres is increased in the sheet. For the same reason, reduction in the light scattering coefficient is also observed for increased wet pressing, accompanied by increase in the sheet density and bonding degree [Niskanen98]. However, the water permeability of pulp pads, and also the air permeability of dried samples made of softwood kraft, have shown increasing surface area per unit mass for increased beating [Knauf86]. Similarly, air permeability measurements on 100 g/m2 and 2350 g/m2 unbeaten sulphite pulp samples have suggested increase in surface area for increased wet pressing [Bliesner64]. Furthermore, correlation coefficients between the data sets and the capillary model results used for determining the surface area were apparently very good in these investigations. This suggests that determination of pore surface area from fluid penetration or permeation results is ambiguous, as is the determination of pore dimensions.
1.3.3 RESPONSE OF POROSITY TO COMPRESSION When the total porosity of a saturated fibre network is reduced by mechanical pressing, the compressive pressure exerted on the system by the pressing surfaces is equal to the sum of the mechanical pressure acting on the solid structure made of fibres, and the fluid pressure in the pore volume. This concept is known as the Terzaghi’s principle. In a rapid compression, pressure of the interfibre fluid, and possibly interaction between the interfibre fluid and fibres, can have a significant contribution. In slow compression the mechanical pressure developed in the fibre network gives usually the major contribution to resistance against the compression, since mobile fluid has enough time to withdraw from interfibre pores without a large increase in the fluid pressure [Maloney98]. In fibre network, mechanical pressure causes bending of free spans of fibres, and flattening of fibres cross-sectionally in locations where they rest atop each other. Bending of fibres creates eventually new contacts with other fibres, which in turn causes further bending and flattening of fibres in contact. In transverse compression, the height of interfibre pores necessarily decreases, but also the lateral dimensions of pores decrease, since the free span length decreases due to new contacts formed by bending fibres [Han69]. The flexibility and cross-sectional compressibility of the fibres, as well as the number of fibre-fibre contacts are the factors which mostly affect the slow rate compressibility of the fibre network [Han69]. Furthermore, an intrafibre fluid affects strongly the compressibility and flexibility of fibres [Maloney98, Maloney99]. Due to large variation in fibre strength properties, and due to disordered structure of fibre network, large local variation can be expected on compressibility of the fibre network. Although the fluid permeation, centrifugal, solute exclusion and DSC experiments concerning the porosity or pore size response to compression do not agree in every aspect, their results indicate that the interfibre porosity and pore size decrease considerably already at very low mechanical pressures. Wet pressing of hardwood kraft and TMP samples at 0.1 MPa clearly reduced the pore volume in a mercury intrusion test [Lieshout06]. Slightly higher wet pressing pressure of 0.6 MPa was found to reduce the interfibre porosity by c. 30 % for different sample materials, in centrifugal dewatering tests [Maloney97]. An increase in the wet pressing pressure from 0.07 MPa to 0.7 MPa has been observed to half the interfibre pore size from 5.8 µm to 2.8, in a permeation test [Bliesner64]. In unbeaten kraft sheets wet pressing at 0.6 MPa has been found to collapse the large interfibre pores without effects on small pores, in centrifugal dewatering tests. Instead, in beaten kraft sheets and TMP sheets, with the already compacted sheet structure, wet pressing at 0.6 MPa has been found to collapse small pores, too [Maloney97]. In DSC measurement, the free water which probably represents the essential flow-conducting part of the interfibre porosity, is the first fraction that decreases during dewatering. Down to a moisture ratio of 0.80 g/g for beaten kraft, and of 0.65 g/g for

17
TMP, the free water fraction has been found to decrease linearly with decreasing moisture ratio. In this phase free water comprises approximately 20 % and 10 % of the total porosity for beaten kraft and TMP samples, respectively. This suggests that more than 90 % of the interfibre porosity may have disappeared already at 1 – 2 MPa mechanical pressure [Weise96, Maloney98]. In contrast to this, after a pressing pulse c. 10 ms with a mechanical pressure of 8 MPa, moisture ratios were 2 – 4 times larger than in static pressing with a similar pressure. This indicates the significance of fluid pressure and other fluid flow- related effects in dynamic pressing conditions [Weise96, Maloney98]. The wet fibre flexibility and cross-sectional compressibility remain finite for normal pulp material, and pulp treatments, and also the elongated form of wood fibres persist [Paavilainen93a]. Also the compression of the fibre web does not significantly increase the fibre perimeter, even if the fibre cell wall collapses cross-sectionally [Niskanen98]. Furthermore, upon a transverse compression of the fibre web, any significant repositioning of fibres in the in-plane directions has not been observed even after repeated compressions [Han69]. Therefore, it appears that a fraction of the interfibre porosity will remain open in typical paper materials even at high compression, maintaining fluid flow through the percolating interfibre pore network. Due to reasons mentioned above, the pinholes will obviously persist in compression even better than any 3D pore structure. Therefore, one can expect that sheets with low coverage and/or uneven formation can maintain their essential flow-conducting fraction of the interfibre porosity even in a highly compressed state
1.4 FLOW IN FIBROUS MEDIA When a fluid moves in a macroscopic interfibre pore space around an assembly of fibres, the mean free path of the fluid molecules due to random thermal motion should be smaller than the characteristic dimensions of the flow channel, if the motion of the molecules is to be treated by means of fluid mechanics rather than molecular mechanics. For liquids, this requirement is usually met due to the short mean free path in the liquid phase, but for gases this requirement is not always met in small-scale pores, causing a so called “slip” between the solid and fluid phase. If the continuum approximation justified, also the concept of viscosity is applicable as a measure of the internal friction of the fluid. In a moving volume of a viscotic fluid, a velocity distribution exists across the flow channel; flow velocity at the channel boundaries is zero and increases away from boundaries. Shear stress between the fluid and the solid surface induces also frictional flow resistance which is the main source in the total flow resistance of a macroscopic sample at low flow velocities. Increasing flow velocity increases the inertial forces in the fluid, which in turn can induce turbulence. As the basic principles of fluid mechanics are valid for flow within the pores of the fibre network of paper, classical fluid mechanics equations can be utilised for developing theoretical models of flow resistance or permeability for real porous medium. Small size and disordered structure of the pore space, and the low transparency of typical fibre materials restrict to some extent direct microscopic-scale measurements of fluid flow in the voids of porous medium. Arbitrary shape and disorder of the voids also necessitate more suitable methods for flow simulation in realistic porous medium models. Experimental determination of flow resistance or permeability of porous media is needed, and it is realised by using the Darcy equation (Eq. 1). It relates the proportionality factor between flow rate and pressure difference for fluid flow through a porous medium to its permeability, which does not contain any assumption of the internal properties of the medium. Permeability measurements are carried out on samples which are considerably larger than the size of fibres or grains of the medium. Therefore, results of the measurements averaged over the whole sample area, and whether or not they represent the true average behaviour of the sample, depends its size with respect to its uniformity. Darcy equation was developed by, and named after Henry Darcy, who first carried out water permeability measurements on layers of soil in the 1850’s. From hydrology applications, where the media are often consolidated granular materials, the concept of fluid permeability was then deployed to other areas and other kinds of medium. The first permeability measurements on fibrous media appeared in the late 1930’s [Jackson86], and the first applications to permeability of paper in the late 1940’s [MacGregor89].

18
1.4.1 EXPERIMENTAL RESULTS FOR FIBROUS MEDIA Generally, the permeability of the fibrous media is strongly dependent on the porosity and other structural properties of these media as porosity approaches zero (Fig. 1). In Fig. 1, dimensionless permeability of various fibrous materials is presented as a function of their solid volume fraction. Various natural and man-made materials which fulfil the requirement of being composed of elongated solid particles were included. Sizes of the particles varied from long-chained molecules to heat exchanger tubes, while the porosity varied from 0.997 to 0.29. Permeabilities were made dimensionless by dividing them by the radius of the “fibre” squared [Jackson86]. However, typical paper materials were apparently not included in this study, probably because information about fibre diameter is rarely given in permeability studies of paper materials. Fig. 1 Dimensionless permeability of various fibrous media as a function of volume fraction of fibres [Jackson86]. The observed variation of permeability for materials with an approximately similar porosity is assumed to be mostly due to variation and inhomogeneity in their fibrous structures. For equal porosity, structures of fibres with their long axis aligned along the flow have a higher permeability than structures with fibres aligned perpendicular to the flow. Furthermore, detailed arrangement of fibres affects the permeability. For assembly of layers of evenly spaced parallel cylindrical tubes, with layers stacked atop each other, the highest permeability was found for an assembly where consecutive layers were perpendicular to each other. Permeability was lower for an assembly where consecutive layers were parallel with tubes directly atop of each other. The lowest permeability was found for a parallel assembly with consecutive layers shifted sideways. If separation between the consecutive layers was more than spacing between parallel tubes, orientation of consecutive layers had no effect on permeability. Finally, non-uniformity created in a regular, parallel fibre assembly increased the permeability by a factor of two, suggesting that more uniform is the distribution of the fibres, the lower is the permeability [Jackson86]. An important consequence of this observation is that a larger contribution to the total permeability is expected from less dense regions with high local permeability than from more densely packed regions of low local permeability.
0,0001
0,001
0,01
0,1
1
10
100
1000
10000
0,0001 0,001 0,01 0,1 1
Fibre volume fraction
Dim
ensio
nles
s per
mea
bilit
y

19
1.4.2 EXPERIMENTAL RESULTS FOR PAPER MATERIALS Several studies concerning the permeability of paper have been published during the past five decades. Permeability has typically been defined as a function of mechanical compression of the sample, using the Darcy equation, but otherwise the conduct of the measurements, and the composition and treatment of the samples have varied considerably. The maximum value of the mechanical pressure applied has varied from 0.7 MPa to over 13 MPa [Lindsay93a, Ceckler82], resulting in a nonlinear reduction of permeability by less than one to several orders of magnitude. Porosities of the samples were expressed in several ways, including solid fraction [Luey79], density [Ceckler82], moisture ratio [Carlsson83] and mechanical pressure applied [Vomhoff00]. Many other web or sample composition properties were also investigated. Among the studied web properties were the flow direction (transverse direction, machine direction or cross direction), web thickness, basis weight, web uniformity, formation, and drying history. The studied web composition properties included effects of fibre dimensions, cooking yield, degree of beating or refining, and amount of fines. In order to have an effect on permeability, this fibre, pulp and sheet properties should affect the interfibre porosity or pore structure. However, quite a few explanations for the observed behaviours have been offered.
1.4.2.1 EFFECTS OF FIBRE AND STOCK PROPERTIES For various samples made of softwood kraft pulp, the transverse air permeability was found to increase for increasing coarseness. This increase of permeability was accompanied by lower sheet density, and apparently also by higher porosity, larger pores and lower fibre surface area [Paavilainen93b]. Parameters of the chemical cooking process have been found to affect the permeability, so that pulp with a higher kappa number or higher yield also result in paper with a higher water permeability, associated with a lower wet fibre flexibility and lower apparent sheet density [Carlsson83, Lindsay93a]. Beating of chemical pulp fibres generally causes reduction in the air and water permeability of the samples made of that pulp [Carlsson83, Ljungkvist83, Paavilainen90, Lindsay93b]. Reduction in water permeability due to beating seems to be approximately the same in the transverse and lateral directions [Lindsay93a]. The beating process induces several effects which could cause reduction of permeability, including increased flexibility and external fibrillation of fibres, and production fines [Ljungkvist83, Paavilainen90, Paavilainen93a, Paavilainen93b]. If the samples were dewatered sufficiently prior to permeability determination, sheet densification due to increased bonding can explain the observed results [Paavilainen93a, Paavilainen94]. However, increased fibre flexibility, and increased interface surface area between the fluid and solid fractions, due to external fibrillation and fines, can expect to affect also in a saturated state. Fines of chemical pulp can alone cause an order of magnitude reduction of permeability [Lindsay93b]. In dried samples this can be due to sheet densification [Paavilainen90, Retulainen93], but since 6 to 3 times higher flow rates for a given pressure difference were found in freshly filtrated pads of kraft pulp when the fines were washed out from the pulp, it appears that the fines increase the flow resistance also without bond formation [Ljungkvist83]. It should be noted that pulp drainage or filtration tests, e.g. the Shopper-Riegler test (SR) or the Canadian standard freeness test (CSF), that are commonly used to measure the degree of beating or refining of the pulp, generally do not predict permeability of the paper manufactured from the pulp. Often pulps which have a low CSF drainage value due to increased mechanical treatment, have also a low permeability when formed into paper [Ceckler82, Carlsson83]. However, an order of magnitude difference in permeability was observed in samples made of different wood species with a similar value of the CSF test. Also, a nearly order of magnitude permeability difference was found for samples made of the same pulp, but treated with different beating procedures, which still produced nearly the same CSF value [Lindsay93a]. It has been found that at least the SR test is especially sensitive to the existence of fines of the chemical pulp, but not sensitive to the properties of long fibre fractions [Ljungkvist83, Paavilainen90].

20
While mechanical pulp is in many ways very different from the chemical one, some common characteristics appear in their permeability behaviour. The air permeability of dried samples made of screen-fractionated refiner and groundwood pulps decreases for decreasing particle size. Similar reduction takes place in the water permeability of pulp pads. The groundwood fraction that passed the 28-mesh screen but was retained in the 48-mesh screen (denoted as 28/48) had a permeability about three times that of the 48/100 mesh fraction, which in turn had more than twice the permeability of the 100/200 mesh fraction. Mechanical fines had a large effect too, since the permeability of the 100/200 fraction was about twice that of whole, unfractionated, pulp samples. Since the fibre or particle size distribution of mechanical pulp is related to parameters of the pulping process, it has been found that, as expected, increasing the refining or grinding intensity reduces the water permeability of paper [Carlsson83]. Increasing the specific energy consumption in refining has been found to increase the amount of mechanical fines and externally fibrillated long fibres, as well as the flexibility of long fibres [Koljonen95]. Therefore, it has been found, as expected, that reduction in permeability is accompanied by increase in sheet density, and also increase in fibre surface area per unit mass [Forgacs63].
1.4.2.2 EFFECTS OF FIBRE WEB PROPERTIES Studies in which lateral and transverse permeabilities of the same paper material has been compared, the lateral permeability has been found to be higher than the transverse permeability by a factor of 2 to 40. Furthermore, the permeability of machine-made paper is usually higher in the machine direction than in the cross direction, by a factor of 1 to 2 [Lindsay93a, Petterson06, Koivu10]. Qualitatively, these results agree with those of tube assembly measurements [Jackson86]. In the case of flow in the transverse direction, most fibres are oriented perpendicularly to the main flow direction, but in a lateral flow direction a fraction of the fibres is aligned in the direction of the flow. For machine-made papers, this fraction is larger for flow in the machine direction than for flow in the cross-direction. Processes which affect the transverse permeability seem to affect the lateral permeability in a similar way. The reduction of lateral permeability due to compression seems to be even larger than the reduction of transverse permeability [Lindsay93a, Lindsay93b]. Drying of wet-formed paper increases its permeability, as well as rewetting followed by re-drying of the paper [Lindsay93a, Hashemi95]. Water permeability of oven-dried softwood kraft samples can be nearly two orders of magnitude higher than that of never-dried samples, with initial solids content below 25 %. The permeability of partially dried samples has been found to be between these extremes. Air permeability of the paper increases after rewetting followed by re-drying, even after several of such cycles, although increase in air permeability was moderate (tens of percents) in contrast to water permeability [Hashemi95]. However, if the dried samples of paper with a varying drying history were disintegrated and re-formed, only samples that were re-formed from oven-dried fibres have been found to have higher water permeability than the other samples. Generally, the permeability of re-formed samples has been found to be comparable to that of partially dried virgin samples [Lindsay93a]. As already mentioned above, an irregular assembly of cylinders has a higher permeability than a regular assembly with equal porosity [Jackson86], which indicates that regions with low density dominate the permeability of an inhomogeneous fibre network. In paper, the abundance of regions with low density depends on coverage, and thereby should also depend on basis weight and formation of the web. Indeed, these quantities have been found to affect the permeability. A 15 % increase in the formation index due to increase in stock consistency caused a 25 % increase in the air permeability [Niskanen98]. Also slightly higher water permeability have been observed in handsheets formed with stock consistency of 0.086 % than in samples formed with a consistency of 0.028 % or lower [Ceckler82]. Differing formation has also been suggested as the reason for a slightly higher permeability of machine-made board than of the equivalent handsheets, despite the basis weight of several hundred grams per square meter [Luey79]. Also, even if formation has not been quantitatively quoted, flocculation of fibres has been mentioned as a possible reason for unusually conductive pores and high permeability [Lindsay93b]. Since the regions of low density seem to increase the permeability significantly, crowded regions of high density must display

21
the opposite effect. Lateral dye migration studies carried out on several paper grades have suggested that approximately 10 % of the interfibre porosity does not contribute to fluid flow [Lindsay94]. It has been frequently observed that lightweight samples of paper seem to have a higher permeability than otherwise comparable, but heavier samples. However, the “low” basis weight was in many studies 50 – 150 g/m2 in comparison with basis weights of hundreds or even thousands of grams per square meter [Bliesner64, Ceckler82, Knauf86, Lindsey93b, Vomhoff00]. In detailed analyse, it has been found that the transverse permeability of paper decreases inversely proportionally to the basis weight at a given compressive force, up to a certain limiting basis weight. Beyond this point, permeability is essentially independent of basis weight at a fixed compressive force. Furthermore, the response of permeability to changing compressive force became stronger for increasing basis weight, again up to a limiting basis weight. In samples made of chemical pulp, held at a low constant compressive force, permeability was reduced by a factor of 15 when the basis weight was increased from 35 g/m2 to 280 g/m2, with no significant reduction in permeability there after. In 35 g/m2 samples, an increase of compressive force from 0.26 MPa to 3.5 MPa reduced the permeability by a factor of ten, but in 140 g/m2 samples, the reduction in permeability as a result of the same increase in compression was nearly three orders of magnitude, reducing further when basis weight approached 280 g/m2. Decrease in permeability with increasing basis weight has also been found for TMP samples, although to a lesser extent. The limiting basis weight in the case of TMP was much lower, 70 g/m2, than in samples made from chemical pulp [Vomhoff00]. Similarly, only slight decrease was found in air permeability of newsprint samples (made of mechanical pulp) with basis weight increasing beyond 52 g/m2, and with mechanical pressure exceeding 1 MPa [Koivu09]. Perhaps the most frequently offered reason for the higher permeability of low basis weight paper is the size distribution or “inhomogeneity” of pores [Bliesner64, Lindsay93b]. This explanation is quite obvious, taking into account that the average pore height, effective pore size and their variations all increase with decreasing basis weight (Sec 1.3.2 ), and that the low-coverage regions are immune to compression, and display high permeability (Sec 1.3.3).
1.4.2.3 INTERACTION OF FIBRE WEB AND PRESSING SURFACE In practise, a permeability measurement requires the sample to be confined between porous pressing surfaces which must enable fluid passage through the sample, while supporting mechanical compression. These two requirements are difficult to satisfy simultaneously, since fluid transport requires finely distributed pores, while an even compression requires a smooth and planar pressing surface. Usually, felts or sintered plates are used in permeability devices as a contact material with the fibre web. The permeability and distribution of pores of these materials seem to be adequate for an easy and evenly distributed fluid flow, but smoothness and planarity can be questioned, at least for thin fibre webs, especially if a meaningful thickness should be determined simultaneously. Effects of contact surface topography is most often discussed in the context of wet pressing or dewatering of paper [Gullbrand03, Lieshout06], but this topography is also related to the effect of basis weight [Ceckler82, Vomhoff00]. Apparently, the highest “peaks” of an uneven contact surface transmit the main compressive force to the paper web. If a sufficiently thin fibre web is pressed between uneven contact surfaces, the web regions between “peaks” on the opposite pressing surfaces become highly compressed and essentially impermeable, while the regions between “valleys” on opposite surfaces remain in less compressed state and are thus more permeable. If the fibre web is thick in comparison with the unevenness of the contact surfaces, contacts between fibres spread the compression in the lateral directions, so that the whole area of the fibre web becomes more or less compressed [Vomhoff00].

22
An example of the interaction is provided by a permeability measurement already quoted in the previous section (Sec. 1.4.2.2). There, paper samples of 35 g/m2 to 560 g/m2 were pressed between rough wire fabrics and between finer felts [Vomhoff00]. The effect of the basis weight of paper was still visible, but the permeability measured for all basis weights was at least an order of magnitude higher when a coarse wire fabric was used as a contact material. Interestingly, when untreated sintered plates were used as a contact material, the permeability was essentially similar to that measured with felts. Furthermore, for rough contact surfaces, permeability decreased with increasing basis weight without any levelling off, up to 560 g/m2. In contrast, decrease in the permeability levelled off at 100 – 300 g/m2 for smoother contact surfaces, depending on paper material [Vomhoff00]. No detailed quantification of the contact surfaces was given, but inspection of their images reveals that the diameter of the threads of the smoother contact materials appears to be of the order of 100 µm, similarly to the grains of the untreated sintered plate. Instead, the diameter of the threads of the coarse wire fabric was approximately 500 µm. Interaction between the sample and the contact surface of the measurement device apparently becomes an issue every time when a significant mechanical compression takes place. The combined effect of compression unevenness and basis weight of the sample then depends, in a rather complex manner, on the topography and pore area distribution of the contact surfaces, and coverage of the sample web.
1.4.2.4 INTERACTION OF FLUID FLOW WITH FIBRE WEB Interaction between the moving fluid and the solid fraction of the porous medium is increased substantially if anything but “creeping” fluid flow takes place, suggesting onset of other sources of flow resistance. Transition from a laminar flow, where viscosity dominates, to turbulent flow where inertial effects dominate, admittedly causes an increase in the pressure loss for increasing flow velocity. However, experimental results suggest that turbulence is actually not generated within the porous media, and the increase in flow resistance is a consequence of increased inertial effects of laminar flow [Scheidegger57, Ingmanson63]. Whatever the reason for the increase in flow resistance, a linear dependence between the pressure difference and the flow rate is usually tried to maintain in permeability studies of paper, probably in order to use the Darcy’s law in its traditional form. This practise restricts the flow rates and pressures into fairly moderate values in permeability experiments. For unbeaten and fines-free sulphite pulp samples, the average flow velocity of 10 mm/s (apparently volumetric flow rate divided by permeable area) has been estimated to be the limit for negligible inertial effects [Ingmanson63]. Since the flow velocity estimated to occur e.g. in the formation process in papermaking, is an order of magnitude higher (100 mm/s), it is likely that inertial forces actually cause the major part of flow resistance in formation [Ingmanson63]. The ratio of inertial and viscotic forces is traditionally expressed as a dimensionless Reynolds number Re, defined as Re = ρVd/µ, where ρ is the density, V the average flow velocity and the µ the dynamic viscosity of the fluid. d is a somewhat loosely defined characteristic dimension of the system. In a long, straight circular tube, transition from laminar to turbulent flow occurs nominally at Re ≈ 2300 [Fox85]. However, V and d are practically impossible to determine directly in the nearly microscopic and irregular pore structure of paper, necessitating other definitions [Scheidegger57]. Therefore, V is often determined simply by dividing the volumetric flow rate by the permeable area of the sample, sometimes taking into account the porosity, whereas the diameter of the fibres is often used as the characteristic dimension of the system. With such definitions, pressure difference vs. flow rate through the fibre web deviates from a linear dependence at much lower flow velocities than in flow in straight tubes. A Reynolds number around 1 is suggested to be the upper limit for negligible inertial effects for beds of nylon and dacron fibres [Ingmanson63]. Pressure difference as a function of flow rate can be interpreted as a force exerted on the solid fraction by the moving fluid. For a consolidated fibrous medium composed of fibres of low flexural stiffness, deformation of fibres due to hydrodynamic forces is possible [Han69, Jönsson92]. Furthermore, if the same volumetric flow passes through the sample with a constant cross sectional area and a constant distribution of fibres, the same average drag force is expected for any cross-sectional surface in the transverse direction.

23
However, the contacts between the fibres, which transmit the forces involved in the mechanical compression, transmit also the forces exerted on the fibres by the fluid. Therefore, the drag force is expected to cumulate towards the exit surface of the sample, creating an increasing density gradient in the sample if the material is sufficiently deformable and the volumetric flow is high enough [Ingmanson63, Han69, Jönsson92]. This can cause the exit side of the sample to be its most compressed part, and therefore to have a lower permeability than the upstream part of the sample. The term “stratification” is associated with this kind of process [MacGregor89]. A permanent density gradient through the transverse direction was observed in cross-sections of dried samples of softwood kraft after a millisecond –scale wet pressing with a maximum mechanical pressure of several MPa. Up to 30 % density increase was observed on the water extraction side of the handsheet samples compared to the opposite side [Szikla92]. In the presence of a density gradient, properties of the exit side can dominate the permeability of the whole sample, as suggested for dewatering experiments of thick mats of beaten softwood kraft. The mat was composed of several plied 300 g/m2 samples that were dewatered with a static centrifugal pressure of 1.4 MPa. The water contents of the samples remained fairly constant up to mats of four samples. For thicker mats, water contents on the exit side still remained about the same, but increased rapidly on the top side, suggesting a reduction in permeability at the exit layer [Maloney97b]. Increased frictional forces caused by fluid flow are also assumed to cause redistribution of small fines and filler particles that appear among the fibres. Such redistribution is observed during formation in which a fibre web consolidates from water suspension [Niskanen98]. However only little particle movement is observed in already consolidated fibre webs [MacGregor89]. No appreciable redistribution of mechanical fines was observed in dynamic pressing tests despite the apparently favourable conditions of low initial solids content, existence of very small fines among pads of coarse unfibrillated fibres, and a large maximum compression pressure [Szikla92]. It has also been suggested that an increased retention of small particles due to a density gradient would counteract the particle washout due to fluid friction [Szikla92]. If accumulation of fines on the exit side of the web can somehow take place, such condition has been found to decrease the permeability. Centrifugal water removal from two-ply samples of separated fines and fibres at different proportions proved to be more efficient through the fibre side of the pad. In the pads of fibres or fines alone, there was no difference from which side water was removed. Instead, when two-ply samples were pressed, their moisture ratio was up to 25 % higher when water was extracted from the fines-ply side [Maloney98].
2 MODELS FOR PERMEABILITY OF FIBRE NETWORKS In this Chapter the permeability models previously introduced in the literature are first briefly described. Then we describe the fluid flow simulations through a model network, carried out so as to better understand the microscopic mechanisms behind the permeability behaviour of paper. In the more recent flow simulations, whose results are also described, X-ray tomographic reconstructions of samples of real paper have been used as the simulation geometry, results have been fairly similar. Simulations have indicated e.g. that a 2D structure will have a higher permeability than a 3D structure, and that a disordered structure will have a higher permeability than a regular structure, for a fixed porosity. Therefore, in irregular 3D networks of fibres (real paper), occasional 2D-like locations of low coverage can have a pronounced effect on the permeability of the entire sample.
2.1 SIMPLE MODELS OF PERMEABILITY Much experimental and theoretical work has been devoted to finding correlations between the permeability and macroscopic properties that characterise the porous medium [Scheidegger57]. In order to be solvable by essentially analytical means, a rather simple equation is required. If the equation is derived on theoretical grounds, a highly simplified model for the porous medium is also required. One theoretical starting point is the ideal case of a long straight circular tube with a fully developed velocity profile of laminar flow, for which even analytical expressions can be found for the relation between pressure

24
difference and flow. Another theoretical starting point is the flow resistance of a simple body, like an infinitely long cylinder, which can be determined from the basic equations of fluid mechanics. In order to form a model of porous medium, a simple local geometry should be extended to represent a macroscopic volume. The well-known Kozeny - Carman permeability model is an example of this kind of approach. In this model, the porous medium is considered as an assembly of cylindrical tubes intersecting a layer of solid material. Fluid flow through the medium is then a multiple of volumetric flow through a cylindrical tube. The analytical expression relating the pressure difference and the volumetric flow through a straight circular tube with negligible inertial effects is known as the Poiseuille equation. The fact that the experimental Darcy’s law (Eq. 1) can be readily derived from the theoretical Kozeny - Carman equation indicates that permeability is not tightly connected with a certain pore structure. Even the simple capillary model introduces several structural properties of the porous medium, which affect its permeability. Generally the most important structural property is the porosity of the material (φ), or the ratio of the volume of the pores to that of the whole sample. A detailed description of pores is more problematic and case dependent. Frequently the pore structure is characterised by the pore surface area per volume of the sample (S) and by the tortuosity of the medium (τ). In the case of the capillary model, S consists of the internal surface of the capillaries, and it thus depends on number of the capillaries, and on their diameter. In this case, tortuosity can be defined as the ratio of the length of capillaries (L), inclined by a fixed angle (θ) with the normal to the flow direction, and the thickness of the material (h). Thus, tortuosity is τ = L/h = 1/cos θ. With this notation the Kozeny equation takes the form k = φ 3/ (zτ 2S 2), where the Kozeny coefficient z = 2 for tubes with a cylindrical cross-section. In a more general case, the distribution of pore volume can be expressed independently of the sample size by introducing the specific surface area S0 = S/(1-φ), which equals the pore surface area divided by the relative volume of the solid material. Similarly, tortuosity can be defined more generally as τ = V / vp, where V = (vx
2 + vy
2 + vz2)1/2 is the average speed of the fluid and vp is the component of the velocity in the
primary flow direction. Usually vp = vz for flow which takes place primarily in z- or thickness direction, whereas vp = vx or vy for primarily in-plane flow. Tortuosity and Kozeny coefficient z are often combined into one constant which is, incidentally, also usually called as a Kozeny coefficient Z. It has been found empirically that, for fibrous media, Z = 3.5φ 3(1+57(1-φ)3)/(1-φ)1/2 is appropriate for a substantial range of φ [Ingmanson63], while for many occasions Z ≈ 5.55 is suitable. Since some parameters of the Kozeny – Carman equation practically always require experimental determination, the most straightforward form of the equation combines all problematic parameters into the single constant C1. Permeability can now be expressed as a function of fibre volume fraction φf = 1 - φ, and in dimensionless form by dividing the expression with the radius (a) of the tube squared:
( )2
3
12
1
f
fCak
φ
φ−= . (2)
Permeability models based on the flow resistance of a cylinder, or an assembly of cylinders, are reviewed in reference [Jackson86]. As an example of the theoretical expressions for cylinders with flow perpendicular to the cylinder axis is the Happel’s equation for a 2D assembly:
+−
+−=11
)(81
2
2
2f
ff
f
Lnak
φφ
φφ
. (3)
Another obvious starting point for a simple expression for permeability is correlation with experimental data. This approach can also be utilised in different ways. Experimental data and a theoretical expression can be combined so as to solve parameters which would be difficult or impossible to obtain otherwise. For example, parameters Z, z and τ of the Kozeny – Carman expression are often solved in this way. A more straightforward way is simply to fit a mathematical expression to experimental permeability data, even without an explicit dependence between the expression and data. For example, in reference [Koivu09]

25
correlation of permeability was sought with data that related pressure loss to volumetric flow through thin screens and gauzes using the expression:
( ))2(
1 2
22ff
fCak
φφφ−
−= (4)
with C2 a constant. Another example of correlation of explicit mathematical expression with data is given in reference [Koponen98]. In this case permeability data was acquired by numerical flow simulations through models of disordered 3D fibre networks models with varying porosity, and the result was
( )( )155.5 11.102 −= − fe
ak φ . (5)
2.2 THREE-DIMENSIONAL MODELS AND IMAGES OF FIBRE NETWORKS Simple models based on the capillary approach do not take realistically into account the variable geometry and interconnected nature of the pores, nor does the approach which utilises the flow resistance of a single obstacle realistically take into account the effect of neighbouring particles. Also, the disorder typical of real fibre webs is difficult to apply in simplified models. More realistic models of fibrous networks appeared in the mid 1990s. For example, an algorithm was constructed, which generates three-dimensional disordered layers of elongated and flexible beams by deposition on a flat substrate [Niskanen94]. Then, at the turn of the millennium, computerized x-ray micro-tomography became available in paper research. In this method a large amount (of the order of 103) 2D X-ray images of the sample, taken from different directions, are reconstructed into a 3D map of the sample (attenuation coefficient of X-rays) by computational methods. Material dependent attenuation coefficient then means that this map provides a 3D map of the structure of real paper. Due to a resolution of approximately 1µm, mostly fibres and interfibre pores appear in the image. Computational reasons limit the dimension of the imaged volume to only approximately 1 mm , when details of the size scale of fibre width are to be imaged. Since disordered fibrous media are often quite inhomogeneous in such a size scale, several 3D images are often reconstructed from the same sample material, and still special attention has to be paid to the selection of the location of the imaged region in order to capture a representative structure of the material. An advantage of fibre network models and images is the possibility to determine relevant network properties (thickness, porosity, pore dimensions, tortuosity etc.) locally, and in any direction through the sample. Global network properties can then be determined from the local values, and compared to those resulting from experimental measurements. Due to the complexity of pore volume in realistic fibre network models and in the 3D tomographic images, elaborate computational methods are required for modelling fluid flow within the pore volume. Probably the most popular of such methods is the lattice-Boltzmann method and its derivatives [see eg. Koponen98, Koivu 09b]. The key idea behind this method is to model fluid flow by distributions of fictitious particles moving on a regular computational lattice spanning the sample space (Fig. 3). Thus, at each time step particle distributions move discretely along the lattice connecting the neighbouring lattice sites, followed by local collisions of particles and solid surfaces, in which particle velocities are redistributed. With certain assumptions, it has been shown that behaviour of the particle distribution approaches that of real fluid. Among the computational requirements is a sufficient number of time steps so as to reach the steady state in the simulated flow. Also the resolution of the computational lattice, i.e. the size of the structures in the flow environment, must be large enough with respect to the lattice spacing in order to avoid difficulties caused by boundary conditions and the Knudsen effect. Grid resolution is also connected to relaxation parameter, which determines the viscosity of the fluid [Koponen98]. The inherent locality of the lattice-Boltzmann method is particularly suitable for parallel computing. Still, computations are rather laborious, single simulation runs often requiring many hours of CPU time. As a result, a complete 3D velocity field can be determined inside the model or the image of a porous medium. Combining the information of local fibre network properties and local flow properties provides a unique microscopic view of fluid motion

26
within complex fibrous medium, which is impossible to obtain by current experimental methods. Web model used In this work models of fibre networks were constructed by a growth algorithm [Niskanen94] in which fibres are deposited one by one on a flat substrate (the PAKKA model). Each fibre is randomly located and oriented in the xy plane, and is then let to fall in the negative z direction until it makes contact with the underlying structure. In deposition, periodic boundary conditions are used in the lateral directions. Fibre length, width, height and flexibility are adjustable parameters, and during the deposition a fibre can bend according to the underlying structure, but without deforming the lower structure of previously deposited fibres. In order to avoid effects of flat substrate, the samples used in the simulations were extracted from inside of thicker webs.
Fig. 2 A thin computer generated semi-random fibre network of fibres with porosity 0.83 [Koponen98].

27
Porosity of the structure can be adjusted by the flexibility of fibres. A sample created by the growth algorithm is shown in Fig. 2. Local network properties can be determined as well as the related global properties. Local and global network properties can then be related to the local and global flow velocities which are obtained from simulated flow velocity fields. Local values of porosity, coverage, pore height and thickness are determined in the plane of the web (xy plane) by taking into account network properties in the thickness direction (z direction) above each discrete location of the xy plane. Local thickness hL is defined as the distance between the uppermost and lowermost lattice points occupied by solid material in the region of interest. Local porosity φL is defined as the number of lattice points not containing solid material (“pore”) between the uppermost and lowermost lattice point with solid material at that location, divided by the local thickness. Local pore height pL is defined as the number of empty lattice points divided by the number of pores at that location, with a pore defined as a continuous string of empty lattice points in the z-direction between the uppermost and lowermost solid lattice points. Since the local coverage cL of the web models is defined as the number of separated fibres at that location, it is equal to the number of pores plus one. Global network properties of the model can be used for characterisation of the simulated networks and for comparison with the properties of real paper. Thickness h, pore height p and coverage c of the sample are simply averages over the local values, whereas porosity φ is the number of empty lattice points divided by number of all lattice points. Similarly, local and global properties of the networks can be determined in the zx and zy planes, too. All the dimensions in simulated samples are expressed as multiples of the lattice unit g, which is the distance between adjacent points of the lattice (Fig. 3). Thus, in order to make simulations and experimental results comparable, the dimensions of either or both results must be transformed. Lattice unit can be scaled to SI-dimension according to some characteristic measure appearing in the fibre network model, for example the diameter of the fibre. On the other hand, dimensionless permeability can be defined as k/a2, where hydrostatic radius of the fibre a is defined as the perimeter of the cross section of the fibre divided by 2π. Thus, for fibre with circular cross section, a equals the geometric radius.

28
Fig. 3 Computational lattice used in the flow simulations using the fibre network model. Contours of solid bodies as well as the movements of particle distributions, which simulate the fluid flow, are discretised in this lattice. Flow velocity components vx, vy and vz are shown at point (1,2,2). g is the lattice spacing. Similarly to the network properties, local and global flow velocities can be determined from simulated flow velocity fields. The local flow velocities VL for transverse flow (thickness direction) was determined by averaging the velocities in the thickness direction (z direction) at each location in the xy plane. Average flow velocity for the whole sample is then determined as an average over all local velocities. Volumetric flow rate Q is defined as the sum of velocity components vz at the trailing xy plane of the sample. Furthermore, periodic boundary conditions are applied on the velocity components vx and vy. Finally, local tortuosity τL is determined as the ratio of local velocity VL and an average of velocity components vz in the thickness direction (assuming transverse flow), at each location in the xy plane. The average tortuosity τ of the sample is again an average over all local tortuosities. In similar manner, characteristic properties of the lateral flow (in the x and y directions) can be determined.

29
Fluid flow simulations Three series of the fibre the network model were analysed in the present study. In the first series, the porosity of the samples was adjusted in the range 0.96 - 0.43 by changing the flexibility parameter of the fibre. The lower limit for porosity arises from limitations in the computational capabilities. Fibre webs were now composed of identical fibres with square cross section. In order to ensure sufficient grid resolution, a larger lattice was used for samples with low porosity. The dimensions of fibres were 5g × 5g × 100g for φ ≥ 0.6 and 10g × 10g × 200g for the lower porosities. Sample dimensions were 400g × 400g × 50g for the higher porosities, and 800g × 800g × 100g for the lower porosities. The coverage in the z direction was approximately 10 for all samples. The primary flow direction in these simulations was along the z axis, i.e. though the thickness of the web. In addition to simulations for flow in the z direction, some samples of the first series were also simulated for flow in an in-plane direction. In the second series of samples, pore surface area was changed by substituting 10 %, 30 % and 50 % of the volume of the fibres with cubical fines particles. The sample with no fines was used as the reference. In the third series of samples, the effect of cross-sectional shape of the fibre was investigated by composing the network of flattened fibres, with a thickness to width ratio of 1:2. Again, 10 %, 30 % and 50 % of the volume of the flattened fibres was substituted by cubical fines, and the sample with only flattened fibres was used as the reference. The samples of the second and third series all had an approximately constant porosity, φ ≈ 0.6, by changing the flexibility parameter of the fibres according to the fines fraction. To ensure sufficient grid resolution, the dimensions of fines particles were 5g × 5g × 5g, thus the dimensions of fibres were 20g × 20g × 200g in the second series and 20g × 10g × 200g in the third series. Sample dimensions were fairly small, 400g × 400g × 200g, in comparison with the particle size, in order to keep the memory usage reasonable. One sample was also created with a thickness of 300g in order to investigate the properties of thicker webs. Web models were generated at Helsinki University of Technology and Finnish Pulp and Paper Research Centre (KCL) at 1999. The volume of the web model was divided into sections, each treated by its own processor on a Cray T3E computer, using a parallelised simulation code. Usually 10 - 60 processors and several gigabytes of memory were required, with a CPU time of about hour (several thousands time steps) for reaching the steady state in the simulated flow. As a result, 3D flow velocity fields were determined for the samples. From these flow velocity fields, the local and global flow velocities as well as the volumetric flow rates were determined. These properties were related with the local and global properties of the fibre networks, thus enabling e. g. the determination of the permeability of the model. In Fig. 4, a simulated flow velocity field is visualised at an outer surface of a sample (that of Fig. 2). Light shade of grey indicates a high flow velocity.
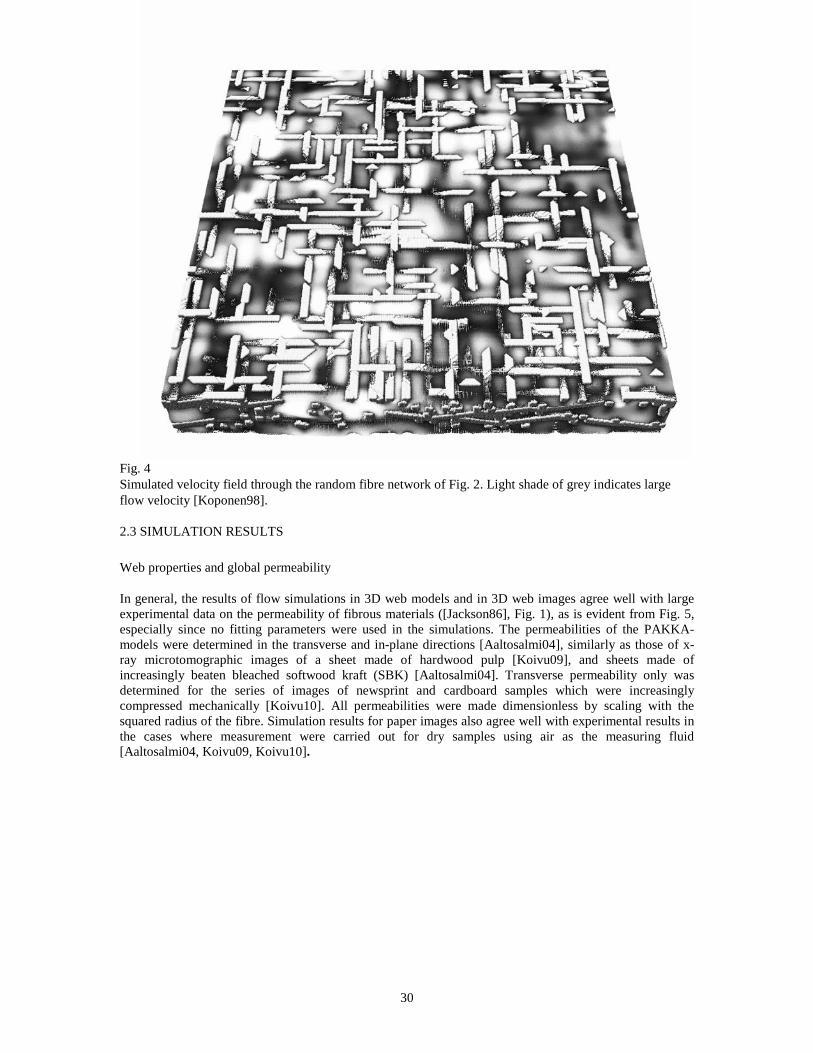
30
Fig. 4 Simulated velocity field through the random fibre network of Fig. 2. Light shade of grey indicates large flow velocity [Koponen98].
2.3 SIMULATION RESULTS Web properties and global permeability In general, the results of flow simulations in 3D web models and in 3D web images agree well with large experimental data on the permeability of fibrous materials ([Jackson86], Fig. 1), as is evident from Fig. 5, especially since no fitting parameters were used in the simulations. The permeabilities of the PAKKA- models were determined in the transverse and in-plane directions [Aaltosalmi04], similarly as those of x-ray microtomographic images of a sheet made of hardwood pulp [Koivu09], and sheets made of increasingly beaten bleached softwood kraft (SBK) [Aaltosalmi04]. Transverse permeability only was determined for the series of images of newsprint and cardboard samples which were increasingly compressed mechanically [Koivu10]. All permeabilities were made dimensionless by scaling with the squared radius of the fibre. Simulation results for paper images also agree well with experimental results in the cases where measurement were carried out for dry samples using air as the measuring fluid [Aaltosalmi04, Koivu09, Koivu10].

31
0,0001
0,001
0,01
0,1
1
10
100
0,01 0,1 1Fibre volume fraction
k/a
2 ExperimentalModel, tr.Model, ip.Hardwood, tr.Hardwood, ip.Beat. SBK, tr.Beat. SBK, ip.Comp. cardboard, tr.Comp. news, tr.
Fig. 5 Dimensionless permeability k/a2 as experimentally determined for fibrous media [Jackson86], and simulated for 3D fibre web models [Aaltosalmi04] and for 3D microtomographic x-ray images of paper [Aaltosalmi04, Koivu09, Koivu10]. For paper images, solid markers denote the transverse flow direction (tr.) and hollow markers an in-plane (ip.) flow direction. The permeability of the PAKKA- model is higher in the transverse than in an in-plane direction for φf ≥ 0.5 (Fig. 6). This is probably due to the way porosity is adjusted in the model, i.e. by changing the flexibility of fibres composing the network [Aaltosalmi04]. Instead, images of paper indicate higher permeability in the in-plane direction [Aaltosalmi04, Koivu09] (Fig. 6 which includes only results for the web models and paper samples of the previous figure). Similarly to experimental data at low porosity, simulation results vary considerably (Fig. 5 and Fig. 6). This indicates the significance of detailed pore structure at low porosities. As an example, the tortuosity τ of the flow is shown as a function of φf in Fig. 7. In this case, scanned paper samples from the series of beaten SBK [Aaltosalmi04], and singular samples of newsprint, filter paper, and a handsheet apparently made of chemical pulp [Holmstad05] were considered. For the PAKKA- model, tortuosity changed rather smoothly for increasing φf, with the in-plane tortuosity larger than the transverse one [Aaltosalmi04]. Instead, for papers images, tortuosities were generally higher and, unlike in the model, tortuosity of paper (SBK) was larger in the transverse direction than in the in-plane directions (Fig. 7).

32
0,0001
0,001
0,01
0,1
0,3 0,4 0,5 0,6 0,7 0,8Fibre volume fraction
k/a
2
Model tr.Model ip. SBKSBKHardwoodHardwoodCardboardNews
Fig. 6 Dimensionless permeability k/a2 for simulated 3D fibre web models [Aaltosalmi04] and x-ray microtomographic images of beaten SBK samples [Aaltosalmi04], mechanically compressed samples of cardboard and newsprint [Koivu10], and a singular sample made of hardwood [Koivu09]. Solid markers denote transverse flow direction (tr.) and hollow markers an in-plane (ip.) flow direction.

33
1
1,4
1,8
2,2
2,6
3
3,4
3,8
4,2
0 0,2 0,4 0,6 0,8Fibre volume fraction
Tor
tuos
ity
Beaten SBK, tr.Beaten SBK, ipHandsheet, trFilter paper, tr.Newspaper, tr.Model, tr.Model, ip
Fig. 7 Tortuosities from flow simulations of the PAKKA- model [Aaltosalmi04] and x-ray microtomographic images of beaten SBK samples [Aaltosalmi04], and of singular samples of newsprint, filter paper, and a handsheet of chemical pulp [Holmstad05]. Solid markers and the cross denote transverse flow direction (tr.) and hollow markers an in-plane (ip.) flow direction. The effect of pore structure was investigated with a series of PAKKA- models with fibres partially substituted by small particles, “fines”, and with rectangular fibres substituted by flat fibres. The porosity of the samples was kept constant, c. 0.55. Therefore, changes in permeability were caused by changes in the pore structure, as indicated by the related increase of the free surface area of fibres (S). Free surface area was determined from the binary maps of the fibre networks by subtracting the contact areas of fibres and fines particles. However, the stepped appearance of bent fibres (due to discrete construction of the lattice) was neglected, as they were considered as straight rectangles. For fibres with a flat cross-section (a height to width ratio of 1:2), permeability k was a half of that for square fibres, and also the reduction of k due to fines was less than for square fibres. This dependence on fibre cross section decreases as the relative amount of fines increased so that, for 50 % fines, k was essentially the same for flat and square fibres (Fig. 8). To further illustrate the change in the average pore structure caused by fines, the relative tortuosity, coverage and pore height with respect to their values for corresponding networks without fines are shown for some samples in Fig. 9. Despite the increase in the particle number by a factor of 320 when 50 % fines are included, changes in the free surface, coverage and especially in tortuosity are fairly modest. This is probably due to the sedimentation-like building process of the web model, which probably leave fines into a more or less continuous layer on top surfaces of fibres, which is not necessarily the most realistic picture of fines distribution in paper [Nanko89]. This is also suggested by the increasing discrepancy between the total and free fibre surface area. For 10 % fines concentration, the total surface area increased by a factor of 1.5, while the free surface area increased by a factor of 1.2. Instead, for a 50 % fines concentration, the total and free surface areas increased by a factors of 5.7 and 1.9, respectively. Furthermore, since the porosity of fibre network models was kept constant, compaction of the web, which is usually associated with an increase of wood fines to wood fibres [Retulainen93], was now neglected.

34
0
0,01
0,02
0,03
0,04
0,05
1 1,2 1,4 1,6 1,8 2SR/S
k/a
2
Square fibre
Flat fibre0 %
10%
30%
50%
Fig. 8 Dimensionless permeability k/a2 for fibre network models with a varying concentration of fines as a function of free fibre surface area S, scaled by a reference area SR which is the surface area of square fibres without fines. Numbers indicate the percentage of fibres substituted by fines particles. Porosity is approximately 0.55 for all samples.

35
0,6
0,8
1,0
1,2
1,4
1,6
1,8
2,0
0 10 20 30 40 50Volume fraction of fines (% )
Rel
ativ
e ne
twor
k pr
oper
ty
Free surface
Coverage
Tortuosity
Pore height
Fig. 9 Average network properties of the web model with 30 % and 50 % fines, with respect to those of corresponding networks without fines (0 %). All results are for fibres with a flat cross section, with a porosity of approximately 0.55. An even bigger effect on permeability of the pore structure can be observed if flow simulations in regular and irregular fibre webs are compared, or if simulations in 2D and 3D fibre webs are compared. Regular and random 2D web models with different porosities were composed by freely overlapping cylindrical fibres with square arrangement or with random location and orientation. With the assumption that the thickness of 2D structures equals the diameter of the cylinder, the dimensionless permeability k/a2 can be determined from flow simulation results [Valli09]. As an example of a regular 3D structure, layers of parallel cylinders staggered atop each other (square arrangement) have been constructed [Koivu10], while PAKKA- models has been used as a random 3D structures [Koponen98]. Flow simulation results for these models in the transverse direction are shown in Fig. 10, where permeability was made dimensionless by scaling with the squared radius of the fibre. Again, the structure and distribution of the pore volume are increasingly influential when the porosity decreases. In both the 2D and 3D case, the random arrangement of fibres was more permeable than regular one, except for very high porosities. This indicates that high-permeability locations in disordered network dominate the permeability. These simulations are also in agreement with experimental results on regular and irregular structures (see Sec. 1.4.1). The difference between 2D and 3D networks is even larger than that between regular and irregular networks (in 2D and 3D structure. If porosities relevant for paper materials (≥ 0.3) is considered, the permeabilities of 2D networks are an order of magnitude higher than those of corresponding 3D networks (Fig. 10).

36
0,001
0,01
0,1
1
10
100
0 0,1 0,2 0,3 0,4 0,5 0,6 0,7 0,8 0,9Fibre volume fraction
k/a2
Random 2D Regular 2D
Random 3DRegular 3D
Fig. 10 Simulated dimensionless permeability (k/a2) for a transverse flow through a 3D random fibre web model [Koponen98], a regular 3D fibre web model [Koivu10], and regular and random 2D fibre web models [Valli09]; a is the hydraulic radius of the model fibre. Web properties and the local permeability As Fig. 10 and experimental results (Sec. 1.4.1) indicate, disorder in the fibre network causes an increase in the permeability. Therefore, locations with favourable flow conditions and high permeability can be expected to occur in random networks. A common feature of all simulated velocity fields for fibre web models is the considerable spatial fluctuation of flow velocity. For a disordered fibre web model, standard deviation of the transverse component of the local flow velocity is 98 % of the average value [Koponen98]. Despite the substantial increase in the particle number due to introduction of fines in the network, the spatial variation of the local flow velocity remains high. For flat fibres without fines, the standard deviation of the transverse component of the local flow velocity was 85 % of the average value, and it was reduced only to 60 % when a half of the fibres were replaced by fines. In order to connect local flow velocity and local network properties, flow velocity and network properties were determined for every 400 × 400 in-plane locations, and arranged according to ascending value of the local velocity (VL),and then this set of data was divided into ten groups of equal size. The average pore height (pL), porosity (φL), thickness (hL) and coverage (cL) of each group was presented as a function of the local volumetric flow rate (QL) of the group. Since different locations of the network were divided evenly into the groups, each group represented 1/10 of the sample area. In order to make the velocity distributions of different samples comparable, the local network properties and QL of each group were scaled by the corresponding average or sum for the whole sample (Fig. 11 and Fig. 12). The average p, φ, h and c for 0 % fines concentration were 21g, 0.52, 168g and 5.8, and for 50 % fines concentration they were 17g, 0.58, 177g and 7.9, respectively. Similarly, the average p, φ, h and c for a thin sample were 21g, 0.52, 170g and 5.8, and for a thicker sample they were 23g, 0.55, 267g and 8.3, respectively. It is evident that in all cases, from 18 % to 25 % of the volumetric flow through the sample was conducted through an most permeable 10 % of the cross-sectional area of the networks. Furthermore, 10 % of the volumetric flow was conducted through the approximately 3 % of the most permeable area, with the appropriately favourable p, φ, h and c.

37
The greatest differences between the webs with and without fines (Fig. 11), as well as thick and thin webs (Fig. 12), appear in the properties of the 10 – 20 % most permeable area fractions. Instead, it took the least permeable 70 % of the area to conduct a half of the total Q through the sample for all samples analysed, and the least permeable 10 % carried only a couple of percents of the total Q. For the fibre network models of present study, the local pore height pL and coverage cL turned out to be more influential factors in the local permeability than the local thickness or the porosity. The importance of the sparsest locations in the disordered network is emphasised by these results. Especially the monotonic dependence on the flow rate QL on coverage cL was an interesting observation since, for real networks of wood fibres, coverage probably remains unchanged during mechanical compression and the locations with low cL persist and maintain their QL also at higher compressions. Also, the coverage of real wood fibre webs probably varies even more than in the random deposition models due to flocculation which is not present in the model. Thus, in paper, the locations of low cL could exist at high basis weight and be more numerous at low basis weight. These results are in line with the higher simulated permeability for irregular 2D and 3D structures than for regular ones at a similar porosity (Fig. 10), as well as with similar experimental results for 3D assemblies of cylinders [Jackson86]. This reinforces the idea that sparse locations dominate the permeability of the network, despite the fact that dense locations of low permeability must also exist in random networks.

38
Fig. 11 Local web properties vs. local volumetric flow QL for flat fibres of which 0 % (solid markers) and 50 % (hollow markers) are replaced by fines. All quantities were divided into ten equal groups with increasing VL, and scaled by the total averages and by Q of the whole sample, respectively.
Fig. 12 Local web properties vs. local volumetric flow QL for webs of square fibres with 30 % fines and a nominal thickness of h = 200g (solid markers) and h = 300g (hollow markers). All quantities were divided into ten equal groups with increasing VL, and scaled by the total averages and by Q of the whole sample, respectively.
0.4
0.6
0.8
1
1.2
1.4
1.6
1.8
0 0.05 0.1 0.15 0.2 0.25Q L / Q
Loc
al n
etw
ork
prop
erty
/ave
rage
Pore height
Porosity
0%50%
0.6
0.7
0.8
0.9
1
1.1
1.2
1.3
1.4
0 0.05 0.1 0.15 0.2 0.25 0.3Q L / Q
Loc
al n
etw
ork
prop
erty
/ave
rage
Thickness
Coverage
h=200
h=300
0.4
0.6
0.8
1
1.2
1.4
1.6
1.8
0 0.05 0.1 0.15 0.2 0.25 0.3Q L / Q
Loc
al n
etw
ork
prop
erty
/ave
rage
Pore height
Porosity
h=200h=300
0.6
0.7
0.8
0.9
1
1.1
1.2
1.3
1.4
0 0.05 0.1 0.15 0.2 0.25Q L / Q
Loc
al n
etw
ork
prop
erty
/ave
rage
Thickness
Coverage
0%50%

39
3 THE PERMEABILITY DEVICE One of the main objectives of this study was characterisation of the JYFL permeability device. Therefore, this device is described here in detail. The most sophisticated component of the device is its pair of compressing surfaces. These surfaces must be highly permeable. If lightweight, i.e. thin samples are to be compressed and simultaneously measured for compressibility or permeability, these surfaces must also be smooth, highly planar and rigid. Satisfying such, apparently somewhat contradicting requirements, means that special attention must be paid to their material, treatment and characterisation.
3.1 GENERAL STRUCTURE OF THE DEVICE Permeability is measured by using Darcy’s law (Eq. 1). Therefore, the quantities needed are the pressure difference across the sample, the volumetric flow rate and the thickness of the sample. Viscosity of the fluid can be considered constant and the flow area was defined by the construction of the device. Due to fragility of paper, the samples must be well supported during the measurement. Thus pressing surfaces must simultaneously ensure fluid flow through the sample and support against stresses exerted by mechanical compression and fluid flow. The sample was enclosed in a sample basin formed between a rigid upper pressing chamber and a lower pressing chamber which can be moved vertically. The permeability device of JYFL was specifically intended to be able to handle samples of low basis weight. Therefore, special attention was paid to the pressing plates that support the sample. In order to achieve rigidity, and evenly distributed fluid flow and mechanical stress, pressing plates were made of sintered stainless steel plates. Furthermore, pressing surfaces of sintered plates were carefully levelled in order to achieve a uniform spacing between the pressing surfaces, thus providing a meaningful thickness of the sample even under compression.
3.2 MAIN COMPONENTS The basic design and construction of the permeability device was made in the early 1990s, including its pressing surfaces [Kirmanen94, Kataja95]. Several structural modifications and an improvement of the transducer system were made thereafter, and the configuration used in this work was completed in 1996. The main components of the permeability device are the frame, upper and lower pressing chambers, hydraulic cylinder for moving the lower pressing chamber, water supply and circulation system, and transducers needed in the actual measurements. All components expected to be in contact with water were manufactured from AISI 304 stainless steel. The frame of the device consisted of two circular support plates connected by three cylindrical connecting rods (Fig. 13). All the components were assembled inside the frame. The upper pressing chamber is attached to the upper support plate, while the lower pressing chamber was atop of the hydraulic cylinder, which in turn was attached to the lower support plate. A movable hydraulic cylinder enabled opening and closing of the sample space as well as mechanical compression of the sample. In a measurement, the sample was inserted between the opposite heads of the upper and lower pressing chambers. Fluid circulation took place in either direction from one pressing chamber to the other through the porous pressing surfaces and the sample. The transducers for measuring the fluid pressure difference were located inside the upper and lower pressing chambers, while the three displacement transducers for measuring the thickness of the sample were located symmetrically around the pressing chambers. The transducer for measuring the compressive force was located between the upper support plate and the pressing chamber. The flow rate measurement took place outside the permeability device, as part of the water circulation system.

40
Fig. 13 A partial cross section of the layout of the permeability device. The water circulation system and some minor details are not included in this figure.

41
3.3 HYDRAULIC CYLINDER Movements of the lower pressing chamber and the mechanical compression force on the sample were both realised with a hydraulic cylinder located between the lower support plate and the guide plate (Fig. 13 and Fig. 16). The cylinder is a single-action Hell Hydraulik model CR-60 with a piston of 80 mm in diameter and 100 mm stroke. Hydraulic pressure for the cylinder is supplied with a hand-operated Nike Hydraulics I-PHS 36 pump. For additional sensitivity of the movement of the piston, an adjustment valve in the pressure line was kept nearly closed. This slowed down the operation of the hand pump and reduced the possibility of unintended or exaggerated movements of the cylinder, especially when only small, of the order of a micrometer, adjustments were called for.
3.4 PRESSING CHAMBERS The pressing chambers (Fig. 13) were the two cylindrical vessels that contained fluid passages, and instrumentation for thickness and hydrostatic pressure measurements, and whose opposite ends formed the sample basin. The upper pressing chamber was a cylinder of 90 mm in diameter, and it was rigidly attached to the force transducer, which in turn was attached to the upper support plate. The lower pressing chamber was a cylinder of 105 mm in diameter. It was attached to the top of the hydraulic cylinder so that it could be lowered for placing or removing the sample, and raised for closing the sample basin and compressing the sample against the upper pressing chamber head. Opposing ends of the pressing chambers formed a cylindrical sample basin, an airtight closure that confined the sample. For this purpose, lower chamber has a cylindrical recess of 90.3 mm in diameter and c. 25 mm deep, in which the upper cylinder fitted. A nylon ring in the rim of the upper chamber forms an airtight seal between the chambers, leaving a c. 20 x 90 mm cylindrical space for the sample.
3.5 PRESSING SURFACES The top and the bottom surfaces of the sample basin, i.e. parallel heads of the pressing chambers, acted as the pressing surfaces. A porous but still rigid structure was achieved by fabricating the centres of the pressing plate from sintered stainless steel plates. Sintered plate was composed of small grains of stainless steel, which were solidified by application of heat and mechanical compression. Sintered plates were manufactured by Sintertech Poral of France. The upper and lower pressing surfaces were circular solid stainless steel plates of 90 x 5 mm, in which a circular sintered plate of 60 x 2 mm was permanently embedded. The pressing plates were supported by the circular 90 x 18 mm blocks so as to provide sufficient mechanical rigidity against compressive forces. The pressing plates and the support blocks were perforated, and provided with lateral channels below the sintered portion, to ensure even distribution for fluid flow. The total area of the pressing surfaces was Atot = 6360 mm2 and the area available for fluid flow was Aflow= 2680 mm2, when the area covered by attachment screws was excluded. Since the pressing surfaces must be densely perforated for fluid flow, their smoothness is an ambiguous quantity. As paper structure is very irregular in the size scale of fibre width and below, we can only look for smoothness in a larger scale. If solid contact areas of the pressing surface are rigid, highly planar, large enough and sufficiently densely located, they will provide support for outmost fibres of the sample sheet on numerous locations, and unsupported fibre spans are short enough to prevent macroscopic thickness variation of the sheet. In such a case thickness determination would be principally similar to that of the standardised hard or soft platen technique. However, due to thinness of lightweight paper, untreated sintered plates or press felts, which are frequently used as contact material, are apparently too uneven to produce meaningful thickness determination (Vomhoff00). The structure of the felt is highly deformable and it is composed of fibres with a diameter approximately equal to or larger than the typical diameter of wood fibres. At low mechanical pressure, felt surface fibres have a small contact area (< 15 %), and at high loads, either the contact area increases only marginally for finer surface fibres, or surface fibres are much thicker than average wood fibres, and sparsely distributed. At high loads the structure of still coarser base fibres is transmitted through a layer of surface fibres, further increasing the roughness of the interface

42
(Cox91). Based on microscopic images of pressing surfaces of the permeability device, grains of sintered stainless steel appeared to be very irregular in shape and size, typically of the order of 100 µm in their largest dimension (Fig. 14). This means that without smoothing, the combined surface roughness of pressing plates would be of similar magnitude as the thickness of lightweight paper in an uncompressed condition. Unfortunately, even a light mechanical machining tends to block the pores of a sinter plate due to galling of the steel on machining. On the other hand, non-contact methods like electric discharge machining did not give a satisfactory surface quality. As a solution to this problem, after permanent attachment of the sintered plate to the pressing plate, the pores of the sinter plate were electrolytically filled with copper. Then the whole pressing surface was mechanically ground and polished, whereafter copper was removed by reverse electrolysis. The area distribution of porosity and the characteristic dimensions of smoothed pressing surface were evaluated by analysing their micrographs, while the height profile of the pressing surface was measured by optical profilometry. Images were taken by an optical microscope at 40X magnification and analysed by MatLab’s image processing software. Each image represented c. 1.25 mm x 1.25 mm area of the pressing surface. These images show that the pressing surface machined into the sintered plate consisted of three distinguishable components: Machined top surfaces of steel grains, visible grain surfaces below machining level, and deep pores. Machined grain surface was distinguished from unground grain surface by lighter shade of grey in the images, and by the presence of tool marks. Deep pore area appeared black in the micrographs (Fig. 14). The area fractions of the surface components were quantified by visually determining their grey scale limits and counting the pixels representing each component. Such an analysis indicated that the contact area of sintered pressing surfaces, i. e. that of machined tops of sintered steel grains, covered 55 % of the total area. Visible grain surface below the machining level covered 15 %, and the remaining 30 % was covered by deep pores. Since the shapes of machined tops of the grains and pores between grains were very irregular (Fig. 14), there is no obvious definition for the linear size of the typical contact area or pore. In order to estimate the pressing surface’s capability to support paper sample evenly, the dimensions of the individual contact areas and pores were determined from the micrographs by covering them with randomly oriented straight lines. The average length of the line segments covering machined steel surface was then defined as the average linear dimension of the contact area. Similarly, the average length of the line segments over non-machined steel surface or deep pore was defined as their average linear dimension. With this definition, the average linear dimensions of the contact areas and pores were 130 µm and 75 µm, respectively. The latter dimension agrees with manufacturer’s estimation of the maximum pore size of the sintered plate, which is approximately 100 µm according to particle filtration tests.

43
Fig. 14 Microscopic (40X) image of a sintered pressing surface, representing an area of c. 1.25 mm x 1.25 mm. Machined contact areas appear with light shade of grey, with tool marks running approximately horizontally. Deep pores appear black, while grain surfaces below the contact area level appear dark without tool marks. The width of the wire that extends across the image is 95µm. The height profile of the pressing surface was determined by an optical Alti-Surf 500 profilometer which measures surface height with a 1 µm spot size and a resolution of 0.002 µm. Resulting height map contained 8 × 10⁶ measured points with 5 µm spacing, and represented a 4 × 50 mm area of the surface. Since deep pores have an indefinite height, the profile of the porous pressing surface is best characterised by the skewness (ssk) and the kurtosis (sku) of the height distribution. Skewness is the third moment of height distribution, and a measure its symmetry. Kurtosis is the fourth moment of this distribution, and a measure of its flatness. For the pressing surface machined onto the sintered plates, the strongly negative ssk (-3.5) and large sku (20.4) indicate highly a planar plateau with narrow and deep pores. Furthermore, the highest 55 % of the cumulative height distribution has a standard deviation of only c. 3 µm. The cumulative fraction of locations significantly higher than the average surface height is also very small, as indicated by the exponential decrease in Fig. 15. For example, only half a percent of the cumulative fraction of surface heights consists of heights 10 µm or more above the average height of the surface (Fig. 15). This corresponds approximately to the thickness of the fibre cell walls (Table 1 – Table 5).

44
Fig. 15 Height distribution (squares) and cumulative height distribution (triangles) of the pressing surface machined onto the sintered plate, consisting of the highest 55 % of total area. Exponential function is fitted to the cumulative data (dashed line).
3.6 WATER CIRCULATION Water taken from the municipal network was filtrated to remove particles larger than 10 µm, and then stored in a closed settling tank equipped with a heater and pneumatic vacuum pump (Fig. 16). Water circulation and pressurisation were accomplished with a Grundfors CR2-110 centrifugal pump which had a maximum volumetric output of c. 3 m2/h, or a maximum available pressure of c. 1.2 MPa, depending on the loading condition. The flow rate and fluid pressure are adjusted with a changing the rotation rate of the pump by a frequency converter. Water was also lead through a 5 µm filter for further purification. An expansion tank was installed in the water line to reduce pressure peaks and oscillations caused by the pump. Since electric motors and especially frequency converters are sources of electric disturbances, the water pump and the frequency converter were closed in a metal cabin. The maximum attainable fluid pressure in the sample basin, on the high-pressure or upstream side of the sample, was approximately 0.8 MPa for paper samples that offer a considerable flow resistance. In the case of empty sample basin, the maximum attainable pressure was c. 0.3 MPa due to the low flow resistance of the pressing plates. Although water could be circulated in either direction, the lower pressing chamber was chosen to be the upstream side in the measurements, and therefore flow direction was upwards. This arrangement was chosen as the lower pressing surface in the sample basin bottom could be covered by water after deaeration. When a saturated sample was then immersed in the sample basin, the upstream side of the sample was free of air bubbles. From the downstream pressure chamber, water could be either circulated back to the settling tank or, alternatively, to flow rate determination by an electronic scale. The temperature of the water was approximately 20 °C in all measurements.
0
2
4
6
8
10
12
-4 -2 0 2 4 6 8 10 12 14 16 18Difference from average height (µm)
Fra
ctio
n (%
)
0,01
0,1
1
10
100
Frac
tion
(%)
Distribution
Cumulative

45
Fig. 16 Schematic layout of the equipment used in the permeability measurements. Water circulation is shown with a thick line, electric data transfer and control connections with a thin dashed line, and pressure supply for the hydraulic cylinder with a thick dashed line.
3.7 TRANSDUCER SYSTEM The permeability device had transducers for measuring the thickness of the sample, water pressure, flow rate and compressive force (Fig. 13 and Fig. 16). Except for the flow rate measurement, all transducers produced an analogous electric signal proportional to the related physical stimulus, and were calibrated by comparing this electric signal with a known physical stimulus. Linear least-squares fits between the physical stimulus and the transducer signal produced coefficients with a linear correlation of 0.9995 or more for all transducers, indicating a generally accurate and regular operation. Since voltages were transformed to physical units by linear calibration functions, different error components were usually taken into account by defining the error of the physical quantity from scatter in the calibrator value-voltage data according to the equations presented in Appendix 2. Digitalisation and determination of the signal voltages was carried out with a data acquisition board, and the same arrangement was also used for voltage measurements in transducer calibration. The accuracy of the voltage measurement was ± 2.44 mV, owing to the magnitude of the least significant bit for a range of 0 - 10 volts and the number of output states (4096) of 12-bit AD-conversion. Conversion into the respective physical quantities was carried out by data acquisition software. The thickness of the sample was measured with three Schlumberger DG 1 displacement transducers installed symmetrically on the outside of the upper pressing chamber (Fig. 13). Transducers were calibrated by supplying a reference displacement with a digital Mitutoyo 390 micrometer head. By analysing the calibration data, the uncertainty of each displacement transducer is estimated to be ± 5 µm (Appendix 2). Since three identical transducers measure the (in principle) same thickness of the sample independently, the average of the transducers represents the best estimate of the thickness. Other sources of inaccuracy in the thickness measurement include unevenness of the pressing surfaces and elastic deformation of the structure of the permeability device under compression of the sample. Uniformity of the pressing surfaces is treated

46
in Sec. 3.5 and the flexing of device in Sec. 4.1. The difference in hydrostatic pressure over the sample was measured with two DS-Europe LS 634 transducers installed in the walls of the upper and lower pressing chambers. In addition, one transducer measured the fluid pressure of the sample basin at the level of the lower pressing surface (Fig. 13). The uncertainty of an individual pressure transducer was estimated to be approximately ± 1.5 kPa, but since the pressure difference requires two independent pressure values with similar uncertainty, the error in the pressure difference was approximately ± 2 kPa. Pressure loss due to flow resistance of the pressing plates may require a special correction which is treated in Sec. 4.3. The compressive mechanical force applied by the hydraulic cylinder was measured with a DS Europe HC 7010 strain-gauge load cell installed between the upper support plate and the upper pressing chamber (Fig. 13). Uncertainty of the compressive force was ± 0.09 kN, corresponding to c. ± 0.014 MPa of mechanical pressure in the sample basin. The effect of fluid pressure on the mechanical pressure was relevant only at the lowest degrees of compression, and is treated in Sec. 4.2. The weight of the water permeated through the sample was determined with the Mettler PM 2000 digital scale, and the volumetric flow rate was determined by measuring the rate of weight increase. For each flow rate measurement, twenty weight values were read, and the slope of a linear fit to the 20 measured points represented the flow rate. To assure the steadiness of the flow rate, the slopes of the first and last four measurement points were separately checked, and if either slope deviated by more than 20 % from the overall result, a warning was produced by the interface program. Based on scatter in the flow rate calibration data, the accuracy of the flow rate determination was estimated to be ± 5 %. Measured volumetric flow rate values were converted to average flow velocities by dividing them by the permeable area of the sintered plates, Aflow = 2680 mm2.
3.8 ASSEMBLY OF THE DEVICE In addition to dimensional uniformity of the components, their assembly eventually determines how parallel the pressing surfaces are and the co-axiality of their movement. Assembled pressing surfaces were checked by a mechanical dial indicator, which had a resolution of 5 µm. The measurement head of the instrument was spherical and 2 mm in diameter, large enough for not to interfere with the pores of the sintered plate. When measurement head was moved across the entire pressing surface at three locations, no obliquity or waviness was observable within the resolution of instrument.
4 MEASUREMENT TECHNIQUES Mechanical compression and measurement of thickness of the sample, while there is a flow of liquid through it, is a difficult combination of simultaneous tasks. Special measures were required in order to ensure a correct measurement of thickness under mechanical pressure, and of the pressure loss caused by the sample. Furthermore, the softness and plasticity of (wet) paper also necessitate a specific procedure for thickness determination. Results of such measurements can then be utilised in the permeability and compressibility measurements.
4.1 TECHNIQUES OF THICKNESS MEASUREMENT Even when the device was assembled acceptably, small but finite structural flexing took place under mechanical loading. Within the maximum mechanical load of the present work, deformation of device structures was found to be elastic and repeatable. This was verified by pressing soft and completely elastic materials, for which the same pressure and thickness were found under repeated pressings. Furthermore, Fuji Prescale pressure sensitive films were compressed between the pressing surfaces with varying loading. The spatial distribution of the mechanical pressure was visualised by the intensity distribution of red coloration of the film, caused by breaking of microscopic dye capsules due to mechanical pressure. The

47
pattern of the load distribution remained essentially similar as the load increased, and also in repeated pressings. These results indicate that the pressing surfaces do not undergo permanent deformation during the operation of permeability device, and that the elastic deformation is indeed very small. The correction to thickness data was determined by measuring the thickness of one, two and three similar sheets of paper with the compressive loading ranging from c. 0.15 kN to the maximal 20 kN, and for each value of the compressive force, the thickness of a hypothetical “zero sheet” was extrapolated from a linear fit to the measured points (Fig. 17). Thickness corrections of the three transducers are shown in Fig. 18 as a function of mechanical pressure. Error of the intercept of the linear fit was ± 7 µm. With this treatment, the distance between the pressing surfaces as a function of compressive force was estimated for each transducer without the risk of damaging sinters, which would be possible if contact of the hard surfaces were too strong. Based on the results of this measurement, real-time correction was then made of each transducer reading in the data acquisition program. Thickness correction remained unchanged as long as the components of the frame and pressing chambers remained intact and firmly attached. Fig. 17 Determination of thickness correction from the apparent thickness of 1 – 3 samples for three values of mechanical pressure. Data are from transducer 1.
-0,1
-0,05
0
0,05
0,1
0,15
0,2
0,25
0,3
0,35
0 1 2 3Number of sheets
Thi
ckne
ss (m
m)
0.025 MPa
1.0 MPa
3.2 MPa

48
Fig. 18 Thickness corrections as functions of mechanical pressure. The ± 7 µm error in the correction is marked on a few points of the transducer 1 data. In order to detect possible damages and changes in measurement device, and also to reduce systematic errors in the thickness measurement, the zero setting of the thickness reading was checked prior to each measurement. Checking was carried out by putting the pressing surfaces into a light contact with each other, under a low mechanical pressure of 0.03 MPa. Thickness of 0.000 mm was required, and usually met within the measurement error. If necessary, thickness reading was zeroed manually.
4.2 SURFACE CONTACT OF THE SAMPLE Due to the typically uneven surface and compressibility of paper, its thickness depends strongly on the way it is measured. In this work the contact or initial thickness hc of the sample was defined as a distance of the pressing surfaces at a mechanical pressure of 0.03 MPa. This pressure was considered to be the lowest which could be clearly distinguished from variation in the friction of the sample basin air-tight seal, when the lower chamber was slowly but continuously hoisted towards the upper chamber. The initial thickness was recorded when the compressive force first reached the preset value, without trying to stabilise the relaxing compressive stress. For such a low value of compressive force, the effect of structural flexing was negligible. Furthermore, the zero setting of the force and the thickness transducers was checked before every measurement, and build-up of fluid pressure was prevented during closing of the sample basin.
-0,1
-0,09
-0,08
-0,07
-0,06
-0,05
-0,04
-0,03
-0,02
-0,01
0
0 0,5 1 1,5 2 2,5 3 3,5Mechanical pressure (MPa)
Thi
ckne
ss c
orre
ctio
n (m
m)
Transducer 1
Transducer 2
Transducer 3

49
The firmness of contact between the sample and the pressing surfaces can be evaluated on the basis of fluid pressure measured by the transducer located in the side wall of the sample basin (Fig. 13). If the sample is out of contact with or just barely touching a pressing surfaces, the fluid pressure measured at the rim of the sample basin should be close to that at the pressing surface of the upstream (high pressure side) sintered plate, as suggested by the results for a sample at contact thickness in Fig. 19. Instead, if the sample has firm contact with the pressing surfaces, fluid pressure at the impermeable rim area of the sample basin is expected to be in between the pressures at the pressing surfaces of the upstream and downstream (low pressure side) sintered plates. This kind of behaviour was observed for samples at 15 % and 30 % compression, with mechanical pressures of c. 0.1 MPa and 0.25 MPa, respectively. Results for compressed samples indicate that pressure difference between the upstream pressing surface and rim is slightly less than a half of the pressure difference across the sample, when contact is firm. When the water pressure difference across the sample exceeded the mechanical pressure of the web, the firmness of the contact started to slacken and water pressure at the rim started to increase, as the behaviour of the sample with 15 % compression indicated (Fig. 19). Only estimations can be given of how fluid pressure is distributed within the impermeable rim area. When dyed water was driven through the sample, outline of the sintered plate and locations of its attachment screws become clearly visible from the coloured background. The part of the sample pressed between the impermeable rim areas of the pressing plates always remained uncoloured. This indicated that the flow did not circulate in the space between the rim areas, and that the fluid pressure probably remained approximately constant in the rim area. Therefore, it was estimated that a rim pressure Prim was effective in the rim area Arim, and a pressure P was effective in the sinter area Aflow, so that Ffluid = PrimArim+PAflow. Further elaboration to determine the effective area, or the pressure which exerts the force to or through the sintered plate, was considered unnecessary, since the forces caused by fluid pressure were usually insignificant in comparison with mechanical forces, except for measurements in which a low mechanical pressure was combined with high flow rates and fluid pressures. For those cases, the uncertainty dFfluid was estimated to be ± 16 kPa.

50
0
0,02
0,04
0,06
0,08
0,1
0,12
0,14
0 0,05 0,1 0,15 0,2 0,25 0,3Pup - Pdn (MPa)
P up
-Pri
m (M
Pa)
30% compression
15% compression
Contact thickness
Fig. 19 Fluid pressure difference between the upstream (high pressure) pressing surface and the rim of the sample basin (Pup -Prim) as a function of pressure difference across the sample (Pup – Pdn). Results are for three levels of mechanical compression of a 250 g/m2 blotter board sample. Effects of pressing plates are corrected for all data sets and a ± 0.003 MPa measurement error is marked on a few points of one data set.
4.3 TECHNIQUES OF PRESSURE MEASUREMENTS The inlets of hydrostatic pressure transducers are located in the upper and lower pressure chambers, and one in the rim of the sample basin at the level of the lower pressing surface. Since the pressure difference associated with fluid flow was measured by the transducers in the upper and lower pressure chambers, the pressure loss was caused not only by the sample, but also by the sinter plates and their support structures. This effect can be corrected by measuring the pressure differences between the upstream and downstream chambers of an empty device as a function of volumetric flow rate (Fig. 20), and then subtracting the pressure loss caused by the pressing plates from the total pressure loss measured with a sample. Although this correction reduces the systematic error, it also adds a new random error since measurement of pressure difference includes two determinations of pressure difference; one with a sample and the pressing plates and another with the pressing plates alone. A pressure correction with two independent pressure difference measurements with an uncertainty of ± 0.002 MPa produced an uncertainty of approximately ± 0.003 MPa in the corrected pressure difference. A linear fit was made to the correction data, and the resulting linear correction function was then applied to the results measured with the sample. Flow rates typically encountered in the permeability measurements of paper samples were of the order of 1 cm3/s or less. In such cases, pressure loss caused by the pressing plates was considerably lower than the typical pressure loss caused by the sample, which was of the order of 0.02 MPa or more (Fig. 21). In the regime typically used in the permeability measurements, the flow rate and pressure difference were linearly dependent, suggesting that inertial effects were not significant (Fig. 20). The necessity of pressure difference correction was estimated for each case by taking into account the magnitude of the correction and the increase of error.

51
For high flow rates pressure loss in the pressing plates was significant and a pressure difference correction was always carried out (Fig. 22). It was also found that the upstream (high pressure side) pressing plate caused most of the pressure loss for high flow rates, independently of the flow direction. For high flow rates the dependence between pressure loss and flow rate was also non linear, indicating the existence of significant inertial forces in the moving fluid. In this case, a second-order polynomial was fitted to the pressure loss data for an empty device in order to subtract this effect from the flow resistance of the paper sample (Fig. 22).
R2 = 0,988
0
0,0025
0,005
0,0075
0,01
0,0125
0,015
0,5 1 1,5 2 2,5 3 3,5Volumetric flow rate (cm3/s)
Pres
sure
diff
eren
ce (M
Pa)
Both plates
Upstream plate
Downstream plate
Fig. 20 Pressure loss caused by the pressing plates at low flow rates. A linear fit, and a few measurement errors, ± 0.002 MPa for the pressure difference and ± 5 % for the flow rate are also shown on data for both plates.

52
0
0,02
0,04
0,06
0,08
0,1
0 0,5 1 1,5 2 2,5Volumetric flow rate (cm3/s)
Pres
sure
diff
eren
ce (M
Pa)
Paper sample
Pressing plates
Fig. 21 Pressure loss caused by the pressing plates and a typical paper sample (65 g/m2 Fine). Measurement errors in the pressure difference were ± 0.002 MPa for the pressing plates and ± 0.003 MPa for the paper sample of which the effect of pressing plates was subtracted. Measurement error for the flow rate was ± 5 %.

53
0,001
0,01
0,1
0 5 10 15 20 25 30Volumetric flow rate (cm3/s)
Pres
sure
diff
eren
ce (M
Pa)
Both plates
Upstream plate
Downstream plate
Fig. 22 Pressure loss of the pressing plates at high flow rates. A few measurement errors of ± 0.002 MPa for the pressure difference and ± 5 % for the flow rate are marked on data for both plates and the downstream plate. Hollow markers denote measurements without any preliminary deaeration procedures. Pressure loss of the upper and lower pressing plates was frequently measured as a function of flow rate in order to control the cleanness of the sintered plates. The most recent data was then used for the pressure difference correction in every measurement. Increased pressure difference, in comparison with the previous measurements, was presumably caused by accumulation of small particles in pores of sinter plates. These particles originated from the inlet water, from the interior walls of the water vessels and tubing, or from the sample. Most waterborne particles were probably 5 µm or smaller in size due to the nominal cut-off size of the second filter, unless they were detached from the sample or interior walls of the permeability device, upstream from the sample. If an increase of pressure loss was observed, sinters were individually flushed by flow in the opposite direction than the one used in the measurements. Usually 30 to 60 minute flushing in the reverse direction with the maximum flow rate was sufficient to restore the original condition, but if a more profound cleaning was necessary, pressing plates were dismounted from the pressure chambers and treated with an ultrasonic cleaner and a bath of heated solvent solution. There are somewhat inconsistent experiences as for the need of air removal or deaeration of permeability devices [Carlsson83, Lindsay93b]. Present experiments suggest that, within the accuracy limits of pressure difference and volumetric flow determination, deaeration has no significant effect on the pressure loss of pressing plates of the present device (Fig. 22). The effect of deaeration was also tested with 250 g/m2 blotter board samples, with similar results; initially dry and well-saturated samples had an essentially similar pressure loss as a function of average flow velocity (Fig. 23). Therefore, it seems unlikely that air bubbles in the device or in the sample would cause significant errors in the measurements. Nevertheless, a deaeration procedure was carried out prior to every measurement session as follows: Water is first circulated through the water supply system with the maximum flow rate to remove air bubbles from water tubes. It was then pumped through the sintered plates with the maximum hydrostatic pressure in order to remove air and to saturate them completely. Prior to every measurement, sample basin in the lower pressing chamber was filled with water to ensure that the upstream side (assuming upward flow direction) of the sample remained free from bubbles. A saturated sample was then placed at the bottom of the sample basin against the lower pressing surface. Initially dry samples were saturated at least for quarter of an hour

54
prior to measurement. Device was there after closed by raising the lower chamber towards the upper one so that sealing enclosed the sample basin air-tightly. To remove the air that was possibly trapped under the upper pressing surface during chamber closure, lower chamber was moved further upwards so that water expelling from the sample basin drove possible air bubbles through the upper sintered plate. At this point the pressing surfaces were not driven into contact with the sample. When the sample basin was closed, water was pumped through the system at a slow rate for several minutes so as to make sure that all air was removed from the system. Fig. 23 Pressure loss of 250 g/m2 blotter board samples with no preliminary saturation (dry), with approximately 15 minutes of saturation (saturated) and with 24 h of saturation (wetted). The effect of pressing plates was subtracted from the data. Measurement errors of ± 0.003 MPa for ΔP and ± 5 % for v are marked in the saturated data.
5 ACCURACY OF THE MEASUREMENT SYSTEM The final measurement accuracy of the different relevant quantities depends on a number of factors: Accuracy of transducer operation, accuracy of transducer calibration, and accuracy of the corrections made to transducer readings. These effects are described in detail in the previous chapter. Here, these effects are summarised. The total error when measuring the thickness of the sample was assumed to be affected by the uncertainty of displacement transducers, the uncertainty involved in the correction of elastic deformation of device structures, and the unevenness of contact surface profiles. The uncertainties of transducer, voltage determination and displacement calibration produced a combined random error of ± 5 µm. Error in the correction of structural elastic deformation was estimated to be ± 7 µm. Finally, the unevenness of pressing
0,01
0,1
1
0 5 10 15 20 25Average flow velocity (mm/s)
Pres
sure
diff
eren
ce (M
Pa)
Dry
Saturated
Wetted

55
surfaces was found to be ± 3 µm per surface. Since these components were considered independent, they could be combined according to the principle of error propagation (Appendix 2), producing a total thickness uncertainty of ± 10 µm. Before each measurement, reading of thickness was reset to zero in order to reduce systematic errors in the measurement (Sec. 4.2). Due to similarity of the measurement principles, the apparent sheet thickness determined by the present device and by the SCAN- standardised hard-plate method (Sec 7.1) can be compared when the same mechanical pressure has been used in both measurements. Thus, sheets were measured in dry condition and under 0.1 MPa of mechanical pressure. With the present device, average thickness of Fine sheets was 110 ± 10µm, while it was 120 ± 10µm for News sheets (Fig. 30 ). The SCAN- standard thicknesses were 97 µm and 115µm for Fine and News sheets, respectively (Table 1). Taking into account the general ambiguities of the subject (Sec. 1.3), results agree reasonably. Sample materials are described in detail in Sec. 7.3 Determination of fluid pressure difference includes two independent pressure measurements with a combined measurement error of ± 0.002 MPa. If the volumetric flow through the sample was high enough so as to cause significant pressure loss in the sintered plates, this effect was subtracted from the total pressure difference caused by the sample and the pressing plates. In this case, measurement error resulted from those of two independent pressure difference determinations, with a combined uncertainty of ± 0.003 MPa. The uncertainty in the compressive mechanical pressure was ± 0.02 MPa, mainly due to properties of the force transducer. The effect of fluid pressure could be subtracted from the total compressive force as described in Sec. 4.2, producing a combined uncertainty of ± 0.025 MPa. The uncertainty of flow rate was estimated to be ± 5 %, based on scatter in the calibration data. The uncertainty of average flow velocity (volumetric flow rate divided by area of the sintered plate) was also ± 5 % since only a small measurement error is present (± 0.1 mm in diameter) in the area of sintered plate
6 MEASUREMENT PROCEDURE In this study, three kinds of measurement were carried out with the permeability device. Permeability and compressibility are basic properties of soft, porous media, important in their many applications. In addition, the effect of flow velocity on flow resistance is determined as this property is significant in practice. Permeability of fibrous materials was measured as a function of the solids content of the sample, or as a function of the mechanical pressure exerted on it. In these measurements, the difference in the fluid pressure across the sample was kept constant, while the solids content and mechanical pressure were gradually increased by increasing the mechanical compression. The thickness of the sample and the volumetric flow through it were measured at each measurement point. Compressibility measurements were carried out with a similar procedure, but without the presence of a difference in the fluid pressure across the sample. In this case the thickness and mechanical pressure alone were measured. Finally, the dependence of flow resistance on the flow rate of the fluid was measured by keeping the thickness constant, while the difference in the fluid pressure was increased. At each measurement point the volumetric flow of the fluid was measured.
6.1 PREPARATIONS Prior to measurements, air was removed from the permeability device tubings and sintered plates as completely as possible (Sec. 4.3). The sample was confined in the water filled sample basin, and the device was closed, but the pressing surfaces were not yet in contact with the sample. When the sample basin was closed, water was pumped through the sample and device at a slow rate to make sure that all air was removed from the system. When deaeration was completed, pressing surfaces were moved to be in contact with the sample. Contact or initial thickness hc of the sample was defined as the distance between the pressing surfaces when the mechanical pressure first time reached the value 0.03 MPa (Sec. 4.2). Initial thickness also defined the initial fibre volume fraction by Eq (13) or (14) of Appendix 1, using the dry mass of the sample (dried and weighted after the measurement) and estimated density of dry fibre material. After

56
the initial thickness hc was determined, the subsequent measurement procedure depended on which of the two types of measurement was performed.
6.3 PERMEABILITY AS A FUNCTION OF FIBRE VOLUME FRACTION In the case of porous and compressible webs of wood fibres, the primary interest is usually to know the permeability as a function of porosity of the medium. However, as mentioned above, effective porosity or the fraction of pore volume which conducts the fluid flow through the medium, is not directly measurable with present methods. Therefore, permeability measurements are in practise carried out as a function of mechanical pressure, compression, or fibre volume fraction, all of which can be readily determined. Information about effective porosity can then be estimated from the measured data. After the sample was in contact with the pressing surfaces, hydrostatic pressure difference was adjusted to a value which is known to keep the relation of flow rate and pressure difference within the validity limits of Darcy equation (Eq. (1)), but which still produces a measurable volumetric flow. A suitable pressure difference is usually found in the region 0.02 – 0.05 MPa. Pressure difference was selected according to requirements related to measurement of permeability as a function of flow velocity, which task was carried out first. The initial thickness and fibre volume fraction were determined by the first measurement point. In all measurement points, transducer readings were recorded at least twice, with a three minutes interval, in order to detect any possible time dependent phenomena. After repeated measurements for the same thickness, sample was slowly compressed to the next measurement thickness. Typically, 20 measurement points were recorded, up to maximum compression of 50 % - 70 % depending on the paper grade. Maximum compression was limited by a maximum allowable compressive force of 20 kN. Since (effective) porosity was the quantity to be adjusted by compression, thickness of the sample rather than compressive force was monitored during compression. Therefore, despite the considerable relaxation of stress of the fibre web as a function of time, no attempt was made to find stable values of compressive force in the course of permeability measurements. Fortunately, thickness was also found to be a much more stable quantity than compressive force. Inward creeping of the pressing surfaces was not observed even when mechanical stress of the fibre web was decreased considerably. Contact between the sample and pressing surfaces was monitored by reading the third fluid pressure transducer at the side wall of the sample basin (Sec. 4.2). Compressibility of samples was measured with the permeability device using a similar preparation of samples as in the permeability measurements. Initial thickness hc was determined again by the first occurrence of a compressive force of 0.03 MPa. Subsequent values of thickness and compressive force were recorded immediately after adjusting the thickness. Most samples were measured under wet condition, and for these measurements the device was water filled, but no fluid pressure was applied nor allowed to build up. For compressibility measurements of dry samples, the device was dried by compressed air.
6.4 PERMEABILITY AS A FUNCTION OF FLOW VELOCITY The extent to which fluid pressure difference ∆p and flow rate Q are linearly dependent, and thus the Darcy law (Eq. (1)) valid, was determined by measuring ∆p and Q up to sufficiently high values while keeping the sample thickness constant. For measurement of flow rate as a function of pressure difference, preparations of the device and the sample were the same as those described above. Fluid pressure difference was slowly increased to that in the first measurement point by increasing pressure on the upstream side of the sample. Transducer readings were then recorded with an interval of three minutes in order to detect possible time dependent phenomena. In the cases where a significant time dependence of flow resistance was encountered, measurements were repeated up to 15 minutes. After successive recordings under the same

57
conditions, pressure on the upstream side of the sample was slowly increased to that in the next measurement point. To find the response of fibre web to high fluid velocities, measurements were usually continued beyond the point where linear dependence between pressure difference and average flow velocity ceased. These measurements had typically about 20 measurement points, and pressure differences varied from 0.01 MPa to 0.5 - 0.8 MPa. Corresponding values of the average flow velocity varied, approximately, from 0.1 mm/s to 30 mm/s. The lower limit was determined by the sensitivity of flow rate measurement and pressure transducers, and the upper limit by the capacity of water pump or the flow rate measurement. Furthermore, in order to estimate the permanent structural changes on the fibre web due to fluid flow, the previously described measurement cycle was in some cases repeated several times. Despite the higher frictional force and strain associated with high flow velocities, samples with substantial mechanical compression evidently stayed in contact with the pressing surfaces. This was again deduced from the pressure difference between the upstream side of the sample and the rim of the sample basin (Sec. 4.2).
7 CHARACTERISATION OF THE SAMPLES
7.1 SAMPLE MATERIALS In present study, the effects of measurement device (its contact surfaces in particular) and the basis weight of the sample on its permeability were treated separately. So as to exemplify the permeability of paper as determined with the present device, a rather extensive assembly of paper samples were measured here. Altogether 22 different compositions of paper were measured, including mixtures containing non-wood particles and fibres. Paper samples were arranged in five series according to the properties that were varied in them. Most variables were typical of papermaking such that changes in the pore properties and permeability could be expected. Series 1 in Section 7.3 consists of samples made of typical chemical and mechanical pulps from industrial sources. Samples of this series had varying basis weight and degree of dryness. The rest of the series consists of handsheets made of pulps processed in the laboratory. Series 2 in Section 7.4 consists of samples made of chemical pulp with a varying degree of beating. Series 3 in Section 7.5 consists of samples of mechanical pulp with a varying proportion of mechanical fines. Series 4 in Section 7.6 consists of samples made of mixtures of chemical and mechanical pulp with varying proportions. Finally, in Section7.7, series 5 consists of mixtures of chemical pulp with viscose fibres and series 6 of their mixtures with talc particles. Fibre, pulp and sheet properties of paper materials were studied and characterised with methods described in Section 7.2.
7.2 CHARACTERISATION METHODS Samples were characterised according to fibre dimensions and structural properties of the fibre webs. Measurement of properties of the sample materials was mostly carried out according to the standard procedures in the pulp and paper industry. Length and width distributions of fibres from once-dried and decomposed samples were determined by optical Kajaani FS-200 analysis at Metso Mechanical Pulping Oy. Bauer-McNett fibre classification, Shopper-Riegler (SR) filtration test and Canadian Standard Freeness (CSF) filtration test results were available for some pulps. Also, measured values of sheet thickness, basis weight, density, light scattering coefficient and air permeability were available for some sample materials. Thin cross-sectional slices of some handsheet samples were also studied by image analysis methods to determine the number of cross-sectional dimensions of fibres and pore structures. These measurements were carried out and published by the Finnish Pulp and Paper Research Institute (KCL) [Niskanen99]. Standardised pulp and sheet measurements were carried out according to the appropriate SCAN- procedures. Bauer-McNett device fractionated the pulp according to fibre length by driving dilute fibre suspensions through a series of wire screens arranged by decreasing mesh size. Fibre length distribution was estimated by dry masses of the fibres restrained by each wire and dry mass of the fine particles passing through the wires. SR and CSF tests both describe filtration resistance of the pulp fibres by filtrating them

58
from a dilute suspension on a wire screen or on a perforated plate and measuring the flow rate of the water which penetrates through the thickening fibre layer. Sheet properties were determined from samples which were conditioned of 23 C° and a humidity of 50 %. Apparent thickness of the sheet was defined as the distance between two flat 200 mm2 measurement heads which were compressed by a pressure of 100 kPa. Density of paper was then given by basis weight divided by thickness. Light scattering coefficient was determined on the basis of the reflectivity of a single sheet against black background and the reflectivity of a non-transparent pile of sheets. Air permeability according to the Gurley method was determined as the time needed to permeate 100 ml of air through a dry sample [Aaltonen86]. The pressure difference created by the Gurley device was 1210 Pa, and the area available for permeation was 6.47 cm2 [Nilsson96]. These values could be inserted in Eq. (1) in order to determine the air permeability of a dry sample according to Darcy law, since air flow in a typical Gurley measurement seems to be viscosity-dominated, and gas dense enough to justify the assumption of a continuous medium [Knauf86]. In the FS-200- analysis, fibre length was measured from change in light polarisation by a single fibre, whereas cross-sectional dimensions were determined from digitised images of fibres. Fibres were fed into the analyser in a dilute water suspension, i.e. especially the cross-sectional dimensions represent fibres in a swelled condition. In the FS-200- analysis, fibres and particles were classified according to their length into groups with 50 µm spacing. Instead, the diameter of the fibre and the thickness of the cell wall were classified into groups with 1 µm spacing. Thus, 50 µm and 1 µm represent the resolution threshold for the length and width analysis, respectively. The length analysis consisted of measuring of the order of 105 fibres, of which c. 10 % was also analysed for their cross-sectional dimensions. Cross-sectional dimensions were used as they were recorded, whereas fibre length was represented by the median value of each group. Particles which appeared to be wider than the median length were omitted from further analysis. Averages of length, width and cell wall thickness were determined from the distributions as arithmetic averages without weighting by length or mass. Due to the measurement principles, all dimensions were projections of fibres, not taking into account bends or other irregularities of the shape. Fibres and fines were identified from width distributions based on results obtained for mechanical pulps with a similar device [Mörseburg99]. Three separate maxima were typically observed in all width distributions, two associated with fines and one with fibres. The maximum that was associated with more or less whole fibres was located around 20 µm. This maximum was pronounced in chemical pulps and much smaller in mechanical pulps. The two maxima that were associated with fines were located in intervals 1 - 4 µm, and 4 - 10 µm. For groundwood pulps, a narrow type of fines is characterised by a length-width ratio above 100, whereas wide fines have a length-width ratio of less than 40 [Mörseburg99]. Determination of the dimensions of the smallest particles of the pulp, i. e. fines, may have suffered from resolution limits and discretisation errors due to the size class distribution used in the analysis. All samples were air dried to over 0.9 solids content prior to the FS-200- analysis, and decomposed with an electronic mixer for the analysis. Detailed FS-200- results for fresh pulps of present samples were not available for all materials, but few available results for the average fibre length indicate a very slight shortening due to drying and reslushing (See Sec. 7.4). In the cross-sectional image analysis thin slices were cut and stained from dried handsheets embedded in epoxy. Geometric properties were determined by scanning at least 1200 lines through the digitised image in the z (thickness)- direction with a pixel size of 0.4 µm. Several images were analysed from each sample in order to obtain reliable results. Estimates of pore and fibre height were made directly from the scanning results. Interfibre porosity was estimated by the length fraction of pores in the scanned lines, considering the distance between the opposing surfaces of the fibre layer as the effective thickness of the sample. Coverage was determined by the average number of fibres along a scan line. The relative bonded area was determined by the average number of bonds per scan line divided by coverage. Finally, density of the fibre was estimated from the effective thickness, basis weight and porosity, including the volume of lumen in the volume of fibre [Niskanen99].

59
The estimate for dry fibre density ρf was based on density gradient column measurements [Carlsson83]. The dry fibre densities ρf = 1550 kg/m3 and 1450 kg/m3 were used in the present study for chemically and mechanically pulped fibres, respectively. Notice that values around 1550 kg/m3 are frequently quoted as the density of cell wall material in wood fibres [Paavilainen93b, Niskanen99]. Given the density of this magnitude, it is probable that the fibre volume does not contain much of intrafibre pores. In order to estimate the effect of fibre swelling on porosity of the sample, results of DSC measurement were utilised (Sec. 1.3.1). The DSC non-freezing water is evidently located in cell wall fissures small enough not to be removed by a mechanical pressures on the order of 6 MPa, whereas water with an altered freezing point is located in pores which start to collapse and drain approximately at 1 MPa. Thus, the non-freezing water represents most probably intrafibre porosity, but water with altered freezing temperature not necessarily. Moisture ratios of non-freezing and altered-freezing water per mass of dry fibre ( i.e. ratio Rm) as a function of mechanical pressure have been determined for unbleached softwood kraft (USK) (Fig. 24) and TMP (Fig. 25) [Maloney98]. While TMP and USK results are for never-dried pulp, dried USK closely followed the behaviour of never-dried TMP. Furthermore, the non-freezing DSC fraction was nearly independent of pulp type, suggesting that at least the non-freezing results can be considered realistic also for dried fibres. Values of Rm could be then used to determine the effective fibre volume fraction φf,eff using Eq. (13) of Appendix 1. Since a dry fibre density of 1550 kg/m3 (1450 kg/m3 for mechanical pulp)
apparently represents a maximum for wood materials, then the case of Rm = 0 represents the minimum fibre volume fraction φf,min, and the maximum interfibre porosity φi. Instead, φf,eff does not necessarily represent the real lower limit for φi, due to limitations of the DSC method to identify the intrafibre porosity as it is defined here.
y = 0,003x2 - 0,030x + 0,348
y = 0,77e-0,06x
0,20
0,30
0,40
0,50
0,60
0,70
0,80
0,01 0,1 1 10Mechanical pressure (MPa)
Moi
stur
e ra
tio (g
/g)
Altered freezing
Non-freezing
Fig. 24 DSC water fractions as a function of mechanical pressure for softwood kraft pulp [Maloney98].

60
y = 0,001x2 - 0,014x + 0,354
y = 0,63e-0,05x
0,20
0,30
0,40
0,50
0,60
0,70
0,80
0,01 0,1 1 10Mechanical pressure (MPa)
Moi
stur
e ra
tio (g
/g)
Altered freezing
Non-freezing
Fig. 25 DSC water fractions as a function of mechanical pressure for TMP [Maloney98].
7.3 CHEMICAL AND MECHANICAL PULP The samples of Series 1 were manufactured from softwood TMP pulp or mixture of pine and birch kraft pulp. These samples were denoted as News and Fine, respectively, according to their intended use in paper industry. Materials were supplied by Metso Paper Machines Oyj and originated from Finnish industrial sources. In the fibre length distributions of TMP and kraft pulp, one maximum was located at a typical length of softwood fibres of this study; just under 0.1 mm. Kraft pulp had another maximum at approximately 0.7 mm. This maximum was reported to represent birch fibres although hardwoods typically have shorter fibre lengths than softwoods (Fig. 26). This difference is not observable in the fibre width distribution, whose maximum for apparently intact fibres was approximately 20 µm in both cases. Instead, the maxima associated with fines widths, below 10 µm, were more pronounced in TMP than in kraft. Handsheets and machine paper were manufactured from both materials with a basis weight of 30 g/m2 to 120 g/m2. Samples were also used at different levels of initial dryness, beginning from handsheets with a solids content of c. 0.15, which was the lowest value at which samples could be handled without causing damage. Machine papers were received at 0.5 – 0.7 solids content. Solids contents above 0.7 were achieved by air-drying. Handsheets were manufactured in a laboratory mould according to principles of the SCAN-C 26:76 standard procedures, except for procedures of wet pressing and drying due to the wide range of solids content required. The FS-200- fibre length distributions for never-dried pulps were available for Fine and News. Results were essentially identical with those of the present analysis for once-dried handsheets. This indicates that the composition of machine- and laboratory-formed sheets is similar, without e.g. washout of smallest particles, and that decomposition of dried samples does not significantly affect the length distribution. Fibre, pulp and paper properties of Fine and News are shown in Table 1.

61
Table 1 Properties of the chemical and mechanical samples of Series 1. Samples are denoted according to their intended use in paper industry.
Name Fine News Pulp properties: SR (s) 23 70 FS-200 fibre analysis: ave. fibre length (mm) 0.71 0.53 ave. fibre diameter d (µm) 20 25 ave. cell wall thickness (µm) 7.2 8.9 fines 4 µm ≥ d ≥ 1 µm (%) 3 12 fines 10 µm ≥ d ≥ 4 µm (%) 7 19 fines 10 µm ≥ d ≥ 1 µm (%) 9 28 Sheet properties *: basis weight (g/m2) 70 45 density (kg/m3) 733 390 thickness (µm) 97 115
* Machine-made sheets.
Fig. 26 FS-200 distributions of length and width of softwood TMP pulp fibres (News), and mixture of softwood and hardwood kraft pulp fibres (Fine).
0
2
4
6
8
10
12
14
16
0.01 0.1 1 10Length (mm)
Frac
tion
(%)
News
Fine
0
1
2
3
4
5
6
7
1 10 100 1000
News
Fine
Width (µm)

62
Four series of handsheet samples were prepared at KCL according to the SCAN-C 26:76 standard procedures. The pulp and sheet properties, excluding the FS-200- analysis, were provided by the sample manufacturer. In each series, some pulp property was changed gradually within series of four to six otherwise identical samples in order to measure the permeability response. The basis weight of these handsheets series was approximately 65 g/m2. After forming, all samples were air dried to over 0.9 solids content and stored at room temperature and humidity prior to resaturation and permeability measurement. Therefore, some of the original pulp properties may be obscured by subsequent drying – resaturation phases.
7.4 BEATEN KRAFT In Series 2, effect on permeability of beating of chemical pulp is investigated. Samples were manufactured from pine kraft pulp and characterised the Shopper - Riegler (SR) filtration test, SR 13 representing an essentially unbeaten material. The rest of the series was increasingly beaten with a Valley beater device to SR values of 25, 35 and 45 by increasing the processing time. The length and width distributions were typical for chemical softwood fibres, with a slight increase in the fraction of particles with a diameter of 1 - 4 µm evidently associated with beating (Fig. 27). The FS-200- fibre length distribution for fresh, never-dried fibres was also available for Series 1 samples. Comparing with the present FS-200- analysis for once-dried fibres, only very small (approximately 0.5 %) shortening of fibres was found for dried and decomposed samples. This indicates that the drying and reslushing process with an electric mixer does not significantly change their length. The amount of fines remaind so small through the beating process that it was assumed to give only a minor effect on the compaction of fibre structure. In this case, the effect of beating seems to arise mainly from increased conformability and fibrillation of fibres (Table 2). Handsheet properties indicate more clearly typical effects of the increased flexibility and bonding ability of beaten fibres: Sheet thickness decreased and density increased, tensile strength increased, light scattering coefficient and air permeability decreased (Table 2). Assuming a fibre density of 1550 kg/m3, the minimum fibre volume fraction φf,min for dry sheets increased by approximately 20 % due to beating (Table 7). Also the results of cross-sectional scanning, although inconsistent, indicated reduction of porosity and pore height due to beating (Table 2). The dry fibre density as determined from cross-sectional scannings was approximately 1400 kg/m3 for all chemical softwood fibres. Comparing with the fibre density from literature (1550 kg/m3), the result suggests that some volume of the lumen and pores in cell walls was included in the fibre volume in the present case. Comparing with the results for fibre web models (Chapter 2.3), porosities and pore heights relative to web thickness were now approximately 45 % lower [Niskanen99].

63
Table 2 Properties of the samples in Series 2 made of chemical pulp with a varying degree of beating. Samples are denoted by their Shopper-Riegler test result. Name: SR13 SR25 SR35 SR45 Pulp properties: SR filtration (s) 13 25 35 45 CSF filtration (ml) 690 500 380 220 Bauer-McNett classification: in wire no. 14 (%) 56 55 57 55 in wire no. 28 (%) 22 21 21 18 in wire no. 48 (%) 10 10 10 10 in wire no. 200 (%) 6 6 6 7 through wire no. 200 (%) 5 8 6 10 FS-200 fibre analysis: ave. fibre length (mm) 1.15 1.00 1.00 0.97 ave. fibre diameter d (µm) 27.3 26.4 26.1 26.2 ave. cell wall thickness (µm) 9.5 9.7 9.7 9.8 fines 4 µm ≥ d ≥ 1 µm (%) 1 1 2 2 fines 10 µm ≥ d ≥ 4 µm (%) 4 5 5 6 fines 10 µm ≥ d ≥ 1 µm (%) 5 6 7 7 Handsheet properties: basis weight (g/m2) 64 64 63 63 density (kg/m3) 563 657 681 698 thickness (µm) 114 97 93 90 light scattering coef. (m2/kg) 30.2 22.1 21 20.9 elastic modulus (GPa) 2.06 5.33 5.86 6.28 tensile index (Nm/g) 23.6 80.9 89,7 92.7 Gurley air resistance (s) 1.1 9.7 26 110 Cross-sectional scanning: ave. pore height (µm) 6.0 4.5 4.6 4.9 ave. fibre height (µm) 5.6 5.7 5.6 5.7 porosity 0.45 0.34 0.37 0.37 coverage 8.4 7.3 9.0 7.4 relative bonded area 0.13 0.17 0.10 0.18 effective fibre density (kg/m3) 1356 1523 1271 1498

64
Fig. 27 FS-200 distributions of length and width of softwood kraft pulp fibres beaten to SR 13 and SR 45. The rest of the distributions for this series of samples are located in between the present ones.
7.5 FRACTIONATED TMP In Series 3 the effect of mechanical fines on permeability was investigated. Samples with varying content of smallest fines were manufactured by mixing intact and Bauer-McNett- fractionated TMP, which was produced by removing particles that pass a sieve of mesh size 200 (denoted as +200). Mixtures were manufactured in dry mass proportions of 100 %, 75 %, 50 %, 25 % and 0 % of the fractionated stock. The fraction +200 was selected as a variable since it has a small average particle size, and therefore a large surface area. The largest dimension of particles in the +200- fraction of TMP was found to be approximately 110 µm for elongated fibrillar fines and 58 µm for non-fibrillar flake-like fines [Luukko99]. The fibre length distributions and the average fibre lengths in Series 3 suggested that a sieve type device fractionates fibres largely according to the largest dimension of the fibre, since the average fibre length increased along with the proportion of fractionated pulp with no systematic changes in the width distributions (Fig. 28, Table 3). Width distributions, having large fractions of fines particles with a diameter of 1 µm < d < 4 µm, are typical of mechanical pulp. Handsheet properties change again more than fibre dimension changes alone would indicate. Expectedly, the light scattering coefficient increased somewhat. However, also sheet density increased and sheet thickness decreased, suggesting improved bonding. Decreased air permeability indicates a more compacted structure due to presence of +200- fines. The minimum fibre volume fraction φf,min of dry sheet increased slightly for a decreasing +200- fraction, from c. 0.35 to c. 0.30 (Table 7).
0
2
4
6
8
10
12
0.01 0.1 1 10Length (mm)
Frac
tion
(%)
SR 13
SR 45
0
1
2
3
4
5
1 10 100 1000Fr
actio
n (%
)
SR 13
SR 45
Width (µm)

65
Table 3 Properties of the samples in Series 3 made of TMP with a varying fraction of mechanical fines. Samples are denoted according to the proportion of +200 fraction.
Name: All +200 ¾ +200 ½ +200 ¼ +200 No +200 FS-200 fibre analysis: ave. fibre length (mm) 0.64 0.65 0.66 0.71 0.73 ave. fibre diameter d (µm) 24.9 25.2 25.2 25.3 24.8 ave. cell wall thickness (µm) 8.9 9.1 9.1 9.0 7.8 fines 4 µm ≥ d ≥ 1 µm (%) 15 14 14 12 12 fines 10 µm ≥ d ≥ 4 µm (%) 17 16 16 15 15 fines 10 µm ≥ d ≥ 1 µm (%) 28 28 27 25 24 Handsheet properties: basis weight (g/m2) 64 63 65 65 65 density (kg/m3) 525 497 489 459 436 thickness (µm) 122 127 132 142 149 light scattering coef. (m2/kg) 49.8 48.8 47.0 45.1 42.3 Gurley air resistance (s) 300 160 110 47 17
Fig. 28 FS-200 distributions of length and width of fibres for mixtures of fractionated and non-fractionated TMP. Percentages indicate the mass fraction of fractionated pulp.
0
2
4
6
8
10
12
0.01 0.1 1 10Length (mm)
0% (TMP)
50%
100%
0
1
2
3
4
5
6
7
1 10 100 1000
0% (TMP)
50%
100%
Width (µm)

66
7.6 KRAFT- GROUNDWOOD MIXTURES In Series 4, permeability properties of mixtures of chemical softwood kraft pulp and mechanical groundwood (GW) pulp were investigated. Samples were manufactured with chemical pulp dry mass proportions of 100 %, 80 % 60 %, 30 %, 10 % and 0 %. Kraft pulp had fibre dimensions typical of chemically pulped softwood fibres. Similarly to the TMP of Series 3, GW pulp had a large fraction of particles with a diameter of 1 µm < d < 4 µm. However, GW pulp also had another distinct fraction of particles, with 4 µm < d < 10 µm. The average fibre dimensions of kraft-GW mixtures were between the two extremes according to the proportion of the stock materials (Fig. 29 and Table 3). The bulk properties of dry sheets suggest that kraft pulp produced a more compact structure than GW pulp. Kraft sheet thickness was lower and density higher than those of GW sheets. Instead, the in-plane strength of kraft sheet was also lower. Samples with different kraft-GW fractions had bulk properties between those of pure kraft and GW samples, except for the in-plane strength which have maximum at 30 % kraft fraction (Table 4). Groundwood samples had a lower sheet density and higher thickness than the TMP samples of Series 3. Comparison with other sample series indicated that the kraft samples of Series 4 is bulkier and weaker than the comparable samples in Series 1, Series 2 and Series 5, despite of quite similar fibre properties. Assuming dry fibre densities of 1550 kg/m3 for kraft fibres and 1450 kg/m3 for GW fibres, the φf,min for a dry kraft sheet was c. 0.3 and c. 0.25 for dry groundwood sheet. The minimum fibre volume fractions of mixtures were between these two values (Table 7). Comparing the cross-sectional scan of GW sample with those of the beaten chemical pulp samples of Series 2, their interfibre porosities were approximately the same. Despite the lower basis weight of the mechanical sample, its coverage was higher and pore and fibre heights lower than those of the chemical sample. Therefore, it seems that the pore structure of a sheet of mechanical pulp is dispersed more finely than pores in a chemical sheet. Also, the unbounded exterior surface area of fibres seemed to be higher in the GW sheet since its coverage was higher and fibre dimensions smaller, but relative bonded area was rather similar in the kraft sheet (Tables T2 and T4). The density of dry GW fibres was considerably lower than that of kraft fibres (940 kg/m3 vs. 1400 kg/m3). Difference between the measured fibre density and the values reported in the literature value was also larger for GW fibres (940 kg/m3 vs. 1450 kg/m3) than for kraft fibres, suggesting that a considerable volume of lumen and intrafibre- and surface pores was included in the fibre volume for mechanically pulped fibres.

67
Table 4 Properties of the samples in Series 4 made of mixtures of softwood kraft pulp and groundwood pulp. Samples are classified by the dry mass proportion of kraft pulp. Name: 0 % 30 % 60 % 80 % 100 % FS-200 fibre analysis: ave. fibre length (mm) 0.37 0.46 0.66 0.78 0.99 ave. fibre diameter d (µm) 24.5 24.1 27.1 25.5 25.2 ave. cell wall thickness (µm) 8.7 8.6 8.1 8.9 8.7 fines 4 µm ≥ d ≥ 1 µm (%) 15 12 6 4 1 fines 10 µm ≥ d ≥ 4 µm (%) 29 25 14 12 5 fines 10 µm ≥ d ≥ 1 µm (%) 40 34 18 14 6 Handsheet properties: basis weight (g/m2) 64 66 65 65 65 density (kg/m3) 389 407 435 449 480 thickness (µm) 160 160 150 140 130 tensile index (Nm/g) 25.9 27.0 21.6 21.8 17.5 Cross-sectional scanning : ave. pore height (µm) 3.9 ave. fibre height (µm) 4.5 porosity 0.38 coverage 13.9 relative bonded area 0.16 effective fibre density (kg/m3) 939
Fig. 29 FS-200 distributions of the length and width of fibres in mixtures of groundwood and kraft pulp, classified by the mass proportion of kraft pulp.
0
2
4
6
8
10
12
14
16
18
0.01 0.1 1 10Length (mm)
Frac
tion
(%)
0% (GW)
60%
100%
0
1
2
3
4
5
6
1 10 100 1000
Frac
tion
(%)
0% (GW)
60%
100%
Width (µm)

68
7.7 MIXTURES WITH NON-WOOD MATERIALS In Series 5 the effect of uniform, synthetic fibres mixed with natural wood fibres was studied. Samples were manufactured by mixing slightly beaten pine kraft pulp with viscose fibres, with viscose dry mass proportions of 0 %, 25 %, 50 %, 60 % and 70 %. Viscose fibres were solid cylinders with a circular cross-section and a diameter of approximately 15 µm, and approximately 5 mm long. The density of the viscose fibre appears to be considerably lower than that of the wood fibre, according to estimated dimensions and coarseness of viscose fibres. A quantitative estimate for viscose density is approximately a half of that of the wood fibres, i.e. 750 kg/m3. The surface of the viscose fibres is known to be unfibrillated, and the tendency to form bonds and to absorb water is lower for viscose fibres. The handsheet properties of a pure kraft sheet resemble closely those of Series 2 samples. Addition of viscose fibres reduces sheet density and increases sheet thickness approximately linearly, so that a sheet with 70 % viscose has c. 55 % lower density, and c. 140 % higher thickness than a pure-kraft sheet. The minimum fibre volume fraction φf,min of dry sheets also decreases linearly from c. 0.4 to c. 0.3 with increasing viscose proportion. Due to the lower density of viscose, viscose fibres are much more abundant in the web than wood fibres already at medium viscose mass proportions. For dry sheets at 50 % mass proportion, the minimum volume fraction of viscose is c. 0.25, twice the φf,min of wood fibres (Table 5, Table 7 and Appendix 1). In Series 6, the effect of talc particles among fibres of kraft pulp was studied. Samples with basis weights of c. 33 g/m2, 42 g/m2 and 74 g/m2, and with talc dry mass proportions of 0 % and c. 45 % were compared. The mass proportion of talc was determined from the ash content of combusted sample. Talc particles have a planar shape and a size considerably smaller than the cross-sectional dimensions of the fibres [Niskanen98]. The tendency to form bonds is lower for the talc particles. The handsheet properties of a pure kraft sheet resembled again closely those of Series 2 samples. Overall, addition of talc decreased the dry sheet thickness and increased the density, both by approximately 10 % in comparison with sheets of pure kraft. Talc particles remained largely unbonded since the light scattering increased and the in-plane strength decreased with addition of talc. Due to the high density of talc (c. 2700 kg/m3) the minimum fibre volume fraction φf,min of dry sheets only increased a few percent due to presence of talc. The minimum volume fraction of talc was c. 0.10, which was a half of the φf,min of wood fibres. Distribution of talc particles can be further exemplified by comparing a 74 gsm talc-kraft sheet with a 42 gsm kraft sheet. The basis weights of the kraft fibers alone were closely equal in these samples. Then, adding 46.6 mass-% of talc among the 42 g/m2 fibres increased the sheet thickness from 75 µm to 106 µm, or by approximately 40 %. Even if talc was added as a solid layer, sheet thickness would increase c. 23 %. Apparently, the talc particles were numerous, but packed quite compactly among the fibres (Table 6, Table 7, and Appendix 1). Table 5 Properties of the samples in Series 5 made of mixtures of pine kraft pulp and synthetic viscose fibres. Samples are classified by dry mass proportion of viscose fibres.
Name: 0 % 25 % 50 % 60 % 70 % Handsheet properties: basis weight (g/m2) 66 68 67 68 69 density (kg/m3) 649 495 368 317 284 thickness (µm) 101 137 183 213 241 Gurley air resistance (s) 6.0 0.5 0.1 0.1 -
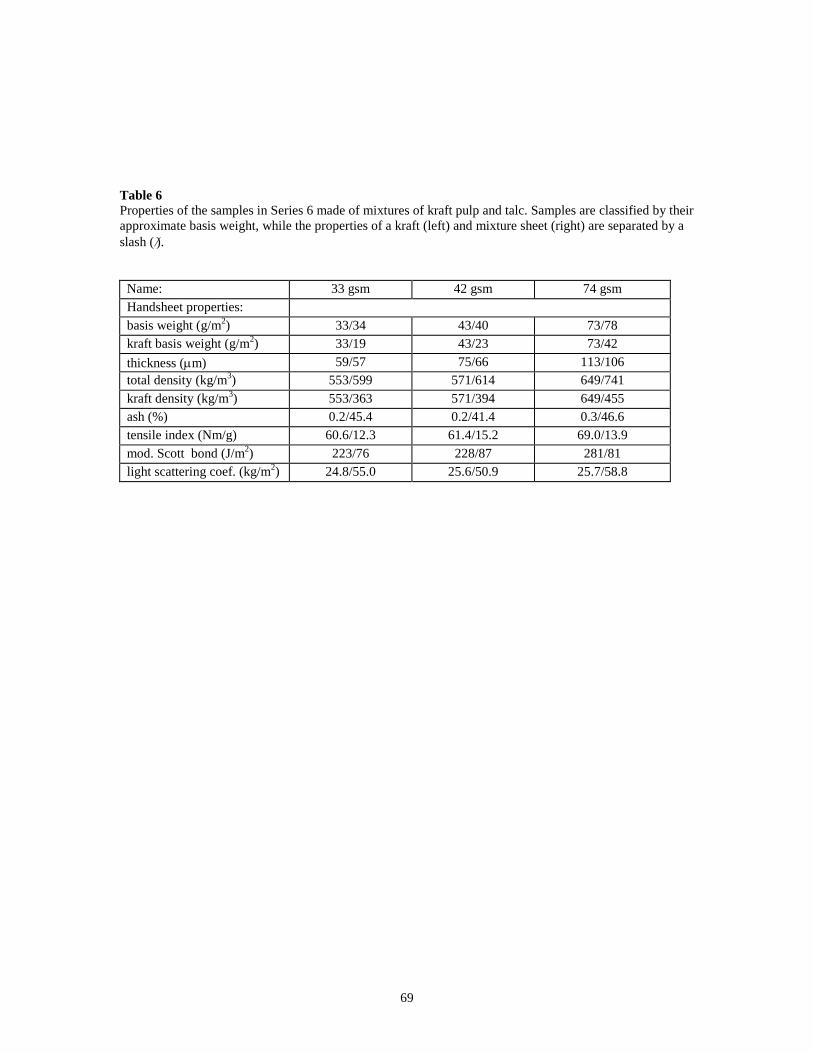
69
Table 6 Properties of the samples in Series 6 made of mixtures of kraft pulp and talc. Samples are classified by their approximate basis weight, while the properties of a kraft (left) and mixture sheet (right) are separated by a slash (⁄).
Name: 33 gsm 42 gsm 74 gsm Handsheet properties: basis weight (g/m2) 33/34 43/40 73/78 kraft basis weight (g/m2) 33/19 43/23 73/42 thickness (µm) 59/57 75/66 113/106 total density (kg/m3) 553/599 571/614 649/741 kraft density (kg/m3) 553/363 571/394 649/455 ash (%) 0.2/45.4 0.2/41.4 0.3/46.6 tensile index (Nm/g) 60.6/12.3 61.4/15.2 69.0/13.9 mod. Scott bond (J/m2) 223/76 228/87 281/81 light scattering coef. (kg/m2) 24.8/55.0 25.6/50.9 25.7/58.8

70
8 RESULTS In this Chapter results of the measurements are reported. In Section 8.1, expressions for permeability and compressibility are showed. In Section 8.2 we show the general characteristics of the thickness and volumetric flow measurements of paper materials. In Section 8.1.1 we discuss variation of results for a single sample, their variation for similar samples, and differences of results for different materials with respect to measurement errors. In Section 8.2 we show the effect of basis weight on permeability. The present results are compared with those reported previously in the literature in Section 8.2.1. Conclusions of the effect of basis weight are drawn in Section 8.2.2. The effect of roughness of the pressing surface with respect to the basis weight of the sample is also treated in this Section. In Section 8.3, we show the permeabilities of different paper materials and a felt. This Section is divided into subsections according to the treatment or composition of the pulp of which the samples were made. Section 8.3.1 treats the effects of beating of chemical pulp, Section 8.3.2 the effects of fines of mechanical pulp, Section 8.3.4 the effects of mixing chemical and mechanical pulp and Section 8.3.4 the effects of mixing viscose fibres or talc with chemical pulp. Permeability of a pressing felt is reported in Section 8.3.5. Results are summarised in Section 8.3.6. In Section 8.3.7 the present results are compared with those reported previously in the literature. In this Section difference between water permeability of paper and results for other fibrous media and simulations is discussed. Finally, in Section 8.3.8, conclusions are drawn on the permeability of different paper compositions. In Section 8.4, we discuss the increase in flow resistance when the flow velocity is increased. We report results for flow induced effects on sample structure, and compare with previously found such effects. In Section 8.4.1, conclusions are drawn on the effects induced by flow velocity.
8.1 EXPRESSIONS FOR PERMEABILITY RESULTS In order to describe the permeability of paper quantitatively, an explicit expression is required to relate it with some relevant, measurable quantities that describe the sample. That expression should at least reflect the essential dependence of the measured behaviour on structure of the sample. In this study, the state of the sample is characterised by two different quantities, the minimum volume fraction of fibres φf,min, and mechanical pressure Ps. The minimum volume fraction of fibres φf,min was selected due to its inevitable connection with the porosity (φ ) and permeability, and mechanical pressure Ps was selected due to its material-independence and straightforward determination. Compressibility of paper was characterised by expression that related φf,min and Ps. The fibre volume fraction was determined from the dimensions and dry mass of the sample by utilising the dry fibre density (Appendix 1). Therefore, φf,min was related to a hypothetical upper limit for interfibre porosity which include all pore volume available for fluid flow. Expressions for permeability and compressibility were selected on the basis of (semiempirical) fits to experimental data. The simplest expression that fulfils the above requirements, and generally offers good agreement with data, is a power law- type of expression. Such an expression has previously been used for relating the permeability and moisture ratio of paper [Carlsson83]. Thus, in this study, expressions of the form k = Aφf,min
B (6) and k = CPs
D (7) are used for quantifying permeability k, and an expression of the form φf,min = EPs
F (8)

71
is used for quantifying the compressibility of the sample. In these equations, scaling factors A, C and E describe the level of the permeability or φf,min, while exponents B, D and F describe their dependence on the argument. Power law equations agree very well with the measured compressibility and permeability data, as can be seen from figures shown in Sections 8.1.1, 8.2 and 8.3. Generally, the R-squared values of the fits were above 0.95 for all individual samples measured in this work, including those of different stock materials, dryness levels and basis weights. Furthermore, results provided by permeability expressions which are derived from fundamental fluid mechanics principles, are presented in Sec. 8.3.
8.1.1 MEASUREMENT RESOLUTION AND SAMPLE UNIFORMITY The measurement resolution and sample uniformity were evaluated from results for News and Fine handsheets and machine paper made of the stock materials of Series 1 (Sec. 7.3). Thickness results were compared to SCAN- standardised measurements for machine-made 70 g/m2 Fine sheets and 45 g/m2 News sheets. SCAN- thickness is determined by placing a dry sheet between two plates which are pressed against each other with 0.1 MPa pressure [Aaltonen86]. In the present device, the average thicknesses of dry sheets at 0.1 MPa were 105 µm for Fine and 124 µm for News (Fig. 30). Taking into account the measurement uncertainty, the thicknesses of Fine and News were 110 ± 10 µm and 120 ± 10 µm, respectively. These results agree reasonably well with their SCAN- standard thicknesses of 97 µm and 115 µm, respectively (Table 1). For the present device and samples, thickness variation between the transducers was typically 10 – 20 µm at the initial thickness, decreasing to approximately 5 – 10 µm at the highest compression (Fig. 31).
0,06
0,07
0,08
0,09
0,1
0,11
0,12
0,13
0,14
0,15
0,01 0,1 1 10Mechanical pressure (MPa)
Thi
ckne
ss (m
m)
Fine 1Fine 4Fine 3Fine 2News 1News 2
Fig. 30 Compression of dry Fine (70 g/m2) and News (45 g/m2) machine sheets. Measurement errors of ± 10 µm for thickness and ± 0.02 MPa for mechanical pressure are marked in a few measurement points of Fine

72
Fig. 31 Readings of three thickness transducers and their average for a single 70 g/m2 dry Fine machine sheet. Measurement errors of ± 10 µm for thickness and ± 0.02 MPa for mechanical pressure are marked in a few measurement points Fine and News samples were manufactured with basis weights in the range c. 40 - 70 g/m2 in order to test if the slight systematic differences in sample properties can be seen in measurements. These samples were measured in a never-dried condition, with an initial solids content of c. 0.7. The fluid pressure difference ∆p was 0.02 MPa and the mechanical pressure was up to 3.2 MPa. Usually, a minimum of five samples of each sample type was measured. It is evident from Fig. 32 and Fig. 33, that the News handsheets were generally bulkier than the Fine, and more compressible. Sample groups with c. 20 % difference in their basis weight were clearly discernible, despite the measurement uncertainty and the variation in their properties of individual samples. Variation of the chemical pulp samples, especially at low basis weight, appeared to be larger than that of the mechanical pulp samples (Fig. 32 and Fig. 33). In the samples of each group, the largest deviations of contact thickness hc and minimum thickness hmin were less than 15 % and 10 % of the group average, respectively. The largest deviation of dry mass mf was less than 5 % of the group average. Variation of thickness and basis weight in machine paper was somewhat lower than in handsheets.
0,07
0,08
0,09
0,1
0,11
0,12
0,13
0,14
0,01 0,1 1 10Mechanical pressure (MPa)
Thi
ckne
ss (m
m)
Transducer 1
Transducer 2
Transducer 3
Average

73
0,01
0,1
1
10
0,020,060,10,140,180,22Thickness (mm)
Flow
rat
e (c
m3 /s)
News 41 gsm
News 52 gsm
Fig. 32 Flow rate across the sample as a function of thickness for five samples of never-dried News handsheets of two basis weights with an identical fluid pressure difference and an identical range of mechanical pressure. Measurement errors of ± 10 µm for thickness and ± 5 % for flow rate are marked in the results of one sample per basis weight.

74
Fig. 33 Flow rate across the sample as a function of thickness for five samples of never-dried Fine handsheets of two basis weights with an identical fluid pressure difference and an identical range of mechanical pressure. Measurement errors of ± 10 µm for thickness and ± 5 % for flow rate are marked in the results of one sample per basis weight. Since the experimental determination of permeability was based on Darcy’s law (Eq. 1), the uncertainty of the permeability measurement (dk) was estimated by applying the principle of error propagation (Appendix 2) in which the uncertainties of fluid pressure difference, thickness, flow rate and cross-sectional area for the fluid flow were used (Chapter 5). Since the flow resistance of sintered plates was insignificant for low flow rates, the related correction of ∆p was omitted. Thus, dk was approximately 15 % of the measured value. Similarly, uncertainty of φf,min was affected by the measurement uncertainties of mass and especially of the dimensions of the sample, causing dφf,min to increase approximately from 5 % to 15 % for increasing compression. The uncertainty of mechanical pressure (dPs) was mostly affected by the uncertainty of force measurement, and could exceed 20 % for a few first measurement points, but reduced down to about 0.1 % at high mechanical pressures. In Fig. 34 to Fig. 39, the measured permeability and compressibility data are shown for five samples per sample type, including the samples of Fig. 32 and Fig. 33. An appropriate power law expression was fitted to each data set or, in cases with little sample variation, to a larger group of samples. Measurement uncertainties are then applied to the fitted curves.
0,01
0,1
1
10
0,020,060,10,140,180,22Thickness (mm)
Flow
rat
e (c
m3 /s)
Fine 44 gsm
Fine 61 gsm

75
0,15
0,2
0,25
0,3
0,35
0,4
0,45
0,5
0,55
0,6
0,01 0,1 1 10Mechanical pressure (MPa)
Min
. fib
re v
olum
e fr
actio
n
Laboratory 41 gsm
Laboratory 52 gsm
Factory 43 gsm
φ f,min = 0.4 P s0.18
Fig. 34 Minimum fibre volume fraction φf,min of 15 never-dried News handsheets and factory samples as a function of mechanical pressure Ps. A power law expression was fitted to the data, and measurement errors are marked on the fit.

76
1E-17
1E-16
1E-15
1E-14
0,01 0,1 1 10Mechanical pressure (MPa)
Perm
eabi
lity
(m2 )
Laboratory 52 gsm
Laboratory 41 gsm
Factory 43 gsm
k = 1.6*10-16 P s-0.9
Fig. 35 Permeability k of 15 never-dried News handsheets and factory samples as a function of mechanical pressure Ps. A power law expression was fitted to data, and measurement errors are marked on the fit.

77
1E-17
1E-16
1E-15
1E-14
0,1 0,2 0,3 0,4 0,5 0,6 0,7Minimum fibre volume fraction
Perm
eabi
lity
(m2 )
Laboratory 41 gsm
Laboratory 52 gsm
Factory 43 gsm
k = 3.1*10-18 φ f,min-4.9
Fig. 36 Permeability k of 15 never-dried News handsheets and factory samples as a function of minimum fibre volume fraction φf,min. A power law expression was fitted to data, and measurement errors are marked on the fit.

78
0,2
0,25
0,3
0,35
0,4
0,45
0,5
0,55
0,6
0,01 0,1 1 10
Mechanical pressure (MPa)
Min
. fib
re v
olum
e fr
actio
n
Laboratory 44 gsm
Laboratory 61 gsm
Factory 64 gsm
φ f,min = 0.5 P s0.13
Fig. 37 Minimum fibre volume fraction φf,min of 15 never-dried Fine handsheets and factory samples as a function of mechanical pressure Ps. A power law expression was fitted to the data and measurement errors are marked on the fit.

79
1E-17
1E-16
1E-15
1E-14
0,01 0,1 1 10Mechanical pressure (MPa)
Perm
eabi
lity
(m2 )
Laboratory 44 gsm
k = 23*10-17 P s-0.8
Fig. 38 Permeability k of five never-dried Fine handsheets as a function of mechanical pressure Ps. A power law expression was fitted to the data, and measurement errors are marked on the fit.

80
1E-17
1E-16
1E-15
1E-14
0,2 0,3 0,4 0,5 0,6 0,7Min. fibre volume fraction
Perm
abili
ty (m
2 )
Laboratory 44 gsm
k = 3.5*10-18 φ f,min-5.3
Fig. 39 Permeability of five never-dried Fine handsheets as a function of minimum fibre volume fraction φf,min. Power law equation is fitted to data and measurement errors marked on the fit. The results for News were fairly uniform, even when results for 41 g/m2 and 52 g/m2 handsheets and 43 g/m2 factory sheets were all shown in the same figure (Fig. 34 – Fig. 36). Fitting parameters A and B were essentially the same for all three series of samples, thus the average trend of fifteen samples can be considered representative for this material. Instead, the Fine samples, especially the lighter 44 g/m2
handsheets, exhibited more variation in permeability than News samples of comparable basis weight (Fig. 39). Although there was less variation in the results of heavier Fine samples, the permeability behaviour of different samples varied so that the negative exponent B increased for increasing basis weight, and the machine made samples had a slightly smaller coefficient A than the handsheets (Fig. 39 and Fig. 40). However, the compression behaviour of Fine samples was again fairly uniform for all sample types (Fig. 37). The variations of thickness and dry mass between samples were similar in Fine and News samples, in the former case less than 15 % of the average, and the latter case less than 5 %. The spatial variation of basis weight (formation value) is more sensitive measure for the spatial variation of web structure, although the cross-sectional area of the β-particle beam (1mm2) in the formation tester was probably too large to recognise, e.g. the individual empty locations in the fibre network. The standard deviation of local basis weights of the Fine handsheets and factory papers was 5.6 % of the average basis weight, whereas the comparable News handsheets and factory papers had formation values of 7.2 % and 7.9 %, respectively. These features suggest that the higher permeability variation between individual Fine samples is not a consequence of worse formation, but of different web structures of the two materials. Since no cross-sectional scanning was made for the Fine or News samples, their coverages can be estimated by comparison with the samples of similar pulp and sheet properties. Taking into account differences in basis weight, the coverage of the Fine was estimated from the SR 45 of the Series 2, and the coverage of the News from the 0 % kraft-groundwood mixture of the Series 4 (Sec. 7.2). Thus, for the 41 g/m2 News samples c ≈ 9, while for the 44 g/m2 Fine samples c ≈ 5. Assuming that the spatial distribution of fibres is given by the Poisson distribution, the probability of pinholes is higher by a factor of 55 for c ≈ 9 than for c ≈ 5, even without considering the unevenness of formation. Recalling that simulations gave a higher permeability in 2D than in 3D (Fig. 10), and that the dominating effect on the simulated permeability of

81
disordered fibre webs was that of vacant locations, low coverage can explain the wide permeability variation of the Fine samples. The increasing variation between the samples with increasing compression can be explained by the same fact. At a low compression and lowφf,min, the complex and tortuous (3D) part of the pore volume is also highly permeable. For increasing compression, 2D locations of the network essentially preserve their permeability while in 3D structures it decreases, since coverage remains the same in compression.
1E-17
1E-16
1E-15
1E-14
0,2 0,3 0,4 0,5 0,6 0,7Min. fibre volume fraction
Perm
abili
ty (m
2 )
Laboratory 61 gsm
Factory 64 gsm
k = 0.4*10-18 φ f,min-6.6
Fig. 40 Permeability of ten never-dried Fine samples as a function of minimum fibre volume fraction φf,eff. A power law expression is fitted to the data, and measurement errors are marked on the fit. These results indicate that the resolution of the permeability device is good enough for clearly discerning the thickness and flow rate of samples with c. 20 % difference in their basis weight, with error of approximately ± 15 % in the permeability, and with varying error limits for φf,min and Ps. For the materials used in this study, these results indicate that mechanical pulp forms webs with a uniform dependence of k on φf,min at a basis weight of c. 40 g/m2, while the webs with a of similar basis weight of chemical pulp show a more sample dependent variation and a varying k(φf,min) behaviour.
8.2 THE EFFECT OF BASIS WEIGHT The higher permeability of lightweight samples compared to that of otherwise identical, but heavier samples has been observed in a number of previous studies (Sec. 1.4). Since the permeability behaviour of the Fine samples varied depending on basis weight, in contrast with that of the News samples (Sec. 8.1.1), this phenomenon is now studied for a wider range of basis weights, and also for samples with varying stock material and drying history. Most samples were machine-made from the stock materials of Series 1 (Sec. 7.3), similar to samples of the previous section. In order to observe the effects of e.g. varying formation and z-directional material distribution, measurements were done on single-sheet samples and stacks of samples cut from the same sheet. Single-sheet Fine samples had basis weights of 38 g/m2, 73 g/m2 and 114 g/m2, with a maximum solids content of approximately 0.5 prior to the measurement. In addition, lightweight

82
handsheets with basis weight of 33 g/m2, 42 g/m2 and 74 g/m2 of Series 6 (Sec. 7.7) were measured. These samples were air-dried to over 0.9 solids content prior to the measurement. The stacked samples contained one to four 64 g/m2 factory Fine sheets, or one to four 42 g/m2 factory News sheets. All stacked samples were air dried to over 0.9 solids content prior to the measurement. Permeabilities of samples of Series 1 and Series 6 with varying basis weight are shown in Fig. 41 - Fig. 44 as a function of the minimum fibre volume fraction φf,min. For clarification, a power law fit to the data is shown only for the lightest and heaviest samples, and in some cases measured values for the lightest and heaviest samples alone are shown. Results for samples of varying basis weight followed the trend indicated in the previous section: For the News samples made of mechanical pulp, permeability at given φf,min was rather uniform, and no basis weight dependence was observable in News samples of 42 - 167 g/m2 (Fig. 44). In contrast with this, in Fine samples made of chemical pulp, permeability of light and heavy samples was the same only at the initial condition with a low φf,min. Thereafter the permeability of heavy samples decreased more rapidly for increasing φf,min. Still, this effect was rather marginal in most cases; although lightest samples seemed to follow this trend, wide error margins made the result inconclusive (Fig. 41 and Fig. 43). The main reason for this large uncertainty in φf,min was the thinness of the lightweight samples in respect to uncertainty in the thickness measurement. Only for the two sample sets with the largest difference in their basis weights (256 g/m2 vs. 64 g/m2), the decrease in permeability with increasing φf,min was unambiguously steeper for heavier samples (Fig. 42).
1E-18
1E-17
1E-16
1E-15
1E-14
1E-13
0,1 0,2 0,3 0,4 0,5 0,6 0,7 0,8Min. fibre volume fraction
Perm
eabi
lity
(m2 )
38 gsm
114 gsm
k = 1.7*10-18 φ f,min-5.8
Fig. 41 Permeability of ten never-dried Fine single-sheet samples of Series 1 as a function of minimum fibre volume fraction φf,min. A power law fit to the data is also shown, and measurement errors are marked in the fit.

83
1E-17
1E-16
1E-15
1E-14
0,2 0,3 0,4 0,5 0,6 0,7 0,8Min. fibre volume fraction
Perm
eabi
lity
(m2 )
64 gsm
128 gsm
256 gsm
k = 4.4*10-18φ f,min-6,2
k = 0.2*10-18 φ f,min-8.1
Fig. 42 Permeability of dried Fine samples composed of 1, 2 or 4 sheets of Series 1. Power law fits to the data for the lightest and heaviest samples are also shown, and measurement errors are marked in the fits.

84
1E-16
1E-15
1E-14
1E-13
0,2 0,3 0,4 0,5 0,6 0,7Min. fibre volume fraction
Perm
eabi
lity
(m2 )
33 gsm
74 gsm
k = 934*10-18φ f,min-2.6
k = 51*10-18φ f,min-4.5
Fig. 43 Permeability of dried handsheets of Series 6 made of chemical pulp. Power law fits to the data are also shown, and measurement errors are marked in the fits.
1E-17
1E-16
1E-15
1E-14
0,1 0,2 0,3 0,4 0,5 0,6 0,7Min. fibre volume fraction
Perm
eabi
lity
(m2 )
42 gsm
84 gsm
125 gsm
167 gsm
k = 1.3*10-18φ f,min-5.0
Fig. 44 Permeability of dried News samples composed of 1, 2, 3 or 4 sheets of Series 1. A power law fit to the data is also shown, and measurement errors are marked in the fit.

85
Prefactors and exponents of power law fits for all basis weights of Series 1 and 5 are shown as a function of W in Fig. 45, Fig. 46 and Fig. 49, including the results shown in Sec. 8.1.1. The influence of basis weight on exponent B of Eq. (6) is evident in chemical pulp samples. B increases rapidly from - 2.5 to - 7.5 with increasing basis weight up to 100 g/m2, and levels off thereafter. Also, coefficient A levels off to about 10-18 m2 for the heavy samples, while the samples whose basis weight is below 100 g/m2 have considerably larger values (Fig. 45). Instead, the samples made of mechanical pulp have B = -5, and their A is about 10-18 m2 for all basis weights from 42 g/m2 to 167 g/m2 (e. g. Fig. 36 and Fig. 44).
0,1
1
10
100
1000
10000
0 50 100 150 200 250 300
Basis weight (g/m2)
A (
x10-1
8 m2 )
Chemical
Mechanical
2
3
4
5
6
7
8
9
0 50 100 150 200 250 300Basis weight (g/m2)
| B|
Chemical
Mechanical
Fig. 45 Values of coefficient A (left) and exponent |B| (right) in the power law relation k = A φf,min
B as a function of basis weight for samples made of chemical and mechanical pulp. Curves are guides for the eye. Thus, the approximate limits of basis weight for uniform permeability behaviour were 100 g/m2 for the Fine samples, and 42 g/m2 or below for the News samples, since no basis weight dependence was observed for the latter. Coverages corresponding to these threshold basis weights could be again estimated by comparison with the SR 45 sample of Series 2, and with the groundwood sample of Series 4 (Sec. 7.2). The threshold coverage of the 100 g/m2 Fine was approximately 11, and approximately 9 for the 42 g/m2 News. These values are close to transition from 2D to 3D structure, since voids are expected to form in the thickness direction at coverage of 2 - 10, depending on the flexibility and cross-sectional aspect ratio of fibres [Niskanen98]. Our results suggest that fibre network of the Fine samples was transformed into a 3D structure around c ≈ 10. In networks with a lower coverage, 2D locations are more abundant, which generally increases the permeability and makes it more tolerant against compression. For the News samples, a 3D structure is apparently achieved already at a coverage of c < 10.

86
1
10
100
1000
0 50 100 150 200 250 300Basis weight (g/m2)
C (
x 10
-17 m
2 )
Chemical
Mechanical
0,2
0,4
0,6
0,8
1
1,2
0 50 100 150 200 250 300Basis weight (g/m2)
|D|
Chemical
Mechanical
Fig. 46 Values of coefficient C (left) and exponent |D| (right) in the power law relation k = C Ps
D as a function of basis weight for samples made of chemical and mechanical pulp. When permeability k was plotted as a function of Ps, samples with a basis weight of less than 100 g/m2 had more variation than the heavier ones. Again, samples made of chemical pulp had more variation than those made of mechanical pulp. The coefficient C of Eq. (7) was about 10-17 m2 and exponent D ≈ 1 for all samples with a basis weight of more than 100 g/m2, including those made of chemical pulp (Fig. 46).

87
0,2
0,3
0,4
0,5
0,6
0,7
0,8
0,01 0,1 1 10Mechanical pressure (MPa)
Min
. fib
re v
olum
e fr
actio
n
64 gsm
128 gsm
256 gsm
φ f,min = 0.6 P s0.17
Fig. 47 Minimum fibre volume fraction φf,min of dried Fine samples of Series 1, composed of 1, 2 and 4 individual sheets. Also shown is a power law to all data points. Measurement errors are indicated in the fit.
0,2
0,3
0,4
0,5
0,6
0,7
0,8
0,01 0,1 1 10Mechanical pressure (MPa)
Min
. fib
re v
olum
e fr
actio
n
114 gsm
38 gsm
φ f,min = 0.5 P s0.18
Fig. 48 Minimum fibre volume fraction φf,min of never-dried Fine single-sheet samples of Series 1. Also shown is a power law to all data points. Measurement errors are indicated in the fit.

88
0,1
0,2
0,3
0,4
0,5
0,6
0,7
0 50 100 150 200 250 300Basis weight (g/m2)
E ,
F E, chem.
F, chem.E, mech.
F, mech.
Fig. 49 Values of coefficient E and exponent F in the power law relation φf,min = E Ps
F as a function of basis weight for samples made of chemical and mechanical pulp. Compression properties (φf,min vs. Ps) of samples of different basis weights were quite uniform and independent of whether the samples were made of chemical or mechanical pulp. Coefficients E and F of Eq. (8) varied less than the coefficients of permeability properties (Fig. 49). The lightweight Fine samples seemed to have a slightly higher φf,min than the heavy ones for a given Ps, as expected due to pore formation in the thickness direction when there is the 2D to 3D transition [Niskanen98]. However, wide error margins again made the results inconclusive (Fig. 48). Also, compressibility and permeability measurements react differently to local variations of paper since compressibility depends on properties of the solid fraction while the permeability depends on properties of the (interfibre) pores. Since compressibility is measured with rigid pressing plates, any stiffness resists the motion of the entire pressing plate, irrespective of whether fibres are evenly or unevenly distributed in the sample area. Instead, fluid pressure affects the whole sample area driving the fluid through the permeable locations independent of less permeable site, increasing the permeability of the whole sample.
8.2.1 BASIS WEIGHT EFFECT IN THE LITERATURE There are only few systematic studies of permeability as a function of the basis weight of the sample material. Water permeability measurements of bleached kraft samples of 135 - 400 g/m2 consistently showed a higher permeability for the lowest basis weight [Lindsay93b]. Instead, the air permeability measurements of uncalandered newsprint of 52 - 260 g/m2 displayed a minor dependence on basis weight [Koivu09]. Despite the differences in the measurement methods and devices, the present study qualitatively agrees with these results: Basis weight affects more the permeability of samples made of chemical pulp than mechanical pulp. Apparently the most comprehensive study concerning the effect on permeability of basis weight is reported in Ref. [Vomhoff00]. In Vomhoff’s study, thicknesses of these samples were considered undetermined due to contact surface roughness, and Darcy’s equation was modified by substituting the thickness by the basis

89
weight. The resulting quantity was called the modified permeability, denoted here as k* [Vomhoff00]. For comparison, k* was determined here for the samples made of stacked Fine and News sheets. According to the material properties available (Sec. 7.3), these sample materials can be considered to provide rather close match with the bleached softwood kraft (SBK) and thermomechanical pulp (TMP) used in Vomhoff’s study. In Vomhoff’s results, the effect of basis weight was much stronger than in present results. Modified permeability decreased with increasing basis weight much more, and levelled off at a higher basis weight in Vomhoff’s study than in the present study. However, these two studies qualitatively agree in that the inference of basis weight is stronger for samples made of chemical than mechanical pulp: k* decreased more with increasing basis weight, and k* levelled off at a higher basis weight for SBK and Fine than for TMP and News samples (Fig. 50 and Fig. 51).
1E-17
1E-16
1E-15
1E-14
1E-13
1E-12
1E-11
0 100 200 300 400 500 600
Basis weight (g/m2)
Mod
ified
per
mea
bilit
y (k
g/m
SBKSBKFineFine
0.5 MPa
0.5 MPa
2.6 MPa
2.7 MPa
Fig. 50 Modified permeability k* of stacks of SBK sheets [Vomhoff00] and stacks of Fine sheets of Series 1 for two levels of mechanical pressure. Curves are guides for the eye.
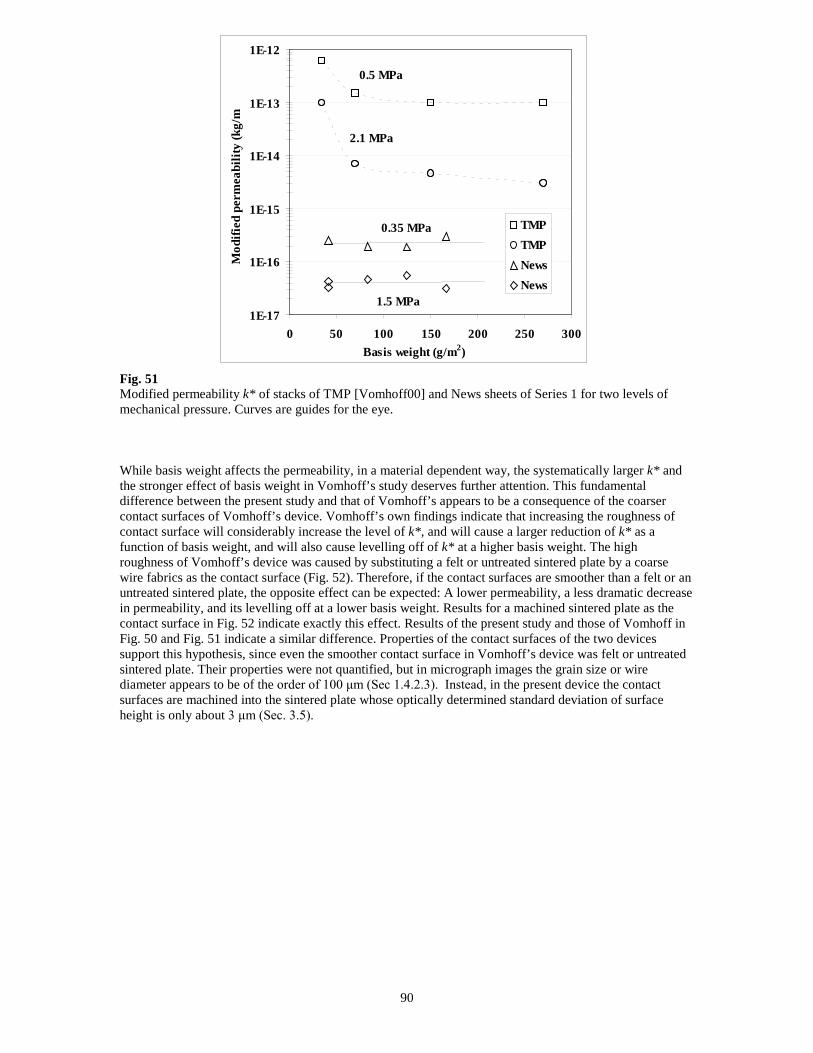
90
Fig. 51 Modified permeability k* of stacks of TMP [Vomhoff00] and News sheets of Series 1 for two levels of mechanical pressure. Curves are guides for the eye. While basis weight affects the permeability, in a material dependent way, the systematically larger k* and the stronger effect of basis weight in Vomhoff’s study deserves further attention. This fundamental difference between the present study and that of Vomhoff’s appears to be a consequence of the coarser contact surfaces of Vomhoff’s device. Vomhoff’s own findings indicate that increasing the roughness of contact surface will considerably increase the level of k*, and will cause a larger reduction of k* as a function of basis weight, and will also cause levelling off of k* at a higher basis weight. The high roughness of Vomhoff’s device was caused by substituting a felt or untreated sintered plate by a coarse wire fabrics as the contact surface (Fig. 52). Therefore, if the contact surfaces are smoother than a felt or an untreated sintered plate, the opposite effect can be expected: A lower permeability, a less dramatic decrease in permeability, and its levelling off at a lower basis weight. Results for a machined sintered plate as the contact surface in Fig. 52 indicate exactly this effect. Results of the present study and those of Vomhoff in Fig. 50 and Fig. 51 indicate a similar difference. Properties of the contact surfaces of the two devices support this hypothesis, since even the smoother contact surface in Vomhoff’s device was felt or untreated sintered plate. Their properties were not quantified, but in micrograph images the grain size or wire diameter appears to be of the order of 100 μm (Sec 1.4.2.3). Instead, in the present device the contact surfaces are machined into the sintered plate whose optically determined standard deviation of surface height is only about 3 μm (Sec. 3.5).
1E-17
1E-16
1E-15
1E-14
1E-13
1E-12
0 50 100 150 200 250 300Basis weight (g/m2)
Mod
ified
per
mea
bilit
y (k
g/m
TMPTMPNewsNews
0.35 MPa
0.5 MPa
2.1 MPa
1.5 MPa

91
Fig. 52 Modified permeability k* of stacks of SBK [Vomhoff00] and Fine sheets of Series 1 for different contact surfaces. Curves are guides for the eye.
8.2.2 CONCLUSIONS CONCERNING THE EFFECT OF BASIS WEIGHT The results presented above indicate that basis weight affects the permeability of the sample such that increasing basis weight increases its dependence on the volume fraction of fibres φf,min. At low φf,min, heavy and light sheets have an approximately similar permeability, but for increasing φf,min, the permeability of the heavier sheet decreases more. Finally, at sufficiently high basis weight, dependence of permeability on φf,min becomes constant. Apparently, this happens at a lower basis weight for samples made of mechanical pulp than for samples made of chemical pulp. In this study, no basis weight effect was observed in mechanical pulp samples, with a basis weight more than 43 g/m2, while for the chemical pulp samples, this threshold was about 100 g/m2. Estimations of the corresponding coverage of the samples made of chemical and mechanical pulp (c ≈ 10) suggests that basis weight affects the sheets permeability when they are in the transition regime between 2D and 3D structure. A 3D structure is more vulnerable to increase in flow resistance (to resulting compression) than a structure of more two-dimensional nature. Natural coarseness of the fibre, pulping method and further treatment of the pulp affect strongly the number of fibres and particles per unit area. Thus, the threshold coverage can be reached at different values of basis weight, depending on the composition of the pulp. For the compressibility properties of the materials of this study, basis weight had no significant effect. Furthermore, interaction of the sample with the contact surfaces can strongly affect the magnitude and behaviour of permeability. Increasing the unevenness of the contact surface increases the permeability. Apparently the unevenness of the contact surface leaves uncompressed locations in thin web, which maintain their local permeability essentially unchanged. Instead, smooth contact surfaces distribute compression evenly also in a thin sample, so that only locations with low coverage remain highly permeable. At a sufficiently high coverage and basis weight, mutual contacts of fibres distribute the mechanical compression effectively, and the effect of roughness of the contact surface disappears
1E-17
1E-16
1E-15
1E-14
1E-13
1E-12
1E-11
1E-10
0 100 200 300 400 500 600Basis weight (g/m2)
Mod
ified
per
mea
bilit
y (k
g/m
)
SBK - coarse wire
SBK - felt or sinter
Fine - smooth sinter
2.1 MPa
2.1 MPa
1.4 MPa

92
8.3 THE EFFECT OF SAMPLE COMPOSITION The source of (wood) fibres, pulping method, further treatment of pulp, and additive materials mixed with it are optimized by paper manufacturer in order to achieve the wanted strength, printing and visual properties of paper, and economy of manufacturing. Many of these factors also affect the permeability of the fibre web. In this study, the effect of beating of the chemical pulp (Series 2), the amount of mechanical pulp fines in TMP (Series 3), and mixing of kraft pulp and groundwood (Series 4) were investigated. The permeability properties of sheets made of kraft pulp and viscose fibres (Series 5) or kraft pulp and talc particles (Series 6) were also measured. Finally, the permeability properties of a used 1600 g/m2 press felt were measured for comparison with paper materials. Altogether, 20 different paper compositions were studied for their permeability and compressibility properties. All paper samples were manufactured by a laboratory mould according to the SCAN-C 26:76 standard procedures. The basis weight of the paper samples was approximately 65 g/m2 except in Series 6, in which basis weights were 74 g/m2, 42 g/m2 or 33 g/m2. All samples were air-dried to a solids content of more than 0.9 prior to their saturation with water and permeability measurements. Therefore, some sample properties originated from the pulp may have been obscured by effects caused by drying and resaturation. The permeability behaviour of paper samples of variable composition but constant basis weight was rather similar in all but one series (Series 5 with viscose fibres): The level of permeability varied with sample composition while its dependence on φf,min or Ps was essentially the same for all compositions. Despite the differences in permeability, compressibility of the paper samples was again essentially the same for different compositions.
8.3.1 THE EFFECT OF BEATING In Series 2, we studied the effect of increased beating on permeability of softwood kraft pulp. The beating process is known to increase the flexibility, collapsibility and bond formation of fibres, which increase the compactness and strength of the fibre web made of this pulp (Sec. 1.3.2, Sec. 1.4.2.1). In dry sheets, thickness decreased and φf,min increased more than 20 % due to beating from SR 13 to 45. Compaction is accompanied with increased in-plane strength and decreased air flow across the sample (Table 2). When resaturated beaten samples SR 25 – SR 45 swelled more (c. 45 %) than the essentially unbeaten sample SR 13 (c. 30 %) with respect to their dry thicknesses. Thus, the initial φf,min for all saturated samples was approximately 0.27 (Table 7). Reduction of permeability for increasingly beaten samples happened as a decrease of the level of permeability while the dependence of permeability on φf,min remained similar for all samples, as indicated by the decrease of parameter A from 769 · 10-18 m2 to 31 · 10-18 m2, and constancy of parameter B, B ≈ 3.9 (see Eq. (6), Fig. 53 and Table 7). Compressibility of Series 2 was uniform within measurement uncertainties, so that the same parameters E and F of Eq. (8), E = 0.48 and F = 0.18, could be used for all samples of the series (Fig. 54 and Table 7). The dependence of permeability on Ps was also similar in all samples, but the level of permeability decreased with increasing beating, as indicated by parameter C decreasing from 1900 · 10-17 m2 to 55 · 10-17 m2 , and the constancy of parameter D, D ≈ 0.7 (see Eq. (7), Fig. 55 and Table 7).

93
1E-16
1E-15
1E-14
1E-13
1E-12
0,2 0,3 0,4 0,5 0,6 0,7Min. fibre volume fraction
Perm
eabi
lity
(m2 )
SR 13
SR 25
SR 35
SR 45
k = 769*10-18 φ f,min -4.0
k = 31*10-18 φ f,min-4.0
Fig. 53 Permeability k as a function of minimum fibre volume fraction φf,min for Series 2 of dried increasingly beaten kraft handsheets. Also shown are power law fits to the sets of data points. A few measurement errors are marked in data points of the SR 13 and SR 45 samples.
0,2
0,3
0,4
0,5
0,6
0,7
0,01 0,1 1 10Mechanical pressure (MPa)
Min
. fib
re v
olum
e fr
actio
n
SR 13
SR 25
SR 35
SR 45
φ f,min = 0.5 P s 0.18
Fig. 54 Minimum fibre volume fraction φf,min as a function of mechanical pressure Ps for samples of Series 2. Also shown is a power law fit to all data points. Some measurement errors are marked in the fit.

94
1E-16
1E-15
1E-14
1E-13
1E-12
0,01 0,1 1 10Mechanical pressure (MPa)
Perm
eabi
lity
(m2)
SR 13
SR 25
SR 35
SR 45
k = 55*10-17 P s-0.7
k = 1900*10-17 P s-0.8
Fig. 55 Permeability k as a function of mechanical pressure Ps for Series 2 of dried increasingly beaten kraft handsheets. Also shown are power law fits to the two sets of data points. A few measurement errors are marked in the data points of the SR 13 and SR 45 samples. Increasing flexibility and collapsibility of beaten fibres decreases especially the volume of large interfibre pores in fibre web. Due to the irreversibility of drying effects, a decreased interfibre porosity of the fibre web remains even after resaturation, explaining the decrease of permeability of the web with increased beating. However, increased flexibility and collapsibility of fibres seems not significantly affect the compressibility of the (dried and resaturated) web. While decreased permeability indicate that interfibre porosity of the sheet is reduced due to beating of the fibres, increased swelling of the sheets suggest that intrafibre porosity might be simultaneously even increased. Since minimum fibre volume fraction φf,min is only indirectly associated with porosity, reduction of φf,min as a function of Ps can remain essentially unchanged.
8.3.2 THE EFFECT OF MECHANICAL PULP FINES Many properties of mechanical pulps result from mechanical pulp fines, which affect the surface area and bonding of the fibre network, among other things. In Series 3, we studied the effect on permeability of the fraction of TMP fines which passed through the 200-mesh size sieve. When formed into the sheets, thickness increased, while density and φf,min decreased, all by approximately 20 %, due to removal of the +200-mesh fraction. Reduced compaction was accompanied by a reduced light scattering coefficient and an increased air flow through the sample. Since these properties were measured from dried sheets, it is apparent that unbonded surface and compacted sheet structure both survive in drying [Retulainen93, Maloney97]. Properties of sheets with other proportions of the +200- fraction were between the extremes (Table 3). When resaturated, sheets with no +200- fraction swelled more (60 %) than sheets made of intact TMP (40 %), with respect to their dry thicknesses. Therefore, the initial φf,min of all saturated samples was similar, approximately 0.20 (Table 7).

95
Decrease of level of permeability with increasing amount of +200 fraction is described by the decrease of parameter A from 16 · 10-18 m2 to 1.7 · 10-18 m2, and the constancy of parameter B, B ≈ -4.5 (See Eq. (6), Fig. 56 and Table 7). Compressibility was identical for all samples of Series 3, justifying the use of E = 0.49 and F = 0.18 in Eq. (8) when the results for all samples were fitted by this equation (Fig. 57 and Table 7). Furthermore, parameters E and F were essentially the same in Series 3 and Series 2 (Table 7). The dependence of permeability on Ps was again similar for all samples. The level of permeability decreased for an increasing amount of the +200 fraction, as indicated by the decrease of parameter C from 52 · 10-17 m2 to 4.5 · 10-17 m2, and the constancy of parameter D ≈ 0.9 (See Eq. (7) and Table 7).
1E-17
1E-16
1E-15
1E-14
1E-13
0,1 0,2 0,3 0,4 0,5 0,6 0,7Min. fibre volume fraction
Perm
eabi
lity
(m2 ) No +200
1/2 +200
All +200
k = 16*10-18 φ f,min -4.9
k = 1.7*10-18 φ f,min-4.5
Fig. 56 Permeability k as a function of minimum fibre volume fraction φf,min for Series 3 of dried TMP handsheets for different fractions of +200-mesh fines. Also shown are power law fits to the two sets of data points. A few measurement errors are marked in the data points of the intact sample (all of the +200 fraction included) and completely fractionated sample (none of the +200 fraction included).

96
0,2
0,3
0,4
0,5
0,6
0,7
0,01 0,1 1 10Mechanical pressure (MPa)
Min
. fib
re v
olum
e fr
actio
n
No +200
1/2 +200
All +200
φ f,min = 0.5 P s 0.18
Fig. 57 Minimum fibre volume fraction φf,min as a function of mechanical pressure Ps for Series 3 of dried TMP handsheets with different fractions of the +200-mesh fines. Also shown are power law fit to the data points. A few measurement errors are marked in the fit. Presence of fines reduces the larger interfibre pores by filling spaces between fibres, and by increasing bonding between them. Simultaneously, smaller interfibre pores are created among fibres and fines particles since part of the fines surface remains unbonded. Therefore, increase of permeability is expected for samples with a decreasing amount of fines. However, even without the +200 fraction, TMP web still contains a large amount of small particles (Fig. 28) which apparently reduces the interfibre pore size, and thus the permeability in comparison with webs made of chemical pulp (Fig. 53 and Fig. 58).
8.3.3 MIXTURE OF CHEMICAL AND MECHANICAL PULP Mixing of chemical and mechanical pulp is a common practice in the paper industry, basically so as to combine the low cost of mechanical pulp and the good strength properties provided by the chemical pulp. In Series 4, we studied the permeability properties of a mixture of slightly beaten softwood kraft and groundwood (GW). Typical of all samples of this study was that paper made of mechanical pulp always had a larger initial thickness and lower φf,min than that made of chemical pulp, in the dried condition and at the same basis weight. Usually sheet density was also lower for paper made of mechanical pulp. This applied to Series 4 as well, since sheet thickness of dry groundwood was c. 20 % higher, φf,min was c. 15 % lower, and density was c. 20 % lower than in sheets made of kraft. Samples with different kraft – GW proportions had bulk properties between the extremes (Table 4). When resaturated, groundwood sheets swelled slightly more (c. 25 %) than kraft sheets (c. 20 %), with respect to their dry thicknesses. Thus, the initial φf,min of saturated samples varied from c. 0.20 (GW) to c. 0.25 (kraft) (Table 7). The level of permeability decreased nonlinearly with a decreasing kraft proportion. The first 20 % decrease of the kraft proportion decreased the level of permeability nearly by an order of magnitude, while only a minor change was observable in permeability for changing kraft proportions below 30 %. Again,

97
permeability dependence on φf,min was quite similar for all samples. Thus, parameter A decreased with decreasing kraft proportion from 555 · 10-18 m2 to approximately 10 · 10-18 m2, while parameter B remained nearly constant, B ≈ -4.4 (see Eq. (6), Fig. 58 and Table 7). Compressibility of Series 4 was identical, justifying use of constant parameters E and F, E = 0.45 and F = 0.22, when fitting data of this series by Eq. (8) (Fig. 59 and Table 7). The dependence of permeability on Ps was similar for all samples, with a constant parameter D, but with the level of permeability decreasing with kraft proportion. This is indicated by the decrease of parameter C from 1900 · 10-17 m2 to 17 · 10-17 m2, and the constancy of parameter D, D ≈ 0.97 (see Eq. (7) and Table 7).
1E-17
1E-16
1E-15
1E-14
1E-13
1E-12
0,2 0,3 0,4 0,5 0,6Min. fibre volume fraction
Perm
eabi
lity
(m2 )
100% kraft 80% kraft60% kraft 30% kraft0% kraft
k = 555*10-18 φ f,min -4.6
k = 9.5*10-18 φ f,min-3.6
Fig. 58 Permeability k as a function of minimum fibre volume fraction φf,min for Series 4 of dried handsheets of kraft – groundwood mixtures. Also shown are power law fits to two sets of data points. A few measurement errors are marked in the data points of the kraft (100 % kraft) and groundwood (0 % kraft) sample.

98
0,2
0,3
0,4
0,5
0,6
0,01 0,1 1 10Mechanical pressure (MPa)
Min
. fib
re v
olum
e fr
actio
n
100% kraft80% kraft
60% kraft30% kraft
0% kraft
φ f,min = 0.5 P s 0.22
Fig. 59 Minimum fibre volume fraction φf,min as a function of mechanical pressure Ps for samples of Series 4. Also shown is a power law equation fitted as an average for the samples, and measurement errors marked for the fit.
Since abundance of mechanical pulp fines increased with decreasing kraft proportion, a decrease of permeability was also expected. Evidently, this was caused by a shift towards smaller interfibre pores and an increase in the unbonded fibre surface area (see Sec. 8.3.3). Since change in the particle size distribution was now much larger than in the case of Series 3, also the reduction of permeability was now larger (Fig. 29 and Fig. 28). Roughly speaking, the fibre and permeability properties of kraft sheets were similar to those of sheets made of unbeaten kraft in Series 2, while properties of groundwood sheets were similar to those of intact TMP sheets of Series 3.
8.3.4 MIXTURES WITH NON-WOOD MATERIALS In order to investigate how the morphology and surface properties of the solid fraction affect the permeability, we studied mixtures of non-wood materials and kraft pulp. In Series 5, synthetic viscose fibres were mixed with kraft pulp at different proportions, and in Series 6, talc particles were mixed with kraft pulp. Talc is a common mineral filler material for improving the optical properties of paper, due to the higher specific surface area of small flake-like talc particles, and due to the reduced bonding between fibres. These effects can be seen as an increased light scattering coefficient and reduced strength properties of the dried sheet with c. 45 mass- % of talc. Sheet thickness was reduced due to talc addition, apparently due to a decreased amount of wood fibres in the sheet, and due to the high density of talc. Thus, φf,min of the dried sheets increased by approximately 10 % due to addition of talc. Volumetrically, φf,min,talc ≈ 0.1, which is one third of the whole solid volume fraction (Table 6). When resaturated, kraft - talc mixture sheets swelled less (c. 20 %) than the pure-kraft sheets (c. 30 %). Thus, in the saturated condition, both the mixture and pure-kraft sheets had an approximately equal φf,min, c. 0.3 (Table 7).

99
Permeability of the 74 g/m2 pure-kraft sheet was similar to that of the 65 g/m2 samples made of beaten kraft. Within the measurement errors, mixture sheets had similar permeability when presented as a function of φf,min. Therefore, the same A = 61 · 10-18 m2 and B = -4.1 can be applied in Eq. (6) for samples with and without talc (Fig. 60 and Table 7). Also the compressibility was similar for kraft and mixture sheets, justifying use of the same E = 0.54 and F = 0.18 in Eq. (8). When permeability was presented as a function of mechanical pressure, kraft sheets had somewhat higher level of permeability than mixture sheets. In Eq. (7), C = 146 · 10-17 m2 for the kraft sheet and 79 · 10-17 m2 for a mixture sheet, while exponent D was D ≈ 0.7 for both materials (Table 7). Despite that a one third of volume of the long wood fibres was substituted by talc particles in mixture sheets, practically no permeability or compressibility effects ensued. The same was true for all basis weights (74, 42 and 33 g/m2) of Series 6. However, it is likely that the permeability behaviour of kraft - talc mixtures is actually a combined effect of two opposing mechanisms: Substitution of kraft fibres by talc particles simultaneously decreases the coverage of the (kraft) fibre web, and increases its specific surface area. Kraft basis weight and kraft sheet density of the 74 g/m2 mixture sheet are close to those of the 42 g/m2 pure-kraft sheet (Table 6). Therefore, without the talc particles, the permeability also should be similar. Since the permeability of the 74 g/m2 mixture sheet is lower than that of the 42 g/m2 pure-kraft sheet it is evident that talc particles decreased the permeability (Fig. 60). The decrease of coverage and increase of specific surface area closely cancelled each other, suggesting that the effect on permeability of kraft fibres and talc particles was approximately similar. In contrast to this, permeability decreased an order of magnitude when kraft pulp was substituted by groundwood pulp, even if kraft was substituted in a lesser proportion than here (“80 % kraft” in Fig. 58).
Fig. 60 Permeability k as a function of minimum fibre volume fraction φf,min for the 74 g/m2 and 42 g/m2 samples of Series 6, dried handsheets made of softwood kraft and a mixture of kraft and 45 mass-% of talc, respectively. A power law fit to the data of 74 g/m2 samples is also shown, and some and measurement errors are marked on the fit.
1E-16
1E-15
1E-14
1E-13
0,2 0,3 0,4 0,5 0,6 0,7Min. fibre volume fraction
Perm
eabi
lity
(m2 )
74 gsm
74 gsm / talc
42 gsm
k = 61*10-18φ f,min-4.1

100
Unlike minerals, viscose fibres are not common addition in paper. They are used for some special applications like porosity adjustment of filter papers, or increasing wet strength of tissue paper. Viscose fibres represent rather idealistic fibres due to their uniform external dimensions, solid circular cross-section and unfibrillated surface. Viscose fibres do absorb water, but less than wood fibres. Similarly, ability to form bonds between fibres is lower for viscose. Kraft-viscose mixtures ranging from 25 mass- % to 70 mass-% of viscose ratio were studied. Addition of viscose fibres increased the thickness and decreased the density of the dried sheets. A bulkier structure of the sheet was also indicated by increase in the air flow through the dry sheet with viscose. Also, φf,min of the dried sheet decreased with increasing viscose ratio, so that the mixture sheet with 70 mass-% viscose ratio had φf,min a quarter of that of pure-kraft sheet. Volumetrically, the mixture with 25 mass-% of viscose already had nearly a half of their solid volume substituted by viscose. Mixtures with 50 – 70 mass-% of viscose were mostly viscose fibre webs, since for both viscose ratios φf,min,viscose ≈ 0.25, which is c. 80 % of the whole solid volume fraction (Table 5). Swelling of the saturated sheet decreased from 35 % to 5 % with increasing viscose ratio, in comparison to the dry sheet thicknesses. Thus, the initial φf,min for the resaturated sheet was approximately 0.3 for both the pure-kraft sheet and the kraft-viscose mixtures (Table 7). Permeability of the pure-kraft sheet (0 % viscose) was comparable to those of the other kraft samples. Increase in the viscose ratio also increased the permeability, up to a viscose ratio of 50 %, without significant changes thereafter (Fig. 61). Addition of viscose increased the level of permeability, but also reduced its dependence on φf,min. Thus, parameter A of Eq. (6) increased from 77 · 10-18 m2 to 3390 · 10-18 m2 with increasing viscose ratio. Exponent B simultaneously decreased from -4.2 to -2.1 (Fig. 62 and Table 7). Addition of viscose also increased the compressibility of the saturated sheet, which also increased to about 50 % viscose ratio without significant changes thereafter. In Eq. (8), E increased from 0.4 to 0.6, and F from 0.16 to 0.22, with increasing viscose proportion (Fig. 62 and Table 7). Permeability also increased with viscose ratio when expressed as a function of Ps. In Eq. (7), C increased from 255 · 10-17 m2 to 1120 · 10-17 m2 while D decreased from -0.7 to -0.5, with increasing viscose ratio (Fig. 63 and Table 7).

101
1E-16
1E-15
1E-14
1E-13
0,2 0,3 0,4 0,5 0,6 0,7 0,8Min. fibre volume fraction
Perm
eabi
lity
(m2 )
70% viscose
50% viscose
25% viscose
0% viscose
k = 3650*10-18φ f,min-2.1
k = 77*10-18φ f,min-4.2
Fig. 61 Permeability k as a function of minimum fibre volume fraction φf,min for Series 5 composed of dried handsheets made of mixture of softwood kraft and viscose fibres. Also shown are power law fits to the data of samples with 0 % and 70 % viscose. A few measurement errors are marked in the fits.

102
0,2
0,3
0,4
0,5
0,6
0,7
0,8
0,01 0,1 1 10Mechanical pressure (MPa)
Min
. fib
re v
olum
e fr
actio
n
70% viscose
50% viscose
25% viscose
0% viscose
φ f,min = 0.4 P s 0.16
φ f,min = 0.6 P s 0.23
Fig. 62 Minimum fibre volume fraction φf,min as a function of mechanical pressure Ps for samples of Series 5. Also shown are power law fits to the data of samples with 0 % and 70 % of viscose. A few measurement errors are marked in the fits.

103
1E-15
1E-14
1E-13
0,01 0,1 1 10Mechanical pressure (MPa)
Perm
eabi
lity
(m2 )
70% viscose
50% viscose
25% viscose
0% viscose
k = 1120*10-17 P s-0.5
k = 255*10-17P s-0.7
Fig. 63 Permeability k as a function of mechanical pressure Ps for samples of Series 5. The data of samples with 0 % and 70 % viscose were fitted by power law, and a few measurement errors were marked in them. The permeability and compressibility behaviour of mixtures with viscose fibres differed significantly from those of the rest of paper compositions of the same basis weight. This was the case despite many factors that suggest that the permeabilities of sheets made of kraft and kraft – viscose mixtures should be quite similar: Initial φf,min are similar within 5 %, both webs consist mostly long fibres without fines or filler particles, and fibre diameters of viscose and kraft, 15 µm vs. 25 µm, respectively (Sec. 7.3 – 7.7), are not entirely unlike. Still, permeabilities of kraft and mixture sheets were somewhat different in the beginning, and reduction of permeability as a result of mechanical pressure was much lower for mixture sheets. Qualitatively similar behaviour was found for kraft samples with decreasing basis weight, apparently due to decreasing coverage (Sec. 8.2). However, this explanation is unlikely now since coarseness of viscose fibres is approximately a half of the typical value for softwood kraft fibres (0.2 mg/m for Series 2 fibres). For the 70 % viscose ratio, fibre length per unit area increased by factor of c. 1.5. Thus, when kraft fibres are substituted by viscose fibres at a constant basis weight, coverage will increase, not decrease. Furthermore, while the initial values of φf,min for both kraft and mixture sheets were similar, mixtures had an increasingly high φf,min for increasing Ps. Thus, while the mixture sheets compress more, they also maintain higher permeability during compression, in contrast to the kraft sheets. There are probably several factors affecting permeability and compressibility behaviour of kraft – viscose mixture sheets. Decrease of basis weight and coverage of wood fibres with increasing viscose ratio evidently increases permeability and lessen the effect of compression. However, since the replacement of the wood fibres with viscose ones increase overall coverage, the viscose fibre network must be more permeable than the wood fibre web. The lower specific surface area of unfibrillated viscose and the lower collapsibility of solid viscose apparently increase the permeability. Finally, distribution of intra- and interfibre porosity is apparently different for kraft and mixture sheets, which affects both permeability and compressibility results. Due to the solid cross-section of viscose fibres and the less hydrophilic nature of the material, sheets made of viscose fibres swell only a few percents from original thickness when saturated. In contrast, wood fibres are strongly hydrophilic, and the sheets made of wood fibres typically swells one third or more from original thickness when saturated. Intrafibre porosity φi for kraft sheet can be

104
50 % or more (see Fig. 71) higher than theφf,min. Since 50 – 80 % of solid volume of mixture sheets consisted of viscose fibres, it can be assumed that φi for saturated mixture sheet was considerably lower than that for the pure-kraft sheet. Because φf,min is initially the same for kraft and mixture sheets, this also means that the effective (interfibre) porosity φeff is larger for the mixture sheet than for the kraft sheet (Eq. (13)).
8.3.5 PERMEABILITY OF A PRESS FELT As an example of fibrous medium made of synthetic fibres and with a fabricated mesh structure, samples of one type of press felt were also measured. The felt had a typical woven structure of coarse base threads with needled batt layers of a finer thread size. Flow resistance of the felt is determined mostly by the dense layer of fine batt threads [Szikla92], whose diameter is typically c. 30 µm. Synthetic nylon (density 1150 kg/m3) fibres have a uniform size and cross-section, unfibrillated surface, negligible intrafibre porosity and water absorbance as compared to the wood fibres. The sample felt had a basis weight of 1600 kg/m2, and since it was well used in a pilot paper machine, its structure was probably more compacted than that of an unused felt. Initial φf,min of the saturated felt was already 0.55, which is close to the final φf,min of paper materials, achieved under 3 MPa of mechanical compression. Still, the permeability of the felt is orders of magnitude higher than even the most permeable paper materials of this study. For comparison, permeability and compressibility of the highly permeable paper sample SR13 of Series 2 (Sec. 8.3.1) shown together with felt. In an intact condition, the permeability could have been still several times, or even tens of times higher [Szikla92]. Coefficient A of Eq. (6) was found to be 3400 · 10-18 m2 and exponent B was B = -7.0 (Fig. 64). Both A and C were considerably higher than those of paper materials (Table 7). While φf,min was generally higher for the press felt than for paper, press felt was also stiffer against compression than paper materials. In Eq. (8), coefficients E and F were found to be E = 0.7 and F = 0.06 for this felt (Fig. 65). In contrast with paper materials, coefficient E was higher and exponent F lower for the felt (Table 7). In Eq. (7), coefficients C and D were found to be C = 49240 · 10-17 m2 and D = -0.4 for the felt (Fig. 66). Coefficient C was much larger and D lower than for paper samples (Table 7).

105
1E-15
1E-14
1E-13
1E-12
1E-11
0,2 0,3 0,4 0,5 0,6 0,7 0,8Min. fibre volume fraction
Perm
eabi
lity
(m2 )
Press felt
SR13
k = 3400*10-18φ f,min-7.0
k = 769*10-18φ f,min-4.0
Fig. 64 Permeability k as a function of minimum fibre volume fraction φf,min for the 1600 kg/m2 felt and the 65 kg/m2 kraft handsheets for comparison. Power law fits were made to these data sets, and a few measurement errors were marked on the felt data.

106
0,2
0,3
0,4
0,5
0,6
0,7
0,8
0,01 0,1 1 10Mechanical pressure (MPa)
Min
. fib
re v
olum
e fr
actio
n
Press felt
SR 13
φ f,min = 0.7 P s 0.06
φ f,min = 0.5 P s 0.18
Fig. 65 Minimum fibre volume fraction φf,min as a function of mechanical pressure Ps for the 1600 kg/m2 felt and 65 kg/m2 kraft handsheets. Power law fits to these data sets are also shown and a few measurement errors are marked on the felt data.
1E-14
1E-13
1E-12
1E-11
0,01 0,1 1 10Mechanical pressure (MPa)
Perm
eabi
lity
(m2 )
Press felt
SR 13
k = 49240*10-17 P s-0.4
k = 1900*10-17 P s-0.8
Fig. 66 Permeability k as a function of mechanical pressure Ps for the 1600 kg/m2 used press felt and 65 kg/m2 kraft handsheets. Power law fits to these data sets are also shown and a few measurement errors are marked on the felt data.

107
While the permeability of the press felt was much higher than that of the paper materials, the press felt results followed actually the general trend observed for fibrous media (Fig. 68). It is apparent that the low coverage did not explain the high permeability of the felt, since its basis weight was multiple times that of the paper samples. Instead, results for the felt indicate how absence of small particles, and a non-flattening cross-section and unfibrillated surface of fibres, increase the web permeability. It is also apparent that intrafibre porosity is much lower for the nylon web than for the wood fibre web. Since φf,min of the felt was c. 0.75 at the maximum compression, it is likely that the effective (interfibre) porosity φeff could be close to 0.25 due to minimal fibre swelling and absence of small particles.
8.3.6 SUMMARY OF DIFFERENT SAMPLE COMPOSITIONS Differences in the pulp composition or pulp treatment cause differences in the level of permeability of the paper samples, but its dependence on φf,min or on Ps was fairly similar For all 17 different paper compositions (excluding the kraft - viscose mixtures of Series 5) the scaling factor A in Eq. (6) varied from 1.7 to 770 while exponent B varied by less than 20 % around an average of -4.3. Quite similarly, the scaling factor C in Eq. (7) varied from 4.5 to 1900, while exponent D varied by less than 30 % around an average of -0.85 (Table 7). Compressibility of the different paper samples was very similar. Taking the measurement uncertainty into account, usually one pair of parameters E and F of the Eq. (8) covered whole series of samples. Furthermore, for all 17 different compositions (again excluding the viscose mixtures), the scaling factor E, E ≈ 0.47 ± 6 % and exponent F, F ≈ 0.19 ± 11 %, cover satisfactorily the entire data (Table 7).

108
Table 7 Permeability and compressibility of the wet samples, and the initial φf,min for wet and dry samples (Tables T2 - T6). All samples had a basis weight approximately 65 g/m2 (except Series 6) and all were dried prior to measurement. Series Sample k = A φf,min
B (m2) k = C PsD (m2) φf,min = E Ps
F Wet Dry A (10-18) |B| C (10-17) |D| E F φf,min φf,min
2 SR13 769 4,0 1900 0,79 0,48 0,18 0,24 0,36 2 SR25 326 4,0 544 0,69 0,48 0,18 0,30 0,42 2 SR35 235 3,5 289 0,65 0,48 0,18 0,27 0,44 2 SR45 31 4,0 55 0,71 0,48 0,18 0,28 0,45 3 All +200 1,7 4,5 4,5 0,80 0,49 0,18 0,21 0,36 3 3/4 +200 5,5 4,0 9,1 0,72 0,49 0,18 0,21 0,32 3 1/2 +200 7,7 4,3 13 0,98 0,49 0,18 0,20 0,34 3 1/4 +200 10 4,8 20 1,08 0,49 0,18 0,21 0,34 3 No +200 16 5,0 52 0,92 0,49 0,18 0,20 0,30 4 100% kraft 555 4,6 1900 0,97 0,45 0,22 0,24 0,31 4 80% kraft 142 4,3 351 0,95 0,45 0,22 0,24 0,29 4 60% kraft 14 5,1 62 1,07 0,45 0,22 0,25 0,29 4 30% kraft 5,4 4,3 25 0,98 0,45 0,22 0,21 0,28 4 0% kraft 10 3,6 17 0,87 0,45 0,22 0,21 0,27 5 0% visc. 77 4,2 255 0,65 0,43 0,16 0,31 0,42 5 25% visc. 438 3,8 659 0,67 0,49 0,18 0,28 0,40 5 50% visc. 2050 2,7 1090 0,58 0,58 0,21 0,30 0,36 5 70% visc 3650 2,1 1120 0,47 0,58 0,23 0,27 0,32 6 74gsm 61 4,1 146 0,76 0,54 0,18 0,29 0,42 6 74gsm/talc 61 4,1 79 0,63 0,54 0,18 0,31 0,38
Highest permeabilities were found for samples made of unbeaten chemical pulp, but outside of that there were no systematic differences between papers made of chemical or mechanical pulp. Similar permeability properties can be found for samples made of chemical or mechanical pulp, or of their mixtures. The same is true for the level of chemical pulp beating and fraction of mechanical pulp fines. While permeability decreases for increasing beating and fraction of mechanical pulp fines within a sample series, these properties do not uniquely determine the permeability of that particular material.The rest of the standard pulp and sheet properties do not explain any better the permeability. Although SR filtration resistance of the Series 2 correlates with permeability, it is known that filtration tests of the pulp are generally not consistent with the permeability of the sheet [Lindsay93a]. The light scattering coefficient, which measures the unbound surface area of the dry solid fraction, obviously did not correlate well with the water permeability (Fig. 67). From the Gurley air resistance results and certain handsheet properties, the air permeability of the dry sample can be determined (Sec. 7.1). Even the air and water permeabilities of the same material were not alike. Water permeability was slightly higher for papers made of beaten softwood pulp (Series 2) and TMP with a varying fines fraction (Series 3), while the air permeability was significantly higher for kraft - viscose mixtures (Fig. 67).

109
0,1
1
10
100
1000
10000
1 10 100 1000k (10-15 m2)
k G
urle
y (10
-15 m
2 )Series 2
Series 3
Series 5
1
10
100
1000
20 30 40 50 60Light scattering coefficient (m2/kg)
k (1
0-15 m
2 )
Series 2
Series 3
Series 6
Fig. 67 Sheet properties vs. permeability. On the left, air permeability as a function of water permeability. On the right, water permeability as a function of light scattering coefficient (Table 7). Although no single parameter associated with the pulp or paper properties seemed not predict paper permeability uniquely and quantitatively, the effect on permeability of changing pulp properties could be estimated qualitatively. Changes in pulp properties, which were associated with reduction of interfibre porosity or pore size of the paper, invariably reduced its permeability. In samples made of wood materials, only the level of permeability changed for a varying composition, while dependence of permeability on φf,min was essentially constant. This indicates that the pore and fibre structure of all sample types was essentially three dimensional, even in kraft samples which typically have a lower coverage than samples made of mechanical pulp. Only kraft samples with a basis weight of 42 g/m2 or lower appeared to have a partly 2D structure (Fig. 60 and Fig. 43). The webs consisting of synthetic fibres had a higher permeability than any wood fibre web, even if the φf,min was higher for synthetic webs. Apparently, this was partly due to the high permeability of synthetic fibres with an unfibrillated surface and with a solid, non-flattening cross-section. Furthermore, the intrafibre porosity of synthetic webs is lower than that of webs made of wood fibres. Therefore, the effective (interfibre) porosity φeff for wood fibres is significantly lower than the total porosity φ, while for synthetic fibres this was not necessarily the case. Drying or wetting apparently change the structure of the paper. This was especially apparent in the compressibility results which were essentially independent of the pulp properties or of the composition of paper. Fig. 67 also indicates that the properties determined for a dry sample can be quite different than those for a wet sample.
8.3.7 DISCUSSION WITH RESPECT TO PREVIOUS RESULTS ON PAPER PERMEABILITY Among the permeability studies of paper, such measurements in which the properties of the stock pulp is changed, and the permeability of paper samples is then measured at different degrees of mechanical compression, is perhaps the most common type of study. Results of the studies in which several types of paper were measured [Ceckler82, Carlsson83, Lindsay93a, Lindsay93b] can be compared with those of the present study. In addition, the extensive review of the permeability of fibrous media by Jackson [Jackson86] is included in this comparison. Due to the considerable difference between paper materials and other fibrous media, the results with highest permeability were selected from each paper permeability study. In all cases, the samples made of chemical pulp were the most permeable ones. Basis weights varied between the studies, ranging from 250 g/m2 [Carlsson83] to135 g/m2 [Lindsay93b]. In the present study, the 65 g/m2 sample SR 13 (Fig. 53) represents the most permeable paper material. In order to provide paper with a comparable basis weight, and an example of a synthetic fibrous medium, the results for the 256 g/m2
Fine paper stack (Fig. 42) and the press felt (Fig. 64) were included in this comparison. For clarification,

110
only part of the whole data for each study is shown here. Permeabilities are shown as a function of minimum fibre volume fraction φf,min, by conversion according to Appendix 1 if necessary. Results were made dimensionless by dividing the permeability (k ) with fibre radius a squared [Jackson86]. Since the fibre dimensions were not quoted by any of the paper studies above, the average diameter of wet kraft fibres of several wood species was used [Niskanen98]. Thus, the wet fibre radius a = 17 µm was used for the literature results. According to FS-200 measurements in the present study, radiuses 10 µm and 14 µm were used for the Fine and SR 13 paper samples, respectively (Table 1and Table 2). A fibre radius of 15 µm was used for the felt (Sec. 8.7). Collapse of the lumen or deformation of the cell wall were not taken into account in the estimations of a, since the aspect ratio for flattened fibres is commonly fairly modest, and the perimeter of the fibre is found to remain constant under compression (Sec. 1.3.3). Thus, the magnitude of the dimensionless permeability k/a2 is dominated by permeability k rather than radius a, since only k vary by orders of magnitude for samples made of wood fibres. Results for the press felt lies among the general trend observed for fibrous media, indicating that the measurement device and procedures are indeed adequate for permeability studies (Fig. 68). Instead, the dimensionless permeability of paper materials is generally orders of magnitude lower than the general trend of fibrous media with a similar φf,min, especially since the samples with the highest permeability was selected from each paper study. In each study, there were materials with a lower permeability by couple of orders of magnitude than the most permeable materials whose results are shown here. Large variation exists also between the different paper studies. This seems to be mostly a consequence of differences in measurement procedures and devices (e.g., Fig. 52), in addition to differences in sample properties (e.g., Fig. 45 and Table 7).
0,00000001
0,0000001
0,000001
0,00001
0,0001
0,001
0,01
0,1
1
10
100
0,01 0,1 1Fibre volume fraction
k/a
2
[Jackson]
[Lindsay]
[Carlsson]
[Ceckler]
Press felt
SR13
Fine 256gsm
Fig. 68 Experimental k/a2 of different fibrous media [Jackson86] and of paper materials from references [Lindsay93a], [Lindsay93b], [Carlsson83], [Ceckler82], and from the present study. Paper samples SR 13 and 256 g/m2 stack of Fine sheets are from the present study, as well as Press felt. Measurement uncertainties have been marked on a few points of SR13.

111
Although the permeability of paper is lower than the general trend for porous media, it is unlikely that its permeability would be entirely different from the trend for fibrous media [Jackson86]. The data of this reference include those for a wide variety of materials made of natural fibres, measured with various fluids and with different flow configurations [Jackson86]. The apparent discrepancy between these results and those for paper is probably exaggerated by our plotting of permeability as a function of φf,min. There is quite much scatter in the data around the general trend in this reference and the trend descends steeply for φf ≥ 0.5, indicating its stronger dependence there on porosity, and thereby on the detailed structure of the pore space. In the paper samples, φf,min was initially 0.2 – 0.3 while it was 0.55 – 0.65 under the maximal compression. It appears that φf,min underestimates the volume available for fluid flow, since it ignores the intrafibre porosity. In an attempt to estimate the effective porosity of paper, compressibility measurements on samples of varying initial dryness were compared. Samples of Fine and News were thus measured initially in a never-dried condition, in a partially-dried condition and in an air-dried condition (Fig. 69 and Fig. 70). The never-dried samples were made with a laboratory mould of the same pulp as the samples with higher solids contents. The initial solids content of the never-dried samples was c. 0.15, the lowest solids content in which samples could be removed undamaged from the mould. The partially-dried samples were mechanically pressed into a solids content of c. 0.50 and then they were further air dried into a solids content of c. 0.95. Our results indicate that the wet News samples were compressed into the same thickness as the dry ones, while the wet Fine samples remained c. 30 % thicker at 3 MPa than the dry ones. At high Ps, further compression of the pressing plates closer together was mostly resisted by those locations of the fibre web, which had the highest coverage. It appeared that fibres at those locations were compressed to such an extent that stiffness of the fibre-wall material limited the further compression, which was true in particular for the mechanically pulped fibres of the News samples. Correspondingly, fibres at the locations of low coverage were compressed to a lesser extent, thus retaining there a substantial moisture content. Unfortunately, compressed initially wet samples were rewetted during opening of the pressing chambers. Therefore, the maximum solids content of the wet samples could not be determined reliably with the present device (see Sec. 6.3). Results of the literature related to Sec. 1.3.1 suggest that even hundreds of milligrams of (intrafibre) water per a gram of solids remain in the web despite its compression by 3 MPa. If this is true for the present device, with nearly equal thicknesses of the dry and wet samples at Ps = 3 MPa, it is likely that the effective porosity φeff of paper is substantially lower than the total porosity.

112
0,05
0,1
0,15
0,2
0,25
0,3
0,35
0,4
0,01 0,1 1 10Mechanical pressure (MPa)
Thi
ckne
ss (m
m)
Never dried
Partially dried
Dry
Fig. 69 Thickness of 70 g/m2 Fine samples as a function of mechanical pressure Ps at an initial solids contents of c. 0.15 (Never-dried), c. 0.5 (Partially dried) and c. 0.95 (Dry). Measurement errors are marked in a few points of the dry-sample data.

113
Fig. 70 Thickness of c. 55 g/m2 News samples as a function of mechanical pressure Ps at an initial solids contents of c. 0.15 (Never-dried), c. 0.5 (Partially dried) and c. 0.95 (Dry). Measurement errors are marked in a few points of dry sample data. In order to estimate the intrafibre porosity remaining in the wet sheet, DSC moisture contents were included in φf,min so as to produce an effective fibre volume fraction φf,eff (Appendix 1). As an example, φf,min and φf,eff are here determined for the never-dried Fine- samples of Fig. 69. Non-freezing and altered-freezing DSC- water fractions of Fig. 24 were used as estimates of the intrafibre porosity of never dried, chemically pulped fibres (Fig. 71). Inclusion of non-freezing DSC- fraction in φf,min affected only a little for low Ps, but at 3 MPa φf,eff was about 50 % higher than the corresponding φf,min. Because of properties of the non-freezing DSC- water fraction (see Sec. 7.1), the above estimate probably represents quite a realistic lower limit for φf,eff. Including the altered-freezing DSC- fraction in φf,min leads to a situation in which φf,eff ≥ 1 at the maximum mechanical pressure. Taking into account that all paper samples remained in the present study clearly permeable throughout the measurements, altered freezing DSC- fraction apparently overestimates the intrafibre porosity in this case. However, it is likely that part of the intrafibre porosity is strongly affected by compression, and probably the real φf,eff for the present device and samples is somewhere between the altered-freezing and non-freezing trends of Fig. 71.
0,05
0,1
0,15
0,2
0,25
0,3
0,35
0,01 0,1 1 10Mechanical pressure (MPa)
Thi
ckne
ss (m
m)
Never dried
Partially dried
Dry

114
0
0,1
0,2
0,3
0,4
0,5
0,6
0,7
0,8
0,9
1
0,01 0,1 1 10Mechanical pressure (MPa)
Fibr
e vo
lum
e fr
actio
n
Never dried -
Never dried -
Never dried -
φ f,min + altered-freez.
φ f,min + non-freezing
φ f,min
Fig. 71 Effective fibre volume fraction φf,eff of the never-dried Fine samples of Fig. 69, estimated by including the altered-freezing DSC moisture ratio (black squares) or the non-freezing DSC moisture ratio (grey squares) in φf,min (hollow squares). If the non-freezing DSC water fraction is included in the fibre volume fraction of SR 13 and Fine stack of Fig. 68, the highest values of φf,eff for paper samples increase to c. 0.85 at maximum mechanical pressure (Fig. 72). Since press felt is composed of nylon fibres, its water absorbance can be considered negligible, and φf,eff = φf,min. When φf,eff is utilised instead of φf,min, experimental water permeability of paper materials approach the general trend that has been found for fibrous media and in simulations of 3D images of dry paper.

115
0,0000001
0,000001
0,00001
0,0001
0,001
0,01
0,1
1
0,1 1Fibre volume fraction
k/a
2
Exp. various
Simul. SBK
Simul. cardb.
Simul. news
Press felt
SR13*
Fine 256gsm*
Fig. 72 Experimental and simulated k/a2 of paper materials. Simulations of SBK [Aaltosalmi04], cardboard and newsprint [Koivu10] have been carried out in 3D images. The experimental results for paper samples SR 13 and 256 g/m2 Fine are presented as a function of effective fibre volume fraction (denoted with an asterisk *). Experimental results for various fibrous media [Jackson86] and Press felt are shown for comparison. The argument as a function of which permeability results are shown, naturally affects their mathematical presentation. In Fig. 73, the dimensionless permeability of paper samples SR 13 (Sec. 8.3.1) and the 256 g/m2 Fine paper stack (Sec. 8.2), and of the Press felt (Sec. 8.3.5) are presented as a function of φf,eff . The DSC non-freezing fraction was included in the fibre volume fraction of paper materials, while for the press felt φf,eff = φf,min. Four simple equations quoted in Sec. 2.1 and a power-law equation of the form k/a2 = Gφf,eff H were fitted into the measurement results. Latter equation is a dimensionless version of Eq. (6) used throughout this study (Sec. 8.1). Equations (3) and (5), which agree well with the general trend of fibrous media, also agree reasonably with the press felt data. Since the only variable of these equations is φf , they are not suitable for paper materials which nevertheless have a lower permeability than the general trend, for given φf . Equations (2) and (4), which have one fitting parameter in addition toφf, agree reasonably well with the permeabilities of felt and paper materials. However, dependence of permeability on φf,eff also varies for different samples, and this variability seems to be difficult to cope with by equations with a single free parameter. Equation (4) fits better the SR 13 data with a slow decrease of permeability for decreasing φf,eff, while Eq. (2) fits better the 256 g/m2 Fine data with steeper dependence of k/a2 on φf,eff. The order of magnitude of both parameters C1 (Eq. (2)) and C2 (Eq. (4)) varied from 0.01 for the press felt, to 0.00001 for the 256 g/m2 Fine stack. Finally, a power-law expression evidently fit well all the results of the present study, also k/a2 as a function of φf,eff . Parameter G varied from 18600 · 10-8 for the press felt to 5.5 · 10-8 for the 256 g/m2 Fine stack. For these samples parameter H was found to be -6.5 and -8.5, respectively.

116
0,0000001
0,000001
0,00001
0,0001
0,001
0,01
0,1
0,3 0,4 0,5 0,6 0,7 0,8 0,9Fibre volume fraction
k/a2 Eq. 5
Eq. 3Eq. 4Eq. 2Pow.
Press felt
Fine 256gsm*
SR 13*
Fig. 73 The simple permeability equations of Sec 2.1 and power-law equation (Sec. 8.1) fitted the results of measurements on the press felt and the paper samples of unbeaten kraft (SR 13) and the 256 g/m2 stack of Fine. Dimensionless permeability is presented as a function of effective fibre volume fraction φf,eff (denoted with an asterisk *). For the press felt φf,eff = φf,min . 8.3.8 CONCLUSIONS ON THE EFFECT OF SAMPLE COMPOSITION Increased beating and increasing fraction of mechanical pulp or its fines all reduced the permeability of paper made of such a pulp. Reduction of permeability happened such that its dependence on φf,min or Ps remained similar. The latter property indicates that the coverage of the 65 g/m2 samples was sufficient for formation of a three dimensional fibre structure. Differences in the permeability seemed to be associated with changes in the interfibre porosity or, perhaps even more importantly, changes in the interfibre pore size distribution. Beating of chemical pulp increases the flexibility of fibres, and produces fines and external fibrillation of fibres, all of which reduce, directly or indirectly, the size of large interfibre pores. Heterogeneous small particles of mechanical pulp somewhat improve the bonding, and generally contribute to filling of interfibre pores, thereby shifting the size distribution of interfibre pores towards small sizes. However, typical pulp or sheet properties alone are apparently inadequate for explaining and quantifying the permeability. Also, the effective flow-conducting fraction of porosity appears to be considerably smaller than the total porosity. Unfortunately, present methods for the determination of porosity components, and especially for the determination of the relevant interfibre pore size distribution, are limited.
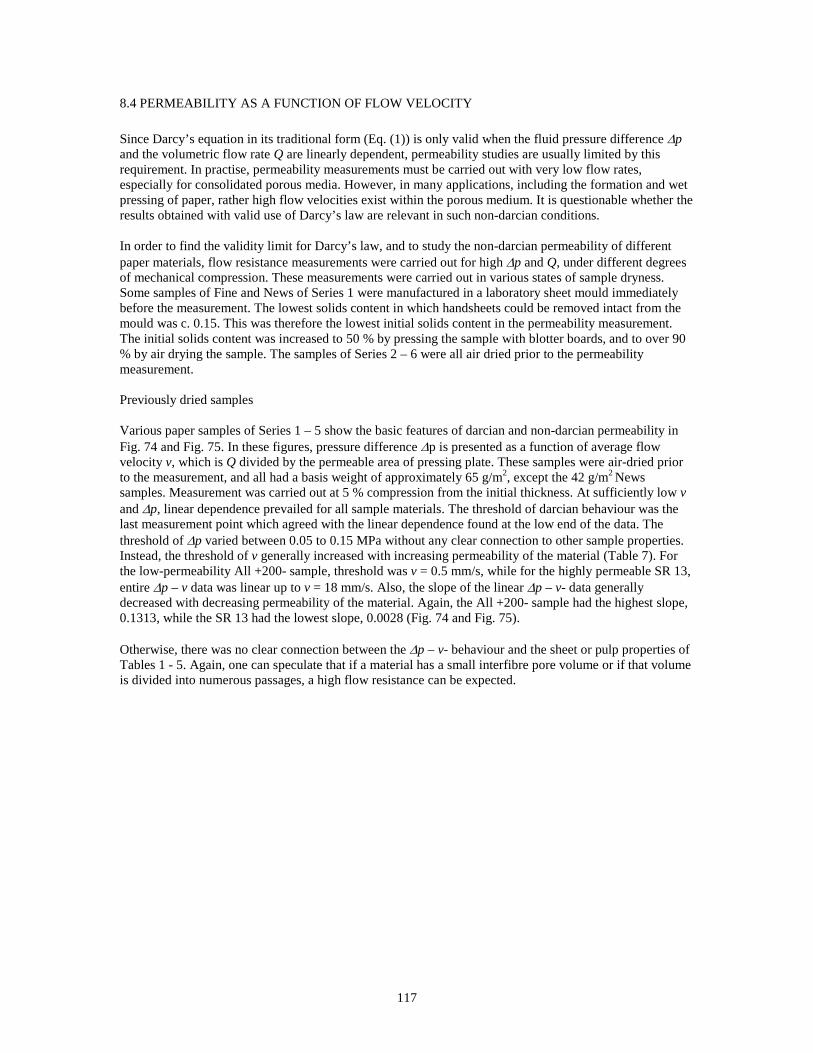
117
8.4 PERMEABILITY AS A FUNCTION OF FLOW VELOCITY Since Darcy’s equation in its traditional form (Eq. (1)) is only valid when the fluid pressure difference ∆p and the volumetric flow rate Q are linearly dependent, permeability studies are usually limited by this requirement. In practise, permeability measurements must be carried out with very low flow rates, especially for consolidated porous media. However, in many applications, including the formation and wet pressing of paper, rather high flow velocities exist within the porous medium. It is questionable whether the results obtained with valid use of Darcy’s law are relevant in such non-darcian conditions. In order to find the validity limit for Darcy’s law, and to study the non-darcian permeability of different paper materials, flow resistance measurements were carried out for high ∆p and Q, under different degrees of mechanical compression. These measurements were carried out in various states of sample dryness. Some samples of Fine and News of Series 1 were manufactured in a laboratory sheet mould immediately before the measurement. The lowest solids content in which handsheets could be removed intact from the mould was c. 0.15. This was therefore the lowest initial solids content in the permeability measurement. The initial solids content was increased to 50 % by pressing the sample with blotter boards, and to over 90 % by air drying the sample. The samples of Series 2 – 6 were all air dried prior to the permeability measurement. Previously dried samples Various paper samples of Series 1 – 5 show the basic features of darcian and non-darcian permeability in Fig. 74 and Fig. 75. In these figures, pressure difference ∆p is presented as a function of average flow velocity v, which is Q divided by the permeable area of pressing plate. These samples were air-dried prior to the measurement, and all had a basis weight of approximately 65 g/m2, except the 42 g/m2 News samples. Measurement was carried out at 5 % compression from the initial thickness. At sufficiently low v and ∆p, linear dependence prevailed for all sample materials. The threshold of darcian behaviour was the last measurement point which agreed with the linear dependence found at the low end of the data. The threshold of ∆p varied between 0.05 to 0.15 MPa without any clear connection to other sample properties. Instead, the threshold of v generally increased with increasing permeability of the material (Table 7). For the low-permeability All +200- sample, threshold was v = 0.5 mm/s, while for the highly permeable SR 13, entire ∆p – v data was linear up to v = 18 mm/s. Also, the slope of the linear ∆p – v- data generally decreased with decreasing permeability of the material. Again, the All +200- sample had the highest slope, 0.1313, while the SR 13 had the lowest slope, 0.0028 (Fig. 74 and Fig. 75). Otherwise, there was no clear connection between the ∆p – v- behaviour and the sheet or pulp properties of Tables 1 - 5. Again, one can speculate that if a material has a small interfibre pore volume or if that volume is divided into numerous passages, a high flow resistance can be expected.

118
Fig. 74 Pressure difference as a function of v for various dried paper samples of Series 1-5, at 5 % compression. A few examples of the measurement errors and linear fits at low values of v are shown for the Fine and SR13 data.
y = 0,0028xR2 = 0,9786
R2 = 0,9915
0
0,05
0,1
0,15
0,2
0,25
0,3
0,35
0,4
0,45
0 2 4 6 8 10 12 14 16 18 20Average flow velocity (mm/s)
Pres
sure
diff
eren
ce (M
Pa)
Fine SR13SR45 No +20080% Kraft

119
Fig. 75 Pressure difference as a function of v for various dried paper samples of Series 1-5, at 5 % compression. A few examples of the measurement errors and linear fits at low values of v are shown for the All +200 and 30% Kraft data. Increase in the basis weight or mechanical compression also increased the flow resistance, for otherwise identical measurement conditions. In both cases increase of flow resistance manifested itself by a higher ∆p for a given v, in contrast to light or less compressed samples. For the Fine stacks with an increased basis weight, the slope of the linear ∆p – v- data increased, and the linearity threshold for v decreased. However, slopes of the linear fits to the stacked Fine samples suggest that increase in flow resistance is stronger at low basis weights (Fig. 76). Since increase in mechanical pressure decreases the interfibre porosity and pore size, and simultaneously increases the number of contacts between fibres, and the strain in the fibre web, increase in flow resistance is also expected consequence. In the 64 g/m2 Fine samples, slope of the linear ∆p – v- region increased, and the linearity threshold for v decreased with mechanical compression. Finally, under 3 MPa mechanical pressure and at 50 % compression from the initial thickness, the entire ∆p – v- data fell into the linear regime without any signs of flow effects (Fig. 77). At 50 % compression, all tested basis weights (up to 192 g/m2) of Fine were similarly immune to the effects of flow.
R2 = 0,9934
y = 0,1313xR2 = 0,9105
0
0,05
0,1
0,15
0,2
0,25
0,3
0,35
0,4
0,45
0 0,5 1 1,5 2 2,5Average flow velocity (mm/s)
Pres
sure
diff
eren
ce (M
Pa)
News
All +200
30% Kraft

120
Fig. 76 Pressure difference as a function of v for stacks of air-dried Fine samples at 5 % compression. Linear fits and slopes for low values of v are shown for all data sets together with a few measurement errors for the 64 g/m2 data set. Fig. 77 Pressure difference as a function of v for the 64 g/m2 Fine samples. Linear fits are shown for the 50 % and 5 % compressions, and a few measurement errors for the 5 % data set. When a linearity threshold for ∆p and v exist, flow resistance always increases beyond that threshold (Fig. 74 to Fig. 77). Increase of flow resistance beyond the linear regime also depends on properties of the fibre web. For materials with a high threshold v, the ∆p – v- slope just increases slightly (Fig. 74), but for samples with a low threshold v, ∆p can rise very steeply (Fig. 75).
y = 0,0307x
y = 0,1314x
y = 0,1042x
0
0,1
0,2
0,3
0,4
0,5
0 1 2 3 4 5 6 7Average flow velocity (mm/s)
Pres
sure
diff
eren
ce (M
Pa)
192gsm
128gsm
64gsm
y = 0,0307xy = 0,5196x
0
0,05
0,1
0,15
0,2
0,25
0,3
0 1 2 3 4 5 6Average flow velocity (mm/s)
Pres
sure
diff
eren
ce (M
Pa)
50% comp.
25% comp.
10% comp.
5% comp.

121
Never-dried samples A freshly formed fibre web has an initial solids content of c. 0.15. Such a web is very loose and highly deformable. Typically, the initial thickness is then approximately 2.5 times that of the same samples in a dry condition (Fig. 69 and Fig. 70). Freshly-made samples were measured at 5 % and 30 % compression from initial thickness. While the fibre volume fraction φf naturally increased due to compression, even at the 30 % compression the mechanical pressure quickly relaxed to a negligible level, leaving the fibre network essentially unstrained and in an easily deformable condition. The flow resistance of freshly formed samples was lower than that of the same samples after air-drying; For a given v, the pressure difference ∆p was lower for fresh than previously dried samples. Also, the threshold v was several times higher for the fresh samples. The slope of the linear ∆p - v- data was lower and the threshold in v higher for Fine than for News, similarly to dried samples. At 5 % compression the threshold in v was 15 mm/s, and the slope 0.004 for the Fine samples. For the News samples, this threshold was much smaller, 2 mm/s, and the slope higher, 0.04. The threshold in ∆p was c. 0.05 MPa or more for both materials, which was quite similar to dried samples. Mechanical compression (30 %) increased the flow resistance, i.e. steepened the slope of the linear ∆p - v- data. For the Fine samples, the threshold in v remained the same for higher compressions while for the News, the threshold in v decreased with compression (Fig. 78 and Fig. 79). Similarly to dried samples, beyond the linearity threshold, the slope of the ∆p – v- dependence for Fine turned to a steeper rise, while for the News, the increase in ∆p was essentially a discontinuous vertical jump (Fig. 79). It is evident that fewer contacts and lesser degree of bonding exist between the fibres of never-dried samples. Such conditions would suggest earlier and stronger effects of flow. However, our results show quite the opposite behaviour: A lower flow resistance and higher threshold for softer samples. It seems that vulnerability of the material is not the foremost factor in flow effects, but the interfibre porosity and average pore size. Both are necessarily larger for never-dried samples, which have a φf,min considerably lower than for dried and re-saturated samples.

122
Fig. 78 Pressure difference as a function of v for the 44 g/m2 never-dried Fine pulp samples at a 5 % and 30 % compression from the initial thicknesses. Linear fits to low values of v are also shown for both data sets, along with a few measurement uncertainties for the 5 % data. Fig. 79 Pressure difference as a function of v for the 44 g/m2 never-dried News pulp samples at 5 % and 30 % compression from their initial thicknesses. Linear fits to low values of v are shown for both data sets, along with a few measurement uncertainties for the 30 % data.
y = 0,004xR2 = 0,909
0
0,05
0,1
0,15
0,2
0,25
0,3
0,35
0,4
0 5 10 15 20 25 30 35
Average flow velocity (mm/s)
Pres
sure
diff
eren
ce (M
Pa)
30% compression
5% compression
y = 0,04xR2 = 0,94
0
0,1
0,2
0,3
0,4
0,5
0,6
0,7
0 0,5 1 1,5 2 2,5 Average flow velocity (mm/s)
Pres
sure
diff
eren
ce (M
Pa)
30% compression
5% compression

123
It was also found that flow resistance increased with time. In this case, increase of flow resistance manifested itself by decreasing v with time, while ∆p remained essentially constant. Rate of this decrease seemed to be related to the magnitude of v, so that decrease was generally lower in the linear ∆p – v- regime than above it. Decrease of v also seemed to be persistent, since in all ceases v decreased throughout the observation period of eight minutes or more (Fig. 80). Rate of decrease of v above the linearity threshold was approximately similar for Fine and News, but due to a generally lower v for News, reduction was relatively larger for latter material. Decrease of v with time was also found for some air-dried samples, especially for those with a low threshold in v, but rate of decrease was smaller than for the never-dried samples. In Fig. 78 and Fig. 79, the value of first measurement point for each ∆p- level is shown. While a non-linear increase of ∆p as a function of v could be solely fluid mechanical phenomenon, related to the onset of inertial effects, it is difficult to explain the decrease of v with time without considering the interaction of the fibre web and flow. Redistribution of the solid fraction due to fluid flow is the most likely explanation of such a slow process. If drag forces exerted by the moving fluid can set particles in motion in the first place, it is easiest for small particles which are least entangled. However, in order to be a realistic explanation, some mechanism must exist to prevent a complete washout of mobile small particles.

124
0
0,1
0,2
0,3
0,4
0,5
0,6
0,7
0,8
0,9
0 0,5 1 1,5 2
Average flow velocity (mm/s)
Pres
sure
diff
eren
ce (M
Pa)
30% comp.
Fig. 80 Time evolution of the never-dried News sample of Fig. 79. Dashed line indicates the order of the measurement points. Time interval between the measurement points was approximately 1 minute. Flow effects on the fibre web To further investigate flow-induced permanent changes on the fibre web, the whole measurement procedure of gradually increasing ∆p, and measuring the resulting Q, was repeated several times for the same sample, while keeping the thickness constant. If flow had changed the fibre web permanently, changes in the flow resistance could be expected in subsequent measurement cycles. Measurements were carried out on Fine and News samples with the following procedure: The fibre volume fraction was first adjusted to the desired value by mechanical compression which was then kept constant. Thereafter pressure difference ∆p was adjusted to the first measurement point of 0.02 MPa, and the flow rate was monitored for 5 – 10 minutes, taking measurements with one minute intervals. Pressure difference was then increased to the next measurement point, and flow measurements were repeated. This process was continued up to the maximum ∆p, 0.2 MPa or 0.3 MPa. Then, ∆p was reduced back to 0.02 MPa and the whole measurement cycle was repeated. Results for Fine and News indicate that an irreversible increase in flow resistance took place during the first few measurement cycles (Fig. 81 to Fig. 83). The slope of the linear ∆p – v- data increased with increasing measurement cycles. Largest changes in the ∆p – v- behaviour took place within the first two cycles. After two or three cycles, the entire ∆p – v- data fell into a linear regime, at least up to the maximum ∆p used in the measurements. Furthermore, the tendency of v to decrease with time practically vanished after two measurement cycles.
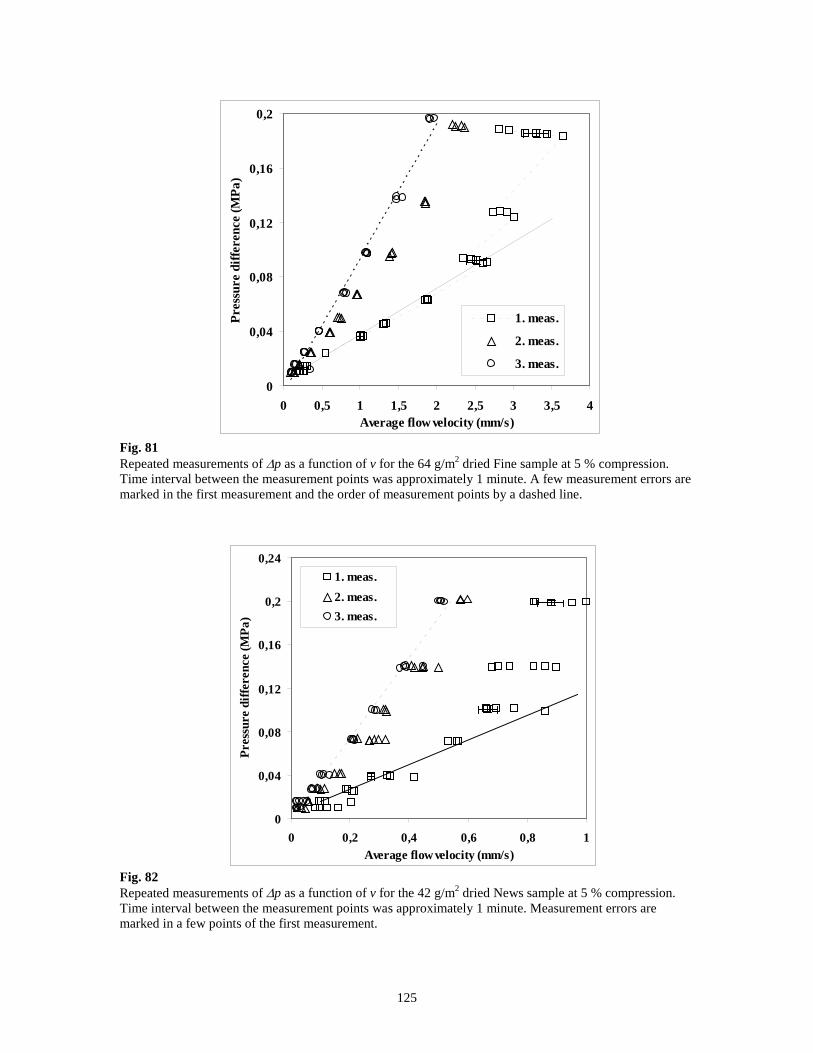
125
0
0,04
0,08
0,12
0,16
0,2
0 0,5 1 1,5 2 2,5 3 3,5 4Average flow velocity (mm/s)
Pres
sure
diff
eren
ce (M
Pa)
1. meas.
2. meas.
3. meas.
Fig. 81 Repeated measurements of ∆p as a function of v for the 64 g/m2 dried Fine sample at 5 % compression. Time interval between the measurement points was approximately 1 minute. A few measurement errors are marked in the first measurement and the order of measurement points by a dashed line. Fig. 82 Repeated measurements of ∆p as a function of v for the 42 g/m2 dried News sample at 5 % compression. Time interval between the measurement points was approximately 1 minute. Measurement errors are marked in a few points of the first measurement.
0
0,04
0,08
0,12
0,16
0,2
0,24
0 0,2 0,4 0,6 0,8 1Average flow velocity (mm/s)
Pres
sure
diff
eren
ce (M
Pa)
1. meas.2. meas.3. meas.

126
In addition to air-dried samples at 5 % compression (Fig. 81 and Fig. 82), repeated flow measurements were also carried out for never-dried Fine samples with an initial solids content of 0.5 (Fig. 83). The latter measurement was carried out at 25 % mechanical compression from the initial thickness. Although the slope of the linear ∆p – v- data was generally steeper for compressed samples, the typical flow-induced increase in resistance was still essentially similar to that in the uncompressed results (Fig. 81) despite the substantial strain in the fibre web in this case. Mechanical pressure exerted to web was approximately the same as ∆p of water, 0.3 MPa. Fig. 83 Repeated measurements of ∆p as a function of v for the 64 g/m2 never-dried Fine sample at 25 % mechanical compression. Time interval between the measurement points was approximately 1 minute. Measurement errors are marked in a few points of the first measurement. Since the thickness and mechanical compression of the samples were kept constant throughout the measurement process, it is evident that it was the water flow which caused permanent structural changes in the fibre web. Structural changes were always such that flow resistance increased from one measurement cycle to the next. Results suggest that two different mechanisms increase the flow resistance. A slow decrease of v with time is again present. However, flow resistance increased more in successive cycles than the temporal decrease of v alone would suggest. It is likely that the flow resistance of fibres creates a density gradient in the fibre web, as described in Sec. 1.4.2.4; Drag force for any cross-section perpendicular to the flow direction is transmitted through contacts between fibres, and it is cumulated at the downstream side of the sample. The resulting dense and low-permeability layer there apparently catches mobile particles. Qualitatively, the through-flow affects quite similarly as a moderate mechanical compression (see e.g. Fig. 76). When a 3 MPa mechanical pressure was applied simultaneously with a 0.2 MPa fluid pressure difference, the former apparently caused such stress and densification of the web that fluid flow could not cause any further effects (Fig. 77). Instead, if the mechanical pressure was approximately similar to the fluid pressure difference, the through-flow can permanently increase the flow resistance (Fig. 83).
0
0,05
0,1
0,15
0,2
0,25
0,3
0 0,2 0,4 0,6 0,8 1 1,2Average flow velocity (mm/s)
Pres
sure
diff
eren
ce (M
Pa)
1. meas.
2. meas.3. meas.

127
Effect of contact surfaces Since fluid flow apparently compacts the fibre web, the interface between the web and the device can be expected to affect the interaction (Sec. 8.2). This was studied briefly by carrying out flow velocity measurements on paper samples with and without wire fabrics between the pressing plates and the sample. Never-dried 42 g/m2 News samples were used as the paper material. Wire fabric was of unspecified type, but visibly more uneven than the smooth sintered plates of the present device. Paper – wire assemblies were measured with wire in the upstream side, wire in the downstream side, and wires on both sides of the paper. All sample assemblies were measured at their initial thickness, i.e. without mechanical compression. It is likely that mechanical compression against the smooth sintered plates of the present device distribute the mechanical compression of the paper more evenly than compression against wire fabrics (see Fig. 52 ). As expected, the presence of wires on both sides of the paper decreased the flow resistance, i.e. increased the v for a given ∆p (Fig. 84). Variation between the samples was unusually large, but results were still sufficiently clear. At low ∆p and v, their linear dependence prevailed. In this regime, flow resistance with and without the wires was approximately the same. Thresholds in ∆p and v seemed to be larger for samples with wires. The most pronounced effect of contact surface took place beyond the threshold. For the paper with wires, v increased continuously with increasing ∆p instead of a discontinuous increase in flow resistance, which was typical of News. The paper sample without wires practically sealed itself already at v ≈ 6 mm/s. Instead, for the assembly with wires on both sides of the paper, v was approximately 18 mm/s at a maximum ∆p of 0.8 MPa, and was still increasing without any indication of a discontinuous increase of flow resistance. Results for assemblies with only one wire with the paper were between the extremes above. For the assembly with wire on the upstream side of the paper, a sudden increase in flow resistance took place, similarly to the sample without wires, but at a slightly higher threshold in v. For the assembly with wire on the downstream side, v increased continuously with increasing ∆p, although slightly less than for the assembly with wires on both sides of the paper. Measurements for a single wire were omitted from Fig. 84 for clarity. It is evident that roughness of the contact surface maintains the local permeability of the fibre web, even if fluid flow generally causes densification of the web. Most effective is roughness at the exit surface, or downstream surface of the web, but even roughness at the upstream surface apparently disrupts the homogeneity of densification. It is likely that for a heavier basis weight and substantial mechanical compression, roughness of the contact surface would have an even larger effect (see Fig. 52 ).
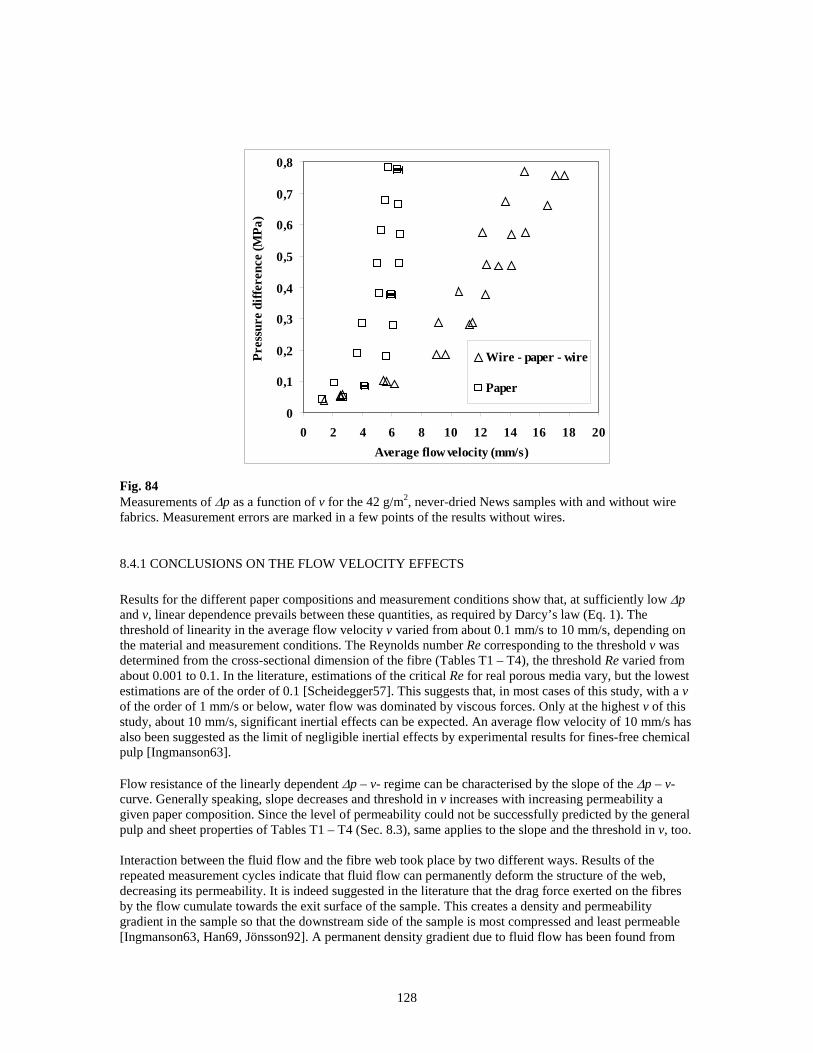
128
Fig. 84 Measurements of ∆p as a function of v for the 42 g/m2, never-dried News samples with and without wire fabrics. Measurement errors are marked in a few points of the results without wires.
8.4.1 CONCLUSIONS ON THE FLOW VELOCITY EFFECTS Results for the different paper compositions and measurement conditions show that, at sufficiently low ∆p and v, linear dependence prevails between these quantities, as required by Darcy’s law (Eq. 1). The threshold of linearity in the average flow velocity v varied from about 0.1 mm/s to 10 mm/s, depending on the material and measurement conditions. The Reynolds number Re corresponding to the threshold v was determined from the cross-sectional dimension of the fibre (Tables T1 – T4), the threshold Re varied from about 0.001 to 0.1. In the literature, estimations of the critical Re for real porous media vary, but the lowest estimations are of the order of 0.1 [Scheidegger57]. This suggests that, in most cases of this study, with a v of the order of 1 mm/s or below, water flow was dominated by viscous forces. Only at the highest v of this study, about 10 mm/s, significant inertial effects can be expected. An average flow velocity of 10 mm/s has also been suggested as the limit of negligible inertial effects by experimental results for fines-free chemical pulp [Ingmanson63]. Flow resistance of the linearly dependent ∆p – v- regime can be characterised by the slope of the ∆p – v- curve. Generally speaking, slope decreases and threshold in v increases with increasing permeability a given paper composition. Since the level of permeability could not be successfully predicted by the general pulp and sheet properties of Tables T1 – T4 (Sec. 8.3), same applies to the slope and the threshold in v, too. Interaction between the fluid flow and the fibre web took place by two different ways. Results of the repeated measurement cycles indicate that fluid flow can permanently deform the structure of the web, decreasing its permeability. It is indeed suggested in the literature that the drag force exerted on the fibres by the flow cumulate towards the exit surface of the sample. This creates a density and permeability gradient in the sample so that the downstream side of the sample is most compressed and least permeable [Ingmanson63, Han69, Jönsson92]. A permanent density gradient due to fluid flow has been found from
0
0,1
0,2
0,3
0,4
0,5
0,6
0,7
0,8
0 2 4 6 8 10 12 14 16 18 20Average flow velocity (mm/s)
Pres
sure
diff
eren
ce (M
Pa)
Wire - paper - wire
Paper

129
the cross-sections of the samples, although only for dynamic water removal [Szikla92]. Web appears to be immune to effects of fluid flow only if it is sufficiently compressed mechanically during the flow, or if it has been subjected to several cycles of through-flow previously. Another effect of fluid flow was a gradual decrease of v with time. It was most likely related to migration of small particles by the flow in the network of larger fibres. In the literature, a slow decrease of the static permeability has been related to accumulation of either impurities of water or fines of wood pulp [Han69]. Impurities in water are unlikely here due to an effective filtration of water (Sec. 3.6). However, since the flow rate was reduced with time rather than increased, detached particles should accumulate in the sample rather than become washed out. Thus, accumulation of fines in the fibre network must be related to formation of a density gradient in the network. Although experimental results for fines migration have been inconsistent [Szikla92], practical experience has shown that fines accumulation due to fluid flow do happen under certain conditions, for example in the formation process of paper [Niskanen98]. Irrespective of how the accumulation of fines has taken place, it has been found that a fines-rich layer at the exit side of the fibre web reduces its permeability [Maloney98]. Roughness in the contact surface between paper and support structures maintains the permeability of paper against densification due to through-flow. Apparently roughness leaves some locations of the fibre web uncompressed and thus permeable, even if the web is generally compacted. Effects of contact surface roughness are similar independent of whether the densification of the fibre web is caused by fluid flow or mechanical compression (Sec. 8.2). Since high average flow velocities exist in many practical applications, like the estimated order of magnitude 100 mm/s in the paper formation process, it is probable that a significant part of flow resistance is caused by effects of fluid flow, rather than the Darcian permeability of the web alone.

130
9 CONCLUSIONS Treatment which smoothed out the pressing surfaces of sintered pressing plates of the permeability device enabled thickness determination of paper samples, whose results agrees reasonably well with those of the SCAN hard-platen technique. Quantification of the error in thickness measurements also enabled determination of the measurement error in permeability, approximately ± 15 %. On the other hand, a smooth interface between the permeability device and the sample increases the flow resistance, apparently due to an even compaction of the fibre web against the pressing surfaces when the web was mechanically compressed or densified by fluid flow. When the permeability (k) of paper was measured according to Darcy’s law, composition of the sample and also its basis weight affected its permeability. Increasing the basis weight amplified the effect of compression. If permeability was quantified by the relation k = A φf,min
B , the absolute value of exponent B increased with increasing basis weight up to a certain limiting value, and remained constant thereafter. For samples made of chemical pulp, B increased approximately from -2.5 to -7.5 when the basis weight increased from 40 g/m2 to 100 g/m2. Instead, for samples made of mechanical pulp exponent B was constant (-5) for all measured basis weights from and above 42 g/m2. Estimation of coverage suggested that the basis weight limit coincided with transformation from 2D to 3D fibre structure, at a coverage of approximately ten. Therefore, the basis weight limit is considerably lower for the paper made of mechanical than chemical pulp. Qualitatively, these results are in agreement with simulations of disordered model webs. Simulated permeability of model webs was dominated by properties of the most permeable 10 – 20 % of sample area. Highly permeable locations of the web models were best characterised by low coverage and large pore height. Paper with low coverage has a higher probability for 2D locations and pinholes, which maintain their permeability better under compression than 3D structures. Permeabilities of 20 different paper compositions (with constant basis weight), synthetic webs, and mixtures with wood fibres and non-wood materials were measured. For different paper compositions, k varied from about 10-13 m2 to 10-15 m2 in the uncompressed condition, and consistently decreased by approximately two orders of magnitude for a maximum mechanical pressure of 3 MPa. Otherwise, response to compression was essentially constant. Thus, in the relation k = A φf,min
B , exponent B = -4.3 covered reasonably well all the paper samples, while coefficient A varied by two orders of magnitude. The level of permeability had apparent connections to interfibre porosity and interfibre pore size distribution. Processes and pulp compositions which reduce the interfibre porosity or change the interfibre pore size distribution towards small sizes, also reduce the level permeability. In contrast with this, compressibilities of different paper materials were very similar, so that relation φf,min = 0.47 Ps
0.19 covered reasonably well all the paper compositions measured. Determination of permeability by Darcy’s law requires a linear dependence between the pressure difference ∆p and the average flow velocity v. In practise, this requires low flow rates. Threshold for the validity of Darcy’s law can be given in terms of the Reynolds number (Re), with the average flow velocity and cross-sectional dimension of fibres as the scaling variables. For samples under low compression, the linear dependence ceased at approximately Re = 0.001 - 0.1. The lower value applied to materials with a low permeability, and the higher value to well permeable materials. Through-flow increases the flow resistance of the fibre web by modifying its structure. Apparently this takes place by formation of a density gradient in web, and by accumulation of small particles on its compacted downstream side. For samples with a low threshold Re, increase in flow resistance can be very abrupt and large.

131
APPENDIX 1 Characterisation of porosity variables For characterisation of the state of a porous, deformable sample, several definitions are used. Mechanical or structural pressure Ps is defined as
tots A
FP = ,
(9) where F is the compressive force measured by a strain gauge and Atot is total cross-sectional area of the sample. The total volume of the sample Vtot is the product of Atot and thickness of the sample h, and it is composed of the volume of dry fibres Vf, the volume of intrafibre pores Vi, the volume of flow-conducting interfibre pores Vp, and the volume of non-conducting interfibre pores Vnc,
ncpiftottot VVVVhAV +++== . (10) Since there is currently no experimental method to clearly distinguish Vp and Vnc, the latter is assumed to be zero unless otherwise noted. Instead, there are methods to estimate the amount of water which is strongly associated with the solid material, and is thus related to volume component Vi. For measurement reasons, Vf is determined by dry mass mf and density of the fibre material ρf, while Vi is determined from the moisture ratio Rm = mwi/mf with mwi the mass of the intrafibre water and mf that of dry fibres, and the density of water ρw,
pw
fm
f
ftot V
mRmV ++=
ρρ. (11)
Dividing by the total volume leads to volume fractions of the components of the sample.
φφφρρρ
++=++=++= iftot
p
totw
fm
totf
f
tot
p
totw
fm
tot
f
VV
VmR
Vm
VV
VmR
VV
1 , (12)
where φf is the volume fraction of fibres, φi the intrafibre porosity and φ the interfibre porosity or just porosity. Volume components assumed to be non-conducting for fluid flow, can be combined into an effective fibre volume fraction φf,eff while the volume fraction which conducts the fluid flow, is the effective (interfibre) porosity, φeff = 1 − φf,eff,
efftotfw
mfwf
tot
ifefff V
RmV
VVφ
ρρρρ
φ −=+
=+
= 1)(
, . (13)
In the case where solid material is composed of different components A and B, Eq. (13) takes the form
−++
−+=
+++=
W
mB
W
mA
BAtot
f
tot
iBiAfBfAefff
MRMRMMVm
VVVVV
ρρρρφ )1()1(
, , (14)

132
where M is the dry mass fraction of component A with density ρA and moisture ratio RmA. Thus, component B has mass fraction (1-M), density ρB and moisture ratio RmB. The minimum volume fraction of fibres φf,min, is determined by puting Rm = 0 in Eq. (13) and in Eq. (14). In the literature, many other expressions were also used for characterisation of the state of the porous material [Ceckler82, Carlsson83, Lindsay93a, Lindsay93b, Vomhoff00]. For comparison purposes, many of these expressions can be converted to φf by making certain assumptions. Thus, moisture ratio rm which is defined as the mass of water divided the mass of dry pulp [Carlsson83] was converted to φf such that φf = ρw/(ρw + rmρf). Concentration C was defined as the mass of dry pulp divided by the total volume [Ceckler82], and was converted such that φf = C/ρf. In all cases, density of water was ρw = 1000 kg/m3 and the density of chemically pulped fibre material was ρf = 1550 kg/m3, while that of mechanically pulped fibres was ρf = 1450 kg/m3.

133
APPENDIX 2 Evaluation of measurement errors Mathematical relationship of two sets of values (x1, x2, …, xN) and (y1, y2, …, yN) is frequently needed for various purposes. To describe the mutual change of values in both sets either the coefficient of linear correlation or R-squared correlation is determined readily by either Microsoft Excel or Microcal Origin statistical software used in this work. For both measures of correlation, absolute value 1 indicates perfect correlation and 0 no correlation at all. Common interpretation for correlation coefficient is to consider correlation “significant” if the probability to obtain equal or larger correlation coefficient with uncorrelated variables is 5 % or less. Similarly, correlation is considered “highly significant” if the probability to obtain equal or larger correlation coefficient with uncorrelated variables is 1 % or less [Taylor82]. To quantify the relationship of two sets of values, curve can be fitted to data by a least-squares process, in which the sum of squared deviations between the measured values and the fitted curve is minimised, and thus the best fit of the curve is obtained. Least squares fit for several types of functions is also a standard feature in the statistical software used in this work. The error estimate dyfit for the most common case of linear fit is given by
∑=
−−
−=
N
i i
iifit dy
SxIyN
dy1
2
21 , (15)
where N is the number of values in the data sets, I is the intercept of the linear fit and the y axis, and S the slope of the linear fit. dyi is the uncertainty of determination of yi, which is used as the weight of contribution of individual deviations. In the cases when there were no significant differences in accuracy of determination of yi, the value dyi = 1 was used. The error dxfit for the x component of a linear fit can be determined similarly, and these two independently determined errors could be combined according to Eq. 16 to the equivalent error dyeq,
22 )()( fitfiteq Sdxdydy += , (16)
which can be used instead of dyfit [Taylor82]. Finally, for errors of the intercept and the slope [Taylor82],
∑∑∑
−=
22
2
)( ii
ifit xxN
xdydI , (17)
∑∑ −=
22 )( iifit xxN
NdydS . (18)
As an example, voltage – displacement calibration data is shown in Fig. 74, where transducer head is moved back and forth through its entire range. Horizontal error bars in Fig. 74 represent voltage determination uncertainty (2.44 mV), and vertical error bars quadratic sum of independent errors of transducer operation (5 % of reading due to mechanical nonlinearity, plus 0.15 µm unrepeatability) and calibrator measurement accuracy (2 µm). From Eq. (15), dyfit and dxfit are found to be 2.8 µm and 4.7 µm, respectively. Finally, from Eq. 13 the equivalent error was found to be 4.0 µm. Thus, the error for this particular displacement transducer operation is ± 4 µm.

134
Fig. 85 Displacement transducer calibration data, with voltage determination errors and quadratic sum of transducer, voltage determination and calibrator errors marked on the data. Similarly, errors for the upper-, the lower- and the sample basin pressure transducers, as well as for the force transducer were defined from voltage - fluid pressure calibration data. For force tranducer, fluid pressure data was scaled by the area of the upper pressing chamber roof. Again, the scatter for voltage – fluid pressure data is caused by voltage determination uncertainty, and the independent combination of pressure transducer uncertainty ( 5 kPa for the LS 634, and 2.5 kPa for the LS 652-1), and the uncertainty of the Beomex PC 105 pressure calibrator (0.04 % of the reading, plus 0.1 kPa). As a result, equivalent error for single pressure transducer turned out to be ± 1.5 kPa. For the force trancducer, scatter for the voltage – force calibration data is caused by the voltage determination uncertainty, the independent combination of force transducer uncertainty (0.2 % the full scale of ten tons for the non-linearity and hysteresis, plus 0.1 % of the full scale for repeatability and 0.1 % of the full scale for the return-to-zero error), the uncertainty of the pressure calibrator, and the uncertainty of the area of upper pressing chamber face (). In this case, the equivalent error for the force transducer was ± 0.09 kN. Calibration of the flow rate measurement was carried out by manually timing the increase of mass for several steady flow rates, ranging from approximately 400 cm3/s to 0.25 cm3/s. High flow rates were limited by the short duration of reaching the maximum capacity of the scale (2000 g), whereas low flow rates were limited by the unsteady rate of dripping of individual water droplets. Manually determined flow rates were compared to a set of weighting values collected in the computer, and the time interval between samples in the weight set was solved as a result. Since the smallest mass increases in the flow rate measurements were several grams, uncertainty of the Mettler PM 2000 electronic scale (0.025 g, due to unrepeatability and unlinearity) was considered negligible. Since flow rate measurement was carried out entirely by electronic scale without signal processing and digitising, errors from these sources were not present. Based on the scatter in the data for time interval determination, the equivalent error for the flow rate determination was estimated to be ± 5 % In error analysis of the experimental measurements, the principle of error propagation is used on several occasions to determine the effect of several uncertainties dx, dy, …, dz on the uncertainty of function F(x,y,
y = 0,6003x - 0,104R2 = 1
-1,00
0,00
1,00
2,00
3,00
4,00
5,00
6,00
0 1 2 3 4 5 6 7 8 9 10
Voltage (V)
Dis
plac
emnt
(mm
)
d y fit = 2,8 µmd x fit = 4,7 µmd y eq = 4,0 µm

135
... z). For random independent errors dx, dy, …, dz,
222
...
∂∂
++
∂∂
+
∂∂
= dzzFdy
yFdx
xFdF , (19)
where terms in parenthesis are partial derivatives multiplied by the uncertainty of the particular variable [Taylor82]. Applying this equation to the latter form of Eq. (1), an equation for the measurement error for permeability dk is found in the form
2222 )()()()(PPd
AdA
hdh
QdQkdk
flow
flow
∆∆
+++= , (20)
where dQ, dh, dAflow and d∆P are measurement errors for volumetric flow, thickness, cross-sectional flow area and pressure difference, respectively. Similarly applying Eq. (19) to Eq. (9) leads to an equation for the measurement error for the mechanical pressure dPs,
22 )()( tottots FdAdFAdP += , (21) where dF and dAtot are the measurement errors for compressive force and total cross-sectional area, respectively. Finally, applying Eq. (19) to Eq. (13) leads to an equation for the measurement error for the effective fibre volume fraction dφf,eff,
222,, )()()(
hdh
AdA
mdm
dtot
tot
f
fefffefff ++= φφ , (22)
where dmf is the measurement error of the dry mass of fibres.

136
10 REFERENCES Aaltonen86, Aaltonen P., “Kuituraaka-aineen ja Paperin Testausmentelmiä”, Otatieto, Helsinki, Finland, 1986. Aaltosalmi04, Aaltosami U., Kataja, M., Koponen A., Timoen J., Goel A., Lee G., and Ramaswamy S., “Numerical Analysis of Fluid Flow Through Fibrous Porous Materials”, Journal of Pulp and Paper Science, 30(9): 251, 2004. Bliesner64, Bliesner W. C., “A Study of the Porous Structure of Fibrous Sheets Using Permeability Techniques”, TAPPI, 47(7):392, 1963. Carlsson83, Carlsson G., “Some Fundamental Aspects of the Wet Pressing of Paper”, Ph. D. Dissertation, Dept. of Paper Technology, The Royal Institute of Technology, Stockholm, Sweden, 1983. Ceckler82, Ceckler W. H. and Thompson E. W., “Final Report of the University of Maine at Orono Wet Pressing Project”, University of Maine at Orono, Orono, USA, 1982. Cox91, Cox D. M. and Purdy A. T., “The Influence of Wet Felts on Sheet Surface”, Paper Technology, Nov:16, 1991. Dodson96, Dodson C. J. T. and Sampson W. W., “The Effect of Paper Formation and Grammage on its Pore Size Distribution”, Journal of Pulp and Paper Science, 22(5):165, 1996. Forgacs63, Forcags O. L., “The Characterisation of Mechanical Pulps”, Pulp Paper Mag. Can., Convention Issue, pp. 89, 1963. Fox85, Fox R. W. and MacDonald A. T., “Introduction to Fluid Mechanics”, John Wiley & Sons, New York, USA, 1985. Gullbrand03, Gullbrand J.,Vomhoff H., ”A New Method for the Characterisation of Micro-scale Stress Variation of Press Felts”, Nordic Pulp and Paper Research Journal, 18(1):18, 2003. Görres01, Görres J. H., Amiri R., McDonald D., “The Specific Pore Volume of Multi-planar Webs: The Role of the Short and Long Fibre Fractions”, Transactions of the 12th Fundamental Research Symposium, C. F. Baker (ed.), Oxford, UK, 2001. Han69, Han S. T., “Compressibility and Permeability of Fibre Mats”, Pulp Paper Mag. Can., 70(5):65, 1969. Hashemi95, Hashemi S. J., Gomes V. G., and Douglas W. J. M., “Permeability and specific surface of machine-formed paper”, Proceedings of 1995 International Paper Physics Conference, Niagara-on-the-lake, Ontario, Canada, pp. 21, 1995. Holmstad05, Holmstad R., Aaltosalmi U., Ramaswamy S., Kataja M., Koponen A., Goel A., Gregersen Ö. W., “Comparison of 3D Structural Characteristics of High and Low Resolution X-ray Microtomographic Images of Paper”, Nordic Pulp and Paper Research Journal, 20(3):283, 2005. Ingmanson63, Ingmanson W. L. and Andrews B. D., “High-Velocity Water Flow through Fibre Mats”, TAPPI 46(3):150, 1963. Jackson86, Jackson G. W. and James D. F., “The Permeability of Fibrous Media”, The Can. J. Chem. Eng., 64:364, 1986. Jönsson92, Jönsson K. A.-S. and Jönsson B. T. L., “Fluid Flow in Compressible Porous Media: 1: Steady-State Conditions”, AlChE Journal, 38(9):1340, 1992.

137
Kataja95, Kataja M., Kirmanen J. and Timonen J., “Hydrostatic and structural pressure in compressed paper webs and press felts”, Nordic Pulp and Paper Research Journal, (3):162, 1995. Kirmanen94, Kirmanen J., Kataja M. and Timonen J., “Stress balance in soft porous media”, Appl. Phys. Lett., 64(19):2605, 1994. Knauf86, Knauf G. H. and Doshi M. R., “Calculations of aerodynamic porosity, specific surface area and specific volume from Gurley seconds measurements”, IPC Technical Paper Series No. 183, The Institute of Paper Chemistry, Appleton, USA, 1986. Koljonen95, Koljonen T. and Heikkurinen A., “Delamination of Stiff Fibres”, International Mechanical Pulp Conference, Stockholm, Sweden, Poster presentations, pp. 407, 1997. Koivu09, Koivu V., Mattila K. and Kataja M., ”A Method for measuring Darcian Flow Permeability”, Nordic Pulp and Paper Research Journal. 24(4):395, 2009. Koivu10, Koivu V., Decain M., Geindreau C., Mattila K., Bloch J.-F. and Kataja M., ”Transport properties of heterogeneous materials. Combining computerized x-ray micro-tomography and direct numerical simulations”, Int. J. of Comp. fluid Dynamics 23(10):713, 2010. Koponen98, Koponen A., “Simulations of Fluid Flow in Porous Media by Lattice-Gas and Lattice-Boltzmann Methods”, Ph. D. Dissertation, Department of Physics, University of Jyväskylä, Jyväskylä, Finland, 1998. Lieshout06, Marit van Lieshout, “The Effect of Wet Pressing on Paper Quality”, Ph. D. Dissertation, University of Groningen, Groningen, The Netherlands. 2006. Lindsay93a, Lindsay J. D., and Brady P. H., “Studies of anisotropic permeability with applications to water removal in fibrous webs, Part 1”, TAPPI 76(9):119, 1993. Lindsay93b, Lindsay J. D., and Brady P. H., “Studies of anisotropic permeability with applications to water removal in fibrous webs, Part 2”, TAPPI 76(11):167, 1993. Lindsay94, Lindsay J. D., “Relative flow porosity in fibrous media: measurements and analysis, including dispersion effects”, TAPPI 77(6):225, 1994. Ljungkvist83, Ljungkvist K., “Pulp characterisation by permeability measurements”, Ph. D. Dissertation, Dept. of Chemical Engineering Design, Chalmers University of Technology, Göteborg, Sweden, 1983. Luey79, Luey A. T., “Pressing recycled paperboard”, XVII EUCEPA Conference Proceedings, 124, London, UK, 1979. Luukko99, Luukko K., “Characterisation and Properties of Mechanical Pulp Fines”, Ph. D. Dissertation, Laboratory of Paper Technology, Helsinki University of Technology, Helsinki, Finland, 1999. MacGregor89, MacGregor M. A., “Wet pressing in 1989 - An historical perspective, Analysis and Commentary”, Transactions of the 9th Fundamental Research Symposium, C. F. Baker (ed.), London, UK, pp. 511, 1989. Maloney97, Maloney T. C., Li T.-Q., Weise U. and Paulapuro H., “Intra- and inter-fibre pore closure in wet pressing”, Appita Journal 50(4):301, 1997. Maloney98, Maloney T. C., Todorovic A. and Paulapuro H., Nordic Pulp and Paper Research Journal 13(4):285, 1998.

138
Moura05, Moura M. J., Ferreira P. J., and Figueiredo M. M., “Mercury intrusion porosimetry in pulp and paper technology”, Powder Technology 160:61, 2005. Mörseburg99, Mörseburg K., “Development and Characterisation of Norway Spruce Pressure Groundwood Pulp fibres”, Ph. D. Dissertation, Laboratory of Pulping Technology, Åbo Akademi University, Turku, Finland, 1999. Nanko89, Nanko H. and Ohsawa J., “Mechanisms of Fibre Bond Formation”, Transactions of the 9th Fundamental Research Symposium, C. F. Baker (ed.), London, UK, Vol. 2, pp. 783, 1989. Nilsson96, Nilsson L., “Some Studies of the Transport Coefficients of Pulp and Paper”, Ph. D. Dissertation, Department of Chemical Engineering 1, Lund University, Lund, Sweden, 1996. Niskanen94, Niskanen K. and Alava M., “Planar random networks with flexible fibres”, Phys. Rev. Lett. 73(25):3475, 1994. Niskanen98, Niskanen K. (Ed.), “Paper Physics”, Papermaking Science and Technology, Book 16, Finnish Paper Engineers Association and TAPPI, Helsinki, Finland, 1998. Niskanen99, Niskanen K., Löytty H. and Grönlund E., “Statistical geometry of paper cross sections”, PSC Communications 125, Oy Keskuslaboratorio – Centrallaboratorium Ab, Helsinki, Finland, 1999. Paavilainen90, Paavilainen L., “Importance of particle size – fibre length and fines – for the characterization of softwood kraft pulp”, Paperi ja Puu 72(5):516, 1990. Paavilainen93a, Paavilainen L., “Conformability – flexibility and collapsibility – of sulphate pulp fibres”, Paperi ja Puu 75(9-10):689, 1993. Paavilainen93b, Paavilainen L., “Importance of cross-dimensional fibre properties and coarseness for the characterisation of the softwood sulphate pulp”, Paperi ja Puu 75(5):343, 1993. Paavilainen94, Paavilainen L., “Bonding potential of softwood sulphate pulp fibres”, Paperi ja Puu 76(3):162, 1994. Petterson06, Petterson P., Lundström T.S., and Wikström T., “A Method to Measure the Permeability of Dry Fiber Mats”, Wood and Fiber Science, 38(3):417, 2006. Ramaswamy01, Ramaswamy, S., Goel A., Choi D., Bandyopadhyay A. and Ramarao B. V. “The 3 Dimensional Structure of paper and its relationship to liquid and vapor transport”, Transactions of the 12th Fundamental Research Symposium, C. F. Baker (ed.), Oxford, UK, pp. 1289, 2001. Rance82, Rance H. F. (Ed.), “Handbook of Paper Science”, Elsevier, Amsterdam, The Netherlands, 1982. Reme98, Reme P. A., Helle T. and Johnsen P. O., “Fibre characteristics of some mechanical pulp grades”, Nordic Pulp and Paper Research Journal, 13(4):263, 1998. Retulainen93, Retulainen E., Moss P. and Nieminen K., “Effect of fines on the properties of fibre networks”, Transactions of the 10th Fundamental Research Symposium, C. F. Baker (ed.), London, UK, pp. 727, 1993. Scheidegger57, Scheidegger A., “The Physics of Flow in Porous Media”, The Macmillan Company, New York, USA, 1957. Szikla92, Szikla S., “On the Basic Mechanisms of Wet Pressing”, Ph. D. Dissertation, PSC Communication 31, Oy Keskuslaboratorio – Centrallaboratorium Ab, Helsinki, Finland, 1992.

139
Taylor82, Taylor J. R., “An introduction to error analysis”, University Science Books, Sausalito, USA, 1982. Valli09, Valli A., J. Hyväluoma, A. Jäsberg, Koponen A. and Timonen J., “Pressure Drop for Low Reynolds Number Flows Through Regular and Random Screens”, Transport in Porous Media 80(2):193, 2009. Vomhoff00, Vomhoff H, Martinez D. M. and Norman B., “The Transversal Steady-State Permeability of a Fibre Web Compressed Between Rough Permeable Surface”, Journal of Pulp and Paper Science 26(12):428, 2000. Weise96, Weise U., Maloney T. and Paulapuro H., “Quantification of water in different states of interaction with wood pulp fibres”, Cellulose 3:198, 1996. Wood96, Wood J. R. and Karnis A., “Determination of specific surface area of mechanical pulp fines from turbidity measurements”, Paperi ja Puu 78(4):181, 1996.


![PERMEABILITY PROPERTIES OF PAPER MATERIALS · the porous structure is traditionally given by Darcy -type interaction terms [Scheidegger57]. Darcy's law for an incompressible single-phase](https://img.dokumen.tips/doc/110x75/5c9ccf3288c99392348babd1/permeability-properties-of-paper-materials-the-porous-structure-is-traditionally.jpg)