Embed Size (px)
Citation preview

7/30/2019 periodogram analysis
http://slidepdf.com/reader/full/periodogram-analysis 1/19
Stat 565
Charlotte Wickham stat565.cwick.co.nz
The Periodogram
May 9 2012
Wednesday, May 9, 12

7/30/2019 periodogram analysis
http://slidepdf.com/reader/full/periodogram-analysis 2/19
Help sessions
This week both
Today 2-3.30pm &
Tomorrow 2-3pm in
Library 6420
Wednesday, May 9, 12

7/30/2019 periodogram analysis
http://slidepdf.com/reader/full/periodogram-analysis 3/19
Moving to the frequency domain
Time DomainFrequency
Domain
xt linear combination of past xt linear combination of periodic components
population ACF Spectral Density
sample acf Periodogram
Object of interest
Data analysis tool
Identify dominantfreqenc(y/ies)Wednesday, May 9, 12

7/30/2019 periodogram analysis
http://slidepdf.com/reader/full/periodogram-analysis 4/19
Where are we going?
Today: Periodogram
motivation, examples and issues
Then: Spectral Density
improving the periodogram as an estimate of the spectral
density
Later: Linear filters
Wednesday, May 9, 12

7/30/2019 periodogram analysis
http://slidepdf.com/reader/full/periodogram-analysis 5/19
Can you guess the frequencies in these (simulated) series?
Wednesday, May 9, 12
7/30/2019 periodogram analysis
http://slidepdf.com/reader/full/periodogram-analysis 6/19
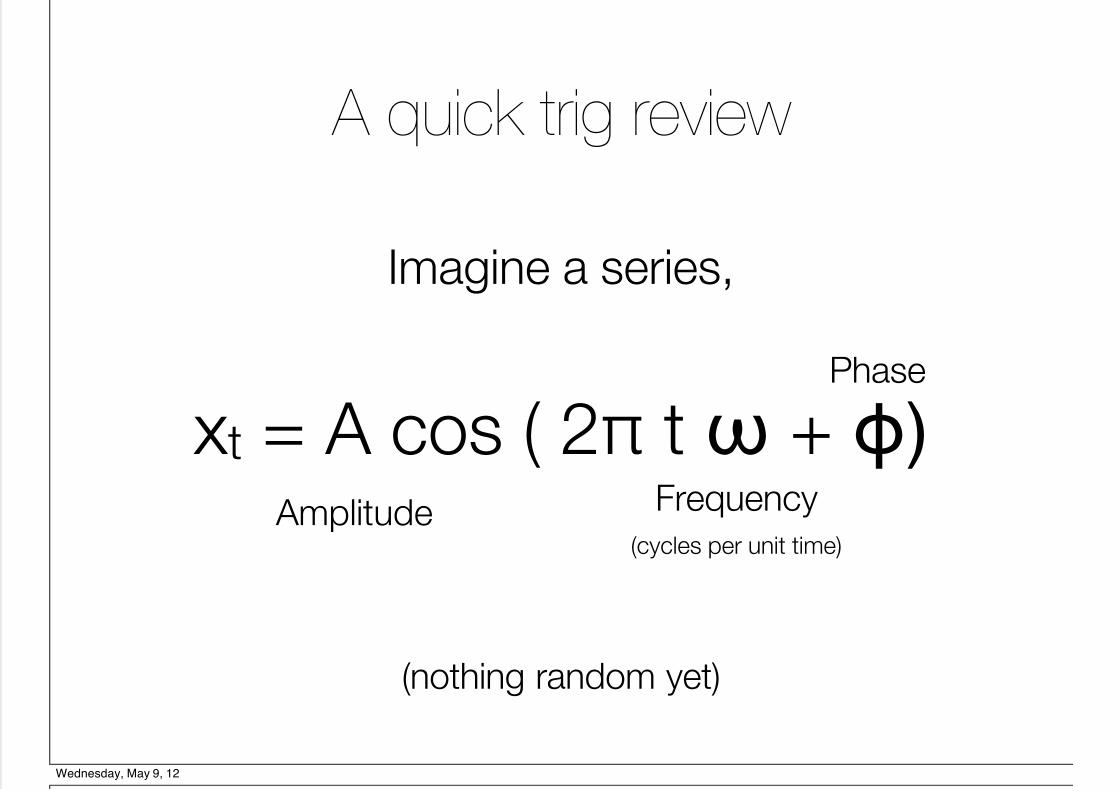
A quick trig review
Imagine a series,
xt = A cos ( 2π t ω + ɸ) Amplitude Frequency
(cycles per unit time)
Phase
(nothing random yet)
Wednesday, May 9, 12
7/30/2019 periodogram analysis
http://slidepdf.com/reader/full/periodogram-analysis 7/19
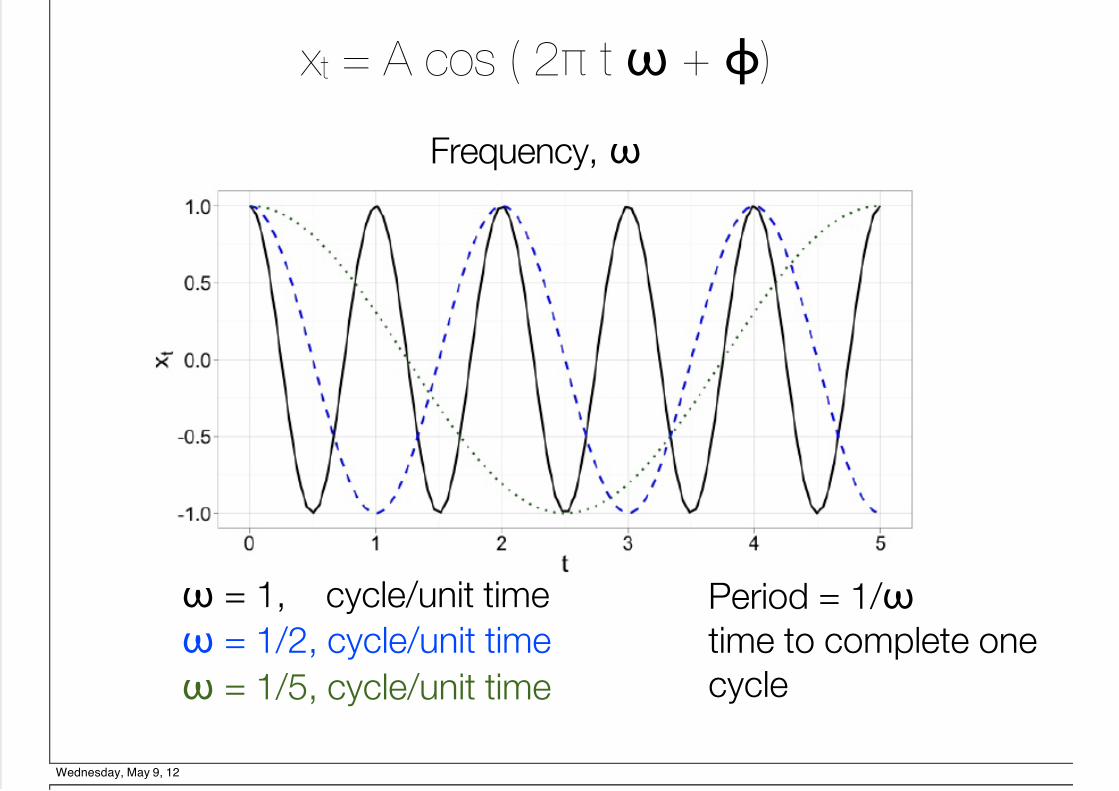
x t = A cos ( 2π t ω + ɸ)
Frequency, ω
ω = 1/2, cycle/unit time
ω = 1, cycle/unit time
ω = 1/5, cycle/unit time
Period = 1/ ω
time to complete one
cycle
Wednesday, May 9, 12
7/30/2019 periodogram analysis
http://slidepdf.com/reader/full/periodogram-analysis 8/19
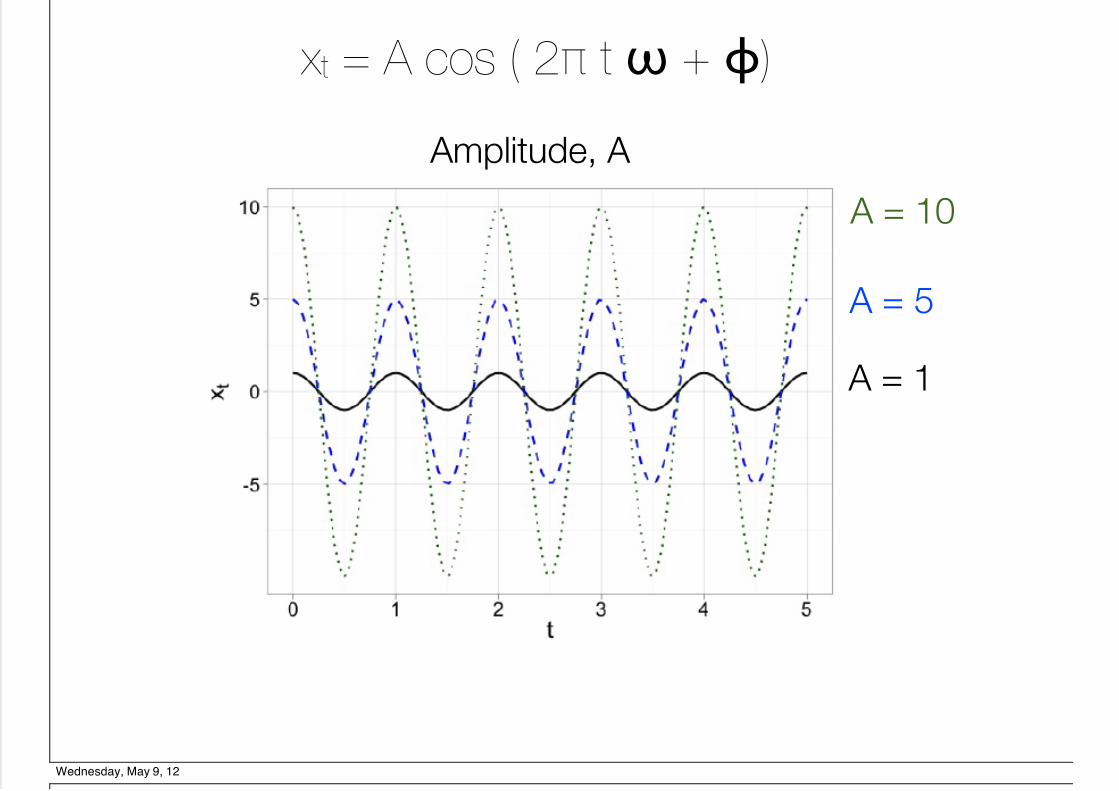
x t = A cos ( 2π t ω + ɸ)
Amplitude, A
A = 5
A = 1
A = 10
Wednesday, May 9, 12

7/30/2019 periodogram analysis
http://slidepdf.com/reader/full/periodogram-analysis 9/19
x t = A cos ( 2π t ω + ɸ)
ɸ = π /2 ɸ = 0 ɸ = -π /2
Phase, ɸ
Wednesday, May 9, 12

7/30/2019 periodogram analysis
http://slidepdf.com/reader/full/periodogram-analysis 10/19
xt = A cos ( 2π t ω + ɸ)
Generally we rewrite this as:
xt = a cos (2π t ω) + b sin(2π t ω)
where a = A cos(ɸ), b = - A sin(ɸ)
and a2 + b2 = A 2
(using the identity: cos(u + v) = cos(u)cos(v) - sin(u)sin(v) )
we saw on Monday if we know the frequency we can
estimate a and b using ordinary least regression
Wednesday, May 9, 12

7/30/2019 periodogram analysis
http://slidepdf.com/reader/full/periodogram-analysis 11/19
Extend to
xt = ∑k ak cos (2π t ωk ) + bk sin(2π t ωk )
a sum of k periodic components
xt = 2 cos(2πt 6/n) + 3 sin(2π 6/n) +4 cos(2πt 10/n) +5 sin(2πt 10/n) +
6 cos(2πt 40/n) + 7 sin(2πt 40/n)
Deterministic example
k=3
Wednesday, May 9, 12

7/30/2019 periodogram analysis
http://slidepdf.com/reader/full/periodogram-analysis 12/19
Can you guess the frequencies in these (simulated) series?
Wednesday, May 9, 12

7/30/2019 periodogram analysis
http://slidepdf.com/reader/full/periodogram-analysis 13/19
Finding ak and bk
We can estimate the ak and bk by regressing xt
on sin(2π t ωk ) and cos(2π t ωk ).
But what frequencies will we use?
Numerically it is very efficient to use, k/n, (the
Fourier frequencies).
k/n = k complete cycles over our record (the kth
harmonic).
We don't actually do the regression, we can use
the fast fourier transform (fft in R).
Wednesday, May 9, 12

7/30/2019 periodogram analysis
http://slidepdf.com/reader/full/periodogram-analysis 14/19
Assume n is odd
xt = a0 + a1 cos (2π t 1/n) + b1 sin(2π t 1/n) +
a2 cos (2π t 2/n) + b2 sin(2π t 2/n) +
... +
a(n-1)/2 cos (2π t ((n-1)/2)/ n) + b2 sin(2π t ((n-1)/2)/n)
= ∑k ak cos (2π t k/n) + bk sin(2π t k/n) k = 1, ..., (n - 1)/2
How many parameters (ak & bk ) are there?
We can perfectly fit any data with this expansion.
The Discrete Fourier transform
Wednesday, May 9, 12
7/30/2019 periodogram analysis
http://slidepdf.com/reader/full/periodogram-analysis 15/19
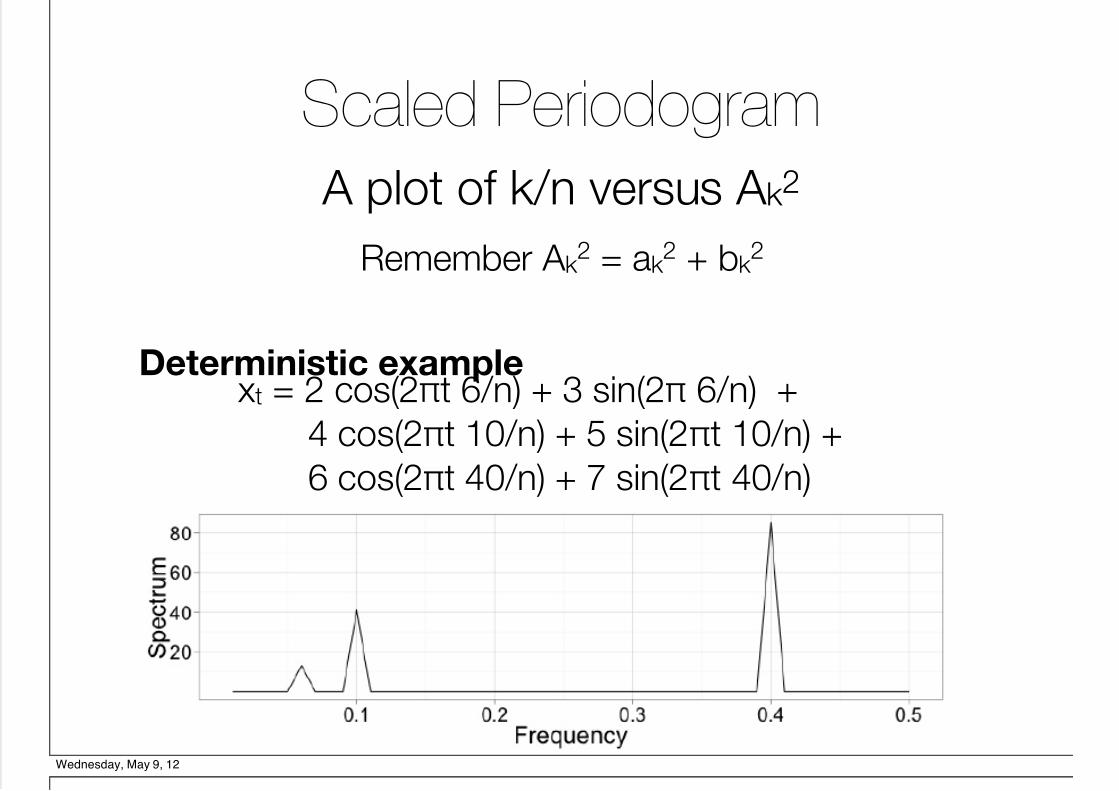
Scaled Periodogram
xt = 2 cos(2πt 6/n) + 3 sin(2π 6/n) +
4 cos(2πt 10/n) + 5 sin(2πt 10/n) +
6 cos(2πt 40/n) + 7 sin(2πt 40/n)
Deterministic example
A plot of k/n versus A k 2
Remember A k 2 = ak
2 + bk 2
Wednesday, May 9, 12

7/30/2019 periodogram analysis
http://slidepdf.com/reader/full/periodogram-analysis 16/19
What about when there is noise?
Scaled periodogram of the first example, x
0.0390625 = 10/256Wednesday, May 9, 12

7/30/2019 periodogram analysis
http://slidepdf.com/reader/full/periodogram-analysis 17/19
Your turn
the 2nd example, x2
the 3rd example, x3
Can you guess the frequencies in these (simulated) series?
Wednesday, May 9, 12

7/30/2019 periodogram analysis
http://slidepdf.com/reader/full/periodogram-analysis 18/19
Look for peaks, they occur at dominant
frequencies.
There are some issues:
1. The frequencies we find depend on
our record length.
2. The periodogram doesn't get
smoother with longer series.
The periodogram
Wednesday, May 9, 12

7/30/2019 periodogram analysis
http://slidepdf.com/reader/full/periodogram-analysis 19/19
Periodogram for white noise
n=
Ideally, with a very
long series we
would estimate a
flat spectrum.