Embed Size (px)
Citation preview

Perinatal Statistics
Report
Health Research and Information Division 20
11
December 2012


ACKNOWLEDGEMENTS The production of this annual report requires commitment and hard work from many individuals. Responsibility for the collection of perinatal data for the National Perinatal Reporting System (NPRS) rests with colleagues in maternity hospitals and units throughout Ireland together with independent midwives. We gratefully acknowledge the input of medical records staff, IT personnel, and administrative departments, together with hospital managers. We are indebted to these individuals for their support and efforts. In addition to financing the NPRS, the Department of Health and the Health Service Executive continue to provide essential support for the operation and development of this system. In particular, we would like to express our gratitude to Professor Michael Turner (Director of the HSE Obstetrics and Gynaecology programme), Alan Cahill and Gráinne Cosgrove (DoH) for their valuable contributions and comments on an early draft of this report. The NPRS team within the Economic and Social Research Institute's Health Research and Information Division (HRID) oversees a wide range of tasks related to the management of this system, including personnel training, data quality and audit, data management and analysis, and information dissemination. We acknowledge gratefully the dedication, skill and expertise that all the members of this team bring to their work on this system. Collection and preparation of the data are undertaken by Malgorzata Chance, Catherine Glennon, Anna Lewandowska, and Izabela Sikora. The IT Department of the HRID supports the development of the NPRS software system for data entry and validation and this is gratefully acknowledged. We would also like to thank specifically Léan McMahon and Deirdre Murphy for reviewing and commenting on earlier drafts of this report. Inevitably, a number of individuals have to carry most of the responsibility for producing a report of this type. In this case Sheelagh Bonham, Aisling Mulligan, and Sinead O'Hara, were to the fore in the preparation of the report for publication with assistance from Nathan Cunningham, Karen Kearns, Shane Leavy and Laura Metcalfe. We wish to express our sincere thanks to these colleagues for all of their hard work on the report. Their commitment, enthusiasm and professionalism are gratefully acknowledged and sincerely appreciated.


P er inata l S tat is t i cs R e p ort 20 1 1 | i
TABLE OF CONTENTS LIST OF TABLES ……………………………………………….............……………………….……..……………………… iii LIST OF FIGURES ………………………………………………………….............………….….………………..………… v KEY FINDINGS …….……………………………………………………………….…….............…………………………… vii SECTION ONE INTRODUCTION
1
Introduction …………………………………………………………………………………………….........………..………. 2 Purpose of this Report ………………………………………………………………………………………………..…….. 2 Structure of this Report ……………………………………………………………………………………….……………. 2 Conventions used in this Report ……………………………………………………………………………..………… 3 National Minimum Data Set …………………………………………………………………………………………..…. 4 Data Collection and Quality …….………………….…………………………………………………………………….. 5 SECTION TWO TIME TRENDS AND INTERNATIONAL COMPARISONS
7
Introduction ……………………………………………………………………….………………………….……….…………. 8 Trends in Selected Statistics ………………………….……………………………………..……………….……...…. 8 Perinatal Mortality …………………………………………………………….………………………………………………. 11 Birth Rates …………………………………………………………………………….……………………………................. 13 Fertility ………………………………………………………………………………………………………………………………. 15 Singleton and Multiple Births ………………………..…………………….…………………………………………..… 16 Method of Delivery for Primiparous and Multiparous Women….………………….……………….…… 18
SECTION THREE GENERAL CHARACTERISTICS
21
Introduction ……………………………………………………………………………….…………………………..…………. 22 Maternal Age …………………………………………………………………….……….……………………….…….………. 23 Mother’s Marital Status ………………………………………………………………..…….……………………….……. 25 Occupation ………………………………………………….…………………………………………………….………………. 27 Mother’s Occupation ………………………………………………………………….………………………………. 27 Father’s Occupation …………………………………………………………………….……..………………………. 29 Nationality ……………………………………………………….………………………………………………………………… 32 Mother’s Nationality …………………………………………………………………………………………………… 32 Father’s Nationality …………………………………………………………………………….……………….……… 35 Maternal Parity …………………………………………………………………………………………….……………………. 37 Number of Previous Stillbirths ……………………………………………………………………….…………………… 40 Interval Since Last Birth …………………………………………………………………………………….……………….. 41 Birthweight ……………………………………………………………………………………………………….……………….. 42 Gestational Age …………………………………………………………………………………….………….……………….. 46 Month of Birth …………………………………………………………………………………………………….…………….. 48
i i | Ta b le o f C o nt ents
SECTION FOUR PERINATAL CARE
51
Introduction ……………………………………………………………………….……….………………………..…….…… 52 Type of Antenatal Care …………………………………………………………………………….…………….………… 53 Duration of Pregnancy at First Antenatal Visit …………………………………………………………..……… 54 Advance Hospital Bookings ………………………………………………………….……………………………...…… 55 Mother’s Antenatal Length of Stay ………………………….……………………………………………………..… 56 Mother’s Postnatal Length of Stay …………………………………………………………………………………... 57 Rubella: Immune Status of Mother ……………………………………………………………………..………….. 59 Method of Delivery …………………………………………………...………………………………………………....... 59 Method of Delivery by Maternities and Parity ……...……………………..…………………………… 59 Method of Delivery by Births and Parity .……………………………..……..………………………….... 61 Method of Delivery by Births and Plurality ..………………………..………………………….………… 62 Method of Delivery by Maternal Age ……………………………………………………….…………....... 63 Distribution of Births by Size of Maternity Unit ……………………………………….……………………….. 64 Inter-Hospital Transfer of Infants ……………………………………………………………………………………… 65 Infant’s Length of Stay ………………………………………………………..……………………………………………. 66 Infant’s Type of Feeding …………………………………………………………………………………..………………. 67 SECTION FIVE PERINATAL OUTCOMES
75
Introduction ……………………………………………………………………….………………….………………………… 76 Mortality by Birthweight and Parity ………………………………………………………….……………………… 76 Cause of Death by Birthweight ………………………..………………………………………………..……………… 79 Mortality by Gestational Age …………………..…………………………………………………………..…………… 84 Cause of Death ……………………………………………………….………………………………………………………… 86 Age at Death ………………………………………………….……………………………………………………….………… 93 Post-Mortem Examinations ………………………….……………………………………………………..…………… 94 APPENDICES 95 Appendix A: Definitions ……………………………….…………………………….………….……………....……….. 96 Appendix B: Copy of Part 3 of the Birth Notification Form ………………………………………..….….. 100 Appendix C: Classification of Occupation .............................................................................. 101 Appendix D: Cause of Death Classification ............................................................................ 102 Appendix E: Classification of County of Residence …………………………………………………..……..… 106 Appendix F: Classification of Nationality ……………………………………………………………..…………… 107 Appendix G: Source Data for Figures ……………………………………………………………………..…………. 111 Appendix H: Domiciliary Births …………………………………………………………………………………………. 125
P er inata l S tat is t i cs R e p ort 20 1 1 | i i i
LIST OF TABLES Tables for Time Trends and International Comparisons:
2.1 Trends in Selected Statistics, 2002–2011 ……………………….………………………...…….……… 10 2.2 Live Births, Stillbirths, Early Neonatal Deaths, and Perinatal Deaths, 2002–2011 ...... 11 2.3 Singleton and Multiple Births, 2002–2011 …………………….…………………………................ 17 2.4 Live Births, Stillbirths and Early Neonatal Deaths, Numbers and Rates, Singleton
and Multiple Births, 2002–2011 ………………………………………………................……………… 17 2.5 Percentage Distribution of Maternities by Method of Delivery, Primiparous and
Multiparous Women, 2002–2011 …………………………………...........................……........... 18 Tables for General Characteristics:
3.1 Age of Mother ………..……………………………………………………………………………………………… 23 3.2 Mother’s Marital Status ……….……………………………………………………………………………….. 25 3.3 Mother’s Occupation ……….……………………………………………………………………………………. 28 3.4 Father’s Occupation ………..………………………………………………………………….……….……….. 30 3.5 Mother’s Nationality ……………………………..………………………………………………………………. 33 3.6 Father’s Nationality ………..……………………………………………………………………………………… 36 3.7 Maternal Parity ……………...…………………………………………………………………….……….……… 37 3.8 Previous Stillbirths ……….……………………………………………………………………………………….. 40 3.9 Interval in Years Since Last Birth ……….…………………………………………………………………… 41 3.10 Birthweight (grams)..……………………………………………………………………………………………… 43 3.11 Gestational Age (weeks) at Delivery ……….……………………………………………………………… 46 3.12 Month of Birth ……….……………………………………………………………………………………………… 48 Tables for Perinatal Care:
4.1 Type of Antenatal Care ………..………………………………………………………………...……………… 53 4.2 Time of First Visit (weeks) to Doctor or Hospital during Pregnancy …………………..…… 54 4.3 Advance Hospital Bookings …………………………………………………………………….……………… 55 4.4 Mother’s Antenatal Length of Stay ………………………………………………………………………… 56 4.5 Mother’s Postnatal Length of Stay ………..………………………………………………....…………… 57 4.6 Rubella: Immune Status of Mother, Numbers and Percentages ………..…………………… 59 4.7a Method of Delivery for Total Maternities by Parity …………………………………..…………… 60 4.7b Method of Delivery for Total Births by Parity ………………………………………………………… 61 4.8a Method of Delivery, Total Births ……………………………………………………………………………. 62 4.8b Method of Delivery by Maternal Age ………….………………………………………………….……… 63 4.9 Size of Maternity Unit (Number of Live Births and Stillbirths Annually) …………….…… 64 4.10 Inter-Hospital Transfer of Infants …………………………………………………………………..……… 65 4.11 Infant’s Length of Stay (days) in Hospital, Live Births ………........................................ 66 4.12 Age of Mother by Infant’s Type of Feeding, Numbers and Percentages, Total Live
Births …..…………………………………………………………………………….....…....................………… 68 4.13 Mother’s Occupation by Infant’s Type of Feeding, Total Live Births …….………………… 71

iv | L is t o f Ta b l es
Tables for Perinatal Outcomes:
5.1 Birthweight (grams): Total Births, Antepartum and Intrapartum Stillbirths, Early
Neonatal Deaths, and Mortality Rates…………..............……………….....…………..….……… 77 5.2 Cause of Death by ICD-10 Chapter by Birthweight, Numbers and Perinatal Mortality
Rate ……..……………………………………………………………..........………………………………………….. 80 5.3 Gestational Age (weeks): Total Births, Antepartum, and Intrapartum Stillbirths,
Early Neonatal Deaths, and Mortality Rates……………….........……....…………………….….... 84 5.4 Cause of Death by ICD-10 Chapter and Subcategories, Numbers and Mortality Rates 87 5.5 Age at Death, Early Neonatal Deaths ……………………………………………………………..……..… 93 5.6 Post-Mortem Examinations, Total Deaths …….........................................................….. 94 Appendix Tables:
D1 Cause of Death Coding Rules …..…………………………………………………………………...……… 104 D2 ICD-10, Cause of Death Codes …..……………………………………………………………….………… 105 Tables for Source Data for Figures:
G1 Percentage Distribution of Total Births by Mother’s Marital Status, 2007–2011..... 111 G2 Mother’s County of Residence by Mother’s Marital Status, Total Births ……..….…… 112 G3 Percentage Distribution of Total Births by Mother’s Nationality, 2007–2011.......... 113 G4 Mother’s Average Age by Mother’s Nationality, Total Maternities …..………....……… 114 G5 Age of Mother by Maternal Parity, Total Maternities .............................................. 114 G6 Percentage Distribution of Total Births to Primiparous Women by Maternal Age,
2007 and 2011 …………………………………………………………….........................………………. 114 G7 Percentage Distribution of Total Births to Multiparous Women by Maternal Age,
2007 and 2011 .......................................................................................................... 114 G8 Birthweight (grams) for Primiparous Women..……….......…...………………………………… 115 G9 Birthweight (grams) for Multiparous Women ………..……………………………....…………… 116 G10 Birthweight (grams), Numbers and Percentages, Total Live Births ………....…………… 117 G11 Birthweight (grams) by Sex, Total Live Births …………………………………………….......…… 117 G12 Gestational Age (weeks) at Delivery, Primiparous Women ……………………….…....…… 118 G13 Gestational Age (weeks) at Delivery, Multiparous Women ……..……...................…… 118 G14 Method of Delivery by Mother’s Postnatal Length of Stay, Singleton and Multiple
Births ………………………………………………………………………..…..……….......................……… 119 G15 Method of Delivery by Parity, Total, Singleton and Multiple Births ……...……………… 120 G16 Mother’s County of Residence by Infant’s Type of Feeding, Total Live Births ….…… 121 G17 Mother’s Nationality by Infant’s Type of Feeding, Total Live Births ........................ 123 G18 Birthweight (grams): Total Births, Antepartum and Intrapartum Stillbirths, Early
Neonatal Deaths, and Mortality Rates …..……..………..…………………………………...……… 124 Tables for Domiciliary Births:
H1 Trends in Domiciliary Births - Selected Statistics, 2002-2011 ………………………………… 126 H2 Age of Mother by Maternal Parity …………………………………………………………….....……… 127 H3 Mother’s Marital Status by Age of Mother ……..…………………………………….……………… 128 H4 Age of Mother by Gestational Age (weeks) at Delivery ……………………………….………… 128 H5 Birthweight (grams) by Gestational Age (weeks) at Delivery ………………………………… 129 H6 Mother’s Occupation by Birthweight ………………………………………………..…………..……… 129 H7 Mother’s Occupation by Type of Feeding .................………….............................……… 130
P er inata l S tat is t i cs R e p ort 20 1 1 | v
LIST OF FIGURES
1.1 National Perinatal Reporting System, Data Collection ……..………..………………………….. 6 Figures for Time Trends and International Comparisons:
2.1 Stillbirth, Early Neonatal and Perinatal Mortality Rates, Ireland, 2002–2011 …......… 12 2.2 Perinatal Mortality Rates for Selected EU Countries, 2011 ………...…………………....…… 13 2.3 Trends in Birth Rates for Selected EU Countries, 2002-2011 ……………..…………........… 14 2.4 Birth Rates per 1,000 Population for EU Countries, 2011 ………..………................……… 14 2.5 Age-Specific Fertility Rates (ASFRs) and Total Period Fertility Rates (TPFRs),
Ireland, 2002–2011 …..…………………………………………………………………………………………… 15 2.6 Total Period Fertility Rates for Selected EU Countries, 2011 …………….………...………… 16 2.7 Percentage Distribution of Maternities Delivering by Caesarean Section
for Total, Primiparous and Multiparous Women, 2002–2011 ………..………………...…… 19 Figures for General Characteristics:
3.1 Age-specific Stillbirth, Early Neonatal and Perinatal Mortality Rates, Total Births .… 24 3.2 Percentage of Births by Mother’s Marital Status, Total Births, 2007–2011 …...…….… 26 3.3 Percentage of Births to Single Mothers by Mother’s County of Residence,
Total Births …………..…………………………………………………………………………………….....……… 26 3.4 Perinatal Mortality Rates by Mother’s Occupation, Total Births ………....………………… 29 3.5 Perinatal Mortality Rate by Father’s Occupation, Total Births ….…………….…..………… 31 3.6 Percentage Distribution of Births by Nationality for Non-Irish Born Mothers,
Total Births, 2007–2011 ……..………………………………………………………………………....……… 34 3.7 Average Age of Mother by Mother’s Nationality, Total Maternities …………………....… 34 3.8 Parity by Age of Mother, Total Maternities ……..………………………………………….………… 38 3.9 Total Births to Primiparous Women by Mother’s Age Group, 2007 and 2011 …..…… 39 3.10 Total Births to Multiparous Women by Mother’s Age Group, 2007 and 2011 ……..… 39 3.11 Birthweight: Cumulative Percentages of Total Live Births ..………………..………………..… 44 3.12 Percentage of Births by Birthweight Groups, Total Live Births …….………………….……… 44 3.13 Percentage Distribution for Males and Females across Birthweight Groups,
Total Live Births ……………………………………………………………………………………........……….. 45 3.14 Perinatal Mortality Rates by Gestational Age (weeks) at Delivery, Total Births ……… 47 3.15 Percentage of Births by Month of Birth, Total Births ……………………………………………… 49 Figures for Perinatal Care:
4.1 Mother’s Postnatal Length of Stay by Method of Delivery, Singleton Births ……..…… 58 4.2 Mother’s Postnatal Length of Stay by Method of Delivery, Multiple Births ……………. 58 4.3 Percentage Distribution of Maternities by Method of Delivery ................................. 60 4.4 Percentage Distribution of Total Live Births by Method of Delivery .......................... 63 4.5 Percentage of Total Births by Method of Delivery and Age of Mother …………………… 64 4.6 Percentage Distribution of Births by Size of Maternity Unit, Total Births …….…...…… 65 4.7 Percentage Distribution of Total Live Births by Infant’s Length of Stay ……..…...……… 67 4.8 Percentage Distribution of Infant’s Type of Feeding by Age of Mother,
Total Live Births ……..………….............................................................................…………
69 4.9 Percentage Distribution of Breastfed Infants by Mother’s County of Residence,
Total Live Births ……..……………….…………………………………………………………..................... 70 4.10 Percentage Distribution of Infant’s Type of Feeding by Mother’s Occupation,
Total Live Births ……..……………………………………………………………………………...……………… 72 4.11 Percentage Distribution of Breastfed Infants by Mother’s Nationality, Total Live
Births ................……..……………………………………………………………………………...………………
73

vi | L is t o f F ig ur es
Figures for Perinatal Outcomes:
5.1 Deaths by Birthweight Groups and Parity ………..………………………………………….………… 78 5.2 Perinatal Mortality Rates by Birthweight Groups, Total Births ……….………………...…… 79 5.3 Total Deaths with Birthweight < 2,500 grams by Cause of Death ………..………….……… 83 5.4 Total Deaths with Birthweight ≥ 2,500 grams by Cause of Death …………………….…….. 83 5.5 Deaths by Gestational Age (weeks) Groups, Total, Singleton and Multiple Births…... 85 5.6 Perinatal Mortality Rates by Gestational Age (weeks) at Delivery, Total Births ……… 86 5.7 Stillbirths by Cause of Death, Total, Singleton and Multiple Births …...…………………… 90 5.8 Early Neonatal Deaths by Cause of Death, Total, Singleton and Multiple Births ..…… 91 5.9 Perinatal Deaths by Cause of Death, Total, Singleton and Multiple Births …...………… 92 Figures for Domiciliary Births:
H1 Number and Percentage of Domiciliary Births Reported, 2002–2011 ………..……..…… 127

K ey F in d in gs | v i i
KEY FINDINGS The Perinatal Statistics Report 2011 presents national statistics on perinatal events in Ireland. This report is based on data collected for the National Perinatal Reporting System (NPRS) and provides information on mothers giving birth and babies born in 2011. SUMMARY STATISTICS, 2011 Live Births, Stillbirths, Early Neonatal Deaths, Perinatal Deaths, and Adjusted Perinatal Deaths
Total Births Live Births Stillbirths Early Neonatal
Deaths Perinatal Deaths
Adjusted Perinatal Deaths#
Number Number Number Rate* Number Rate* Number Rate* Number Rate* Singleton 71,651 71,375 276 3.9 126 1.8 402 5.6 275 3.8 Multiple 2,726 2,705 21 7.7 27 10.0 48 17.6 33 12.2 Total 74,377 74,080 297 4.0 153 2.1 450 6.1 308 4.1
Notes: * Rate per 1,000 births. For stillbirths, perinatal deaths and adjusted perinatal deaths, rates are calculated on total live
births and stillbirths. For early neonatal deaths, rates are calculated on total live births. See Appendix A for further details on calculation of rates.
# In this and subsequent tables, ‘Adjusted Perinatal Rate’ excludes all deaths due to congenital anomalies. BABIES, 2011
MOTHERS, 2011
• The average age of mothers has increased from 30.4 years in 2002 to 31.7 years in 2011 • 29% of mothers were aged 35 years or older, up from 23% in 2002 • 17% of first births were to women aged 35 years or older compared to 11% in 2002 • 2% of total mothers giving birth were aged 19 years or younger, compared to 5% in 2002 • 40% gave birth for the first time, with an average age for first time mothers of 29.8 years • 33% of births were to single mothers, who had an average age of 28.3 years • 2% had a multiple pregnancy • 55% of mothers recorded any breastfeeding, compared to 51% in 2007 and 44% in 2002 • 47% of mothers exclusively breastfed, compared to 45% in 2007 and 41% in 2002 • 57% of women having a singleton live birth delivered spontaneously, while deliveries using forceps accounted for 4%, vacuum extractions for 12%, and 27% by caesarean section • For women having a singleton birth 55% had a postnatal length of stay of 2 days or less and 43% had a postnatal
length of stay of 3-5 days • For women having a multiple birth 13% had a postnatal length of stay of 2 days or less and 74% had a postnatal length of stay of 3-5 days • 24% of births in 2011 were to mothers born outside Ireland compared to 21% in 2007.
• 74,377 births were reported to NPRS in 2011, representing a 1.6 per cent decrease between 2010 and 2011 • 6% of total births were preterm (less than 37 weeks gestation) • 5% of live births were low birthweight (less than 2,500 grams) • 3% of live births were high birthweight (4,500 grams or more) • 55% of babies recorded any breastfeeding in 2011, compared to 51% in 2007 and 44% in 2002 • 47% of babies were exclusively breastfed, compared to 45% in 2007 and 41% in 2002 • 28% of total live births were delivered by caesarean section, with 27% of singleton and 66% of multiple live births
delivered by this method. In 2002, 22% of total live births were delivered by caesarean section • 96% of singleton births and 66% of multiple births were discharged from hospital within 5 days of birth • The perinatal mortality rate was 6.1 per 1,000 live births and stillbirths (5.6 per 1,000 singleton births and 17.6 per
1,000 multiple births). This rate has fallen by 28% since 2002,when it was 8.4 per 1,000 live births and stillbirths • At 10.7 per 1,000 live births and stillbirths, the perinatal mortality rate was highest for babies born to mothers aged
40 to 44 years. The lowest perinatal mortality rate of 5.3 per 1,000 live births and stillbirths was for babies born to mothers aged between the 25 to 29 and 35 to 39 year age groups.


SECTION ONE
INTRODUCTION
2 | Per inatal Stat i st ics Report 2011
INTRODUCTION
The National Perinatal Reporting System (NPRS) within the Health Research and Information Division (HRID) at the Economic and Social Research Institute (ESRI) is responsible for the collection, processing, management and reporting of data on all births nationally. As the only complete national reporting system on births, it is a valuable resource for informing policy and service planning. The analysis presented in this report is based on data collected from Part 3 of the Birth Notification Form (BNF01/2003) which is used to notify local registrars of all live births and stillbirths occurring in Ireland (see Appendix B). Since 1999 the ESRI has managed the NPRS on behalf of the Department of Health and the Health Service Executive.
PURPOSE OF THIS REPORT
The principal aim of this report is to present national statistics on perinatal events for the year 2011.1 In so doing, the report aims to
• describe the fundamental social and biological characteristics of mothers and their babies
• report on pregnancy outcomes with particular reference to perinatal mortality
• highlight important aspects of perinatal care
• stimulate a wider interest in research in the area of perinatal epidemiology
• promote a general recognition of the importance of having an accurate and complete perinatal reporting system at a national level.
STRUCTURE OF THIS REPORT
SECTION ONE provides background information relating to the NPRS system, explains conventions used in the report, and provides details relating to the data elements collected in the system.
SECTION TWO contains summary data on selected variables since 2002 and trends in international comparisons.
SECTION THREE contains tables relating to the following variables: maternal age, marital status, socio-economic group of mother and father (derived from collection of data on occupation), nationality of mother and father, maternal parity, distribution of previous stillbirths, interval since last birth, birthweight, gestational age, and month of birth.
SECTION FOUR presents tables relating to variables which fall more naturally into the category of the use of health care facilities, and deals in particular with the following: type of antenatal care received, timing of first antenatal visit, length of mother’s antenatal and postnatal stay, whether hospital admission was
1 Previous reports in this series can be downloaded from www.esri.ie/health_information/nprs/nprs_reports/

Introd uct ion | 3
booked or not, mother’s immunity to rubella, method of delivery, classification of outcome according to size of maternity unit, transfer of infants between hospitals, length of infant’s hospital stay, and type of feeding.
SECTION FIVE deals with perinatal outcomes in detail, examining perinatal deaths by birthweight and gestational age, with particular focus on cause of death. In this section, tables are presented on the following variables: numbers of antepartum and intrapartum stillbirths and early neonatal deaths by birthweight groups and gestational age, numbers and rates for cause of death, age at death for early neonatal deaths, and numbers and percentages of stillbirths and early neonatal deaths undergoing post-mortem examinations.
APPENDICES include definitions, source data tables for figures, and other relevant information for use when reading the report. Appendix H deals with domiciliary births, including trends since 2002 and tables on selected variables for 2011.
CONVENTIONS USED IN THIS REPORT
• In accordance with the World Health Organization (WHO) guidelines, only births weighing 500 grams or more are included in any analysis of NPRS data. (See www.who.int/classifications/icd/ICD-10_2nd_ed_volume2.pdf ; pg 96, 5.7.2. Reporting Criteria)
• The majority of tables report total, singleton and multiple births alongside the number of maternities, where applicable. Other tables report total maternities by primiparous and multiparous women for selected variables (see Appendix A for definitions).
• Unless otherwise stated, discussion on total births in this report includes live births and stillbirths for singleton and multiple births.
• Caution should be exercised when interpreting rates based on small numbers. Rates based on 20 observations or fewer are distinguished by italic type as a warning to the user that their reliability as a measure may be affected by the small number of observations. For further information on calculation of rates see Appendix A.
• Throughout this report ‘Not Stated’ values are not included in the calculation of percentages used in discussion or in compilation of figures. ‘Not Stated’ values are presented in data tables. ‘Not Stated’ values are reported by hospitals when information is not available.
• Deliveries under hospital schemes (including domino, early transfer home, planned community midwives, and midwifery-led units) are treated as hospital births.
• Fathers’ details are only required for registration purposes where mother’s marital status is recorded as ‘married’. As a result, the proportion of records for which information is available is not complete and a category of ‘not applicable’ is required, this category is combined with ‘not stated’ for the purposes of presenting data on father’s occupation and father’s nationality in this report.

4 | Per inatal Stat i st ics Report 2011
NATIONAL MINIMUM DATA SET
The NPRS data set provides a national minimum data set, which is intended to serve as a basis for the analyses of key indicators over time. Births are registered and notified on a standard four-part Birth Notification Form (BNF01/2003) used to notify local registrars of all live births and stillbirths occurring in Ireland. The third part of the form has all identifying information removed and is sent to the HRID at the ESRI (see Appendix B). Figure 1.1 provides a diagrammatic representation of the information system around the registration of births. All the tables in this report are based on data contained in the third part of the standard form.
The data collected by the NPRS can be grouped logically into demographic, clinical and administrative data as follows:
DEMOGRAPHIC DATA
• Date of infant’s birth, sex of infant • Date of father’s birth, father’s county and country of residence, father’s occupation, father’s
nationality (from 2004) • Date of mother’s birth, mother’s county and country of residence, mother’s occupation, mother’s
nationality (from 2004) • Marital status of mother and date of present marriage CLINICAL DATA
• Infant’s birthweight and period of gestation, and mother’s obstetric history (including parity) • Multiple birth indicator • Autopsy indicator • Whether stillbirth occurred before or during labour • Main cause of death and one secondary cause of death for infant • Maternal immunity to rubella, method of delivery • Infant’s BCG vaccination • Main maternal disease or condition and one secondary maternal disease or condition affecting the
infant or foetus • Main disease or congenital malformation and one secondary disease or congenital malformation
affecting the infant or foetus

Introd uct ion | 5
ADMINISTRATIVE DATA
• Hospital number, case number (unique to hospital of birth) • Type of birth indicator, place of birth • Date of last birth (live birth or stillbirth) • Type of death indicator, place of death • Type of antenatal care received, dates of first visits to doctor and hospital during pregnancy • Type of feeding, pre-booked admission indicator, dates of mother’s admission and discharge, date of
infant’s discharge • Infant transfer indicator, number for hospital to which infant was transferred.
DATA COLLECTION AND QUALITY
The link between the Birth Notification Form and the birth registration process for the General Register Office (GRO) ensures complete coverage of all births for the NPRS (see Figure 1.1). With the objective of preserving confidentiality, each birth is recorded using case reference numbers unique to each hospital/maternity unit. Missing records can be identified using this unique case reference number system. Where a record is found to be missing, a request is made to the hospital/maternity unit to provide the birth notification form for any missing records. Similarly, independent midwives are requested to submit an annual summary of all births attended for a specified year, which is cross-checked against the birth notification forms received.
The Information Technology and Support team at the HRID has developed a custom-designed data entry and validation software system for NPRS data. Data are received, either in electronic or paper format, from the hospitals/independent midwives and entered in the NPRS data system. Quality checks include the application of a comprehensive series of edits, which are built into this software system to check for completeness, validity, logic, and coding errors. If problems are identified, clarification can be sought from the hospital or midwife and corrections can be made at the point of data entry. This data validation process is continually reviewed and new checks are incorporated based on data quality activities and research. The completeness of each record is dependent on the commitment of those persons responsible for notification and registration of the births in each hospital/maternity unit throughout the country and each independent midwife working in the community.

6 | Per inatal Stat i st ics Report 2011
FIGURE 1.1 National Perinatal Reporting System, Data Collection
Notes: CSO denotes Central Statistics Office. HSE denotes Health Service Executive.
DoH denotes Department of Health. GRO denotes General Register Office.
Four-part Birth Notification Form
(BNF01/2003) completed by
hospital/midwife
Part 1 Register birth/death with local Registrar
and GRO
Part 2 Director of
Community Care in local HSE area
Part 3 Forms/Electronic Record reviewed,
coded and processed by HRID at ESRI
Part 4 File with hospital patient record or
retained by midwife
Data cleaning and validation using custom-
designed NPRS data entry software
Feedback/queries arising from validation process
to hospital/midwife
Formation of national data set; data set
forwarded to DoH and HSE
Data forwarded to CSO for Vital Statistics
-Publishing of annual report -Data analysis and requests -Hospital reports on request
Ongoing

SECTION TWO
TIME TRENDS AND INTERNATIONAL COMPARISONS
8 | Per inatal Stat i st ics Report 2011
INTRODUCTION
This section presents selected statistics, together with data on the following three key indicators:
1) perinatal mortality
2) birth rate
3) fertility.
At a national level, data presented here show how these parameters have changed over time. International comparisons then allow the most recent statistics for Ireland to be compared with those for other European countries. The indicators for Ireland were calculated using data from the NPRS for the period 2002 to 2011.2 Analysis on single and multiple births and method of delivery for the period 2002 to 2011 are also presented.
TRENDS IN SELECTED STATISTICS Table 2.1 presents trends in selected statistics and shows that;
• Total births increased from 60,865 births in 2002 to 74,377 births in 2011, a 22.2 per cent increase over the decade. The number of total births reported has decreased between 2010 and 2011 by 1.6 per cent.
• Mothers giving birth in Ireland in 2011 (31.7 years) were on average 1.3 years older than those who gave birth in 2002 (30.4 years) and just slightly older than those giving birth in 2010 (31.5 years).
• The percentage of total births to single mothers has increased from 30.0 to 33.3 per cent, representing an 11.0 per cent increase over the decade 2002 to 2011. Total births to single mothers increased by 0.9 per cent between 2010 and 2011.
• The average age of single mothers has increased from 25.7 years in 2002 to 28.3 years in 2011, a rate of increase of 10.1 per cent over the decade. There was a 1.1 per cent increase between 2010 and 2011.
• Average parity (number of previous live births and stillbirths) has decreased slightly from 1.1 to 1.0 over the period and is unchanged from 2010. Interval in years since last delivery has remained relatively stable and was 3.8 years in 2011, compared with 3.9 years in 2010.
• Immunity to rubella for mothers increased from 86.5 per cent in 2002 to 92.3 per cent in 2010 and was recorded at 94.3 per cent in 2011.
• The percentage of women recording any breastfeeding was 43.9 per cent in 2002. This rate has increased to 55.3 per cent in 2011 which represents an increase of 26.0 per cent in the proportion of women recording any breastfeeding over the decade. An increase of just 2.2 per cent is estimated for the period 2010 to 2011.
• The percentage of women exclusively breastfeeding has increased from 41.1 per cent in 2002 to 47.0 per cent in 2011. This represents an increase of 14.4 per cent in the proportion of women recording exclusive breastfeeding over the decade. This rate increased by 1.7 per cent between 2010 and 2011.
2 Previous reports in this series can be downloaded from www.esri.ie/health_information/nprs/nprs_reports/

Time Trends and Internat iona l Comparisons | 9
Additional data relating to the birth episode show that:
• Mother’s average length of stay was recorded at 4.1 days in 2002 and has decreased to 3.3 days in 2011 representing a decrease of 19.5 per cent over the decade. The decline since 2010 is estimated at 2.9 per cent.
• The number of women choosing combined antenatal care has increased by 4.3 per cent over the decade 2002 to 2011. There was, however, a slight decrease to 77.3 per cent in 2011 compared with 80.9 per cent in 2010.
• Booked admissions for 2011 are estimated at 99.3 per cent which is unchanged from 2010.
Method of delivery is reported by total live births and by total maternities.
• For total live births the percentage of spontaneous deliveries fell from 62.4 per cent in 2002 to 55.8 per cent in 2011. The upward trend in delivery by Caesarean section continues with a rate of 22.4 per cent reported in 2002 compared with 28.1 per cent for 2011. This represents an increase of 25.4 per cent in the proportion of Caesarean section deliveries for live births over the decade, and a 3.7 per cent increase between 2010 and 2011.
• For total maternities, the percentage of spontaneous deliveries fell from 63.0 per cent in 2002 to 56.6 per cent in 2011. The trend in delivery by Caesarean section has increased from 21.9 per cent in 2002 to 27.3 per cent in 2011, which represents an increase of 24.7 per cent in the proportion of Caesarean section deliveries for maternities over the decade, and a 3.8 per cent increase between 2010 and 2011.
Regarding infant’s characteristics, trends have been largely consistent over the decade 2002 to 2011.
• The average birthweight for total live births was 3,467.0 grams in 2011 which is broadly consistent with the preceding decade and almost unchanged since 2010 (3,468.4 grams).
• While the average birthweight for singleton births of 3505.0 grams has remained consistent over the decade, slightly more variation is observed for multiple births, ranging from a high of 2,489.7 grams in 2002 to a low of 2,421.4 grams in 2007 and 2,464.6 grams in 2011.
• The percentage of total births recording low birthweight (<2,500 grams) was 4.9 per cent in 2002 compared with 5.2 per cent for 2011. This represents a 6.1 per cent increase in the proportion of low birthweight babies over the decade and a 2.0 per cent increase between 2010 and 2011.
• The percentage of total births classified as high birthweight (4,500 grams or more) has decreased from 2.9 per cent in 2002 to 2.6 per cent in 2011. In 2010, 2.7 per cent of total births classified as high birthweight.
• For total births, the infant’s average length of stay declined from 3.9 days in 2002 to 3.2 days in 2011. This represents a 17.9 per cent decrease over the decade, with no change from 2010 reported.

TABLE 2.1 Trends in Selected Statistics, 2002–2011
2002 2003 2004 2005 2006 2007 2008 2009 2010 2011 % Change
2002–2011 2010-2011 Total Births N 60,865 61,989 62,406 61,786 65,810 71,963 75,587 76,023 75,600 74,377 22.2 -1.6 Birth Rate1 Per 1,000 population 15.5 15.5 15.3 14.9 15.5 16.4 16.8 16.7 16.5 16.2 4.5 -1.8 Maternal Characteristics Age of mother (years)2 Avg 30.4 30.6 30.8 31.0 31.0 31.1 31.1 31.3 31.5 31.7 4.3 0.6
Age of single mother (years)2,3 Avg 25.7 26.1 26.4 26.6 26.8 27.1 27.3 27.5 28.0 28.3 10.1 1.1 Single mothers 2,3 % 30.0 30.2 30.6 30.7 31.5 31.8 32.4 32.4 33.0 33.3 11.0 0.9 Maternal parity2 Avg 1.1 1.1 1.1 1.1 1.0 1.0 1.0 1.0 1.0 1.0 -9.1 0.0 Number of previous stillbirths per 1,000 maternities2 Avg 12.6 12.6 12.6 12.8 10.6 10.8 10.9 11.7 11.5 11.9 -5.6 3.5 Gestational age at delivery (weeks)2 Avg 39.5 39.4 39.4 39.4 39.4 39.4 39.4 39.4 39.4 39.3 -0.5 -0.3 Interval since last birth (years)4 Avg 3.9 3.8 3.7 3.8 3.8 3.9 3.9 3.8 3.9 3.8 -2.6 -2.6 Immunity to rubella2 % 86.5 87.3 90.5 90.3 92.2 92.4 90.0 90.5 92.3 94.3 9.0 2.2 Any breastfeeding1,2,5,6 % 43.9 44.8 45.7 47.7 48.9 50.7 51.2 52.8 54.1 55.3 26.0 2.2
Exclusive breastfeeding1,2,5 % 41.1 41.3 42.5 44.1 44.5 45.2 44.7 45.5 46.2 47.0 14.4 1.7 Mother's length of stay (days)1,2,7 Avg 4.1 4.0 3.9 3.8 3.7 3.6 3.5 3.5 3.4 3.3 -19.5 -2.9 Perinatal Care Hospital & G.P. combined antenatal care2 % 74.1 75.9 77.3 77.5 79.0 77.5 79.4 80.8 80.9 77.3 4.3 -4.4 Booked hospital admissions 2,7 % 97.7 97.6 98.4 98.5 99.0 99.1 98.9 99.0 99.3 99.3 1.6 0.0
Method of delivery8
Total live births9
Spontaneous % 62.4 61.2 59.6 59.0 58.8 57.3 56.6 56.4 56.5 55.8 -10.6 -1.2 Caesarean section % 22.4 24.2 25.2 25.9 25.4 26.2 26.7 26.9 27.1 28.1 25.4 3.7 Forceps10 % 3.2 2.9 2.5 2.8 3.0 3.7 3.7 4.1 4.0 4.1 28.1 2.5
Method of delivery8
Total maternities
Spontaneous % 63.0 61.9 60.2 59.7 59.4 58.0 57.4 57.0 57.2 56.6 -10.2 -1.0 Caesarean section % 21.9 23.6 24.6 25.3 24.8 25.5 25.9 26.2 26.3 27.3 24.7 3.8 Forceps10 % 3.2 2.9 2.5 2.8 3.0 3.7 3.7 4.1 4.0 4.1 28.1 2.5
Infant Characteristics
Birthweight (grams)1
Total births Avg 3474.1 3471.1 3476.6 3472.0 3473.0 3465.4 3464.0 3466.1 3468.4 3467.0 -0.2 0.0 Singleton births Avg 3503.7 3500.6 3508.0 3503.2 3503.9 3499.3 3501.9 3498.9 3504.0 3505.0 0.0 0.0 Multiple births Avg 2489.7 2487.1 2471.2 2469.2 2464.8 2421.4 2424.5 2465.2 2447.2 2464.6 -1.0 0.7
Low birthweight (<2500 grams)1
Total births % 4.9 5.1 5.0 5.0 5.0 5.3 5.3 5.0 5.1 5.2 6.1 2.0 Singleton births % 3.8 3.9 3.7 3.8 3.7 3.8 3.8 3.7 3.6 3.6 -5.3 0.0 Multiple births % 44.2 45.1 45.6 45.6 46.4 50.4 48.4 45.4 47.6 46.0 4.1 -3.4
High birthweight (≥4500 grams)1
Total births % 2.9 2.8 2.8 2.9 2.9 2.8 2.7 2.7 2.7 2.6 -10.3 -3.7
Infant's length of stay (days)1,5,7 Total births Avg 3.9 3.8 3.8 3.7 3.7 3.5 3.4 3.3 3.2 3.2 -17.9 0.0 Singleton births Avg 3.7 3.6 3.6 3.5 3.5 3.3 3.1 3.1 3.0 3.0 -18.9 0.0 Multiple births Avg 10.2 10.1 10.6 10.1 9.9 10.0 9.9 9.0 9.5 8.6 -15.7 -9.5
Post-mortems for early neonatal deaths % 42.1 41.7 38.2 24.4 26.9 30.8 29.7 34.0 34.4 25.9 -38.5 -24.7
Notes: 'Not Stated' values are not included in the calculation of percentages. 1 Based on live births. 2Based on maternities. 3 Data recording marital status as ‘never married’ are classified as ‘single’ in this report. 4 Based on multiparous maternities. 5 Excludes early neonatal
deaths. 6 Any breastfeeding includes type of feeding recorded as either breast or combined. 7 Excludes domiciliary births. 8 See also Section 4 ‘Method of Delivery for Primiparous and Multiparous Women’. 9 These figures were based on total live births, as each infant in a multiple pregnancy can have a different method of delivery. 10 Excludes breech deliveries.

Time Trends and Internat iona l Comparisons | 11
PERINATAL MORTALITY
Despite improvements in reducing perinatal mortality in recent decades, the perinatal period continues to be a time of relatively high risk.3 Stillbirths account for 66.0 per cent of perinatal deaths in 2011.4,5 Table 2.2 presents the numbers and rates for total births and perinatal deaths for Ireland from 2002 to 2011.
• In 2011 approximately 1 in every 250 births was stillborn and 1 in every 484 live births died in the first week of life.
• The perinatal mortality rate has fallen from 8.4 per 1,000 live births and stillbirths in 2002 to 6.1 per 1,000 in 2011. This represents a 27.4 per cent decrease over the decade, and a 10.3 per cent decrease since 2010 (see Figure 2.1).
TABLE 2.2 Live Births, Stillbirths, Early Neonatal Deaths, and Perinatal Deaths, 2002–2011
2002 2003 2004 2005 2006 2007 2008 2009 2010 2011 % Change
Number of Births and Perinatal Deaths
2002–2011
2010-2011
Total Births 60,865 61,989 62,406 61,786 65,810 71,963 75,587 76,023 75,600 74,377 22.2 -1.6 Live Births 60,522 61,632 62,067 61,480 65,502 71,570 75,229 75,651 75,245 74,080 22.4 -1.5 Stillbirths 343 357 339 306 308 393 358 372 355 297 -13.4 -16.3 Early Neonatal Deaths 170 177 168 139 152 132 159 155 161 153 -10.0 -5.0 Perinatal Deaths 513 534 507 445 460 525 517 527 516 450 -12.3 -12.8 Adjusted Perinatal Deaths
396 384 382 330 345 383 384 381 368 308 -22.2 -16.3
Rates (per 1,000 births)* Stillbirth 5.6 5.8 5.4 5.0 4.7 5.5 4.7 4.9 4.7 4.0 -28.6 -14.9 Early Neonatal Death 2.8 2.9 2.7 2.3 2.3 1.8 2.1 2.0 2.1 2.1 -25.0 0.0 Perinatal Mortality 8.4 8.6 8.1 7.2 7.0 7.3 6.8 6.9 6.8 6.1 -27.4 -10.3 Adjusted Perinatal Mortality
6.5 6.2 6.1 5.4 5.3 5.3 5.1 5.0 4.9 4.1 -36.9 -16.3
Notes: * For stillbirths, perinatal deaths and adjusted perinatal deaths, rates are calculated on total live births and stillbirths. For
early neonatal deaths, rates are calculated on total live births. For numbers and rates by singleton and multiple births see Section Two ‘Singleton and Multiple Births’.
3 EURO-PERISTAT Project, with SCPE, EUROCAT, EURONEOSTAT. European Perinatal Health Report, 2008.
www.europeristat.com 4 Details on rate calculations are in Appendix A. 5 Section 5 of this report focuses on perinatal outcomes in more detail, examining perinatal deaths by birthweight and
gestational age, with particular focus on cause of death.

12 | Perinata l Stat i st i cs Report 2011
FIGURE 2.1 Stillbirth, Early Neonatal and Perinatal Mortality Rates, Ireland, 2002–2011
Note: See Table 2.2 for data.
Using available data, a European comparison6 of perinatal mortality rates in Figure 2.2 shows that for the countries included;
• Bulgaria recorded the highest perinatal mortality rate for 2011, at 11.7 per 1,000 live births and stillbirths.
• Portugal had the lowest perinatal mortality rate recording 3.8 per 1,000 live births and stillbirths.
• At 6.1 per 1,000 live births and stillbirths, the perinatal mortality rate for Ireland ranked 10th lowest out of the 16 EU27 countries for which 2011 data were available.
6 ‘Population and Social Conditions', Eurostat, Data Navigation Tree, date consulted December 2012.
http://epp.eurostat.ec.europa.eu When countries are compared, it should be remembered that rates are affected by many factors, such as national policies on abortion, screening for congenital anomalies, availability of services related to fertility treatment, differences in the comprehensiveness and accuracy of registration and notification systems, and variations in definitions employed (in particular, for stillbirth).
0.0
1.0
2.0
3.0
4.0
5.0
6.0
7.0
8.0
9.0
10.0
2002 2003 2004 2005 2006 2007 2008 2009 2010 2011
Perin
atal
Mor
talit
y Ra
tes
Stillbirths Early Neonatal Deaths Perinatal Deaths Adjusted Perinatal Deaths

Time Trends and Internat iona l Comparisons | 13
FIGURE 2.2 Perinatal Mortality Rates for Selected EU Countries, 2011
Sources: ‘Population and Social Conditions', Eurostat, Data Navigation Tree, date consulted December 2012. http://epp.eurostat.ec.europa.eu * National Figure compiled by NPRS. See Table 2.2 for data. ** Perinatal Mortality Rate for UK is based on 2010 data.
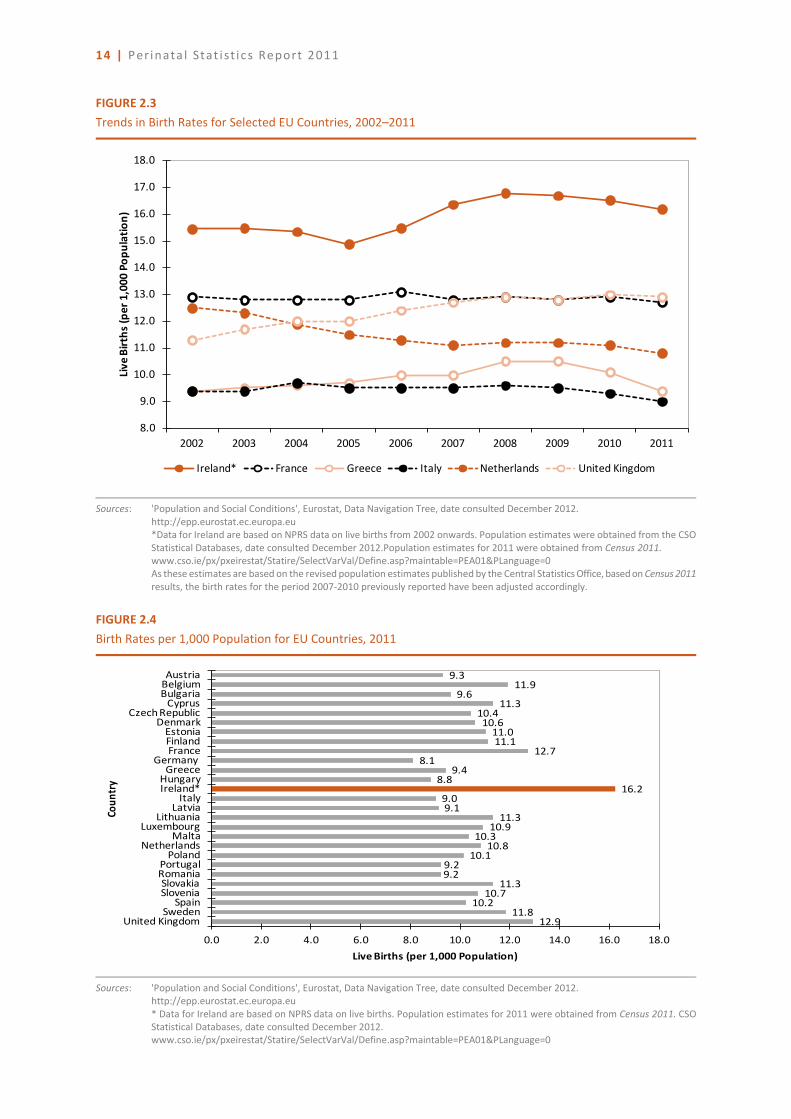
BIRTH RATES7
The birth rate is based on the total number of live births per 1,000 population.8 Figure 2.3 presents trends in birth rates for selected EU countries and total live births for Ireland over the decade 2002 to 2011. Figure 2.4 presents birth rates in the 27 EU countries in 2011.
• Of the countries reviewed, Ireland has consistently had the highest birth rate over the period, increasing from 15.5 per 1000 population in 2002 to 16.2 per 1,000 population in 2011.9
• The birth rate for Ireland has declined from a high of 16.8 per 1,000 population in 2008 to 16.5 per 1,000 in 2010 and 16.2 per 1,000 in 2011.
• After Ireland, the countries with the next highest birth rates are the United Kingdom and France (12.9 and 12.7 respectively) followed by Belgium and Sweden (11.9 and 11.8 respectively). In 2011, Germany (8.1) had the lowest birth rate with Hungary (8.8) next in line (see Figure 2.4).
7 It should be noted that the crude birth rate could rise or fall depending on the numbers of women in the age cohorts from
15 to 49 years old. Changes in the crude birth rate often mask underlying trends in fertility. 8 The population estimates used in the denominator of the birth rate were calculated by the CSO Statistical Databases, date
consulted December 2012. www.cso.ie/px/pxeirestat/Statire/SelectVarVal/Define.asp?maintable=PEA01&PLanguage=0 9 The CSO estimates the Irish birth rate at 16.3 per 1,000 of the population for 2011. See Vital Statistics, Fourth Quarter and
Yearly Summary 2011, July 2012. CSO 2011 data are provisional and are based on the number of births registered within the year as opposed to births occurring in the year.
5.711.7
4.95.5
6.66.1
9.76.16.2
5.55.5
3.87.6
5.64.3
4.77.4
0.0 2.0 4.0 6.0 8.0 10.0 12.0 14.0
AustriaBulgariaEstonia
Germany HungaryIreland*
LatviaLithuania
LuxembourgNetherlands
PolandPortugalRomaniaSlovakiaSloveniaSweden
United Kingdom**
Perinatal Mortality Rate (per 1,000 Live Births and Stillbirths)
Coun
try
14 | Perinata l Stat i st i cs Report 2011
FIGURE 2.3 Trends in Birth Rates for Selected EU Countries, 2002–2011
Sources: 'Population and Social Conditions', Eurostat, Data Navigation Tree, date consulted December 2012. http://epp.eurostat.ec.europa.eu *Data for Ireland are based on NPRS data on live births from 2002 onwards. Population estimates were obtained from the CSO Statistical Databases, date consulted December 2012.Population estimates for 2011 were obtained from Census 2011. www.cso.ie/px/pxeirestat/Statire/SelectVarVal/Define.asp?maintable=PEA01&PLanguage=0 As these estimates are based on the revised population estimates published by the Central Statistics Office, based on Census 2011 results, the birth rates for the period 2007-2010 previously reported have been adjusted accordingly.
FIGURE 2.4 Birth Rates per 1,000 Population for EU Countries, 2011
Sources: 'Population and Social Conditions', Eurostat, Data Navigation Tree, date consulted December 2012. http://epp.eurostat.ec.europa.eu * Data for Ireland are based on NPRS data on live births. Population estimates for 2011 were obtained from Census 2011. CSO Statistical Databases, date consulted December 2012. www.cso.ie/px/pxeirestat/Statire/SelectVarVal/Define.asp?maintable=PEA01&PLanguage=0
8.0
9.0
10.0
11.0
12.0
13.0
14.0
15.0
16.0
17.0
18.0
2002 2003 2004 2005 2006 2007 2008 2009 2010 2011
Live
Birt
hs (p
er 1
,000
Pop
ulat
ion)
Ireland* France Greece Italy Netherlands United Kingdom
9.311.9
9.611.3
10.410.6
11.011.1
12.78.1
9.48.8
16.29.09.1
11.310.9
10.310.8
10.19.29.2
11.310.7
10.211.8
12.9
0.0 2.0 4.0 6.0 8.0 10.0 12.0 14.0 16.0 18.0
AustriaBelgiumBulgaria
CyprusCzech Republic
DenmarkEstoniaFinlandFrance
Germany Greece
HungaryIreland*
ItalyLatvia
LithuaniaLuxembourg
MaltaNetherlands
PolandPortugalRomaniaSlovakiaSlovenia
SpainSweden
United Kingdom
Live Births (per 1,000 Population)
Coun
try

Time Trends and Internat iona l Comparisons | 15
FERTILITY
The Total Period Fertility Rate (TPFR) for a given year indicates the number of children a woman could expect to have if the Age-Specific Fertility Rates (ASFR) for that year applied throughout her fertile years.10 The ASFR refers to the number of live births to women in a particular age group per 1,000 women. Figure 2.5 displays the trend in the TPFR in Ireland from 2002 to 2011.
• The Irish TPFR has increased overall from an average of 1.98 in 2002 to 2.03 in 2011.11
• The ASFRs show women aged 35 to 39 recorded an annual increase in fertility between 2002 and 2008 and reported a slight decrease between 2009 and 2011.
• Whilst women in the younger age groups (20 to 24 years) recorded decreasing rates up to 2005, these rates have shown a more consistent trend in recent years.
• In all years the 30 to 34 year age group recorded the highest ASFR.
• The ASFR for the 40 to 44 year age group was higher than that reported for the 15 to 19 year age group in 2011, a trend observed in greater proportions since 2005.
FIGURE 2.5 Age-Specific Fertility Rates (ASFRs) and Total Period Fertility Rates (TPFRs), Ireland, 2002–2011
Sources: Total period fertility rates (TPFRs) and age-specific fertility rates (ASFRs) are calculated using NPRS data from 2002 onwards. Female population estimates from 2002 onwards were obtained from the CSO Statistical Databases, date consulted December 2012. Female population estimates for 2011 were obtained from Census 2011. www.cso.ie/px/pxeirestat/Statire/SelectVarVal/Define.asp?maintable=PEA01&PLanguage=0 As these estimates are based on the revised population estimates published by the Central Statistics Office, based on Census 2011 results, the TPFRs and ASFRs for the period 2007-2010 previously reported have been adjusted accordingly.
10 See Appendix A, definitions for calculation of TPFR and ASFR. 11 The CSO estimates the TPFR at 2.04 for 2011. See Vital Statistics, Fourth Quarter and Yearly Summary 2011, July 2012. CSO
2011 data are provisional and are based on the number of births registered within the year as opposed to births occurring in the year.
0.00
0.50
1.00
1.50
2.00
2.50
0.0
20.0
40.0
60.0
80.0
100.0
120.0
140.0
160.0
2002 2003 2004 2005 2006 2007 2008 2009 2010 2011
Tota
l Per
iod
Fert
ility
Rat
e
Age
Spe
cific
Fer
tility
Rat
e (p
er 1
,000
Wom
en)
15-19 20-24 25-29 30-34 35-39 40-44 45-49 TPFR

16 | Perinata l Stat i st i cs Report 2011
The TPFR for Ireland is based on population data for 201112, and at 2.03 is below the level required for the long-term replacement of the population in the absence of any net inward migration (2.10). Figure 2.6 presents data on TPFRs for 2011 using data from Eurostat and the NPRS.
• Ireland had the highest TPFR in the 22 EU countries for which 2011 data were available.
• Sweden and Finland were just behind Ireland with a TPFR of 1.90 and 1.83 respectively, while Hungary (1.23) and Romania (1.25) recorded the lowest TPFR in 2011.
FIGURE 2.6 Total Period Fertility Rates for Selected EU Countries, 2011
Sources: 'Population and Social Conditions', Eurostat, Data Navigation Tree, date consulted December 2012. http://epp.eurostat.ec.europa.eu * Data for Ireland are based on NPRS data on live births. Female population estimates for 2011 were obtained from Census 2011. CSO Statistical Databases, date consulted December 2012. www.cso.ie/px/pxeirestat/Statire/SelectVarVal/Define.asp?maintable=PEA01&PLanguage=0 ** Total Period Fertility Rate for UK is based on 2010 data.
SINGLETON AND MULTIPLE BIRTHS
Table 2.3 shows the numbers of singleton and multiple births each year for the period 2002 to 2011.
• There were 71,651 singleton births, 2,638 twin births, 84 triplet births and 4 quadruplet births in 2011.13
• The twinning rate was 18.1 per 1,000 maternities in 2011, this represents an increase of 25.7 per cent over the decade.
12 Census 2011. Central Statistics Office, date consulted December 2012.
www.cso.ie/px/pxeirestat/Statire/SelectVarVal/Define.asp?maintable=PEA01&PLanguage=0 13 In accordance with the World Health Organization (WHO) guidelines, only births weighing 500 grams or more are included
in any analysis of NPRS data. In 2011, there were 71,703 singleton births, 2,655 twin births, 87 triplets and 4 quadruplets reported to the NPRS; of these 72 births weighed less than 500 grams (including 52 singleton births and 20 multiple births) and so were excluded from the analysis.
1.421.51
1.351.43
1.751.52
1.831.36
1.431.23
2.031.34
1.761.52
1.761.30
1.351.25
1.451.56
1.361.901.98
0.00 0.50 1.00 1.50 2.00 2.50
AustriaBulgaria
CyprusCzech Republic
DenmarkEstoniaFinland
Germany Greece
HungaryIreland*
LatviaLithuania
LuxembourgNetherlands
PolandPortugalRomaniaSlovakiaSlovenia
SpainSweden
United Kingdom**
Total Period Fertility Rate
Coun
try

Time Trends and Internat iona l Comparisons | 17
TABLE 2.3 Singleton and Multiple Births, 2002–2011
2002 2003 2004 2005 2006 2007 2008 2009 2010 2011 % Change
2002-2011
2010-2011
Singleton births 59,071 60,164 60,499 59,902 63,839 69,692 72,916 73,603 73,046 71,651 21.3 -1.9 Twin births 1,728 1,747 1,849 1,833 1,916 2,185 2,575 2,377 2,480 2,638 52.7 6.4 Triplet births 54 78 54 47 51 83 92 39 74 84 55.6 13.5 Quadruplet births 12 0 4 4 4 3 4 4 0 4 -66.7 - Twinning rate (per 1,000 maternities)
14.4 14.3 15.0 15.1 14.8 15.4 17.3 15.9 16.7 18.1 25.7 8.4
Notes: See Appendix A for details on calculation of twinning rate.
This table includes live births and stillbirths.
The numbers and rates of stillbirths and early neonatal deaths for singleton and multiple births between 2002 and 2011 is presented in Table 2.4.
• Higher mortality rates were observed for multiple births when compared to singleton births.
• The stillbirth mortality rate for singleton births has decreased over the decade from 5.4 in 2002 to 4.4 in 2006, to the 2011 rate of 3.9 per 1,000 live births and stillbirths.
• The early neonatal mortality rate for singleton births decreased to 1.8 per 1,000 live births in 2011 compared to a rate of 2.5 per 1,000 live births in 2002.
TABLE 2.4 Live Births, Stillbirths and Early Neonatal Deaths, Numbers and Rates, Singleton and Multiple Births, 2002–2011
2002 2003 2004 2005 2006 2007 2008 2009 2010 2011 % Change
Number of Births and Perinatal Deaths 2002-2011
2010-2011
Total Births 60,865 61,989 62,406 61,786 65,810 71,963 75,587 76,023 75,600 74,377 22.2 -1.6 Singleton 59,071 60,164 60,499 59,902 63,839 69,692 72,916 73,603 73,046 71,651 21.3 -1.9
Multiple 1,794 1,825 1,907 1,884 1,971 2,271 2,671 2,420 2,554 2,726 52.0 6.7 Live Births 60,522 61,632 62,067 61,480 65,502 71,570 75,229 75,651 75,245 74,080 22.4 -1.5
Singleton 58,752 59,837 60,186 59,621 63,555 69,318 72,582 75,247 72,709 71,375 21.5 -1.8 Multiple 1,770 1,795 1,881 1,859 1,947 2,252 2,647 2,404 2,536 2,705 52.8 6.7
Stillbirths 343 357 339 306 308 393 358 372 355 297 -13.4 -16.3 Singleton 319 327 313 281 284 374 334 356 337 276 -13.5 -18.1 Multiple 24 30 26 25 24 19 24 16 18 21 -12.5 16.7
Early Neonatal Deaths
170 177 168 139 152 132 159 155 161 153 -10.0 -5.0
Singleton 149 156 140 109 129 118 138 142 135 126 -15.4 -6.7 Multiple 21 21 28 30 23 14 21 13 26 27 28.6 3.8
Rates (per 1,000 births)* Stillbirths 5.6 5.8 5.4 5.0 4.7 5.5 4.7 4.9 4.7 4.0 -28.6 -14.9
Singleton 5.4 5.4 5.2 4.7 4.4 5.4 4.6 4.8 4.6 3.9 -27.8 -15.2 Multiple 13.4 16.4 13.6 13.3 12.2 8.4 9.0 6.6 7.0 7.7 -42.5 10.0
Early Neonatal Deaths
2.8 2.9 2.7 2.3 2.3 1.8 2.1 2.0 2.1 2.1 -25.0 0.0
Singleton 2.5 2.6 2.3 1.8 2.0 1.7 1.9 1.9 1.9 1.8 -28.0 -5.3 Multiple 11.9 11.7 14.9 16.1 11.8 6.2 7.9 5.4 10.3 10.0 -16.0 -2.9
Note: * For stillbirths, rates are calculated on total live births and stillbirths. For early neonatal deaths, rates are calculated on total live
births.

18 | Perinata l Stat i st i cs Report 2011
METHOD OF DELIVERY FOR PRIMIPAROUS14 AND MULTIPAROUS15 WOMEN
Table 2.5 outlines trends in the method of delivery for primiparous and multiparous women over the decade 2002 to 2011.
• Delivery by Caesarean section has increased for total maternities from 21.9 per cent in 2002 to 27.3 per cent in 2011.
• 28.6 per cent of primiparous women delivered by Caesarean section in 2011 compared to 23.8 per cent in 2002, with the rate of increase for Caesarean section delivery higher for multiparous women, increasing from 20.6 per cent in 2002 to 26.4 per cent in 2011 (see Figure 2.7).
• Spontaneous deliveries have fallen for total maternities from 63.0 per cent in 2002 to 56.6 per cent in 2011 with the rate of decrease higher for primiparous than multiparous women.
TABLE 2.5 Percentage Distribution of Maternities by Method of Delivery, Primiparous and Multiparous Women, 2002–2011
2002 2003 2004 2005 2006 2007 2008 2009 2010 2011 % Change 2002–
2011 2010-2011
Total Maternities Spontaneous 63.0 61.9 60.2 59.7 59.4 58.0 57.4 57.0 57.2 56.6 -10.2 -1.0 Breech/forceps 0.4 0.4 0.4 0.4 0.4 0.4 0.4 0.4 0.5 0.4 0.0 -20.0
Forceps 3.2 2.9 2.5 2.8 3.0 3.7 3.7 4.1 4.0 4.1 28.1 2.5
Vacuum extraction 11.2 11.0 12.0 11.7 12.2 12.2 12.6 12.2 11.9 11.5 2.7 -3.4
Caesarean section 21.9 23.6 24.6 25.3 24.8 25.5 25.9 26.2 26.3 27.3 24.7 3.8
Other specified & combined
0.3 0.2 0.3 0.1 0.2 0.2 0.1 0.1 0.0 0.0 -100.0 0.0
Total 100 100 100 100 100 100 100 100 100 100 Primiparous Spontaneous 49.6 47.8 45.4 45.0 45.6 44.1 43.5 42.7 42.7 41.2 -16.9 -3.5
Breech/forceps 0.5 0.6 0.5 0.6 0.6 0.6 0.5 0.5 0.7 0.6 20.0 -14.3
Forceps 6.2 5.7 5.1 5.6 5.8 7.2 7.2 8.2 8.0 8.6 38.7 7.5 Vacuum extraction 19.5 19.4 21.2 21.0 21.5 21.0 21.4 21.2 21.0 21.0 7.7 0.0
Caesarean section 23.8 26.3 27.7 27.7 26.3 27.1 27.3 27.3 27.6 28.6 20.2 3.6
Other specified & combined
0.2 0.2 0.2 0.1 0.2 0.1 0.0 0.0 0.0 0.0 -100.0 0.0
Total 100 100 100 100 100 100 100 100 100 100 Multiparous Spontaneous 72.2 71.5 70.1 69.5 69.1 68.0 67.6 67.4 67.5 66.8 -7.5 -1.0
Breech/forceps 0.3 0.3 0.3 0.2 0.3 0.3 0.3 0.3 0.4 0.3 0.0 -25.0
Forceps 1.1 1.0 0.8 0.9 1.0 1.2 1.1 1.1 1.2 1.1 0.0 -8.3
Vacuum extraction 5.5 5.3 5.9 5.5 5.7 5.8 6.0 5.7 5.4 5.2 -5.5 -3.7
Caesarean section 20.6 21.7 22.5 23.7 23.7 24.4 24.8 25.4 25.4 26.4 28.2 3.9
Other specified & combined
0.3 0.2 0.4 0.1 0.2 0.2 0.1 0.1 0.1 0.1 -66.7 0.0
Total 100 100 100 100 100 100 100 100 100 100
Note: Maternities with ‘not stated’ parity were excluded from the table.
14 Women who have had no previous pregnancy resulting in a live birth or stillbirth. 15 Women who have had at least one previous pregnancy resulting in a live birth or stillbirth.

Time Trends and Internat iona l Comparisons | 19
FIGURE 2.7 Percentage Distribution of Maternities Delivering by Caesarean Section for Total, Primiparous and Multiparous Women, 2002–2011
Note: See Table 2.5 for data
0.0
5.0
10.0
15.0
20.0
25.0
30.0
2002 2003 2004 2005 2006 2007 2008 2009 2010 2011
Perc
enta
ge o
f Tot
al M
ater
nitie
s (%
)
Total Maternities Primiparous Maternities Multiparous Maternities


SECTION THREE
GENERAL CHARACTERISTICS

22 | Perinata l Stat i st i cs Report 2011
INTRODUCTION
This section presents more detailed analyses of data reported to the NPRS for 2011 and some longitudinal comparisons.16 Unless otherwise stated the data presented in tables and figures in Section Three are based on data reported to the NPRS for 2011.
Data for a selection of variables are presented including:
• mother's age, marital status, occupation, nationality, parity, number of previous stillbirths, and interval since last birth;
• father's occupation and nationality; and
• infant's birthweight, gestational age, and month of birth.
For selected variables, the tables outline data for live births, stillbirths and early neonatal deaths, together with their corresponding rates, as well as presenting the number of maternities.
16 Data for 2007–2011 will be presented in this section. Previous reports in this series can be downloaded from
www.esri.ie/health_information/latest_hipe_nprs_reports/
Genera l Character i st ics | 23
MATERNAL AGE
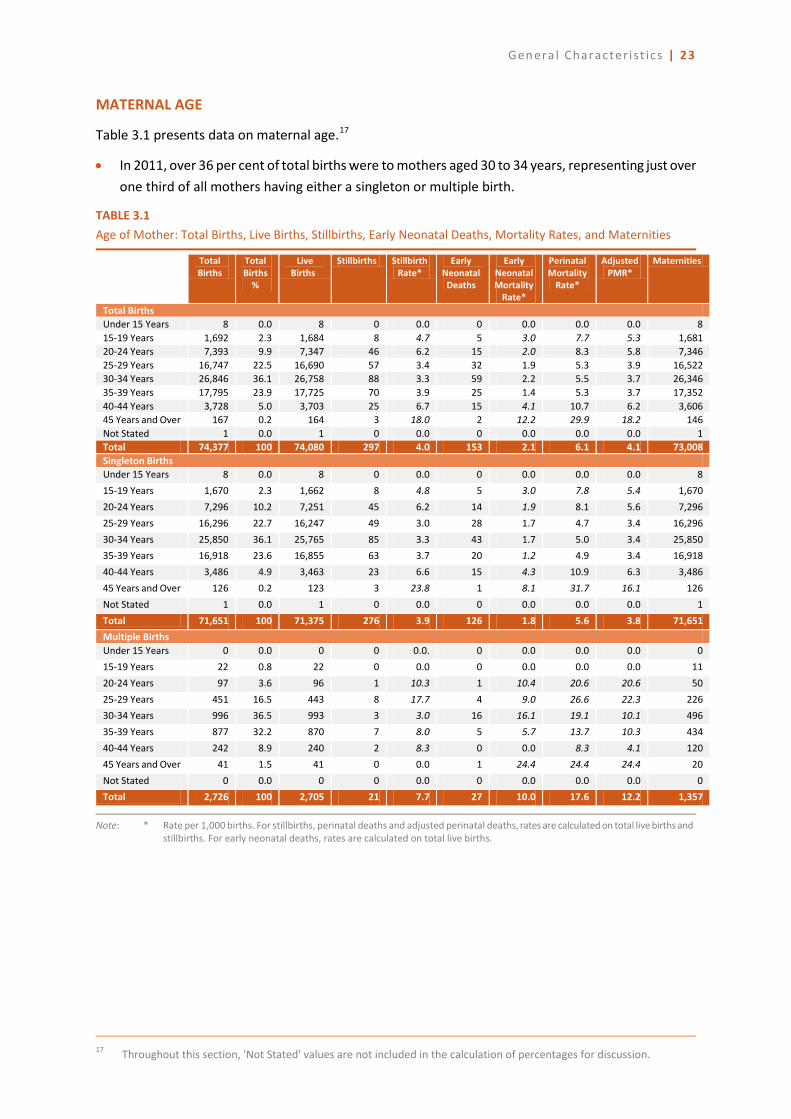
Table 3.1 presents data on maternal age.17
• In 2011, over 36 per cent of total births were to mothers aged 30 to 34 years, representing just over one third of all mothers having either a singleton or multiple birth.
TABLE 3.1 Age of Mother: Total Births, Live Births, Stillbirths, Early Neonatal Deaths, Mortality Rates, and Maternities
Total
Births Total Births
%
Live Births
Stillbirths Stillbirth Rate*
Early Neonatal
Deaths
Early Neonatal Mortality
Rate*
Perinatal Mortality
Rate*
Adjusted PMR*
Maternities
Total Births Under 15 Years 8 0.0 8 0 0.0 0 0.0 0.0 0.0 8 15-19 Years 1,692 2.3 1,684 8 4.7 5 3.0 7.7 5.3 1,681 20-24 Years 7,393 9.9 7,347 46 6.2 15 2.0 8.3 5.8 7,346 25-29 Years 16,747 22.5 16,690 57 3.4 32 1.9 5.3 3.9 16,522 30-34 Years 26,846 36.1 26,758 88 3.3 59 2.2 5.5 3.7 26,346 35-39 Years 17,795 23.9 17,725 70 3.9 25 1.4 5.3 3.7 17,352 40-44 Years 3,728 5.0 3,703 25 6.7 15 4.1 10.7 6.2 3,606 45 Years and Over 167 0.2 164 3 18.0 2 12.2 29.9 18.2 146 Not Stated 1 0.0 1 0 0.0 0 0.0 0.0 0.0 1 Total 74,377 100 74,080 297 4.0 153 2.1 6.1 4.1 73,008 Singleton Births Under 15 Years 8 0.0 8 0 0.0 0 0.0 0.0 0.0 8 15-19 Years 1,670 2.3 1,662 8 4.8 5 3.0 7.8 5.4 1,670 20-24 Years 7,296 10.2 7,251 45 6.2 14 1.9 8.1 5.6 7,296 25-29 Years 16,296 22.7 16,247 49 3.0 28 1.7 4.7 3.4 16,296 30-34 Years 25,850 36.1 25,765 85 3.3 43 1.7 5.0 3.4 25,850 35-39 Years 16,918 23.6 16,855 63 3.7 20 1.2 4.9 3.4 16,918 40-44 Years 3,486 4.9 3,463 23 6.6 15 4.3 10.9 6.3 3,486 45 Years and Over 126 0.2 123 3 23.8 1 8.1 31.7 16.1 126 Not Stated 1 0.0 1 0 0.0 0 0.0 0.0 0.0 1 Total 71,651 100 71,375 276 3.9 126 1.8 5.6 3.8 71,651 Multiple Births Under 15 Years 0 0.0 0 0 0.0. 0 0.0 0.0 0.0 0 15-19 Years 22 0.8 22 0 0.0 0 0.0 0.0 0.0 11 20-24 Years 97 3.6 96 1 10.3 1 10.4 20.6 20.6 50 25-29 Years 451 16.5 443 8 17.7 4 9.0 26.6 22.3 226 30-34 Years 996 36.5 993 3 3.0 16 16.1 19.1 10.1 496 35-39 Years 877 32.2 870 7 8.0 5 5.7 13.7 10.3 434 40-44 Years 242 8.9 240 2 8.3 0 0.0 8.3 4.1 120 45 Years and Over 41 1.5 41 0 0.0 1 24.4 24.4 24.4 20 Not Stated 0 0.0 0 0 0.0 0 0.0 0.0 0.0 0 Total 2,726 100 2,705 21 7.7 27 10.0 17.6 12.2 1,357
Note: * Rate per 1,000 births. For stillbirths, perinatal deaths and adjusted perinatal deaths, rates are calculated on total live births and
stillbirths. For early neonatal deaths, rates are calculated on total live births.
17 Throughout this section, 'Not Stated' values are not included in the calculation of percentages for discussion.

24 | Perinata l Stat i st i cs Report 2011
Figure 3.1 presents perinatal mortality rates.
• The perinatal mortality rate is highest for mothers aged less than 25 years, with a rate of 8.1 per 1,000 live births and stillbirths, whilst the lowest perinatal mortality rate was recorded for the 25 to 29 year age group (5.3 per 1,000 live births and stillbirths).
• At 5.9 per 1,000 live births and stillbirths the highest stillbirth rate was recorded for mothers aged less than 25 years, whilst the lowest stillbirth rate was recorded for the 30 to 34 year age group (3.3 per 1,000 live births and stillbirths).
• At 2.2 per 1,000 live births the highest early neonatal rate was recorded for mothers aged 30 to 34 years.
FIGURE 3.1 Age-Specific Stillbirth, Early Neonatal and Perinatal Mortality Rates, Total Births
Note: See Table 3.1 for data. Rates based on 20 or fewer observations are not included in this Figure.
0.0
1.0
2.0
3.0
4.0
5.0
6.0
7.0
8.0
9.0
<25 Years 25-29 Years 30-34 Years 35+ Years
Perin
atal
Mor
talit
y Ra
tes
Stillbirth Rate Early Neonatal Rate Perinatal Mortality Rate

Genera l Character i st ics | 25
MOTHER'S MARITAL STATUS
Table 3.2 presents data on mother's marital status.
• Close to two-thirds of births were to married women, and under one-third to single women.18
• Approximately 72 per cent of multiple births were to married women.
TABLE 3.2 Mother's Marital Status: Total Births, Live Births, Stillbirths, Early Neonatal Deaths, Mortality Rates, and Maternities
Total
Births Total Births
%
Live Births
Stillbirths Stillbirth Rate*
Early Neonatal Deaths
Early Neonatal Mortality
Rate*
Perinatal Mortality
Rate*
Adjusted PMR*
Maternities
Total Births Married 48,492 65.2 48,319 173 3.6 100 2.1 5.6 3.6 47,510 Single 24,667 33.2 24,553 114 4.6 51 2.1 6.7 5.0 24,306 Widowed 91 0.1 91 0 0.0 0 0.0 0.0 0.0 90 Separated 656 0.9 650 6 9.1 0 0.0 9.1 9.1 647 Divorced 407 0.5 403 4 9.8 0 0.0 9.8 7.4 396 Not Stated 64 0.1 64 0 0.0 2 31.3 31.3 0.0 59 Total 74,377 100 74,080 297 4.0 153 2.1 6.1 4.1 73,008 Singleton Births Married 46,538 65.0 46,379 159 3.4 78 1.7 5.1 3.3 46,538 Single 23,943 33.4 23,835 108 4.5 46 1.9 6.4 4.8 23,943 Widowed 89 0.1 89 0 0.0 0 0.0 0.0 0.0 89 Separated 641 0.9 635 6 9.4 0 0.0 9.4 9.4 641 Divorced 386 0.5 383 3 7.8 0 0.0 7.8 7.8 386 Not Stated 54 0.1 54 0 0.0 2 37.0 37.0 0.0 54 Total 71,651 100 71,375 276 3.9 126 1.8 5.6 3.8 71,651 Multiple Births Married 1,954 71.7 1,940 14 7.2 22 11.3 18.4 12.9 972 Single 724 26.6 718 6 8.3 5 7.0 15.2 11.1 363 Widowed 2 0.1 2 0 0.0 0 0.0 0.0 0.0 1 Separated 15 0.6 15 0 0.0 0 0.0 0.0 0.0 6 Divorced 21 0.8 20 1 47.6 0 0.0 47.6 0.0 10 Not Stated 10 0.4 10 0 0.0 0 0.0 0.0 0.0 5 Total 2,726 100 2,705 21 7.7 27 10.0 17.6 12.2 1,357
Note: * Rate per 1,000 births. For stillbirths, perinatal deaths and adjusted perinatal deaths, rates are calculated on total live births and
stillbirths. For early neonatal deaths, rates are calculated on total live births. Figures 3.2 and 3.3 present data on mother's marital status.
• The distribution of total births by mother's marital status has remained fairly consistent between 2007 and 2011 (see Figure 3.2).
• Figure 3.3 presents the distribution of births to single mothers by county of residence. In Dublin City over 40.3 per cent of births were to single mothers, compared to 27.0 per cent in Mayo (See Appendix E for details of county of residence classification).
18 Data recording marital status as 'never married' are classified as 'single' in discussion in this report.

26 | Perinata l Stat i st i cs Report 2011
FIGURE 3.2 Percentage of Births by Mother's Marital Status, Total Births, 2007–2011
Note: See Appendix G, Table G1 for data. 'Not Stated' values are not included in the calculation of percentages.
FIGURE 3.3 Percentage of Births to Single Mothers by Mother's County of Residence, Total Births
Notes: See Appendix G, Table G2 for data. 'Not Stated' values are not included in the calculation of percentages. Example: Of all births to mothers resident in Carlow, 36.0 per cent were to single mothers.
0.0
10.0
20.0
30.0
40.0
50.0
60.0
70.0
80.0
90.0
100.0
2007 2008 2009 2010 2011
Perc
enta
ge o
f Tot
al B
irths
(%)
Married Single Widowed Separated Divorced
Genera l Character i st ics | 27
OCCUPATION
MOTHER'S OCCUPATION
Table 3.3 presents data on mother's occupation.
• The highest proportions of total births were to mothers whose occupation was recorded as either 'intermediate non-manual workers' (20.9 per cent) or 'home duties' (20.7 per cent).
• Mothers classified as 'lower professional' accounted for 16.3 per cent of total births, while mothers in the 'other non-manual workers' category accounted for a further 13.6 per cent of total births.
• Where rates are calculated on more than 20 observations, the highest perinatal mortality rate of 10.9 per 1,000 live births and stillbirths was reported for 'unemployed' mothers.
• The lowest perinatal mortality rate was recorded for mothers with an occupation in the 'intermediate non-manual workers' category (4.4 per 1,000 live births and stillbirths), while a perinatal mortality rate of 5.0 per 1,000 live births and stillbirths was recorded for mothers in the 'lower professional' category (see Figure 3.4).19
19 For further discussion and analysis on this issue see Layte, R., and Clyne, B., Did the Celtic Tiger Decrease Socio-Economic
Differentials in Perinatal Mortality in Ireland?, The Economic and Social Review, Vol 41, No.2, June 2010.

28 | Perinata l Stat i st i cs Report 2011
TABLE 3.3 Mother's Occupation: Total Births, Live Births, Stillbirths, Early Neonatal Deaths, Mortality Rates, and Maternities
Total
Births Total Births
%
Live Births
Stillbirths Stillbirth Rate*
Early Neonatal Deaths
Early Neonatal Mortality
Rate*
Perinatal Mortality
Rate*
Adjusted PMR*
Maternities
Total Births Farmers & Farm Managers
62 0.1 62 0 0.0 0 0.0 0.0 0.0 60
Other Agricultural Occupations & Fishermen
69 0.1 69 0 0.0 0 0.0 0.0 0.0 69
Higher Professional 5,018 6.7 5,000 18 3.6 10 2.0 5.6 3.2 4,900 Lower Professional 12,078 16.2 12,039 39 3.2 21 1.7 5.0 3.6 11,836 Employers & Managers 5,437 7.3 5,421 16 2.9 15 2.8 5.7 3.3 5,301 Salaried Employees 1,006 1.4 1,006 0 0.0 3 3.0 3.0 3.0 986 Intermediate Non-Manual Workers
15,481 20.8 15,435 46 3.0 22 1.4 4.4 3.1 15,182
Other Non-Manual Workers
10,107 13.6 10,056 51 5.0 18 1.8 6.8 4.8 9,952
Skilled Manual Workers 1,152 1.5 1,145 7 6.1 0 0.0 6.1 5.2 1,130 Semi-Skilled Manual Workers
2,318 3.1 2,309 9 3.9 5 2.2 6.0 4.3 2,278
Unskilled Manual Workers
9 0.0 9 0 0.0 0 0.0 0.0 0.0 9
Unemployed 3,118 4.2 3,089 29 9.3 5 1.6 10.9 7.7 3,082 Not Classifiable 2,890 3.9 2,870 20 6.9 8 2.8 9.7 7.3 2,854 Home Duties 15,316 20.6 15,258 58 3.8 45 2.9 6.7 4.4 15,056 Not Stated 316 0.4 312 4 12.7 1 3.2 15.8 12.7 313 Total 74,377 100 74,080 297 4.0 153 2.1 6.1 4.1 73,008 Singleton Births Farmers & Farm Managers
58 0.1 58 0 0.0 0 0.0 0.0 0.0 58
Other Agricultural Occupations & Fishermen
69 0.1 69 0 0.0 0 0.0 0.0 0.0 69
Higher Professional 4,784 6.7 4,769 15 3.1 7 1.5 4.6 2.7 4,784 Lower Professional 11,593 16.2 11,557 36 3.1 16 1.4 4.5 3.1 11,593 Employers & Managers 5,167 7.2 5,153 14 2.7 11 2.1 4.8 2.9 5,167 Salaried Employees 965 1.3 965 0 0.0 3 3.1 3.1 3.1 965 Intermediate Non-Manual Workers
14,892 20.8 14,852 40 2.7 18 1.2 3.9 2.8 14,892
Other Non-Manual Workers
9,796 13.7 9,748 48 4.9 16 1.6 6.5 4.8 9,796
Skilled Manual Workers 1,106 1.5 1,099 7 6.3 0 0.0 6.3 5.4 1,106 Semi-Skilled Manual Workers
2,237 3.1 2,228 9 4.0 4 1.8 5.8 4.0 2,237
Unskilled Manual Workers
9 0.0 9 0 0.0 0 0.0 0.0 0.0 9
Unemployed 3,047 4.3 3,020 27 8.9 5 1.7 10.5 7.2 3,047 Not Classifiable 2,817 3.9 2,797 20 7.1 8 2.9 9.9 7.5 2,817 Home Duties 14,801 20.7 14,745 56 3.8 37 2.5 6.3 3.9 14,801 Not Stated 310 0.4 306 4 12.9 1 3.3 16.1 12.9 310 Total 71,651 100 71,375 276 3.9 126 1.8 5.6 3.8 71,651 Multiple Births Farmers & Farm Managers
4 0.1 4 0 0.0 0 0.0 0.0 0.0 2
Other Agricultural Occupations & Fishermen
0 0.0 0 0 0.0 0 0.0 0.0 0.0 0
Higher Professional 234 8.6 231 3 12.8 3 13.0 25.6 13.0 116 Lower Professional 485 17.8 482 3 6.2 5 10.4 16.5 14.5 243 Employers & Managers 270 9.9 268 2 7.4 4 14.9 22.2 11.2 134 Salaried Employees 41 1.5 41 0 0.0 0 0.0 0.0 0.0 21 Intermediate Non-Manual Workers
589 21.6 583 6 10.2 4 6.9 17.0 11.9 290
Other Non-Manual Workers
311 11.4 308 3 9.6 2 6.5 16.1 3.3 156
Skilled Manual Workers 46 1.7 46 0 0.0 0 0.0 0.0 0.0 24 Semi-Skilled Manual Workers
81 3.0 81 0 0.0 1 12.3 12.3 12.3 41
Unskilled Manual Workers
0 0.0 0 0 0.0 0 0.0 0.0 0.0 0
Unemployed 71 2.6 69 2 28.2 0 0.0 28.2 28.2 35 Not Classifiable 73 2.7 73 0 0.0 0 0.0 0.0 0.0 37 Home Duties 515 18.9 513 2 3.9 8 15.6 19.4 17.5 255 Not Stated 6 0.2 6 0 0.0 0 0.0 0.0 0.0 3 Total 2,726 100 2,705 21 7.7 27 10.0 17.6 12.2 1,357
Notes: * Rate per 1,000 births. For stillbirths, perinatal deaths and adjusted perinatal deaths, rates are calculated on total live births and
stillbirths. For early neonatal deaths, rates are calculated on total live births. See Appendix C for a description of the classification system for occupation.

Genera l Character i st ics | 29
FIGURE 3.4 Perinatal Mortality Rates by Mother's Occupation, Total Births
Note: See Table 3.3 for data. Rates based on 20 or fewer observations are not included in this Figure.
FATHER'S OCCUPATION
Father’s details are only required for registration purposes where mother's marital status is recorded as 'married'. As a result, the proportion of records for which information is available is not complete and a category of 'not applicable' is required. This category is combined with 'not stated' for the purposes of presenting data on father's occupation in this report. With respect to availability and access to father’s details, data quality measures are ongoing with hospital staff in an effort to improve completeness of returns for the details of all fathers. Table 3.4 presents data on father's occupation. • Excluding 'not stated/not applicable', over 25 per cent of all births were to fathers whose occupation
was recorded as 'skilled manual workers'.
• Fathers recorded as 'other non-manual workers' accounted for 12.6 per cent of total births.
• Where rates are calculated on more than 20 observations, the occupations recording the highest perinatal mortality rates were 'unemployed' which recorded a perinatal mortality rate of 8.2 per 1,000 live births and stillbirths, and 'other non-manual workers' which recorded a perinatal mortality rate of 7.8 per 1,000 live births and stillbirths (see Figure 3.5).
• The lowest perinatal mortality rates were recorded for 'employers and managers' at 3.9 per 1,000 live births and stillbirths and 'higher professional' at 4.7 per 1,000 live births and stillbirths.
0.0 1.0 2.0 3.0 4.0 5.0 6.0 7.0 8.0 9.0 10.0 11.0 12.0
Home Duties
Unemployed
Other Non-Manual Workers
Intermediate Non-Manual Workers
Lower Professional
Perinatal Mortality Rates (per 1,000 Live Births and Stillbirths)
Mot
her's
Occ
upat
ion
Perinatal Mortality Rate Adjusted PMR

30 | Perinata l Stat i st i cs Report 2011
TABLE 3.4 Father's Occupation: Total Births, Live Births, Stillbirths, Early Neonatal Deaths, Mortality Rates, and Maternities
Total
Births Total Births
%
Live Births
Stillbirths Stillbirth Rate*
Early Neonatal Deaths
Early Neonatal Mortality
Rate*
Perinatal Mortality
Rate*
Adjusted PMR*
Maternities
Total Births Farmers & Farm Managers 2,130 2.9 2,121 9 4.2 6 2.8 7.0 2.8 2,081 Other Agricultural Occupations & Fishermen
616 0.8 614 2 3.2 1 1.6 4.9 4.9 605
Higher Professional 5,288 7.1 5,270 18 3.4 7 1.3 4.7 3.2 5,165 Lower Professional 4,266 5.7 4,252 14 3.3 12 2.8 6.1 4.2 4,189 Employers & Managers 5,412 7.3 5,401 11 2.0 10 1.9 3.9 2.8 5,290 Salaried Employees 1,300 1.7 1,297 3 2.3 5 3.9 6.2 3.9 1,278 Intermediate Non-Manual Workers
6,354 8.5 6,330 24 3.8 11 1.7 5.5 3.2 6,219
Other Non-Manual Workers 7,168 9.6 7,133 35 4.9 21 2.9 7.8 5.6 7,038 Skilled Manual Workers 14,464 19.4 14,421 43 3.0 30 2.1 5.0 3.5 14,214 Semi-Skilled Manual Workers
3,507 4.7 3,497 10 2.9 3 0.9 3.7 2.9 3,463
Unskilled Manual Workers 434 0.6 433 1 2.3 1 2.3 4.6 2.3 430 Unemployed 3,801 5.1 3,776 25 6.6 6 1.6 8.2 4.5 3,737 Not Classifiable 1,843 2.5 1,834 9 4.9 2 1.1 6.0 4.9 1,803 Home Duties 126 0.2 126 0 0.0 0 0.0 0.0 0.0 125 Not Stated/Not Applicable 17,668 23.8 17,575 93 5.3 38 2.2 7.4 5.4 17,371 Total 74,377 100 74,080 297 4.0 153 2.1 6.1 4.1 73,008 Singleton Births Farmers & Farm Managers 2,032 2.8 2,023 9 4.4 4 2.0 6.4 3.0 2,032 Other Agricultural Occupations & Fishermen
592 0.8 590 2 3.4 0 0.0 3.4 3.4 592
Higher Professional 5,043 7.0 5,029 14 2.8 7 1.4 4.2 3.2 5,043 Lower Professional 4,113 5.7 4,099 14 3.4 7 1.7 5.1 3.4 4,113 Employers & Managers 5,172 7.2 5,163 9 1.7 9 1.7 3.5 2.5 5,172 Salaried Employees 1,256 1.8 1,253 3 2.4 3 2.4 4.8 2.4 1,256 Intermediate Non-Manual Workers
6,089 8.5 6,068 21 3.4 11 1.8 5.3 3.0 6,089
Other Non-Manual Workers 6,911 9.6 6,881 30 4.3 19 2.8 7.1 4.9 6,911 Skilled Manual Workers 13,960 19.5 13,918 42 3.0 23 1.7 4.7 3.3 13,960 Semi-Skilled Manual Workers
3,419 4.8 3,409 10 2.9 2 0.6 3.5 2.6 3,419
Unskilled Manual Workers 426 0.6 425 1 2.3 0 0.0 2.3 2.3 426 Unemployed 3,674 5.1 3,650 24 6.5 6 1.6 8.2 4.4 3,674 Not Classifiable 1,763 2.5 1,754 9 5.1 2 1.1 6.2 5.1 1,763 Home Duties 124 0.2 124 0 0.0 0 0.0 0.0 0.0 124 Not Stated/Not Applicable 17,077 23.8 16,989 88 5.2 33 1.9 7.1 5.2 17,077 Total 71,651 100 71,375 276 3.9 126 1.8 5.6 3.8 71,651 Multiple Births Farmers & Farm Managers 98 3.6 98 0 0.0 2 20.4 20.4 0.0 49 Other Agricultural Occupations & Fishermen
24 0.9 24 0 0.0 1 41.7 41.7 41.7 13
Higher Professional 245 9.0 241 4 16.3 0 0.0 16.3 4.1 122 Lower Professional 153 5.6 153 0 0.0 5 32.7 32.7 26.3 76 Employers & Managers 240 8.8 238 2 8.3 1 4.2 12.5 8.4 118 Salaried Employees 44 1.6 44 0 0.0 2 45.5 45.5 45.5 22 Intermediate Non-Manual Workers
265 9.7 262 3 11.3 0 0.0 11.3 7.6 130
Other Non-Manual Workers 257 9.4 252 5 19.5 2 7.9 27.2 23.4 127 Skilled Manual Workers 504 18.5 503 1 2.0 7 13.9 15.9 10.0 254 Semi -Skilled Manual Workers
88 3.2 88 0 0.0 1 11.4 11.4 11.4 44
Unskilled Manual Workers 8 0.3 8 0 0.0 1 125.0 125.0 0.0 4 Unemployed 127 4.7 126 1 7.9 0 0.0 7.9 7.9 63 Not Classifiable 80 2.9 80 0 0.0 0 0.0 0.0 0.0 40 Home Duties 2 0.1 2 0 0.0 0 0.0 0.0 0.0 1 Not Stated/Not Applicable 591 21.7 586 5 8.5 5 8.5 16.9 13.6 294 Total 2,726 100 2,705 21 7.7 27 10.0 17.6 12.2 1,357
Notes: * Rate per 1,000 births. For stillbirths, perinatal deaths and adjusted perinatal deaths, rates are calculated on total live births and
stillbirths. For early neonatal deaths, rates are calculated on total live births. See Appendix C for a description of the classification system for occupation.
From 2010 the categories 'Not Stated' and 'Not Applicable' have been combined into the category 'Not Stated/ Not Applicable'. In previous Perinatal Statistics Reports these were reported as individual categories.

Genera l Character i st ics | 31
FIGURE 3.5 Perinatal Mortality Rate by Father's Occupation, Total Births
Notes: See Table 3.4 for data. Rates based on 20 or fewer observations are not included in this Figure. Adjusted Perinatal Mortality Rates are not presented due to small numbers associated with the majority of categories.
0.0 1.0 2.0 3.0 4.0 5.0 6.0 7.0 8.0 9.0
Higher Professional
Lower Professional
Employers & Managers
Intermediate Non-Manual Workers
Other Non-Manual Workers
Skilled Manual Workers
Unemployed
Perinatal Mortality Rate (per 1,000 Live Births and Stillbirths)
Fath
er's
Occ
upat
ion

32 | Perinata l Stat i st i cs Report 2011
NATIONALITY
MOTHER'S NATIONALITY
Mother's nationality relates to 'place of birth' of the mother. Table 3.5 presents data on mother's nationality.
• After births to mothers from Ireland, the next highest proportion of total births were to mothers from the EU15 to EU27 at 11.6 per cent, followed by mothers from Asia at 4.0 per cent.
• Where rates are calculated on more than 20 observations, the highest perinatal mortality rate was recorded for babies born to mothers from Africa (13.9 per 1,000 live births and stillbirths) and the lowest perinatal mortality rates were reported for babies born to mothers from EU15 to EU27 at 4.9 per 1,000 live births and stillbirths.
Over the period 2007 to 2011 the proportion of births to Irish mothers fell from 79.3 per cent to 76.2 per cent. Figure 3.6 presents the distribution of births by nationality for non-Irish born mothers between 2007 and 2011.
• The proportion of total births to mothers from Africa decreased from 3.6 per cent in 2007 to 2.6 per cent in 2011.
Figure 3.7 presents the average age of mother by mother's nationality for 2011.
• The average age of all mothers giving birth was 31.7 years and the average age of mothers from Ireland was slightly higher at 32.1 years.
• Mothers giving birth from the EU15 to EU27 were on average younger at 29.1 years, whilst mothers from Australia and the EU15 (excluding Ireland and United Kingdom) recorded the highest average maternal age at 34.3 years and 33.3 years respectively.

Genera l Character i st ics | 33
TABLE 3.5 Mother's Nationality: Total Births, Live Births, Stillbirths, Early Neonatal Deaths, Mortality Rates, and Maternities
Total
Births Total Births
%
Live Births
Stillbirths Stillbirth Rate*
Early Neonatal Deaths
Early Neonatal Mortality
Rate*
Perinatal Mortality
Rate*
Adjusted PMR*
Maternities
Total Births Ireland 56,605 76.1 56,377 228 4.0 118 2.1 6.1 4.1 55,515 UK 1,695 2.3 1,689 6 3.5 5 3.0 6.5 5.3 1,665 EU15 (excluding Ireland & UK)
1,078 1.4 1,077 1 0.9 0 0.0 0.9 0.9 1,060
EU15 to EU27 8,609 11.6 8,578 31 3.6 11 1.3 4.9 3.4 8,483 Rest of Europe 603 0.8 603 0 0.0 0 0.0 0.0 0.0 590 Africa 1,938 2.6 1,921 17 8.8 10 5.2 13.9 10.4 1,895 Asia 2,956 4.0 2,947 9 3.0 5 1.7 4.7 3.7 2,925 America 617 0.8 616 1 1.6 3 4.9 6.5 6.5 604 Australia 105 0.1 104 1 9.5 0 0.0 9.5 9.5 104 New Zealand and Other Oceania
43 0.1 43 0 0.0 0 0.0 0.0 0.0 43
Multi Nationality 2 0.0 2 0 0.0 0 0.0 0.0 0.0 1 Other Nationality 2 0.0 2 0 0.0 0 0.0 0.0 0.0 2 Not Stated 124 0.2 121 3 24.2 1 8.3 32.3 24.4 121 Total 74,377 100 74,080 297 4.0 153 2.1 6.1 4.1 73,008 Singleton Births Ireland 54,438 76.0 54,226 212 3.9 95 1.8 5.6 3.8 54,438 UK 1,634 2.3 1,628 6 3.7 5 3.1 6.7 5.5 1,634 EU15 (excluding Ireland & UK)
1,042 1.5 1,042 0 0.0 0 0.0 0.0 0.0 1,042
EU15 to EU27 8,356 11.7 8,327 29 3.5 8 1.0 4.4 3.0 8,356 Rest of Europe 577 0.8 577 0 0.0 0 0.0 0.0 0.0 577 Africa 1,855 2.6 1,838 17 9.2 9 4.9 14.0 10.3 1,855 Asia 2,892 4.0 2,885 7 2.4 5 1.7 4.1 3.1 2,892 America 591 0.8 590 1 1.7 3 5.1 6.8 6.8 591 Australia 103 0.1 102 1 9.7 0 0.0 9.7 9.7 103 New Zealand and Other Oceania
43 0.1 43 0 0.0 0 0.0 0.0 0.0 43
Multi Nationality 0 0.0 0 0 0.0 0 0.0 0.0 0.0 0 Other Nationality 2 0.0 2 0 0.0 0 0.0 0.0 0.0 2 Not Stated 118 0.2 115 3 25.4 1 8.7 33.9 25.6 118 Total 71,651 100 71,375 276 3.9 126 1.8 5.6 3.8 71,651 Multiple Births Ireland 2,167 79.5 2,151 16 7.4 23 10.7 18.0 11.6 1,077 UK 61 2.2 61 0 0.0 0 0.0 0.0 0.0 31 EU15 (excluding Ireland & UK)
36 1.3 35 1 27.8 0 0.0 27.8 27.8 18
EU15 to EU27 253 9.3 251 2 7.9 3 12.0 19.8 15.9 127 Rest of Europe 26 1.0 26 0 0.0 0 0.0 0.0 0.0 13 Africa 83 3.0 83 0 0.0 1 12.0 12.0 12.0 40 Asia 64 2.3 62 2 31.3 0 0.0 31.3 31.3 33 America 26 1.0 26 0 0.0 0 0.0 0.0 0.0 13 Australia 2 0.1 2 0 0.0 0 0.0 0.0 0.0 1 New Zealand and Other Oceania
0 0.0 0 0 0.0 0 0.0 0.0 0.0 0
Multi Nationality 2 0.1 2 0 0.0 0 0.0 0.0 0.0 1 Other Nationality 0 0.0 0 0 0.0 0 0.0 0.0 0.0 0 Not Stated 6 0.2 6 0 0.0 0 0.0 0.0 0.0 3 Total 2,726 100 2,705 21 7.7 27 10.0 17.6 12.2 1,357
Notes: * Rate per 1,000 births. For stillbirths, perinatal deaths and adjusted perinatal deaths, rates are calculated on total live births and
stillbirths. For early neonatal deaths, rates are calculated on total live births. See Appendix F for a description of the classification system for nationality.

34 | Perinata l Stat i st i cs Report 2011
FIGURE 3.6 Percentage Distribution of Births by Nationality for Non-Irish Born Mothers, Total Births, 2007–2011*
Notes: See Appendix G, Table G3 for data. 'Not Stated' values are not included in the calculation of percentages. Percentages calculated for the four most frequent nationalities for Non-Irish born mothers in 2011. *Mothers from the United Kingdom, EU 15-27, Africa, and Asia accounted for 20.5 per cent of total births in 2011.
FIGURE 3.7 Average Age of Mother by Mother's Nationality, Total Maternities
Notes: See Appendix G, Table G4 for data. Average ages calculated for nationalities with greater than 100 births.
0.0
2.0
4.0
6.0
8.0
10.0
12.0
2007 2008 2009 2010 2011
Perc
enta
ge o
f Tot
al B
irths
(%)
UK EU 15 to EU27 Africa Asia
26.0
27.0
28.0
29.0
30.0
31.0
32.0
33.0
34.0
35.0
Ireland UK EU15 (excluding Ireland &
UK)
EU15 to EU27
Rest of Europe
Africa Asia America Australia
Mot
her's
Ave
rage
Age
(Yea
rs)
Mother's Nationality
Average Maternal Age = 31.7 Years
Genera l Character i st ics | 35
FATHER'S NATIONALITY
Father's nationality relates to 'place of birth' of the father. Father’s details are only required for registration purposes where mother's marital status is recorded as 'married'. As a result, the proportion of records for which information is available is not complete and a category of 'not applicable' is required. This category is combined with 'not stated' for the purposes of presenting data on father's nationality in this report.
Table 3.6 presents information on father's nationality
• Births are excluded where father's details are not available and are, therefore, classified as 'not stated/not applicable'. Irish fathers accounted for 77.0 per cent of total births.
• Births to fathers from the EU15 to EU27 accounted for 10.1 per cent of total births.
Between 2007 and 2011
• The proportion of total births to fathers from Asia was 4.2 per cent in 2011 compared to 3.7 per cent in 2007.
• Births to fathers from Africa were 2.7 per cent of total births in 2011 compared to 3.9 per cent of total births in 2007.
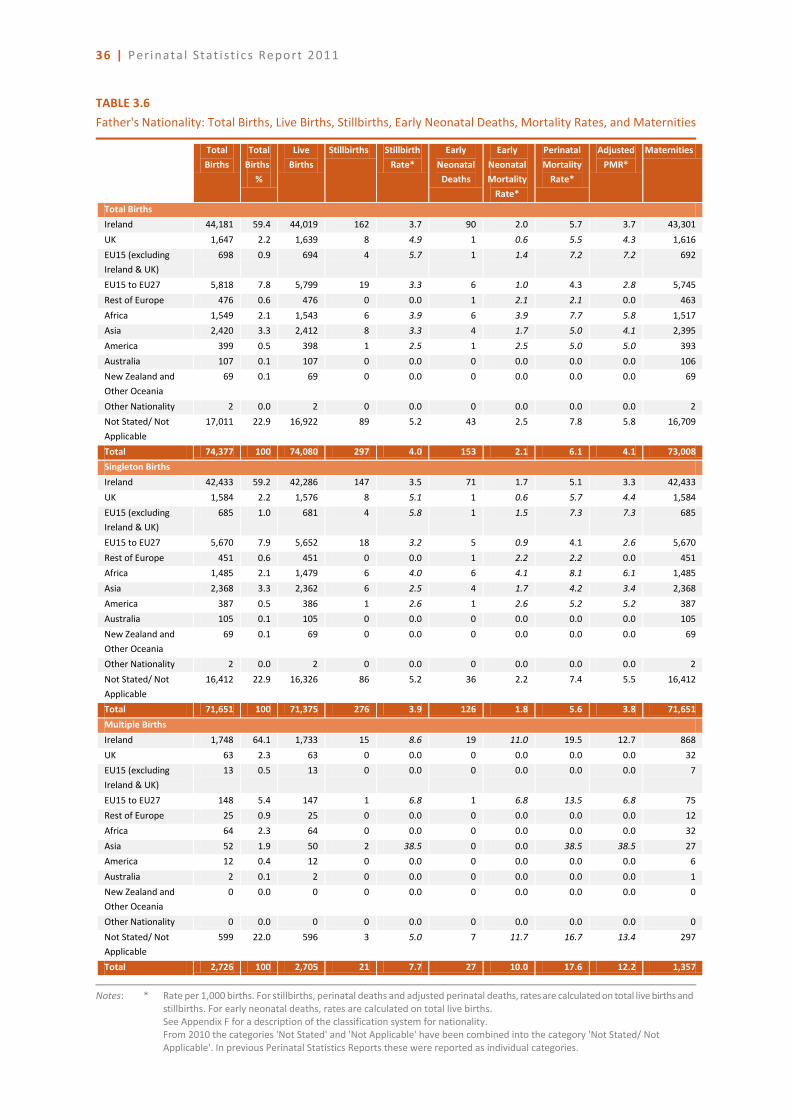
36 | Perinata l Stat i st i cs Report 2011
TABLE 3.6 Father's Nationality: Total Births, Live Births, Stillbirths, Early Neonatal Deaths, Mortality Rates, and Maternities
Total
Births Total
Births %
Live Births
Stillbirths Stillbirth Rate*
Early Neonatal
Deaths
Early Neonatal Mortality
Rate*
Perinatal Mortality
Rate*
Adjusted PMR*
Maternities
Total Births Ireland 44,181 59.4 44,019 162 3.7 90 2.0 5.7 3.7 43,301 UK 1,647 2.2 1,639 8 4.9 1 0.6 5.5 4.3 1,616 EU15 (excluding Ireland & UK)
698 0.9 694 4 5.7 1 1.4 7.2 7.2 692
EU15 to EU27 5,818 7.8 5,799 19 3.3 6 1.0 4.3 2.8 5,745 Rest of Europe 476 0.6 476 0 0.0 1 2.1 2.1 0.0 463 Africa 1,549 2.1 1,543 6 3.9 6 3.9 7.7 5.8 1,517 Asia 2,420 3.3 2,412 8 3.3 4 1.7 5.0 4.1 2,395 America 399 0.5 398 1 2.5 1 2.5 5.0 5.0 393 Australia 107 0.1 107 0 0.0 0 0.0 0.0 0.0 106 New Zealand and Other Oceania
69 0.1 69 0 0.0 0 0.0 0.0 0.0 69
Other Nationality 2 0.0 2 0 0.0 0 0.0 0.0 0.0 2 Not Stated/ Not Applicable
17,011 22.9 16,922 89 5.2 43 2.5 7.8 5.8 16,709
Total 74,377 100 74,080 297 4.0 153 2.1 6.1 4.1 73,008 Singleton Births Ireland 42,433 59.2 42,286 147 3.5 71 1.7 5.1 3.3 42,433 UK 1,584 2.2 1,576 8 5.1 1 0.6 5.7 4.4 1,584 EU15 (excluding Ireland & UK)
685 1.0 681 4 5.8 1 1.5 7.3 7.3 685
EU15 to EU27 5,670 7.9 5,652 18 3.2 5 0.9 4.1 2.6 5,670 Rest of Europe 451 0.6 451 0 0.0 1 2.2 2.2 0.0 451 Africa 1,485 2.1 1,479 6 4.0 6 4.1 8.1 6.1 1,485 Asia 2,368 3.3 2,362 6 2.5 4 1.7 4.2 3.4 2,368 America 387 0.5 386 1 2.6 1 2.6 5.2 5.2 387 Australia 105 0.1 105 0 0.0 0 0.0 0.0 0.0 105 New Zealand and Other Oceania
69 0.1 69 0 0.0 0 0.0 0.0 0.0 69
Other Nationality 2 0.0 2 0 0.0 0 0.0 0.0 0.0 2 Not Stated/ Not Applicable
16,412 22.9 16,326 86 5.2 36 2.2 7.4 5.5 16,412
Total 71,651 100 71,375 276 3.9 126 1.8 5.6 3.8 71,651 Multiple Births Ireland 1,748 64.1 1,733 15 8.6 19 11.0 19.5 12.7 868 UK 63 2.3 63 0 0.0 0 0.0 0.0 0.0 32 EU15 (excluding Ireland & UK)
13 0.5 13 0 0.0 0 0.0 0.0 0.0 7
EU15 to EU27 148 5.4 147 1 6.8 1 6.8 13.5 6.8 75 Rest of Europe 25 0.9 25 0 0.0 0 0.0 0.0 0.0 12 Africa 64 2.3 64 0 0.0 0 0.0 0.0 0.0 32 Asia 52 1.9 50 2 38.5 0 0.0 38.5 38.5 27 America 12 0.4 12 0 0.0 0 0.0 0.0 0.0 6 Australia 2 0.1 2 0 0.0 0 0.0 0.0 0.0 1 New Zealand and Other Oceania
0 0.0 0 0 0.0 0 0.0 0.0 0.0 0
Other Nationality 0 0.0 0 0 0.0 0 0.0 0.0 0.0 0 Not Stated/ Not Applicable
599 22.0 596 3 5.0 7 11.7 16.7 13.4 297
Total 2,726 100 2,705 21 7.7 27 10.0 17.6 12.2 1,357
Notes: * Rate per 1,000 births. For stillbirths, perinatal deaths and adjusted perinatal deaths, rates are calculated on total live births and
stillbirths. For early neonatal deaths, rates are calculated on total live births. See Appendix F for a description of the classification system for nationality.
From 2010 the categories 'Not Stated' and 'Not Applicable' have been combined into the category 'Not Stated/ Not Applicable'. In previous Perinatal Statistics Reports these were reported as individual categories.

Genera l Character i st ics | 37
MATERNAL PARITY
Maternal parity is a mother's total number of previous live births and stillbirths. Table 3.7 presents data on maternal parity.
• Primiparous mothers accounted for 39.9 per cent of all maternities, with 60.1 per cent of maternities having one or more previous live births or stillbirths.
• Of mothers aged less than 20 years, 89.2 per cent gave birth for the first time, with only 9.6 per cent delivering for the second time and 1.2 per cent delivering a third time or more (see Figure 3.8).
• For women aged 30 to 34 years, 38.4 per cent gave birth for the first time and 37.2 per cent delivered for the second time.
TABLE 3.7 Maternal Parity: Total Births, Live Births, Stillbirths, Early Neonatal Deaths, Mortality Rates, and Maternities
Total
Births Total Births
%
Live Births
Stillbirths Stillbirth Rate*
Early Neonatal Deaths
Early Neonatal Mortality
Rate*
Perinatal Mortality
Rate*
Adjusted PMR*
Maternities
Total Births 0 29,774 40.0 29,632 142 4.8 64 2.2 6.9 5.1 29,135 1 25,174 33.8 25,103 71 2.8 45 1.8 4.6 3.1 24,745 2 12,636 17.0 12,591 45 3.6 27 2.1 5.7 3.3 12,446 3 4,411 5.9 4,384 27 6.1 14 3.2 9.3 5.7 4,345 4 1,446 1.9 1,441 5 3.5 1 0.7 4.1 4.1 1,419 5 534 0.7 532 2 3.7 0 0.0 3.7 3.7 525 6 199 0.3 196 3 15.1 0 0.0 15.1 15.1 191 More than 6 199 0.3 198 1 5.0 1 5.1 10.1 0.0 198 Not Stated 4 0.0 3 1 250.0 1 333.3 500.0 333.3 4 Total 74,377 100 74,080 297 4.0 153 2.1 6.1 4.1 73,008 Singleton Births 0 28,501 39.8 28,371 130 4.6 45 1.6 6.1 4.6 28,501 1 24,319 33.9 24,252 67 2.8 40 1.6 4.4 3.0 24,319 2 12,255 17.1 12,215 40 3.3 26 2.1 5.4 2.9 12,255 3 4,281 6.0 4,254 27 6.3 12 2.8 9.1 5.6 4,281 4 1,394 1.9 1,389 5 3.6 1 0.7 4.3 4.3 1,394 5 516 0.7 514 2 3.9 0 0.0 3.9 3.9 516 6 184 0.3 181 3 16.3 0 0.0 16.3 16.3 184 More than 6 197 0.3 196 1 5.1 1 5.1 10.2 0.0 197 Not Stated 4 0.0 3 1 250.0 1 333.3 500.0 333.3 4 Total 71,651 100 71,375 276 3.9 126 1.8 5.6 3.8 71,651 Multiple Births 0 1,273 46.7 1,261 12 9.4 19 15.1 24.4 16.6 634 1 855 31.4 851 4 4.7 5 5.9 10.5 5.9 426 2 381 14.0 376 5 13.1 1 2.7 15.7 15.7 191 3 130 4.8 130 0 0.0 2 15.4 15.4 7.8 64 4 52 1.9 52 0 0.0 0 0.0 0.0 0.0 25 5 18 0.7 18 0 0.0 0 0.0 0.0 0.0 9 6 15 0.6 15 0 0.0 0 0.0 0.0 0.0 7 More than 6 2 0.1 2 0 0.0 0 0.0 0.0 0.0 1 Not Stated 0 0.0 0 0 0.0 0 0.0 0.0 0.0 0 Total 2,726 100 2,705 21 7.7 27 10.0 17.6 12.2 1,357
Note: * Rate per 1,000 births. For stillbirths, perinatal deaths and adjusted perinatal deaths, rates are calculated on total live births and
stillbirths. For early neonatal deaths, rates are calculated on total live births.

38 | Perinata l Stat i st i cs Report 2011
FIGURE 3.8 Parity by Age of Mother, Total Maternities
Note: See Appendix G, Table G5 for data. 'Not Stated' values are not included in the calculation of percentages.
Figures 3.9 to 3.10 present data on maternal parity for 2007 and 2011.
• The proportion of mothers giving birth for the first time and aged less than 25 years fell between 2007 and 2011; births to primiparous women aged less than 20 years accounted for 7.6 per cent of births in 2007 compared to 5.1 per cent in 2011. Births to primiparous women aged 20 to 24 years accounted for 19.7 per cent of births in 2007 and 15.3 per cent of births in 2011.
• The proportion of mothers giving birth for a second time or more fell for all mothers aged between 20 and 29 years, with a slight increase recorded for mothers aged 30 years or more.
0.0
10.0
20.0
30.0
40.0
50.0
60.0
70.0
80.0
90.0
100.0
< 20 Years 20-24 Years 25-29 Years 30-34 Years 35-39 Years 40+ Years
Perc
enta
ge o
f Tot
al M
ater
nitie
s (%
)
Age of Mother
0 1 2 3 4 5 6 More than 6

Genera l Character i st ics | 39
FIGURE 3.9 Total Births to Primiparous Women by Mother's Age Group, 2007 and 2011
Note: See Appendix G, Table G6 for data. 'Not Stated' values are not included in the calculation of percentages.
FIGURE 3.10 Total Births to Multiparous Women by Mother's Age Group, 2007 and 2011
Note: See Appendix G, Table G7 for data. 'Not Stated' values are not included in the calculation of percentages.
0.0
5.0
10.0
15.0
20.0
25.0
30.0
35.0
< 20 years 20-24 years 25-29 years 30-34 years 35-39 years 40+ years
Perc
enta
ge o
f Tot
al B
irths
(%)
Age of Mother2007 2011
0.0
5.0
10.0
15.0
20.0
25.0
30.0
35.0
40.0
< 20 years 20-24 years 25-29 years 30-34 years 35-39 years 40+ years
Perc
enta
ge o
f Tot
al B
irths
(%)
Age of Mother2007 2011
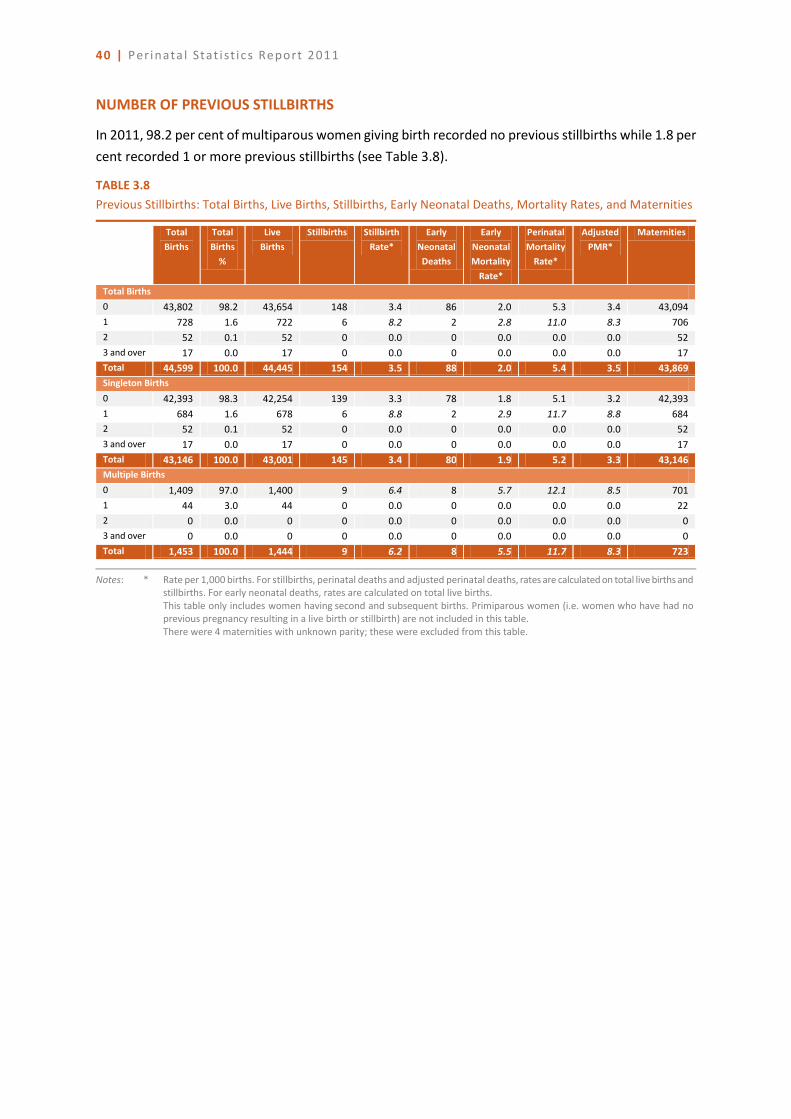
40 | Perinata l Stat i st i cs Report 2011
NUMBER OF PREVIOUS STILLBIRTHS
In 2011, 98.2 per cent of multiparous women giving birth recorded no previous stillbirths while 1.8 per cent recorded 1 or more previous stillbirths (see Table 3.8).
TABLE 3.8 Previous Stillbirths: Total Births, Live Births, Stillbirths, Early Neonatal Deaths, Mortality Rates, and Maternities
Total
Births Total Births
%
Live Births
Stillbirths Stillbirth Rate*
Early Neonatal Deaths
Early Neonatal Mortality
Rate*
Perinatal Mortality
Rate*
Adjusted PMR*
Maternities
Total Births 0 43,802 98.2 43,654 148 3.4 86 2.0 5.3 3.4 43,094 1 728 1.6 722 6 8.2 2 2.8 11.0 8.3 706 2 52 0.1 52 0 0.0 0 0.0 0.0 0.0 52 3 and over 17 0.0 17 0 0.0 0 0.0 0.0 0.0 17 Total 44,599 100.0 44,445 154 3.5 88 2.0 5.4 3.5 43,869 Singleton Births 0 42,393 98.3 42,254 139 3.3 78 1.8 5.1 3.2 42,393 1 684 1.6 678 6 8.8 2 2.9 11.7 8.8 684 2 52 0.1 52 0 0.0 0 0.0 0.0 0.0 52 3 and over 17 0.0 17 0 0.0 0 0.0 0.0 0.0 17 Total 43,146 100.0 43,001 145 3.4 80 1.9 5.2 3.3 43,146 Multiple Births 0 1,409 97.0 1,400 9 6.4 8 5.7 12.1 8.5 701 1 44 3.0 44 0 0.0 0 0.0 0.0 0.0 22 2 0 0.0 0 0 0.0 0 0.0 0.0 0.0 0 3 and over 0 0.0 0 0 0.0 0 0.0 0.0 0.0 0 Total 1,453 100.0 1,444 9 6.2 8 5.5 11.7 8.3 723
Notes: * Rate per 1,000 births. For stillbirths, perinatal deaths and adjusted perinatal deaths, rates are calculated on total live births and
stillbirths. For early neonatal deaths, rates are calculated on total live births. This table only includes women having second and subsequent births. Primiparous women (i.e. women who have had no previous pregnancy resulting in a live birth or stillbirth) are not included in this table. There were 4 maternities with unknown parity; these were excluded from this table.

Genera l Character i st ics | 41
INTERVAL SINCE LAST BIRTH
Table 3.9 shows the interval since the last birth for multiparous women.
• Almost 53 per cent of all multiparous mothers had their previous birth within the last three years.
• Approximately 16 per cent had their previous birth more than six years earlier.
TABLE 3.9 Interval in Years since Last Birth: Total Births, Live Births, Stillbirths, Early Neonatal Deaths, Mortality Rates, and Maternities
Total
Births Total Births
%
Live Births
Stillbirths Stillbirth Rate*
Early Neonatal Deaths
Early Neonatal Mortality
Rate*
Perinatal Mortality
Rate*
Adjusted PMR*
Maternities
Total Births 1 year or less 575 1.3 573 2 3.5 5 8.7 12.2 7.0 556 >1 year to 2 years 11,099 24.9 11,057 42 3.8 22 2.0 5.8 3.9 10,935 >2 years to 3 years 11,718 26.3 11,692 26 2.2 21 1.8 4.0 2.1 11,538 >3 years to 4 years 7,136 16.0 7,117 19 2.7 13 1.8 4.5 2.7 7,022 >4 years to 5 years 4,196 9.4 4,177 19 4.5 9 2.2 6.7 4.3 4,127 >5 years to 6 years 2,607 5.8 2,600 7 2.7 3 1.2 3.8 1.9 2,564 More than 6 years 6,903 15.5 6,869 34 4.9 12 1.7 6.7 5.1 6,770 Not Stated 365 0.8 360 5 13.7 3 8.3 21.9 19.2 357 Total 44,599 100.0 44,445 154 3.5 88 2.0 5.4 3.5 43,869 Singleton Births 1 year or less 536 1.2 534 2 3.7 3 5.6 9.3 5.6 536 >1 year to 2 years 10,772 25.0 10,732 40 3.7 21 2.0 5.7 3.9 10,772 >2 years to 3 years 11,357 26.3 11,332 25 2.2 19 1.7 3.9 2.0 11,357 >3 years to 4 years 6,911 16.0 6,896 15 2.2 12 1.7 3.9 2.0 6,911 >4 years to 5 years 4,061 9.4 4,044 17 4.2 9 2.2 6.4 3.9 4,061 >5 years to 6 years 2,521 5.8 2,514 7 2.8 3 1.2 4.0 2.0 2,521 More than 6 years 6,639 15.4 6,605 34 5.1 12 1.8 6.9 5.3 6,639 Not Stated 349 0.8 344 5 14.3 1 2.9 17.2 14.4 349 Total 43,146 100.0 43,001 145 3.4 80 1.9 5.2 3.3 43,146 Multiple Births 1 year or less 39 2.7 39 0 0.0 2 51.3 51.3 26.3 20 >1 year to 2 years 327 22.5 325 2 6.1 1 3.1 9.2 3.1 163 >2 years to 3 years 361 24.8 360 1 2.8 2 5.6 8.3 2.8 181 >3 years to 4 years 225 15.5 221 4 17.8 1 4.5 22.2 22.2 111 >4 years to 5 years 135 9.3 133 2 14.8 0 0.0 14.8 14.8 66 >5 years to 6 years 86 5.9 86 0 0.0 0 0.0 0.0 0.0 43 More than 6 years 264 18.2 264 0 0.0 0 0.0 0.0 0.0 131 Not Stated 16 1.1 16 0 0.0 2 125.0 125.0 125.0 8 Total 1,453 100.0 1,444 9 6.2 8 5.5 11.7 8.3 723
Notes: * Rate per 1,000 births. For stillbirths, perinatal deaths and adjusted perinatal deaths, rates are calculated on total live births and
stillbirths. For early neonatal deaths, rates are calculated on total live births. This table only includes women having second and subsequent births. Primiparous women (i.e. women who have had no previous pregnancy resulting in a live birth or stillbirth) are not included in this table. There were 4 maternities with unknown parity; these were excluded from this table.

42 | Perinata l Stat i st i cs Report 2011
BIRTHWEIGHT
The birthweight of a baby is widely used as a key indicator of health status. According to the World Health Organization (WHO), low birthweight babies are defined as weighing less than 2,500 grams. This is further divided into very low birthweight (weighing less than 1,500 grams) and extremely low birthweight (weighing less than 1,000 grams). Low birthweight babies are more likely to have poor perinatal outcomes with consequences for later life experience.20
• The average birthweight for live births was 3,505.0 grams for singletons, 2,464.6 grams for multiples and 3,467.0 grams for total live births.
• The average birthweight of live births was 3,525.6 grams for males compared to 3,405.3 grams for females.
• 70.4 per cent of stillbirths were classified as low birthweight, with the average birthweight for total stillbirths at 1,872.3 grams.
Table 3.10 presents data on baby birthweight.
• The percentage of total live births classified as low birthweight was 5.2 per cent (3.6 per cent of singletons and 46.0 per cent of multiples).
• There was considerable variation in very low birthweight rates between singleton and multiple births with 0.6 per cent of singleton live births weighing less than 1,500 grams compared to 7.0 per cent for multiple births (see Figure 3.11).
• 92.2 per cent of total live births were in the healthy birthweight category weighing between 2,500 and 4,499 grams (see Figure 3.12).
• A marginally smaller proportion of male live births were low birthweight (4.8 per cent) compared with female live births (5.6 per cent) (see Figure 3.13).
20 EURO-PERISTAT Project, with SCPE, EUROCAT, EURONEOSTAT. European Perinatal Health Report, 2008.
www.europeristat.com

Genera l Character i st ics | 43
TABLE 3.10 Birthweight (grams): Total Births, Live Births, Stillbirths, Early Neonatal Deaths, Mortality Rates, and Maternities
Total
Births Total Births
%
Live Births
Stillbirths Stillbirth Rate*
Early Neonatal Deaths
Early Neonatal Mortality
Rate*
Perinatal Mortality
Rate*
Adjusted PMR*
Maternities
Total Births 500-749 148 0.2 98 50 337.8 43 438.8 628.4 601.4 135 750-999 163 0.2 135 28 171.8 19 140.7 288.3 226.7 144 1000-1249 210 0.3 181 29 138.1 10 55.2 185.7 118.6 176 1250-1499 219 0.3 194 25 114.2 6 30.9 141.6 91.8 181 1500-1999 913 1.2 870 43 47.1 15 17.2 63.5 31.7 716 2000-2499 2,398 3.2 2,364 34 14.2 16 6.8 20.9 12.6 2,043 2500-2999 8,709 11.7 8,675 34 3.9 10 1.2 5.1 3.6 8,220 3000-3499 23,931 32.2 23,904 27 1.1 16 0.7 1.8 1.2 23,737 3500-3999 25,569 34.4 25,551 18 0.7 15 0.6 1.3 0.8 25,541 4000-4499 10,197 13.7 10,188 9 0.9 2 0.2 1.1 1.0 10,195 4500 and Over 1,919 2.6 1,919 0 0.0 0 0.0 0.0 0.0 1,919 Not Stated 1 0.0 1 0 0.0 1 1000.0 1000.0 1000.0 1 Total 74,377 100 74,080 297 4.0 153 2.1 6.1 4.1 73,008 Singleton Births 500-749 119 0.2 74 45 378.2 33 445.9 655.5 627.3 119 750-999 125 0.2 100 25 200.0 13 130.0 304.0 230.1 125 1000-1249 146 0.2 121 25 171.2 6 49.6 212.3 154.4 146 1250-1499 146 0.2 125 21 143.8 5 40.0 178.1 111.1 146 1500-1999 551 0.8 513 38 69.0 14 27.3 94.4 45.9 551 2000-2499 1,700 2.4 1,666 34 20.0 15 9.0 28.8 17.8 1,700 2500-2999 7,719 10.8 7,685 34 4.4 9 1.2 5.6 4.0 7,719 3000-3499 23,518 32.8 23,491 27 1.1 15 0.6 1.8 1.2 23,518 3500-3999 25,515 35.6 25,497 18 0.7 13 0.5 1.2 0.8 25,515 4000-4499 10,192 14.2 10,183 9 0.9 2 0.2 1.1 1.0 10,192 4500 and Over 1,919 2.7 1,919 0 0.0 0 0.0 0.0 0.0 1,919 Not Stated 1 0.0 1 0 0.0 1 1000.0 1000.0 1000.0 1 Total 71,651 100 71,375 276 3.9 126 1.8 5.6 3.8 71,651 Multiple Births 500-749 29 1.1 24 5 172.4 10 416.7 517.2 500.0 16 750-999 38 1.4 35 3 78.9 6 171.4 236.8 216.2 19 1000-1249 64 2.3 60 4 62.5 4 66.7 125.0 34.5 30 1250-1499 73 2.7 69 4 54.8 1 14.5 68.5 55.6 35 1500-1999 362 13.3 357 5 13.8 1 2.8 16.6 11.1 165 2000-2499 698 25.6 698 0 0.0 1 1.4 1.4 0.0 343 2500-2999 990 36.3 990 0 0.0 1 1.0 1.0 0.0 501 3000-3499 413 15.2 413 0 0.0 1 2.4 2.4 2.4 219 3500-3999 54 2.0 54 0 0.0 2 37.0 37.0 0.0 26 4000-4499 5 0.2 5 0 0.0 0 0.0 0.0 0.0 3 4500 and Over 0 0.0 0 0 0.0 0 0.0 0.0 0.0 0 Not Stated 0 0.0 0 0 0.0 0 0.0 0.0 0.0 0 Total 2,726 100 2,705 21 7.7 27 10.0 17.6 12.2 1,357
Notes: * Rate per 1,000 births. For stillbirths, perinatal deaths and adjusted perinatal deaths, rates are calculated on total live births and
stillbirths. For early neonatal deaths, rates are calculated on total live births. Birthweight tables by primiparous and multiparous women are provided in Appendix G, Tables G8 and G9.

44 | Perinata l Stat i st i cs Report 2011
FIGURE 3.11 Birthweight: Cumulative Percentages of Total Live Births
Note: See Table 3.10 for data. 'Not Stated' values are not included in the calculation of percentages.
FIGURE 3.12 Percentage of Births by Birthweight Groups, Total Live Births
Note: See Appendix G, Table G10 for data. 'Not Stated' values are not included in the calculation of percentages.
0.0
10.0
20.0
30.0
40.0
50.0
60.0
70.0
80.0
90.0
100.0
Cum
ulat
ive
Perc
enta
ge (%
)
Birthweight (grams)
Singleton Births Multiple Births
0.8%4.4%
92.2%
2.6%Less than 1,500g1,500-2,499g2,500-4,499g4,500g and Over

Genera l Character i st ics | 45
FIGURE 3.13 Percentage Distribution for Males and Females across Birthweight Groups, Total Live Births
Note: See Appendix G, Table G11 for data. 'Not Stated' values are not included in the calculation of percentages.
0.0
5.0
10.0
15.0
20.0
25.0
30.0
35.0
40.0
Perc
enta
ge o
f Tot
al Li
ve B
irths
(%)
Birthweight groups (grams)
Male Female

46 | Perinata l Stat i st i cs Report 2011
GESTATIONAL AGE
Based on maternities, the average gestational age for total births was 39.3 weeks. Live births reported an average gestational age of 39.4 weeks and stillbirths reported an average gestational age of 32.9 weeks. The average gestational age for singleton live births was 39.4 weeks compared with 35.9 weeks for live twin births and 31.7 weeks for higher-order multiple live births.
Table 3.11 presents data on mother's gestational age.
• 90.8 per cent of all babies were born at term (37 to 41 weeks).
• Preterm birth (born before 37 weeks) occurred in 66.7 per cent of stillbirths and 5.8 per cent of live births.
• Preterm births were associated with higher risk of perinatal death and comprised 6.1 per cent of total births (see also Figure 3.14).
TABLE 3.11 Gestational Age (weeks) at Delivery: Total Births, Live Births, Stillbirths, Early Neonatal Deaths, Mortality Rates, and Maternities
Total
Births Total Births
%
Live Births
Stillbirths Stillbirth Rate*
Early Neonatal Deaths
Early Neonatal Mortality
Rate*
Perinatal Mortality
Rate*
Adjusted PMR*
Maternities
Total Births Less than 28 308 0.4 242 66 214.3 59 243.8 405.8 385.9 276 28-31 533 0.7 481 52 97.6 13 27.0 122.0 84.1 443 32-36 3,680 4.9 3,602 78 21.2 37 10.3 31.3 16.6 3,141 37-41 67,524 90.8 67,430 94 1.4 39 0.6 2.0 1.2 66,816 42 and Over 2,324 3.1 2,320 4 1.7 5 2.2 3.9 2.6 2,324 Not Stated 8 0.0 5 3 375.0 0 0.0 375.0 375.0 8 Total 74,377 100 74,080 297 4.0 153 2.1 6.1 4.1 73,008 Singleton Births Less than 28 238 0.3 179 59 247.9 45 251.4 437.0 412.3 238 28-31 363 0.5 318 45 124.0 9 28.3 148.8 112.1 363 32-36 2,611 3.6 2,539 72 27.6 31 12.2 39.4 20.7 2,611 37-41 66,107 92.3 66,014 93 1.4 36 0.5 2.0 1.2 66,107 42 and Over 2,324 3.2 2,320 4 1.7 5 2.2 3.9 2.6 2,324 Not Stated 8 0.0 5 3 375.0 0 0.0 375.0 375.0 8 Total 71,651 100 71,375 276 3.9 126 1.8 5.6 3.8 71,651 Multiple Births Less than 28 70 2.6 63 7 100.0 14 222.2 300.0 300.0 38 28-31 170 6.2 163 7 41.2 4 24.5 64.7 24.5 80 32-36 1,069 39.2 1,063 6 5.6 6 5.6 11.2 6.6 530 37-41 1,417 52.0 1,416 1 0.7 3 2.1 2.8 0.7 709 42 and Over 0 0.0 0 0 0.0 0 0.0 0.0 0.0 0 Not Stated 0 0.0 0 0 0.0 0 0.0 0.0 0.0 0 Total 2,726 100 2,705 21 7.7 27 10.0 17.6 12.2 1,357
Notes: * Rate per 1,000 births. For stillbirths, perinatal deaths and adjusted perinatal deaths, rates are calculated on total live births and
stillbirths. For early neonatal deaths, rates are calculated on total live births. Gestational age tables by primiparous and multiparous women are provided in Appendix G, Tables G12 and G13.

Genera l Character i st ics | 47
FIGURE 3.14 Perinatal Mortality Rates by Gestational Age (weeks) at Delivery, Total Births
Note: See Table 3.11 for data.
0.0
50.0
100.0
150.0
200.0
250.0
300.0
350.0
400.0
450.0
500.0
Less than 28 28-31 32-36 37-41
Perin
atal
Mor
talit
y Ra
tes
(per
1,0
00 L
ive
Birt
hs a
nd S
tillb
irths
)
Gestational Age (weeks)
Perinatal Mortality Rate Adjusted PMR

48 | Perinata l Stat i st i cs Report 2011
MONTH OF BIRTH
Table 3.12 presents data on the month of birth.
• Total births were fairly evenly spread throughout the year, with the lowest number of births occurring in February (7.6 per cent) and the highest occurring in July (8.7 per cent).
• The highest number of singleton births occurred in July (8.7 per cent) and the highest number of multiple births in October (9.4 per cent) (see Figure 3.15).
TABLE 3.12 Month of Birth: Total Births, Live Births, Stillbirths, Early Neonatal Deaths, Mortality Rates, and Maternities
Total
Births Total Births
%
Live Births
Stillbirths Stillbirth Rate*
Early Neonatal Deaths
Early Neonatal Mortality
Rate*
Perinatal Mortality
Rate*
Adjusted PMR*
Maternities
Total Births January 6,063 8.2 6,040 23 3.8 8 1.3 5.1 2.5 5,947 February 5,672 7.6 5,651 21 3.7 13 2.3 6.0 4.4 5,571 March 6,330 8.5 6,301 29 4.6 16 2.5 7.1 4.4 6,214 April 6,000 8.1 5,977 23 3.8 11 1.8 5.7 3.5 5,895 May 6,284 8.4 6,258 26 4.1 9 1.4 5.6 3.7 6,168 June 6,252 8.4 6,229 23 3.7 13 2.1 5.8 4.0 6,147 July 6,498 8.7 6,471 27 4.2 11 1.7 5.8 4.2 6,380 August 6,404 8.6 6,381 23 3.6 21 3.3 6.9 5.2 6,290 September 6,434 8.7 6,415 19 3.0 18 2.8 5.8 4.2 6,324 October 6,195 8.3 6,179 16 2.6 13 2.1 4.7 3.2 6,066 November 5,939 8.0 5,910 29 4.9 10 1.7 6.6 5.2 5,821 December 6,306 8.5 6,268 38 6.0 10 1.6 7.6 5.2 6,185 Total 74,377 100 74,080 297 4.0 153 2.1 6.1 4.1 73,008 Singleton Births January 5,831 8.1 5,811 20 3.4 8 1.4 4.8 2.4 5,831 February 5,468 7.6 5,448 20 3.7 11 2.0 5.7 4.2 5,468 March 6,099 8.5 6,074 25 4.1 16 2.6 6.7 3.9 6,099 April 5,793 8.1 5,770 23 4.0 11 1.9 5.9 3.6 5,793 May 6,057 8.5 6,035 22 3.6 8 1.3 5.0 3.1 6,057 June 6,042 8.4 6,019 23 3.8 9 1.5 5.3 3.8 6,042 July 6,259 8.7 6,236 23 3.7 10 1.6 5.3 3.7 6,259 August 6,176 8.6 6,155 21 3.4 14 2.3 5.7 3.9 6,176 September 6,219 8.7 6,201 18 2.9 12 1.9 4.8 4.0 6,219 October 5,938 8.3 5,922 16 2.7 11 1.9 4.5 3.2 5,938 November 5,704 8.0 5,675 29 5.1 8 1.4 6.5 5.1 5,704 December 6,065 8.5 6,029 36 5.9 8 1.3 7.3 5.1 6,065 Total 71,651 100 71,375 276 3.9 126 1.8 5.6 3.8 71,651 Multiple Births January 232 8.5 229 3 12.9 0 0.0 12.9 4.3 116 February 204 7.5 203 1 4.9 2 9.9 14.7 9.9 103 March 231 8.5 227 4 17.3 0 0.0 17.3 17.3 115 April 207 7.6 207 0 0.0 0 0.0 0.0 0.0 102 May 227 8.3 223 4 17.6 1 4.5 22.0 17.7 111 June 210 7.7 210 0 0.0 4 19.0 19.0 9.6 105 July 239 8.8 235 4 16.7 1 4.3 20.9 16.8 121 August 228 8.4 226 2 8.8 7 31.0 39.5 39.5 114 September 215 7.9 214 1 4.7 6 28.0 32.6 9.5 105 October 257 9.4 257 0 0.0 2 7.8 7.8 3.9 128 November 235 8.6 235 0 0.0 2 8.5 8.5 8.5 117 December 241 8.8 239 2 8.3 2 8.4 16.6 8.4 120 Total 2,726 100 2,705 21 7.7 27 10.0 17.6 12.2 1,357
Note: * Rate per 1,000 births. For stillbirths, perinatal deaths and adjusted perinatal deaths, rates are calculated on total live births and
stillbirths. For early neonatal deaths, rates are calculated on total live births.

Genera l Character i st ics | 49
FIGURE 3.15 Percentage of Births by Month of Birth, Total Births
Note: See Table 3.12 for data.
0.0
2.0
4.0
6.0
8.0
10.0
12.0
Janu
ary
Febr
uary
Mar
ch
April
May
June July
Augu
st
Sept
embe
r
Oct
ober
Nov
embe
r
Dec
embe
r
Perc
enta
ge o
f Tot
al B
irths
(%)
Singleton Births Multiple Births


SECTION FOUR
PERINATAL CARE

52 | Perinata l Stat i st i cs Report 2011
INTRODUCTION
This section presents a detailed review of aspects of perinatal care for the mother and baby. Tables and figures are presented in some detail for a number of variables, including
• type of antenatal care
• timing of first antenatal visit
• mother's antenatal and postnatal length of stay
• method of delivery
• mother's immunity to rubella
• infant's length of stay
• type of feeding.
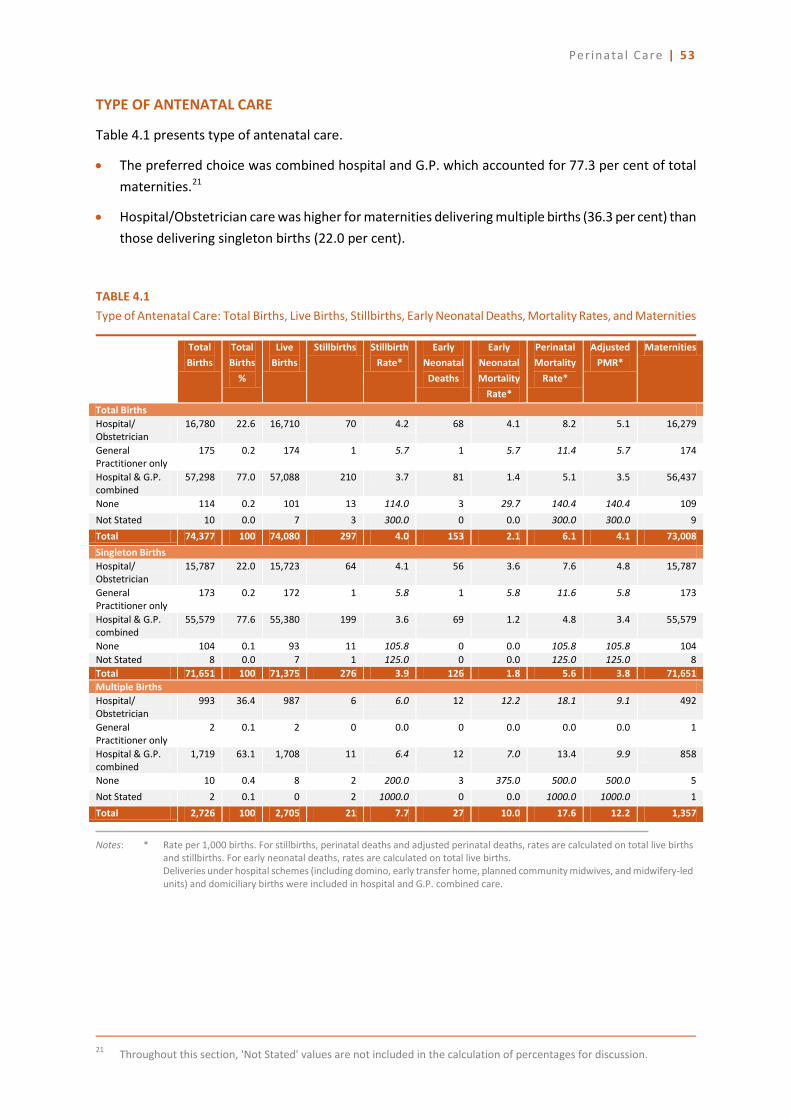
Perinatal Care | 53
TYPE OF ANTENATAL CARE
Table 4.1 presents type of antenatal care.
• The preferred choice was combined hospital and G.P. which accounted for 77.3 per cent of total maternities.21
• Hospital/Obstetrician care was higher for maternities delivering multiple births (36.3 per cent) than those delivering singleton births (22.0 per cent).
TABLE 4.1 Type of Antenatal Care: Total Births, Live Births, Stillbirths, Early Neonatal Deaths, Mortality Rates, and Maternities
Total
Births Total Births
%
Live Births
Stillbirths Stillbirth Rate*
Early Neonatal Deaths
Early Neonatal Mortality
Rate*
Perinatal Mortality
Rate*
Adjusted PMR*
Maternities
Total Births Hospital/ Obstetrician
16,780 22.6 16,710 70 4.2 68 4.1 8.2 5.1 16,279
General Practitioner only
175 0.2 174 1 5.7 1 5.7 11.4 5.7 174
Hospital & G.P. combined
57,298 77.0 57,088 210 3.7 81 1.4 5.1 3.5 56,437
None 114 0.2 101 13 114.0 3 29.7 140.4 140.4 109 Not Stated 10 0.0 7 3 300.0 0 0.0 300.0 300.0 9 Total 74,377 100 74,080 297 4.0 153 2.1 6.1 4.1 73,008 Singleton Births Hospital/ Obstetrician
15,787 22.0 15,723 64 4.1 56 3.6 7.6 4.8 15,787
General Practitioner only
173 0.2 172 1 5.8 1 5.8 11.6 5.8 173
Hospital & G.P. combined
55,579 77.6 55,380 199 3.6 69 1.2 4.8 3.4 55,579
None 104 0.1 93 11 105.8 0 0.0 105.8 105.8 104 Not Stated 8 0.0 7 1 125.0 0 0.0 125.0 125.0 8 Total 71,651 100 71,375 276 3.9 126 1.8 5.6 3.8 71,651 Multiple Births Hospital/ Obstetrician
993 36.4 987 6 6.0 12 12.2 18.1 9.1 492
General Practitioner only
2 0.1 2 0 0.0 0 0.0 0.0 0.0 1
Hospital & G.P. combined
1,719 63.1 1,708 11 6.4 12 7.0 13.4 9.9 858
None 10 0.4 8 2 200.0 3 375.0 500.0 500.0 5 Not Stated 2 0.1 0 2 1000.0 0 0.0 1000.0 1000.0 1 Total 2,726 100 2,705 21 7.7 27 10.0 17.6 12.2 1,357
Notes: * Rate per 1,000 births. For stillbirths, perinatal deaths and adjusted perinatal deaths, rates are calculated on total live births
and stillbirths. For early neonatal deaths, rates are calculated on total live births. Deliveries under hospital schemes (including domino, early transfer home, planned community midwives, and midwifery-led units) and domiciliary births were included in hospital and G.P. combined care.
21 Throughout this section, 'Not Stated' values are not included in the calculation of percentages for discussion.

54 | Perinata l Stat i st i cs Report 2011
DURATION OF PREGNANCY AT FIRST ANTENATAL VISIT
Table 4.2 presents the time of first antenatal visit.
• Two thirds of total maternities recorded their first antenatal visit within the first 12 weeks of pregnancy.
TABLE 4.2 Time of First Visit (weeks) to Doctor or Hospital during Pregnancy: Total Births, Live Births, Stillbirths, Early Neonatal Deaths, Mortality Rates, and Maternities
Total
Births Total Births
%
Live Births
Stillbirths Stillbirth Rate*
Early Neonatal Deaths
Early Neonatal Mortality
Rate*
Perinatal Mortality
Rate*
Adjusted PMR*
Maternities
Total Births 0-12 48,912 65.8 48,741 171 3.5 78 1.6 5.1 3.5 47,974 13-19 19,688 26.5 19,609 79 4.0 40 2.0 6.0 4.0 19,371 20 and over 4,874 6.6 4,839 35 7.2 27 5.6 12.7 8.7 4,783 Not Stated 903 1.2 891 12 13.3 8 9.0 22.1 18.9 880 Total 74,377 100 74,080 297 4.0 153 2.1 6.1 4.1 73,008 Singleton Births 0-12 47,047 65.7 46,882 165 3.5 63 1.3 4.8 3.4 47,047 13-19 19,056 26.6 18,986 70 3.7 34 1.8 5.5 3.6 19,056 20 and over 4,690 6.5 4,658 32 6.8 23 4.9 11.7 7.7 4,690 Not Stated 858 1.2 849 9 10.5 6 7.1 17.5 14.0 858 Total 71,651 100 71,375 276 3.9 126 1.8 5.6 3.8 71,651 Multiple Births 0-12 1,865 68.4 1,859 6 3.2 15 8.1 11.3 5.9 927 13-19 632 23.2 623 9 14.2 6 9.6 23.7 17.5 315 20 and over 184 6.7 181 3 16.3 4 22.1 38.0 32.8 93 Not Stated 45 1.7 42 3 66.7 2 47.6 111.1 111.1 22 Total 2,726 100 2,705 21 7.7 27 10.0 17.6 12.2 1,357
Notes: * Rate per 1,000 births. For stillbirths, perinatal deaths and adjusted perinatal deaths, rates are calculated on total live births
and stillbirths. For early neonatal deaths, rates are calculated on total live births. Although 77.0 per cent of total births were recorded as receiving combined antenatal care, the date of the first visit to the doctor was recorded as 'not known' for 33.9 per cent of these births. As a result of the absence of these data, the timing of first contact with health professionals within this category will reflect the date of the first hospital visit, even though this is likely to have been later than the first doctor visit. Consequently, caution should be exercised in interpreting the data presented here on the timing of the first visit to health services.

Perinatal Care | 55
ADVANCE HOSPITAL BOOKINGS
• Over 99 per cent of total births were booked at time of admission to hospital (see Table 4.3).
TABLE 4.3 Advance Hospital Bookings: Total Births, Live Births, Stillbirths, Early Neonatal Deaths, Mortality Rates, and Maternities
Total
Births Total Births
%
Live Births
Stillbirths Stillbirth Rate*
Early Neonatal Deaths
Early Neonatal Mortality
Rate*
Perinatal Mortality
Rate*
Adjusted PMR*
Maternities
Total Births Booked 73,705 99.3 73,438 267 3.6 142 1.9 5.5 3.7 72,353 Not Booked 500 0.7 470 30 60.0 11 23.4 82.0 76.5 483 Not Stated 4 0.0 4 0 0.0 0 0.0 0.0 0.0 4 Total 74,209 100 73,912 297 4.0 153 2.1 6.1 4.2 72,840 Singleton Births Booked 71,017 99.3 70,766 251 3.5 120 1.7 5.2 3.5 71,017 Not Booked 462 0.6 437 25 54.1 6 13.7 67.1 61.0 462 Not Stated 4 0.0 4 0 0.0 0 0.0 0.0 0.0 4 Total 71,483 100 71,207 276 3.9 126 1.8 5.6 3.9 71,483 Multiple Births Booked 2,688 98.6 2,672 16 6.0 22 8.2 14.1 8.6 1,336 Not Booked 38 1.4 33 5 131.6 5 151.5 263.2 263.2 21 Not Stated 0 0.0 0 0 0.0 0 0.0 0.0 0.0 0 Total 2,726 100 2,705 21 7.7 27 10.0 17.6 12.2 1,357
Notes: * Rate per 1,000 births. For stillbirths, perinatal deaths and adjusted perinatal deaths, rates are calculated on total live births
and stillbirths. For early neonatal deaths, rates are calculated on total live births. Domiciliary births, of which there were 168, are excluded from this table. See Appendix H for detailed analysis.

56 | Perinata l Stat i st i cs Report 2011
MOTHER'S ANTENATAL LENGTH OF STAY
The average antenatal length of stay was less than one day (0.7 days) for singleton births and 2.2 days for multiple births.
Table 4.4 presents data on mother’s antenatal length of stay.
• Just over 90 per cent of singleton births and 76.8 per cent of multiple births were delivered within a day of mother's admission to hospital.
• For total births, 1.8 per cent were delivered more than 5 days after mother's admission to hospital.
TABLE 4.4 Mother's Antenatal Length of Stay: Total Births, Live Births, Stillbirths, Early Neonatal Deaths, Mortality Rates, and Maternities
Total
Births Total Births
%
Live Births
Stillbirths Stillbirth Rate*
Early Neonatal Deaths
Early Neonatal Mortality
Rate*
Perinatal Mortality
Rate*
Adjusted PMR*
Maternities
Total Births 0-1 Days 66,493 89.6 66,261 232 3.5 127 1.9 5.4 3.7 65,446 2 Days 4,296 5.8 4,269 27 6.3 8 1.9 8.1 6.3 4,214 3-5 Days 2,006 2.7 1,976 30 15.0 6 3.0 17.9 11.5 1,904 6-8 Days 537 0.7 534 3 5.6 4 7.5 13.0 7.5 493 9-11 Days 226 0.3 224 2 8.8 0 0.0 8.8 8.8 206 12-14 Days 167 0.2 166 1 6.0 1 6.0 12.0 12.0 150 More than 2 Weeks
419 0.6 418 1 2.4 7 16.7 19.1 12.0 362
Not Stated 65 0.1 64 1 15.4 0 0.0 15.4 15.4 65 Total 74,209 100 73,912 297 4.0 153 2.1 6.1 4.2 72,840 Singleton Births 0-1 Days 64,399 90.1 64,183 216 3.4 105 1.6 5.0 3.4 64,399 2 Days 4,136 5.8 4,110 26 6.3 7 1.7 8.0 6.3 4,136 3-5 Days 1,803 2.5 1,776 27 15.0 5 2.8 17.7 11.2 1,803 6-8 Days 452 0.6 450 2 4.4 3 6.7 11.1 6.7 452 9-11 Days 186 0.3 184 2 10.8 0 0.0 10.8 10.8 186 12-14 Days 134 0.2 133 1 7.5 1 7.5 14.9 14.9 134 More than 2 Weeks
308 0.4 307 1 3.2 5 16.3 19.5 16.3 308
Not Stated 65 0.1 64 1 15.4 0 0.0 15.4 15.4 65 Total 71,483 100 71,207 276 3.9 126 1.8 5.6 3.9 71,483 Multiple Births 0-1 Days 2,094 76.8 2,078 16 7.6 22 10.6 18.1 13.4 1,047 2 Days 160 5.9 159 1 6.3 1 6.3 12.5 6.3 78 3-5 Days 203 7.4 200 3 14.8 1 5.0 19.7 14.9 101 6-8 Days 85 3.1 84 1 11.8 1 11.9 23.5 11.9 41 9-11 Days 40 1.5 40 0 0.0 0 0.0 0.0 0.0 20 12-14 Days 33 1.2 33 0 0.0 0 0.0 0.0 0.0 16 More than 2 Weeks
111 4.1 111 0 0.0 2 18.0 18.0 0.0 54
Not Stated 0 0.0 0 0 0.0 0 0.0 0.0 0.0 0 Total 2,726 100 2,705 21 7.7 27 10.0 17.6 12.2 1,357
Notes: * Rate per 1,000 births. For stillbirths, perinatal deaths and adjusted perinatal deaths, rates are calculated on total live births
and stillbirths. For early neonatal deaths, rates are calculated on total live births. Domiciliary births, of which there were 168, are excluded from this table. See Appendix H for detailed analysis.

Perinatal Care | 57
MOTHER'S POSTNATAL LENGTH OF STAY
Maternal postnatal length of stay can be influenced by factors such as method of delivery, post-delivery complications, neonatal mortality, and hospital discharge policies. Average maternal postnatal lengths of stay for singleton and multiple births were 2.5 and 4.1 days respectively.
Table 4.5 presents data on mother’s postnatal length of stay.
• Over 55 per cent of maternities delivering singleton births remained in hospital for up to 2 days following delivery, compared to 13.1 per cent of maternities delivering multiple births.
• For total maternities 42.8 per cent of singleton births and 74.4 per cent of multiple births were discharged 3 to 5 days post delivery.
• For singleton births, 97.9 per cent of mothers were discharged home within 5 days of delivery compared to 87.5 per cent of multiple births.
TABLE 4.5 Mother's Postnatal Length of Stay: Total Births, Live Births, Stillbirths, Early Neonatal Deaths, Mortality Rates, and Maternities
Total
Births Total Births
%
Live Births
Stillbirths Stillbirth Rate*
Early Neonatal Deaths
Early Neonatal Mortality
Rate*
Perinatal Mortality
Rate*
Adjusted PMR*
Maternities
Total Births 0-1 Days 16,920 22.8 16,754 166 9.8 60 3.6 13.4 9.1 16,882 2 Days 22,822 30.8 22,753 69 3.0 33 1.5 4.5 3.2 22,684 3-5 Days 32,639 44.0 32,590 49 1.5 52 1.6 3.1 2.0 31,622 6-8 Days 1,516 2.0 1,507 9 5.9 7 4.6 10.6 7.9 1,368 9-11 Days 208 0.3 208 0 0.0 0 0.0 0.0 0.0 185 12-14 Days 54 0.1 54 0 0.0 0 0.0 0.0 0.0 51 More than 2 Weeks
35 0.0 33 2 57.1 1 30.3 85.7 85.7 34
Not Stated 15 0.0 13 2 133.3 0 0.0 133.3 133.3 14 Total 74,209 100 73,912 297 4.0 153 2.1 6.1 4.2 72,840 Singleton Births 0-1 Days 16,842 23.6 16,682 160 9.5 53 3.2 12.6 8.4 16,842 2 Days 22,547 31.5 22,480 67 3.0 29 1.3 4.3 3.1 22,547 3-5 Days 30,613 42.8 30,572 41 1.3 39 1.3 2.6 1.8 30,613 6-8 Days 1,224 1.7 1,218 6 4.9 4 3.3 8.2 6.5 1,224 9-11 Days 163 0.2 163 0 0.0 0 0.0 0.0 0.0 163 12-14 Days 48 0.1 48 0 0.0 0 0.0 0.0 0.0 48 More than 2 Weeks
33 0.0 31 2 60.6 1 32.3 90.9 90.9 33
Not Stated 13 0.0 13 0 0.0 0 0.0 0.0 0.0 13 Total 71,483 100 71,207 276 3.9 126 1.8 5.6 3.9 71,483 Multiple Births 0-1 Days 78 2.9 72 6 76.9 7 97.2 166.7 155.8 40 2 Days 275 10.1 273 2 7.3 4 14.7 21.8 14.7 137 3-5 Days 2,026 74.3 2,018 8 3.9 13 6.4 10.4 5.5 1,009 6-8 Days 292 10.7 289 3 10.3 3 10.4 20.5 13.8 144 9-11 Days 45 1.7 45 0 0.0 0 0.0 0.0 0.0 22 12-14 Days 6 0.2 6 0 0.0 0 0.0 0.0 0.0 3 More than 2 Weeks
2 0.1 2 0 0.0 0 0.0 0.0 0.0 1
Not Stated 2 0.1 0 2 1000.0 0 0.0 1000.0 1000.0 1 Total 2,726 100 2,705 21 7.7 27 10.0 17.6 12.2 1,357
Notes: * Rate per 1,000 births. For stillbirths, perinatal deaths and adjusted perinatal deaths, rates are calculated on total live births
and stillbirths. For early neonatal deaths, rates are calculated on total live births. Domiciliary births, of which there were 168, are excluded from this table. See Appendix H for detailed analysis.

58 | Perinata l Stat i st i cs Report 2011
Figures 4.1 and 4.2 present data on mother’s postnatal length of stay for singleton and multiple births.
• The postnatal length of stay for mothers differed by method of delivery and plurality.
• Mother's postnatal length of stay was 2 days or less for over 77 per cent of singleton spontaneous deliveries compared to 37.3 per cent of multiple spontaneous deliveries.
• For Caesarean section deliveries, mother's postnatal length of stay was 3 to 5 days for 89.8 per cent of singleton deliveries compared to 81.3 per cent for multiple deliveries.
FIGURE 4.1 Mother's Postnatal Length of Stay by Method of Delivery, Singleton Births
FIGURE 4.2 Mother's Postnatal Length of Stay by Method of Delivery, Multiple Births
Note: See Appendix G, Table G14 for data. 'Not Stated' values are not included in the calculation of percentages.
0.0
10.0
20.0
30.0
40.0
50.0
60.0
70.0
80.0
90.0
100.0
Spontaneous Breech/Forceps & Forceps
Vacuum Extraction Caesarean Section
Perc
enta
ge o
f Sin
glet
on B
irths
(%)
Method of Delivery0-2 Days 3-5 Days 6-8 Days 9+ Days
0.0
10.0
20.0
30.0
40.0
50.0
60.0
70.0
80.0
90.0
100.0
Spontaneous Breech/Forceps &Forceps
Vacuum Extraction Caesarean Section
Perc
enta
ge o
f Mul
tiple
Birt
hs (%
)
Method of Delivery
0-2 Days 3-5 Days 6-8 Days 9+ Days

Perinatal Care | 59
RUBELLA: IMMUNE STATUS OF MOTHER
The rubella immune status of the mother is presented in Table 4.6. Of total maternities, over 94 per cent were rubella immune.
TABLE 4.6 Rubella: Immune Status of Mother, Numbers and Percentages
Rubella Immunity Number of Maternities Per Cent Total Births Immune 68,868 94.3 Not Immune 2,729 3.7 Not known 1,411 1.9 Total 73,008 100 Singleton Births Immune 67,580 94.3 Not Immune 2,684 3.7 Not known 1,387 1.9 Total 71,651 100 Multiple Births Immune 1,288 94.9 Not Immune 45 3.3 Not known 24 1.8 Total 1,357 100
METHOD OF DELIVERY22
METHOD OF DELIVERY BY MATERNITIES AND PARITY
Table 4.7a presents data on method of delivery for total maternities by parity. • 56.6 per cent delivered spontaneously (41.2 per cent of primiparous and 66.8 per cent of
multiparous women).
• When method of delivery is analysed by plurality, almost two thirds of mothers (64.2 per cent) having a multiple birth delivered by Caesarean section, compared with just over one quarter (26.6 per cent) of maternities delivering singleton births.
• As well as recording a higher proportion of Caesarean sections (28.6 per cent), primiparous women also recorded a higher proportion of births by instrumental delivery (either breech/forceps, forceps or vacuum extraction) at 30.2 per cent compared to multiparous women (6.6 per cent) (see Figure 4.3).
22 Throughout this section, method of delivery recorded as 'other specified & combined' are not included in figures presenting
data on method of delivery

60 | Perinata l Stat i st i cs Report 2011
TABLE 4.7a Method of Delivery for Total Maternities by Parity
Total Maternities Maternities -
Primiparous Women Maternities -
Multiparous Women Number Per Cent Number Per Cent Number Per Cent
Total Births Spontaneous 41,330 56.6 12,005 41.2 29,325 66.8 Breech/Forceps 326 0.4 173 0.6 153 0.3 Forceps 3,006 4.1 2,505 8.6 501 1.1 Vacuum extraction 8,400 11.5 6,108 21.0 2,292 5.2 Caesarean section 19,917 27.3 8,344 28.6 11,573 26.4 Other specified & combined 25 0.0 0 0.0 25 0.1 Total 73,004 100 29,135 100 43,869 100 Singleton Births Spontaneous 40,978 57.2 11,922 41.8 29,056 67.3 Breech/Forceps 310 0.4 162 0.6 148 0.3 Forceps 2,964 4.1 2,473 8.7 491 1.1 Vacuum extraction 8,324 11.6 6,053 21.2 2,271 5.3 Caesarean section 19,046 26.6 7,891 27.7 11,155 25.9 Other specified & combined 25 0.0 0 0.0 25 0.1 Total 71,647 100 28,501 100 43,146 100 Multiple Births Spontaneous 352 25.9 83 13.1 269 37.2 Breech/Forceps 16 1.2 11 1.7 5 0.7 Forceps 42 3.1 32 5.0 10 1.4 Vacuum extraction 76 5.6 55 8.7 21 2.9 Caesarean section 871 64.2 453 71.5 418 57.8 Other specified & combined 0 0.0 0 0.0 0 0.0 Total 1,357 100 634 100 723 100
Note: There were 4 Maternities with parity unknown; these were excluded from this table.
FIGURE 4.3 Percentage Distribution of Maternities by Method of Delivery
Notes: See Table 4.7a for data. There were 4 Maternities with parity unknown; these were excluded from this figure. *Instrumental delivery includes breech/forceps, forceps or vacuum extraction.
0.0
10.0
20.0
30.0
40.0
50.0
60.0
70.0
Spontaneous Instrumental* Caesarean Section
Perc
enta
ge o
f Mat
erni
ties
(%)
Method of Delivery
Total Maternities Primiparous Women Multiparous Women

Perinatal Care | 61
METHOD OF DELIVERY BY BIRTHS AND PARITY
Table 4.7b presents births by method of delivery and parity.
• Spontaneous births accounted for the majority of births to both primiparous and multiparous women at 40.6 per cent and 66.1 percent respectively.
TABLE 4.7b Method of Delivery by Parity: Total Births, Live Births, Stillbirths, Early Neonatal Deaths, and Mortality Rates
Total
Births Total Births
%
Live Births
Stillbirths Stillbirth Rate*
Early Neonatal Deaths
Early Neonatal Mortality
Rate*
Perinatal Mortality
Rate*
Adjusted PMR*
Total Births Spontaneous 41,568 55.9 41,369 199 4.8 62 1.5 6.3 4.7 Breech/Forceps 425 0.6 380 45 105.9 16 42.1 143.5 90.0 Forceps 3,026 4.1 3,020 6 2.0 5 1.7 3.6 2.3 Vacuum extraction 8,492 11.4 8,488 4 0.5 10 1.2 1.6 0.9 Caesarean section 20,837 28.0 20,795 42 2.0 58 2.8 4.8 2.9 Other specified & combined 25 0.0 25 0 0.0 1 40.0 40.0 40.0 Total 74,373 100 74,077 296 4.0 152 2.1 6.0 4.1 Births to Primiparous Women Spontaneous 12,078 40.6 11,979 99 8.2 29 2.4 10.6 8.5 Breech/Forceps 210 0.7 191 19 90.5 7 36.6 123.8 93.6 Forceps 2,517 8.5 2,513 4 1.6 4 1.6 3.2 2.0 Vacuum extraction 6,157 20.7 6,154 3 0.5 6 1.0 1.5 1.0 Caesarean section 8,812 29.6 8,795 17 1.9 18 2.0 4.0 2.3 Other specified & combined 0 0.0 0 0 0.0 0 0.0 0.0 0.0 Total 29,774 100 29,632 142 4.8 64 2.2 6.9 5.1 Births to Multiparous Women Spontaneous 29,490 66.1 29,390 100 3.4 33 1.1 4.5 3.1 Breech/Forceps 215 0.5 189 26 120.9 9 47.6 162.8 86.3 Forceps 509 1.1 507 2 3.9 1 2.0 5.9 3.9 Vacuum extraction 2,335 5.2 2,334 1 0.4 4 1.7 2.1 0.9 Caesarean section 12,025 27.0 12,000 25 2.1 40 3.3 5.4 3.4 Other specified & combined 25 0.1 25 0 0.0 1 40.0 40.0 40.0 Total 44,599 100 44,445 154 3.5 88 2.0 5.4 3.5
Notes: * Rate per 1,000 births. For stillbirths, perinatal deaths and adjusted perinatal deaths, rates are calculated on total live births
and stillbirths. For early neonatal deaths, rates are calculated on total live births. There were 4 Maternities with parity unknown; these were excluded from this table. See Appendix G, Table G15 for a breakdown of Method of Delivery by Parity for Total, Singleton and Multiple Births.

62 | Perinata l Stat i st i cs Report 2011
METHOD OF DELIVERY BY BIRTHS AND PLURALITY
Table 4.8a presents data on method of delivery for total births.
• There were 20,796 live births delivered by Caesarean section, representing 28.1 per cent of total live births, 26.6 per cent of live singleton births and 65.8 per cent of live multiple births.
• Almost 56 per cent of total live births delivered spontaneously (57.1 per cent of live singleton births and 21.5 per cent of live multiple births) (see Figure 4.4).
• Just over 16 per cent of total live births were born by instrumental delivery (either breech/forceps, forceps or vacuum extraction) with higher percentages for live singleton births (16.2 per cent) compared with live multiple births (12.7 per cent).
TABLE 4.8a Method of Delivery: Total Births, Live Births, Stillbirths, Early Neonatal Deaths, Mortality Rates, and Maternities
Total
Births Total Births
%
Live Births
Stillbirths Stillbirth Rate*
Early Neonatal Deaths
Early Neonatal Mortality
Rate*
Perinatal Mortality
Rate*
Adjusted PMR*
Maternities
Total Births Spontaneous 41,570 55.9 41,371 199 4.8 63 1.5 6.3 4.7 41,332 Breech / Forceps 426 0.6 380 46 108.0 16 42.1 145.5 92.3 327 Forceps 3,026 4.1 3,020 6 2.0 5 1.7 3.6 2.3 3,006 Vacuum extraction
8,492 11.4 8,488 4 0.5 10 1.2 1.6 0.9 8,400
Caesarean section 20,838 28.0 20,796 42 2.0 58 2.8 4.8 2.9 19,918 Other specified & combined
25 0.0 25 0 0.0 1 40.0 40.0 40.0 25
Total 74,377 100 74,080 297 4.0 153 2.1 6.1 4.1 73,008 Singleton Births Spontaneous 40,980 57.2 40,789 191 4.7 52 1.3 5.9 4.4 40,980 Breech / Forceps 311 0.4 267 44 141.5 12 44.9 180.1 111.5 311 Forceps 2,964 4.1 2,958 6 2.0 3 1.0 3.0 2.0 2,964 Vacuum extraction
8,324 11.6 8,320 4 0.5 10 1.2 1.7 1.0 8,324
Caesarean section 19,047 26.6 19,016 31 1.6 48 2.5 4.1 2.6 19,047 Other specified & combined
25 0.0 25 0 0.0 1 40.0 40.0 40.0 25
Total 71,651 100 71,375 276 3.9 126 1.8 5.6 3.8 71,651 Multiple Births Spontaneous 590 21.6 582 8 13.6 11 18.9 32.2 25.6 352 Breech / Forceps 115 4.2 113 2 17.4 4 35.4 52.2 43.9 16 Forceps 62 2.3 62 0 0.0 2 32.3 32.3 16.4 42 Vacuum extraction
168 6.2 168 0 0.0 0 0.0 0.0 0.0 76
Caesarean section 1,791 65.7 1,780 11 6.1 10 5.6 11.7 6.7 871 Other specified & combined
0 0.0 0 0 0.0 0 0.0 0.0 0.0 0
Total 2,726 100 2,705 21 7.7 27 10.0 17.6 12.2 1,357
Note: * Rate per 1,000 births. For stillbirths, perinatal deaths and adjusted perinatal deaths, rates are calculated on total live births
and stillbirths. For early neonatal deaths, rates are calculated on total live births.

Perinatal Care | 63
FIGURE 4.4 Percentage Distribution of Total Live Births by Method of Delivery
Notes: See Table 4.8a for data. *Instrumental delivery includes breech/forceps, forceps or vacuum extraction.
METHOD OF DELIVERY BY MATERNAL AGE
Table 4.8b presents method of delivery by maternal age.
• Caesarean section rates ranged from 15.1 per cent for mothers aged less than 20 years to 43.6 per cent for mothers aged 40 years and over.
• The percentage of babies delivered by spontaneous delivery declined with age and was reported at 65.5 per cent for mothers aged less than 20 years compared to 45.9 per cent to mothers aged 40 years and older (see Figure 4.5).
TABLE 4.8b Method of Delivery by Maternal Age
Age of Mother Frequency Under 20-24 25-29 30-34 35-39 40 Years Not Total Col. Per Cent 20 Years Years Years Years Years and Over Stated Spontaneous 1,114 4,607 9,996 14,700 9,364 1,789 0 41,570
65.5 62.3 59.7 54.8 52.6 45.9 0.0 55.9 Breech/Forceps 7 49 105 144 101 20 0 426
0.4 0.7 0.6 0.5 0.6 0.5 0.0 0.6 Forceps 76 315 779 1,222 536 98 0 3,026 4.5 4.3 4.7 4.6 3.0 2.5 0.0 4.1 Vacuum extraction 247 968 2,139 3,203 1,644 290 1 8,492
14.5 13.1 12.8 11.9 9.2 7.4 100.0 11.4 Caesarean section 256 1,452 3,721 7,565 6,147 1,697 0 20,838
15.1 19.6 22.2 28.2 34.5 43.6 0.0 28.0 Other specified & combined
0 2 7 12 3 1 0 25 0.0 0.0 0.0 0.0 0.0 0.0 0.0 0.0
Total 1,700 7,393 16,747 26,846 17,795 3,895 1 74,377 100 100 100 100 100 100 100 100
0.0
10.0
20.0
30.0
40.0
50.0
60.0
70.0
Spontaneous Instrumental* Caesarean Section
Perc
enta
ge o
f Tot
al Li
ve B
irths
(%)
Method of Delivery
Total Live Births Singleton Live Births Multiple Live Births

64 | Perinata l Stat i st i cs Report 2011
FIGURE 4.5 Percentage of Total Births by Method of Delivery and Age of Mother
Notes: See Table 4.8b for data. * Instrumental delivery includes breech/forceps, forceps or vacuum extraction.
DISTRIBUTION OF BIRTHS BY SIZE OF MATERNITY UNIT
Analysis of births by size of maternity unit is based on births registered by either maternity hospitals or hospitals with dedicated maternity units. Table 4.9 presents data on the size of maternity units.
• Just over 44 per cent of total births took place in 15 maternity units accommodating between 1,000 and 3,999 births each annually.
• Four maternity units each accommodated 8,000 or more births accounting for almost 49 per cent of total births (see Figure 4.6).
TABLE 4.9 Size of Maternity Unit (Number of Live Births and Stillbirths Annually) by Number of Units: Total Births, Live Births, Stillbirths, Early Neonatal Deaths and Mortality Rates
Number
of Units Total Births
Total Births
%
Live Births
Stillbirths Stillbirth Rate*
Early Neonatal Deaths
Early Neonatal Mortality
Rate*
Perinatal Mortality
Rate*
Adjusted PMR*
1000-1999 5 7,586 10.2 7,556 30 4.0 14 1.9 5.8 4.1 2000-2999 8 17,956 24.2 17,880 76 4.2 22 1.2 5.5 3.9 3000-3999 2 7,238 9.8 7,213 25 3.5 17 2.4 5.8 4.3 5000-5999 1 5,164 7.0 5,133 31 6.0 15 2.9 8.9 5.8 8000 and Over 4 36,265 48.9 36,130 135 3.7 85 2.4 6.1 4.0 Total 20 74,209 100 73,912 297 4.0 153 2.1 6.1 4.2
Notes: * Rate per 1,000 births. For stillbirths, perinatal deaths and adjusted perinatal deaths, rates are calculated on total live births
and stillbirths. For early neonatal deaths, rates are calculated on total live births. There were 20 maternity units in Ireland in 2011, each of which delivered over 1,000 births per annum. No unit delivered between 4,000 and 4,999 or 6,000 and 7,999 births.
0.0
10.0
20.0
30.0
40.0
50.0
60.0
70.0
80.0
90.0
100.0
< 20 Years 20-24 Years 25-29 Years 30-34 Years 35-39 Years 40+ Years
Perc
enta
ge o
f Tot
al B
irths
(%)
Age of Mother
Spontaneous Instrumental* Caesarean Section

Perinatal Care | 65
FIGURE 4.6 Percentage Distribution of Births by Size of Maternity Unit, Total Births
Notes: See Table 4.9 for data. Percentages are subject to rounding The size of the unit refers to the number of live births and stillbirths occurring in 2011..
INTER-HOSPITAL TRANSFER OF INFANTS
Table 4.10 presents data on inter-hospital transfer of infants.
• Over 99 per cent of infants remained in the hospital in which they were born, just under 1 per cent of live births were transferred to another hospital for medical reasons.
• Less than 1 per cent of singleton births were transferred compared to 2.6 per cent of multiple births being transferred for medical reasons.
TABLE 4.10 Inter-Hospital Transfer of Infants
Live Births Per Cent Live Births Early Neonatal Deaths Early Neonatal Mortality Rate* Total Births Transferred 499 0.7 26 52.1 Not Transferred 73,408 99.3 127 1.7 Not Stated 5 0.0 0 0.0 Total 73,912 100 153 2.1 Singleton Births Transferred 428 0.6 24 56.1 Not Transferred 70,774 99.4 102 1.4 Not Stated 5 0.0 0 0.0 Total 71,207 100 126 1.8 Multiple Births Transferred 71 2.6 2 28.2 Not Transferred 2,634 97.4 25 9.5 Not Stated 0 0.0 0 0.0 Total 2,705 100 27 10.0
Notes: * Rate per 1,000 births. For early neonatal deaths, rates are calculated on total live births.
Domiciliary births, of which there were 168 live births, are excluded from this table. See Appendix H for detailed analysis.
10.2%
24.2%
9.8%
7.0%
48.9%
1,000-1,999
2,000-2,999
3,000-3,999
5,000-5,999
8,000 and Over

66 | Perinata l Stat i st i cs Report 2011
INFANT'S LENGTH OF STAY
Table 4.11 presents data relating to infant's length of stay in hospital.
• Over 54 per cent of singleton live births were discharged from hospital within 2 days, compared to just 9.9 per cent of multiple births (see Figure 4.7).
• Over 95 per cent of singleton live births were discharged from hospital within 5 days of birth, compared to 66.3 per cent of multiple live births.
• 5.3 per cent of total live births had a length of stay of 6 or more days.
TABLE 4.11 Infant's Length of Stay (days) in Hospital, Live Births
Live Births Per Cent Live Births Total Births 0-2 38,940 52.8 3-5 30,800 41.8 6-10 2,144 2.9 11-28 1,282 1.7 29 or more 509 0.7 Not Stated 84 0.1 Total 73,759 100 Singleton Births 0-2 38,677 54.4 3-5 29,305 41.2 6-10 1,802 2.5 11-28 881 1.2 29 or more 359 0.5 Not Stated 57 0.1 Total 71,081 100 Multiple Births 0-2 263 9.8 3-5 1,495 55.8 6-10 342 12.8 11-28 401 15.0 29 or more 150 5.6 Not Stated 27 1.0 Total 2,678 100
Note: This table does not include domiciliary births and early neonatal deaths.

Perinatal Care | 67
FIGURE 4.7 Percentage Distribution of Total Live Births by Infant's Length of Stay
Note: See Table 4.11 for data. 'Not Stated' values are not included in the calculation of percentages.
INFANT'S TYPE OF FEEDING
Type of feeding is recorded at the time of discharge from hospital or by midwife attending a domiciliary birth. The presentation of type of feeding in this report is based on live births only and excludes early neonatal deaths.
Table 4.12 presents type of feeding by age of mother.
• At 46.6 per cent, a slightly higher proportion of total births were breastfed23 compared to 44.8 per cent reporting artificial feeding.
• Artificial feeding is more common for multiple births (52.6 per cent for multiple births compared to 44.6 per cent for singleton births) while breastfeeding is more common for singleton births (47.3 per cent for singleton births compared to 27.4 per cent for multiple births).
• Breastfeeding was more common than artificial feeding amongst mothers aged between 25 years or more, with the highest proportion in the 30–34 year age group for whom 50.2 percent reported breastfeeding (see Figure 4.8).
• One-fifth (20.6 per cent) of infants born to mothers under 20 were exclusively breastfed.
23 Throughout this section, discussion of breastfeeding refers to exclusive breastfeeding only.
0.0
10.0
20.0
30.0
40.0
50.0
60.0
0-2 3-5 6-10 11-28 29 or more
Perc
enta
ge o
f Tot
al Li
ve B
irths
(%)
Infant's Length of Stay (Days)
Total Births Singleton Births Multiple Births

TABLE 4.12 Age of Mother by Infant's Type of Feeding, Numbers and Percentages, Total Live Births
Type of Feeding
Total Births Singleton Births Multiple Births
Frequency Row Per Cent Col. Per Cent
Artificial Breast Combined Not Stated
Total Artificial Breast Combined Not Stated
Total Artificial Breast Combined Not Stated
Total
Under 15 4 4 0 0 8 4 4 0 0 8 0 0 0 0 0 Years 50.0 50.0 0.0 0.0 100.0 50.0 50.0 0.0 0.0 100.0 0.0 0.0 0.0 0.0 0.0 0.0 0.0 0.0 0.0 0.0 0.0 0.0 0.0 0.0 0.0 0.0 0.0 0.0 0.0 0.0 15-19 Years 1,276 344 59 0 1,679 1,256 342 59 0 1,657 20 2 0 0 22 76.0 20.5 3.5 0.0 100.0 75.8 20.6 3.6 0.0 100.0 90.9 9.1 0.0 0.0 100 3.8 1.0 0.9 0.0 2.3 4.0 1.0 1.0 0.0 2.3 1.4 0.3 0.0 0.0 0.8 20-24 Years 4,486 2,386 459 1 7,332 4,433 2,361 442 1 7,237 53 25 17 0 95 61.2 32.5 6.3 0.0 100.0 61.3 32.6 6.1 0.0 100.0 55.8 26.3 17.9 0.0 100 13.5 6.9 7.2 33.3 9.9 14.0 7.0 7.6 33.3 10.2 3.8 3.4 3.2 0.0 3.5 25-29 Years 7,463 7,820 1,375 0 16,658 7,235 7,689 1,295 0 16,219 228 131 80 0 439 44.8 46.9 8.3 0.0 100.0 44.6 47.4 8.0 0.0 100.0 51.9 29.8 18.2 0.0 100 22.5 22.7 21.7 0.0 22.5 22.8 22.8 22.3 0.0 22.8 16.2 17.8 15.0 0.0 16.4 30-34 Years 10,915 13,394 2,389 1 26,699 10,415 13,117 2,189 1 25,722 500 277 200 0 977 40.9 50.2 8.9 0.0 100.0 40.5 51.0 8.5 0.0 100.0 51.2 28.4 20.5 0.0 100 32.9 38.9 37.7 33.3 36.1 32.8 38.9 37.7 33.3 36.1 35.5 37.7 37.4 0.0 36.5 35-39 Years 7,413 8,658 1,629 0 17,700 6,955 8,426 1,454 0 16,835 458 232 175 0 865 41.9 48.9 9.2 0.0 100.0 41.3 50.1 8.6 0.0 100.0 52.9 26.8 20.2 0.0 100 22.4 25.1 25.7 0.0 23.9 21.9 25.0 25.1 0.0 23.6 32.5 31.6 32.7 0.0 32.3 40-44 Years 1,532 1,754 401 1 3,688 1,408 1,694 345 1 3,448 124 60 56 0 240 41.5 47.6 10.9 0.0 100.0 40.8 49.1 10.0 0.0 100.0 51.7 25.0 23.3 0.0 100 4.6 5.1 6.3 33.3 5.0 4.4 5.0 5.9 33.3 4.8 8.8 8.2 10.5 0.0 9.0 45 Years and 60 80 22 0 162 35 72 15 0 122 25 8 7 0 40 Over 37.0 49.4 13.6 0.0 100.0 28.7 59.0 12.3 0.0 100.0 62.5 20.0 17.5 0.0 100 0.2 0.2 0.3 0.0 0.2 0.1 0.2 0.3 0.0 0.2 1.8 1.1 1.3 0.0 1.5 Not Stated 1 0 0 0 1 1 0 0 0 1 0 0 0 0 0 100.0 0.0 0.0 0.0 100.0 100.0 0.0 0.0 0.0 100.0 0.0 0.0 0.0 0.0 0.0 0.0 0.0 0.0 0.0 0.0 0.0 0.0 0.0 0.0 0.0 0.0 0.0 0.0 0.0 0.0 Total 33,150 34,440 6,334 3 73,927 31,742 33,705 5,799 3 71,249 1,408 735 535 0 2,678 44.8 46.6 8.6 0.0 100.0 44.6 47.3 8.1 0.0 100.0 52.6 27.4 20.0 0.0 100 100 100 100 100 100 100 100 100 100 100 100 100 100 0.0 100
Note: This table excludes Early Neonatal Deaths.
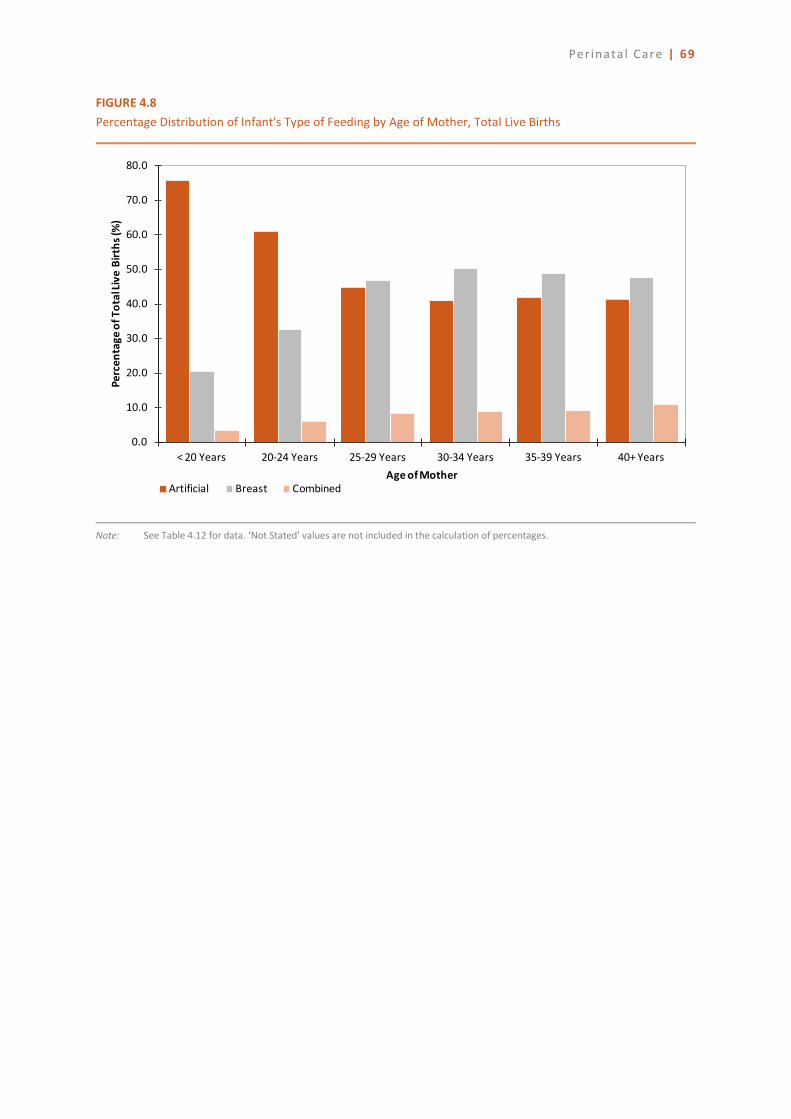
Perinatal Care | 69
FIGURE 4.8 Percentage Distribution of Infant's Type of Feeding by Age of Mother, Total Live Births
Note: See Table 4.12 for data. ‘Not Stated' values are not included in the calculation of percentages.
0.0
10.0
20.0
30.0
40.0
50.0
60.0
70.0
80.0
< 20 Years 20-24 Years 25-29 Years 30-34 Years 35-39 Years 40+ Years
Perc
enta
ge o
f Tot
al Li
ve B
irths
(%)
Age of MotherArtificial Breast Combined

70 | Perinata l Stat i st i cs Report 2011
Figure 4.9 presents the prevalence of exclusive breastfeeding by geographic location.
• Infants born to mothers resident in Waterford recorded the highest rate of breastfeeding at 56.3 per cent, closely followed by Dublin County and Cork (53.9 per cent and 52.9 per cent respectively).
• Other counties reporting exclusive breastfeeding rates of over 50 per cent include Kilkenny, Westmeath and Dublin City.
• Eastern and South-Eastern counties recorded exclusive breastfeeding rates in line with or above the national breastfeeding rate of 46.6 per cent.
FIGURE 4.9 Percentage Distribution of Breastfed Infants by Mother's County of Residence, Total Live Births
Notes: See Appendix G, Table G16 for data. 'Not Stated' values are not included in the calculation of percentages. Example: Of all live births to mothers resident in Dublin City 50.3 per cent were breastfed.

Perinatal Care | 71
Table 4.13 presents data on type of feeding by mother's occupation. • Breastfeeding was most common among mothers in ‘higher professional’ occupations (63.0 per
cent) and least common among ‘unemployed’ mothers (27.8 per cent).
• Artificial feeding was most common amongst the ‘unemployed’ mothers with a rate of 64.3 per cent and those whose occupation was recorded as ‘home duties’ (53.9 per cent).
• Lower rates of artificial feeding were found amongst ‘higher professionals’ (27.4 per cent) and ‘lower professionals’ (29.3 per cent) (see Figure 4.10).
TABLE 4.13 Mother's Occupation by Infant's Type of Feeding, Total Live Births
Type of Feeding
Frequency Artificial Breast Combined Not Stated Total Row Per Cent Col. Per Cent Farmers & Farm Managers 25 31 6 0 62
40.3 50.0 9.7 0.0 100
0.1 0.1 0.1 0.0 0.1
Other Agricultural Occupations & Fishermen 14 46 9 0 69
20.3 66.7 13.0 0.0 100
0.0 0.1 0.1 0.0 0.1
Higher Professional 1,368 3,143 479 0 4,990
27.4 63.0 9.6 0.0 100
4.1 9.1 7.6 0.0 6.7
Lower Professional 3,525 7,366 1,127 0 12,018
29.3 61.3 9.4 0.0 100
10.6 21.4 17.8 0.0 16.3
Employers & Managers 2,117 2,779 510 0 5,406
39.2 51.4 9.4 0.0 100
6.4 8.1 8.1 0.0 7.3
Salaried Employees 439 482 82 0 1,003
43.8 48.1 8.2 0.0 100
1.3 1.4 1.3 0.0 1.4
Intermediate Non-Manual Workers 7,872 6,424 1,117 0 15,413
51.1 41.7 7.2 0.0 100
23.7 18.7 17.6 0.0 20.8
Other Non-Manual Workers 4,848 4,340 849 1 10,038
48.3 43.2 8.5 0.0 100
14.6 12.6 13.4 33.3 13.6
Skilled Manual Workers 368 674 103 0 1,145
32.1 58.9 9.0 0.0 100
1.1 2.0 1.6 0.0 1.5
Semi-Skilled Manual Workers 889 1,193 222 0 2,304
38.6 51.8 9.6 0.0 100
2.7 3.5 3.5 0.0 3.1
Unskilled Manual Workers 3 6 0 0 9
33.3 66.7 0.0 0.0 100
0.0 0.0 0.0 0.0 0.0
Unemployed 1,982 858 243 1 3,084
64.3 27.8 7.9 0.0 100
6.0 2.5 3.8 33.3 4.2
Not Classifiable 1,358 1,155 348 1 2,862
47.4 40.4 12.2 0.0 100
4.1 3.4 5.5 33.3 3.9
Home Duties 8,204 5,816 1,193 0 15,213
53.9 38.2 7.8 0.0 100
24.7 16.9 18.8 0.0 20.6
Not Stated 138 127 46 0 311
44.4 40.8 14.8 0.0 100
0.4 0.4 0.7 0.0 0.4
Total 33,150 34,440 6,334 3 73,927
44.8 46.6 8.6 0.0 100
100 100 100 100 100
Notes: See Appendix C for a description of the classification system for occupation. This table excludes Early Neonatal Deaths.

72 | Perinata l Stat i st i cs Report 2011
FIGURE 4.10 Percentage Distribution of Infant's Type of Feeding by Mother's Occupation, Total Live Births
Notes: See Table 4.13 for data. 'Not Stated' values are not included in the calculation of percentages. Categories where percentages would be based on <100 births are not included.
Figure 4.11 presents the prevalence of exclusive breastfeeding by mother’s nationality.
• At 39.8 per cent, births to mothers from Ireland record the lowest proportion of breastfeeding, whilst births to mothers from the EU15 (excluding Ireland & UK) report the highest proportion of breastfeeding at 78.4 per cent.
• Births to mothers from the Rest of Europe, Australia and the EU15 to EU27 each record breastfeeding percentages of over 75 per cent.
• Similar breastfeeding rates are reported for mothers from Africa and the UK at just over 50 per cent.
0.0 20.0 40.0 60.0 80.0 100.0
Home Duties
Not Classifiable
Unemployed
Semi-Skilled Manual Workers
Skilled Manual Workers
Other Non-Manual Workers
Intermediate Non-Manual Workers
Salaried Employees
Employers & Managers
Lower Professional
Higher Professional
Percentage of Total Live Births (%)
Mot
her's
Occ
upat
ion
Artificial Breast Combined

Perinatal Care | 73
FIGURE 4.11 Percentage Distribution of Breastfed Infants by Mother's Nationality, Total Live Births
Notes: See Appendix G, Table G17 for data. 'Not Stated' values are not included in the calculation of percentages. Categories where percentages would be based on <100 live births are not included.
0.0
10.0
20.0
30.0
40.0
50.0
60.0
70.0
80.0
Ireland UK EU15 (excluding Ireland &
UK)
EU15 to EU27
Rest of Europe
Africa Asia America Australia
Perc
enta
ge o
f Tot
al Li
ve B
irths
(%)
Mother's Nationality
National PercentageBreastfeeding=46.6%


SECTION FIVE
PERINATAL OUTCOMES

76| Perin ata l S tat i st i cs Report 2011
INTRODUCTION
This section presents a detailed review of aspects of perinatal outcomes for the infant. Cause of death is examined according to the guidelines set out by the WHO in the International Classification of Diseases (ICD-10).24 A detailed description of cause of death classification and coding rules applied is available in Appendix D.
Of the 74,377 births recorded by the NPRS in 2011, 297 were stillbirths and 153 were early neonatal deaths, giving a total of 450 perinatal deaths and a perinatal mortality rate of 6.1 per 1,000 live births and stillbirths.
The number of perinatal deaths are broken down by type of death (antepartum and intrapartum stillbirths and early neonatal deaths), with tables presenting data in relation to
• birthweight distribution by parity and cause of death
• gestational age at delivery and cause of death
• cause of death categorised by ICD-10 codes
• age at death for early neonatal deaths
• post-mortem examinations.
MORTALITY BY BIRTHWEIGHT AND PARITY
Table 5.1 presents mortality rates by birthweight and parity. 25,26
• Approximately 71 per cent of total perinatal deaths weighed less than 2,500 grams (72.3 per cent for primiparous women and 69.7 per cent for multiparous women) (see Figure 5.1).
• The perinatal mortality rate for low birthweight babies (weighing less than 2,500 grams) was 78.3 per 1,000 live births and stillbirths (71.3 per 1,000 for primiparous women and 85.7 per 1,000 for multiparous women).
• For births weighing 2,500 grams or more the perinatal mortality rate was 1.8 per 1,000 live births and stillbirths (2.1 for primiparous women and 1.7 for multiparous women).
• The highest perinatal mortality rate for all births was recorded for births weighing between 500–749 grams at 628.4 per 1,000 live births (see Figure 5.2).
24 World Health Organisation, 2005, International Statistical Classification of Diseases and Related Health Problems, 10th
Revision, Vols. 1-3. Geneva: World Health Organisation 25 Throughout this section, ‘Not Stated’ values are not included in the calculation of percentages for discussion. 26 For details of birthweight by plurality for total births, antepartum and intrapartum stillbirths, early neonatal deaths and
associated rates see Appendix G, Table G18
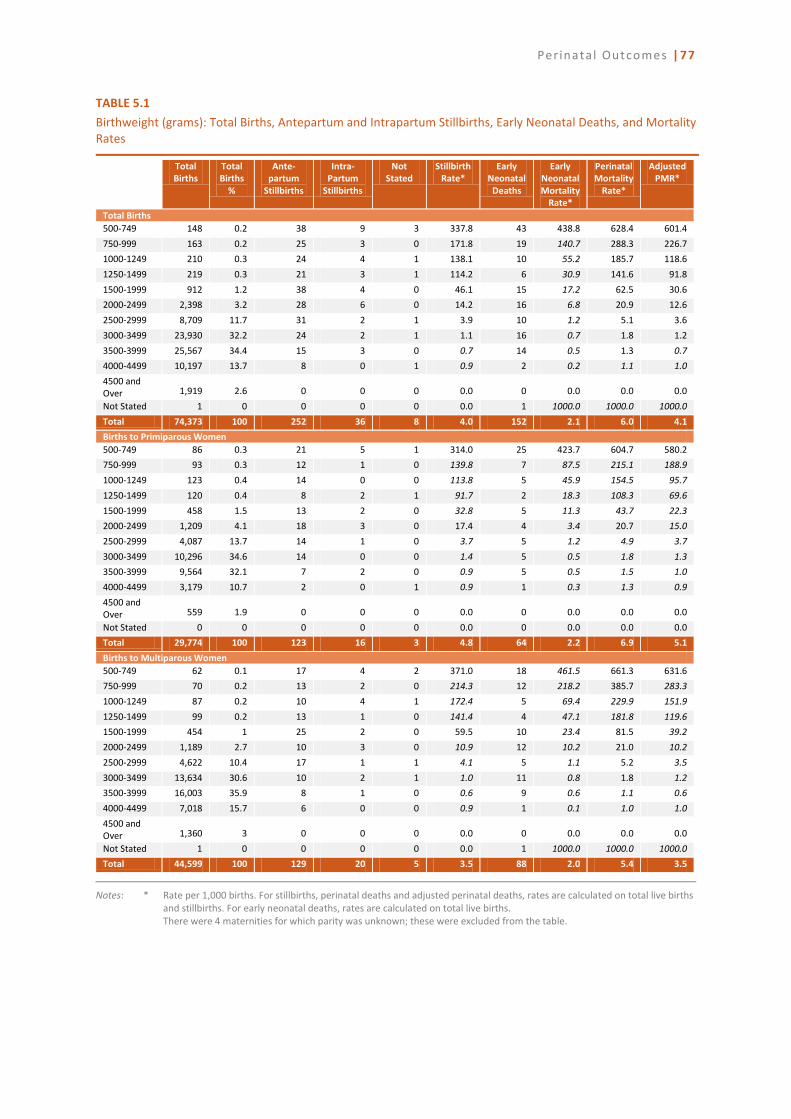
Perinatal Outcomes |77
TABLE 5.1 Birthweight (grams): Total Births, Antepartum and Intrapartum Stillbirths, Early Neonatal Deaths, and Mortality Rates
Total
Births Total Births
%
Ante- partum
Stillbirths
Intra- Partum
Stillbirths
Not Stated
Stillbirth Rate*
Early Neonatal
Deaths
Early Neonatal Mortality
Rate*
Perinatal Mortality
Rate*
Adjusted PMR*
Total Births 500-749 148 0.2 38 9 3 337.8 43 438.8 628.4 601.4 750-999 163 0.2 25 3 0 171.8 19 140.7 288.3 226.7 1000-1249 210 0.3 24 4 1 138.1 10 55.2 185.7 118.6 1250-1499 219 0.3 21 3 1 114.2 6 30.9 141.6 91.8 1500-1999 912 1.2 38 4 0 46.1 15 17.2 62.5 30.6 2000-2499 2,398 3.2 28 6 0 14.2 16 6.8 20.9 12.6 2500-2999 8,709 11.7 31 2 1 3.9 10 1.2 5.1 3.6 3000-3499 23,930 32.2 24 2 1 1.1 16 0.7 1.8 1.2 3500-3999 25,567 34.4 15 3 0 0.7 14 0.5 1.3 0.7 4000-4499 10,197 13.7 8 0 1 0.9 2 0.2 1.1 1.0 4500 and Over 1,919 2.6 0 0 0 0.0 0 0.0 0.0 0.0 Not Stated 1 0 0 0 0 0.0 1 1000.0 1000.0 1000.0 Total 74,373 100 252 36 8 4.0 152 2.1 6.0 4.1 Births to Primiparous Women 500-749 86 0.3 21 5 1 314.0 25 423.7 604.7 580.2 750-999 93 0.3 12 1 0 139.8 7 87.5 215.1 188.9 1000-1249 123 0.4 14 0 0 113.8 5 45.9 154.5 95.7 1250-1499 120 0.4 8 2 1 91.7 2 18.3 108.3 69.6 1500-1999 458 1.5 13 2 0 32.8 5 11.3 43.7 22.3 2000-2499 1,209 4.1 18 3 0 17.4 4 3.4 20.7 15.0 2500-2999 4,087 13.7 14 1 0 3.7 5 1.2 4.9 3.7 3000-3499 10,296 34.6 14 0 0 1.4 5 0.5 1.8 1.3 3500-3999 9,564 32.1 7 2 0 0.9 5 0.5 1.5 1.0 4000-4499 3,179 10.7 2 0 1 0.9 1 0.3 1.3 0.9 4500 and Over 559 1.9 0 0 0 0.0 0 0.0 0.0 0.0 Not Stated 0 0 0 0 0 0.0 0 0.0 0.0 0.0 Total 29,774 100 123 16 3 4.8 64 2.2 6.9 5.1 Births to Multiparous Women 500-749 62 0.1 17 4 2 371.0 18 461.5 661.3 631.6 750-999 70 0.2 13 2 0 214.3 12 218.2 385.7 283.3 1000-1249 87 0.2 10 4 1 172.4 5 69.4 229.9 151.9 1250-1499 99 0.2 13 1 0 141.4 4 47.1 181.8 119.6 1500-1999 454 1 25 2 0 59.5 10 23.4 81.5 39.2 2000-2499 1,189 2.7 10 3 0 10.9 12 10.2 21.0 10.2 2500-2999 4,622 10.4 17 1 1 4.1 5 1.1 5.2 3.5 3000-3499 13,634 30.6 10 2 1 1.0 11 0.8 1.8 1.2 3500-3999 16,003 35.9 8 1 0 0.6 9 0.6 1.1 0.6 4000-4499 7,018 15.7 6 0 0 0.9 1 0.1 1.0 1.0 4500 and Over 1,360 3 0 0 0 0.0 0 0.0 0.0 0.0 Not Stated 1 0 0 0 0 0.0 1 1000.0 1000.0 1000.0 Total 44,599 100 129 20 5 3.5 88 2.0 5.4 3.5
Notes: * Rate per 1,000 births. For stillbirths, perinatal deaths and adjusted perinatal deaths, rates are calculated on total live births
and stillbirths. For early neonatal deaths, rates are calculated on total live births. There were 4 maternities for which parity was unknown; these were excluded from the table.

78| Perin ata l S tat i st i cs Report 2011
FIGURE 5.1 Deaths by Birthweight Groups and Parity
Total Births
Births to Primiparous Women
Births to Multiparous Women
Note: See Table 5.1 for data. ‘Not Stated’ values are not included in the calculation of percentages.
0.0
10.0
20.0
30.0
40.0
50.0
60.0
70.0
80.0
90.0
100.0
Early Neonatal Deaths Stillbirths Total Perinatal Deaths
Perc
enta
ge of
Dea
ths (
%)
Type of Death
<1500g 1500-2499g 2500-3499g 3500g+
0.0
10.0
20.0
30.0
40.0
50.0
60.0
70.0
80.0
90.0
100.0
Early Neonatal Deaths Stillbirths Total Perinatal Deaths
Perc
enta
ge of
Dea
ths (
%)
Type of Death
<1500g 1500-2499g 2500-3499g 3500g+
0.0
10.0
20.0
30.0
40.0
50.0
60.0
70.0
80.0
90.0
100.0
Early Neonatal Deaths Stillbirths Total Perinatal Deaths
Perc
enta
ge o
f Dea
ths (
%)
Type of Death
<1500g 1500-2499g 2500-3499g 3500g+

Perinatal Outcomes |79
FIGURE 5.2 Perinatal Mortality Rates by Birthweight, Total Births
Note: See Table 5.1 for data. Rates based on 20 or fewer observations are not included in this Figure.
CAUSE OF DEATH BY BIRTHWEIGHT
Cause of death data are recorded using the WHO ICD-10 classification.27 Under this system, the main cause of death is defined as the pathological condition of the infant or foetus which, in the opinion of the certifier, made the greatest contribution towards the death.28
Table 5.2 presents cause of death by birthweight for total, singleton and multiple births.
• Foetus and newborn affected by maternal factors and by complications of pregnancy, labour and delivery (P00-P04) accounted for the largest proportion of total perinatal deaths (21.6 per cent).
• Over 70 per cent of total perinatal deaths weighed <2,500 grams, and of these 31.8 per cent were due to congenital malformations (Q00-Q99), followed by immaturity (P05-P08) and maternal factors (P00-P04), each accounting for almost 20 per cent (see Figure 5.3).
• Almost three in ten perinatal deaths weighed ≥2,500 grams, and of these 31.3 per cent recorded cause of death due to congenital malformations (Q00-Q99), and 26.7 per cent were due to maternal factors (P00-P04) (see Figure 5.4).
27 World Health Organisation, op. cit. 28 See Appendix D for more detail.
0.0
100.0
200.0
300.0
400.0
500.0
600.0
700.0
500-749 750-999 1000-1249 1250-1499 1500-1999 2000-2499 2500-2999 3000-3499 3500-3999
Perin
atal
Mor
talit
y Ra
tes
(per
1,0
00 L
ive
Birt
hs a
nd S
tillb
irths
)
Birthweight (grams)
Perinatal Mortality Rate Adjusted PMR

TABLE 5.2 Total Births: Cause of Death by ICD-10 Chapter by Birthweight, Numbers and Perinatal Mortality Rate
ICD-10 Code Birthweight (grams)
Number Rate per 1,000 Live Births and Stillbirths
500 -749
750 - 999
1000 - 1249
1250 - 1499
1500 - 1999
2000 - 2499
2500 - 2999
3000 - 3499
3500 - 3999
4000 - 4499
4500 and Over
Not Stated
Total
Foetus and newborn affected by maternal factors and by complications of pregnancy, labour and delivery
P00-P04 16 8 8 9 9 12 12 13 8 2 0 0 97 108.1 49.1 38.1 41.1 9.9 5.0 1.4 0.5 0.3 0.2 0.0 0.0 1.3
Disorders related to length of gestation and foetal growth P05-P08 40 9 5 3 3 3 2 0 0 0 0 1 66 270.3 55.2 23.8 13.7 3.3 1.3 0.2 0.0 0.0 0.0 0.0 1000.0 0.9
Respiratory and cardiovascular disorders specific to the perinatal period
P20-P29 6 7 4 2 5 6 4 7 6 0 0 0 47 40.5 42.9 19.0 9.1 5.5 2.5 0.5 0.3 0.2 0.0 0.0 0.0 0.6
Infections specific to the perinatal period P35-P39 2 2 1 1 0 1 0 0 1 1 0 0 9 13.5 12.3 4.8 4.6 0.0 0.4 0.0 0.0 0.0 0.1 0.0 0.0 0.1
Haemorrhagic and haematological disorders of foetus and newborn
P50-P61 3 0 0 1 1 0 4 0 0 0 0 0 9 20.3 0.0 0.0 4.6 1.1 0.0 0.5 0.0 0.0 0.0 0.0 0.0 0.1
Transitory endocrine and metabolic disorders specific to foetus and newborn
P70-P74 1 1 0 0 0 0 0 0 1 2 0 0 5 6.8 6.1 0.0 0.0 0.0 0.0 0.0 0.0 0.0 0.2 0.0 0.0 0.1
Digestive system disorders of foetus and newborn P75-P78 1 0 0 0 0 0 0 0 0 0 0 0 1 6.8 0.0 0.0 0.0 0.0 0.0 0.0 0.0 0.0 0.0 0.0 0.0 0.0
Conditions involving the integument and temperature regulation of foetus and newborn
P80-P83 2 3 0 0 2 0 0 1 0 1 0 0 9 13.5 18.4 0.0 0.0 2.2 0.0 0.0 0.0 0.0 0.1 0.0 0.0 0.1
Other disorders originating in the perinatal period P90.0-P94.9, P96.0-P96.8
0 0 0 0 0 0 1 1 0 1 0 0 3 0.0 0.0 0.0 0.0 0.0 0.0 0.1 0.0 0.0 0.1 0.0 0.0 0.0
Foetal death of unspecified cause, Condition originating in the perinatal period, unspecified
P95, P96.9 12 4 5 3 8 8 8 7 4 3 0 0 62 81.1 24.5 23.8 13.7 8.8 3.3 0.9 0.3 0.2 0.3 0.0 0.0 0.8
Congenital malformations of the nervous system Q00-Q07 2 3 6 2 2 5 4 2 4 0 0 0 30 13.5 18.4 28.6 9.1 2.2 2.1 0.5 0.1 0.2 0.0 0.0 0.0 0.4
Congenital malformations of the circulatory system Q20-Q28 1 0 0 0 6 3 0 7 1 0 0 0 18 6.8 0.0 0.0 0.0 6.6 1.3 0.0 0.3 0.0 0.0 0.0 0.0 0.2
Congenital malformations of the respiratory system Q30-Q34 0 0 1 0 0 2 0 0 0 0 0 0 3 0.0 0.0 4.8 0.0 0.0 0.8 0.0 0.0 0.0 0.0 0.0 0.0 0.0
Cleft lip and cleft palate Q35-Q37 0 0 0 0 0 1 0 0 0 0 0 0 1 0.0 0.0 0.0 0.0 0.0 0.4 0.0 0.0 0.0 0.0 0.0 0.0 0.0 Other congenital malformations of the digestive system Q38-Q45 0 1 0 2 1 0 1 0 1 0 0 0 6
0.0 6.1 0.0 9.1 1.1 0.0 0.1 0.0 0.0 0.0 0.0 0.0 0.1 Congenital malformations of genital organs Q50-Q56 1 0 1 0 0 0 0 0 0 0 0 0 2 6.8 0.0 4.8 0.0 0.0 0.0 0.0 0.0 0.0 0.0 0.0 0.0 0.0 Congenital malformations of the urinary system Q60-Q64 0 0 0 0 1 2 3 1 1 0 0 0 8
0.0 0.0 0.0 0.0 1.1 0.8 0.3 0.0 0.0 0.0 0.0 0.0 0.1 Congenital malformations and deformations of the musculoskeletal system
Q65-Q79 1 1 2 0 1 0 1 1 1 0 0 0 8 6.8 6.1 9.5 0.0 1.1 0.0 0.1 0.0 0.0 0.0 0.0 0.0 0.1
Other congenital malformations Q80-Q89 3 2 1 2 5 1 1 0 3 1 0 0 19 20.3 12.3 4.8 9.1 5.5 0.4 0.1 0.0 0.1 0.1 0.0 0.0 0.3
Chromosomal abnormalities, not elsewhere classified Q90-Q99 2 6 5 6 14 6 3 3 2 0 0 0 47 13.5 36.8 23.8 27.4 15.3 2.5 0.3 0.1 0.1 0.0 0.0 0.0 0.6
Total
93 47 39 31 58 50 44 43 33 11 0 1 450 628.4 288.3 185.7 141.6 63.5 20.9 5.1 1.8 1.3 1.1 0.0 1000.0 6.1

TABLE 5.2 Singleton Births: Cause of Death by ICD-10 Chapter by Birthweight, Numbers and Perinatal Mortality Rate
ICD-10 Code Birthweight (grams)
Number Rate per 1,000 Live Births and Stillbirths
500 - 749
750 - 999
1000 - 1249
1250 - 1499
1500 - 1999
2000 - 2499
2500 - 2999
3000 - 3499
3500 - 3999
4000 - 4499
4500 and Over
Not Stated
Total
Foetus and newborn affected by maternal factors and by complications of pregnancy, labour and delivery
P00-P04 14 7 8 8 5 12 12 13 8 2 0 0 89 117.6 56.0 54.8 54.8 9.1 7.1 1.6 0.6 0.3 0.2 0.0 0.0 1.2
Disorders related to length of gestation and foetal growth
P05-P08 32 6 4 2 3 3 2 0 0 0 0 1 53 268.9 48.0 27.4 13.7 5.4 1.8 0.3 0.0 0.0 0.0 0.0 1000.0 0.7
Respiratory and cardiovascular disorders specific to the perinatal period
P20-P29 5 5 3 2 5 6 4 7 6 0 0 0 43 42.0 40.0 20.5 13.7 9.1 3.5 0.5 0.3 0.2 0.0 0.0 0.0 0.6
Infections specific to the perinatal period P35-P39 2 2 1 0 0 1 0 0 1 1 0 0 8 16.8 16.0 6.8 0.0 0.0 0.6 0.0 0.0 0.0 0.1 0.0 0.0 0.1
Haemorrhagic and haematological disorders of foetus and newborn
P50-P61 3 0 0 0 1 0 4 0 0 0 0 0 8 25.2 0.0 0.0 0.0 1.8 0.0 0.5 0.0 0.0 0.0 0.0 0.0 0.1
Transitory endocrine and metabolic disorders specific to foetus and newborn
P70-P74 1 1 0 0 0 0 0 0 1 2 0 0 5 8.4 8.0 0.0 0.0 0.0 0.0 0.0 0.0 0.0 0.2 0.0 0.0 0.1
Digestive system disorders of foetus and newborn P75-P78 1 0 0 0 0 0 0 0 0 0 0 0 1 8.4 0.0 0.0 0.0 0.0 0.0 0.0 0.0 0.0 0.0 0.0 0.0 0.0
Conditions involving the integument and temperature regulation of foetus and newborn
P80-P83 2 3 0 0 2 0 0 1 0 1 0 0 9 16.8 24.0 0.0 0.0 3.6 0.0 0.0 0.0 0.0 0.1 0.0 0.0 0.1
Other disorders originating in the perinatal period P90.0-P94.9, P96.0-P96.8
0 0 0 0 0 0 1 0 0 1 0 0 2 0.0 0.0 0.0 0.0 0.0 0.0 0.1 0.0 0.0 0.1 0.0 0.0 0.0
Foetal death of unspecified cause, Condition originating in the perinatal period, unspecified
P95, P96.9 9 2 5 3 8 8 8 7 4 3 0 0 57 75.6 16.0 34.2 20.5 14.5 4.7 1.0 0.3 0.2 0.3 0.0 0.0 0.8
Congenital malformations of the nervous system Q00-Q07 2 2 3 2 2 5 3 2 4 0 0 0 25 16.8 16.0 20.5 13.7 3.6 2.9 0.4 0.1 0.2 0.0 0.0 0.0 0.3
Congenital malformations of the circulatory system Q20-Q28 1 0 0 0 5 2 0 7 1 0 0 0 16 8.4 0.0 0.0 0.0 9.1 1.2 0.0 0.3 0.0 0.0 0.0 0.0 0.2
Congenital malformations of the respiratory system Q30-Q34 0 0 1 0 0 2 0 0 0 0 0 0 3 0.0 0.0 6.8 0.0 0.0 1.2 0.0 0.0 0.0 0.0 0.0 0.0 0.0
Cleft lip and cleft palate Q35-Q37 0 0 0 0 0 1 0 0 0 0 0 0 1 0.0 0.0 0.0 0.0 0.0 0.6 0.0 0.0 0.0 0.0 0.0 0.0 0.0 Other congenital malformations of the digestive system Q38-Q45 0 1 0 1 1 0 1 0 1 0 0 0 5
0.0 8.0 0.0 6.8 1.8 0.0 0.1 0.0 0.0 0.0 0.0 0.0 0.1 Congenital malformations of genital organs Q50-Q56 1 0 0 0 0 0 0 0 0 0 0 0 1 8.4 0.0 0.0 0.0 0.0 0.0 0.0 0.0 0.0 0.0 0.0 0.0 0.0 Congenital malformations of the urinary system Q60-Q64 0 0 0 0 1 2 3 1 1 0 0 0 8
0.0 0.0 0.0 0.0 1.8 1.2 0.4 0.0 0.0 0.0 0.0 0.0 0.1 Congenital malformations and deformations of the musculoskeletal system
Q65-Q79 1 1 2 0 1 0 1 1 1 0 0 0 8 8.4 8.0 13.7 0.0 1.8 0.0 0.1 0.0 0.0 0.0 0.0 0.0 0.1
Other congenital malformations Q80-Q89 2 2 0 2 4 1 1 0 1 1 0 0 14 16.8 16.0 0.0 13.7 7.3 0.6 0.1 0.0 0.0 0.1 0.0 0.0 0.2
Chromosomal abnormalities, not elsewhere classified Q90-Q99 2 6 4 6 14 6 3 3 2 0 0 0 46 16.8 48.0 27.4 41.1 25.4 3.5 0.4 0.1 0.1 0.0 0.0 0.0 0.6
Total 78 38 31 26 52 49 43 42 31 11 0 1 402 655.5 304.0 212.3 178.1 94.4 28.8 5.6 1.8 1.2 1.1 0.0 1000.0 5.6

TABLE 5.2 Multiple Births: Cause of Death by ICD-10 Chapter by Birthweight, Numbers and Perinatal Mortality Rate
ICD-10 Code Birthweight (grams)
Number Rate per 1,000 Live Births and Stillbirths
500 - 749
750 - 999
1000 - 1249
1250 - 1499
1500 - 1999
2000 - 2499
2500 - 2999
3000 - 3499
3500 - 3999
4000 - 4499
4500 and Over
Not Stated
Total
Foetus and newborn affected by maternal factors and by complications of pregnancy, labour and delivery
P00-P04 2 1 0 1 4 0 0 0 0 0 0 0 8
69.0 26.3 0.0 13.7 11.0 0.0 0.0 0.0 0.0 0.0 0.0 0.0 2.9 Disorders related to length of gestation and foetal growth
P05-P08 8 3 1 1 0 0 0 0 0 0 0 0 13 275.9 78.9 15.6 13.7 0.0 0.0 0.0 0.0 0.0 0.0 0.0 0.0 4.8
Respiratory and cardiovascular disorders specific to the perinatal period
P20-P29 1 2 1 0 0 0 0 0 0 0 0 0 4 34.5 52.6 15.6 0.0 0.0 0.0 0.0 0.0 0.0 0.0 0.0 0.0 1.5
Infections specific to the perinatal period P35-P39 0 0 0 1 0 0 0 0 0 0 0 0 1 0.0 0.0 0.0 13.7 0.0 0.0 0.0 0.0 0.0 0.0 0.0 0.0 0.4
Haemorrhagic and haematological disorders of foetus and newborn
P50-P61 0 0 0 1 0 0 0 0 0 0 0 0 1 0.0 0.0 0.0 13.7 0.0 0.0 0.0 0.0 0.0 0.0 0.0 0.0 0.4
Other disorders originating in the perinatal period P90.0-P94.9, P96.0-P96.8
0 0 0 0 0 0 0 1 0 0 0 0 1 0.0 0.0 0.0 0.0 0.0 0.0 0.0 2.4 0.0 0.0 0.0 0.0 0.4
Foetal death of unspecified cause, Condition originating in the perinatal period, unspecified
P95, P96.9 3 2 0 0 0 0 0 0 0 0 0 0 5 103.4 52.6 0.0 0.0 0.0 0.0 0.0 0.0 0.0 0.0 0.0 0.0 1.8
Congenital malformations of the nervous system Q00-Q07 0 1 3 0 0 0 1 0 0 0 0 0 5
0.0 26.3 46.9 0.0 0.0 0.0 1.0 0.0 0.0 0.0 0.0 0.0 1.8 Congenital malformations of the circulatory system
Q20-Q28 0 0 0 0 1 1 0 0 0 0 0 0 2 0.0 0.0 0.0 0.0 2.8 1.4 0.0 0.0 0.0 0.0 0.0 0.0 0.7
Other congenital malformations of the digestive system
Q38-Q45 0 0 0 1 0 0 0 0 0 0 0 0 1 0.0 0.0 0.0 13.7 0.0 0.0 0.0 0.0 0.0 0.0 0.0 0.0 0.4
Congenital malformations of genital organs Q50-Q56 0 0 1 0 0 0 0 0 0 0 0 0 1 0.0 0.0 15.6 0.0 0.0 0.0 0.0 0.0 0.0 0.0 0.0 0.0 0.4
Other congenital malformations
Q80-Q89
1 0 1 0 1 0 0 0 2 0 0 0 5 34.5 0.0 15.6 0.0 2.8 0.0 0.0 0.0 37.0 0.0 0.0 0.0 1.8
Chromosomal abnormalities, not elsewhere classified
Q90-Q99 0 0 1 0 0 0 0 0 0 0 0 0 1 0.0 0.0 15.6 0.0 0.0 0.0 0.0 0.0 0.0 0.0 0.0 0.0 0.4
Total 15 9 8 5 6 1 1 1 2 0 0 0 48 517.2 236.8 125.0 68.5 16.6 1.4 1.0 2.4 37.0 0.0 0.0 0.0 17.6

Perinatal Outcomes |83
FIGURE 5.3 Total Deaths with Birthweight < 2,500 grams by Cause of Death
Note: See Table 5.2 for data. ‘Not Stated’ values are not included in the calculation of percentages.
FIGURE 5.4 Total Deaths with Birthweight ≥ 2,500 grams by Cause of Death
Note: See note to Figure 5.3.
19.5%
19.8%
9.4%12.6%
31.8%
6.9%
Maternal factors (P00-P04)
Immaturity (P05-P08)
Respiratory/cardiovascular disorders (P20-P29)
Unspecified/Unexplained (P95,P96.9)
Congenital malformations (Q00-Q99)
All other specific causes
Total Deaths < 2,500g: 318
26.7%
1.5%
13.0%
16.8%
31.3%
10.7%
Maternal factors (P00-P04)
Immaturity (P05-P08)
Respiratory/cardiovascular disorders (P20-P29)
Unspecified/Unexplained (P95,P96.9)
Congenital malformations (Q00-Q99)
All other specific causes
Total Deaths ≥ 2,500g: 131

84| Perin ata l S tat i st i cs Report 2011
MORTALITY BY GESTATIONAL AGE
Table 5.3 presents data on mortality by gestational age.
• Prematurity29 has a significant impact on stillbirth and early neonatal mortality rates with just over two-thirds of total perinatal deaths born preterm.30
• 65.4 per cent of singleton perinatal deaths and 91.7 per cent of multiple perinatal deaths were preterm (see Figure 5.5).
• The perinatal mortality rate for babies born before 37 completed weeks of gestation was 67.5 per 1,000 live births and stillbirths (81.3 per 1,000 singleton births and 33.6 per 1,000 multiple births).
• For babies born at 37 or more completed weeks of gestation, perinatal mortality rate was 2.0 per 1,000 live births and stillbirths (2.0 for singleton births and 2.8 per 1,000 multiple births).
TABLE 5.3 Gestational Age (weeks): Total Births, Antepartum and Intrapartum Stillbirths, Early Neonatal Deaths, and Mortality Rates
Total
Births Total Births
%
Ante- Partum
Stillbirths
Intra- Partum
Stillbirths
Not Stated
Stillbirth Rate*
Early Neonatal
Deaths
Early Neonatal Mortality
Rate*
Perinatal Mortality
Rate*
Adjusted PMR*
Total Births Less than 28 308 0.4 51 12 3 214.3 59 243.8 405.8 385.9 28-31 533 0.7 47 3 2 97.6 13 27.0 122.0 84.1 32-36 3,680 4.9 68 10 0 21.2 37 10.3 31.3 16.6 37-41 67,524 90.8 83 9 2 1.4 39 0.6 2.0 1.2 42 and Over 2,324 3.1 2 1 1 1.7 5 2.2 3.9 2.6 Not Stated 8 0 2 1 0 375.0 0 0.0 375.0 375.0 Total 74,377 100 253 36 8 4.0 153 2.1 6.1 4.1 Singleton Births Less than 28 238 0.3 45 11 3 247.9 45 251.4 437.0 412.3 28-31 363 0.5 40 3 2 124.0 9 28.3 148.8 112.1 32-36 2,611 3.6 62 10 0 27.6 31 12.2 39.4 20.7 37-41 66,107 92.3 82 9 2 1.4 36 0.5 2.0 1.2 42 and Over 2,324 3.2 2 1 1 1.7 5 2.2 3.9 2.6 Not Stated 8 0 2 1 0 375.0 0 0.0 375.0 375.0 Total 71,651 100 233 35 8 3.9 126 1.8 5.6 3.8 Multiple Births Less than 28 70 2.6 6 1 0 100.0 14 222.2 300.0 300.0 28-31 170 6.2 7 0 0 41.2 4 24.5 64.7 24.5 32-36 1,069 39.2 6 0 0 5.6 6 5.6 11.2 6.6 37-41 1,417 52 1 0 0 0.7 3 2.1 2.8 0.7 42 and Over 0 0 0 0 0 0.0 0 0.0 0.0 0.0 Not Stated 0 0 0 0 0 0.0 0 0.0 0.0 0.0 Total 2,726 100 20 1 0 7.7 27 10.0 17.6 12.2
Note: * Rate per 1,000 births. For stillbirths, perinatal deaths and adjusted perinatal deaths, rates are calculated on total live births
and stillbirths. For early neonatal deaths, rates are calculated on total live births.
29 Defined as less than 37 completed weeks of gestation. 30 In 2011, 6.1 per cent of total births were pre-term.

Perinatal Outcomes |85
FIGURE 5.5 Deaths by Gestational Age (weeks), Total, Singleton and Multiple Births Total Births
Singleton Births
Multiple Births
Note: See Table 5.3 for data. ‘Not Stated’ values are not included in the calculation of percentages.
0.0
10.0
20.0
30.0
40.0
50.0
60.0
70.0
80.0
90.0
100.0
Early Neonatal Deaths Stillbirths Total Perinatal Deaths
Perce
ntag
e of D
eath
s (%)
Type of Death
< 28 weeks 28-31 weeks 32-36 weeks 37-41 weeks 42+ weeks
0.0
10.0
20.0
30.0
40.0
50.0
60.0
70.0
80.0
90.0
100.0
Early Neonatal Deaths Stillbirths Total Perinatal Deaths
Perce
ntag
e of D
eath
s (%)
Type of Death
< 28 weeks 28-31 weeks 32-36 weeks 37-41 weeks 42+ weeks
0.0
10.0
20.0
30.0
40.0
50.0
60.0
70.0
80.0
90.0
100.0
Early Neonatal Deaths Stillbirths Total Perinatal Deaths
Perce
ntag
e of D
eath
s (%)
Type of Death
< 28 weeks 28-31 weeks 32-36 weeks 37-41 weeks 42+ weeks

86| Perin ata l S tat i st i cs Report 2011
Figure 5.6 shows the perinatal mortality rates by gestational age at delivery for total births, illustrating the higher rates associated with lower gestational age.
FIGURE 5.6 Perinatal Mortality Rates by Gestational Age (weeks) at Delivery, Total Births
Note: See Table 5.3 for data. Rates based on 20 or fewer observations are not included in this Figure.
CAUSE OF DEATH
Cause of death data for stillbirths, early neonatal deaths and total perinatal deaths are presented in Table 5.4. In 2011, 13.8 per cent of total perinatal deaths were classified as ‘unspecified/unexplained’. The fact that almost 60 per cent of all perinatal deaths in Ireland do not undergo post-mortem may be a contributing factor to the numbers assigned to this category (see Table 5.6). This finding is not unique to Ireland, however, as many countries report high percentages of unexplained deaths in the perinatal period.
0.0
50.0
100.0
150.0
200.0
250.0
300.0
350.0
400.0
450.0
500.0
Less than 28 28-31 32-36 37-41
Perin
atal
Mor
talit
y Ra
tes
(per
1,0
00 L
ive
Birt
hs a
nd S
tillb
irths
)
Gestational Age (weeks)
Perinatal Mortality Rate Adjusted PMR

TABLE 5.4 Cause of Death by ICD-10 Chapter and Subcategories, Numbers and Mortality Rates
ICD-10 Code Total Deaths Singleton Deaths Multiple Deaths
Stillbirths Early Neonatal Deaths
Total Perinatal Deaths
Stillbirths Early Neonatal Deaths
Total Perinatal Deaths
Stillbirths Early Neonatal Deaths
Total Perinatal Deaths
N Rate N Rate N Rate N Rate N Rate N Rate N Rate N Rate N Rate Foetus and newborn affected by maternal factors and by complications of pregnancy, labour and delivery
P00-P04 92 1.2 5 0.1 97 1.3 84 1.2 5 0.1 89 1.2 8 2.9 0 0.0 8 2.9
Foetus and newborn affected by maternal conditions that may be unrelated to present pregnancy
P000 - P009 3 0.0 0 0.0 3 0.0 3 0.0 0 0.0 3 0.0 0 0.0 0 0.0 0 0.0
Foetus and newborn affected by maternal complications of pregnancy
P010 - P019 12 0.2 1 0.0 13 0.2 5 0.1 1 0.0 6 0.1 7 2.6 0 0.0 7 2.6
Foetus and newborn affected by complications of placenta, cord and membranes
P020 - P029 73 1.0 4 0.1 77 1.0 72 1.0 4 0.1 76 1.1 1 0.4 0 0.0 1 0.4
Foetus and newborn affected by other complications of labour and delivery
P030 - P039 4 0.1 0 0.0 4 0.1 4 0.1 0 0.0 4 0.1 0 0.0 0 0.0 0 0.0
Disorders related to length of gestation and foetal growth
P05-P08 31 0.4 35 0.5 66 0.9 29 0.4 24 0.3 53 0.7 2 0.7 11 4.1 13 4.8
Slow foetal growth and foetal malnutrition P050 - P059 10 0.1 0 0.0 10 0.1 10 0.1 0 0.0 10 0.1 0 0.0 0 0.0 0 0.0 Disorders related to short gestation and low birth weight, not elsewhere classified
P070 - P073 21 0.3 35 0.5 56 0.8 19 0.3 24 0.3 43 0.6 2 0.7 11 4.1 13 4.8
Respiratory and cardiovascular disorders specific to the perinatal period
P20-P29 24 0.3 23 0.3 47 0.6 23 0.3 20 0.3 43 0.6 1 0.4 3 1.1 4 1.5
Intrauterine hypoxia P200 - P209 23 0.3 2 0.0 25 0.3 22 0.3 2 0.0 24 0.3 1 0.4 0 0.0 1 0.4 Birth asphyxia P210 - P219 0 0.0 2 0.0 2 0.0 0 0.0 2 0.0 2 0.0 0 0.0 0 0.0 0 0.0 Respiratory distress of newborn P220 - P229 0 0.0 3 0.0 3 0.0 0 0.0 2 0.0 2 0.0 0 0.0 1 0.4 1 0.4 Interstitial emphysema and related conditions originating in the perinatal period
P250 - P258 0 0.0 1 0.0 1 0.0 0 0.0 1 0.0 1 0.0 0 0.0 0 0.0 0 0.0
Pulmonary haemorrhage originating in the perinatal period
P260 - P269 0 0.0 6 0.1 6 0.1 0 0.0 4 0.1 4 0.1 0 0.0 2 0.7 2 0.7
Other respiratory conditions originating in the perinatal period
P280 - P289 0 0.0 6 0.1 6 0.1 0 0.0 6 0.1 6 0.1 0 0.0 0 0.0 0 0.0
Cardiovascular disorders originating in the perinatal period
P290 - P299 1 0.0 3 0.0 4 0.1 1 0.0 3 0.0 4 0.1 0 0.0 0 0.0 0 0.0
Infections specific to the perinatal period P35-P39 6 0.1 3 0.0 9 0.1 6 0.1 2 0.0 8 0.1 0 0.0 1 0.4 1 0.4 Bacterial sepsis of newborn P360 - P369 3 0.0 2 0.0 5 0.1 3 0.0 1 0.0 4 0.1 0 0.0 1 0.4 1 0.4 Other congenital infectious and parasitic diseases P370 - P379 1 0.0 0 0.0 1 0.0 1 0.0 0 0.0 1 0.0 0 0.0 0 0.0 0 0.0 Other infections specific to the perinatal period P390 - P399 2 0.0 1 0.0 3 0.0 2 0.0 1 0.0 3 0.0 0 0.0 0 0.0 0 0.0 Haemorrhagic and haematological disorders of foetus and newborn
P50-P61 6 0.1 3 0.0 9 0.1 5 0.1 3 0.0 8 0.1 1 0.4 0 0.0 1 0.4
Foetal blood loss P500 - P509 4 0.1 0 0.0 4 0.1 3 0.0 0 0.0 3 0.0 1 0.4 0 0.0 1 0.4 Intracranial nontraumatic haemorrhage of foetus and newborn
P520 - P529 0 0.0 3 0.0 3 0.0 0 0.0 3 0.0 3 0.0 0 0.0 0 0.0 0 0.0
Other perinatal haematological disorders P610 - P619 2 0.0 0 0.0 2 0.0 2 0.0 0 0.0 2 0.0 0 0.0 0 0.0 0 0.0

Table 5.4: Cause of Death by ICD-10 Chapter and Subcategories, Numbers and Mortality Rates (cont.)
ICD-10 Code Total Deaths Singleton Deaths Multiple Deaths
Stillbirths Early Neonatal
Deaths Total Perinatal
Deaths Stillbirths Early Neonatal
Deaths Total Perinatal
Deaths Stillbirths Early Neonatal
Deaths Total Perinatal
Deaths
N Rate N Rate N Rate N Rate N Rate N Rate N Rate N Rate N Rate Transitory endocrine and metabolic disorders specific to foetus and newborn
P70-P74 4 0.1 1 0.0 5 0.1 4 0.1 1 0.0 5 0.1 0 0.0 0 0.0 0 0.0
Transitory disorders of carbohydrate metabolism specific to foetus and newborn
P700 - P709 4 0.1 1 0.0 5 0.1 4 0.1 1 0.0 5 0.1 0 0.0 0 0.0 0 0.0
Digestive system disorders of foetus and newborn P75 - P78 0 0.0 1 0.0 1 0.0 0 0.0 1 0.0 1 0.0 0 0.0 0 0.0 0 0.0 Necrotizing enterocolitis of foetus and newborn P77 0 0.0 1 0.0 1 0.0 0 0.0 1 0.0 1 0.0 0 0.0 0 0.0 0 0.0 Conditions involving the integument and temperature regulation of foetus and newborn
P80-P83 8 0.1 1 0.0 9 0.1 8 0.1 1 0.0 9 0.1 0 0.0 0 0.0 0 0.0
Other conditions of integument specific to foetus and newborn
P830 - P839 8 0.1 1 0.0 9 0.1 8 0.1 1 0.0 9 0.1 0 0.0 0 0.0 0 0.0
Other disorders originating in the perinatal period P90-P96 54 0.7 11 0.1 65 0.9 51 0.7 8 0.1 59 0.8 3 1.1 3 1.1 6 2.2 Other disturbances of cerebral status of newborn P910 - P919 0 0.0 3 0.0 3 0.0 0 0.0 2 0.0 2 0.0 0 0.0 1 0.4 1 0.4 Foetal death of unspecified cause, Condition origination in the perinatal period, unspecified
P95, P969 54 0.7 8 0.1 62 0.8 51 0.7 6 0.1 57 0.8 3 1.1 2 0.7 5 1.8
Congenital malformations of the nervous system Q00-Q07 10 0.1 20 0.3 30 0.4 9 0.1 16 0.2 25 0.3 1 0.4 4 1.5 5 1.8 Anencephaly and similar malformations Q000 - Q002 5 0.1 9 0.1 14 0.2 5 0.1 5 0.1 10 0.1 0 0.0 4 1.5 4 1.5 Congenital hydrocephalus Q030 - Q039 1 0.0 6 0.1 7 0.1 1 0.0 6 0.1 7 0.1 0 0.0 0 0.0 0 0.0 Other congenital malformations of the brain Q040 - Q049 1 0.0 3 0.0 4 0.1 1 0.0 3 0.0 4 0.1 0 0.0 0 0.0 0 0.0 Spina bifida Q050 - Q059 3 0.0 2 0.0 5 0.1 2 0.0 2 0.0 4 0.1 1 0.4 0 0.0 1 0.4 Congenital malformations of the circulatory system Q20-Q28 9 0.1 9 0.1 18 0.2 9 0.1 7 0.1 16 0.2 0 0.0 2 0.7 2 0.7 Congenital malformations of cardiac chambers and connections
Q200 - Q209 0 0.0 1 0.0 1 0.0 0 0.0 1 0.0 1 0.0 0 0.0 0 0.0 0 0.0
Congenital malformations of cardiac septa Q210 - Q219 1 0.0 0 0.0 1 0.0 1 0.0 0 0.0 1 0.0 0 0.0 0 0.0 0 0.0 Congenital malformations of pulmonary and tricuspid valves
Q220 - Q229 2 0.0 0 0.0 2 0.0 2 0.0 0 0.0 2 0.0 0 0.0 0 0.0 0 0.0
Congenital malformations of aortic and mitral valves Q230 - Q239 0 0.0 1 0.0 1 0.0 0 0.0 1 0.0 1 0.0 0 0.0 0 0.0 0 0.0 Other congenital malformations of heart Q240 - Q249 4 0.1 6 0.1 10 0.1 4 0.1 5 0.1 9 0.1 0 0.0 1 0.4 1 0.4 Congenital malformations of great veins Q260 - Q269 0 0.0 1 0.0 1 0.0 0 0.0 0 0.0 0 0.0 0 0.0 1 0.4 1 0.4 Other congenital malformations of peripheral vascular system
Q270 - Q279 1 0.0 0 0.0 1 0.0 1 0.0 0 0.0 1 0.0 0 0.0 0 0.0 0 0.0
Other congenital malformations of circulatory system Q280 - Q289 1 0.0 0 0.0 1 0.0 1 0.0 0 0.0 1 0.0 0 0.0 0 0.0 0 0.0 Congenital malformations of the respiratory system Q30-Q34 0 0.0 3 0.0 3 0.0 0 0.0 3 0.0 3 0.0 0 0.0 0 0.0 0 0.0 Congenital malformations of trachea and bronchus Q320 - Q324 0 0.0 1 0.0 1 0.0 0 0.0 1 0.0 1 0.0 0 0.0 0 0.0 0 0.0 Congenital malformations of lung Q330 - Q339 0 0.0 1 0.0 1 0.0 0 0.0 1 0.0 1 0.0 0 0.0 0 0.0 0 0.0 Other congenital malformations of respiratory system Q340 - Q349 0 0.0 1 0.0 1 0.0 0 0.0 1 0.0 1 0.0 0 0.0 0 0.0 0 0.0 Cleft lip and cleft palate Q35-Q37 0 0.0 1 0.0 1 0.0 0 0.0 1 0.0 1 0.0 0 0.0 0 0.0 0 0.0 Cleft palate with cleft lip Q370 - Q379 0 0.0 1 0.0 1 0.0 0 0.0 1 0.0 1 0.0 0 0.0 0 0.0 0 0.0

Table 5.4: Cause of Death by ICD-10 Chapter and Subcategories, Numbers and Mortality Rates (cont.)
ICD-10 Code Total Deaths Singleton Deaths Multiple Deaths
Stillbirths Early Neonatal
Deaths Total Perinatal
Deaths Stillbirths Early Neonatal
Deaths Total Perinatal
Deaths Stillbirths Early Neonatal
Deaths Total Perinatal
Deaths
N Rate N Rate N Rate N Rate N Rate N Rate N Rate N Rate N Rate Other congenital malformations of the digestive system
Q38-Q45 3 0.0 3 0.0 6 0.1 2 0.0 3 0.0 5 0.1 1 0.4 0 0.0 1 0.4
Congenital malformations of oesophagus Q390 - Q399 1 0.0 1 0.0 2 0.0 1 0.0 1 0.0 2 0.0 0 0.0 0 0.0 0 0.0 Congenital absence, atresia and stenosis of small intestine
Q410 - Q419 1 0.0 0 0.0 1 0.0 1 0.0 0 0.0 1 0.0 0 0.0 0 0.0 0 0.0
Other congenital malformations of intestine Q430 - Q439 1 0.0 1 0.0 2 0.0 0 0.0 1 0.0 1 0.0 1 0.4 0 0.0 1 0.4 Other congenital malformations of digestive system Q450 - Q459 0 0.0 1 0.0 1 0.0 0 0.0 1 0.0 1 0.0 0 0.0 0 0.0 0 0.0 Congenital malformations of genital organs Q50-Q56 1 0.0 1 0.0 2 0.0 0 0.0 1 0.0 1 0.0 1 0.4 0 0.0 1 0.4 Congenital malformations of uterus and cervix Q510 - Q519 1 0.0 0 0.0 1 0.0 0 0.0 0 0.0 0 0.0 1 0.4 0 0.0 1 0.4 Indeterminate sex and pseudohermaphroditism Q560 - Q564 0 0.0 1 0.0 1 0.0 0 0.0 1 0.0 1 0.0 0 0.0 0 0.0 0 0.0 Congenital malformations of the urinary system Q60-Q64 3 0.0 5 0.1 8 0.1 3 0.0 5 0.1 8 0.1 0 0.0 0 0.0 0 0.0 Renal agenesis and other reduction defects of kidney Q600 - Q606 1 0.0 3 0.0 4 0.1 1 0.0 3 0.0 4 0.1 0 0.0 0 0.0 0 0.0 Cystic kidney disease Q610 - Q619 1 0.0 2 0.0 3 0.0 1 0.0 2 0.0 3 0.0 0 0.0 0 0.0 0 0.0 Other congenital malformations of kidney Q630 - Q639 1 0.0 0 0.0 1 0.0 1 0.0 0 0.0 1 0.0 0 0.0 0 0.0 0 0.0 Congenital malformations and deformations of the musculoskeletal system
Q65-Q79 6 0.1 2 0.0 8 0.1 6 0.1 2 0.0 8 0.1 0 0.0 0 0.0 0 0.0
Osteochondrodysplasia with defects of growth of tubular bones and spine
Q770 - Q779 1 0.0 0 0.0 1 0.0 1 0.0 0 0.0 1 0.0 0 0.0 0 0.0 0 0.0
Other osteochondrodysplasias Q780 - Q789 2 0.0 0 0.0 2 0.0 2 0.0 0 0.0 2 0.0 0 0.0 0 0.0 0 0.0 Congenital malformations of musculoskeletal system, not elsewhere classified
Q790 - Q799 3 0.0 2 0.0 5 0.1 3 0.0 2 0.0 5 0.1 0 0.0 0 0.0 0 0.0
Other congenital malformations Q80-Q89 11 0.1 8 0.1 19 0.3 9 0.1 5 0.1 14 0.2 2 0.7 3 1.1 5 1.8 Other specified congenital malformation syndromes affecting multiple systems
Q870 - Q878 2 0.0 0 0.0 2 0.0 2 0.0 0 0.0 2 0.0 0 0.0 0 0.0 0 0.0
Other congenital malformations, not elsewhere classified
Q890 - Q899 9 0.1 8 0.1 17 0.2 7 0.1 5 0.1 12 0.2 2 0.7 3 1.1 5 1.8
Chromosomal abnormalities, not elsewhere classified Q90-Q99 29 0.4 18 0.2 47 0.6 28 0.4 18 0.3 46 0.6 1 0.4 0 0.0 1 0.4 Downs syndrome Q900 - Q909 8 0.1 0 0.0 8 0.1 7 0.1 0 0.0 7 0.1 1 0.4 0 0.0 1 0.4 Edwards syndrome and Pataus syndrome Q910 - Q917 15 0.2 14 0.2 29 0.4 15 0.2 14 0.2 29 0.4 0 0.0 0 0.0 0 0.0 Other trisomies and partial trisomies of the autosomes, not elsewhere classified
Q920 - Q929 2 0.0 2 0.0 4 0.1 2 0.0 2 0.0 4 0.1 0 0.0 0 0.0 0 0.0
Turners syndrome Q960 - Q969 2 0.0 0 0.0 2 0.0 2 0.0 0 0.0 2 0.0 0 0.0 0 0.0 0 0.0 Other chromosome abnormalities, not elsewhere classified
Q990 - Q999 2 0.0 2 0.0 4 0.1 2 0.0 2 0.0 4 0.1 0 0.0 0 0.0 0 0.0
Total 297 4.0 153 2.1 450 6.1 276 3.8 126 1.8 402 5.6 21 7.7 27 10.0 48 17.6
Notes: N equals number of deaths.
Rate per 1,000 births. For stillbirths, perinatal deaths and adjusted perinatal deaths, rates are calculated on total live births and stillbirths. For early neonatal deaths, rates are calculated on total live births.

90| Perinata l S tat i st i cs Report 2011
STILLBIRTHS
Figure 5.7 presents the main cause of death for stillbirths.
• Maternal factors (P00-P04) were the leading cause of death for total stillbirths (31.0 per cent).
• While maternal factors accounted for 38.1 per cent of multiple stillbirths, the second leading cause of death was congenital malformations, accounting for 28.6 per cent of multiple stillbirths.
• Congenital malformations (Q00-Q99) contributed to almost one in 4 deaths for total stillbirths (24.2 per cent) and singleton stillbirths (23.9 per cent).
• The cause of death was unspecified/unexplained (P95, P96.9) for 18.2 per cent of total stillbirths.
FIGURE 5.7 Stillbirths by Cause of Death, Total, Singleton and Multiple Births
Note: See Table 5.4 for data. Percentages are subject to rounding.
31.0%
10.4%
8.1%18.2%
24.2%
8.1%
Total Stillbirths: 297
30.4%
10.5%
8.3%18.5%
23.9%
8.3%
Singleton Stillbirths: 276
38.1%
9.5%4.8%
14.3%
4.8%
Maternal factors (P00-P04)
Immaturity (P05-P08)
Respiratory/cardiovascular disorders (P20-P29)
Unspecified/Unexplained (P95,P96.9)
Congenital malformations (Q00-Q99)
All other specific causes
Multiple Stillbirths: 21
28.6%

Perinatal Outcomes |91
EARLY NEONATAL DEATHS (ENNDS)
Figure 5.8 presents the main cause of death for early neonatal deaths.
• Over 45 per cent of total early neonatal deaths and 48.4 per cent of singleton early neonatal deaths were due to congenital malformations (Q00-Q99).
• Immaturity (P05-P08) was the second leading cause of death, contributing to 22.9 per cent of total early neonatal deaths and 19.0 per cent of singleton early neonatal deaths.
• Immaturity (P05-P08) accounted for 40.7 per cent of multiple early neonatal deaths.
FIGURE 5.8 Early Neonatal Deaths by Cause of Death, Total, Singleton and Multiple Births
Note: See Table 5.4 for data. Percentages are subject to rounding.
3.3%
22.9%
15.0%
5.2%
45.8%
7.8%
Total ENNDs:153
4.0%
19.0%
15.9%
4.8%
48.4%
7.9%
Singleton ENNDs: 126
40.7%
11.1%
33.3%
7.4%
Maternal factors (P00-P04)Immaturity (P05-P08)Respiratory/cardiovascular disorders (P20-P29)Unspecified/Unexplained (P95,P96.9)Congenital malformations (Q00-Q99)All other specific causes
Multiple ENNDs: 27
7.4%

92| Perinata l S tat i st i cs Report 2011
TOTAL PERINATAL DEATHS
Figure 5.9 presents data on all perinatal deaths.
• Congenital malformations (Q00-Q99) accounted for almost 1 in 3 total perinatal deaths (31.6 per cent) and were the leading cause of death for total singleton perinatal deaths (31.6 per cent) and total multiple perinatal deaths (31.3 per cent).
• Maternal factors were the second most frequently reported cause of death for total singleton perinatal deaths (22.1 per cent).
• Immaturity (P05-P08) was the second most frequent cause of death for total multiple perinatal deaths accounting for 27.1 per cent of deaths.
FIGURE 5.9 Perinatal Deaths by Cause of Death, Total, Singleton and Multiple Births
Note: See Table 5.4 for data. Percentages are subject to rounding.
21.6%
14.7%
10.4%13.8%
31.6%
8.0%
Total Perinatal Deaths: 450
22.1%
13.2%
10.7%14.2%
31.6%
8.2%
Singleton Perinatal Deaths: 402
16.7%
27.1%
8.3%10.4%
31.3%
6.3%
Maternal factors (P00-P04)
Immaturity (P05-P08)
Respiratory/cardiovascular disorders (P20-P29)
Unspecified/Unexplained (P95,P96.9)
Congenital malformations (Q00-Q99)
All other specific causes
Multiple Perinatal Deaths: 48

Perinatal Outcomes |93
AGE AT DEATH
Table 5.5 presents age at death for early neonatal deaths.
• 1 in 5 early neonatal deaths occurred within the first hour of life.
• Almost 60 per cent of total early neonatal deaths died within the first day of life.
TABLE 5.5 Age at Death, Early Neonatal Deaths
Total Births Singleton Births Multiple Births
Number Per Cent Number Per Cent Number Per Cent Completed Hours <1 30 19.6 28 22.2 2 7.4 1 16 10.5 10 7.9 6 22.2 2 10 6.5 8 6.3 2 7.4 3 11 7.2 9 7.1 2 7.4 4 2 1.3 2 1.6 0 0.0 5 4 2.6 4 3.2 0 0.0 6 1 0.7 1 0.8 0 0.0 7-10 2 1.3 1 0.8 1 3.7 11-15 7 4.6 6 4.8 1 3.7 16-23 4 2.6 4 3.2 0 0.0 Total under 1 day 87 56.9 73 57.9 14 51.9 Completed Days 1 14 9.2 11 8.7 3 11.1 2 17 11.1 14 11.1 3 11.1 3 14 9.2 10 7.9 4 14.8 4 5 3.3 5 4.0 0 0.0 5 5 3.3 4 3.2 1 3.7 6 8 5.2 6 4.8 2 7.4 Total under 1 Week 63 41.2 50 39.7 13 48.1 Unknown 3 2.0 3 2.4 0 0.0 Total 153 100 126 100 27 100

94| Perinata l S tat i st i cs Report 2011
POST-MORTEM EXAMINATIONS
Post-mortem examinations were less likely in the case of early neonatal deaths compared to stillbirths and this trend is consistent over recent years.31 Table 5.6 presents data on post-mortem examinations.
• The percentage of early neonatal deaths undergoing post-mortem examinations was 25.9 per cent compared to 48.1 per cent for stillbirths.
• A post-mortem examination was undertaken for 40.8 per cent of total perinatal deaths in 2011.
TABLE 5.6 Post-Mortem Examinations, Total Deaths
Type of Death Frequency
Early Neonatal Deaths Stillbirths Total Row Per Cent Col. Per Cent Total Births Post-Mortem 38 143 181 21.0 79.0 100 24.8 48.1 40.2 No Post-Mortem 109 154 263 41.4 58.6 100 71.2 51.9 58.4 Not Stated 6 0 6 100 0.0 100 3.9 0.0 1.3 Total 153 297 450 34.0 66.0 100 100 100 100 Singleton Births Post-Mortem 34 135 169 20.1 79.9 100 27.0 48.9 42.0 No Post-Mortem 86 141 227 37.9 62.1 100 68.3 51.1 56.5 Not Stated 6 0 6 100 0.0 100 4.8 0.0 1.5 Total 126 276 402 31.3 68.7 100 100 100 100 Multiple Births Post-Mortem 4 8 12 33.3 66.7 100 14.8 38.1 25.0 No Post-Mortem 23 13 36 63.9 36.1 100 85.2 61.9 75.0 Not Stated 0 0 0 0.0 0.0 0.0 0.0 0.0 0.0 Total 27 21 48
56.3 43.8 100
100 100 100
31 Previous reports in this series can be downloaded from www.esri.ie/health_information/latest_hipe_nprs_reports/

APPENDICES

96 | Per inatal Stat i st ics Report 201 1
APPENDIX A DEFINITIONS
This section collates the definitions of the terms used in the analyses for this report. All perinatal statistics and definitions are based on WHO ICD-10 Classifications.
Age at Death: The age of early neonatal deaths is given in completed hours if the infant survived less than one day and in completed days otherwise. Age-Specific Fertility Rate (ASFR): refers to the number of live births to women in a particular age group divided by the female population in that age group, multiplied by 1,000 (see also definition for Total Period Fertility Rate (TPFR)). Antenatal Length of Stay: This is computed as the difference, in days, between a mother’s date of admission and her date of delivery. Domiciliary births are not included in tables relating to this variable. Antepartum and Intrapartum Stillbirths: These refer to stillbirths occurring prior to and during labour respectively. Birth Rate: The Birth Rate or Crude Birth Rate is the ratio of total live births to total population over a specified period of time. The birth rate is often expressed as the number of live births per 1,000 members of the population in a particular time period (for example one year). Birthweight: Birthweight is given in grams and hospitals are asked to record the weight within the first hour after birth. In accordance with WHO guidelines, only births weighing 500 grams or more are included in any analysis of NPRS data. Born Before Arrival (BBA): Where BBA is recorded as place of birth this indicates that an infant was delivered before arrival at hospital. Cause of Death: This categorisation indicates the principal underlying pathological cause, which in the opinion of the certifier made the greatest contribution to the death of the infant or foetus. In assigning cause of death in the NPRS, the guidelines recommended by the WHO have been followed. A summary of these guidelines is provided in Appendix D. Since 2005 the International Statistical Classification of Diseases and Related Health Problems, 10th Revision, Vols. 1-3. Geneva: World Health Organisation is used to code Irish births. Congenital Anomalies: These are physiological or structural abnormalities that develop at or before birth and are present at the time of birth. Congenital anomalies are those diseases/conditions categorised in ICD-10, Chapter XVII, Congenital Malformations, Deformities and Chromosomal Abnormalities (Q00.0-Q99.9).

App endices | 97
Domiciliary Birth: Domiciliary births are planned home births. The vast majority of these are attended by an independent midwife and are not associated with a hospital. In 2011, there were 58 births under hospital administered home birth schemes. For the purposes of this report these births are treated as hospital births due to their small numbers. Early Neonatal Death (ENND) and Early Neonatal Mortality Rate: An early neonatal death refers to the death of a live born infant during the first week of life. The early neonatal mortality rate is calculated as follows:
Number of Early Neonatal Deaths x 1,000 Total Number of Live Births
Hospital Admission Booked or Unbooked: This indicates whether a mother’s admission to hospital for delivery was booked or unbooked prior to delivery. Domiciliary births are not included in the tables relating to this variable. Immunity to Rubella: An affirmative answer should be recorded only where there is documented evidence of a rubella antibody test. A history of rubella or previous immunisation is not sufficient to indicate immunity to rubella. Length of Infant’s Stay: This is computed as the difference, in days, between the infant’s date of birth and the date of the infant’s discharge from hospital. A return of ‘not stated’ for this variable may indicate that the completed form was returned before the infant had been discharged. Where an infant was transferred to another hospital, the date of the transfer is given as the date of the infant’s discharge. Domiciliary births and perinatal deaths are not included in the tables relating to this variable. Live Birth: A live birth is defined as the complete expulsion or extraction from its mother of a product of conception, irrespective of the duration of pregnancy, which, after such separation, breathes or shows any other evidence of life, such as beating of the heart, pulsation of the umbilical cord, or definite movement of voluntary muscles, whether or not the umbilical cord has been cut or the placenta is attached. In accordance with WHO guidelines, only births weighing 500 grams or more are included in any analysis of NPRS data. Marital Status: Five categories are used:
1. Married 2. Never Married (classified as ‘Single’ in discussion in this report) 3. Widowed 4. Separated (including deserted, legally separated, Church decree of nullity and otherwise
separated) 5. Divorced.
Maternity: refers to a woman who has delivered a baby irrespective of outcome. In accordance with WHO guidelines, only births weighing 500 grams or more are included in any analysis of NPRS data.

98 | Per inatal Stat i st ics Report 201 1
Method of Delivery: Six categories are used:32
1. Spontaneous cephalic delivery 2. Breech delivery, spontaneous, with or without forceps to after-coming head, breech extraction 3. Forceps delivery 4. Vacuum extraction33 5. Caesarean section 6. Other Specified and Combined (for example, combination of spontaneous delivery followed by a
vacuum extraction or caesarean section). Mother’s and Father’s Nationality: This indicates place of birth for mother and father. This definition is for the sole purpose of giving the necessary directions for the completion of the Birth Notification Form and is not a legal definition. Details are given in Appendix F. Mother’s and Father’s Occupation: Occupations are coded and grouped, with minor modifications, according to the system of socioeconomic groupings as used by the Central Statistics Office in the 1991 Census of Population, Volume 6. Details are given in Appendix C. Parity: Maternal parity indicates a mother’s total number of previous live births and stillbirths. Primiparous: Women who have had no previous pregnancy resulting in a live birth or stillbirth.
Multiparous: Women who have had at least one previous pregnancy resulting in a live birth or stillbirth.
Perinatal Death and Perinatal Mortality Rate (PMR): Perinatal deaths include stillbirths and early neonatal deaths. The perinatal mortality rate (PMR) is calculated as follows:
Number of Stillbirths and Early Neonatal Deaths x 1,000 Total Number of Live Births and Stillbirths
In this report a second perinatal mortality rate has been calculated excluding all stillbirths and early neonatal deaths due to congenital anomalies. This adjusted rate (Adjusted PMR) to some extent removes those perinatal events where death was unavoidable, but no attempt has been made to exclude only invariably fatal congenital anomalies. Perinatal Period: For the purposes of NPRS the perinatal period covers pregnancy, delivery and ends at seven completed days after birth. Period of Gestation: Gestational age at delivery is recorded in completed weeks, and is measured or estimated according to the best method available in each case.
32 For the purpose of presenting data in this report ‘instrumental delivery’ includes breech/forceps, forceps or vacuum
extraction. 33 Also known as Ventouse Deliveries (Source: World Health Organization, 2005, International Statistical Classification of
Diseases and Related Health Problems, 10th Revision, Vol. 1. Geneva: World Health Organization).

App endices | 99
Plurality: This indicates the number of births resulting from a single pregnancy. Singleton birth: Results when one baby is born from a single pregnancy.
Multiple births: Results when more than one baby is born from a single pregnancy.
Post-mortem: This indicates whether or not a post-mortem examination was performed. In some cases a return of ‘not stated’ may be due to the notification form being returned prior to post-mortem. Postnatal Length of Stay: This is computed as the difference, in days, between the date of delivery and the date of the mother’s discharge from hospital. A return of ‘not stated’ for this variable may indicate that the completed form was returned before the mother had been discharged. Domiciliary births are not included in tables relating to this variable. Size of Maternity Unit: Size in this context refers to the number of live births and stillbirths occurring during the year in a dedicated maternity hospital/unit. Stillbirth and Stillbirth Rate: Foetal death is defined as death prior to the complete expulsion or extraction from its mother of a product of conception, irrespective of the duration of the pregnancy. A foetal death is indicated by the fact that, after such separation, the foetus does not breathe or show any other evidence of life, such as beating of the heart, pulsation of the umbilical cord, or definite movement of voluntary muscles. Following WHO guidelines, a stillbirth in this report refers to the death of a foetus weighing at least 500 grams. The stillbirth rate is given as follows:
Number of Stillbirths x 1,000 Total Number of Live Births and Stillbirths
Time since Last Birth: This variable gives the time, grouped into yearly intervals, since the mother’s last live birth or stillbirth. Total Period Fertility Rate (TPFR): is compiled by summing the Age-Specific Fertility Rate (ASFR) for the relevant five-year age groups, dividing by 1,000 and multiplying by 5. It gives the theoretical average number of children who would be born alive to a woman during her lifetime if she were to pass through her childbearing years conforming to the age-specific fertility rates of a given year. See also definition for ASFR. Transfer of Infants: This identifies infants who were transferred to another hospital for medical reasons. Twinning Rate: This is given by:
Number of Twin Births / 2 x 1,000
Total Number of Maternities
Twin births, which resulted in stillbirths, are included in the calculation of the twinning rate. Type of Feeding: This indicates whether artificial feeding, breastfeeding, or a combination of both was being used at the time of discharge. Type of feeding is based on live births only (excluding early neonatal deaths). Any breastfeeding includes type of feeding recorded as either breast or combined at discharge from hospital.

100 | Perinatal Stat i s t i cs Report 2011
APPENDIX B COPY OF PART 3 OF THE BIRTH NOTIFICATION FORM USED BY NPRS
The following format was used for births in 2011.

App endices | 101
APPENDIX C CLASSIFICATION OF OCCUPATION
Occupations have been coded and classified in a set of socio-economic groups according to a system devised by the CSO. The final CSO category of ‘Unknown’ has been differentiated into five distinct groups for the purposes of the Perinatal Reporting System. These are ‘Unemployed’, ‘Not Classifiable’, ‘Not Applicable’, ‘Home Duties’, and ‘Not Stated’. Occupation is coded as unemployed when occupation is given as unemployed and where no previous occupation is stated. If a previous occupation is stated then occupation is coded to the relevant category. ‘Not Classifiable’ has been used to categorise indecipherable, unclear, or unlisted occupations where efforts to clarify the information have failed. ‘Home Duties’ is entered where occupation has been entered as ‘full-time mother/father/parent’, ‘stay at home mother/father/parent’, ‘housewife’, ‘home duties’, etc. ‘Not Stated’ applies to those cases where either the mother’s or father’s occupation has been left blank or has been recorded as ‘Unknown’. Under Father’s occupation, the following applies: ‘Not Applicable’ is entered when the marital status of the mother has been given as never married, widowed, separated or divorced, and where father’s occupation has been left blank. ‘Not Stated’ applies to those cases where the marital status of the mother is recorded as either married or not stated, and where father’s occupation has been left blank or has been recorded as ‘Unknown’. In either case, if an occupation is given for the father then the appropriate occupational code has been used. For the purposes of presenting data on father’s occupation in this report, the categories ‘Not Applicable’ and ‘Not Stated’ are combined. The full list of socioeconomic groups used in this report is as follows: • Farmers & Farm Managers • Other Agricultural Occupations &
Fishermen • Higher Professional • Lower Professional • Employers & Managers • Salaried Employees • Intermediate Non-Manual Workers • Other Non-Manual Workers
• Skilled Manual Workers • Semi-Skilled Manual Workers • Unskilled Manual Workers • Unemployed • Not Classifiable • Not Applicable (Father’s Occupation Only) • Home Duties • Not Stated.

102 | Perinatal Stat i s t i cs Report 2011
APPENDIX D CAUSE OF DEATH CLASSIFICATION
The main cause of death has been determined according to the guidelines set out by the WHO in the Tenth Revision of the ICD.34 The principal coding criteria are summarised here. The main cause of death should as far as possible indicate the pathological condition of the infant or foetus which, in the opinion of the certifier, made the greatest contribution towards the death. The following rules are extracted from ICD-10, Second Edition, 2005, 4. Rules and guidelines for mortality and morbidity coding. These rules have been applied to cause of death coding in the NPRS data set as follows: Section (A) – main disease or condition in foetus or infant Section (B) – other diseases or conditions in foetus or infant Section (C) – main maternal disease or condition affecting foetus or infant Section (D) – other maternal disease or condition affecting foetus or infant.
Rule P1. Mode of death or prematurity entered in section (a):
If heart or cardiac failure, asphyxia or anoxia (any condition in P20.-, P21.-) or prematurity (any condition in P07.-) is entered in section (a) and other conditions of the infant or foetus are entered in either section (a) or section (b), code the first-mentioned of these other conditions as if it had been entered alone in section (a) and code the condition actually entered in section (a) as if it had been entered in section (b).
Rule P2. Two or more conditions entered in sections (a) or (c):
If two or more conditions are entered in section (a) or section (c), code the first-mentioned of these as if it had been entered alone in section (a) or (c) and code the others as if they had been entered in sections (b) or (d).
34 World Health Organization, 2005, International Statistical Classification of Diseases and Related Health Problems, 10th
Revision, Vols. 1- 3. Geneva: World Health Organization

App endices | 103
Rule P3. No entry in sections (a) or (c)
If there is no entry in section (a) but there are conditions of the infant or foetus entered in section (b), code the first-mentioned of these as if it had been entered in section (a). If there are no entries in either section (a) or section (b), either code P95 (Foetal death of unspecified cause) for stillbirths or code P96.9 (Condition originating in the perinatal period, unspecified) for early neonatal deaths should be used for section (a).
Similarly, if there is no entry in section (c) but there are maternal conditions entered in section (d), code the first-mentioned of these as if it had been entered in section (c). If there are no entries in either section (c) or section (d) use some artificial code, e.g. xxx.x for section (c) to indicate that no maternal condition was reported.
Rule P4. Conditions entered in wrong section
If a maternal condition (i.e. conditions in P00-P04) is entered in section (a) or section (b), or if a condition of the infant or foetus is entered in section (c) or section (d), code the conditions as if they had been entered in the respective correct section.
For the purpose of the cause of death tables included in this report, one further criterion has been applied. Where no infant’s condition is given then, where a specific maternal condition is given (any condition in P00-P04), the main cause of death is classified under the maternal condition.
Table D1 summarises these rules.
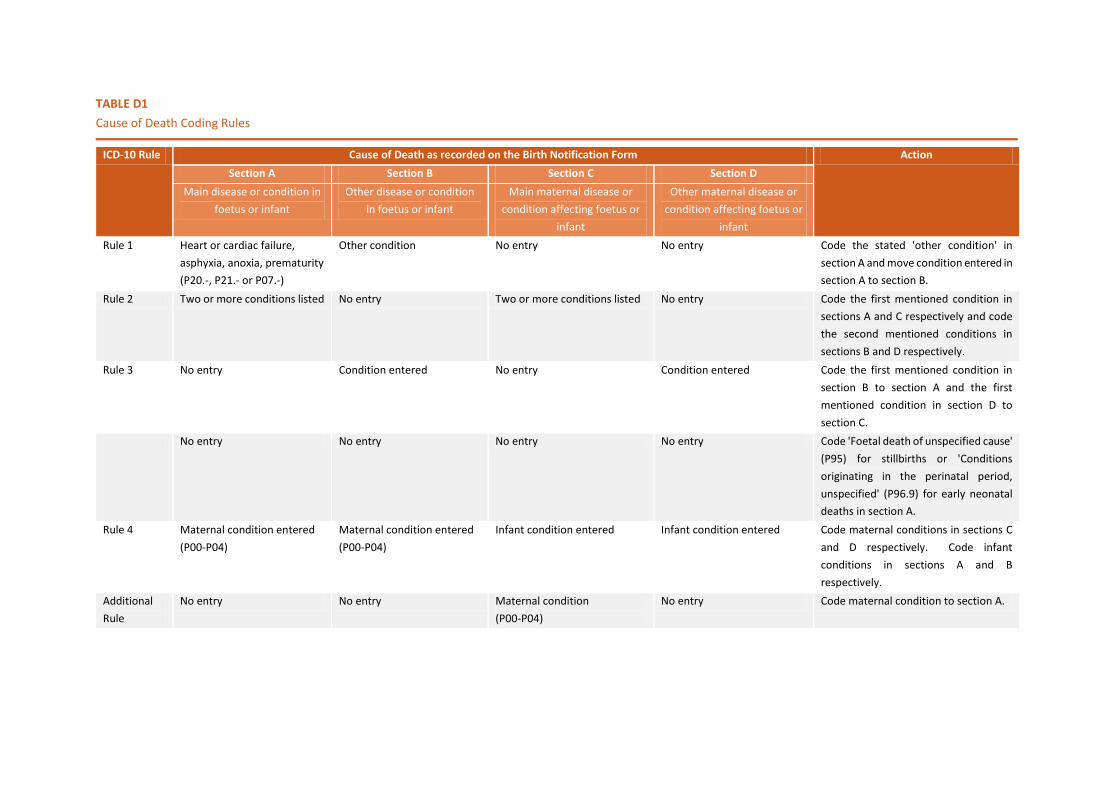
TABLE D1 Cause of Death Coding Rules
ICD-10 Rule Cause of Death as recorded on the Birth Notification Form Action
Section A Section B Section C Section D Main disease or condition in
foetus or infant Other disease or condition
in foetus or infant Main maternal disease or
condition affecting foetus or infant
Other maternal disease or condition affecting foetus or
infant Rule 1 Heart or cardiac failure,
asphyxia, anoxia, prematurity (P20.-, P21.- or P07.-)
Other condition No entry No entry Code the stated 'other condition' in section A and move condition entered in section A to section B.
Rule 2 Two or more conditions listed No entry Two or more conditions listed No entry Code the first mentioned condition in sections A and C respectively and code the second mentioned conditions in sections B and D respectively.
Rule 3 No entry Condition entered No entry Condition entered Code the first mentioned condition in section B to section A and the first mentioned condition in section D to section C.
No entry No entry No entry No entry Code 'Foetal death of unspecified cause' (P95) for stillbirths or 'Conditions originating in the perinatal period, unspecified' (P96.9) for early neonatal deaths in section A.
Rule 4 Maternal condition entered (P00-P04)
Maternal condition entered (P00-P04)
Infant condition entered Infant condition entered Code maternal conditions in sections C and D respectively. Code infant conditions in sections A and B respectively.
Additional Rule
No entry No entry Maternal condition (P00-P04)
No entry Code maternal condition to section A.

App endices | 105
Table D2 illustrates the main chapter blocks relating to cause of death categories in this report. TABLE D2 ICD 10, Cause of Death Codes
ICD-10
CODE CAUSE OF DEATH
P00–P04 Foetus and newborn affected by maternal factors and by complications of pregnancy, labour and delivery
P05–P08 Disorders related to length of gestation and foetal growth P10–P15 Birth trauma P20–P29 Respiratory and cardiovascular disorders specific to the perinatal period P35–P39 Infections specific to the perinatal period P50–P61 Haemorrhagic and haematological disorders of foetus and newborn P70–P74 Transitory endocrine and metabolic disorders specific to foetus and newborn P75–P78 Digestive system disorders of foetus and newborn P80–P83 Conditions involving the integument and temperature regulation of foetus and newborn P90–P96 Other disorders originating in the perinatal period Q00–Q07 Congenital malformations of the nervous system Q10–Q18 Congenital malformations of eye, ear, face and neck Q20–Q28 Congenital malformations of the circulatory system Q30–Q34 Congenital malformations of the respiratory system Q35–Q37 Cleft lip and cleft palate Q38–Q45 Other congenital malformations of the digestive system Q50–Q56 Congenital malformations of genital organs Q60–Q64 Congenital malformations of the urinary system Q65–Q79 Congenital malformations and deformations of the musculoskeletal system Q80–Q89 Other congenital malformations Q90–Q99 Chromosomal abnormalities, not elsewhere classified
All other codes (A00–O99, R00–Z99) have been classified in the category ‘all other causes’.

106 | Perinatal Stat i s t i cs Report 2011
APPENDIX E
CLASSIFICATION OF COUNTY OF RESIDENCE The following codes are applied to mother’s and father’s county of residence. Where a Dublin postal code, such as Dublin 13, is entered then a code of 10 is applied for Dublin City. Where there is no postal code and Dublin is recorded then a code of 11 is applied for Dublin County. Where a mother’s or father’s county of residence is unknown the code 99 is applied. The code 90 is applied where the address given is outside the Republic of Ireland.
10 Dublin City 11 Dublin County 12 Kildare 13 Wicklow 20 Laois 21 Offaly 22 Longford 23 Westmeath 30 Clare 31 Limerick 32 Tipperary North Riding 40 Meath 41 Cavan 42 Monaghan 43 Louth
50 Donegal 51 Sligo 52 Leitrim 60 Carlow 61 Kilkenny 62 Tipperary South Riding 63 Waterford 64 Wexford 70 Cork 71 Kerry 80 Galway 81 Mayo 82 Roscommon 90 Other – all places outside Republic of Ireland 99 Not Stated.
Note: For the purposes of this report Tipperary North Riding and Tipperary South Riding have been combined for County Tipperary.

App endices | 107
APPENDIX F CLASSIFICATION OF NATIONALITY
Nationality for mother and father is defined by the place of their birth. This definition is for the sole purpose of giving the necessary directions for the completion of the Birth Notification Form and is not a legal definition. Nationalities have been coded and classified into groupings according to a system devised by the CSO, see below:
Ireland includes the following: UK includes the following: Ireland Irish American Irish English Irish European Irish Other.
England Great Britain Northern Ireland Scotland Wales.
EU 15 (excluding Ireland and the UK) includes the following: Austria Belgium Denmark Finland France Germany Greece
Italy Luxembourg Netherlands Portugal Spain Sweden.
EU 15 to EU 27 includes the following: Bulgaria Cyprus Czech Republic Estonia Hungary Latvia
Lithuania Malta Poland Slovakia Slovenia Romania.
Rest of Europe includes the following: Andorra Armenia Azerbaijan Belarus Bosnia and Herzegovina Croatia Faroe Islands Georgia Gibraltar
Jersey Liechtenstein Macedonia, The Former Yugoslav Republic of, Moldova, Republic of Monaco Norway Russian Federation San Marino Switzerland

108 | Perinatal Stat i s t i cs Report 2011
Guernsey Iceland Isle of Man
Turkey Ukraine Vatican City Yugoslavia, Federal Republic of.
Africa includes the following: Algeria Angola Benin Botswana Burkina Faso Burundi Cameroon Cape Verde Central African Republic Chad Comoros Congo Congo, The Democratic Republic of the Cote d’Ivoire Djibouti Egypt Equatorial Guinea Eritrea Ethiopia Gabon Gambia Ghana Guinea Guinea-Bissau Kenya Lesotho Liberia Libyan Arab Jamahiriya Madagascar
Malawi Mali Mauritania Mauritius Mayotte Morocco Mozambique Namibia Niger Nigeria Reunion Rwanda Saint Helena Sao Tome and Principe Senegal Seychelles Sierra Leone Somalia South Africa Sudan Swaziland Tanzania, United Republic of Togo Tunisia Uganda Western Sahara Zambia Zimbabwe.
Asia includes the following: Afghanistan Bahrain Bangladesh Bhutan British Indian Ocean Territory Brunei Darussalam Cambodia China East Timor Hong Kong India
Macao Malaysia Maldives Mongolia Myanmar Nepal Oman Pakistan Palestinian Territory, Occupied Philippines Qatar

App endices | 109
America includes the following: Anguilla Antigua and Barbuda Argentina Aruba Bahamas Barbados Belize Bermuda Bolivia Brazil Canada Cayman Islands Chile Colombia Costa Rica Cuba Dominica Dominican Republic Ecuador El Salvador Falkland Islands (Malvinas) French Guiana Greenland Grenada Guadeloupe Guatemala
Guyana Haiti Honduras Jamaica Martinique Mexico Montserrat Netherlands Antilles Nicaragua Panama Paraguay Peru Puerto Rico Saint Kitts and Nevis Saint Lucia Saint Pierre and Miquelon Saint Vincent and the Grenadines Suriname Trinidad and Tobago Turks and Caicos Islands United States Uruguay Venezuela Virgin Islands, British Virgin Island, US.
Australia includes the following: Australia.
Indonesia Iran, Islamic Republic of Iraq Israel Japan Jordan Kazakhstan Korea, Democratic People's Republic of Korea, Republic of Kuwait Kyrgyzstan Lao People's Democratic Republic Lebanon
Saudi Arabia Singapore Sri Lanka Syrian Arab Republic Taiwan, Province of China Tajikistan Thailand Turkmenistan United Arab Emirates Uzbekistan Vietnam Yemen.

110 | Perinatal Stat i s t i cs Report 2011
New Zealand and Other Oceania includes the following: American Samoa Antarctica Bouvet Island Christmas Island Cocos (Keeling) Islands Cook Islands Fiji French Polynesia French Southern Territories Guam Heard Island and McDonald Islands Kiribati Marshall Islands Micronesia, Federated States of Nauru New Caledonia New Zealand
Niue Norfolk Island Northern Mariana Islands Palau Papua New Guinea Pitcairn Samoa Solomon Islands South Georgia and the South Sandwich Islands Svalbard and Jan Mayen Tokelau Tonga Tuvalu United States Minor Outlying Islands Vanuatu Wallis and Futuna.
Multi-Nationality includes the following: Mixed/Multi-Nationality (stated as so).
No Nationality: Stated as so.
Not Stated: Where nationality is not provided.
Not Applicable: This applies to father’s nationality only. Where mother’s marital status is stated as ‘never married’, ‘widowed’, ‘separated’ or ‘divorced’ the General Register Office does not require father’s details to register the birth, and as such this information is generally not provided. If a nationality is given for the father then the appropriate nationality code has been used. For the purposes of presenting data on father’s nationality in this report, the categories ‘Not Applicable’ and ‘Not Stated’ are combined.
All Other Nationalities: Where nationality is not recorded to any category listed above.

App endices | 111
APPENDIX G SOURCE DATA FOR FIGURES
G1 Percentage Distribution of Total Births by Mother’s Marital Status, 2007–2011 G2 Mother’s County of Residence by Mother’s Marital Status, Total Births G3 Percentage Distribution of Total Births by Mother’s Nationality, 2007–2011 G4 Mother’s Average Age by Mother’s Nationality, Total Maternities G5 Age of Mother by Maternal Parity, Total Maternities G6 Percentage Distribution of Total Births to Primiparous Women by Maternal Age, 2007 and 2011 G7 Percentage Distribution of Total Births to Multiparous Women by Maternal Age, 2007 and 2011 G8 Birthweight (grams) for Primiparous Women G9 Birthweight (grams) for Multiparous Women G10 Birthweight (grams), Numbers and Percentages, Total Live Births G11 Birthweight (grams) by Sex, Total Live Births G12 Gestational Age (weeks) at Delivery for Primiparous Women G13 Gestational Age (weeks) at Delivery for Multiparous Women G14 Method of Delivery by Mother’s Postnatal Length of Stay, Singleton and Multiple Births G15 Method of Delivery by Parity, Total, Singleton and Multiple Births G16 Mother’s County of Residence by Infant’s Type of Feeding, Total Live Births G17 Mother’s Nationality by Infant’s Type of Feeding, Total Live Births G18 Birthweight (grams) Total Births, Antepartum and Intrapartum Stillbirths, Early Neonatal Deaths, and
Mortality Rates
TABLE G1 Percentage Distribution of Total Births by Mother’s Marital Status, 2007–2011
Marital Status 2007 2008 2009 2010 2011 Married 66.4 66.1 66.1 65.6 65.3 Single 31.7 32.3 32.2 32.9 33.2 Widowed 0.1 0.1 0.1 0.1 0.1 Separated 1.1 0.9 0.9 0.8 0.9 Divorced 0.6 0.6 0.6 0.6 0.5
Note: ‘Not Stated’ values are not included in the calculation of percentages.

112 | Perinatal Stat i s t i cs Report 2011
TABLE G2 Mother’s County of Residence by Mother’s Marital Status, Total Births
Mother's Marital Status
Frequency Row Per Cent Col. Per Cent
Married Single Widowed Separated Divorced Not Stated Total
Carlow 633 362 0 7 4 1 1,007
62.9 35.9 0.0 0.7 0.4 0.1 100
1.3 1.5 0.0 1.1 1.0 1.6 1.4
Cavan 889 355 3 12 10 2 1,271
69.9 27.9 0.2 0.9 0.8 0.2 100
1.8 1.4 3.3 1.8 2.5 3.1 1.7
Clare 1,186 507 0 5 3 0 1,701
69.7 29.8 0.0 0.3 0.2 0.0 100
2.4 2.1 0.0 0.8 0.7 0.0 2.3
Cork 5,806 2,460 13 58 36 0 8,373
69.3 29.4 0.2 0.7 0.4 0.0 100
12.0 10.0 14.3 8.8 8.8 0.0 11.3
Donegal 1,458 701 2 24 4 1 2,190
66.6 32.0 0.1 1.1 0.2 0.0 100
3.0 2.8 2.2 3.7 1.0 1.6 2.9
Dublin City 9,069 6,311 16 154 99 13 15,662
57.9 40.3 0.1 1.0 0.6 0.1 100
18.7 25.6 17.6 23.5 24.3 20.3 21.1
Dublin County 4,163 1,718 9 64 40 9 6,003
69.3 28.6 0.1 1.1 0.7 0.1 100
8.6 7.0 9.9 9.8 9.8 14.1 8.1
Galway 2,861 1,059 5 31 17 1 3,974
72.0 26.6 0.1 0.8 0.4 0.0 100
5.9 4.3 5.5 4.7 4.2 1.6 5.3
Kerry 1,353 603 6 24 15 0 2,001
67.6 30.1 0.3 1.2 0.7 0.0 100
2.8 2.4 6.6 3.7 3.7 0.0 2.7
Kildare 2,645 1,152 4 35 15 1 3,852
68.7 29.9 0.1 0.9 0.4 0.0 100
5.5 4.7 4.4 5.3 3.7 1.6 5.2
Kilkenny 976 421 2 12 7 0 1,418
68.8 29.7 0.1 0.8 0.5 0.0 100
2.0 1.7 2.2 1.8 1.7 0.0 1.9
Laois 837 484 2 18 8 2 1,351
62.0 35.8 0.1 1.3 0.6 0.1 100
1.7 2.0 2.2 2.7 2.0 3.1 1.8
Leitrim 346 125 0 1 2 0 474
73.0 26.4 0.0 0.2 0.4 0.0 100
0.7 0.5 0.0 0.2 0.5 0.0 0.6
Limerick 2,023 1,087 1 14 7 0 3,132
64.6 34.7 0.0 0.4 0.2 0.0 100
4.2 4.4 1.1 2.1 1.7 0.0 4.2
Longford 424 205 2 9 3 0 643
65.9 31.9 0.3 1.4 0.5 0.0 100
0.9 0.8 2.2 1.4 0.7 0.0 0.9
Louth 1,122 760 3 24 12 0 1,921
58.4 39.6 0.2 1.2 0.6 0.0 100
2.3 3.1 3.3 3.7 2.9 0.0 2.6
Mayo 1,317 468 2 14 11 4 1,816
72.5 25.8 0.1 0.8 0.6 0.2 100
2.7 1.9 2.2 2.1 2.7 6.3 2.4

App endices | 113
TABLE G2 Mother’s County of Residence by Mother’s Marital Status, Total Births (cont.)
Mother's Marital Status
Frequency Row Per Cent Col. Per Cent
Married Single Widowed Separated Divorced Not Stated Total
Meath 2,479 942 0 35 32 3 3,491
71.0 27.0 0.0 1.0 0.9 0.1 100
5.1 3.8 0.0 5.3 7.9 4.7 4.7
Monaghan 596 261 0 5 15 1 878
67.9 29.7 0.0 0.6 1.7 0.1 100
1.2 1.1 0.0 0.8 3.7 1.6 1.2
Offaly 790 428 4 7 5 0 1,234
64.0 34.7 0.3 0.6 0.4 0.0 100
1.6 1.7 4.4 1.1 1.2 0.0 1.7
Roscommon 602 226 0 9 3 0 840
71.7 26.9 0.0 1.1 0.4 0.0 100
1.2 0.9 0.0 1.4 0.7 0.0 1.1
Sligo 596 324 1 7 1 0 929
64.2 34.9 0.1 0.8 0.1 0.0 100
1.2 1.3 1.1 1.1 0.2 0.0 1.2
Tipperary 1,558 817 7 20 9 4 2,415
64.5 33.8 0.3 0.8 0.4 0.2 100
3.2 3.3 7.7 3.0 2.2 6.3 3.2
Waterford 1,075 709 4 21 13 0 1,822
59.0 38.9 0.2 1.2 0.7 0.0 100
2.2 2.9 4.4 3.2 3.2 0.0 2.4
Westmeath 940 464 2 10 5 0 1,421
66.2 32.7 0.1 0.7 0.4 0.0 100
1.9 1.9 2.2 1.5 1.2 0.0 1.9
Wexford 1,350 899 2 17 23 3 2,294
58.8 39.2 0.1 0.7 1.0 0.1 100
2.8 3.6 2.2 2.6 5.7 4.7 3.1
Wicklow 1,390 813 1 19 8 19 2,250
61.8 36.1 0.0 0.8 0.4 0.8 100
2.9 3.3 1.1 2.9 2.0 29.7 3.0
Other 8 6 0 0 0 0 14
57.1 42.9 0.0 0.0 0.0 0.0 100
0.0 0.0 0.0 0.0 0.0 0.0 0.0
Total
48,492 24,667 91 656 407 64 74,377 65.2 33.2 0.1 0.9 0.5 0.1 100 100 100 100 100 100 100 100
Note: See Appendix E for details of county of residence classification.
TABLE G3 Percentage Distribution of Total Births by Mother’s Nationality, 2007–2011
Mother's Nationality 2007 2008 2009 2010 2011 Ireland 79.3 77.5 76.2 75.5 76.2 UK 3.0 2.7 2.6 2.7 2.3 EU15 to EU27 7.2 9.3 10.3 11.3 11.6 Africa 3.6 3.4 3.4 3.0 2.6 Asia 3.6 3.7 4.0 3.9 4.0
Notes: Percentages calculated for the five most frequent nationalities in 2011
‘Not Stated’ values are not included in the calculation of percentages.

114 | Perinatal Stat i s t i cs Report 2011
TABLE G4 Mother’s Average Age by Mother’s Nationality, Total Maternities
Mother's Nationality Average Age in Years Ireland 32.1 UK 31.7 EU15 (excluding Ireland & UK) 33.3 EU15 to EU27 29.1 Rest of Europe 31.1 Africa 31.4 Asia 31.3 America 32.1 Australia 34.3 Total 31.7
Notes: Average ages calculated for nationalities with greater than 100 births. See Appendix F for a description of the classification system for nationality. TABLE G5 Age of Mother by Maternal Parity, Total Maternities
Maternal Parity Frequency Row Per Cent
0 1 2 3 4 5 6 More than 6
Not Stated
Total
Under 20 Years 1,506 162 18 2 0 0 1 0 0 1,689 89.2 9.6 1.1 0.1 0.0 0.0 0.1 0.0 0.0 100 20-24 Years 4,526 2,195 488 109 25 3 0 0 0 7,346 61.6 29.9 6.6 1.5 0.3 0.0 0.0 0.0 0.0 100 25-29 Years 7,998 5,605 2,002 644 193 57 15 6 2 16,522 48.4 33.9 12.1 3.9 1.2 0.3 0.1 0.0 0.0 100 30-34 Years 10,113 9,787 4,349 1,363 434 177 73 48 2 26,346 38.4 37.1 16.5 5.2 1.6 0.7 0.3 0.2 0.0 100 35-39 Years 4,112 5,909 4,652 1,773 553 201 68 84 0 17,352 23.7 34.1 26.8 10.2 3.2 1.2 0.4 0.5 0.0 100 40 Years and 879 1,087 937 454 214 87 34 60 0 3,752 Over 23.4 29.0 25.0 12.1 5.7 2.3 0.9 1.6 0.0 100 Not Stated 1 0 0 0 0 0 0 0 0 1 100.0 0.0 0.0 0.0 0.0 0.0 0.0 0.0 0.0 100 Total
29,135 24,745 12,446 4,345 1,419 525 191 198 4 73,008 39.9 33.9 17.0 6.0 1.9 0.7 0.3 0.3 0.0 100
TABLE G6 Percentage Distribution of Total Births to Primiparous Women by Maternal Age, 2007 and 2011
Maternal Age (years) 2007 2011 Under 20 Years 7.6 5.1 20-24 Years 19.7 15.3 25-29 Years 27.2 27.2 30-34 Years 31.0 34.7 35-39 Years 12.4 14.5 40 Years and Over 2.1 3.2 Total 100 100
Note: ‘Not Stated’ values are not included in the calculation of percentages. TABLE G7 Percentage Distribution of Total Births to Multiparous Women by Maternal Age, 2007 and 2011
Maternal Age (years) 2007 2011 Under 20 Years 0.5 0.4 20-24 Years 7.3 6.4 25-29 Years 20.4 19.4 30-34 Years 36.5 37.0 35-39 Years 29.3 30.2 40 Years and Over 6.0 6.6 Total 100 100
Note: ‘Not Stated’ values are not included in the calculation of percentages.

App endices | 115
TABLE G8 Birthweight (grams) for Primiparous Women: Total Births, Live Births, Stillbirths, Early Neonatal Deaths, Mortality Rates, and Maternities
Total
Births Total Births
%
Live Births
Stillbirths Stillbirth Rate*
Early Neonatal
Deaths
Early Neonatal Mortality
Rate*
Perinatal Mortality
Rate*
Adjusted PMR*
Maternities
Total Births
500-749 86 0.3 59 27 314.0 25 423.7 604.7 580.2 75
750-999 93 0.3 80 13 139.8 7 87.5 215.1 188.9 80
1000-1249 123 0.4 109 14 113.8 5 45.9 154.5 95.7 98
1250-1499 120 0.4 109 11 91.7 2 18.3 108.3 69.6 98
1500-1999 458 1.5 443 15 32.8 5 11.3 43.7 22.3 354
2000-2499 1,209 4.1 1,188 21 17.4 4 3.4 20.7 15.0 1,025
2500-2999 4,087 13.7 4,072 15 3.7 5 1.2 4.9 3.7 3,883
3000-3499 10,296 34.6 10,282 14 1.4 5 0.5 1.8 1.3 10,232
3500-3999 9,564 32.1 9,555 9 0.9 5 0.5 1.5 1.0 9,553
4000-4499 3,179 10.7 3,176 3 0.9 1 0.3 1.3 0.9 3,178
4500 and Over
559 1.9 559 0 0.0 0 0.0 0.0 0.0 559
Not Stated 0 0.0 0 0 0.0 0 0.0 0.0 0.0 0
Total 29,774 100 29,632 142 4.8 64 2.2 6.9 5.1 29,135
Singleton Births
500-749 64 0.2 40 24 375.0 15 375.0 609.4 583.3 64
750-999 67 0.2 56 11 164.2 4 71.4 223.9 187.5 67
1000-1249 76 0.3 66 10 131.6 2 30.3 157.9 135.1 76
1250-1499 73 0.3 64 9 123.3 1 15.6 137.0 73.5 73
1500-1999 268 0.9 254 14 52.2 5 19.7 70.9 38.6 268
2000-2499 850 3.0 829 21 24.7 3 3.6 28.2 21.3 850
2500-2999 3,674 12.9 3,659 15 4.1 4 1.1 5.2 4.1 3,674
3000-3499 10,149 35.6 10,135 14 1.4 5 0.5 1.9 1.3 10,149
3500-3999 9,544 33.5 9,535 9 0.9 5 0.5 1.5 1.0 9,544
4000-4499 3,177 11.1 3,174 3 0.9 1 0.3 1.3 0.9 3,177
4500 and Over
559 2.0 559 0 0.0 0 0.0 0.0 0.0 559
Not Stated 0 0.0 0 0 0.0 0 0.0 0.0 0.0 0
Total 28,501 100 28,371 130 4.6 45 1.6 6.1 4.6 28,501
Multiple Births
500-749 22 1.7 19 3 136.4 10 526.3 590.9 571.4 11
750-999 26 2.0 24 2 76.9 3 125.0 192.3 192.3 13
1000-1249 47 3.7 43 4 85.1 3 69.8 148.9 24.4 22
1250-1499 47 3.7 45 2 42.6 1 22.2 63.8 63.8 25
1500-1999 190 14.9 189 1 5.3 0 0.0 5.3 0.0 86
2000-2499 359 28.2 359 0 0.0 1 2.8 2.8 0.0 175
2500-2999 413 32.4 413 0 0.0 1 2.4 2.4 0.0 209
3000-3499 147 11.5 147 0 0.0 0 0.0 0.0 0.0 83
3500-3999 20 1.6 20 0 0.0 0 0.0 0.0 0.0 9
4000-4499 2 0.2 2 0 0.0 0 0.0 0.0 0.0 1
4500 and Over
0 0.0 0 0 0.0 0 0.0 0.0 0.0 0
Not Stated 0 0.0 0 0 0.0 0 0.0 0.0 0.0 0
Total 1,273 100 1,261 12 9.4 19 15.1 24.4 16.6 634
Notes: * Rate per 1,000 births. For stillbirths, perinatal deaths and adjusted perinatal deaths, rates are calculated on total live births
and stillbirths. For early neonatal deaths, rates are calculated on total live births. There were 4 maternities with parity unknown; these were excluded from this table.

116 | Perinatal Stat i s t i cs Report 2011
TABLE G9 Birthweight (grams) for Multiparous Women: Total Births, Live Births, Stillbirths, Early Neonatal Deaths, Mortality Rates, and Maternities
Total
Births Total
Births % Live
Births Stillbirths Stillbirth
Rate* Early
Neonatal Deaths
Early Neonatal Mortality
Rate*
Perinatal Mortality
Rate*
Adjusted PMR*
Maternities
Total Births 500-749 62 0.1 39 23 371.0 18 461.5 661.3 631.6 60 750-999 70 0.2 55 15 214.3 12 218.2 385.7 283.3 64 1000-1249 87 0.2 72 15 172.4 5 69.4 229.9 151.9 78 1250-1499 99 0.2 85 14 141.4 4 47.1 181.8 119.6 83 1500-1999 454 1.0 427 27 59.5 10 23.4 81.5 39.2 361 2000-2499 1,189 2.7 1,176 13 10.9 12 10.2 21.0 10.2 1,018 2500-2999 4,622 10.4 4,603 19 4.1 5 1.1 5.2 3.5 4,337 3000-3499 13,634 30.6 13,621 13 1.0 11 0.8 1.8 1.2 13,504 3500-3999 16,003 35.9 15,994 9 0.6 9 0.6 1.1 0.6 15,986 4000-4499 7,018 15.7 7,012 6 0.9 1 0.1 1.0 1.0 7,017 4500 and Over
1,360 3.0 1,360 0 0.0 0 0.0 0.0 0.0 1,360
Not Stated 1 0.0 1 0 0.0 1 1000.0 1000.0 1000.0 1 Total 44,599 100 44,445 154 3.5 88 2.0 5.4 3.5 43,869 Singleton Births 500-749 55 0.1 34 21 381.8 18 529.4 709.1 680.0 55 750-999 58 0.1 44 14 241.4 9 204.5 396.6 285.7 58 1000-1249 70 0.2 55 15 214.3 4 72.7 271.4 177.4 70 1250-1499 73 0.2 61 12 164.4 4 65.6 219.2 149.3 73 1500-1999 282 0.7 259 23 81.6 9 34.7 113.5 49.4 282 2000-2499 850 2.0 837 13 15.3 12 14.3 29.4 14.3 850 2500-2999 4,045 9.4 4,026 19 4.7 5 1.2 5.9 4.0 4,045 3000-3499 13,368 31.0 13,355 13 1.0 10 0.7 1.7 1.1 13,368 3500-3999 15,969 37.0 15,960 9 0.6 7 0.4 1.0 0.6 15,969 4000-4499 7,015 16.3 7,009 6 0.9 1 0.1 1.0 1.0 7,015 4500 and Over
1,360 3.2 1,360 0 0.0 0 0.0 0.0 0.0 1,360
Not Stated 1 0.0 1 0 0.0 1 1000.0 1000.0 1000.0 1 Total 43,146 100 43,001 145 3.4 80 1.9 5.2 3.3 43,146 Multiple Births 500-749 7 0.5 5 2 285.7 0 0.0 285.7 285.7 5 750-999 12 0.8 11 1 83.3 3 272.7 333.3 272.7 6 1000-1249 17 1.2 17 0 0.0 1 58.8 58.8 58.8 8 1250-1499 26 1.8 24 2 76.9 0 0.0 76.9 40.0 10 1500-1999 172 11.8 168 4 23.3 1 6.0 29.1 23.4 79 2000-2499 339 23.3 339 0 0.0 0 0.0 0.0 0.0 168 2500-2999 577 39.7 577 0 0.0 0 0.0 0.0 0.0 292 3000-3499 266 18.3 266 0 0.0 1 3.8 3.8 3.8 136 3500-3999 34 2.3 34 0 0.0 2 58.8 58.8 0.0 17 4000-4499 3 0.2 3 0 0.0 0 0.0 0.0 0.0 2 4500 and Over
0 0.0 0 0 0.0 0 0.0 0.0 0.0 0
Not Stated 0 0.0 0 0 0.0 0 0.0 0.0 0.0 0 Total 1,453 100 1,444 9 6.2 8 5.5 11.7 8.3 723
Notes: * Rate per 1,000 births. For stillbirths, perinatal deaths and adjusted perinatal deaths, rates are calculated on total live births
and stillbirths. For early neonatal deaths, rates are calculated on total live births. There were 4 maternities with parity unknown; these were excluded from this table.

App endices | 117
TABLE G10 Birthweight (grams), Numbers and Percentages, Total Live Births
Birthweight (grams) Number Per Cent Less than 1,500 grams 608 0.8 1,500 - 2,499 grams 3,234 4.4 2,500 - 4,499 grams 68,318 92.2 4,500 grams and Over 1,919 2.6 Not Stated 1 0.0 Total 74,080 100.0
TABLE G11 Birthweight (grams) by Sex, Total Live Births
Male Female Total
Number Per Cent Number Per Cent Number Per Cent 500-749 52 0.1 46 0.1 98 0.1 750-999 76 0.2 59 0.2 135 0.2 1000-1249 98 0.3 83 0.2 181 0.2 1250-1499 109 0.3 85 0.2 194 0.3 1500-1999 427 1.1 443 1.2 870 1.2 2000-2499 1,063 2.8 1,301 3.6 2,364 3.2 2500-2999 3,842 10.1 4,833 13.4 8,675 11.7 3000-3499 11,111 29.2 12,793 35.5 23,904 32.3 3500-3999 13,746 36.2 11,805 32.7 25,551 34.5 4000-4499 6,175 16.2 4,013 11.1 10,188 13.8 4500 and Over 1,316 3.5 603 1.7 1,919 2.6 Not Stated 0 0.0 1 0.0 1 0.0 Total 38,015 100.0 36,065 100.0 74,080 100.0

118 | Perinatal Stat i s t i cs Report 2011
TABLE G12 Gestational Age (weeks) at Delivery for Primiparous Women: Total Births, Live Births, Stillbirths, Early Neonatal Deaths, Mortality Rates, and Maternities
Total
Births Total Births
%
Live Births
Stillbirths Stillbirth Rate*
Early Neonatal Deaths
Early Neonatal Mortality
Rate*
Perinatal Mortality
Rate*
Adjusted PMR*
Maternities
Total Births Less than 28 172 0.6 141 31 180.2 33 234.0 372.1 357.1 148 28-31 283 1.0 258 25 88.3 2 7.8 95.4 65.7 230 32-36 1,724 5.8 1,693 31 18.0 12 7.1 24.9 15.8 1,459 37-41 26,320 88.4 26,268 52 2.0 13 0.5 2.5 1.6 26,023 42 and Over 1,273 4.3 1,271 2 1.6 4 3.1 4.7 2.4 1,273 Not Stated 2 0.0 1 1 500.0 0 0.0 500.0 500.0 2 Total 29,774 100 29,632 142 4.8 64 2.2 6.9 5.1 29,135 Singleton Births Less than 28 120 0.4 93 27 225.0 20 215.1 391.7 370.7 120 28-31 184 0.6 162 22 119.6 1 6.2 125.0 100.6 184 32-36 1,197 4.2 1,170 27 22.6 9 7.7 30.1 19.4 1,197 37-41 25,725 90.3 25,674 51 2.0 11 0.4 2.4 1.7 25,725 42 and Over 1,273 4.5 1,271 2 1.6 4 3.1 4.7 2.4 1,273 Not Stated 2 0.0 1 1 500.0 0 0.0 500.0 500.0 2 Total 28,501 100 28,371 130 4.6 45 1.6 6.1 4.6 28,501 Multiple Births Less than 28 52 4.1 48 4 76.9 13 270.8 326.9 326.9 28 28-31 99 7.8 96 3 30.3 1 10.4 40.4 0.0 46 32-36 527 41.4 523 4 7.6 3 5.7 13.3 7.6 262 37-41 595 46.7 594 1 1.7 2 3.4 5.0 0.0 298 42 and Over 0 0.0 0 0 0.0 0 0.0 0.0 0.0 0 Not Stated 0 0.0 0 0 0.0 0 0.0 0.0 0.0 0 Total 1,273 100 1,261 12 9.4 19 15.1 24.4 16.6 634
Notes: * Rate per 1,000 births. For stillbirths, perinatal deaths and adjusted perinatal deaths, rates are calculated on total live births
and stillbirths. For early neonatal deaths, rates are calculated on total live births. There were 4 maternities with parity unknown; these were excluded from this table.
TABLE G13 Gestational Age (weeks) at Delivery for Multiparous Women: Total Births, Live Births, Stillbirths, Early Neonatal Deaths, Mortality Rates, and Maternities
Total
Births Total Births
%
Live Births
Stillbirths Stillbirth Rate*
Early Neonatal Deaths
Early Neonatal Mortality
Rate*
Perinatal Mortality
Rate*
Adjusted PMR*
Maternities
Total Births Less than 28 135 0.3 101 34 251.9 26 257.4 444.4 418.6 127 28-31 250 0.6 223 27 108.0 11 49.3 152.0 105.5 213 32-36 1,956 4.4 1,909 47 24.0 25 13.1 36.8 17.2 1,682 37-41 41,201 92.4 41,159 42 1.0 25 0.6 1.6 0.9 40,790 42 and Over 1,051 2.4 1,049 2 1.9 1 1.0 2.9 2.9 1,051 Not Stated 6 0.0 4 2 333.3 0 0.0 333.3 333.3 6 Total 44,599 100 44,445 154 3.5 88 2.0 5.4 3.5 43,869 Singleton Births Less than 28 117 0.3 86 31 265.0 25 290.7 478.6 450.5 117 28-31 179 0.4 156 23 128.5 8 51.3 173.2 124.3 179 32-36 1,414 3.3 1,369 45 31.8 22 16.1 47.4 21.8 1,414 37-41 40,379 93.6 40,337 42 1.0 24 0.6 1.6 0.9 40,379 42 and Over 1,051 2.4 1,049 2 1.9 1 1.0 2.9 2.9 1,051 Not Stated 6 0.0 4 2 333.3 0 0.0 333.3 333.3 6 Total 43,146 100 43,001 145 3.4 80 1.9 5.2 3.3 43,146 Multiple Births Less than 28 18 1.2 15 3 166.7 1 66.7 222.2 222.2 10 28-31 71 4.9 67 4 56.3 3 44.8 98.6 58.8 34 32-36 542 37.3 540 2 3.7 3 5.6 9.2 5.6 268 37-41 822 56.6 822 0 0.0 1 1.2 1.2 1.2 411 42 and Over 0 0.0 0 0 0.0 0 0.0 0.0 0.0 0 Not Stated 0 0.0 0 0 0.0 0 0.0 0.0 0.0 0 Total 1,453 100 1,444 9 6.2 8 5.5 11.7 8.3 723
Notes: * Rate per 1,000 births. For stillbirths, perinatal deaths and adjusted perinatal deaths, rates are calculated on total live births
and stillbirths. For early neonatal deaths, rates are calculated on total live births. There were 4 maternities with parity unknown; these were excluded from this table.

App endices | 119
TABLE G14 Method of Delivery by Mother’s Postnatal Length of Stay, Singleton and Multiple Births
Postnatal Length of Stay Frequency Row Per Cent Col. Per Cent
0-2 Days 3-5 Days 6-8 Days 9+ Days Not Stated Total
Singleton Births Spontaneous 31,688 8,839 234 41 10 40,812 77.6 21.7 0.6 0.1 0.0 100 80.4 28.9 19.1 16.8 76.9 57.1 Breech/Forceps 191 110 10 0 0 311 61.4 35.4 3.2 0.0 0.0 100 0.5 0.4 0.8 0.0 0.0 0.4 Forceps 1,571 1,340 42 11 0 2,964 53.0 45.2 1.4 0.4 0.0 100 4.0 4.4 3.4 4.5 0.0 4.1 Vacuum extraction 5,007 3,217 86 14 0 8,324 60.2 38.6 1.0 0.2 0.0 100 12.7 10.5 7.0 5.7 0.0 11.6 Caesarean section 911 17,104 851 178 3 19,047 4.8 89.8 4.5 0.9 0.0 100 2.3 55.9 69.5 73.0 23.1 26.6 Other specified & combined 21 3 1 0 0 25 84.0 12.0 4.0 0.0 0.0 100 0.1 0.0 0.1 0.0 0.0 0.0 Total 39,389 30,613 1,224 244 13 71,483
55.1 42.8 1.7 0.3 0.0 100 100 100 100 100 100 100
Multiple Births Spontaneous 220 340 26 4 0 590 37.3 57.6 4.4 0.7 0.0 100 62.3 16.8 8.9 7.5 0.0 21.6 Breech/Forceps 37 74 3 1 0 115 32.2 64.3 2.6 0.9 0.0 100 10.5 3.7 1.0 1.9 0.0 4.2 Forceps 12 48 1 1 0 62 19.4 77.4 1.6 1.6 0.0 100 3.4 2.4 0.3 1.9 0.0 2.3 Vacuum extraction 47 109 12 0 0 168 28.0 64.9 7.1 0.0 0.0 100 13.3 5.4 4.1 0.0 0.0 6.2 Caesarean section 37 1,455 250 47 2 1,791 2.1 81.2 14.0 2.6 0.1 100 10.5 71.8 85.6 88.7 100.0 65.7 Other specified & combined 0 0 0 0 0 0 0.0 0.0 0.0 0.0 0.0 0.0 0.0 0.0 0.0 0.0 0.0 0.0 Total 353 2,026 292 53 2 2,726
12.9 74.3 10.7 1.9 0.1 100 100 100 100 100 100 100
Note: Domiciliary births, of which there were 168 births, are excluded from this table. See Section Six for detailed analysis.

120 | Perinatal Stat i s t i cs Report 2011
TABLE G15 Method of Delivery by Parity, Total, Singleton and Multiple Births
Total Births Singleton Births Multiple Births
Number Per cent Number Per cent Number Per cent Total Births Spontaneous 41,568 55.9 40,978 57.2 590 21.6 Breech/Forceps 425 0.6 310 0.4 115 4.2 Forceps 3,026 4.1 2,964 4.1 62 2.3 Vacuum extraction 8,492 11.4 8,324 11.6 168 6.2 Caesarean section 20,837 28.0 19,046 26.6 1,791 65.7 Other specified & combined 25 0.0 25 0.0 0 0.0
Total 74,373 100 71,647 100 2,726 100 Births to Primiparous Women Spontaneous 12,078 40.6 11,922 41.8 156 12.3 Breech/Forceps 210 0.7 162 0.6 48 3.8 Forceps 2,517 8.5 2,473 8.7 44 3.5 Vacuum extraction 6,157 20.7 6,053 21.2 104 8.2 Caesarean section 8,812 29.6 7,891 27.7 921 72.3 Other specified & combined 0 0.0 0 0.0 0 0.0 Total 29,774 100 28,501 100 1,273 100 Births to Multiparous Women Spontaneous 29,490 66.1 29,056 67.3 434 29.9 Breech/Forceps 215 0.5 148 0.3 67 4.6 Forceps 509 1.1 491 1.1 18 1.2 Vacuum extraction 2,335 5.2 2,271 5.3 64 4.4 Caesarean section 12,025 27.0 11,155 25.9 870 59.9 Other specified & combined 25 0.1 25 0.1 0 0.0 Total 44,599 100 43,146 100 1,453 100
Note: There were 4 maternities with parity unknown; these were excluded from this table.

App endices | 121
TABLE G16 Mother’s County of Residence by Infant’s Type of Feeding, Total Live Births
Type of Feeding Frequency Row Per Cent Col. Per Cent
Artificial Breast Combined Not Stated Total
Carlow 483 497 21 0 1,001 48.3 49.7 2.1 0.0 100 1.5 1.4 0.3 0.0 1.4 Cavan 660 556 49 0 1,265 52.2 44.0 3.9 0.0 100 2.0 1.6 0.8 0.0 1.7 Clare 948 633 106 0 1,687 56.2 37.5 6.3 0.0 100 2.9 1.8 1.7 0.0 2.3 Cork 3,311 4,407 615 0 8,333 39.7 52.9 7.4 0.0 100 10.0 12.8 9.7 0.0 11.3 Donegal 1,277 740 157 0 2,174 58.7 34.0 7.2 0.0 100 3.9 2.1 2.5 0.0 2.9 Dublin City 6,097 7,829 1,650 0 15,576 39.1 50.3 10.6 0.0 100 18.4 22.7 26.0 0.0 21.1 Dublin County 2,079 3,224 673 1 5,977 34.8 53.9 11.3 0.0 100 6.3 9.4 10.6 33.3 8.1 Galway 1,670 1,622 661 0 3,953 42.2 41.0 16.7 0.0 100 5.0 4.7 10.4 0.0 5.3 Kerry 1,013 843 137 0 1,993 50.8 42.3 6.9 0.0 100 3.1 2.4 2.2 0.0 2.7 Kildare 1,665 1,782 378 0 3,825 43.5 46.6 9.9 0.0 100 5.0 5.2 6.0 0.0 5.2 Kilkenny 660 739 11 0 1,410 46.8 52.4 0.8 0.0 100 2.0 2.1 0.2 0.0 1.9 Laois 652 641 53 0 1,346 48.4 47.6 3.9 0.0 100 2.0 1.9 0.8 0.0 1.8 Leitrim 237 179 53 0 469 50.5 38.2 11.3 0.0 100 0.7 0.5 0.8 0.0 0.6 Limerick 1,930 980 194 0 3,104 62.2 31.6 6.3 0.0 100 5.8 2.8 3.1 0.0 4.2 Longford 318 291 28 0 637 49.9 45.7 4.4 0.0 100 1.0 0.8 0.4 0.0 0.9 Louth 1,029 717 161 0 1,907 54.0 37.6 8.4 0.0 100 3.1 2.1 2.5 0.0 2.6 Mayo 854 628 318 0 1,800 47.4 34.9 17.7 0.0 100 2.6 1.8 5.0 0.0 2.4

122 | Perinatal Stat i s t i cs Report 2011
TABLE G16 Mother’s County of Residence by Infant’s Type of Feeding, Total Live Births (cont.)
Type of Feeding Frequency Row Per Cent Col. Per Cent
Artificial Breast Combined Not Stated Total
Meath 1,520 1,669 284 1 3,474 43.8 48.0 8.2 0.0 100 4.6 4.8 4.5 33.3 4.7 Monaghan 479 343 51 0 873 54.9 39.3 5.8 0.0 100 1.4 1.0 0.8 0.0 1.2 Offaly 675 514 35 1 1,225 55.1 42.0 2.9 0.1 100 2.0 1.5 0.6 33.3 1.7 Roscommon 398 360 73 0 831 47.9 43.3 8.8 0.0 100 1.2 1.0 1.2 0.0 1.1 Sligo 439 330 153 0 922 47.6 35.8 16.6 0.0 100 1.3 1.0 2.4 0.0 1.2 Tipperary 1,289 1,048 56 0 2,393 53.9 43.8 2.3 0.0 100 3.9 3.0 0.9 0.0 3.2 Waterford 756 1,018 35 0 1,809 41.8 56.3 1.9 0.0 100 2.3 3.0 0.6 0.0 2.4 Westmeath 613 733 66 0 1,412 43.4 51.9 4.7 0.0 100 1.8 2.1 1.0 0.0 1.9 Wexford 1,128 1,051 104 0 2,283 49.4 46.0 4.6 0.0 100 3.4 3.1 1.6 0.0 3.1 Wicklow 968 1,056 210 0 2,234 43.3 47.3 9.4 0.0 100 2.9 3.1 3.3 0.0 3.0 Other 2 10 2 0 14 14.3 71.4 14.3 0.0 100 0.0 0.0 0.0 0.0 0.0 Total 33,150 34,440 6,334 3 73,927
44.8 46.6 8.6 0.0 100 100 100 100 100 100
Note: See Appendix E for details of county of residence classification. This table excludes Early Neonatal Deaths.
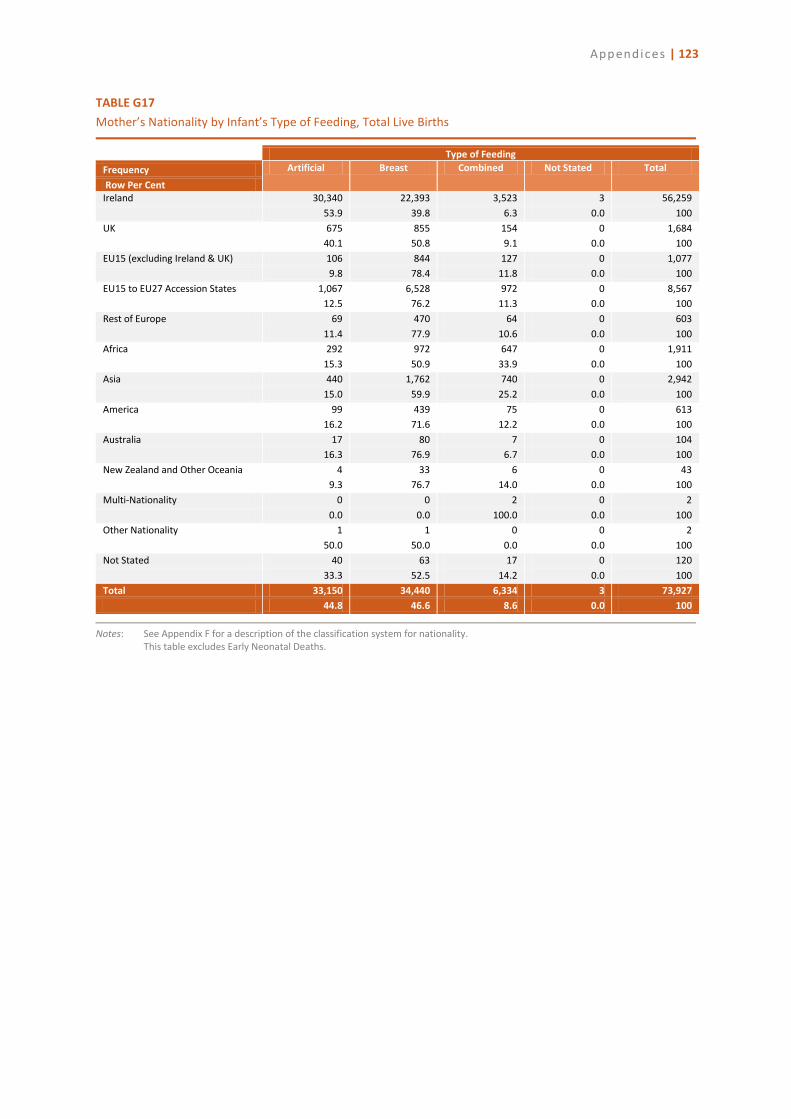
App endices | 123
TABLE G17 Mother’s Nationality by Infant’s Type of Feeding, Total Live Births
Type of Feeding
Frequency Artificial Breast Combined Not Stated Total
Row Per Cent Ireland 30,340 22,393 3,523 3 56,259 53.9 39.8 6.3 0.0 100 UK 675 855 154 0 1,684 40.1 50.8 9.1 0.0 100 EU15 (excluding Ireland & UK) 106 844 127 0 1,077 9.8 78.4 11.8 0.0 100 EU15 to EU27 Accession States 1,067 6,528 972 0 8,567 12.5 76.2 11.3 0.0 100 Rest of Europe 69 470 64 0 603 11.4 77.9 10.6 0.0 100 Africa 292 972 647 0 1,911 15.3 50.9 33.9 0.0 100 Asia 440 1,762 740 0 2,942 15.0 59.9 25.2 0.0 100 America 99 439 75 0 613 16.2 71.6 12.2 0.0 100 Australia 17 80 7 0 104 16.3 76.9 6.7 0.0 100 New Zealand and Other Oceania 4 33 6 0 43 9.3 76.7 14.0 0.0 100 Multi-Nationality 0 0 2 0 2 0.0 0.0 100.0 0.0 100 Other Nationality 1 1 0 0 2 50.0 50.0 0.0 0.0 100 Not Stated 40 63 17 0 120 33.3 52.5 14.2 0.0 100 Total 33,150 34,440 6,334 3 73,927 44.8 46.6 8.6 0.0 100
Notes: See Appendix F for a description of the classification system for nationality. This table excludes Early Neonatal Deaths.

124 | Perinatal Stat i s t i cs Report 2011
TABLE G18 Birthweight (grams): Total Births, Antepartum and Intrapartum Stillbirths, Early Neonatal Deaths, and Mortality Rates
Total
Births Total Births
%
Ante-partum
Stillbirths
Intra-partum
Stillbirths
Not Stated
Stillbirth Rate*
Early Neonatal Deaths
Early Neonatal Mortality
Rate*
Perinatal Mortality
Rate*
Adjusted PMR*
Total Births 500-749 148 0.2 38 9 3 337.8 43 438.8 628.4 601.4 750-999 163 0.2 25 3 0 171.8 19 140.7 288.3 226.7 1000-1249 210 0.3 24 4 1 138.1 10 55.2 185.7 118.6 1250-1499 219 0.3 21 3 1 114.2 6 30.9 141.6 91.8 1500-1999 913 1.2 39 4 0 47.1 15 17.2 63.5 31.7 2000-2499 2,398 3.2 28 6 0 14.2 16 6.8 20.9 12.6 2500-2999 8,709 11.7 31 2 1 3.9 10 1.2 5.1 3.6 3000-3499 23,931 32.2 24 2 1 1.1 16 0.7 1.8 1.2 3500-3999 25,569 34.4 15 3 0 0.7 15 0.6 1.3 0.8 4000-4499 10,197 13.7 8 0 1 0.9 2 0.2 1.1 1.0 4500 and
1,919 2.6 0 0 0 0.0 0 0.0 0.0 0.0
Not Stated 1 0.0 0 0 0 0.0 1 1000.0 1000.0 1000.0 Total 74,377 100 253 36 8 4.0 153 2.1 6.1 4.1 Singleton Births 500-749 119 0.2 34 8 3 378.2 33 445.9 655.5 627.3 750-999 125 0.2 22 3 0 200.0 13 130.0 304.0 230.1 1000-1249 146 0.2 20 4 1 171.2 6 49.6 212.3 154.4 1250-1499 146 0.2 17 3 1 143.8 5 40.0 178.1 111.1 1500-1999 551 0.8 34 4 0 69.0 14 27.3 94.4 45.9 2000-2499 1,700 2.4 28 6 0 20.0 15 9.0 28.8 17.8 2500-2999 7,719 10.8 31 2 1 4.4 9 1.2 5.6 4.0 3000-3499 23,518 32.8 24 2 1 1.1 15 0.6 1.8 1.2 3500-3999 25,515 35.6 15 3 0 0.7 13 0.5 1.2 0.8 4000-4499 10,192 14.2 8 0 1 0.9 2 0.2 1.1 1.0 4500 and
1,919 2.7 0 0 0 0.0 0 0.0 0.0 0.0
Not Stated 1 0.0 0 0 0 0.0 1 1000.0 1000.0 1000.0 Total 71,651 100 233 35 8 3.9 126 1.8 5.6 3.8 Multiple Births 500-749 29 1.1 4 1 0 172.4 10 416.7 517.2 500.0 750-999 38 1.4 3 0 0 78.9 6 171.4 236.8 216.2 1000-1249 64 2.3 4 0 0 62.5 4 66.7 125.0 34.5 1250-1499 73 2.7 4 0 0 54.8 1 14.5 68.5 55.6 1500-1999 362 13.3 5 0 0 13.8 1 2.8 16.6 11.1 2000-2499 698 25.6 0 0 0 0.0 1 1.4 1.4 0.0 2500-2999 990 36.3 0 0 0 0.0 1 1.0 1.0 0.0 3000-3499 413 15.2 0 0 0 0.0 1 2.4 2.4 2.4 3500-3999 54 2.0 0 0 0 0.0 2 37.0 37.0 0.0 4000-4499 5 0.2 0 0 0 0.0 0 0.0 0.0 0.0 4500 and
0 0.0 0 0 0 0.0 0 0.0 0.0 0.0
Not Stated 0 0.0 0 0 0 0.0 0 0.0 0.0 0.0 Total 2,726 100 20 1 0 7.7 27 10.0 17.6 12.2
Note: * Rate per 1,000 births. For stillbirths, perinatal deaths and adjusted perinatal deaths, rates are calculated on total live births
and stillbirths. For early neonatal deaths, rates are calculated on total live births.

App endic ies | 125
APPENDIX H DOMICILIARY BIRTHS, 2002–2011
INTRODUCTION
In the NPRS, domiciliary births are defined as planned home births attended by an independent midwife and are not associated with a hospital. Births delivered under hospital-administered home birth schemes are recorded as hospital births. Domiciliary births have been included, unless otherwise stated, in the analysis presented in previous sections.
Table H1 presents selected statistics for domiciliary births for the period 2002 to 2011.
• There were 168 domiciliary births in 2011 representing just 0.2 per cent of all births.
• The number of domiciliary births has decreased by 41.7 per cent over the decade while the decrease from 2010 is estimated at 5.1 percent. The lowest number of domiciliary births over the 10-year period was reported for 2009 (148) and the highest number reported in 2002 (288) (see Figure H1).
• The average age of mothers having domiciliary births has remained stable, ranging from 33.4 years in 2005 to 35.0 years in 2009 and is recorded as 33.7 years in 2011.
• For all domiciliary births in 2011, 29.2 per cent were to single mothers compared with 22.7 per cent in 2002.
• Women choosing a domiciliary delivery in 2011 had an average maternal parity of 1.5 previous births.
• The percentage of women recording any breastfeeding was 95.1 per cent in 2002; this has increased to 99.4 per cent in 2011.
• Exclusively breastfeeding was reported for 98.2 per cent of domiciliary births in 2011.
• The average birthweight for domiciliary births in 2011 was 3,679.6 grams.
More detailed analysis of domiciliary births for 2011 is presented in Tables H2 to H7, including the maternal characteristics of maternal age, parity and marital status, as well as details of the perinatal characteristics and care including gestational age, birthweight and type of feeding.

126| Per inatal Stat i st ics Report 2011
TABLE H1 Trends in Domiciliary Births–Selected Statistics, 2002–2011
2002 2003 2004 2005 2006 2007 2008 2009 2010 2011 % Change
2002-2011 2010-2011 General Characteristics Total Domiciliary Births 288 236 202 183 170 186 158 148 177 168 -41.7 -5.1 Age of mother (years)1 Avg 34.1 34.0 34.3 33.4 34.3 34.1 34.3 35.0 33.8 33.7 -1.2 -0.3 Single mothers1, 2 % 22.7 28.0 29.2 23.5 20.0 16.1 25.3 22.3 24.4 29.2 28.6 19.7 Maternal parity1 Avg 1.7 1.6 1.6 1.7 1.7 1.6 1.5 1.7 1.4 1.5 -11.8 7.1 Gestational age at delivery in weeks1 Avg 40.1 40.1 40.0 40.0 40.1 40.0 40.1 40.0 40.0 40.0 -0.2 0.0 Interval since last birth (years)3 Avg 3.7 3.7 3.5 3.3 3.4 3.4 3.6 3.7 3.4 3.2 -13.5 -5.9 Immunity to Rubella1 % 91.6 94.1 97.0 95.1 96.5 100.0 96.2 98.0 97.2 97.0 5.9 -0.2 Any Breastfeeding4,5 % 95.1 95.8 98.0 94.0 98.2 96.2 95.6 97.3 97.2 99.4 4.5 2.3
Exclusive Breastfeeding4 % 94.0 94.1 97.5 94.0 97.1 95.7 95.6 97.3 96.6 98.2 4.5 1.7 Combined Antenatal Care - Midwife and G.P./Hospital6 % 57.7 66.1 64.4 71.6 76.5 60.8 77.8 99.3 98.9 93.5 62.0 -5.5 Birthweight (grams)7 Avg 3730.1 3754.3 3738.4 3760.1 3742.2 3699.2 3667.1 3764.9 3833.9 3679.6 -1.4 -4.0 Low Birthweight (<2,500 grams)7 % 0.3 0.0 1.0 0.5 0.6 1.1 0.6 0.0 0.0 0.0 -100.0 -
Notes: 'Not Stated' values are not included in the calculation of percentages.
There were no domiciliary multiple births in the years 2002 -2011. 1 Based on maternities. 2 Data recording marital status as 'never married' are classified as 'single' in this report. 3 Based on multiparous maternities. 4 Based on maternities with live births. Excludes early neonatal deaths. 5 Any breastfeeding includes type of feeding recorded as either breast or combined. 6 Based on maternities. This figure applies to the percentage of home births where antenatal care is stated as 'combined', rather than 'midwife only'. 7 Based on live births.

App endic ies | 127
FIGURE H1 Number and Percentage of Domiciliary Births Reported, 2002–2011
Note: See Table 2.2 and Table H1 for data.
TABLE H2 Age of Mother by Maternal Parity
Maternal Parity Frequency 0 1 2 3 4 5 6 Total Row Per Cent Col. Per Cent < 25 Years 4 2 0 0 0 0 0 6 66.7 33.3 0.0 0.0 0.0 0.0 0.0 100 10.5 3.6 0.0 0.0 0.0 0.0 0.0 3.6 25-29 Years 13 9 8 2 0 0 0 32 40.6 28.1 25.0 6.3 0.0 0.0 0.0 100 34.2 16.4 18.2 7.7 0.0 0.0 0.0 19.0 30-34 Years 13 23 13 9 0 1 0 59 22.0 39.0 22.0 15.3 0.0 1.7 0.0 100 34.2 41.8 29.5 34.6 0.0 50.0 0.0 35.1 35-39 Years 5 17 20 13 2 0 1 58 8.6 29.3 34.5 22.4 3.4 0.0 1.7 100 13.2 30.9 45.5 50.0 100.0 0.0 100.0 34.5 40 Years and Over 3 4 3 2 0 1 0 13 23.1 30.8 23.1 15.4 0.0 7.7 0.0 100 7.9 7.3 6.8 7.7 0.0 50.0 0.0 7.7 Total 38 55 44 26 2 2 1 168 22.6 32.7 26.2 15.5 1.2 1.2 0.6 100 100 100 100 100 100 100 100 100
0.00
0.05
0.10
0.15
0.20
0.25
0.30
0.35
0.40
0.45
0.50
0
50
100
150
200
250
300
350
2002 2003 2004 2005 2006 2007 2008 2009 2010 2011
Num
ber o
f Dom
icilia
ry B
irths
Domicilary Births Domiciliary Births as a Percentage of Total Births
Dom
icila
ryBi
rths
as a
Per
cent
age o
f Tot
al B
irths
(%)

128| Per inatal Stat i st ics Report 2011
TABLE H3 Mother's Marital Status by Age of Mother
Age of Mother Frequency < 25
Years 25-29 Years
30-34 Years
35-39 Years
40+ Years
Total Row Per Cent Col. Per Cent Married 1 14 43 47 9 114 0.9 12.3 37.7 41.2 7.9 100 16.7 43.8 72.9 81.0 69.2 67.9 Single 5 18 14 10 2 49 10.2 36.7 28.6 20.4 4.1 100 83.3 56.3 23.7 17.2 15.4 29.2 Other* 0 0 2 1 2 5 0.0 0.0 40.0 20.0 40.0 100 0.0 0.0 3.4 1.7 15.4 3.0 Total 6 32 59 58 13 168 3.6 19.0 35.1 34.5 7.7 100 100 100 100 100 100 100
Note: * Includes widowed, separated, divorced and 'not stated'. TABLE H4 Age of Mother by Gestational Age (weeks) at Delivery
Gestational Age (weeks) Frequency 37-41 42 and Over Total Row Per Cent Col. Per Cent < 25 Years 6 0 6 100.0 0.0 100 3.8 0.0 3.6 25-29 Years 30 2 32 93.8 6.3 100 18.9 22.2 19.0 30-34 Years 55 4 59 93.2 6.8 100 34.6 44.4 35.1 35-39 Years 55 3 58 94.8 5.2 100 34.6 33.3 34.5 40 Years and Over 13 0 13 100.0 0.0 100 8.2 0.0 7.7 Total 159 9 168 94.6 5.4 100 100 100 100

App endic ies | 129
TABLE H5 Birthweight (grams) by Gestational Age (weeks) at Delivery
Gestational Age (weeks) Frequency 37-41 42 and Over Total Row Per Cent Col. Per Cent <3000 7 1 8 87.5 12.5 100 4.4 11.1 4.8 3000-3499 50 1 51 98.0 2.0 100 31.4 11.1 30.4 3500-3999 65 4 69 94.2 5.8 100 40.9 44.4 41.1 4000-4499 31 2 33 93.9 6.1 100 19.5 22.2 19.6 4500 and Over 6 1 7 85.7 14.3 100 3.8 11.1 4.2 Total 159 9 168 94.6 5.4 100 100 100 100
TABLE H6 Mother's Occupation by Birthweight
Birthweight (grams) Frequency <3000 3000-
3499 3500- 3999
4000- 4499
4500 and Over
Total Row Per Cent Col. Per Cent Farmers and Farm Managers 0 1 1 0 0 2 0.0 50.0 50.0 0.0 0.0 100 0.0 2.0 1.4 0.0 0.0 1.2 Other Agricultural Occupations & Fishermen 0 1 1 0 0 2 0.0 50.0 50.0 0.0 0.0 100 0.0 2.0 1.4 0.0 0.0 1.2 Higher Professional 0 3 4 1 1 9 0.0 33.3 44.4 11.1 11.1 100 0.0 5.9 5.8 3.0 14.3 5.4 Lower Professional 1 13 19 11 3 47 2.1 27.7 40.4 23.4 6.4 100 12.5 25.5 27.5 33.3 42.9 28.0 Employers & Managers 2 1 4 2 0 9 22.2 11.1 44.4 22.2 0.0 100 25.0 2.0 5.8 6.1 0.0 5.4 Intermediate Non-Manual Workers 2 4 6 0 1 13 15.4 30.8 46.2 0.0 7.7 100 25.0 7.8 8.7 0.0 14.3 7.7 Other Non-Manual Workers 1 13 12 2 1 29 3.4 44.8 41.4 6.9 3.4 100 12.5 25.5 17.4 6.1 14.3 17.3 Skilled Manual Workers 0 0 2 4 0 6 0.0 0.0 33.3 66.7 0.0 100 0.0 0.0 2.9 12.1 0.0 3.6 Unemployed 0 1 0 0 1 2 0.0 50.0 0.0 0.0 50.0 100 0.0 2.0 0.0 0.0 14.3 1.2 Not Classifiable 1 1 2 2 0 6 16.7 16.7 33.3 33.3 0.0 100 12.5 2.0 2.9 6.1 0.0 3.6 Home Duties 1 13 18 11 0 43 2.3 30.2 41.9 25.6 0.0 100 12.5 25.5 26.1 33.3 0.0 25.6 Total 8 51 69 33 7 168 4.8 30.4 41.1 19.6 4.2 100 100 100 100 100 100 100
Note: See Appendix C for a description of the classification system for occupation.

130| Per inatal Stat i st ics Report 2011
TABLE H7 Mother's Occupation by Type of Feeding
Type of Feeding Frequency Artificial Breast Combined Total Row Per Cent Col. Per Cent Farmers and Farm Managers 0 2 0 2 0.0 100.0 0.0 100 0.0 1.2 0.0 1.2 Other Agricultural Occupations & Fishermen 0 2 0 2 0.0 100.0 0.0 100 0.0 1.2 0.0 1.2 Higher Professional 0 9 0 9 0.0 100.0 0.0 100 0.0 5.5 0.0 5.4 Lower Professional 0 47 0 47 0.0 100.0 0.0 100 0.0 28.5 0.0 28.0 Employers & Managers 0 8 1 9 0.0 88.9 11.1 100 0.0 4.8 50.0 5.4 Intermediate Non-Manual Workers 0 13 0 13 0.0 100.0 0.0 100 0.0 7.9 0.0 7.7 Other Non-Manual Workers 1 28 0 29 3.4 96.6 0.0 100 100.0 17.0 0.0 17.3 Skilled Manual Workers 0 6 0 6 0.0 100.0 0.0 100 0.0 3.6 0.0 3.6 Unemployed 0 2 0 2 0.0 100.0 0.0 100 0.0 1.2 0.0 1.2 Not Classifiable 0 6 0 6 0.0 100.0 0.0 100 0.0 3.6 0.0 3.6 Home Duties 0 42 1 43 0.0 97.7 2.3 100 0.0 25.5 50.0 25.6 Total 1 165 2 168 0.6 98.2 1.2 100 100 100 100 100
Note: See Appendix C for a description of the classification system for occupation.


Health Research and Information Division The Economic and Social Research Institute Whitaker Square Sir John Rogerson's Quay Dublin 2 Ireland Telephone + 353 1 8632000 Fax + 353 1 8632100 www.esri.ie ISBN 978-0-7070-0348-1