Embed Size (px)
Citation preview
Contents lists available at ScienceDirect
NeuroImage: Clinical
journal homepage: www.elsevier.com/locate/ynicl
Performance of unscented Kalman filter tractography in edema: Analysis ofthe two-tensor model
Ruizhi Liaoa,b, Lipeng Ninga, Zhenrui Chena, Laura Rigoloa, Shun Gonga,c, Ofer Pasternaka,Alexandra J. Golbya, Yogesh Rathia, Lauren J. O’Donnella,*
a Brigham and Women's Hospital, Harvard Medical School, Boston, MA, USAb Massachusetts Institute of Technology, Cambridge, MA, USAc Shanghai Changzheng Hospital, Shanghai, China
A R T I C L E I N F O
Keywords:White matterDiffusion MRIEdemaTractographyDTI
A B S T R A C T
Diffusion MRI tractography is increasingly used in pre-operative neurosurgical planning to visualize critical fibertracts. However, a major challenge for conventional tractography, especially in patients with brain tumors, istracing fiber tracts that are affected by vasogenic edema, which increases water content in the tissue and lowersdiffusion anisotropy. One strategy for improving fiber tracking is to use a tractography method that is moresensitive than the traditional single-tensor streamline tractography.
We performed experiments to assess the performance of two-tensor unscented Kalman filter (UKF) tracto-graphy in edema. UKF tractography fits a diffusion model to the data during fiber tracking, taking advantage ofprior information from the previous step along the fiber. We studied UKF performance in a synthetic diffusionMRI digital phantom with simulated edema and in retrospective data from two neurosurgical patients withedema affecting the arcuate fasciculus and corticospinal tracts. We compared the performance of several trac-tography methods including traditional streamline, UKF single-tensor, and UKF two-tensor. To provide practicalguidance on how the UKF method could be employed, we evaluated the impact of using various seed regionsboth inside and outside the edematous regions, as well as the impact of parameter settings on the tractographysensitivity. We quantified the sensitivity of different methods by measuring the percentage of the patient-specificfMRI activation that was reached by the tractography.
We expected that diffusion anisotropy threshold parameters, as well as the inclusion of a free water model,would significantly influence the reconstruction of edematous WM fiber tracts, because edema increases watercontent in the tissue and lowers anisotropy. Contrary to our initial expectations, varying the fractional aniso-tropy threshold and including a free water model did not affect the UKF two-tensor tractography output ap-preciably in these two patient datasets. The most effective parameter for increasing tracking sensitivity was thegeneralized anisotropy (GA) threshold, which increased the length of tracked fibers when reduced to 0.075. Inaddition, the most effective seeding strategy was seeding in the whole brain or in a large region outside of theedema.
Overall, the main contribution of this study is to provide insight into how UKF tractography can work, using atwo-tensor model, to begin to address the challenge of fiber tract reconstruction in edematous regions near braintumors.
1. Introduction
A principal goal of modern surgical treatment for brain tumors is tomaximize tumor removal while minimizing damage to critical areas offunctioning brain (Sanai and Berger, 2008; McGirt et al., 2009). Dif-fusion magnetic resonance imaging (MRI) is currently the only way toillustrate brain white matter (WM) pathways in-vivo and non-invasively
(Le Bihan, 2003). Diffusion MRI is able to capture the local micro-structure of white matter by measuring the diffusion of particles,usually water molecules. Based on diffusion MRI data, the brain's WMfiber tracts can be virtually reconstructed or traced throughout thebrain using computational methods called tractography (e.g. Conturoet al., 1999; Jones et al., 1999; Mori et al., 1999; Weinstein et al., 1999;Basser et al., 2000a; Westin et al., 2002; Lazar et al., 2003; Behrens
http://dx.doi.org/10.1016/j.nicl.2017.06.027Received 10 November 2016; Received in revised form 1 June 2017; Accepted 19 June 2017
* Corresponding author.E-mail address: [email protected] (L.J. O’Donnell).
NeuroImage: Clinical 15 (2017) 819–831
Available online 26 June 20172213-1582/ © 2017 Published by Elsevier Inc. This is an open access article under the CC BY-NC-ND license (http://creativecommons.org/licenses/BY-NC-ND/4.0/).
MARK
et al., 2003), a process where fiber trajectories are traced in a stepwisefashion according to local WM models. Diffusion MRI tractography isincreasingly used in pre-operative surgical planning to provide preciseinformation about the spatial relationship of tumors to surroundingcritical WM tracts, such as the corticospinal tract supporting motorfunction and the arcuate fasciculus supporting language function (Taloset al., 2003; Nimsky et al., 2005).
Diffusion tensor imaging (DTI), generated by fitting a single-tensormodel to the diffusion-weighted MRI (DW-MRI) signals (Basser et al.,1994), is the most commonly used method to model the microstructureof white matter and the current clinical standard. However, the single-tensor model is not able to represent complex WM configurations, suchas fiber crossings or partial volume effects (Alexander et al., 2001; Tuchet al., 2002). Due primarily to this limitation, tractography analysesbased on DTI underestimate the full anatomical extent of fiber tracts(Kinoshita et al., 2005; Le Bihan et al., 2006; Duffau, 2014; Feigl et al.,2014). Some improvement can be achieved by DTI tractography ap-proaches that employ information from the previous step (Weinsteinet al., 1999; Lazar et al., 2003; Westin et al., 2002) during fibertracking. These approaches improve anatomical accuracy of tracto-graphy for neurosurgical planning (Feigl et al., 2014), though they stillsuffer from the basic limitations of the DTI model.
An additional challenge for tractography for neurosurgical planningis peritumoral edema, where water and protein cross the blood-brainbarrier in the region near brain tumors (Jellison et al., 2004;Papadopoulos et al., 2004). The increase in extracellular water changesthe diffusion profile, though fiber tracts may still be intact. Tracto-graphy methods based on the single tensor DTI model are known to failin clinically important regions of peritumoral edema (Berman et al.,2004; Pasternak et al., 2009; Nimsky et al., 2016). This is particularlytroublesome since the area around the tumor is the most relevant tosurgical decision-making.
There is a growing awareness in the neurosurgery community thatdiffusion models must move beyond the current clinical standard of thediffusion tensor model in order to handle fiber crossings for betteranatomical accuracy of fiber tracts (Nimsky, 2014; Farquharson et al.,2013; Fernandez-Miranda, 2013; Kuhnt et al., 2013). While manygroups have shown that sophisticated imaging and better mathematicalmodeling can improve tracing of fiber tracts in the brain (Tuch et al.,2003; Qazi et al., 2009; Descoteaux et al., 2009; Malcolm et al., 2010 LeBihan and Johansen-Berg, 2012; Rathi et al., 2013), this extensive bodyof work has been developed for application to neuroscientific studies orin patients without overt brain lesions, where edema is generally not aconsideration.
A multi-compartment modeling method provides an alternative totheoretically address the challenges of fiber crossings and edema, but itis faced with the problem of how to get a “best” estimation for theincreased number of model parameters. By using a two-compartmenttensor model, the effect of edema was reduced on measurements of thetensor trace (Pierpaoli and Jones, 2004), but it is an ill-posed problemto fit the two-tensor model to DW-MRI data. The estimation can beimproved by increasing the number of measurements and diffusionweightings, which, however, requires increased acquisition time(Pierpaoli and Jones, 2004). The estimation of a multi-tensor model canalso be stabilized by performing it during fiber tracking, and this is theapproach that we test here.
In this paper, we show that the challenge of edematous WM fiberreconstruction in clinical data can be addressed to some extent by un-scented Kalman filter (UKF) tractography with a two-tensor model(Malcolm et al., 2010), and we analyze the performance of the method.We have recently performed an empirical study demonstrating thattwo-tensor UKF tractography can trace a higher volume of the arcuatefasciculus (AF) and the corticospinal tract (CST) affected by edema,when compared to single-tensor streamline in neurosurgical patients(Chen et al., 2015, 2016). Here, we investigate the more technical de-tails of the performance of the UKF method in edema, and we assess its
performance quantitatively by making reference to individual subjectfMRI. The rest of this paper is organized as follows. First, we describethe theory and the model applied, the relevant model parameters, andthe synthetic and patient datasets used in this study. Then, we performexperiments to evaluate the performance of UKF tractography inedema, and we investigate its strengths and limitations. Finally, wemake recommendations for the use of the presented technique.
2. Materials and methods
2.1. Theory
2.1.1. Background theory: two-tensor modelA single full diffusion tensor model is commonly used for relating
the DW-MRI signals to the structure of white matter (Basser et al.(1994)). For this single-tensor model, the amount of signal loss Sq,caused by water diffusion, is modeled by the following equation:
= −S S e/ g Dgq
b0 q q
T(1)
where S0 is the original signal without diffusion weighting (Basser,1995); gq is the unit direction of a diffusion gradient; D is the diffusiontensor to be fit; and the factor b is used to describe the gradient timingand strength (Le Bihan et al., 1986).
However, fitting a single tensor to the DW-MRI signals may lead toerror, especially when the structure of white matter in a voxel iscomplicated. Two-tensor models have been proposed for addressingfiber crossing (Tuch et al., 2002; Peled et al., 2006; Pasternak et al.,2008; Qazi et al., 2009) and for removing cerebrospinal fluid (CSF)contamination (Pierpaoli and Jones, 2004; Pasternak et al., 2009).
For the two-tensor model, the signal loss Sq compared to the originalsignal S0 can be described by:
= − +− −S S f e fe/ (1 ) g D g g D gq
b b0 q q q q
T T1 2 (2)
where f, (1 − f) are the relative volume fractions of the two compart-ments, and D1, D2 represent the two tensors. In most cases, the two-tensor model has some additional and physically reasonable con-straints. Some authors have set the three eigenvalues (λ1, λ2, λ2) toconstants (Tuch et al., 2002). The approach followed by many groups(Parker and Alexander, 2005; Peled et al., 2006; Kaden et al., 2007;Friman et al., 2006; Pasternak et al., 2008), including the current im-plementation of UKF tractography (Malcolm et al., 2010), is to modelthe smaller two eigenvalues λ2 and λ3 as equal, i.e. each tensor is cy-lindrical.
2.1.2. Background theory: UKF tractographyStreamline tractography starts from an initial seed point and re-
peatedly propagates the fibers (Conturo et al., 1999; Jones et al., 1999;Mori et al., 1999; Weinstein et al., 1999; Basser et al., 2000a; Westinet al., 2002; Lazar et al., 2003). The propagation follows the equation:
=r td sds
s( ) ( ) (3)
where r(s) is a 3D space curve to represent the fiber tract trajectory, andt(s) is the local tangent orientation of the curve at s (Basser et al.(2000b)). In the fiber propagation, one of the problems is how to fit themodel to the DW-MRI signals consistently in each step. In most trac-tography methods, the model estimations in each voxel are independentand are performed prior to tractography.
In the UKF tractography framework (Malcolm et al., 2010), si-multaneous model parameter estimation and tractography are per-formed using an unscented Kalman filter (Wan and Van Der Merwe,2000). The model parameters, a ten-component vector representing thetwo cylindrical tensors, comprise the system state vector xs at locations, calculated as:
= + −− −x x K y y( )s s s s s s s1 1| | (4)
R. Liao et al. NeuroImage: Clinical 15 (2017) 819–831
820
where −xs s 1| and −ys s 1| are the mean of the sampled states and mea-surements at s predicted from the previously estimated distributions ats − 1, ys is the DW-MRI signal (current measurement), and Ks is calledKalman gain, to tune the certainty of the current estimate xs and themeasurement ys.
At each point along the traced fiber, the model parameters withtheir mean and covariance are estimated by the unscented Kalmanfilter. Then the fiber is propagated forward in the direction of the firsttensor's principal eigenvector. This approach offers a causal estimationof the local structure at each step.
The UKF tractography method initializes tracking with two equaltensors at the seedpoint location. As tracking moves away from theinitial seedpoint, in the course of fitting the data, the model tends toseparate into two different tensors that can represent the tract beingtraced, plus any other crossing fibers.
2.2. Parameters of UKF tractography
The default parameters of UKF were intended for healthy or rela-tively structurally sound subject data for use in neuroscientific studies.In such studies, false positive connections are avoided when possible. Incontrast, in neurosurgical planning it can be useful to increase thenumber of fibers that can be traced in order to track through difficultregions such as peritumoral edema. We note that the default parametersof UKF tractography work reasonably well in edema, and we haveshown that the model performs significantly better than the single-tensor model in a small study of our patient data (Chen et al., 2015,2016). However, we would like to better understand the behavior of themethod in a neurosurgical context. Several parameters of the UKFmodel are relevant for the application of tracking through edema(Table 1). These parameters were expected to significantly influence thereconstruction of edematous WM fiber tracts, because edema increaseswater content in the tissue and lowers diffusion anisotropy.
2.2.1. Fractional Anisotropy (FA)The FA is a normalized variance of the diffusion tensor's eigenvalues
(Pierpaoli et al., 1996) and is the traditional stopping threshold forstandard single-tensor tractography, and it is frequently lowered toallow tracking to continue farther into edematous regions (Akai et al.,2005). In UKF, the FA that is used as a stopping criterion (min FA) is theFA of the tensor that is being tracked (tensor one):
=− + − + −
+ +=
−
+FA λ λ λ λ λ λ
λ λ λλ λ
λ λ12
( ) ( ) ( ) 12
2( )2
1 22
1 32
2 32
12
22
32
1 22
12
22 (5)
where λ1, λ2 and λ3 are the three eigenvalues of tensor one, and λ2, λ3are constrained to be equal in the UKF model.
2.2.2. Generalized Anisotropy (GA)The GA is a normalized variance of the diffusivities computed from
all of the DW-MRIs. This measure does not use any model, tensor orotherwise. GA is computed as:
=−
∑ −
∑=
=
GA nn
S SS1
( )in
i
in
i
12
12
(6)
where Si is the signal measured after the application of diffusion-sen-sitizing gradient i, n is the number of the gradients and S is the averageof the sensitized signals.
2.2.3. free waterThe free water parameter controls the inclusion of a free-water
model as part of the model used for fitting the DW-MRI signals. Thefree-water model is a single-tensor model whose three eigenvalues areall equal to 0.003 mm2/s (Pasternak et al., 2009). With the inclusion ofthe free water term, the multi-tensor model becomes:
= − − + +− − −S S ω f e fe ωe/ (1 )((1 ) )g D g g D gq
b b bd0 q q q q
T T1 2 (7)
where ω is the relative volume fraction of the free-water compartment,d is the diffusivity value of the free-water model which is 0.003 mm2/sand the other parameters are the same as those in Eq. (2).
2.2.4. qLqL is the expected rate of change of the eigenvalues (system noise).
We studied qL as edema is expected to change the eigenvalues instead ofthe eigenvectors, which represent the orientation of the fibers. (We notethat in the original work (Malcolm et al., 2010), qL was called qλ.) InUKF tractography, qL forms part of the injected covariance matrix Qcontaining noise bias to eigenvalues and eigenvectors (Malcolm et al.,2010). The measurement noise denoted by R, which relates to the ex-pected noise in the data, was held constant in our experiments(Malcolm et al., 2010).
In UKF tractography, the Kalman gain Ks is obtained by Px yPy y−1,
where Px y is the estimated cross correlation matrix between the statevector xs and the DW-MRIs ys, and Py y
−1 is the estimated covariancematrix of ys (Malcolm et al., 2010). Therefore, the increase of qL willlead to increase of the Kalman gain Ks, which means that the eigen-values can change more quickly as the fiber tracking encounterschanges in the data.
2.2.5. seeds per voxelThe number of seeds per voxel is the number of times tractography
is initiated within each voxel in a seeding region. If it satisfies thestarting thresholds, each seed will trace out a fiber. Therefore, usingmore seeds usually generates more fibers. The choice of a value for thisparameter depends on the voxel size of the data (if voxels are larger,more seeds will be needed within each) and on the machine used to runthe UKF tractography, because a larger number of seeds will consumemore computational time. In our experiments, the two patient datasetshave voxel sizes of 2 × 2 × 3 mm3 and 2 × 2×2.6 mm3 (in-planevoxel sizes interpolated to 1 × 1 mm2 on the scanner), and one seed pervoxel produced a number of traced fibers that was adequate to de-monstrate the performance of UKF tractography.
2.3. Phantom data generation
In order to have a preliminary understanding of UKF tractographyperformance in edematous brain tissue in a relatively simplified situa-tion, we started our experiments with synthetic (digital) phantomconsisting of parallel fibers with added edema. The phantom was gen-erated as synthetic DW-MRI data, using fractional anisotropy (FA) va-lues and mean diffusivity (MD) values to characterize normal whitematter and edema. Outside the simulated edema, the FA and MD valueswere in the range of normal white matter (Pierpaoli et al., 1996), while
Table 1Parameters of UKF tractography that are relevant to tracking through edema, as well asthe values we tested in the patient data. We note that this is not an exhaustive list of allpossible parameters, but rather indicates those on which we focused our experiments dueto their potential effects on the output. While we did not vary the number of seeds in-itiated per voxel, the parameter is relevant for increasing the output number of fibers,especially in datasets with larger voxel sizes.
UKFparameter
Measured from Description Default Tested
min FA tensor 1 Stopping anisotropythreshold
0.15 0.1, 0.15
min GA DWI data Stopping anisotropythreshold
0.1 0.05, 0.075,0.1
free water multitensormodel
Isotropic free watercomponent
Off On/Off
qL (input value) Eigenvalue rate ofchange
50 100, 200
seeds pervoxel
(input value) Fibers initiated pervoxel
1 1
R. Liao et al. NeuroImage: Clinical 15 (2017) 819–831
821
inside the simulated edema, the FA and MD values were in the range ofperitumoral edematous brain (Sinha et al., 2002; Holodny andOllenschlager, 2002; Lu et al., 2003).
The phantom data model combined a full diffusion tensor (to modelnormal white matter) and a spherical compartment (to model edema).Parallel tracts ran the length of each phantom, whose size was150 mm× 110 mm×110 mm with voxel dimensions of2 mm× 2 mm×2 mm. In the center of each phantom, a region ofedema was simulated. Synthetic DW-MRI data was generated using 81gradient directions uniformly spread on the hemisphere. The form ofthe signal model was:
= − +− −S S ω e ωe/ (1 ) u D u u Iui
b b d0 i i i iT Twm fw (8)
where Si is the signal measured after the application of diffusion-sen-sitizing gradient in the unit direction of ui, S0 is the signal in the absenceof diffusion sensitization, ω is the proportion of unweighted signal fromthe isotropic compartment, Dw m is the diffusion tensor to delineate thelocal microstructure of white matter and dfw is the apparent diffusioncoefficient (ADC) of the isotropic compartment. The free-water model isused to approximate the additional liquid (containing protein, water,etc.) in edema. In our model, b= 1000 s/mm2, Dw
m = λ1nxnxT+λ2nynyT + λ3nznzT where λ1 = 1100 × 10−6 mm2/s,λ2 = λ3 = 450×10−6 mm2/s, and dfw = 3000×10−6 mm2/s. Theisotropic signal weight ω varied along the long axis of the phantom,from 0 in the two ends to 0.65 in the middle, simulating edematousbrain tissue in the phantom's center. The diffusion MRI signal is influ-enced by Rician distributed noise (Gudbjartsson and Patz, 1995; Aja-Fernández et al., 2008; Rodrigues et al., 2010). To make the phantommore realistic, noise was applied to each diffusion signal Si such that thenoisy signal Si′ complied with Rician distribution f(Si′|Si,σ= Si/15),which suggests that the signal-to-noise ratio (SNR) was around 15.
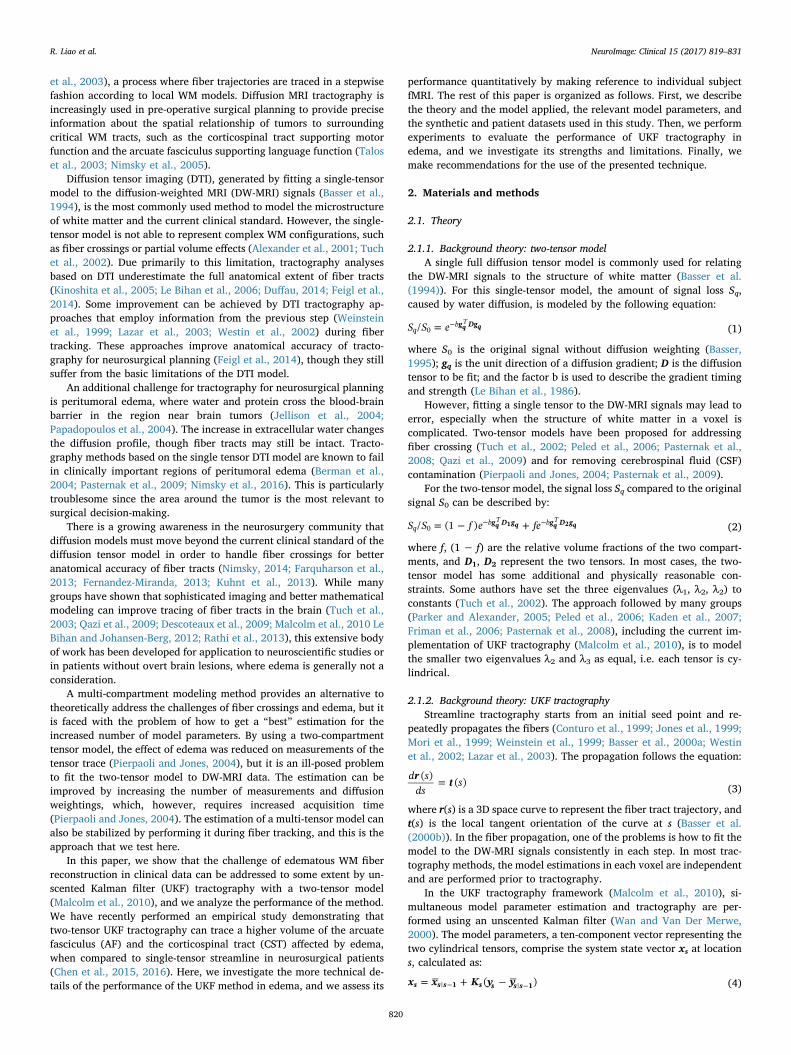
One phantom was generated, where the synthetic edematous fibershad minimum FA values of 0.2 and maximum MD values of1560 × 10−6 mm2/s, respectively (Fig. 1). Tractography processingwas performed in the phantom dataset using 3D Slicer (http://www.slicer.org, version 4) (Fedorov et al., 2012) via the SlicerDMRI project(http://dmri.slicer.org) and using UKF tractography as describedbelow.
2.4. Patient data acquisition and processing
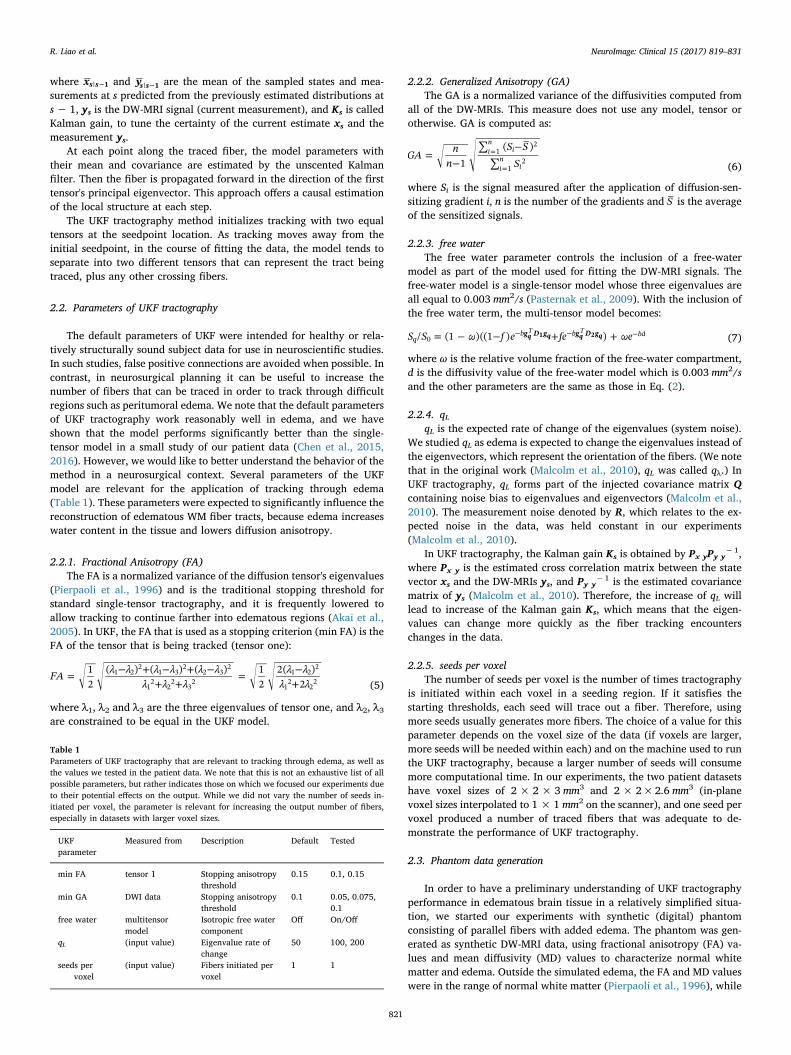
To illustrate and test clinically relevant parameters of UKF tracto-graphy, we retrospectively selected two brain tumor patients withperitumoral edema affecting different structures: the arcuate fasciculus(AF) in one patient (Patient 1) and the corticospinal tract (CST) in theother (Patient 2). The two patients were selected for inclusion in thisstudy from a data repository of neurosurgical patients who have un-dergone diffusion imaging at Brigham and Women's Hospital. The studywas approved by the Partners Healthcare Institutional Review Board,and informed consent had been obtained from all participants prior toscanning. Patient 1 had a glioblastoma multiforme tumor with a peri-tumoral edematous zone in the vicinity of the language cortex, affecting
the AF. Patient 2 had two metastatic lesions of unclassified pleomorphicsarcoma in the left frontal lobe, affecting the CST, and presented withright upper extremity weakness. Their axial T1-weighted image slicesare illustrated in Fig. 2. MR images were obtained using a 3-Teslascanner (EXCITE Signa scanner, GE Medical System, Milwaukee, WI,USA) with Excite 14.0, using an 8-channel head coil and array spatialsensitivity encoding technique (ASSET). Diffusion weighted imageswere acquired using EPI with 8 channel head coil and ASSET(TR = 14000 ms, TE = 75.4 ms, 31 gradient directions with a b-valueof 1000 s/mm2, 1 baseline (b=0) image, FOV = 25.6 cm, ma-trix = 128 × 128, 44 and 52 slices, voxel size = 2 × 2× 3 mm3 and2 × 2 × 2.6 mm3 for the two datasets). The in-plane voxel sizes wereinterpolated to 1 × 1 mm2 on the scanner. fMRI images (used forquantifying the sensitivity of the tractography) were acquired using T2-weighted EPI with a birdcage coil (TR = 2000 ms, TE = 75.4 ms,FOV = 24 cm, matrix = 80 × 80, 27 axial slices, voxel si-ze = 2 × 2 × 4 mm3). For Patient 1, task-based fMRI was obtainedusing an antonym task, and for Patient 2, three motor tasks were em-ployed: lip pursing, foot tapping, and hand clenching.
3D Slicer was used to convert the raw data from DICOM format intoNRRD format using DWIConvert (Matsui, 2014). DTIPrep (http://www.nitrc.org/projects/dtiprep) was used to perform quality control (Liuet al., 2010), which included artifact correction/removal as well aseddy-current and head motion artifacts correction by registration to thebaseline image. A binary brain mask for each patient dataset wascomputed in 3D Slicer. Tractography processing was performed inseveral experiments as described below.
3. Results
We performed several experiments in phantom and patient data,both to evaluate the performance of UKF tractography in edema, and toinvestigate its strengths and limitations.
3.1. Phantom experiments
3.1.1. UKF tractography versus streamline tractography in the phantomFirst, we compared the performance of standard single-tensor
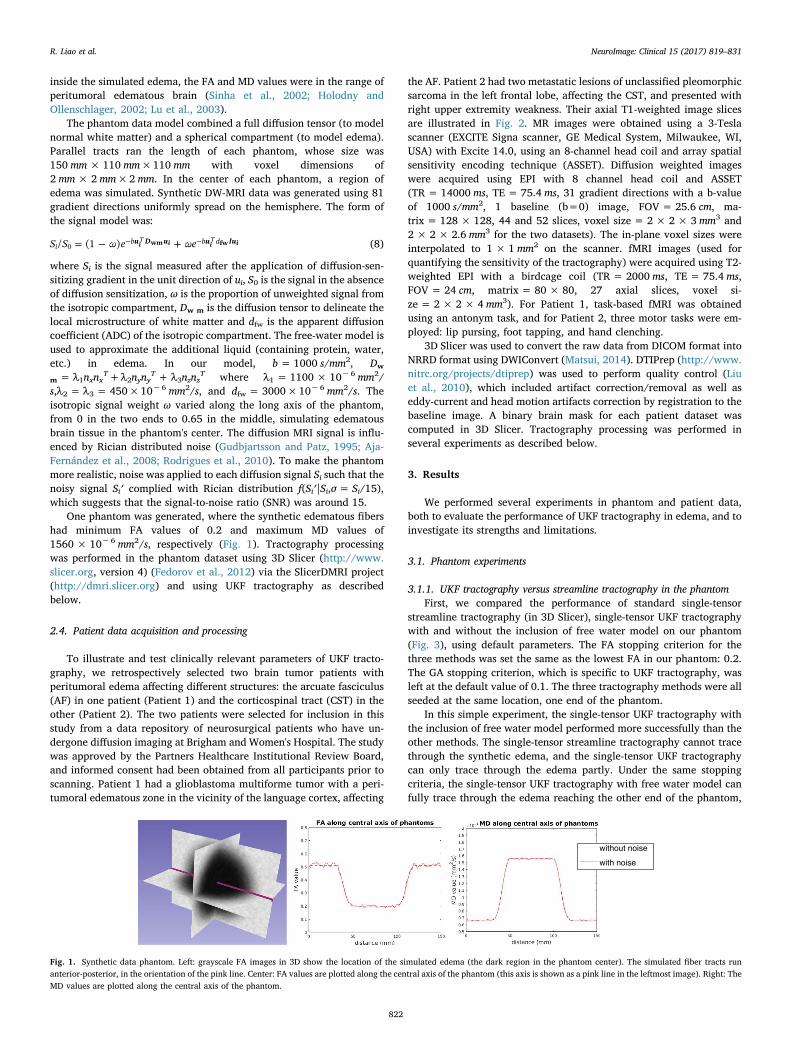
streamline tractography (in 3D Slicer), single-tensor UKF tractographywith and without the inclusion of free water model on our phantom(Fig. 3), using default parameters. The FA stopping criterion for thethree methods was set the same as the lowest FA in our phantom: 0.2.The GA stopping criterion, which is specific to UKF tractography, wasleft at the default value of 0.1. The three tractography methods were allseeded at the same location, one end of the phantom.
In this simple experiment, the single-tensor UKF tractography withthe inclusion of free water model performed more successfully than theother methods. The single-tensor streamline tractography cannot tracethrough the synthetic edema, and the single-tensor UKF tractographycan only trace through the edema partly. Under the same stoppingcriteria, the single-tensor UKF tractography with free water model canfully trace through the edema reaching the other end of the phantom,
Fig. 1. Synthetic data phantom. Left: grayscale FA images in 3D show the location of the simulated edema (the dark region in the phantom center). The simulated fiber tracts runanterior-posterior, in the orientation of the pink line. Center: FA values are plotted along the central axis of the phantom (this axis is shown as a pink line in the leftmost image). Right: TheMD values are plotted along the central axis of the phantom.
R. Liao et al. NeuroImage: Clinical 15 (2017) 819–831
822
which implies that the orientation of the fibers can be better retained inthe tensor estimation when the additional free water model is included.It is clear that the edematous fibers need to be modeled by a moresophisticated model than the single-tensor model. The following ex-periments investigate the two-tensor UKF tractography and the effectsof seeding regions and parameters on the output.
3.1.2. Different seeding regions in the phantomNext we evaluated the performance of two-tensor UKF tractography
when seeded from different regions. Two representative regions werechosen as seeding regions in the phantom, one at the end of thephantom and outside of the central edema as above, and the other atthe center of the phantom and inside of the edema (Fig. 4). These werechosen to mimic two possible clinical seeding scenarios for trackingthrough edema in patients with brain tumors. Two-tensor UKF tracto-graphy with the FA stopping criterion of 0.16 was applied to each ofthese seed regions, and the other parameters were set as the default(Table 1). We lowered the FA stopping criterion here to get more fiberstraced through the synthetic edema.
The tractography results show that the tract orientation was betterestablished when tracking started outside of the synthetic edema,where the anisotropy was high. We also found that when seeded outsideof the edema, in the fibers that were traced through the edema, the twotensors started diverging: one tensor retained its orientation and theother tensor became more round.
3.2. Patient data experiments
Next, we assessed the performance of UKF tractography in retro-spective neurosurgical patient data. We performed experiments tocompare one-tensor and two-tensor UKF tractography results, to
investigate the effect of different seeding regions and to assess the effectof tractography parameters in clinical patient datasets.
3.2.1. Comparison of one-tensor and two-tensor UKFIn the phantom results, fibers can be traced through edema when
using single-tensor UKF, whereas more typical single-tensor streamlinetractography cannot. We have recently shown that two-tensor UKFtractography can trace a higher volume of the AF and the CST affectedby edema, when compared to single-tensor streamline (Chen et al.,2015, 2016). However, this leaves open the question of if the differ-ences in tractography are due to the UKF method or to the two-tensormodel. For this reason, we began the experiments in patient data bycomparing the performance of single-tensor UKF to two-tensor UKFtractography in patient datasets 1 and 2 (Figs. 5, 6). In these experi-ments, tractography was seeded throughout the entire brain using alldefault parameters of the algorithm (note that parameters will be testedbelow). Regions of interest (ROIs) were drawn to select the AF in Pa-tient 1 and the CST in Patient 2. The results in AF and CST, wherecrossing fibers are known to affect the ability to trace the full structure,clearly demonstrate that the combination of the two-tensor model andthe UKF tractography provides more fibers that can be traced throughthe edema, as shown in Figs. 5, 6. For this reason, in the rest of theexperiments we focused solely on the two-tensor UKF method.
3.2.2. Different seeding regions in patient dataUnlike our synthetic phantoms that had only one fiber tract or-
ientation everywhere, the fiber tract anatomy of the brain varies withlocation. UKF tractography offers a causal estimation of the localstructure along the fiber, which suggests that the initial seeding pointsmay have a great influence on the output fibers. Therefore, differentseeding regions for UKF tractography were tested to demonstrate the
Fig. 2. (a) Axial image from Patient 1 with a left fronto-parietalglioblastoma multiforme tumor and peritumoral edematouszone. (b) Axial image from Patient 2, with two metastatic lesionsof unclassified pleomorphic sarcoma in the left frontal lobe andperitumoral edema. Gadolinium was given before the MRIscans.
Fig. 3. Recovery of simulated edematousfiber tracts. Three tractography methodswere seeded in the synthetic edemaphantom with minimum FA of 0.2. (a) Aphantom containing parallel fibers run-ning anterior-posterior (indicated bygreen color) with a region of syntheticedema in the phantom center. Simulatededematous tracts were recovered (yellowfibers) using default parameters for trac-tography. (b) The single-tensor streamline
tractography that used independent single-tensor estimation at each voxel (least-squares) followed by Runge-Kutta order two integration for fiber tracking in 3D Slicer. (c) and (d) Thetwo UKF methods (single tensor with and without free water model) that performed model estimation during tracking, using a Kalman filter.
R. Liao et al. NeuroImage: Clinical 15 (2017) 819–831
823
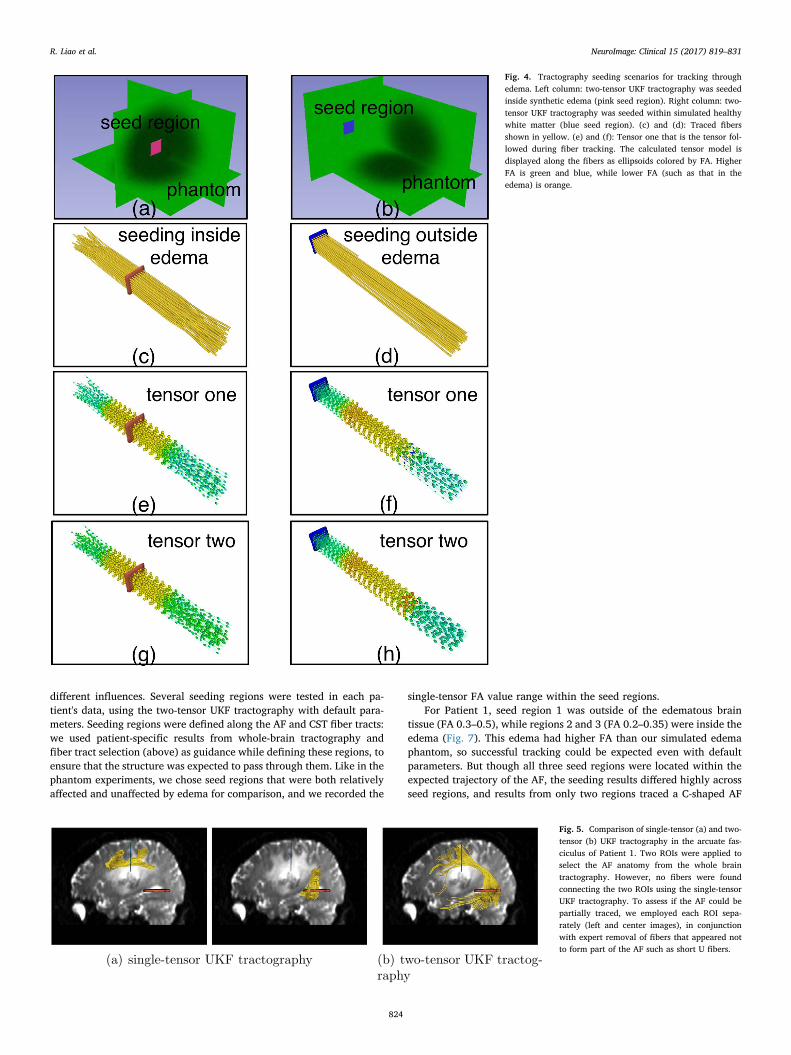
different influences. Several seeding regions were tested in each pa-tient's data, using the two-tensor UKF tractography with default para-meters. Seeding regions were defined along the AF and CST fiber tracts:we used patient-specific results from whole-brain tractography andfiber tract selection (above) as guidance while defining these regions, toensure that the structure was expected to pass through them. Like in thephantom experiments, we chose seed regions that were both relativelyaffected and unaffected by edema for comparison, and we recorded the
single-tensor FA value range within the seed regions.For Patient 1, seed region 1 was outside of the edematous brain
tissue (FA 0.3–0.5), while regions 2 and 3 (FA 0.2–0.35) were inside theedema (Fig. 7). This edema had higher FA than our simulated edemaphantom, so successful tracking could be expected even with defaultparameters. But though all three seed regions were located within theexpected trajectory of the AF, the seeding results differed highly acrossseed regions, and results from only two regions traced a C-shaped AF
Fig. 4. Tractography seeding scenarios for tracking throughedema. Left column: two-tensor UKF tractography was seededinside synthetic edema (pink seed region). Right column: two-tensor UKF tractography was seeded within simulated healthywhite matter (blue seed region). (c) and (d): Traced fibersshown in yellow. (e) and (f): Tensor one that is the tensor fol-lowed during fiber tracking. The calculated tensor model isdisplayed along the fibers as ellipsoids colored by FA. HigherFA is green and blue, while lower FA (such as that in theedema) is orange.
Fig. 5. Comparison of single-tensor (a) and two-tensor (b) UKF tractography in the arcuate fas-ciculus of Patient 1. Two ROIs were applied toselect the AF anatomy from the whole braintractography. However, no fibers were foundconnecting the two ROIs using the single-tensorUKF tractography. To assess if the AF could bepartially traced, we employed each ROI sepa-rately (left and center images), in conjunctionwith expert removal of fibers that appeared notto form part of the AF such as short U fibers.
R. Liao et al. NeuroImage: Clinical 15 (2017) 819–831
824
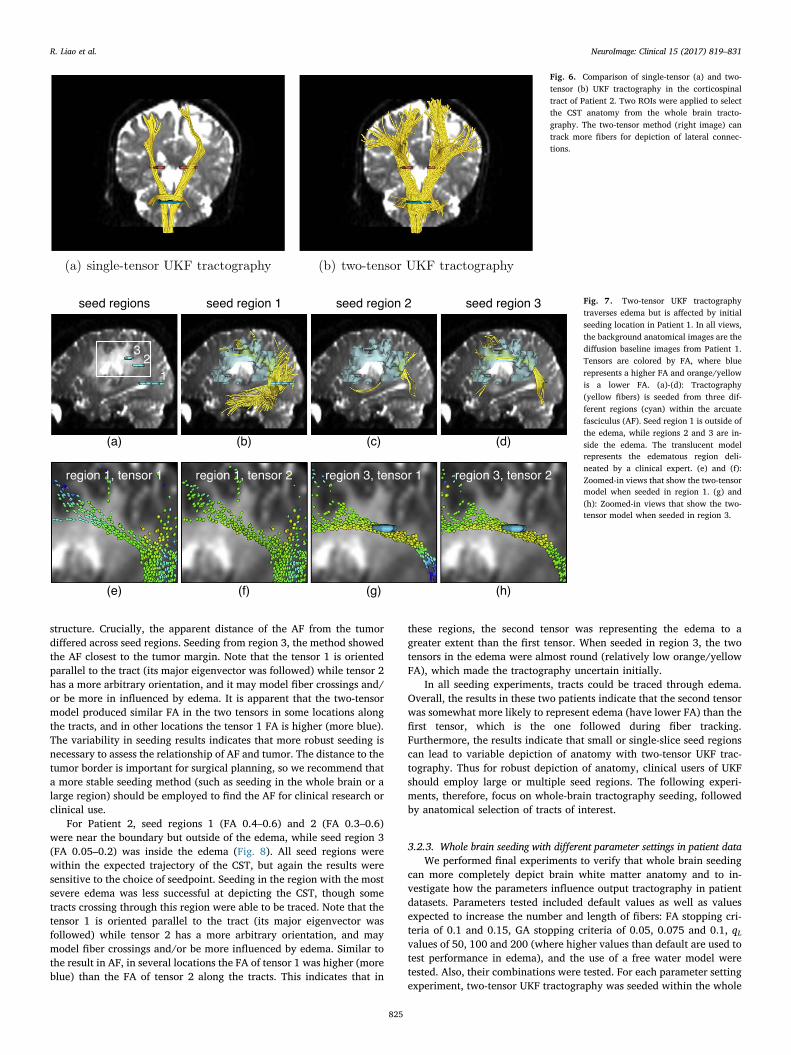
structure. Crucially, the apparent distance of the AF from the tumordiffered across seed regions. Seeding from region 3, the method showedthe AF closest to the tumor margin. Note that the tensor 1 is orientedparallel to the tract (its major eigenvector was followed) while tensor 2has a more arbitrary orientation, and it may model fiber crossings and/or be more in influenced by edema. It is apparent that the two-tensormodel produced similar FA in the two tensors in some locations alongthe tracts, and in other locations the tensor 1 FA is higher (more blue).The variability in seeding results indicates that more robust seeding isnecessary to assess the relationship of AF and tumor. The distance to thetumor border is important for surgical planning, so we recommend thata more stable seeding method (such as seeding in the whole brain or alarge region) should be employed to find the AF for clinical research orclinical use.
For Patient 2, seed regions 1 (FA 0.4–0.6) and 2 (FA 0.3–0.6)were near the boundary but outside of the edema, while seed region 3(FA 0.05–0.2) was inside the edema (Fig. 8). All seed regions werewithin the expected trajectory of the CST, but again the results weresensitive to the choice of seedpoint. Seeding in the region with the mostsevere edema was less successful at depicting the CST, though sometracts crossing through this region were able to be traced. Note that thetensor 1 is oriented parallel to the tract (its major eigenvector wasfollowed) while tensor 2 has a more arbitrary orientation, and maymodel fiber crossings and/or be more influenced by edema. Similar tothe result in AF, in several locations the FA of tensor 1 was higher (moreblue) than the FA of tensor 2 along the tracts. This indicates that in
these regions, the second tensor was representing the edema to agreater extent than the first tensor. When seeded in region 3, the twotensors in the edema were almost round (relatively low orange/yellowFA), which made the tractography uncertain initially.
In all seeding experiments, tracts could be traced through edema.Overall, the results in these two patients indicate that the second tensorwas somewhat more likely to represent edema (have lower FA) than thefirst tensor, which is the one followed during fiber tracking.Furthermore, the results indicate that small or single-slice seed regionscan lead to variable depiction of anatomy with two-tensor UKF trac-tography. Thus for robust depiction of anatomy, clinical users of UKFshould employ large or multiple seed regions. The following experi-ments, therefore, focus on whole-brain tractography seeding, followedby anatomical selection of tracts of interest.
3.2.3. Whole brain seeding with different parameter settings in patient dataWe performed final experiments to verify that whole brain seeding
can more completely depict brain white matter anatomy and to in-vestigate how the parameters influence output tractography in patientdatasets. Parameters tested included default values as well as valuesexpected to increase the number and length of fibers: FA stopping cri-teria of 0.1 and 0.15, GA stopping criteria of 0.05, 0.075 and 0.1, qLvalues of 50, 100 and 200 (where higher values than default are used totest performance in edema), and the use of a free water model weretested. Also, their combinations were tested. For each parameter settingexperiment, two-tensor UKF tractography was seeded within the whole
Fig. 6. Comparison of single-tensor (a) and two-tensor (b) UKF tractography in the corticospinaltract of Patient 2. Two ROIs were applied to selectthe CST anatomy from the whole brain tracto-graphy. The two-tensor method (right image) cantrack more fibers for depiction of lateral connec-tions.
Fig. 7. Two-tensor UKF tractographytraverses edema but is affected by initialseeding location in Patient 1. In all views,the background anatomical images are thediffusion baseline images from Patient 1.Tensors are colored by FA, where bluerepresents a higher FA and orange/yellowis a lower FA. (a)-(d): Tractography(yellow fibers) is seeded from three dif-ferent regions (cyan) within the arcuatefasciculus (AF). Seed region 1 is outside ofthe edema, while regions 2 and 3 are in-side the edema. The translucent modelrepresents the edematous region deli-neated by a clinical expert. (e) and (f):Zoomed-in views that show the two-tensormodel when seeded in region 1. (g) and(h): Zoomed-in views that show the two-tensor model when seeded in region 3.
R. Liao et al. NeuroImage: Clinical 15 (2017) 819–831
825
brain of each patient dataset, using the binary brain mask as a seedregion. As above, the ROIs (Figs. 5, 6) were used to select the AF inPatient 1 and the CST in Patient 2.
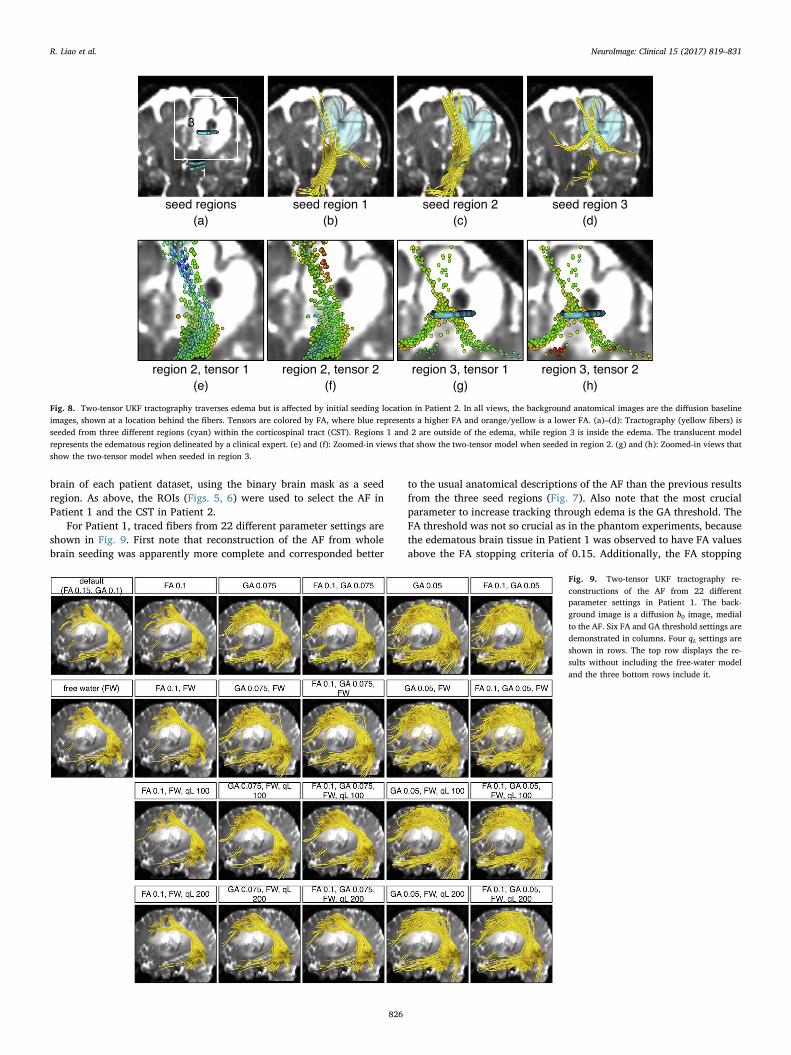
For Patient 1, traced fibers from 22 different parameter settings areshown in Fig. 9. First note that reconstruction of the AF from wholebrain seeding was apparently more complete and corresponded better
to the usual anatomical descriptions of the AF than the previous resultsfrom the three seed regions (Fig. 7). Also note that the most crucialparameter to increase tracking through edema is the GA threshold. TheFA threshold was not so crucial as in the phantom experiments, becausethe edematous brain tissue in Patient 1 was observed to have FA valuesabove the FA stopping criteria of 0.15. Additionally, the FA stopping
Fig. 8. Two-tensor UKF tractography traverses edema but is affected by initial seeding location in Patient 2. In all views, the background anatomical images are the diffusion baselineimages, shown at a location behind the fibers. Tensors are colored by FA, where blue represents a higher FA and orange/yellow is a lower FA. (a)–(d): Tractography (yellow fibers) isseeded from three different regions (cyan) within the corticospinal tract (CST). Regions 1 and 2 are outside of the edema, while region 3 is inside the edema. The translucent modelrepresents the edematous region delineated by a clinical expert. (e) and (f): Zoomed-in views that show the two-tensor model when seeded in region 2. (g) and (h): Zoomed-in views thatshow the two-tensor model when seeded in region 3.
Fig. 9. Two-tensor UKF tractography re-constructions of the AF from 22 differentparameter settings in Patient 1. The back-ground image is a diffusion b0 image, medialto the AF. Six FA and GA threshold settings aredemonstrated in columns. Four qL settings areshown in rows. The top row displays the re-sults without including the free-water modeland the three bottom rows include it.
R. Liao et al. NeuroImage: Clinical 15 (2017) 819–831
826
threshold applies only to tensor one, the tensor being tracked, which wesaw may have higher FA than tensor two. Inclusion of the free-watermodel did not have a large effect on the reconstruction in these twopatient datasets. A higher qL removed the outlier fibers whose or-ientations had changed rapidly.
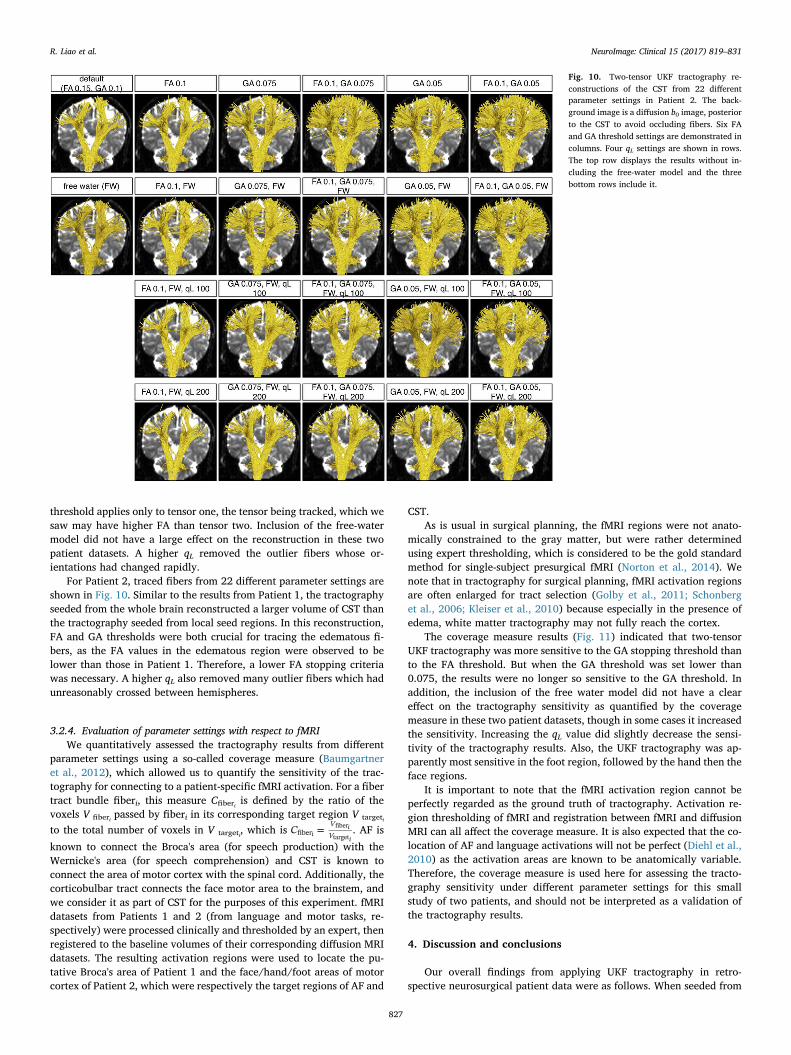
For Patient 2, traced fibers from 22 different parameter settings areshown in Fig. 10. Similar to the results from Patient 1, the tractographyseeded from the whole brain reconstructed a larger volume of CST thanthe tractography seeded from local seed regions. In this reconstruction,FA and GA thresholds were both crucial for tracing the edematous fi-bers, as the FA values in the edematous region were observed to belower than those in Patient 1. Therefore, a lower FA stopping criteriawas necessary. A higher qL also removed many outlier fibers which hadunreasonably crossed between hemispheres.
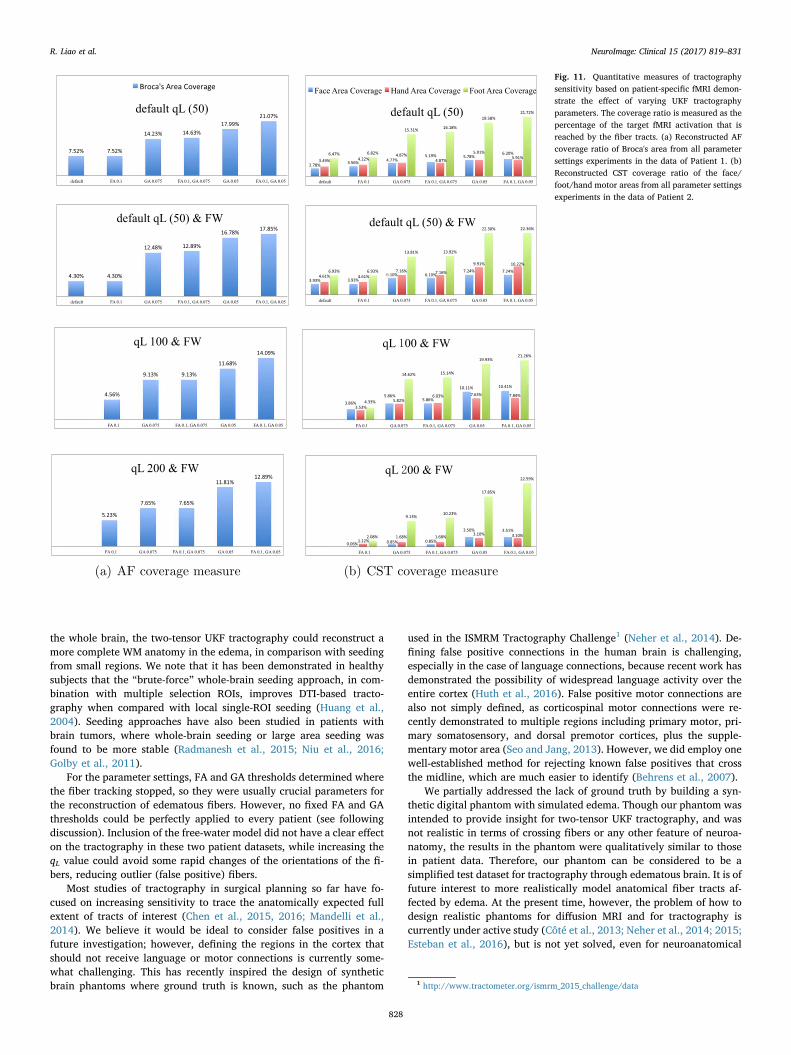
3.2.4. Evaluation of parameter settings with respect to fMRIWe quantitatively assessed the tractography results from different
parameter settings using a so-called coverage measure (Baumgartneret al., 2012), which allowed us to quantify the sensitivity of the trac-tography for connecting to a patient-specific fMRI activation. For a fibertract bundle fiberi, this measure Cfiberi is defined by the ratio of thevoxels V fiberi passed by fiberi in its corresponding target region V targeti
to the total number of voxels in V targeti, which is =CVVfiberi
i
i
fiber
target. AF is
known to connect the Broca's area (for speech production) with theWernicke's area (for speech comprehension) and CST is known toconnect the area of motor cortex with the spinal cord. Additionally, thecorticobulbar tract connects the face motor area to the brainstem, andwe consider it as part of CST for the purposes of this experiment. fMRIdatasets from Patients 1 and 2 (from language and motor tasks, re-spectively) were processed clinically and thresholded by an expert, thenregistered to the baseline volumes of their corresponding diffusion MRIdatasets. The resulting activation regions were used to locate the pu-tative Broca's area of Patient 1 and the face/hand/foot areas of motorcortex of Patient 2, which were respectively the target regions of AF and
CST.As is usual in surgical planning, the fMRI regions were not anato-
mically constrained to the gray matter, but were rather determinedusing expert thresholding, which is considered to be the gold standardmethod for single-subject presurgical fMRI (Norton et al., 2014). Wenote that in tractography for surgical planning, fMRI activation regionsare often enlarged for tract selection (Golby et al., 2011; Schonberget al., 2006; Kleiser et al., 2010) because especially in the presence ofedema, white matter tractography may not fully reach the cortex.
The coverage measure results (Fig. 11) indicated that two-tensorUKF tractography was more sensitive to the GA stopping threshold thanto the FA threshold. But when the GA threshold was set lower than0.075, the results were no longer so sensitive to the GA threshold. Inaddition, the inclusion of the free water model did not have a cleareffect on the tractography sensitivity as quantified by the coveragemeasure in these two patient datasets, though in some cases it increasedthe sensitivity. Increasing the qL value did slightly decrease the sensi-tivity of the tractography results. Also, the UKF tractography was ap-parently most sensitive in the foot region, followed by the hand then theface regions.
It is important to note that the fMRI activation region cannot beperfectly regarded as the ground truth of tractography. Activation re-gion thresholding of fMRI and registration between fMRI and diffusionMRI can all affect the coverage measure. It is also expected that the co-location of AF and language activations will not be perfect (Diehl et al.,2010) as the activation areas are known to be anatomically variable.Therefore, the coverage measure is used here for assessing the tracto-graphy sensitivity under different parameter settings for this smallstudy of two patients, and should not be interpreted as a validation ofthe tractography results.
4. Discussion and conclusions
Our overall findings from applying UKF tractography in retro-spective neurosurgical patient data were as follows. When seeded from
Fig. 10. Two-tensor UKF tractography re-constructions of the CST from 22 differentparameter settings in Patient 2. The back-ground image is a diffusion b0 image, posteriorto the CST to avoid occluding fibers. Six FAand GA threshold settings are demonstrated incolumns. Four qL settings are shown in rows.The top row displays the results without in-cluding the free-water model and the threebottom rows include it.
R. Liao et al. NeuroImage: Clinical 15 (2017) 819–831
827
the whole brain, the two-tensor UKF tractography could reconstruct amore complete WM anatomy in the edema, in comparison with seedingfrom small regions. We note that it has been demonstrated in healthysubjects that the “brute-force” whole-brain seeding approach, in com-bination with multiple selection ROIs, improves DTI-based tracto-graphy when compared with local single-ROI seeding (Huang et al.,2004). Seeding approaches have also been studied in patients withbrain tumors, where whole-brain seeding or large area seeding wasfound to be more stable (Radmanesh et al., 2015; Niu et al., 2016;Golby et al., 2011).
For the parameter settings, FA and GA thresholds determined wherethe fiber tracking stopped, so they were usually crucial parameters forthe reconstruction of edematous fibers. However, no fixed FA and GAthresholds could be perfectly applied to every patient (see followingdiscussion). Inclusion of the free-water model did not have a clear effecton the tractography in these two patient datasets, while increasing theqL value could avoid some rapid changes of the orientations of the fi-bers, reducing outlier (false positive) fibers.
Most studies of tractography in surgical planning so far have fo-cused on increasing sensitivity to trace the anatomically expected fullextent of tracts of interest (Chen et al., 2015, 2016; Mandelli et al.,2014). We believe it would be ideal to consider false positives in afuture investigation; however, defining the regions in the cortex thatshould not receive language or motor connections is currently some-what challenging. This has recently inspired the design of syntheticbrain phantoms where ground truth is known, such as the phantom
used in the ISMRM Tractography Challenge1 (Neher et al., 2014). De-fining false positive connections in the human brain is challenging,especially in the case of language connections, because recent work hasdemonstrated the possibility of widespread language activity over theentire cortex (Huth et al., 2016). False positive motor connections arealso not simply defined, as corticospinal motor connections were re-cently demonstrated to multiple regions including primary motor, pri-mary somatosensory, and dorsal premotor cortices, plus the supple-mentary motor area (Seo and Jang, 2013). However, we did employ onewell-established method for rejecting known false positives that crossthe midline, which are much easier to identify (Behrens et al., 2007).
We partially addressed the lack of ground truth by building a syn-thetic digital phantom with simulated edema. Though our phantom wasintended to provide insight for two-tensor UKF tractography, and wasnot realistic in terms of crossing fibers or any other feature of neuroa-natomy, the results in the phantom were qualitatively similar to thosein patient data. Therefore, our phantom can be considered to be asimplified test dataset for tractography through edematous brain. It is offuture interest to more realistically model anatomical fiber tracts af-fected by edema. At the present time, however, the problem of how todesign realistic phantoms for diffusion MRI and for tractography iscurrently under active study (Côté et al., 2013; Neher et al., 2014; 2015;Esteban et al., 2016), but is not yet solved, even for neuroanatomical
Fig. 11. Quantitative measures of tractographysensitivity based on patient-specific fMRI demon-strate the effect of varying UKF tractographyparameters. The coverage ratio is measured as thepercentage of the target fMRI activation that isreached by the fiber tracts. (a) Reconstructed AFcoverage ratio of Broca's area from all parametersettings experiments in the data of Patient 1. (b)Reconstructed CST coverage ratio of the face/foot/hand motor areas from all parameter settingsexperiments in the data of Patient 2.
1 http://www.tractometer.org/ismrm_2015_challenge/data
R. Liao et al. NeuroImage: Clinical 15 (2017) 819–831
828
modeling of healthy subjects' data.Fitting the two-tensor model to the diffusion signals is an ill-posed
problem; UKF tractography is a causal tractography method, so eachstep's model fitting is partly determined by the signal configuration ofprevious steps. Likely for this reason, we have observed that UKFtractography is relatively sensitive to to the region chosen for seeding(Figs. 7, 8). In contrast, single-tensor streamline tractography generallywill produce more or less the same structure when seeded at differentlocations along the tract, since the model fitting at each location isindependent. Regarding the performance of the two-tensor model whentracking through edema, we have seen that the fitted two tensors maydiverge into a spherical one and an elliptical one when tracking throughedematous brain or simulated edema (Figs. 4, 7, 8). But this does notalways happen; what we can say is that the two tensors together willmodel the data and that this provides increased flexibility for trackingthrough edema relative to a single-tensor model with fewer parameters.
Based on our experimental results, we provide suggested proceduresfor employing UKF tractography to reconstruct edematous WM. First,UKF tractography should be seeded from the whole brain. We havepreviously empirically determined across multiple datasets (O’Donnellet al., 2017) that if the voxels are 2 × 2 × 2 mm3 or larger, multipleseed points should be used per voxel. Our datasets (which had beeninterpolated to higher resolution on the scanner) had voxel sizes of1 × 1 × 2.6 mm3 and 1 × 1 × 3 mm3. Secondly, for parameter set-tings, our results show that reducing the GA and FA stopping thresholds(below the default settings of GA of 0.1 and FA of 0.15) will increase thetractography sensitivity, producing apparently larger fiber tracts. Ingeneral, UKF tractography is more affected by the GA threshold thanthe FA threshold. The default qL of 50 can provide good results. Afterwhole brain seeding of tractography, clinically relevant fiber tract(s) ofinterest may be identified by an expert or an automated method. Wenote that this initial evaluation focused on two patients. In the future,UKF, and especially the free water model, will benefit from more testingin multiple patients with different tumor types, levels of edema, andrelationships between tract and tumor.
These results are based on our dataset, and they provide intuitioninto the parameters for any reader interested in trying this method inhis or her own dataset. The proposed parameters should be broadlyuseful for data acquired around b= 1000 s/mm2 with 30 or moregradient directions, similar to our dataset. We note that the UKF trac-tography method expects a certain level of noise in the data dependingon the settings of the q parameters, so “good” settings for these para-meters for different data (such as that with a higher b-value) can bedetermined by experiments similar to those we have performed here.
Although this work demonstrates that two-tensor UKF tractographywith appropriate seeding/parameter settings can somewhat reconstructmore edematous WM structures, we have not totally addressed thechallenge of tracking through edema. Increasing sensitivity may lead toincreased false positive tracts. The particular two-tensor model, while itfits the data well, was not biophysically designed in any way to re-present edema. The biophysical free water model can represent CSF,but the diffusivity of edema is not necessarily expected to equal that ofCSF. Some groups also attempted to address this challenge in theimaging/scanner level with other fiber orientation estimation/mod-eling methods. Zhang et al. (2013) compared generalized q-samplingbased tractography with DTI-based WM mapping in edematous regions.They demonstrated that DTI-based tractography missed several fibertracts in 5 cases in comparison with those from generalized q-samplingimaging (GQI) data. Another study by Kuhnt et al. (2013) demonstratedthat high angular resolution diffusion imaging (HARDI)-compressedsensing (CS) technique was able to visualize some peritumoral WMfiber bundles that DTI could not achieve. McDonald et al. (2013) haveshown that by applying restricted spectrum imaging (RSI), using mul-tiple diffusion weightings to remove volume fraction associated withedema, the quantification and visualization of white matter tracts inperitumoral regions could be improved. A recent study by Abhinav
et al. (2015) illustrated a more accurate depiction of peritumoral tractsin their preliminary experiments, employing a so-called high-definitionfiber tractography (HDFT). The pathology of brain tumors is patient-specific. Therefore, UKF, and especially the free water model, willbenefit from additional future investigation in multiple patients withdifferent tumor types, levels of edema, and relationships between tractand tumor.
In conclusion, the main contribution of this study is providing aninsight into how UKF tractography works, with a two-tensor model, tosomewhat address the challenge of edematous WM reconstruction. Webuilt a synthetic digital edema phantom to simplify the anatomy ofedematous brain tissues, such that we could have a preliminary un-derstanding of the performance of UKF tractography in the setting ofedema. We showed in retrospective neurosurgical patient data howdifferent choices of seeding regions and parameter settings affected UKFtractography results. Furthermore, we have provided some guidance ofhow to use UKF tractography in neurosurgical planning research toincrease sensitivity for fiber tracking through edema.
Acknowledgments
We gratefully acknowledge the following NIH grants:R21CA156943, P41EB015898, R21NS075728, P41EB015902,R01MH074794, R01MH097979, U01CA199459, R03NS088301, andMerrill Lynch Fellowship.
References
Abhinav, K.K., Yeh, F.-C.F.-C., Mansouri, A.A., Zadeh, G.G., Fernandez-Miranda, J.C.J.C.,2015. High-definition fiber tractography for the evaluation of perilesional whitematter tracts in high-grade glioma surgery. Neuro-oncology 17 (9), 1199–1209.
Aja-Fernández, S.S., Alberola-López, C.C., Westin, C.-F.C.-F., 2008. Noise and signal es-timation in magnitude MRI and Rician distributed images: a LMMSE approach. ImageProcessing, IEEE Transactions on 17 (8), 1383–1398.
Akai, H.H., Mori, H.H., Aoki, S.S., Masutani, Y.Y., Kawahara, N.N., Shibahara, J.J.,Ohtomo, K.K., 2005. Diffusion tensor tractography of gliomatosis cerebri: fibertracking through the tumor. J. Comput. Assist. Tomogr. 29 (1), 127–129.
Alexander, A.L.A.L., Hasan, K.M.K.M., Lazar, M.M., Tsuruda, J.S.J.S., Parker, D.L.D.L.,2001. Analysis of partial volume effects in diffusion-tensor MRI. Magn. Reson. Med.45 (5), 770–780.
Basser, P.P., Pajevic, S.S., Pierpaoli, C.C., Duda, J.J., Aldroubi, A.A., 2000a. In vivo fibertractography using DT-MRI data. Magn. Reson. Med. 44, 625–632.
Basser, P.J.P.J., Pajevic, S.S., Pierpaoli, C.C., Duda, J.J., Aldroubi, A.A., 2000b. In vivofiber tractography using DT-MRI data. Magn. Reson. Med. 44 (4), 625–632.
Basser, P.J.P.J., 1995. Inferring microstructural features and the physiological state oftissues from diffusion-weighted images. NMR Biomed. 8 (7), 333–344.
Basser, P.J.P.J., Mattiello, J.J., LeBihan, D.D., 1994. MR diffusion tensor spectroscopy andimaging. Biophys. J. 66 (1), 259–267.
Baumgartner, C.C., Michailovich, O.O., Levitt, J.J., Pasternak, O.O., Bouix, S.S., Westin,C.C., Rathi, Y.Y., 2012. A unified tractography framework for comparing diffusionmodels on clinical scans. In: CDMRI Workshop-MICCAI, Nice.
Behrens, T.T., Woolrich, M.M., Jenkinson, M.M., Johansen-Berg, H., Nunes, R.R., Clare,S.S., Matthews, P.P., Brady, J.J., Smith, S.S., 2003. Characterization and propagationof uncertainty in diffusion-weighted MR imaging. Magn. Reson. Med. 50 (5),1077–1088.
Behrens, T.E.T.E., Berg, H.J.H.J., Jbabdi, S.S., Rushworth, M.M., Woolrich, M.M., 2007.Probabilistic diffusion tractography with multiple fibre orientations: what can wegain? Neuroimage 34 (1), 144–155.
Berman, J.I.J.I., Berger, M.S.M.S., Mukherjee, P.P., Henry, R.G.R.G., 2004. Diffusion-tensor imaging-guided tracking of fibers of the pyramidal tract combined with in-traoperative cortical stimulation mapping in patients with gliomas. J. Neurosurg. 101(1), 66–72.
Chen, Z.Z., Tie, Y.Y., Olubiyi, O.O., Rigolo, L.L., Mehrtash, A.A., Norton, I.I., Pasternak,O.O., Rathi, Y.Y., Golby, A.J.A.J., O’Donnell, L.J.L.J., 2015. Reconstruction of thearcuate fasciculus for surgical planning in the setting of peritumoral edema usingtwo-tensor unscented Kalman filter tractography. NeuroImage: Clinical 7, 815–822.
Chen, Z.Z., Tie, Y.Y., Olubiyi, O.O., Zhang, F.F., Mehrtash, A.A., Rigolo, L.L., Kahali, P.P.,Norton, I.I., Pasternak, O.O., Rathi, Y.Y., Golby, A.J.A.J., O’Donnell, L.J.L.J., 2016.Corticospinal tract modeling for neurosurgical planning by tracking through regionsof peritumoral edema and crossing fibers using two-tensor unscented Kalman filtertractography. Int. J. Comput. Assist. Radiol. Surg. 1–12.
Conturo, T.E.T.E., Lori, N.F.N.F., Cull, T.S.T.S., Akbuda, E.E., Snyder, A.Z.A.Z., Shimony,J.S.J.S., McKinstry, R.C.R.C., Burton, H.H., Raichle, A.E.A.E., 1999. Tracking neu-ronal fiber pathways in the living human brain. Neurobiology 96, 10422–10427.
Côté, M.-A.M.-A., Girard, G.G., Boré, A.A., Garyfallidis, E.E., Houde, J.-C.J.-C.,Descoteaux, M.M., 2013. Tractometer: towards validation of tractography pipelines.Med. Image Anal. 17 (7), 844–857.
R. Liao et al. NeuroImage: Clinical 15 (2017) 819–831
829
Descoteaux, M.M., Deriche, R.R., Knosche, T.T., Anwander, A.A., 2009. Deterministic andprobabilistic tractography based on complex fibre orientation distributions. MedicalImaging, IEEE Transactions on 28 (2), 269–286.
Diehl, B.B., Piao, Z.Z., Tkach, J.J., Busch, R.M.R.M., LaPresto, E.E., Najm, I.I., Bingaman,B.B., Duncan, J.J., Lüders, H.H., 2010. Cortical stimulation for language mapping infocal epilepsy: correlations with tractography of the arcuate fasciculus. Epilepsia 51(4), 639–646.
Duffau, H.H., 2014. The dangers of magnetic resonance imaging diffusion tensor tracto-graphy in brain surgery. World Neurosurg. 81 (1), 56–58.
Esteban, O.O., Caruyer, E.E., Daducci, A.A., Bach-Cuadra, M.M., Ledesma-Carbayo,M.J.M.J., Santos, A.A., 2016. Diffantom: whole-brain diffusion MRI phantoms de-rived from real datasets of the human connectome project. Front. Neuroinform. 10, 4.
Farquharson, S.S., Tournier, J.-D.J.-D., Calamante, F.F., Fabinyi, G.G., Schneider-Kolsky,M.M., Jackson, G.D.G.D., Connelly, A.A., 2013. White matter fiber tractography: whywe need to move beyond DTI: Clinical article. J. Neurosurg. 118 (6), 1367–1377.
Fedorov, A.A., Beichel, R.R., Kalpathy-Cramer, J.J., Finet, J.J., Fillion-Robin, J.-C.J.-C.,Pujol, S.S., Bauer, C.C., Jennings, D.D., Fennessy, F.F., Sonka, M.M., Buatti, J.J.,Aylward, S.S., Miller, J.V.J.V., Pieper, S.S., Kikinis, R.R., 2012. 3D Slicer as an imagecomputing platform for the quantitative imaging network. Magn. Reson. Imaging 30(9), 1323–1341.
Feigl, G.C.G.C., Hiergeist, W.W., Fellner, C.C., Schebesch, K.-M.M.K.-M.M., Doenitz, C.C.,Finkenzeller, T.T., Brawanski, A.A., Schlaier, J.J., 2014. Magnetic resonance imagingdiffusion tensor tractography: evaluation of anatomic accuracy of different fibertracking software packages. World Neurosurg. 81 (1), 144–150.
Fernandez-Miranda, J.C.J.C., 2013. Editorial: beyond diffusion tensor imaging. J.Neurosurg. 118 (6), 1363–1365.
Friman, O.O., Farneback, G.G., Westin, C.-F.C.-F., 2006. A Bayesian approach for sto-chastic white matter tractography. Medical Imaging, IEEE Transactions on 25 (8),965–978.
Golby, A.J.A.J., Kindlmann, G.G., Norton, I.I., Yarmarkovich, A.A., Pieper, S.S., Kikinis,R.R., 2011. Interactive diffusion tensor tractography visualization for neurosurgicalplanning. Neurosurgery 68 (2), 496.
Gudbjartsson, H.H., Patz, S.S., 1995. The Rician distribution of noisy MRI data. Magn.Reson. Med. 34 (6), 910–914.
Holodny, A.I.A.I., Ollenschlager, M.M., 2002. Diffusion imaging in brain tumors.Neuroimaging Clin. N. Am. 12 (1), 107–124.
Huang, H.H., Zhang, J.J., van Zijl, P.P., Mori, S.S., 2004. Analysis of noise effects on DTI-based tractography using the brute-force and multi-ROI approach. Magn. Reson. Med.52 (3), 559–565.
Huth, A.G.A.G., de Heer, W.A.W.A., Griffiths, T.L.T.L., Theunissen, F.E.F.E., Gallant,J.L.J.L., 2016. Natural speech reveals the semantic maps that tile human cerebralcortex. Nature 532 (7600), 453–458.
Jellison, B.J.B.J., Field, A.S.A.S., Medow, J.J., Lazar, M.M., Salamat, M.S.M.S., Alexander,A.L.A.L., 2004. Diffusion tensor imaging of cerebral white matter: a pictorial reviewof physics, fiber tract anatomy, and tumor imaging patterns. Am. J. Neuroradiol. 25(3), 356–369.
Jones, D.K.D.K., Simmons, A.A., Williams, S.C.R.S.C.R., Horsfield, M.A.M.A., 1999. Non-invasive assesment of axonal fiber connectivity in the human brain via diffusiontensor MRI. Magn. Reson. Med. 42, 37–41.
Kaden, E.E., Knösche, T.R.T.R., Anwander, A.A., 2007. Parametric spherical deconvolu-tion: inferring anatomical connectivity using diffusion MR imaging. Neuroimage 37(2), 474–488.
Kinoshita, M.M., Yamada, K.K., Hashimoto, N.N., Kato, A.A., Izumoto, S.S., Baba, T.T.,Maruno, M.M., Nishimura, T.T., Yoshimine, T.T., 2005. Fiber-tracking does not ac-curately estimate size of fiber bundle in pathological condition: initial neurosurgicalexperience using neuronavigation and subcortical white matter stimulation.Neuroimage 25 (2), 424–429.
Kleiser, R.R., Staempfli, P.P., Valavanis, A.A., Boesiger, P.P., Kollias, S.S., 2010. Impact offMRI-guided advanced DTI fiber tracking techniques on their clinical applications inpatients with brain tumors. Neuroradiology 52 (1), 37.
Kuhnt, D.D., Bauer, M.H.M.H., Egger, J.J., Richter, M.M., Kapur, T.T., Sommer, J.J.,Merhof, D.D., Nimsky, C.C., 2013. Fiber tractography based on diffusion tensorimaging compared with high-angular-resolution diffusion imaging with compressedsensing: initial experience. Neurosurgery 72 (0 1), 165.
Lazar, M.M., Weinstein, D.M.D.M., Tsuruda, J.S.J.S., Hasan, K.M.K.M., Arfanakis, K.K.,Meyerand, M.E.M.E., Badie, B.B., Rowley, H.A.H.A., Haughton, V.V., Field, A.A.,Alexander, A.L.A.L., 2003. White matter tractography using diffusion tensor deflec-tion. Hum. Brain Mapp. 18 (4), 306–321.
Le Bihan, D.D., 2003. Looking into the functional architecture of the brain with diffusionMRI. Nat. Rev. Neurosci. 4 (6), 469–480.
Le Bihan, D.D., Breton, E.E., Lallemand, D.D., Grenier, P.P., Cabanis, E.E., Laval-Jeantet,M.M., 1986. MR imaging of intravoxel incoherent motions: application to diffusionand perfusion in neurologic disorders. Radiology 161 (2), 401–407.
Le Bihan, D.D., Johansen-Berg, H., 2012. Diffusion MRI at 25: exploring brain tissuestructure and function. Neuroimage 61 (2), 324–341.
Le Bihan, D.D., Poupon, C.C., Amadon, A.A., Lethimonnier, F.F., 2006. Artifacts andpitfalls in diffusion MRI. J. Magn. Reson. Imaging 24 (3), 478–488.
Liu, Z.Z., Wang, Y.Y., Gerig, G.G., Gouttard, S.S., Tao, R.R., Fletcher, T.T., Styner, M.M.,2010. Quality control of diffusion weighted images. In: SPIE Medical Imaging.International Society for Optics and Photonics, pp. 76280J.
Lu, S.S., Ahn, D.D., Johnson, G.G., Cha, S.S., 2003. Peritumoral diffusion tensor imagingof high-grade gliomas and metastatic brain tumors. Am. J. Neuroradiol. 24 (5),937–941.
Malcolm, J.J., Shenton, M.M., Rathi, Y.Y., 2010. Filtered multitensor tractography.Medical Imaging, IEEE Transactions on 29 (9), 1664–1675.
Mandelli, M.L.M.L., Berger, M.S.M.S., Bucci, M.M., Berman, J.I.J.I., Amirbekian, B.B.,
Henry, R.G.R.G., 2014. Quantifying accuracy and precision of diffusion MR tracto-graphy of the corticospinal tract in brain tumors: clinical article. J. Neurosurg. 121(2), 349–358.
Matsui, J.T.J.T., 2014. Development of Image Processing Tools and Procedures forAnalyzing Multi-Site Longitudinal Diffusion-Weighted Imaging Studies. University ofIowa Ph.D. thesis.
McDonald, C.R.C.R., White, N.S.N.S., Farid, N.N., Lai, G.G., Kuperman, J.M.J.M., Bartsch,H.H., Hagler, D.J.D.J., Kesari, S.S., Carter, B.S.B.S., Chen, C.C.C.C., Dale, C.C., 2013.Recovery of white matter tracts in regions of peritumoral flair hyperintensity with useof restriction spectrum imaging. Am. J. Neuroradiol. 34 (6), 1157–1163.
McGirt, M.J.M.J., Chaichana, K.L.K.L., Gathinji, M.M., Attenello, F.J.F.J., Than, K.K.,Olivi, A.A., Weingart, J.D.J.D., Brem, H.H., Quiñones-Hinojosa, A.R., 2009.Independent association of extent of resection with survival in patients with malig-nant brain astrocytoma: clinical article. J. Neurosurg. 110 (1), 156–162.
Mori, S.S., Crain, B.B., Chacko, V.V., van Zijl, P.P., 1999. Three dimensional tracking ofaxonal projections in the brain by magnetic resonance imaging. Ann Neurol 45,265–269.
Neher, P.F.P.F., Descoteaux, M.M., Houde, J.C.J.C., Stieltjes, B.B., Maier-Hein, K.H.K.H.,2015. Strengths and weaknesses of state of the art fiber tractography pipelines-acomprehensive in-vivo and phantom evaluation study using tractometer. Med. ImageAnal. 26 (1), 287–305.
Neher, P.F.P.F., Laun, F.B.F.B., Stieltjes, B.B., Maier-Hein, K.H., 2014. Fiberfox: facil-itating the creation of realistic white matter software phantoms. Magn. Reson. Med.72 (5), 1460–1470.
Nimsky, C.C., 2014. Fiber tracking-we should move beyond diffusion tensor imaging.World Neurosurg. 82 (1), 35–36.
Nimsky, C.C., Bauer, M.M., Carl, B.B., 2016. Merits and limits of tractography techniquesfor the uninitiated. In: Advances and Technical Standards in Neurosurgery. Springer,pp. 37–60.
Nimsky, C.C., Ganslandt, O.O., Hastreiter, P.P., Wang, R.R., Benner, T.T., Sorensen,A.G.A.G., Fahlbusch, R.R., 2005. Preoperative and intraoperative diffusion tensorimaging-based fiber tracking in glioma surgery. Neurosurgery 56 (1), 130–138.
Niu, C.C., Liu, X.X., Yang, Y.Y., Zhang, K.K., Min, Z.Z., Wang, M.M., Li, W.W., Guo, L.L.,Lin, P.P., Zhang, M.M., 2016. Assessing region of interest schemes for the corti-cospinal tract in patients with brain tumors. Medicine 95 (12).
Norton, I.H.I.H., Orringer, D.A.D.A., Golby, A.J.A.J., 2014. Image-guided neurosurgicalplanning. In: Intraoperative Imaging and Image-Guided Therapy. Springer, pp.507–517.
O’Donnell, L.J.L.J., Suter, Y.Y., Rigolo, L.L., Kahali, P.P., Zhang, F.F., Norton, I.I., Albi,A.A., Olubiyi, O.O., Meola, A.A., Essayed, W.I.W.I., Unadkat, P.P., Ciris, P.A.P.A.,Wells I.I.I., W.M.W.M., Rathi, Y.Y., Westin, C.-F.C.-F., Golby, A.J.A.J., 2017.Automated white matter fiber tract identification in patients with brain tumors.NeuroImage: Clinical 13, 138–153.
Papadopoulos, M.M., Saadoun, S.S., Binder, D.D., Manley, G.G., Krishna, S.S., Verkman,A.A., 2004. Molecular mechanisms of brain tumor edema. Neuroscience 129 (4),1009–1018.
Parker, G.J.G.J., Alexander, D.C.D.C., 2005. Probabilistic anatomical connectivity derivedfrom the microscopic persistent angular structure of cerebral tissue. Philos. Trans. R.Soc., B 360 (1457), 893–902.
Pasternak, O.O., Assaf, Y.Y., Intrator, N.N., Sochen, N.N., 2008. Variational multiple-tensor fitting of fiber-ambiguous diffusion-weighted magnetic resonance imagingvoxels. Magn. Reson. Imaging 26 (8), 1133–1144.
Pasternak, O.O., Sochen, N.N., Gur, Y.Y., Intrator, N.N., Assaf, Y.Y., 2009. Free waterelimination and mapping from diffusion MRI. Magn. Reson. Med. 62 (3), 717–730.
Peled, S.S., Friman, O.O., Jolesz, F.F., Westin, C.-F.C.-F., 2006. Geometrically constrainedtwo-tensor model for crossing tracts in DWI. Magn. Reson. Imaging 24 (9),1263–1270.
Pierpaoli, C.C., Jezzard, P.P., Basser, P.J.P.J., Barnett, A.A., Di Chiro, G., 1996. Diffusiontensor MR imaging of the human brain. Radiology 201 (3), 637–648.
Pierpaoli, C.C., Jones, D.D., 2004. Removing CSF contamination in brain DT-MRIs byusing a two-compartment tensor model. In: Proc. International Society for MagneticResonance in Medicine 12th Scientific Meeting ISMRM04, pp. 1215.
Qazi, A.A.A.A., Radmanesh, A.A., O’Donnell, L.L., Kindlmann, G.G., Peled, S.S., Whalen,S.S., Westin, C.-F.C.-F., Golby, A.J.A.J., 2009. Resolving crossings in the corticospinaltract by two-tensor streamline tractography: method and clinical assessment usingfMRI. Neuroimage 47, T98–T106.
Radmanesh, A.A., Zamani, A.A.A.A., Whalen, S.S., Tie, Y.Y., Suarez, R.O.R.O., Golby,A.J.A.J., 2015. Comparison of seeding methods for visualization of the corticospinaltracts using single tensor tractography. Clin. Neurol. Neurosurg. 129, 44–49.
Rathi, Y.Y., Gagoski, B.B., Setsompop, K.K., Michailovich, O.O., Grant, P.E.P.E., Westin,C.-F.C.-F., 2013. Diffusion propagator estimation from sparse measurements in atractography framework. In: Medical Image Computing and Computer-AssistedIntervention-MICCAI 2013. Springer, pp. 510–517.
Rodrigues, P.P., Prckovska, V.V., Pullens, W.W., Strijkers, G.G., Vilanova, A.A., ter HaarRomeny, B.B., 2010. Validating validators: an analysis of DW-MRI hardware andsoftware phantoms. In: Proc. Intl. Soc. Mag. Reson. Med. vol. 18. pp. 3964.
Sanai, N.N., Berger, M.S.M.S., 2008. Glioma extent of resection and its impact on patientoutcome. Neurosurgery 62 (4), 753–766.
Schonberg, T.T., Pianka, P.P., Hendler, T.T., Pasternak, O.O., Assaf, Y.Y., 2006.Characterization of displaced white matter by brain tumors using combined DTI andfMRI. Neuroimage 30 (4), 1100–1111.
Seo, J.J., Jang, S.S., 2013. Different characteristics of the corticospinal tract according tothe cerebral origin: DTI study. Am. J. Neuroradiol. 34 (7), 1359–1363.
Sinha, S.S., Bastin, M.E.M.E., Whittle, I.R.I.R., Wardlaw, J.M.J.M., 2002. Diffusion tensorMR imaging of high-grade cerebral gliomas. Am. J. Neuroradiol. 23 (4), 520–527.
Talos, I.-F.I.-F., O’Donnell, L.L., Westin, C.-F.C.-F., Warfield, S.K.S.K., Wells I.I.I., W.W.,
R. Liao et al. NeuroImage: Clinical 15 (2017) 819–831
830

Yoo, S.-S.S.-S., Panych, L.P.L.P., Golby, A.A., Mamata, H.H., Maier, S.S.S.S., Ratiu,P.P., Charles, R.G.R.G., Black, P.M.P.M., Jolesz, F.A.F.A., Kikinis, R.R., 2003.Diffusion tensor and functional MRI fusion with anatomical MRI for image-guidedneurosurgery. In: Medical Image Computing and Computer-Assisted Intervention-MICCAI 2003. Springer, pp. 407–415.
Tuch, D.S.D.S., Reese, T.G.T.G., Wiegell, M.R.M.R., Makris, N.N., Belliveau, J.W.J.W.,Wedeen, V.J.V.J., 2002. High angular resolution diffusion imaging reveals intravoxelwhite matter fiber heterogeneity. Magn. Reson. Med. 48 (4), 577–582.
Tuch, D.S.D.S., Reese, T.G.T.G., Wiegell, M.R.M.R., Wedeen, V.J.V.J., 2003. DiffusionMRI of complex neural architecture. Neuron 40 (5), 885–895.
Wan, E.A.E.A., Van Der Merwe, R.R., 2000. The unscented Kalman filter for nonlinearestimation. In: Adaptive Systems for Signal Processing, Communications, and Control
Symposium 2000. AS-SPCC. The IEEE 2000. IEEE, pp. 153–158.Weinstein, D.D., Kindlmann, G.G., Lundberg, E.E., 1999. Tensorlines: Advection-diffusion
based propagation through diffusion tensor fields. In: Proceedings of the Conferenceon Visualization’99: Celebrating Ten Years. IEEE Computer Society Press, pp.249–253.
Westin, C.-F.C.-F., Maier, S.E.S.E., Mamata, H.H., Nabavi, A.A., Jolesz, F.A.F.A., Kikinis,R.R., 2002. Processing and visualization for diffusion tensor MRI. Med. Image Anal. 6(2), 93–108.
Zhang, H.H., Wang, Y.Y., Lu, T.T., Qiu, B.B., Tang, Y.Y., Ou, S.S., Tie, X.X., Sun, C.C., Xu,K.K., Wang, Y.Y., 2013. Differences between generalized q-sampling imaging anddiffusion tensor imaging in the preoperative visualization of the nerve fiber tractswithin peritumoral edema in brain. Neurosurgery 73 (6), 1044–1053.
R. Liao et al. NeuroImage: Clinical 15 (2017) 819–831
831