Embed Size (px)
Citation preview

Performance of Laser and Radar Ranging Devices inAdverse Environmental Conditions
Julian Ryde and Nick Hillier∗
Abstract
A comparative evaluation of millimetre-wave radar and 2D scanning lasers indust and rain conditions for sensor applications in field robotics is presented. Arobust and reliable method for measuring the level of suspended dust (or otherobscurant media) by determining the transmission coefficient is developed andused for quantitative assessment of sensor performance. The criteria of tar-get acquisition reliability, precision and accuracy under varying environmentalconditions are assessed via sensor operation in a controlled environment. Thisenvironment generated dust and rain of varying densities. Sensor performanceis also assessed for the potential effect upon digital terrain mapping and haultruck localisation due to sensor-specific behaviours in these conditions (e.g.false targets, increased noise). Trials on a research electric face-shovel are con-ducted to test observed behaviours. It is concluded that laser scanners aresuitable for environments with transmissions exceeding 92-93% per meter fortargets closer than 25m. The radar remained relatively unaffected by the gen-erated conditions of rain (50-70mm/hour) and dust (10m visibility) howeverits accuracy (0.1m with a corner reflector and 0.3m on a haul truck), free-spaceclutter and scan rate were insufficient for locating unmodified haul trucks forthis application.
1 Introduction and Background
Scanning infra-red laser range finders and millimeter-wave radar have seen extensive applica-tion in automation and other mapping scenarios in a wide range of research and commercialenvironments. Typically, millimetre wave radar in the mining industry has been limitedto slope stability monitoring [Reeves et al., 2000, Macfarlane and Robertson, 2004] (andsystems by GroundProbe and Reutech), or imaging large underground cavities (stopes, ore-passes [Brooker et al., 2005, Noon et al., 2002]), although there is a growing focus on itsapplication to environmental mapping, volume estimation and machine component track-ing (e.g., bucket localisation). In general, this mining focus has been spearheaded by workdone at the Australian Centre for Field Robotics and CRCMining [Widzyk-Caperhart et al.,2006,Brooker et al., 2005,Brooker et al., 2007,Scheding et al., 2002].
∗Julian Ryde and Nick Hillier are with the Autonomous Systems Laboratory, CSIRO ICT Centre, Brisbane, QLD,Australia. e-mail:{julian.ryde, nick.hillier}@csiro.au
Scanning laser range finders operating in the (near) infra-red have found more wide-spreadapplication in the mining environment, arguably due to the lower sensor costs and maturityof the technology. Although there has been minimal commercial up-take beyond simple see-not-see safety systems, research and prototype applications have ranged from moderate scaledigital terrain mapping for automation purposes on draglines [Corke et al., 2000, Robertset al., 2003] and other excavators [Singh, 1997, Stentz et al., 1999] through vehicle trackingfor traffic control [Duff et al., 2006], machine component tracking [Duff, 2006, Hall andKeays, 1993], automatic dozer and grader blade control (systems by Trimble and others)and underground mine mapping [Huber and Vandapel, 2006,Shaffer et al., 1992,Baker et al.,2004,Nuchter et al., 2004].
Laser range finders and radar technologies are often used as complimentary sensing toolsoutside of the mining industry, particularly in vehicle automation [Miller et al., 2008, Ya-mauchi, 2007], however there have been minimal studies into the relative performance ofthese sensing technologies under adverse environmental conditions beyond their applicationto meteorological studies (of which there is a vast literature).
The Commonwealth Scientific and Industrial Research Organisation (CSIRO) in conjunctionwith CRCMining and the Australian Centre for Field Robotics (ACFR) conducted a series ofcontrolled experiments to examine the performance of three scanning range devices, includinga millimetre-wave radar, and two scanning infra-red laser range finders, when operating invarious rain, mist and dust-cloud conditions. Subsequently, these sensors were installedon a research electric face shovel and further observations of sensor performance in a fielddeployment were made.
1.1 Sensor Summary
The sensors examined in this study are two scanning laser range-finders, the SICK LMS291-S05 and the Riegl LMSQ120, and the 2D HSS - a 95GHz scanning millimeter-wave radarprovided by ACFR. A brief summary of their key characterising specifications is presentedin Table 1.
During the last two decades there have been significant improvements in the performanceof time-of-flight laser range finding devices, in particular with regards to two areas: havingpoor sensing in adverse visibility conditions such as high suspended dust or water vapourloadings (fog, snow, rain); and being dazzled by direct viewing into the sun. Although, lasersare unable to range transparent objects like glass it is rare that this is a limiting factor inoutdoor environments.
Lasers have much higher range precision and significantly tighter beam widths than radarsensors, allowing for the creation of maps with higher accuracies. Scanning lasers are alsousually associated with relatively high scan rates and lower costs than radar. They areconsidered a mature technology with multiple suppliers and low lead times. Radar sensors areconsidered to be insensitive to suspended dust and water vapour loadings. The larger beamwidth and lower operating frequency of radar provides scope for measurement of multipledownrange targets along a single heading - even when visually obscured by intervening

Radar SICK Riegl2D HSS LMS291-S05 LMSQ120
[SICK AG, 2000] [RIEGL Gmbh, 2005]
Min. range 1m† 0m 2mMax range 70m 30-80m 75-150mRange acc. >25mm‡ 10mm 5mmBeam width 1.5◦ 0.7◦ 0.2◦
Field of view 360◦ 180◦ 80◦
Min. angular res. 1.2◦ 0.25◦ 0.04◦
FMCW Single shot Single shotMeasurement with time of flight time of flightprinciple CFAR peak with fog and with multiple echo
detection pixel correction discriminationOperating wavelength 0.003m 905nm ‘near IR’Max scan rate 10Hz 75Hz? up to 100Hz?
Table 1: Summary of commonly identifiable performance parameters between the testedsensors. (FMCW - Frequency Modulated Continuous Wave) (CFAR - Constant False AlarmRate) †Radar minimum range is configurable. ‡Depends on radar cross section (RCS). ?Scanrate at best angular resolution is less.
objects. However, the radar as a sensing technology has a significantly wider beam-widthand lower range precision than the laser sensors. The radar beam is transparent to somecommon materials (e.g. plastics typically yield low amplitude returns to radar).
The higher measurement uncertainties associated with radar often lead to more complexmethods being pursued for map generation and data representation (for example volumetricevidence grids [Foessel, 2000]) by comparison to the simpler 2.5-D representations that areusually employed for digital map representation for laser scanners.
Both technologies have gained general acceptance for being safe, with the lasers presentedhere having Class I ratings (IEC 60825), and there being no known adverse health risks forexposure to the millimeter-wave radar beam of the instrument used here (IEEE C95.11991).
Active range sensors have to deal with uncertainties introduced when the illuminating beamspans a range discontinuity, for instance falling on both a near and far object. If the sensoris in first-echo mode then range to the nearest object in the beam’s coverage is returned,however there are return modes which result in an effect known as mixed pixels (or phantompoints) [Adams and Kerstens, 1996,Ye and Borenstein, 2002]. For safety motivated sensorssuch as the SICK this problem occurs more frequently due to the combination of a weightedfirst echo return and the larger beam divergence designed to ensure complete coverage.Range sensors returning the first-echo are more susceptible to interference from atmosphericobscurants and therefore it would be expected that the Riegl (which has configurable echomode behaviour) would perform better than the SICK at higher dust and rain levels.
Range sensors in general can be susceptible to multi-path errors. These are errors that occur
when the illuminating beam is specularly reflected from one surface and continues on andterminates on another elsewhere. This phenomenon gives an erroneous, more distant, rangereading along the ray. This is especially dangerous for autonomous systems as it impliesthat the area is free of obstacles. Further background on the operation of the FMCW radaris contained within [Foessel, 2000].
To minimise uncertainty in the machine pose estimate, a commercial Applanix InertiallyAided Real-Time Kinematic GPS (IARTK) pose estimator was employed. This system isdescribed and its performance assessed in [Arroyo-Suarez et al., 2005]. The IARTK estimatortypically gave repeatability in position estimates to within 0.05m and heading estimates toabout 0.2 degrees at a 50 Hz update rate. Each pose estimate was time stamped, andnetwork time was synchronised using the network time protocol (NTP) to be within 0.003sbetween computers. Sensor measurements used linear interpolation between pose updates.If there were more than one missing pose estimate then the corresponding range sensormeasurements were discarded.
1.2 Performance Impact from Obscure Intermediaries
A good theoretic summary of the performance of millimeter-wave radar through cloudsof coal dust and water droplets is presented by [Brooker et al., 2007], with a focus onconditions that can be expected in the mining environment. They also present summaryfindings for the dominant sensing technologies (millimeter-wave and micro-wave radar, laser,sonar) examining the attenuation of the sensor signals due to various dust loadings, andfor the signal back-scatter encountered by millimeter-wave radar due to suspended dustand water droplets. For brevity, the analysis will not be repeated here. The conclusionsreached from this theoretical work are that for the examined millimeter-wave radar (77 and94 GHz), the effect of back-scatter is near negligible, and that the signal attenuation due tointervening media in the transmission space is only becomes significant at heavy suspendedwater loadings (visibility less than 4m with large droplet sizes).
The authors were unable to find a similar study for laser range finding devices and there havebeen significant advances in the sensor technologies used for laser range finding in the last 25years, not the least being the introduction of multiple-echo and last-pulse-return acquisitionfiltering.
2 Method
2.1 Generating Adverse Conditions
Experiments were undertaken in a confined environment (test chamber), see Section 2.2.Controlled rain, mist and dust conditions were replicated within this volume. A sprinklersystem installed along the roof simulated rain and mist conditions whilst suspended dustconditions were created by a fan inducing airflow across a vibration table onto which dustwas delivered. Dust(1-5kg) of varying particle size distributions and material was injectedinto the test chamber and the response of the sensors recorded during the period that the dust

cleared (typically 10 to 15 minutes). It was found that the most dense dust-like conditionswere created using media with the longest airborne suspension period (talcum powder). Ahigh suspension time enables more material to be injected into to the volume before anequilibrium between the dust being injected and that settling out was reached, resulting inhigher suspended densities.
Rain conditions were achieved by varying the flow rate through the overhead sprinkler systemat constant pressure (via the use of a regulator). Low flow rates gave a droplet distributionbiased towards larger particle sizes, high flow rates gave a distribution biased towards mistyconditions with higher suspension ratios. The experimental procedure was unable to generatefog-like liquid suspensions. The generated conditions were colloidal with the generated rainand mist conditions being a mixture of a liquid aerosol with droplets not in suspension whilstthe dust conditions were invariably a solid aerosol.
2.2 Test Chamber Setup
Fig. 1 and 2 present the test chamber and sensor arrangement. The test chamber was arectangular room with a floor area of 30m by 5m and a height of 2m. The performance ofboth the radar and laser sensors was recorded for different rain, mist and dust conditions.A retro-reflective target (3M Scotchlite reflective sheeting 3800 series Class I) and normaldiffuse surface were placed at a variety of distances from the sensors and the range readings tothese were recorded for various conditions. It was found that accurate range determinationwas possible to the retro-reflective targets at higher dust and rain densities than for anobstacle with a surface exhibiting Lambertian reflectance.
Laser pointers were situated at several distances along the test volume to allow quantificationof the dust concentration (see Section 2.3). The laser pointer spots were incident on a smallwhite transparent screen.
Two cameras were used to observe the experimental conditions. The first (Allied VisionTechnologies Marlin with a Fujinon 1:1.4/25mm lens) presented a view down the length ofthe test chamber, providing visibility information on contrast targets and qualitative confir-mation of the obscurant media’s even distribution along the length of the test volume via therelative scatter pattern of the laser pointer beams used for the transmission measurements.The second camera (Unibrain Fire-i web-cam) imaged the screen illuminated by the laserpointer spots to provide the intensity information used for the transmissibility evaluation.
Sample images from the camera viewing the test chamber are presented in Fig. 3 for threedust conditions. The first image is of the empty test chamber without any obscurant in-termediary. This is assumed to be effectively clear space and taken as the baseline for thetransmission calculations. The third image shows the test chamber under heavy dust loading(visibility < 8m). The middle image shows an intermediate condition.
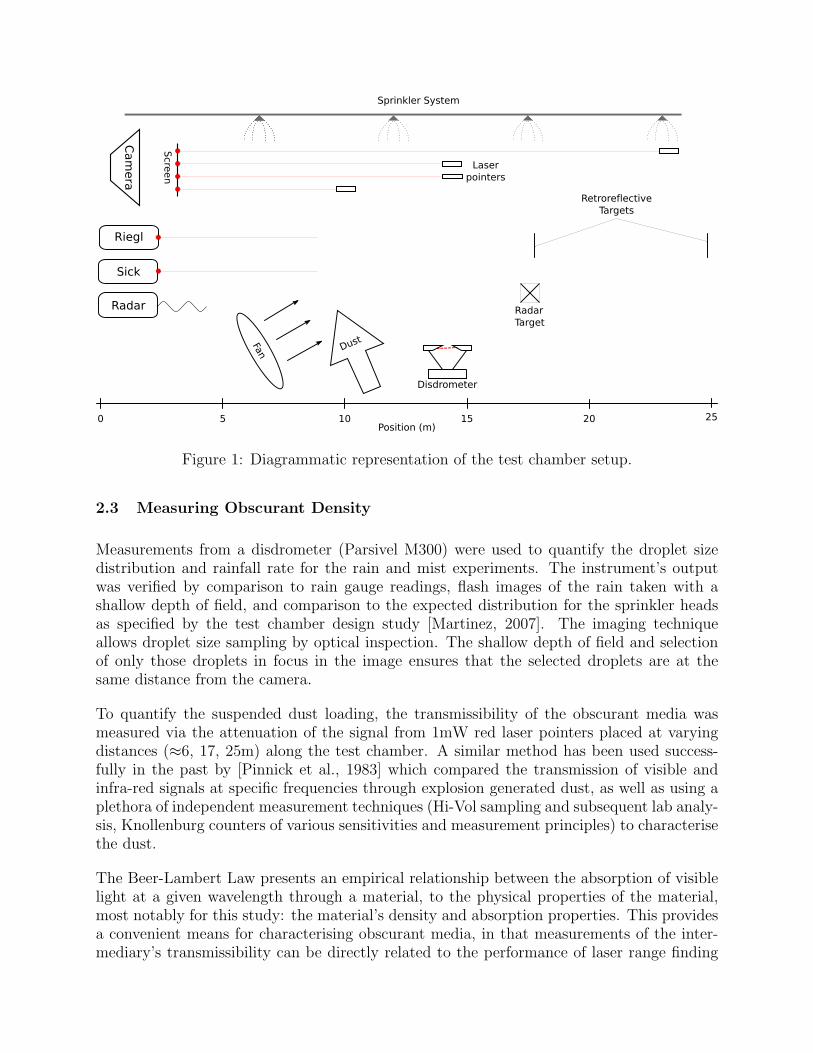
Figure 1: Diagrammatic representation of the test chamber setup.
2.3 Measuring Obscurant Density
Measurements from a disdrometer (Parsivel M300) were used to quantify the droplet sizedistribution and rainfall rate for the rain and mist experiments. The instrument’s outputwas verified by comparison to rain gauge readings, flash images of the rain taken with ashallow depth of field, and comparison to the expected distribution for the sprinkler headsas specified by the test chamber design study [Martinez, 2007]. The imaging techniqueallows droplet size sampling by optical inspection. The shallow depth of field and selectionof only those droplets in focus in the image ensures that the selected droplets are at thesame distance from the camera.
To quantify the suspended dust loading, the transmissibility of the obscurant media wasmeasured via the attenuation of the signal from 1mW red laser pointers placed at varyingdistances (≈6, 17, 25m) along the test chamber. A similar method has been used success-fully in the past by [Pinnick et al., 1983] which compared the transmission of visible andinfra-red signals at specific frequencies through explosion generated dust, as well as using aplethora of independent measurement techniques (Hi-Vol sampling and subsequent lab analy-sis, Knollenburg counters of various sensitivities and measurement principles) to characterisethe dust.
The Beer-Lambert Law presents an empirical relationship between the absorption of visiblelight at a given wavelength through a material, to the physical properties of the material,most notably for this study: the material’s density and absorption properties. This providesa convenient means for characterising obscurant media, in that measurements of the inter-mediary’s transmissibility can be directly related to the performance of laser range finding

Figure 2: The experimental setup. Sensor placement (left), showing the shaker table (left ofimage), imaging cameras, laser sensor, radar and screen for laser pointer spots. The volumetowards the targets (right), showing contrast targets, radar reflectors and retro-reflectivetargets for the laser sensors.
Figure 3: Typical images captured during dust experiments. The first image (left) is ofthe empty test chamber without any obscurant intermediary. The centre image shows anintermediary condition during dust injection. The third image (right) shows the test chamberunder heavy dust loading (visibility < 8m)

devices without the need to formally characterise the obscurant’s composition and density.
For the purposes of this study, the transmissibility, T , of the media was measured using theratio of the measured intensity of the laser pointer before I0 and after I1 passing throughthe obscurant intermediary (1).
T =I1I0
(1)
This can be related to the intermediary material’s properties through (2):
A = − ln(T ) = σlN (2)
where A is the characterising absorbance of the media, σ is the obscurant’s absorption crosssection, l is the length between the incident and measured intensities and N is number ofabsorbers.
Visibility can be roughly related to the mass of dust per volume, which is the typicalmeasurement unit for quantifying dust density in occupational health and safety fields,through [Gillett, 1979,Brooker et al., 2007]:
M =C
V γ(3)
where M is the mass of suspended particulate (g/m3), C and γ are constants of propor-tionality dependant on the suspended materials and atmospheric composition and V is thevisibility (m). [Brooker et al., 2007] gives typical values for C and γ as 37.3 and 1.07 respec-tively.
Unlike measurement of transmissibility (1) the transmission coefficient is independent ofpath length and provides a better descriptor for the concentration of suspended dust and thecharacteristic absorption of the dust particles. The transmission coefficient, Tc is calculatedfrom a combination of (1) and (2) as per (4).
Tc =(I1I0
)1/l
= e−σN (4)
The imaged laser pointer spots were analysed and used to compute the dust transmissibility.For each spot, a rectangular region of interest (ROI) containing the full extent of the spot wasdefined. For each image during the experimental period, the red components were summedover the ROIs and the baseline red component from the background (from a region of thescreen with no incident spot) subtracted. This method provided normalisation of the spotintensities with respect to each other and the background and allowed calculation of thetotal incident energy despite the variety of spot sizes due to the varied distances betweenthe screen and the laser pointers. The sums of the red components for the regions of interest

50
100
150
200
0 0.005 0.01 0.015 0.02 0.025 0.03
Pix
elIn
tens
ity
Exposure Time(s)
Figure 4: Camera response curve illustrating the region of linearity.
was normalised such that the transmission coefficient was one (100% of the transmitted lightis incident at the receiver) when there was no obscuring media other than air.
Calculating the relative incident light energies for the transmission coefficient requires knowl-edge of the response curve of the camera imaging the laser pointer spots. This response curverelates the incident light energy to the pixel intensity recorded by the camera sensor. Thecurve was obtained by imaging a white target under constant illumination with varying ex-posures. If all other settings are held constant, the total incident light energy is directlyproportional to the exposure time. In this manner, Fig. 4 was generated and shows theresponse function for the camera imaging the laser spots. There is significant non-linearityin the imaging camera’s response for pixel intensities outside of the 30 to 200 range and thusonly intensities measured within this bound were compared for the calculation of the relativeincident light energy.
For the validity of this method, it is vital to use lossless compression of the images to preventblurring and colour bleed artefacts that may influence the results. The laser pointer spotimages also need to be free of saturated pixels, to prevent incident energy being unaccounted.Saturation limits can be tuned by varying the imaging camera’s exposure settings.
It was found that during initial dust injection into the test chamber, and for a short periodafter, the density of dust along the length of the test volume was non-uniform as confirmedby visual inspection of the scatter lines from the laser pointers which exhibited variationalong their length as a function of the density at that distance. This is illustrated in thesecond image of Fig. 3 where the width and intensity of the laser’s scatter line varies withthe dust density along the length of the test chamber. After approximately 20 seconds thedust establishes a colloidal suspension with near constant scatter apparent along the imageof the laser line (see the third image of Fig. 3). The resultant solid aerosol is relatively stable,

Radar SICK Riegl2D HSS LMS291-S05 LMSQ120
Dist. to reflective target 1by instrument 16.154m 17.040m 17.603mby tape-measure 16.15m 17.05m 17.60mMean RMS error 0.086m 0.006m 0.008mSignal strength (intensity) 83.4dB 1 214Dist. to reflective target 2by instrument 18.359m 24.070m 24.591mby tape-measure 18.35m 24.07m 24.60mMean RMS error 0.066m 0.007m 0.010mSignal strength (intensity) 95.17dB 1 204Other notable effects Multi-path. Low None
Saturation. Signal
Table 2: Target acquisition performance, clear conditions. Intensity varies over 0 to 7 forthe SICK and 0 to 255 for the Riegl.
existing for a number of minutes after the dust injection process is halted.
3 Experimental Results
3.1 Clear Conditions
Baseline results for the clear conditions were recorded to characterise the sensor performanceand are presented in Table 2. These results are comparable to the manufacturer specifiedsensor characteristics. Distance was measured to the instrument (to the nearest 10mm) andcompared to the instrument’s measurement of the distance (to the nearest 1mm). The meanRMS error from the instrument’s measurement mean and the return signal intensity is alsopresented.
Multipath and saturation effects were visible in the radar data for some scan points awayfrom the target reflectors. These are wholly due to the geometry and composition of themetal walls and roof of the test chamber enclosure (and would not be apparent in a typicaldeployed environment). Multipath errors were also visible in the Riegl data where the beamreflected off the smooth surface of the roof or floor. This error was intermittent and localisedto specific areas of the test chamber. Changing the device to first-echo mode eliminatedthese effects. All further testing was conducted in last-echo mode.
These erroneous effects were filtered out of the analysed data sets to create a base-line forthe clear conditions.
3.2 Rain and Mist Experiments
A variety of rain flow rates were used to generate a series of droplet diameter versus frequencydistributions and the resultant sensor outputs for each condition compared. The results ofthis testing are presented in this section.
Through the range of test conditions, negligible effect was observed to the radar sensoroutput. Despite a slight drop in peak signal strength (in line with the theory presentedin [Brooker et al., 2007]), no change to return accuracy and precision or target discernabilitywere noted. There were no observable changes to the existing multi-path and saturationeffects from the clear condition testing.
Both laser sensors were generally robust to the low flow rate conditions, but presenteddegrading performance as flow rates increased and heavy mist-like conditions were generated.It was found that the rain rate had only a minor performance impact on the accuracy andprecision of the ranging measurement of the sensors, however did significantly alter theprobability of detecting the target (or returning a false or absent range measurement) andso we focus our analysis on this point.
Fig. 5 presents the drop size and frequency distribution for the threshold conditions (approx-imately 50% valid returns) for the SICK laser. These conditions represent those in which itcan be argued that the SICK laser sensor data can still be considered usable. This occurredat rainfall rates of approximately 50-70mm/hour. Although it may be expected that thepresented droplet diameter distribution would be a monotonically decreasing curve, the testsetup was unable to produce very small drop sizes or fog-like conditions, and the disdrom-eter was limited by a lower measurement bound for droplet diameters of 0.25mm. Table 3presents a summary of the average sensor performance over a 5 minute test in these con-ditions. Distance was measured to the instrument (to the nearest 10mm) and compared tothe instrument’s measurement of the distance (to the nearest 1mm). The mean RMS errorfrom the instrument’s measurement mean, the return signal intensity and the probability oftarget acquisition over the 5 minute window is also presented.
It was found that the SICK sensor was more robust to larger drop sizes than the Riegl,whilst the Riegl showed better performance than the SICK in conditions with dense, smalldrop sizes (misty conditions). There was significant variation in the probability of targetacquisition over the test period when using a 1000 sample moving probability window forthe SICK. The range measurements for false target acquisitions also showed a high variation.This suggests that the SICK sensor’s mode of failure was detection of rain drops instead ofthe target, manifesting itself in either the range return of the raindrop itself or a mixed-pixeleffect between the raindrop and the target. This is consistent with the larger beam widthof the SICK, whereas the Riegl showed near constant failure probabilities during the testswith failures tending to be absent measurements or very low range false target acquisitions.This behaviour is consistent with the tight beam width of the Riegl being intercepted bythe rain drops. The Riegl’s superior performance in the misty conditions was limited to thelast-echo return mode and exemplifies the performance gains available through such filteringmethods.

0
5000
10000
15000
20000
25000
0 0.5 1 1.5 2 2.5 3
Dro
pra
te(d
rops
s−1m−2
)
Diameter (mm)
Figure 5: Droplet diameter distribution for the threshold (approximately 50% failure rate)laser returns. Note that the curve goes to zero at low droplet diameters due to the lowermeasurement bound of the instrument and the limitations of the method used to generatethe rain conditions to produce very fine drop sizes.
Radar 2D SICK RieglHSS LMS291-S05 LMSQ120
Dist. to reflective target 1by instrument 14.103m 17.110m 17.610mby tape-measure 14.10m 17.10m 17.60mMean RMS error 0.04m 0.01m 0.022mSignal strength (intensity) 83.38dB 0 60-190Probability of target 100% 81% 70% (last echo),acquisition 40% (1st echo)Dist. to reflective target 2by instrument 14.777m 24.170m 24.600mby tape-measure NA 24.17m 24.60mMean RMS error 0.098m 0.007m 0.038mSignal strength (intensity) 82.13dB 0 60-160Probability of target 100% 49% 65% (last echo),acquisition 44% (1st echo)Other notable effects none multi-path multi-path,
false target.
Table 3: Target acquisition performance, rain and mist threshold conditions (approximately50% valid returns for the 25 m target, as presented in Fig. 5) for a five minute test. Intensityvaries over 0 to 7 for the SICK and 0 to 255 for the Riegl.

Wet surface conditions and puddles form a reflective surface at low angles of incidence andrefractive surface at higher angles for the laser beam. This introduces multi-path effectswhich were observable in the acquired laser data as reflections of the targets about theground plane in both laser sensors. The Riegl also displayed a false target (‘ghost’ points)floating above the retro-reflective target at 17m (a reflection about the centre of the sensor’sfield of view) in the clear conditions between rain and mist tests when the surrounds werewet. This false target disappeared if the retro-reflective target at this distance were replacedwith a target of lower reflectivity, more Lambertian reflectance, or when the target, groundand walls of the test chamber had dried. It can be speculated that this false target could bedue to reflections internal to the sensor’s mechanism under high intensity return conditionsor an effect similar to lens flare as observed on cameras.
3.3 Dust Experiments
A variety of tests were conducted to determine the method to produce the densest dust cloud(see Section 2.1) and subsequently, a series of sensor performance experiments conducted,the results of which are detailed in this section.
Through the range of test conditions, negligible effect was observed to the radar sensoroutput. No change to signal strength, return accuracy and precision or target discernibilitywere noted. There were no observable changes to the existing multipath and saturationeffects observed for the radar from the clear condition testing.
Over the course of the dust clearing, it was found that Tc rises from 91% to 96%. As thisis normalised for a path length of 1m, this change appears insubstantial, however over the50m path length for which the lasers pass for a target at a range of 25m, T 50
c corresponds tovalues of transmissibility in the range of 1-10%.
It was found, for the laser sensors, that target acquisition failure was abrupt - probabilityof target acquisition varied from 100% to complete failure within a very small change in thetransmissibility measurement (see Fig. 6). The threshold transmission coefficients are 0.921for the LMS and 0.926 for Riegl for which the corresponding transmissibilities over a 50mpath length are 0.0163 and 0.0213 respectively. These results emphasise the effectiveness ofthe ranging sensors when the return energy is only 1-2% of the energy emitted by the device.This analysis excludes energy losses from absorption at the target which will further reducethe returned energy. At the levels of transmission for which the lasers failed for the 25mtarget, visibility was poor: typically of the order of 10m.
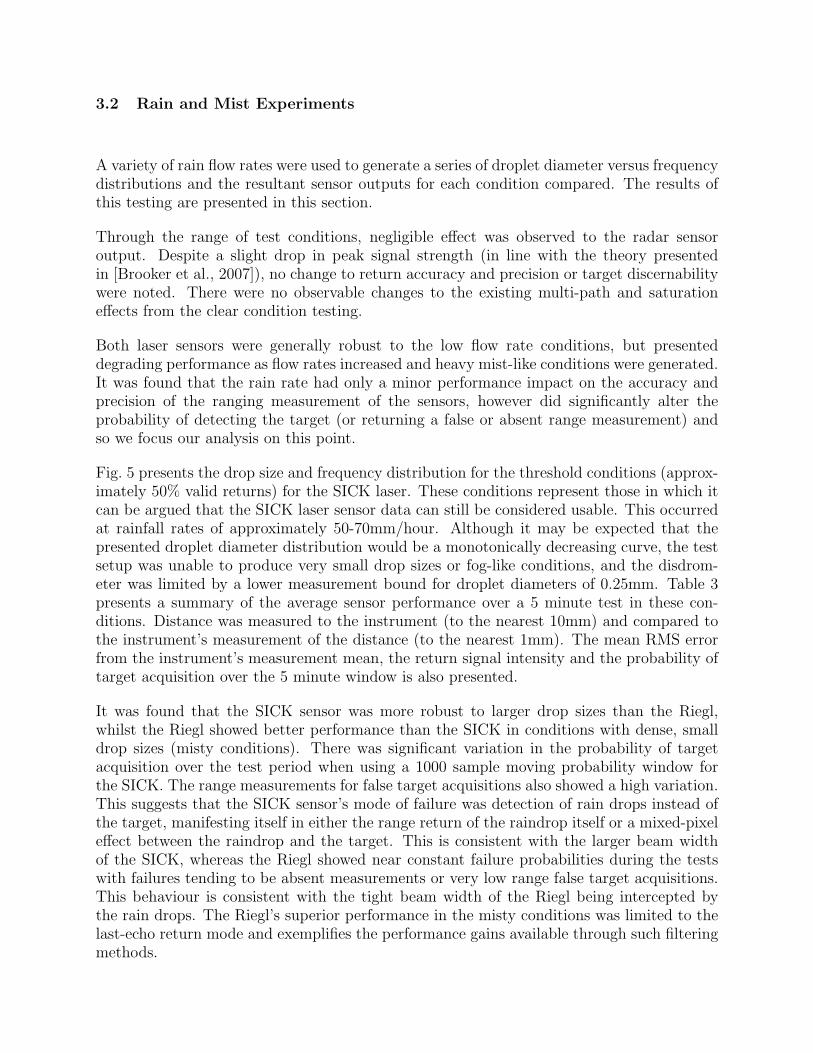
Fig. 7 presents the 10 second RMS error from the measurement mean for each of the lasersensors as a function of the transmission coefficient. As expected and similar to the curvefound in [Adams and Kerstens, 1996], the error in the measurement increases for both sensorsas the amount of dust increases (and the transmission decreases) before the abrupt loss oftarget. This is further illustrated in Fig. 8 which presents histograms of the range returns forvarious transmission coefficients. Additionally, these distributions show that the SICK LMSshows a systematic range increase as the dust level increases that is separate to those due torange and incidence angle presented by [Diosi and Kleeman, 2003]. The histograms in Fig. 8

0
0.2
0.4
0.6
0.8
1
0.9 0.91 0.92 0.93 0.94 0.95 0.96 0.97 0.98 0.99 1
Pro
babi
lity
ofFa
ilure
Transmission coefficient (1m Normalised)
LMSRiegl
Figure 6: Probability of failure for both the SICK and Riegl against transmission for thedust experiments. The target is 25m from the laser scanner. There are increasing rangereading failures as the transmission falls.
provide an effective means of characterising the laser sensor performance as a function ofobscurant density for the purpose of building a sensor model. The Reigl is better behaved:as the dust levels increase, no systematic bias is observed, but an increasing spread whichis correctly centred. Clear-space geometric and systematic sensor behaviours for the SICKare well documented in [Ye and Borenstein, 2002] and more generally for laser range findersin [Adams and Kerstens, 1996, Arras, 2003] and the methods presented appear suitable fordefining the Riegl’s characteristics. The normal fits for the distributions in Fig. 8 indicatethat the range distribution may be adequately described by a Gaussian model within theerror bars of these experiments. No other sensor performance degradation effects (such asmultipath) were observed during the dust tests, although effort was made to keep sensorlenses and targets clean.
4 Field Experiments on an Electric Rope Shovel
Four sensors were installed onto a P&H 2100 BLE electric face shovel (Fig. 9) for the purposeof generating digital terrain maps and performing volume estimation tasks. These maps arepassed to an automation system to allow path planning and collision avoidance. Two SICKLMS291-S05 were mounted either side of the crowd-arm pivot, a Riegl LMSQ-120 mountedadjacent to the right hand side SICK and an ACFR radar as presented in the precedingsections was mounted on the left hand side of the machine house. The laser scanners rely onshovel motion for 3D data collection whilst the radar was modified with a pan axis to allow3D data collection without swinging the shovel. Machine pose information was providedto the sensors via the IARTK system (discussed in Sec. 1.1) installed on the shovel which
0
0.01
0.02
0.03
0.04
0.05
0.06
0.07
0.08
0.93 0.94 0.95 0.96 0.97 0.98 0.99 1
RM
Ser
ror
(m)
Transmission coefficient (1m Normalised)
LMSRiegl
Figure 7: RMS error from a ten second sample mean for both the SICK and Riegl againsttransmission for the dust experiments. The target is 25m from the laser scanner. The RMSerror increases as there is an increase in obscuring media until failure as given by Fig. 6
allowed measurement conversion to a common reference frame.
No sensor problems due to vibration or shocks were evident on this installation. In part, thisis likely due to the relatively smooth operation of this type of excavation machinery, whichhas very slow dynamics due to the significant vehicle mass. The onboard pose estimatorincorporates an IMU and provides pose estimates at 50Hz (and internally at up to 200Hz),whereas the dominant machine dynamics are in the order of <5Hz. This oversamplingminimises map registration errors and possible ghosts, distortions and other artifacts in thescan images due to vibration.
The ghosting effects observed during the controlled indoor tests were also apparent in thefield data on items of high reflectivity (e.g. vehicle number plates and some signs - seeFig. 10). The SICKs provide a larger field of view than the Riegl (180 versus 80 degrees)allowing proprioception of the shovel including the crawler tracks and rear-mounted cable-reeler. The wider field of view also allows sighting of items at higher altitude, including thetops of surrounding trees.
4.1 Field results and analysis
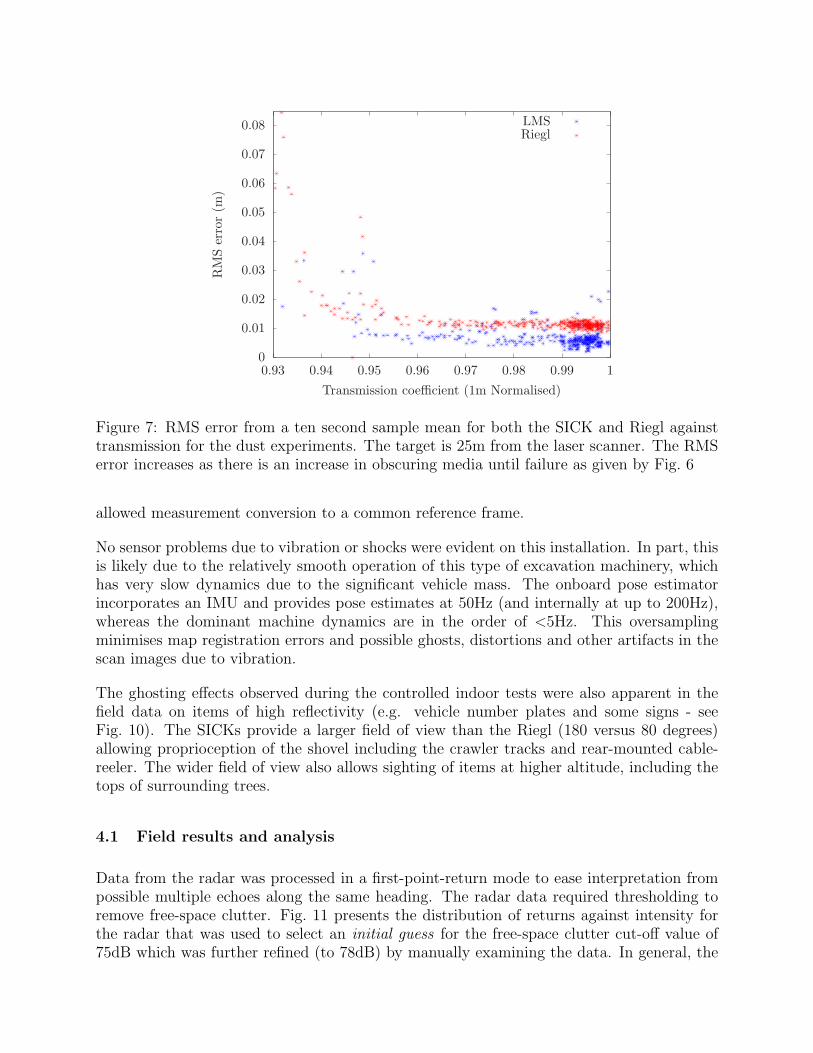
Data from the radar was processed in a first-point-return mode to ease interpretation frompossible multiple echoes along the same heading. The radar data required thresholding toremove free-space clutter. Fig. 11 presents the distribution of returns against intensity forthe radar that was used to select an initial guess for the free-space clutter cut-off value of75dB which was further refined (to 78dB) by manually examining the data. In general, the

0
0.2
0.4
0.6
0.8
1
24 24.05 24.1 24.15 24.2 24.25 24.3 24.35 24.4Range to target (m)
0.99 < Tc <= 1.00Normal fit
0.98 < Tc <= 0.99Normal fit0.98 < Tc
Normal fit
(a) SICK LMS (25m target)
0
0.1
0.2
0.3
0.4
0.5
0.6
0.7
0.8
24.4 24.45 24.5 24.55 24.6 24.65 24.7 24.75 24.8Range to target (m)
0.98 < Tc <= 1.00Normal fit
0.96 < Tc <= 0.98Normal fit0.96 < Tc
Normal fit
(b) Riegl (25m target)
0
0.1
0.2
0.3
0.4
0.5
0.6
0.7
0.8
0.9
17 17.05 17.1 17.15 17.2 17.25 17.3 17.35 17.4Range to target (m)
0.99 < Tc <= 1.00Normal fit
0.98 < Tc <= 0.99Normal fit0.98 < Tc
Normal fit
(c) SICK LMS (17m target)
0
0.2
0.4
0.6
0.8
1
17.4 17.45 17.5 17.55 17.6 17.65 17.7 17.75 17.8Range to target (m)
0.98 < Tc <= 1.00Normal fit
0.96 < Tc <= 0.98Normal fit0.96 < Tc
Normal fit
(d) Riegl (17m target)
Figure 8: Distribution of range returns for the laser sensors for various transmission coeffi-cients. In 8a and 8c there is evidence of a range bias as the dust levels increase for the SICK.In 8b and 8d, an increase in dust levels does not consistently introduce a bias, but rather asignificant increase in the distribution.

Figure 9: The P&H 2100 BLE electric face shovel from which the field data presented in thispaper was collected.
radar showed expected behaviour with lower point return densities and a higher uncertaintyin the range and angular measurement than the lasers. This results in significant data noisewith uncertainty in the ground plane’s z-coordinate (vertical location) typically near 0.5mand up to 1.25m in some instances, although these extreme values are partly due to the1st point return interpretation method employed in combination with the wide beam-widthintroducing a range bias dependant on the incidence angle. This uncertainty in measurementand low cloud density made identification of objects less than 2m in size difficult in the radardata.
There is good correspondence between the filtered point clouds generated by the radar andthose by the SICKs, with similar surfaces providing returns (generally those with a highangle of incidence to the beam) and both sensors were unable to see a region of standingwater near the shovel due to the large angle of incidence. The radar occasionally showedspurious returns near items with a high-metallic content (e.g. the haul truck shown inFig. 12) when the side-lobes of the radar signal intercepted the metal item. In these cases,the sensor returned a signal with an intensity above the free-space clutter filtering thresholdas detected by the beam side-lobe, but with angular offset aligned with centre of the beam.
The significantly lower data acquisition rates and scan-rates for the radar presented the mostlimiting constraint for the terrain modelling application presented here. For this application,data is required of stationary haul trucks or other loading units positioned near the shovelto allow loading. Typically each loading cycle is 30-45 seconds long and involves the shoveldigging, swinging to the load point above the truck, releasing the load and returning to thebank for the next dig. Several such cycles are required to fill the load unit (truck).

Figure 10: Point cloud data from the Riegl showing the effect of ‘ghosts’ in the data (high-lighted in the green squares). Points are coloured by return intensity. The false points aredue to the high intensity points immediately below from the vehicle number plates.
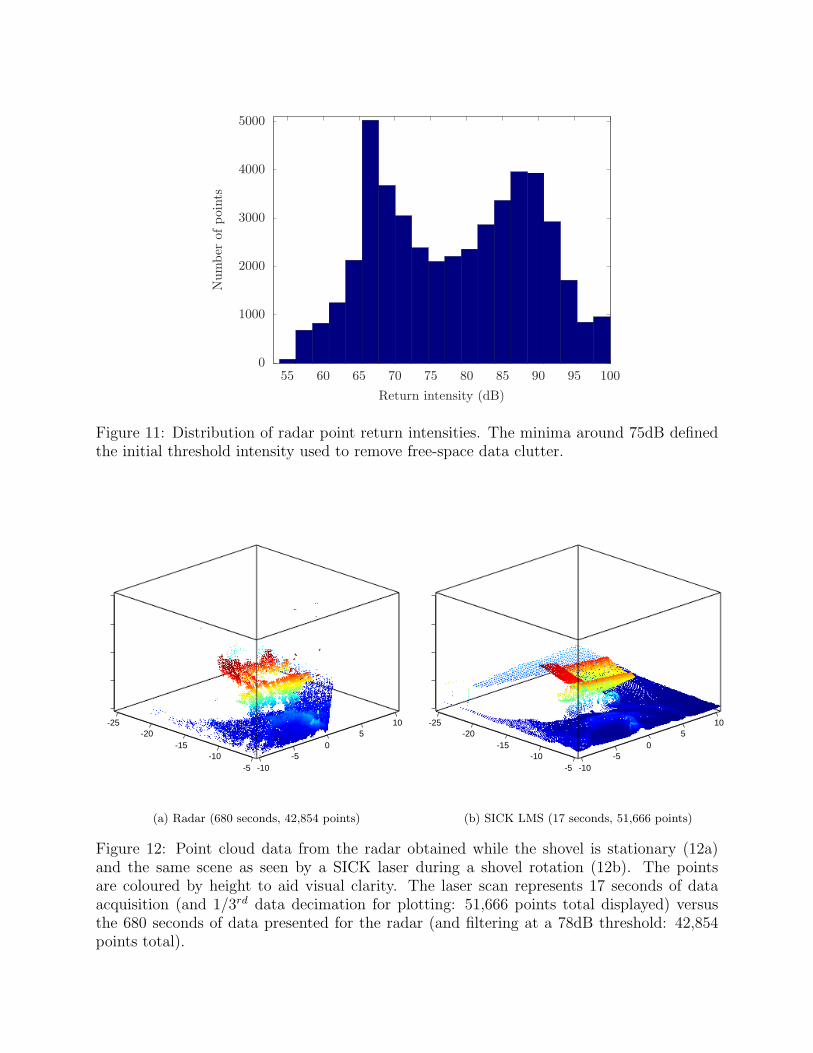
The data for the radar presented in Fig. 12 was collected over a period of approximately 11minutes whilst the shovel was stationary, using the radar’s pan axis actuation to give the 3Dpoint cloud. This data shows a sparser point distribution than that collected by the laser inthe Fig. 12, which was collected over approximately 17 seconds during a simulated loadingcycle.
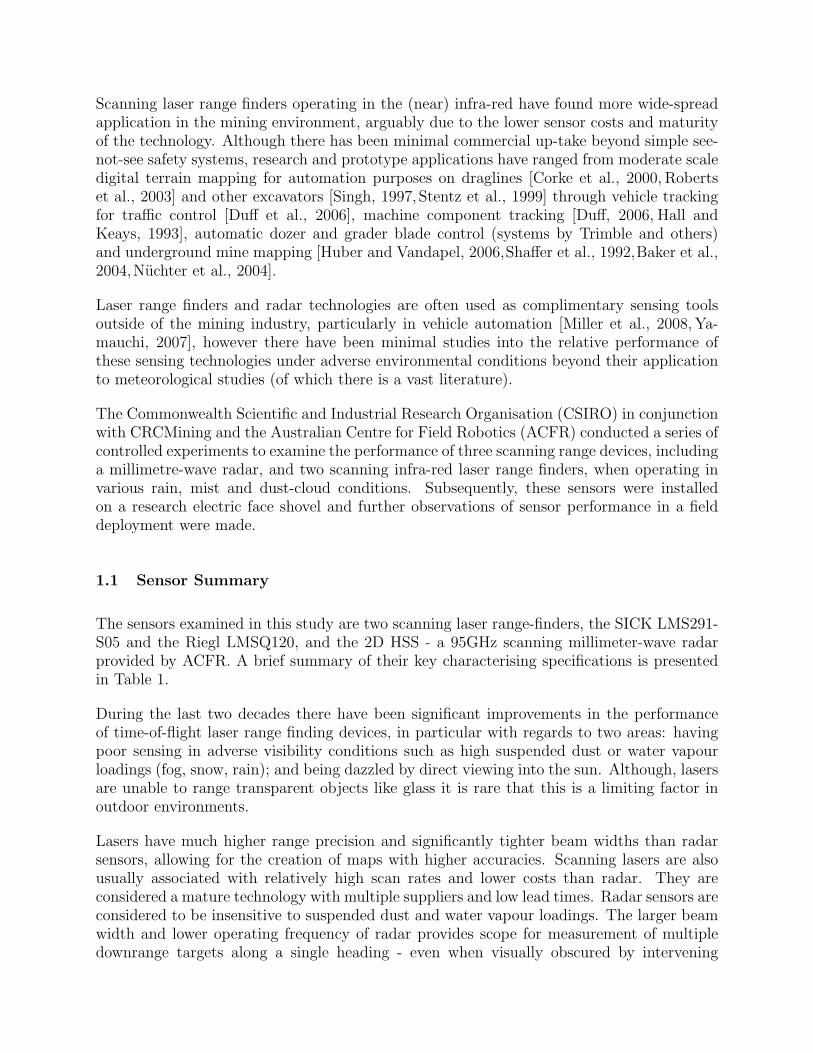
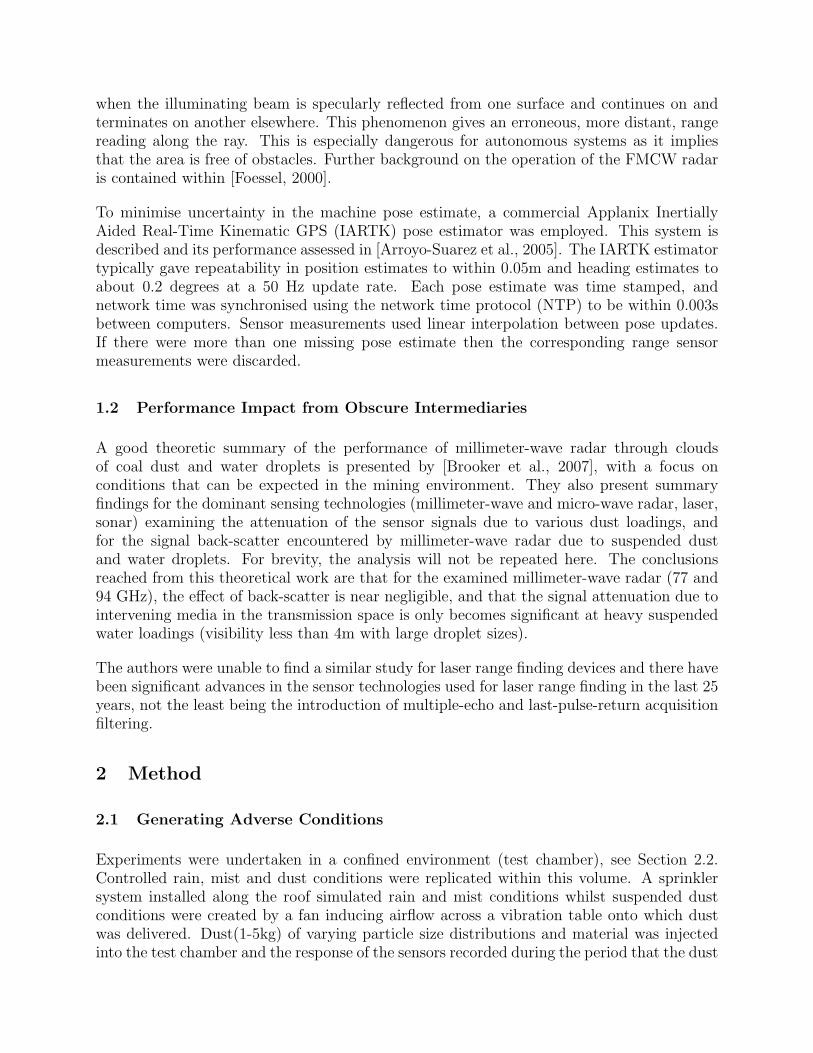
Fig. 13 summarises the associated distances between two point clouds from a subset of thedata (truck) presented in Fig. 12. The SICK LMS point cloud was used as a base dataset, and each radar point queried for its distance to the nearest point in the laser data.Assuming that the laser data is locally spatially correct, an assumption supported by visualinspection of the truck and its flat surfaces, the distribution in Fig. 13b of these nearestneighbour distances illustrates the error in the radar data. Specifically the presence of large(2m) outliers and the poisson-like distribution of the errors is notable in both Fig. 13a andFig. 13b. This highlights that although the radar operation is relatively unaffected by dustand rain its accuracy and data acquisition speed is currently insufficient for recognisingobjects without radar beacons, accurate (better than 0.5m) volume estimation or terrainmodelling.
5 Summary and Conclusion
This paper has presented a repeatable, reliable and relatively inexpensive method for thecomparison of the millimeter-wave radar and near infra-red laser scanning range findingtechnologies under varying environmental (dust, rain/mist) conditions. The metrics of rangeaccuracy, target acquisition probability and signal intensity were compared to determine thethreshold values at which the various sensing technologies failed under adverse environmentalconditions. Further observations from testing in a field deployment were also presented.
It was found that in the environmental conditions tested indoors, the lasers showed accurateand reliable target detection when visual targets were no longer discernible by passive means,such as video imagery. There is a limit to the level of obscurity through which the laserswere able to provide accurate ranging information. This limit was similar for both the Riegl
0
1000
2000
3000
4000
5000
55 60 65 70 75 80 85 90 95 100
Num
ber
ofpo
ints
Return intensity (dB)
Figure 11: Distribution of radar point return intensities. The minima around 75dB definedthe initial threshold intensity used to remove free-space data clutter.
-25-20
-15-10
-5 -10-5
05
10
(a) Radar (680 seconds, 42,854 points)
-25-20
-15-10
-5 -10-5
05
10
(b) SICK LMS (17 seconds, 51,666 points)
Figure 12: Point cloud data from the radar obtained while the shovel is stationary (12a)and the same scene as seen by a SICK laser during a shovel rotation (12b). The pointsare coloured by height to aid visual clarity. The laser scan represents 17 seconds of dataacquisition (and 1/3rd data decimation for plotting: 51,666 points total displayed) versusthe 680 seconds of data presented for the radar (and filtering at a 78dB threshold: 42,854points total).

-18-16
-14-12
-9.5
10
7.8
5.5
3.2
1
-6
-30
36
(a) Radar truck error
0
5000
10000
15000
20000
0 0.5 1 1.5 2
Num
ber
ofpo
ints
Distance error (m)
(b) Radar distance error distribution
Figure 13: Nearest neighbour associated distance error plots for the truck points presentedin Fig. 12. The laser data is considered as a ground truth and each radar point coloured byits distance from the nearest laser point. (13a). The distribution of these error distances ispresented in 13b with 0.1m interval spacing.
and SICK at a transmission coefficient of 92-93% per meter for bright targets closer than25m.
For the testing conducted within the scope of this work, it appears that the false returnsmay be either so called phantom points (or mixed pixels [Adams and Kerstens, 1996,Ye andBorenstein, 2002]) formed by the combination of the returns generated by the rain, mistor dust and the target, or simply returns produced by the rain, mist or dust itself. Theseartifacts can be filtered out and there is some literature on common approaches (see, forexample [Tuley et al., 2005,Tang et al., 2007]). Absent returns for a bright target occur onlywhen the transmission coefficient is less than 92.5%. In these poor conditions, the SICKLMS291-S05 tends to oscillate between false and absent returns. The Riegl provides a multi-echo target discrimination mode, and during the rain tests there was a higher likelihood ofthe sensor returning a valid measurement when using the last echo return.
Both laser sensors provide a measure of the intensity of the return pulse: a simple integergain measurement from 0 to 7 for the SICK LMS and 0 to 255 for the Riegl. The valueof the return intensity correlated well to the transmission measurement for the Riegl, andunder these controlled conditions could be used to detect when the sensor is likely to providefalse readings. It is unlikely that such a method would be easily adapted to use in thefield without discarding a significant portion of valid measurements from targets with lowreflectance. The use of the return intensity as a means to determine the likelihood of a corruptrange measurement for the SICK LMS is not recommended as the observed intensities duringthe tests were low and showed minimal correlation to transmission measurements. The SICK

LMS291-S05 is equipped with pollution sensing capability, however this only activated whenthere was a significant build up of dust on the surface lens of the sensor and did not appear tobe a robust method of discriminating between false/absent and real returns during testing.
The radar return was relatively unaffected by the generated conditions, showing robustbehaviour. However, as a sensing technology radar provides lower range and angular precisionthan the laser systems. This is mainly due to its wider beam width and longer wavelength.The radar tested here exhibits other technology specific behaviours which make generation ofdigital terrain maps difficult and limits application of the sensor to those operations withouta need for high fidelity or high sample rates.
The radar showed reliable performance and accuracy irrespective of the intermediary obscu-rant density for the point reflector targets used in these tests. Sensor return intensity showednegligible attenuation in the dust trials, but dropped approximately 3dB under the highestrain rates.
The results from this study indicate the following:
1. Radar generates point-cloud type information that is robust to adverse environmentalconditions including heavy mist, rain and dense dust clouds. The measurements areof low precision and in our application, spatially sparse, but sufficient for the provisionof structure, and large (≈2m) object segmentation.
2. Laser provides a more easily interpreted measurement ideally suited to the creationof digital models of the surrounding terrain with high precision and accuracy. Themeasurements are susceptible to corruption in environments with high mist and dustloading. This data degradation is not easily identified from the laser measurementalone.
3. There is scope to combine the output from the sensors to create a more robust repre-sentation of the surrounding terrain utilising the strengths of both sensors to compen-sate for the individual sensors’ weaknesses. It is apparent that neither sensor alone issufficient for the expected highly adverse environment of the mining operating space.
It is intended to develop and evaluate appropriate fusion methods and spatial representationsfor these sensors to address this last point. Some guiding heuristics to base this work on are:
• using radar returns to provide a ‘rough-draft’ of the surrounds in which significantobstacles are clearly identifiable and that is robust to adverse weather and dust;
• using laser information to provide the detail of the surrounds, and other informa-tion required for tasks such as volume estimation and classification of objects andobstacles;
• using radar returns to determine when information provided by the laser sensors havebeen degraded by adverse weather and dust.
The authors note that the conducted tests were specific to the project within which theywere conducted (ACARP project C16031). The effects of varying the composition of the

dust to include materials which have the potential for a high radar cross section (e.g. ironore dust), large rain drops (such as may be encountered during tropical storms), ice (hail orsnow) were not specifically considered. These conditions have the potential to further affectthe sensor returns from both sensing technologies and may lead to additional effects beingobserved.
All our indoor experiments considered situations where the sensors were within the obscuringmedia ‘cloud’. A highly reflective cloud that is separated from the sensor by intervening clearspace will inevitably produce detection of an inexistant object (the edge of the cloud) if thelaser sensor is used alone (versus some fusion method against the radar). This case was notexplicitly considered. Similarly the absence of an obstacle due to high absorption propertiesof the cloud may also cause system failure if the laser sensor is used alone, however we haveshown that the likelihood of this failure can be evaluated through simple experiments andmeasurement of the transmission in environments that reflect the deployment.
Adverse environmental conditions as severe as those generated in the controlled testing areyet to be observed in the field and indicate an area of required further work. It wouldbe desirable to observe and assess the sensors’ performance over an extended period in aproduction environment. Furthermore, it is suggested that any such testing aim to incorpo-rate as varied operating conditions as possible, including operation in significantly differentore-types, for example coal and iron.
Acknowledgment
The authors would like to thank the Australian Coal Association Research Program(ACARP) for funding project C16031 which provided for the work presented in this pa-per. We would also like to thank the joint partners in this research project: the CooperativeResearch Centre for Mining (CRCMining) and the Australian Centre for Field Robotics(ACFR). In particular, we would like to thank (from CSIRO) Mike Bosse, for laser sensorcalibration and technical advice on the data acquisition and processing, Steve Nuske forproviding the camera response curve (from ACFR) Javier Martinez and Graham Brookerfor provision and calibration of the radar, providing the results of the radar performanceunder controlled conditions and review feedback on a report from which this paper is based,and (from CRCMining) Ross McAree, Anthony Reid, Kevin Austin, Rebecca Hill and An-drew Denman for managing the ACARP project, providing access to and operating the testfacilities including the research shovel.
References
Adams, M. and Kerstens, A. (1996). The interpretation of phase and intensity datafrom AMCW light detection sensors for reliable mapping. Int J. of Robotics Research,15(5):441–458.
Arras, K. O. (2003). Feature-Based Mobile Robot Navigation in Known and Unknown Envi-ronments. PhD thesis, Swiss Federal Institute of Technology Lausanne (EPFL).
Arroyo-Suarez, E. N., Riley, J. L., Glang, G. F., and Mabey, D. L. (2005). Evaluating a

global differential GPS system for hydrographic surveying. In OCEANS, Proceedings ofMTS/IEEE, volume 3, pages 2557–2563, Washington DC.
Baker, C., Morris, A., Ferguson, D., Thayer, S., Whittaker, C., Omohundro, Z., Reverte,C., Whittaker, W., Hhnel, D., and Thrun, S. (2004). A campaign in autonomous minemapping. In Proceedings of the 2004 IEEE Int. Conf. on Robotics and Automation.
Brooker, G., Hennesy, R., Lobsey, C., Bishop, M., and Widzyk-Capehart, E. (2007). Seeingthrough dust and water vapor: Millimeter wave radar sensors for mining applications.Journal of Field Robotics, 24(7):527–557.
Brooker, G., Hennesy, R., Scheding, S., and Bishop, M. (2005). Development and applica-tion of millimeter wave radar sensors for underground mining. IEEE Sensors Journal,5(6):1270–1280.
Corke, P., Roberts, J., and Winstanley, G. (2000). Experiments and experiences in developinga large robot mining system. In Experimental Robotics VI, volume 250/2000, pages 183–192, Berlin / Heidelberg. Springer.
Diosi, A. and Kleeman, L. (2003). Uncertainty of line segments extracted from static sickpls laser scans. In Australasian Conf. on Robotics and Automation, Brisbane, Australia.
Duff, E. (2006). Accurate guidance and measurement for excavators using a laser scanner.Technical Report C14043, ACARP.
Duff, E., Usher, K., and Ridley, P. (2006). Swing loader traffic control. Technical ReportC13041, ACARP.
Foessel, A. (2000). Radar sensor model for three-dimensional map building. In Proc. SPIE,Mobile Robots XV and Telemanipulator and Telepresence Technologies VII, volume 4195.SPIE.
Gillett, D. (1979). Environmental factors affecting dust emission by wind erosion. Wiley.
Hall, D. and Keays, J. (1993). Dozer trak system phase 2. Technical Report C3045/C3056,ACARP.
Huber, D. and Vandapel, N. (2006). Field and Service Robotics: Recent Advances in Researchand Applications, volume 24 of Springer Tracts in Advanced Robotics, chapter Automatic3D underground mine mapping. Springer.
Macfarlane, D. and Robertson, D. (2004). AVTIS - a dual-mode imaging millimetre waveradar/radiometer for volcanological surveying. Geoscience and Remote Sensing Sympo-sium, 2004. IGARSS ’04. Proceedings. 2004 IEEE Int., 5:3299–3302 vol.5.
Martinez, J. (2007). Rain simulator design. Technical Report Internal, ACFR.
Miller, I., Campbell, M., Hutteniocher, D., Kilne, F.-R., Nathan, A., Lupashin, S., Catlin,J., Schimpf, B., Moran, B., Zych, N., Garcia, E., Kurdziel, M., and Fujishima, H. (2008).Team Cornell’s Skynet: Robust perception and planning in an urban environment. Jour-nal of Field Robotics, 25(8):493–527.
Noon, D., Reeves, B., Sticley, G., Holmstrom, M., Smith, G., and Longstaff, D. (2002).Development of slope stability radar. Technical Report C10036, ACARP.
Nuchter, A., Surmann, H., Lingemann, K., and Hertzberg, J. (2004). 6D slam with anapplication to autonomous mine mapping. In Proceedings of the 2004 IEEE Int. Conf.on Robotics and Automation.

Pinnick, R., Fernandez, G., and Hinds, B. (1983). Explosion dust particle size measurements.Applied Optics.
Reeves, B., Stickley, G., Noon, D., and Longstaff, I. (2000). Developments in monitoring mineslope stability using radar interferometry. Geoscience and Remote Sensing Symposium,2000. Proceedings. IGARSS 2000. IEEE 2000 Int., 5:2325–2327 vol.5.
RIEGL Gmbh (2005). LMSQ120 technical documentation and users instructions. A-3580Horn, Austria.
Roberts, J., Winstanley, G., and Corke, P. (2003). 3d imaging for a very large excavator.Int. Journal of Robotics Research, 22(7/8):467–478.
Scheding, S., Brooker, G., Hennesy, R., Bishop, M., and Maclean, A. (2002). Terrain imagingand perception using millimeter wave radar. In Proc. 2002 Australasian Conf. on Roboticsand Automation, pages 60–65, Auckland.
Shaffer, G., Stentz, A., Whittaker, W., and Fitzpatrick, K. (1992). Position estimator forunderground mine equipment. IEEE Transactions on Industry Applications.
SICK AG (2000). LMS291 technical description. Auto Ident Germany.
Singh, S. (1997). The state of the art in automation of earthmoving. ASCE Journal ofAerospace Engineering, 10(1).
Stentz, A. T., Bares, J., Singh, S., and Rowe, P. (1999). A robotic excavator for autonomoustruck loading. Autonomous Robots, 7(1):175–186.
Tang, P., Huber, D., and Akinci, B. (2007). A comparative analysis of depth-discontinuityand mixed-pixel detection algorithms. In Sixth Intl. Conf. on 3-D Digital Imaging andModelling (3DIM 2007), Montral, Canada.
Tuley, J., Vandapel, N., and Hebert, M. (2005). Analysis and removal of artifacts in 3-dladar data. In Proceedings of the 2005 IEEE Int. Conf. on Robotics and Automation,Barcelona, Spain.
Widzyk-Caperhart, E., Brooker, G., Hennesy, R., Lobsey, C., and Scheding, S. (2006). Ap-plication of millimeter wave radar sensor to environment mapping in surface mining. 9thInt. Conf. Control, Automation, Robotics and Vision, pages 1–6.
Yamauchi, B. (2007). Daredevil: Ultra-wideband radar sensing for small UGVs. In Proceed-ings of SPIE, volume 6561, Orlando, Florida, USA.
Ye, C. and Borenstein, J. (2002). Characterization of a 2-D laser scanner for mobile obstaclenegotiation. In Proceedings of the 2002 IEEE Int. Conf. on Robotics and Automation,pages 2512–2518, Washington DC.