Embed Size (px)
Citation preview

Technical Report SL-98-9 September 1998
US Army Corps of Engineers Waterways Experiment Station
Performance of Electric and Microwave Batch Plant Moisture Meters in Determining the Moisture Contents of Fine-Aggregate Materials for Concrete Production
by Willie E. McDonald, Toy S. Poole
Approved For Public Release; Distribution Is Unlimited
Prepared for Headquarters, U.S. Army Corps of Engineers

The contents of this report are not to be used for advertising, publication, or promotional purposes. Citation of trade names does not constitute an official endorsement or approval of the use of such commercial products.
The findings of this report are not to be construed as an official Department of the Army position, unless so desig- nated by other authorized documents.
$ PRINTED ON RECYCLED PAPER
US Army Corps of Engineers Waterways Experiment Station
HEAOOUAHTERS BUUXKQ
ENTRANCE
ENVmONMENTtt. IAB0RMOW —
AReAOFfKSEBVATIO?! < Z 7s»lo«
Waterways Experiment Station Cataloging-in-Publication Data
McDonald, Willie E. Performance of electric and microwave batch plant moisture meters in determining the moisture
contents of fine-aggregate materials for concrete production / by Willie E. McDonald, Toy S. Poole; prepared for U.S. Army Corps of Engineers.
41 p.: ill.; 28 cm. — (Technical report; SL-98-9) Includes bibliographic references. 1. Aggregates (Building materials) — Testing. 2. Concrete — Moisture —Measurement. 3. Moisture
meters. I. Poole, Toy S. (Toy Spotswood), 1946- II. United States. Army. Corps of Engineers. III. U.S. Army Engineer Waterways Experiment Station. IV. Structures Laboratory (U.S. Army Engineer Waterways Experiment Station) V. Title. VI. Series: Technical report (U.S. Army Engineer Waterways Experiment Station); SL-98-9. TA7 W34 no.SL-98-9

Contents
Preface v
1—Introduction 1
Background 1 Objectives 2 Scope 2
2—Materials and Evaluation Equipment 3
Fine Aggregates 3 Moisture Meter Devices 3
Deltawave moisture recorder 3 Moisture Alert 5 Hydro-View 7 Troxler moisture meter 9 Aggregate storage bins 11
3—Evaluation Procedures 12
Variation of Fine-Aggregate Moisture Content 12 Moisture-Meter Measurements 12 Analysis of Data 13
Random error effects 13 Bias 16 Total uncertainty 17
4—Results and Conclusions 19
Results 19 Conclusions 20
References 21
Appendix A: Physical Property Analyses for Fine-Aggregate Materials Al
Appendix B: Aggregate Storage Bin Dimensional Configuration Bl
Appendix C: Test Results and Method for Calculating Among-Batch Variation from Differences Between Instrumental and Hot-Plate Determinations Cl
SF298
in
List of Figures
Figure 1. Deltawave moisture meter 4
Figure 2. Moisture Alert moisture meter 6
Figure 3. Hydro-View moisture meter 8
Figure 4. Troxler moisture meter 10
Figure 5. Prototype aggregate bins 11
List of Tables
Table 1. Within-Batch Variation, Expressed as Standard Deviations (Units Are in Percent Moisture) 14
Table 2. Between-Batch Component of Variation, Expressed as Standard Deviation, in Units of Percent 15
Table 3. Analysis of Bias in Moisture-Content Determination on Natural Sand 16
Table 4. Analysis of Bias in Moisture-Content Determination Limestone Sand 17
Table 5. Total Standard Deviation 18
Table 6. Maximum Error in Estimating w/c in a Typical Batch of Concrete, Based on +2 Standard Deviations on Mean Moisture-Meter Determinations 18
IV

Preface
The investigation described in this report was conducted by the Concrete and Materials Division (CMD), Structures Laboratory (SL), U.S. Army Engineer Waterways Experiment Station (WES). The work was sponsored by Headquarters, U.S. Army Corps of Engineers, as part of Civil Works Investigations, Work Unit 31138, "New Technologies for Testing and Evaluating Concrete." Technical Monitor for this study was Mr. M. K. Lee (CECW-EG).
The study was conducted under the general supervision of Dr. Bryant Mather, Director, SL, and Mr. John Q. Ehrgott, Assistant Director, SL. Dr. Paul F. Mlakar was Chief, CMD, during this work. Direct supervision was provided by Mr. Edward F. O'Neil, Acting Chief, Engineering Mechanics Branch (EMB), CMD. Mr. Willie E. McDonald, EMB, was the principal investigator of this study. Dr. Toy S. Poole, Engineering Sciences Branch, CMD, analyzed the data and co-authored the report.
At the time of the publication of this report, Director of WES was Dr. Robert W. Whalin. Commander was COL Robin R. Cababa, EN.
The contents of Ms report are not to be used for advertising, publication, or promotional purposes. Gtation of trade names does not constitute an official endorsement or approval of the use of such commercial products.
1 Introduction
Background
In concrete construction, the water-cement ratio (w/c) is one of the most important factors in the control of quality of concrete. As the w/c of the concrete increases, the strength decreases, the permeability increases, and its durability decreases. In order to ensure a proper w/c, it is necessary to control the total quantity of water added to the concrete mixture. Account must be taken of all sources from which appreciable amounts of water can be added to the concrete mixture. Moisture in concrete aggregates can represent a significant source of water. In fresh concrete, the volume occupied by the aggregate is the volume of the aggregate particles including all of the pores. Generally, the total water in the concrete mixture consists of water added to the concrete mixture and that held on the aggregate at the time the aggregate enters the mixer. A part of the latter water is absorbed within the pore structure of the aggregate, while some exists as free water on the surface of the aggregate and is therefore no different from mixing water added directly into the mixer. Any water on the surface of the aggregate will contribute to the water in the mixture and will occupy a volume in excess of that of the aggregate. Free water on the surface of aggregate must be compensated for in the calculation of batch quantities. The surface moisture is expressed as a percentage of the mass of the saturated, surface-dry aggregate and is termed the free moisture content. Measurement of the free moisture content in concrete aggregate is necessary to make the proper adjustment to the quantity of water added to the concrete mixture, thus assuring compliance with the concrete mixture proportioning, particularly the w/c.
Many concrete batch plants associated with the U.S. Army Corps of Engineers' civil works projects typically have moisture meters in the fine aggregate bins and often in those bins containing the smallest size coarse aggregates. Current moisture-meter operations are based on an array of technological applications including microwave, optical, thermal, nuclear, radar, and electric principles of operation. CRD-C 143-62 (U.S. Army Engineer Waterways Experiment Station (WES) 1949c) serves as guidance for moisture meters. However, since the introduction of more sophisticated moisture meters using state-of-the-art technology, there has been little known research accomplished toward evaluation of currently available moisture meters.
Chapter 1 Introduction

Given the variations in aggregate moisture content throughout individual stockpiles as well as from one stockpile to another, it is important to frequently measure the moisture content of the aggregate prior to its introduction into the final concrete mixture. Methods for measuring the moisture content of fine aggregates, such as that given in CRD-C 113-87 (WES 1949a), can usually predict the aggregate moisture content to within 0.5 percent. One major disadvantage of using these methods to measure the moisture contents of aggregate is the prolonged production delays caused by the time required to complete the procedures associated with them. These methods, however, should be implemented for periodic verifications of instantaneous moisture meters. A more desirable method of aggregate moisture-content verification would be a means by which instantaneous and continuous measurements could be accomplished.
Objectives
The objectives of this study are (a) to evaluate the reliability of four moisture meters to consistently and accurately measure fine-aggregate moisture contents and (b) to evaluate the operational features of the instruments.
Scope
Laboratory evaluations in this investigation included two electric- and two microwave-based moisture meters, evaluated by measuring the moisture contents of a natural aggregate and a manufactured aggregate.
The moisture contents of these aggregates were manipulated to represent low, medium, and high levels. The moisture meters evaluated in this investigation include:
a. Deltawave moisture recorder, manufactured by ACECO (microwave).
b. Moisture Alert, manufactured by Concrete Controls Corporation (electric).
c. Hydro-View, distributed by SKAKO (microwave).
d. Sentry 200-CP Moisture Monitor, manufactured by Troxler Electronics, Inc. (electric).
While the electric, microwave, and nuclear moisture meters are the prevailing types used in everyday practices, several agencies prohibit the use of nuclear moisture meters because of required health and safety precautions associated with their operation. Therefore, evaluation of nuclear moisture meters was not included in this study.
Chapter 1 Introduction

2 Materials and Evaluation Equipment
Fine Aggregates
The American Society for Testing and Materials (ASTM) defines natural sand as a fine granular material resulting from the natural disintegration of rock. Manufactured sand is the fine material resulting from the crushing and classification (by screening or other means) of rock, gravel, or blast-furnace slag. Fine aggregate suitable for use in concrete must meet specification requirements based on standard tests for soundness, organic impurities, and deleterious materials that may react unfavorably with the alkalies in cement. It must be graded within specific limits in accordance with ASTM C 33 (ASTM 1987).
The fine-aggregate materials used in this investigation consisted of natural and manufactured sands. The natural sand was a riverbank material, and the manufactured sand consisted of a processed limestone material. Physical property analyses for each of these materials along are given in Appendix A.
Moisture Meter Devices
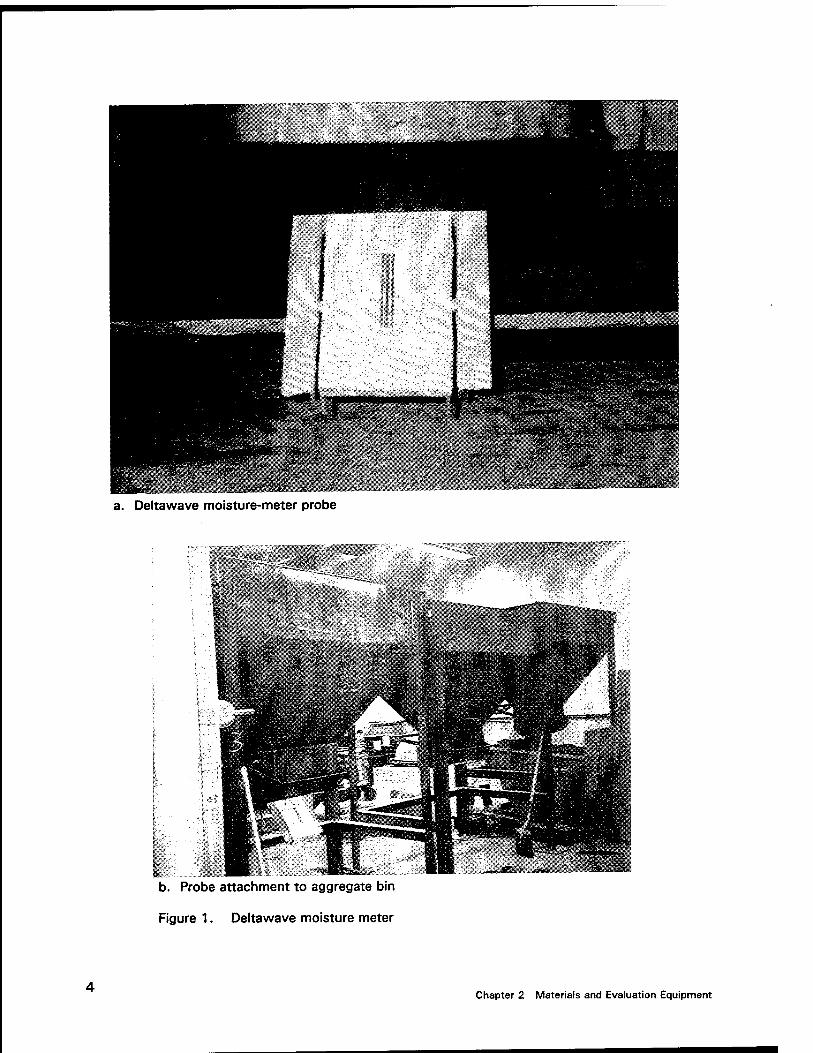
Deltawave moisture recorder
The Deltawave moisture recorder represents a dual-frequency RF (radio frequency) method of sensing moisture in fine aggregates using a VHF (very high frequency) oscillator that detects the capacitance of the aggregate (Figure 1). The Deltawave moisture recorder system measures the moisture content via a stainless-steel probe mounted underneath the storage bin that senses the moisture condition of the aggregate as it flows from the bin. The probe consists of a plastic casting or ceramic tile assembly with three stainless- steel bars inset into the lower center face of the assembly. The probe sensor electronic board is mounted under the assembly, and the assembly is mounted on a 3/16-in. (4.8-mm) steel channel. The center bar is the active sensor, and the two outside bars are ground reference bars. The angle at which the probe is mounted and the position under the outlet port have a direct effect on the
Chapter 2 Materials and Evaluation Equipment
S:«^?:«yjVr.i ij*'--*1--. ^•■^v'/Ä.":'-.#^l'-*r-.'.l
a. Deltawave moisture-meter probe
b. Probe attachment to aggregate bin
Figure 1. Deltawave moisture meter
Chapter 2 Materials and Evaluation Equipment

capacitance value that is read during the aggregate flow. The recommended mounting angle is 45 deg relative to parallel with the bin gate. The probe is connected to a junction box that interfaces with proprietary software for conversion of capacitance readings into moisture- content displays. This software manages the Deltawave moisture recorder system and operates with an IBM-compatible computer with a 386, or higher, processor. The software is Microsoft Windows 95 compatible. The Deltawave facilitates up to three independent probes and can store up to 99 different aggregate calibrations. The software allows the moisture content to be graphically displayed on the computer monitor while sampling is in progress and has a pull-down menu that allows the operator to choose from a number of desired functions. The system facilitates recording and storing moisture-content measurements, time and temperature data, capacitance, history of samples, and material descriptions associated with each batch of readings.
Initial calibration of the Deltawave moisture meter (Figure 1) involves allowing aggregate to pass across the probe underneath the bin gate and observing the moisture percentage indicated by the meter. At the same time, a representative sample of the aggregate is collected that corresponds to the observed moisture displayed by the meter. The moisture content of the collected sample is determined in accordance with CRD-C 113 (WES 1949b). The value of the moisture content determined for the collected sample is then entered into a calibration file that correlates a capacitance value to the moisture percentage. This procedure is repeated throughout the range of moisture percentages anticipated to be measured for the aggregate. Subsequently, a calibration curve is created that relates the capacitance read by the probe to the moisture content for that particular aggregate.
Moisture Alert
The Moisture Alert moisture meter (Figure 2) measures the moisture content of the fine aggregate by applying a small direct-current (DC) voltage to a stainless-steel probe located just below the aggregate bin gate. The probe is installed below the bin gate so that approximately 3 in. (76 mm) of the probe is inserted into a flowing column of aggregate. Moisture in the aggregate causes the voltage in the probe to be conducted to the ground (usually to the overhead bin). The current flow signals are transmitted to a sensitive, solid-state DC microammeter fitted with a scale that indicates the moisture content. The moisture content is displayed on the ammeter on a needle dial scale. In addition to indicating the moisture content, the ammeter also allows for audible and visual alarms if the moisture content of the aggregate being batched goes beyond preset lower and upper limits. The audible and visual alarms are energized through the use of an actuator configured into the system. The Moisture Alert allows two material calibrations to be stored simultaneously. Calibration of the Moisture Alert involves observing the moisture percentage indicated by the needle dial while the aggregate is flowing across die probe. A sample of the aggregate is simultaneously collected, and the moisture of the sample is determined in accordance with CRD-C 133. As subsequent aggregate flows across the probe, a calibration screw located in the rear of the ammeter unit is adjusted to correct the moisture percentage read by the
Chapter 2 Materials and Evaluation Equipment

a. Moisture Alert setup
WI^^B^H1**8
b. Fine-aggregate moisture content monitored by probe
Figure 2. Moisture Alert moisture meter
Chapter 2 Materials and Evaluation Equipment

ammeter to the moisture percentage determined for the collected sample. This procedure can be repeated several times to ensure the moisture contents of the aggregate measured by the ammeter best represent with the actual moisture content of the aggregate.
Hydro-View
The Hydro-View moisture meter, manufactured by Hydronix Incorporated (distributed by SKAKO Incorporated), is a compact microprocessor interfacing unit that displays the percentage moisture content as measured by the probe sensors (Figure 3). The measuring principle of the Hydro-View moisture meter is carried out by means of a microwave energy field penetrating the aggregate. The control display unit provides power to the sensor, conditions and linearizes the sensor signal, and converts information into a moisture percentage reading for display. The measuring probe consists of an electronic unit installed in a plated-steel casing. The probe consists of an abrasive- resistant ceramic plate that is attached to the bin by a clamp ring. A fixing plate is used to weld the probe direcdy to the side of the bin. The sensor probe is positioned into a moving flow of material, resulting in continuous measurement of the moisture content. The Hydro-View can be operated as a stand-alone system with manually operated plants or can operate as an integral part of an automatic batch-control system. The unit is housed in a steel case and suitable for panel mounting. Graphic display provides moisture readings of both the instantaneous and continuously averaged moisture contents. The control unit of Hydro-View has a self-help facility that enables a variety of nine functions (including instantaneous and average percentage moisture display, sensor calibration, and sensor diagnostic facilities), along with several other optional features.
The Hydro-View uses a two-point calibration procedure that requires input of two known moisture-content values (as measured by CRD-C 133 (WES 1949b)) from samples of aggregate. A minimum difference of 1 percent in moisture contents between the two samples is required. The linearized output from the sensor is calibrated by input of these different moisture contents along with the associated unsealed sensor moisture reading (as observed on the display) at the time the samples are taken. These two sets of values are entered into the calibration table, which fixes the straight calibration line for the particular aggregate. The standard capacity of Hydro-View allows calibration of up to four aggregates to be stored. An additional interface can be installed if provision for more than four aggregates is required. The moisture content displayed by the control display unit of Hydro-View is given by the linear scaling equation as follows:
M = mU + c - SSD (1)
where M is the moisture content, U is the unsealed input value, m and c are gain and offset parameters, and SSD is the surface-saturated dry offset calculated automatically by the Hydro-View from:
Chapter 2 Materials and Evaluation Equipment

1 '-«'•Oil
z? r» ri;
L) -"2
a. Probe and display unit
\.p\
ii*»!
b. Probe attachment inside aggregate bin
Figure 3. Hydro-View moisture meter
8 Chapter 2 Materials and Evaluation Equipment

m = U2-Uj (2)
c = M, - mU, (3) 'i *~~i
where
Mt and Uj = moisture content and unsealed input respectively for first sample
M2 and U2 = moisture content and unsealed input respectively for second sample
Troxler moisture meter
The Troxler moisture meter is an electric device (Figure 4). The basic components of the Troxler moisture meter include a Sentry 200-CP measuring probe and a Model 4134 display unit. The measuring probe responds to changes in dielectric constants of aggregates to measure the moisture content. The probe is embedded in the lower section of the aggregate bin at a minimum recommended height of 12 in. (305 mm) above the discharge gate. The Troxler moisture-meter probe is attached in the center of the aggregate bin by means of 1-1/2-in. (38-mm) hollow cast-iron pipes welded to the sides of the bins. The probe connection is facilitated by a 1-1/2-in. (38-mm) T-section internally threaded for screw insertion of the probe. The Sentry 200-CP control unit can be used in a manual mode or programmed for moisture readings at predetermined intervals. The Model 4134 display unit provides visual confirmation by displaying the moisture values as the measurements are generated by the Probereader CP. The system provides updated moisture readings every 0.4 sec. The moisture content can be read while the material is stationary or in motion. However, it should be noted that stationary moisture measurements will reflect higher percentages than measurements observed while the material is flowing due to compaction of the material around the probe sensor. The Troxler moisture meter has capabilities for configuring up to four Sentry 200-CP probes that can be interfaced directly into a computerized batch-control system programmed with a computer, using software supplied with the system. The optional Probereader Plus module is also available and can accommodate up to eight Sentry 200 moisture probes. The Probereader Plus can be operated with optional battery power in remote locations. The Data Collection Unit (DCU) is a comprehensive interface management system that enables programming and control for up to eight Probereader Plus modules. In turn, up to 64 Sentry CP-200 probes can be activated using the DCU system. The DCU allows remote calibration of the Probereader Plus systems and has the capacity to store up to 8,000 readings in memory. Stored readings can then be downloaded to a compatible computer system for permanent documentation.
Chapter 2 Materials and Evaluation Equipment

a. Probe and monitoring equipment
fr-fBjW
b. Probe center-mounted in aggregate bin
Figure 4. Troxler moisture meter
10 Chapter 2 Materials and Evaluation Equipment

Calibration of the Troxler moisture-meter probe follows similar procedures as those described for the Deltawave moisture-meter probe. Basically, representative aggregate samples are allowed to flow across the probe, and the moisture content displayed is observed and recorded. Again, a representative sample is instantaneously collected that corresponds to the observed measurement. The moisture content of the representative samples is then determined in accordance with CRD-C 133 (WES 1949b). The procedure is repeated throughout the anticipated range of moisture percentages to be measured for the aggregate, and the values are used to create a calibration curve that corresponds to that particular aggregate.
Aggregate storage bins
Three sheet-metal aggregate storage bins were fabricated to facilitate moisture-meter probe attachments, and storage and discharge of aggregate materials (Figure 5). The dimensional configuration for the aggregate storage bins is shown in Appendix B.
mm
M
Kl
llitllii SB
Figure 5. Prototype aggregate bins
Chapter 2 Materials and Evaluation Equipment 11

3 Evaluation Procedures
Variation of Fine-Aggregate Moisture Content
The moisture contents of both the natural and manufactured fine aggregate were varied from 1 to 10 percent, by addition of water to dried material. For convenience in analysis data, moisture percentages were categorized as follows:
Low-moisture range -1 to 3 percent Medium-moisture range - 4 to 7 percent High-moisture range - 8 to 10 percent
To accomplish the required variations in moisture percentages, an appropriate quantity of fine aggregate was initially air-dried to a constant mass. A predetermined quantity of water was then added to the aggregate in order to achieve a moisture condition for the aggregate corresponding to the low- moisture range. Following the addition of water, the aggregate was loaded into a rotating-drum mixer (1 yd3 (0.76 m3)) and mixed for a period of 15 to 20 min to assure uniformity in the moisture content throughout the material. After a series of moisture-content measurements was accomplished by the moisture-meter devices, an additional predetermined quantity of water was added to the existing moisture condition of the aggregate to achieve a moisture percentage representative of the medium-moisture range. This procedure was again repeated to achieve the high-moisture range for the aggregate moisture content. The actual moisture content of the sand was taken as that measured by CRD-C 113 (WES 1949b), also referred to as the "hot-plate method."
Moisture-Meter Measurements
Prior to measuring the moisture content of the fine aggregates, each moisture meter was calibrated according to the procedures described previously. Each of the moisture meters was used to make a series of 10 to 12 measurements during the continuous discharge of each batch of sand. During the time that the moisture content was being determined by the instrument, samples were taken, and moisture content was determined by CRD-C 113. Instrumental and hot-plate determinations were made for each
1 2 Chapter 3 Evaluation Procedures
combination of the moisture contents and aggregate type (natural and manufactured sands). Some moisture-aggregate conditions were replicated with fresh batches of fine aggregate. New calibrations were also performed prior to most determinations.
Analysis of Data
Data and descriptive statistics are in Appendix C. The purpose of the data analysis was to estimate and compare the uncertainty in moisture-content determinations between instruments. Uncertainty can be classified into random error and bias components. Random error is variation among determinations due to indeterminate sources, although one can usually speculate on likely sources of this error. Bias is the difference between die determined moisture content and the actual moisture content. Actual moisture content is unknown in this work; therefore, the actual moisture content was taken as that determined by CRD-C 113. Components of both bias and random error contribute to error in the analysis of a single batch of sand. Different components of bias and random error appear when data are examined over many batches or when new calibrations are done. For purposes of this report, these will be called within-batch and among-batch effects, although some sources of error may not strictly breakdown according to that simple scheme. For example, bias may exist in the analysis of a given batch of sand because of some error in calibration. This bias may persist as long as that calibration is being used, but disappear when a new calibration is done. Therefore, this bias is not strictiy a within-batch effect or an among-batch effect. However, in this work, analyses of most batches were believed to be independent events for each meter because they involved different lots of sand and different calibrations, and were separated by a reasonable time interval. Therefore, sources of error that were identified in the analysis of a single batch will be termed within-batch effects, and those that are identified in the analysis of the data over all batches will be termed among-batch effects. In this analysis, bias and random error components are estimated and compared between instruments; then total uncertainty is calculated for some likely measurement scenarios.
Random error effects
Within-batch standard deviation represents the variation in the sequential moisture-content determinations made during the discharge of a single batch. These values are pooled over all batches by weighting the variances (s2) by the degrees of freedom associated with each within-batch determination to give a single estimate of within-batch standard deviation for each instrument. Estimates are summarized in Table 1.
Within-batch standard deviations were relatively constant over all moisture levels. Coefficients of variation tended to be inversely related to moisture content. Therefore, standard deviation is a better statistic for describing variation. Standard deviations were generally a little lower for natural aggregates, but this was not a consistent pattern. The higher standard
Chapter 3 Evaluation Procedures 1 3

Table 1 Within-Batch Variation, Expressed as Standard Deviations (Units Are in Percent Moisture)
Instrument Moisture Content
Manufactured Sand. %
Natural Sand, % Combined, %
Coefficient of Variation, %
Deltawave Moisture Recorder
low 0.30 0.11 0.25 12
medium 0.42 0.27 0.37 5
high 0.55 0.45 0.50 5
overall = 0.38 7
Hydro-View low 0.29 0.16 0.25 12
medium 0.47 0.09 0.34 6
high 0.21 0.27 0.24 2
overall = 0.26 7
Moisture Alert low 0.30 0.13 0.24 12
medium 0.20 0.33 0.27 5
high 0.30 0.14 0.24 3
overall = 0.23 7
Sentry 200-CP low 0.51 25
medium 0.54 0.25 10
Ngh 0.84 9
overall = 0.67 15
deviations among determinations in some batches could have resulted if the added water had not been uniformly mixed with the sand prior to analysis. Had this been the case, the hot-plate and instrumental determinations should have been correlated. This was checked on six batches for which higher within-batch standard deviations had been determined. There was little evidence that this had happened; however, the power of the analysis was low, meaning that this was not a strong tool for detecting this problem.
Comparisons among instruments showed that within-batch variation was lowest, and about equal, in the Hydro-View and Moisture Alert instruments. The standard deviation in the Deltawave instrument was slightly, but significantiy, higher than in these two instruments. The standard deviation determined for the Sentry 200-CP instrument was considerably higher than determined for the other three instruments.
The precision statement of CRD-C 113 gives the single-operator standard deviation to be 0.28-percent moisture content. The standard deviation among hot-plate determinations in this work, pooled over all analyses, was found to be
14 Chapter 3 Evaluation Procedures

0.20 percent (estimated with 320 degrees of freedom). These numbers are comparable to the standard deviations determined for the instrumental methods.
The interpretation of these within-batch standard deviations is that most (67 percent) individual measurements within a continuous run will fall within ± 1 standard deviation of the mean level for the run, but that some measurements (approximately 28 percent) will fall between 1 and 2 standard deviations away, with the remaining 5 percent falling greater than 2 standard deviations away. For example, the within-batch standard deviation of the Deltawave instrument pooled over aggregate types and moisture levels is 0.38 percent. Therefore, in an analysis of a perfecdy uniform batch of sand, most individual measurements will fall within ±0.38 of the mean, but a reasonable number will fall as far away as 0.76 percent, and a still smaller number will be as much as 1.14 percent away from the mean, due solely to random error in the instrument and measuring process. This means that a person monitoring the moisture content of sand cannot reliably detect real variations within the batch that are less than about 2 standard deviations away from the mean moisture content of the batch. This variation could be smoothed out by taking a relatively large number of measurements and developing a running-average protocol for calculating test results.
One of the strengths of automation is that many determinations can be made with little or no extra effort. For example, if a running average of five determinations was used, the standard deviation of the mean in this example would be 0.17 percent (s/\/5j, which is lower than the standard deviation of the hot-plate method.
Among-batch variation was difficult to analyze because there was no true replication among batches. Batches with nominally the same moisture content usually did not have exactly the same moisture content. Even so, an estimate of between-batch standard deviation can be calculated from the difference in instrumental and hot-plate determinations. Calculating the difference between hot-plate and the instrumental determinations gives a way to put all batches on the same basis, so that the mean difference for each batch can be taken as an independent replicate and used to calculate among-batch variation. Details of this calculation are in Appendix C. Table 2 summarizes the between-batch component of variation for each instrument-aggregate combination.
Table 2 Between-Batch Component of Variation, Expressed as Standard Deviation, in Units of Percent
Instrument Limestone, % Natural, % Combined, %
Deltawave 0.00 0.29 0.19
Hydro-View 0.62 0.41 0.55
Moisture Alert 0.27 0.20 0.23
Sentry 200-CP 0.63 0.63
Chapter 3 Evaluation Procedures 15

Bias
The within-batch bias of each instrumental determination was taken as the difference between the mean of the instrumental determinations and the mean of the hot-plate determinations. The statistical significance of this bias was analyzed within each run and then averaged over all runs for each instrument and aggregate type. Each instrument was represented by from three to seven runs, so that the average over all runs was taken as characteristic ofthat instrument. Estimates are in Tables 3 and 4.
Table 3 Analysis of Bias in Moisture-Content Determination on Natural Sand
Instrument
Deltawave Hydro-View Moisture Alert Troxler
Moisture Content,%
Bias1
(instr-hpl
Moisture Content, %
Bias (instr-hp)
Moisture Content, %
Bias (instr-hp)
Moisture Content, %
Bias (instr-hp)3
2 3 5 9 9
0.16' -0.08 -0.02 0.58' 0.61'
2 3 5 8
10
0.33' -0.50' 0.57' 0.43' 0.08
1.5 2 5 8 8 9
-0.272
-0.20' 0.24'
-0.13 0.04 0.21'
Not determined
Descriptive Statistics
Mean Bias Std Dev n
0.25 0.33 5
0.18 0.42 5
-0.018 0.22 6
Correlation Between Bias and Moisture Content
0.86 0.20 0.61
1 Mean bias calculated over all data in a single run. 2 Mean significantly different from zero at P = 0.05, Student's t-Test. 3 Instrument = hot plate.
Statistically significant within-batch biases were relatively common. These were not consistently either positive or negative and, in most cases, were not statistically different from zero when averaged over all batches for each instrument. This pattern indicates that the within-batch biases were probably due either to instrument setup or to errors in determining calibration factors. The latter seems likely since most runs were associated with an independently determined calibration factor. These biases are large enough to cause errors that could reach 0.5 to 1 percent, relative to the moisture content that would have been determined had the hot-plate method been used. All of the instruments appeared to suffer equally.
16 Chapter 3 Evaluation Procedures

Table 4 Analysis of Bias in Moisture-Content Determination on Limestone Sand
Instrument
Deltawave Hydro-View Moisture Alert Troxler
Moisture Content,%
Bias1
(instr-hp)
Moisture Content, %
Bias (instr-hp)
Moisture Content, %
Bias (instr-hp)
Moisture Content, %
Bias (instr-hp)
2 2 4 7 8 9
0.27* 0.23* 0.00
-0.02 0.20 0.30*
2 2 3 7 8 9
11
1.18* 0.35* 0.34
-0.02 -0.59* -0.6* -0.32*
2.5 3 6 8 9
-0.07 0.20*
-0.10 0.61* 0.10
2 5
10
0.20 0.75* 1.48*
Descriptive Statistics
Mean Bias Std Dev n
0.16* 0.14 6
0.05 0.64 7
0.16 0.28 5
0.81 0.64 3
Correlation Between Bias and Moisture Content
Correlation, Bias vs Moisture
0.03 0.84 0.41 1.00
1 Mean bias calculated ovei * Mean significantly differei
all data in a single run. it from zero at P = 0.05, Student's t-Test.
Total uncertainty
The total uncertainty, expressed as standard deviation, in moisture content determined by instrument is the sum of the within-batch and between-batch components of random error, as follows:
° total N
c within-batch
°between-batch component (4)
Bias components would normally also be included in an uncertainty calculation, but these will be taken as zero because there was no consistent evidence of bias when all batches were examined for each instrument. The within-batch biases that were identified contribute to the among-batch component of variation calculated previously. These values are summarized in Table 5 for two scenarios. Column 4 represents a case where n = 10; i.e., 10 determinations are made during discharge of a batch. Column 5 represents a case where n = 3. These results illustrate how little impact differences in within-batch standard deviation have on the overall variation picture. Within a single run, a large number of determinations can be made relatively easily, so that within-batch variation can be reduced to a relatively insignificant figure. Reducing within-batch error by this procedure does increase the sensitivity to
Chapter 3 Evaluation Procedures 17

detecting variations in moisture within a batch of sand. The between-batch error cannot be reduced by replicate within-batch determinations and can only be reduced by taking extra care in instrument setup and in determining calibrations.
To put the variations associated with each instrument into perspective, a sample calculation of maximum likely errors in w/c determinations when moisture-meter data are used is obtained. For these purposes, a range of ±2 standard deviations is taken to represent the maximum error that is likely to occur. For a concrete batch containing 200 kg of water, 500 kg of cement, and 1 Mg of fine aggregate with a true moisture content of 5 percent, the w/c is 0.50. Using standard deviations from Table 5, the maximum likely errors in estimating the w/c for the hypothetical n = 10 and n = 3 situations are listed in Table 6.
Table 5 Total Standard Deviation
Instrument Within-Batch, % Between-Batch Component, %
Total Standard Deviation. %
Number of Within-Batch Determinations
n = 10 n = 3
Deltawave 0.38 0.19 0.22 0.29
Hydro-View 0.26 0.55 0.55 0.57
Moisture Alert 0.23 0.23 0.24 0.27
Sentry 200-CP 0.67 0.63 0.66 0.74
Table 6 Maximum Error in Estimating w/c in a Typical Batch of Concrete, Based on ± 2 Standard Deviations on Mean Moisture-Meter Determinations
Instrument/Method
Deltawave
Hydro-View
Moisture Alert
Troxler
CRD-C 113
Within-Batch Determinations 10
±0.009
±0.022
±0.010
±0.026
±0.003
Within-Batch Determinations = 3
±0.012
±0.023
±0.011
±0.030
±0.006
18 Chapter 3 Evaluation Procedures

4 Results and Conclusions
Results
The level of within-batch variation among instrumental determinations was approximately the value published for CRD-C 113 (WES 1949b), but there were differences among instruments. These differences may be relatively unimportant in practice, if the objective is to estimate the mean moisture content of a batch, because this source of variation can be smoothed out by taking means of replicate determinations. A major advantage of automated technology is that variation can be reduced easily by replication. However, reducing me variation by taking means of replicate determinations does reduce the sensitivity for detecting variations in moisture content within a batch or over a short time interval. Therefore, problems might be encountered if individual instrument determinations were used to engineer a batching system that would make instantaneous changes in other ingredients during batching.
Although there was no consistent pattern of bias in any of the instruments, the variation among determinations on different batches of sand, which appeared as a within-batch bias, is a little more problematic than the within- batch variation because it is not so easily smoothed out by replication. The exact cause of the variation was not determined, although it was thought plausible that it was a result of seemingly minor variations among runs in instrument setup or determination of calibration constants. Largely because of these between-batch effects, uncertainty in determining w/c was found to vary from ±0.01 to +0.03. These errors appeared to be instrument specific, but only a single instrument from each manufacturer was evaluated, and the number of among-batch runs was not very large, so conclusions must be considered tentative. However, it does appear to be generally true that errors in setup and calibration can be larger than those expected from CRD-C 113 and sometimes large enough to cause undesirable uncertainty in estimating w/c. These can probably be removed with a more detailed examination of peculiarities of each instrument, and perhaps a larger effort on determining calibration constants.
Chapter 4 Results and Conclusions 1 g

Conclusions
As suggested in the previous section, batch-plant moisture meters can generally provide instantaneous measurements of variations in fine-aggregate moisture contents with similar consistency as with methods prescribed in CRD-C 113. However, the accuracy in determining moisture contents is related to the precision to which the moisture meters can be calibrated. The ability of moisture meters to continuously maintain precise calibration is therefore an important aspect of their resulting performances. While varying patterns of consistent performances were reflected by the moisture-meter devices, subsequent selection for specific applications should include appropriate considerations of other factors not reflected in the performance results. Cost considerations almost always factor into the selection process. Costs associated with the sophisticated systems incorporated into some of the moisture devices may not be feasible for smaller operations. Inherent specialized and/or detailed intensive setup and operational requirements may prove too cumbersome or incompatible for existing operations. As a result, it is important to select the most suitable moisture-meter device relative to anticipated needs. Overall, batch-plant moisture meters can serve as valuable quality-control tools for concrete production in terms of monitoring variations in fine-aggregate moisture contents, which may in turn have a significant influence on the w/c, and thus, the quality of the concrete.
No data were developed in this investigation that would indicate that any of the four commercial devices studied was superior to others or would be incapable of supplying adequate information upon which to base control of surface moisture levels of fine aggregate. The devices appear to have a level of precision of the same order as the hot plate method (CRD-C 113); there was no consistent pattern of bias.
20 Chapter 4 Results and Conclusions

References
American Society for Testing and Materials. (1987). Annual book ofASTM standards. Designation C 33, "Standard specification for concrete aggregates," Philadelphia, PA.
U.S. Army Engineer Waterways Experiment Station. (1949 with quarterly supplements). Handbook for concrete and cement. Vicksburg, MS.
a. CRD-C 113-87. "Total moisture content of aggregate by drying."
b. CRD-C 133. "Standard test method for total moisture content of aggregate by drying."
c. CRD-C 143-62. "Specifications for meters for automatic indication of moisture in fine aggregate."
References 21

Appendix A Physical Property Analyses for Fine-Aggregate Materials
Appendix A Physical Property Analyses for Fine-Aggregate Materials A1

1. SERIAL NO.
FINE AGGREGATE WORK SHEET 4. iriillALb
5. SOB NUMBER
2. MEMO NO. 3. DATE
>. T66TEDFÖR "^
7. SOURCE
8. PROCESSING BEFORE TEST SCJS
9. DATE RECEIVED 10. SAMPLED BY ii. TYP-MAlkHIAL
CRD-C 108 Bulk Sp Gr. Date
Flask No. a. Weight of Ag, g b. Wt Rask+Water, g c. Wt Rask+AG+Water, g d. Wt Displ Water (a+b-c) Tesnp Water, {C>
Sp 6s- » 500 d
'•) L ^Initiate ^/-^ 7/ Run 1 ' Run < J2
CRD-C 108 Absorption: Date
SSDwt, g O.D. wt, g Moisture wt, g Absorption, %
tiun\ gnu* six. Avg _
6f Initials ?%*
A
Run 2
JilM
Avg 3-S^
CRD-C 121 Organic Color Date: Initials
"CRD-C 116 Mortar-Making Properties:
i, 3-Day Test %, Test Sand
Date Made: Initials:
Std Sand: lb
Initials: _____ Date, 7-Day Test Test Sand
Cement Type: Initials:.
3D-1 Strength, lb
3D-2 3D-3 Sand Test Std Strength ratio, % - 3-Day.
psi Avg 7D-1
Strength, lb Std:
7D-2 7D-3 psi Avg
7-Day.
CRD-C 103 Sieve Analysis: Date: /». Sieve Wt Size Ret. No. 4 ~ 3-/a No. 8 TUB No. 16- ______£ No. 30 3tt£.2- No. SO fVt. 40 No. 100 lbi.lil No. 200 _ i Pan 11,15 ( CRD-C 104 Fineness Modulus: Spec. F.M.
' *7 Ret. v
___25" Initials **fi- Cumulative Per Cent Ret.
_Z£ ».-**■ ft-** Pass. Spec. Pass/Fail
±L11 JL2*Sl ______ 7a* 2- Z_3_£_ ■js.s-y
J. <?*-VP 3-*»
*-'» '»-»I
Y«r>-rt 1Ö5 Decantation: Date: . Initials: Orig. OD wt, g OD wt aft Dec, g Wt loss, g _____ % Loss CRD-C 137 Magnesium Sulfate Soundness:
Date: % Loss: CRD-C 142 Clav Lumps: Date: . % Clay:
Initials . . Cycles:
Initials
Fora WES 466
R Mar 91
(Proponent: OHES-SC-HD Previous editions are obsolete.
A2 Appendix A Physical Property Analyses for Fine-Aggregate Materials

CONCRETE AGGREGATE DATA SHEET
AL 33 86 6 22 Oct 91 USAEWES 3/8" Manu. WESSC-9 MG Vulcan Materials Calera, AL
Hardened Structures
Fine Agg
State: Latitude: Longitude: Index No.: Test Date: Tested By: Material Type: Lab. Symbol No. : Producer: Location: Sampled By: Tested For: Used At: Processing: Geology:
TEST METHOD Nominal Maximum Size Aggregate,
CRD-C 133 (ASTM C 33)': Sieve Analysis, Cum % Passing
CRD-C 103 150 mm (6 in. (ASTM C 136) 125 mm (5 in.
100 mm (4 in. 75 mm (3 in.
63 mm (2-1/2 in. 50 mm (2 in.
37.5 mm (1-1/2 in. 25 mm (1 in.
19 mm (3/4 in. 12.5 mm (1/2 in. 9.5 ram (3/8 in. 4.75 mm (No. 4 2.36 mm (No. 8
1.18 mm (No. 16 600 Im (No. 30 300 Im (No. 50
150 im (No. 100 75 im (No. 200.
Material Finer than 75-im (No CRD-C 105 (ASTM C 117)
Fineness Modulus, CRD-C 104:
Specific Gravity, CRD-C 107/108 (ASTM C
Absorption, CRD-C 107/108 (ASTM C
Organic Impurities, CRD-C 121 (ASTM C 40):
% Soft Particles, CRD-C 130 (ASTM C 851):
% Lighter Than Sp Gr,
Limestone 4
TEST RESULTS 3/4" 1-1/2" 3" #67 #4 #1
6"
100 47 6
200) ,
127/128)
127/128)
2.74
0.53
Appendix A Physical Property Analyses for Fine-Aggregate Materials A3

Appendix B Aggregate Storage Bin Dimensional Configuration
Appendix B Aggregate Storage Bin Dimensional Configuration B1

1 ST
/<73
Y
72- -v v~
pV>/s
^r -*7~
9 *. •• «[
/-J
3-y
B
tfXVX^ 4*7^ ^-J
B2 Appendix B Aggregate Storage Bin Dimensional Configuration

Appendix C Test Results and Method for Calculating Among-Batch Variation from Differences Between Instrumental and Hot- Plate Determinations
Calculating the difference between hot-plate and instrumental determinations gives a way to put all batches on the same basis, so that the mean difference for each batch can be taken as an independent replicate and used to calculate among-batch variation. Variation in this difference includes a contribution from the variation in the hot-plate determinations, for which a correction must be made. The following describes development of the method for estimating among-batch variation.
The difference between instrumental and hot-plate determinations is represented by
D = I - HP (Cl)
where D is the mean difference between the instrumental determinations and the hot-plate determinations, I is the mean of the instrumental determinations, and HP is the mean of the hot-plate determinations. The following equation describes the relationship among variances.
V(D) = V(I) + V(HP) (C2)
V(I), the total variance in mean instrumental determinations among batches, is the quantity to be estimated, so rearranging Equation C2,
V(T) = V(D) - V(HP) (C3)
Appendix C Test Results and Method for Calculating Among-Batch Variation from Differences C1

V(D) can be determined by calculating the mean and variance of the mean- difference data over the five to eight runs that constitute the evaluation of an instrument. V(HP) is estimated from the following equation.
V(HP) = mi (C4) n
where
V(HP) = variance among individual hot-plate measurements
n = average number of hot-plate determinations used to determine the mean for the run
V(HP) is taken from an analysis of variance on all hot-plate determinations for a given instrumental evaluation. V(HP) calculated is strictly speaking the variation in the mean of within-batch hot-plate determinations, and not the between-batch value needed for this calculation. However, the precision statement for CRD-C 113 (WES 19491) indicates that the method has little or no among-batch contribution to variance, so a within-batch estimate will suffice for this calculation. Substituting Equation C4 into Equation C3 gives the among-batch variance (Equation C5).
V(I) = V(D) - ^P* (C5) n
V(I) is the total variation in mean instrumental determinations and is composed of two components of variation: the within-batch variation and the among- batch component of variation, as described in Equation C6.
\7/T\ V"within-batch^ V/T % (Qß\ V(I) = = + VUamoDg-batch component-' ^^
V(l. . J is the variance among instrumental determinations within a run,
n is the number of instrumental determinations done in a run, and V(ImamvtmaU) is the component of variation due to between-batch contributions. Rearranging Equation C6 gives the between-batch component, expressed as a standard deviation (Equation C7).
"among batch comp' \ V(T) - ^»"g1 ""^ (C7)
1 References cited in this appendix are located at the end of the main text.
C2 Appendix C Test Results and Method for Calculating Among-Batch Variation from Differences

c a (0
3
§
2 o a a);?
s « M a •s
d
(D (D «6
I
>
S3
s s
'I'll I I I I
e i o E
5 a
I
S§§§§
c 1 o E
n cd
13
is ;$ is
'8i O (
<0
Appendix C Test Results and Method for Calculating Among-Batch Variation from Differences C3

03 O
8 5- 55 I
2. 2
!
!i i
si
82
S2
1 c A
Sä
J :• • 8s:>
■ 1
1 lllllli 1 « >.:":-:':::>::::>::::::::
wK'-tfmtmm
! WM^S 1" '- - j«
v.:.:;;.;;;;;:::; ::v.:i:::::v.: ;^i :>
SfS
a e ö a ö o o 9
§8§§S8§§' eooooöoo
C4 Appendix C Tost Results and Method for Calculating Among-Batch Variation from Differences

CO
s 3
z I
< 9
Appendix C Test Results and Method for Calculating Among-Batch Variation from Differences C5

■o c CD
co
t; a < S 3 % O 2
rs-
6 I.
h
■3
co
si
*99
■J5 . SI
5
if 99
z £
3 a-
99 909
10 o 9
K 0
S
111
ss
S
S5
£
2
m
1» fa
BSHMHH4
rr IE
MM!!!!*
C6 Appendix C Test Results and Method for Calculating Among-Batch Variation from Differences

•o c n W
3 z
I >> X
Appendix C Test Results and Method for Calculating Among-Batch Variation from Differences C7

s E -j
i 1
C8 Appendix C Test Results and Method for Calculating Among-Batch Variation from Differences

■o c (0
CO 0) c o IS V E
X p
Appendix C Test Results and Method for Calculating Among-Batch Variation from Differences C9

REPORT DOCUMENTATION PAGE '
Form Approved OMB No. 0704-0188
Puttfc repotting burden far thiscotection of information is esämatadtoaveragel hour per response, «>duc*ng the time^ the data needed, and completing and reviewing thecoHection of information. Send comments regartng this txjrden estimate or any other aspect of this coflection of information, indudhg suggestions for reducing this burden, to Washington Headquarters Services, Directorate for Infomiation Operations aiid Rep 22202-4302, and to the Office of Management and Budget Paperwork Reduction Project (07040188), Washington, DC 20503.
1. AGENCY USE ONLY (Leave blank) 2. REPORT DATE
September 1998
3. REPORT TYPE AND DATES COVERED
Final report 4. TITLE AND SUBTITLE
Performance of Electric and Microwave Batch Plant Moisture Meters in Determining the Moisture Contents of Fine-Aggregate Materials for Concrete Production
5. FUNDING NUMBERS
6. AUTHOR(S)
Willie W. McDonald, Toy S. Poole
7. PERFORMING ORGANIZATION NAME(S) AND ADDRESSES)
U.S. Army Engineer Waterways Experiment Station 3909 Halls Ferry Road Vicksburg,MS 39180-6199
8. PERFORMING ORGANIZATION REPORT NUMBER
Technical Report SL-98-9
9. SPONSORING/MONITORING AGENCY NAME(S) AND ADDRESSES)
U.S. Army Corps of Engineers Washington, DC 20314-1000
10. SPONSORING/MONITORING AGENCY REPORT NUMBER
11. SUPPLEMENTARY NOTES
Available from National Technical Information Service, 5285 Port Royal Road, Springfield, VA 22161.
12a. DISTRIBUTION/AVAILABILITY STATEMENT Approved for public release; distribution is unlimited.
12b. DISTRIBUTION CODE
13. ABSTRACT (Maximum 200 words)
The investigation described in this report evaluated the accuracy of four moisture meters to consistently measure fine-aggregate moisture contents and to evaluate the operational features of the instruments.
No data were developed in this investigation that would indicate that any of the four commercial devices studied was superior to others or would be incapable of supplying adequate information upon which to base control of surface moisture levels of fine aggregate. The devices appear to have a level of precision of the same order as the hot plate method (CRD-C 113); there was no consistent pattern of bias.
14. SUBJECT TERMS
Aggregate Concrete Moisture meters
15. NUMBER OF PAGES
41
16. PRICE CODE
17. SECURITY CLASSIFICATION OF REPORT
UNCLASSIFIED
18. SECURITY CLASSIFICATION OF THIS PAGE
UNCLASSIFIED
19. SECURITY CLASSIFICATION OF ABSTRACT
20. LIMITATION OF ABSTRACT
NSN 7540-01-280-5500 Standard Form 298 (Rev. 2-I Prescribed by ANSI Std. Z39-18 298-102


![International Journal of Pure and Applied Mathematics ...batch/semi batch [6], fixed bed, fluidized bed, spouted bed, microwave [7] and screw kiln. Batch or semi -batch reactors have](https://img.dokumen.tips/doc/110x75/6042d371c8d4a7373d406703/international-journal-of-pure-and-applied-mathematics-batchsemi-batch-6.jpg)