Embed Size (px)
DESCRIPTION
nkn
Citation preview

Table of Content
TCP and MTU
Bandwidth Test Scenario
NDT – Bandwidth Test
Performance Monitoring service
Demo
Table of Content
TCP and MTU
Bandwidth Test Scenario
NDT – Bandwidth Test
Performance Monitoring service
Demo

TCP and MTU
“Symptom Hiding”
“Symptom Scaling “

TCP and MTU
Request
Reply
Internet
Gateway
0 - 60 ms > 60 ms
Good Speed
Request Request Reply Reply
Slow Speed
TCP and MTU
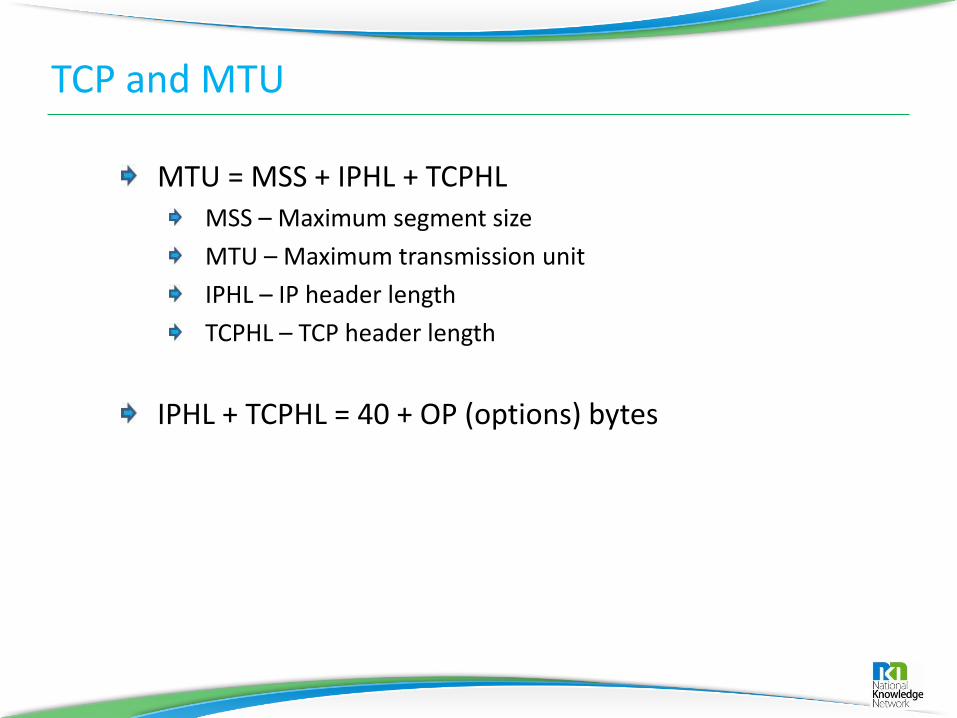
MTU = MSS + IPHL + TCPHL MSS – Maximum segment size
MTU – Maximum transmission unit
IPHL – IP header length
TCPHL – TCP header length
IPHL + TCPHL = 40 + OP (options) bytes

Table of Content
TCP and MTU
Bandwidth Test Scenario
NDT – Bandwidth Test
Performance Monitoring service
Demo

Bandwidth Vs MTU (No Latency) B
and
wid
th (
Mb
its/
s)
Time (s)
MTU (Bytes)

Bandwidth Vs MTU (Latency) B
and
wid
th (
Mb
its/
s)
Time (s)
MTU (Bytes)

Table of Content
TCP and MTU
Bandwidth Test Scenario
NDT – Bandwidth Test
Performance Monitoring service
Demo

NDT - Bandwidth Test
Measure performance directly to user desktop
Identify both performance and configuration problems
Memory to memory client server test
Ignoring disk I/O effects
kernel data automatically collected by the web100 monitoring infrastructure
Source: https://code.google.com/p/ndt/

NDT - Tests performed
Middlebox Test Check duplex mismatch condition
Checks if any intermediate node is modifying the connection settings
Firewall Test Bidirectional test
Find out firewall between server and client

NDT - Tests performed
Client to Server Throughput Test
Server to Client Throughput Test 10 seconds memory-to-memory data transfer
libpcap routine to perform packet trace used by the Bottleneck Link Detection algorithm.
tcpdump trace to save to a standard tcpdump file all packets sent during the test on the newly created connection.
web100 snaplog trace to dump web100 kernel MIB variables' values written in a fixed time interval (default is 5 msec) during the test for the newly created connection.

NDT – Detection Algos
Bottleneck Link Detection Uses the inter-packet delay and the size of the packet as a metric to gauge what the narrowest link in the path is
Calculates the inter-packet throughput by dividing the packet's size, in bits, by the difference between the time that it arrived and the time the previous packet arrived
The bins are defined in mbits/second: 0 < inter-packet throughput (mbits/second) <= 0.01 - RTT 0.01 < inter-packet throughput (mbits/second) <= 0.064 - Dial-up Modem 0.064 < inter-packet throughput (mbits/second) <= 1.5 - Cable/DSL modem 1.5 < inter-packet throughput (mbits/second) <= 10 - 10 Mbps Ethernet or WiFi 11b subnet 10 < inter-packet throughput (mbits/second) <= 40 - 45 Mbps T3/DS3 or WiFi 11 a/g subnet 40 < inter-packet throughput (mbits/second) <= 100 - 100 Mbps Fast Ethernet subnet 100 < inter-packet throughput (mbits/second) <= 622 - a 622 Mbps OC-12 subnet 622 < inter-packet throughput (mbits/second) <= 1000 - 1.0 Gbps Gigabit Ethernet subnet 1000 < inter-packet throughput (mbits/second) <= 2400 - 2.4 Gbps OC-48 subnet 2400 < inter-packet throughput (mbits/second) <= 10000 - 10 Gbps 10 Gigabit Ethernet/OC-192 subnet bits cannot be determined - Retransmissions (this bin counts the duplicated or invalid packets and does not denote a real link type) otherwise - ?

NDT - Detection Algos
Firewall Detection A firewall is detected when the connection to the ephemeral port was unsuccessful in the specified time
NAT Detection A Network Address Translation (NAT) box is detected by comparing the client/server IP addresses as seen from the server and the client boxes
MSS Modification Detection Comparing the final value of the MSS variable in the Middlebox test.
Initial value is 1456
Table of Content
TCP and MTU
Bandwidth Test Scenario
NDT – Bandwidth Test
Performance Monitoring service
Demo
Performance Monitoring in NKN
NKN Core Service Tests performance between servers located at different locations
Tests performed on International links
Bandwidth Monitoring Service Tests performance between NKN user client and server
Java enabled Web browser

Performance Monitoring in NKN
Internet
Test
Test
Test
Test
Test
Test
Test
Test
Delhi
Hyderabad
Mumbai
Bangalore Chennai
Kolkata
Guwahati
NKN User
Test
Test

NKN Core Service
Core link Bandwidth testing
Bandwidth testing to Overseas PoPs
Traceroute service
OWAMP One way ping

Bandwidth Test : NKN Core Delhi to Bangalore

Bandwidth Test : NKN Delhi to San Deigo

Bandwidth Test : NKN Delhi to Washington, US

Bandwidth Test : NKN Delhi to Bangkok, Thailand

Bandwidth Monitoring Service
Servers located at NKN super core PoPs Delhi - https://perfdel.nkn.in
Bangalore – https://perfblr.nkn.in
Hyderabad – https://perfhyd.nkn.in
Chennai – https://perfchn.nkn.in
Mumbai – https://perfmum.nkn.in
Kolkata – https://perfkol.nkn.in
Guwahati – https://perfght.nkn.in

Table of Content
TCP and MTU
Bandwidth Test Scenario
NDT – Bandwidth Test
Performance Monitoring service
Demo
Demo
DEMO

GUI Snapshots

GUI Snapshots

Thank You
Project Implementation Unit National Knowledge Network National Informatics Centre
3rd Floor, Block III, Delhi IT Park, Shastri Park,
New Delhi - 110053